epr study of ligand-receptor interactions: measuring ...739/fulltext.pdf · chapter 1 introduces...
TRANSCRIPT

EPR STUDY OF LIGAND-RECEPTOR INTERACTIONS:
MEASURING LIGAND INDUCED CHANGES IN
DYNAMICS AND STRUCTURE OF THE ESTROGEN
RECEPTOR LIGAND BINDING DOMAIN
A Dissertation Presented
By
Stefano V. Gulla`
To
The Department of Chemistry and Chemical Biology
in partial fulfillment of the requirements
For the degree of
Doctor of Philosophy
in the field of
Chemistry
Northeastern University Boston, Massachusetts
December 2008

2
EPR STUDY OF LIGAND-RECEPTOR INTERACTIONS:
MEASURING LIGAND INDUCED CHANGES IN
DYNAMICS AND STRUCTURE OF THE ESTROGEN
RECEPTOR LIGAND BINDING DOMAIN
By
Stefano V. Gulla`
ABSTRACT OF THESIS
Submitted in partial fulfillment of the requirements for the degree of Doctor of
Philosophy in Chemistry in the Department of Chemistry and Chemical Biology in
the Graduate School of Arts and Sciences of Northeastern University, Boston,
Massachusetts, December, 2008

3
Abstract
Ligand-receptor interactions are powerful determinants of biochemical
pathways. In this work, the role of ligand binding and coregulator interaction is
examined in particular as it related to changes in receptor dynamics and
conformation. The emerging technique of site directed spin labeling and electron
paramagnetic resonance (EPR) is applied to investigate ligand-induced effects on
estrogen receptor (ER), a pharmaceutically relevant member of the nuclear receptor
superfamily of transcription factors.
Chapter 1 introduces the relevant background information on the biology,
structure and physiology of NRs, with emphasis on the alpha isoform of the receptor
(ER-α). An overview of the current state of the field is presented. This chapter also
introduces application of EPR in the context of biological investigation of proteins
dynamics and structure
The specific techniques and methods used in this study are explored in detail
in chapter 2. Here the rationale of combining estradiol ligand substituted at the 11β
position with spin labeling of helix 12 of ER-α is discussed. This chapter provides
experimental details regarding ER mutant production and characterization. Relevant
details about EPR theory and lineshape analysis are explored. In this chapter, double
electron-electron resonance (DEER) is discussed by introducing both a theoretical
and experimental topics.
In chapter 3, the dynamic response of the human ER-α ligand binding
domain (ERα-LBD, residues 302-552) to the binding of different ligands and

4
coactivator peptides is investigated by site-directed spin labeling EPR (SDSL-EPR).
Specific labeling at residue 543 of the C-terminal helix 12 (H12) domain has
provided the first direct experimental demonstration that this domain undergoes
dynamic changes in response to ligand binding that correlate with the ligand’s
biological activity. Ligand-dependent changes are also observable for a label
positioned at residue 530 in the H12 hinge region, however much more dramatic
changes are observed at this position in the presence of both ligand and coregulator
peptides. We investigated the ligand/coregulator induced changes in structure by
measuring interspin distances in 530 labeled ERα-LBD dimers using DEER. These
results extend the current model of ERα-LBD action and provide dynamic
information on the H12 region as well as quantitative structural information on the
dimer conformation of ERα-LBD in solution. The results suggest a large-scale
remodeling of the ER dimer complex that is sensitive to details of the ligand structure
as well as the nature of the coactivator sequence.
In chapter 4 two nitroxide labeled estradiols, HO-2105 and HO-2447 are
characterized as new molecular probes of ligand/receptor interaction with the ERα-
LBD. EPR spectroscopy was used to investigate the binding properties and local
dynamics of the spin-labeled ligand. Fluorescence spectroscopy demonstrated
quenching of both the fluorescence of estradiol and of the intrinsic tryptophan
fluorescence of ERα-LBD by the nitroxide moiety of the labeled ligand. We describe
two methods to assay binding of the probes to ERα-LBD: (i) an EPR derived binding
assay and (ii) an intrinsic tryptophan fluorescence quenching binding assay.

5
Saturation binding studies of the estrogen probes using the two assays showed good
agreement between the independent techniques. DEER spectroscopy was used to
measure interspin distances between the bound probes in the ERα-LBD homodimer
complex. The structural results are consistent with X-ray crystallography of the ERα-
LBD dimer and provide new information about the distribution of conformations in
the homodimer. The spin labeled estradiols described here serve as versatile probes of
ligand binding, local dynamics and structure with potential applications as ER
selective imaging agents and as oxidative stress probes.
Chapter 5 includes results obtained on other projects not related to ER, but all
sharing the broader theme of application of EPR to study biophysical systems. EPR is
a versatile technique that enables study of a variety of biophysical phenomena. Here
we describe applications of EPR as a method to evaluate singlet oxygen (1O2),
production, characterize conformational effects of hydrophobic mismatch on
transmembrane helices, develop methods for characterizing protein self-assembly and
characterize unstructured protein domains. Furthermore, as these projects result from
collaborations with research groups from different disciplines such as organic
chemistry, medicinal chemistry, biochemistry and mechanical engineering they each
add a particular set of challenges.
Chapter 6 evaluates future directions for continuing the investigation into the
molecular basis of ER action. Here we develop a theoretical model for the effect of
ligand/coregulator interaction on ER that is based on the combined results previously
presented. We also consider foreseeable challenges and provide recommendations
relative to experimental design on new spin labeled ER investigations.

6
Table of contents
Chapter 1: Background and motivation __________________________________ 9 1.1 The Nuclear Receptor Superfamily _____________________________________ 10 1.2 ER-α Structure and Function__________________________________________ 13 1.3 Estrogen Receptor role in breast cancer _________________________________ 15 1.4 Site directed spin labeling and EPR: application to protein dynamics and structure ______________________________________________________________ 18
(a) Measuring local dynamics___________________________________________________ 18 (b) Measuring distance by EPR _________________________________________________ 22
1.5 Spectroscopy _______________________________________________________ 23 (a) CW-EPR ________________________________________________________________ 23 (b) Effect of molecular motion on EPR spectrum of nitroxides in solution ________________ 25 (c) DEER spectroscopy _______________________________________________________ 29
1.6 Overview___________________________________________________________ 32 Summary _____________________________________________________________ 36
Chapter 2: Methods _________________________________________________ 37 2.1 Study Design________________________________________________________ 38 2.2 Specific aims________________________________________________________ 39 2.3 Site directed mutation ________________________________________________ 40
(a) Selection of mutation sites and site directed mutagenesis___________________________ 40 (b) Expression, purification and spin labeling ______________________________________ 41 (c) Characterization of purified mutants by LC-MS and [3H]estradiol binding assay ________ 43
2.4 Pitfalls and optimization of experimental conditions _______________________ 50 Summary:_____________________________________________________________ 54
Chapter 3: Dynamic and structural response of the estrogen receptor ligand-binding domain to ligand and coactivator binding_________________________ 55
3.1 Introduction ________________________________________________________ 56 3.2 Materials and Methods _______________________________________________ 60
(a) Protein Expression, Purification and Spin Labeling _______________________________ 60 (b) Ligands _________________________________________________________________ 61 (c) Peptides _________________________________________________________________ 62 (d) Synthesis of IMSL_________________________________________________________ 63 (e) Mutant characterization_____________________________________________________ 64 (f) Incubation of labeled receptor with ligand/coactivators: ____________________________ 65 (g) CW-EPR spectroscopy _____________________________________________________ 65 (h) DEER Spectroscopy _______________________________________________________ 66
3.3 Results_____________________________________________________________ 67

7
(a) Selection of labeling sites ___________________________________________________ 67 (b) Ligand induced dynamic changes of H12 _______________________________________ 68 (c) Dynamic and structural changes of H12 hinge region in response to ligand-coregulator interaction __________________________________________________________________ 71
3.4 Discussion __________________________________________________________ 79 3.5 Conclusions ________________________________________________________ 84
Chapter 4: Characterization of Spin labeled Estradiol _____________________ 86 Abstract ________________________________________ Error! Bookmark not defined. 4.1 Introduction ________________________________________________________ 87 4.2 Methods ___________________________________________________________ 88
(a) Protein preparation: ________________________________________________________ 88 (b) CW-EPR measurements:____________________________________________________ 89 (c) Fluorescence quenching assay: _______________________________________________ 89 (d) EPR assay _______________________________________________________________ 89 (e) DEER measurements: ______________________________________________________ 90
4.3 Results_____________________________________________________________ 91 (a) EPR characterization _______________________________________________________ 91 (b) EPR based binding assay____________________________________________________ 93 (c) Electronic absorption and emission properties ___________________________________ 95 (d) Fluorescence quenching binding assay _________________________________________ 96 (e) Distance measurement of ERα-LBD homodimer using DEER_______________________ 99
4.4 Discussion _________________________________________________________ 100 4.5 Conclusion ________________________________________________________ 102 Summary ____________________________________________________________ 103
Chapter 5: Other Projects ___________________________________________ 104 5.1 Development of an EPR spin trap assay to measure singlet oxygen sensitization of DNA binding dye compounds____________________________________________ 105
(a) Photodynamic therapy in cancer treatment _____________________________________ 105 (b) 1O2 specific spin trapping using TEMP________________________________________ 107
5.2 Effect of membrane thickness on cannabinoid receptor 1 transmembrane helical conformation _________________________________________________________ 113
(a) Introduction _____________________________________________________________ 113 (b) Experimental Procedures___________________________________________________ 116 (c) Results _________________________________________________________________ 120 (d) Discussion ______________________________________________________________ 131 (e) Conclusion______________________________________________________________ 137
5.3 Molecular-scale force measurements in a coiled-coil peptide by electron spin resonance ____________________________________________________________ 138 5.4 SDSL investigation into the structure of UmuD __________________________ 147
(a) Background _____________________________________________________________ 147

8
(b) Initial results ____________________________________________________________ 148 (c) Ongoing work ___________________________________________________________ 151
Chapter 6: Ongoing and Future Work _________________________________ 152 6.1 Distance measurements in ER dimer___________________________________ 153
(a) Hypothesis of dimer remodeling _____________________________________________ 153 (b) Saturation recovery EPR ___________________________________________________ 156
6.2 Double labeled ER __________________________________________________ 157 (a) Experimental considerations ________________________________________________ 157 (b) Spin dilution ____________________________________________________________ 157 (c) Immobilization to substrate _________________________________________________ 158 (d) Initial results ____________________________________________________________ 159
6.3 Electrostatic actuation of leucine zipper peptide dimer____________________ 161 (a) Initial results and interpretations _____________________________________________ 161 (b) Difficulties with initial interpretation _________________________________________ 168
6.4 Initial characterization of 11β spin labeled estradiol ______________________ 171 6.5 Challenges ________________________________________________________ 174
(a) ER stability _____________________________________________________________ 174 (b) ER activity assay_________________________________________________________ 175
6.6 Broader Impact ____________________________________________________ 176 References ___________________________________________________________ 179

9
Chapter 1: Background and motivation

10
1.1 The Nuclear Receptor Superfamily Members of the superfamily of nuclear receptors (NRs) are a class of intracellular
proteins whose general role is to mediate genomic transcription in response to ligand
activation. In other words, NRs translate a chemical signal, usually in the form of
lipophilic small molecules, to a biological response that is specific for each NR and
often dictated by tissue type. They respond directly to physical association with a
variety of hormonal or metabolic molecules and regulate the action of multiple
signaling cascades that regulate tissue-specific gene expression 1. More than 65 NRs
have been identified throughout the animal kingdom. Their structure is characterized
by a modular architecture of 5-6 conserved domains with independent functionality.
NRs are distinct from other transcription factor by their capacity to specifically bind
small hydrophobic ligands with high affinity and selectivity 2-4.
NR signaling is essential for normal homeostasis and proper tissue
development. Given the major impact that this class of proteins on cell physiology it
is not surprising that many pathologies are directly linked to NRs. Table 1
summarizes the link between NRs and some important disease states. Some endocrine
therapies have yielded successful treatments of NR related cancers such as breast
cancer, prostate cancer, acute promyelocytic leukemia (APL) and prevention of
certain types of cancers 5-12. Development of synthetic ligands with agonist,
antagonist, and partial-agonist properties as well as receptor-specific imaging has
created considerable interest in NRs as pharmaceutical targets. This effort has been
facilitated in large part by structural studies of the ligand binding domains (LBD) of

11
numerous NRs which have provided important understanding of the molecular basis
of their biological function. More recently, understanding of NR binding partners
(coregulators) provides the basis for new strategies of pharmacological interference
with NR pathways. Although several NRs have been crystallized in the presence of
both agonist and antagonists, these static models have left many important questions
unanswered:
(i) How does ligand binding affects the dynamics and structure of the
receptors?
(ii) What is the effect of allosteric coregulator binding?
(iii) How does the interplay between agonist/antagonist ligands and
coregulators determine the active conformation of the receptor?
These questions are at the forefront of research in the field of NRs, but also signal the
need for techniques that go beyond X-ray crystallography and are capable of looking
at complex protein/ligand interaction in a more physiological environment. Recently
other methods have been used to address the important questions relative to the NR’s
ligand and coregulator interactions; these include fluorescence labeling, NMR, and
deuterium exchange mass spectrometry.
The work described here focuses on estrogen receptor (ER), one of the most
important NRs for human health. A major aim is to measure dynamic and structural
effects of ligand binding and coregulator interaction with ER as a way to gain new
insights into the pharmacology of ER and, more generally, of NRs. At the same time
this work evaluates new tools that are adapted to address the specific questions
regarding ER function. New estradiol derived ligands with potential application as

12
biophysical tools and imaging agents were designed and characterized. Furthermore,
solution structure constraints for ER-α were obtained for the first time.

13
Nuclear Receptor Ligand Associated Pathology hERα hERβ
OH
OH
Breast Cancer Prostate Cancer Osteoporosis
hPR hGR hMR hAR
Gestation, Abortion Inflammation Prostate cancer
hRARα1 hRARβ2 hRAR γ1 hRXRα hRXRβ hRXRγ
O
OH
Cancer prevention APL (Acute promyelocytic leukemia)
hPPARα
OHO
OH
OH
Inflammation
hTRα hTRβ
OH
O
NH2
I
OH
I
I
I
O
Obesity
hVitD3
OH
Bone Development
Figure 1.1: Overview of members of the superfamily of nuclear receptors. The receptors are grouped by ligand similarity (center) and their pharmacologic relevance is indicated (right).
1.2 ER-α Structure and Function Estrogen Receptor alpha (ER-α) is a transcription factor belonging to the nuclear
receptor (NR) superfamily that acts to regulate the expression of target genes
involved in development, metabolism and reproduction. ER-α transactivation is
estradiol dependent and it is directed to genomic estrogen response elements (ERE)
Estradiol
Progesterone
all-trans retinoic acid
Leukotriene B4
Thyroxine
Vitamin D3

14
by tissue specific co-activator and co-repressor proteins. Members of the NR family
share limited sequence similarities; however, they are structurally homologous with
functionally independent domains 13,14. This characteristic architecture makes it
possible to investigate the activity of individual domains separately. The full length
ER-α is composed of an N-terminal activation function 1 (AF1) domain, a DNA
binding domain, a short hinge region, and the C-terminal ligand binding domain
(LBD) where the activation function 2 (AF2) region is located, and where selective
ligand binding and allosteric protein interaction occurs. The general mode of action of
ER-α has been described as a tripartite model where the ligand, receptor, and specific
co-regulator complex is necessary to carry out target specific genomic modulation.15
In addition to its important homeostasis functions, ER-α plays a major role in
the progression of estrogen responsive breast cancer and several other diseases such
as osteoporosis, obesity and ovarian cancer. The importance of ER-α as target of
current breast cancer therapies and as a general model for the action of NRs has
attracted much attention since its isolation by Green et al. 13.
The action of SERMs can be explained by the presence of coregulator proteins
that direct the tissue specific action of ER. The general mode of action of ER-α has
been described as a tripartite model where the ligand, receptor and specific
coregulator complex is necessary to carry out target specific genomic modulation. In
the next section will describe the structure and function of ER-α and the effect of
ligand and coregulator proteins in determining its biological activity 15.

15
Figure 1.2: Schematic representation of functional domains in full length ERα (A). Model of ERα-LBD showing ligand induced conformations of helix 12 for agonist (purple, 1ERE) and antagonist (red, 3ERT) ligands (B). Molecular models were generated with VMD using research collaboratory for structural bioinformatics protein data bank (RCSB-PDB) files 1ERE and 3ERT .16,17
1.3 Estrogen Receptor role in breast cancer Hormone molecules are essential for normal homeostasis of multicellular eukaryotic
organisms. In humans, hormones are involved in proper development and
homeostasis of virtually every tissue type. Estradiol (E2) is known as the female
AF-1 DNA-BD LBD AF-2
1 552302
His6-ERα-LBD (302-552)
A
B

16
hormone; however, it is present in males as well. In addition to its important effect
on development and in homeostasis, E2 has been directly linked to several disease
states such as breast cancer, colon cancer, ovarian cancer, osteoporosis and obesity.
Estrogenic signaling is mediated by the action of ERs. There exist two major
ERs, ER-α and ER-β. Although they share limited sequence similarity, X-ray crystal
structures show that they have similar conformations. ER-α constitutes the majority
of the estrogen receptors present in the cell and will be the focus of this thesis work.
ER-α plays a crucial role in the growth and progression of approximately two
thirds of diagnosed breast cancers, know as estrogen responsive breast cancer. As
early as the 1800s it was observed that oophorectomy (surgical removal of the
ovaries) caused tumor regression on a substantial portion of premenopausal women
affected by metastatic breast cancer. This pointed to an important role of estrogen in
tumor progression as the ovaries are the major estrogen producing tissue. In the
1950’s it was after Janson and Jacobson purified ER-α and showed that estrogen was
targeted to specific tissues that the molecular mechanism started to be elucidated 18.
Since cloning of the ER-α in the 1990’s a great deal has been learned about its
function and structure.
ER-α is a major target of breast cancer therapy because it has been
demonstrated that the majority of human breast cancers overexpress this receptor.
Compounds have been synthesized that bind to ER-α with high degree of selectivity
and antagonize the effect of estradiol, thus inhibiting the estrogenic response. One of
the classic examples of pure antiestrogens in the drug Fulvestrant (ICI182,780) which
binds the ER resulting in antagonistic effects and downregulation of the estrogen

17
response 19. Selective estrogen receptor modulators (SERMs) such as Tamoxifen and
Raloxifene show competitive binding with ER and display agonist or antagonist
activity in a tissue specific manner 20.
Figure 1.3: Schematic view of ER-α activation by ligand binding and coregulator directed transcriptional activity. Ligand binding induces a conformational change that releases HSP90 and favors formation of ER dimers. Co-activator or co-repressor protein complexes can then interact with the AF-2 (see text) region and direct the transcriptional activity towards specific genomic targets.
HSP90
HSP90
ligand binding
dimerization
Co-A Co-R

18
1.4 Site directed spin labeling and EPR: application to protein dynamics and structure
(a) Measuring local dynamics Site directed spin labeling (SDSL) is an emerging technique that allows the
introduction of an EPR active nitroxide probe anywhere in the sequence of a protein
of interest 21. It consists of preparing a construct with one or more reactive cysteines
at the points of interest. Spin labels containing the EPR active nitroxide moiety and a
thiol specific reactive group are then used to quantitatively label the exposed cysteine,
thus producing stable nitroxide modified proteins that can be assayed by EPR.
Several nitroxide labels have been developed that covalently bind reactive thiols, two
of which are displayed in figure 1.4. In this work we have used a custom label that is
expected to represent the local environment more accurately.
O
SS
N ON
S
Figure 1.4: Molecular structures of cysteines derivatixed with two nitroxide spin labeles: methanethiosulfate spin label (MTSL) and iodomethyl spin label (IMSL).
SDSL has several advantages over methods that have been more commonly
applied to study protein dynamics, like X-ray crystallography, fluorescence labeling
and nuclear magnetic resonance (NMR). The most important advantage is the
MTSL IMSL

19
sensitivity of EPR to dynamics on the time scale of protein domain motion. This
means that EPR is applicable at physiologically relevant conditions and
concentrations, another distinct advantage of EPR over most other structural methods.
In addition, distances can be measured quite accurately in doubly labeled systems,
and the method does not suffer from the same difficulties with adventitious quenching
that are present with fluorescent probes.
These features make SDSL an ideal tool for probing dynamics and structure of
the ER and its molecular level response to potential drugs for breast cancer treatment.
Nitroxide spin labels are very sensitive reporters of local dynamics and structure. By
introducing a spin label at a point of interest it is possible to learn about local
structure by interpreting distinctive lineshape features of the EPR spectrum. Spin
labeled proteins yield spectra that to a first approximation can be explained by two
coexisting dynamic processes. Assuming the overall motion of the protein can be
frozen out by viscous solvents (for a globular 30 KDa protein a 10% glycerol buffer
will reduce the overall tumbling to the hundreds of ns time scale, thus the protein
rotation is essentially frozen in the EPR timescale) the remaining dynamics will be
due to internal rotameric freedom of the label within the local environment and
flexibility of the backbone. Although some theoretical models have been described to
account for these two factors, it still remains a challenge of EPR analysis to
distinguish the two types of dynamics reliably 22,23.
In this work we have used a nitroxide spin label with shorter tether connecting
it to the reactive thiol. In principle, this will reduce the internal degrees of freedom
and make our spectra more representative of the local backbone dynamics. Rotation

20
around the χ1, χ2 and χ3 bonds are unlikely due to high energetic barriers and steric
constraints (see Figure 1.5). It has been found that motions relevant to EPR relaxation
(in the nanosecond time scale) can be described by rotations around χ4 and χ5 of the
standard MTSL probe. The “χ4, χ5” model is the most accredited by experimental and
MD studies 24,25. A considerable amount of effort has been put into reconciling EPR
spectra with MD calculations as a means to both improve the fitting of dynamic
parameters to experimental spectra and to fine tune the physical interpretation of
those parameter to derive structural information. Most studies take as a standard the
nitroxide label methanethiosulfonate spin label MTSL, which is the most common
protein spin label . Some important differences are immediately apparent between
MTSL and the IMSL probe used in this study: (i) when bound to a protein IMSL has
a 1 carbon shorter tether to the backbone (ii) IMSL is connected to the reactive Cys
though a thioether linkage which is resistant to reductive cleavage. These differences
are expected to have important consequences to the dynamics of the label, in
particular the removal of a torsional angle should be considered when interpreting the
results.
A simple semi-quantitative approach can be used to describe local dynamics.
The inverse width of the central resonance line (ΔH0−1 ) can be used to as a measure
of nitroxide mobility that accounts for effects of ordering as well as correlation time
of the motion 26-28.

21
Figure 1.5: Cysteine specific reaction of IMSL with an exposed thiol (i). Molecular dynamics results of showing the rotameric state for the χ2, χ3, χ4 torsion angles.
χ2 χ3 χ4
(i)
(ii)
χ1
χ2
χ3
χ4

22
(b) Measuring distance by EPR EPR is a versatile technique that in many ways is ideally suited to study
complex macromolecules. The previous section described the utility of EPR to study
local environment by SDSL. The same approach can be used to extract accurate
distance constraints between two unpaired electrons. The coupling between two
electrons is dominated by the spin exchange interaction for distances less than 10 Å,
and by the magnetic dipolar interaction for distances between 10 Å and 70 Å 29,30.
Most useful for determining interspin distances is measurement of the dipolar
interaction which has an inverse cubic dependence on the distance separating the two
radical centers. In this thesis we describe the use of two EPR techniques to measure
distances: continuous wave EPR (CW-EPR) and pulsed double electron-electron
resonance (DEER) spectroscopy.
The two methods are technically different but they measure the same
underlying physical parameter, dipolar coupling. This can be thought of as the
interaction occurring between two magnetic dipoles and it is the same effect that
gives rise to nuclear Overhauser effects (NOE) in NMR. In essence, the magnitude of
this interaction is inversely proportional the cube of the distance separating the two
centers. For short distances (5 – 20 Å) this interaction can be observed directly in the
CW-EPR spectra of frozen samples. In this range the dipolar coupling interaction
results in a broadening of the resonance lines that is mostly observable in frozen
solution because the effect tends to be averaged out in fast tumbling liquid samples.
By deconvoluting the spectrum of a sample with interacting labels from a spectrum
with single (non-interacting) labels one obtains a Gaussian broadening function

23
whose width reflects the dipolar coupling and therefore the separation between the
labels. For distances above 20 Å a more sophisticated pulsed method needs to be used
to evaluate the dipolar interaction 31.
DEER is an EPR technique that uses microwave (mw) pulses to measure
coherent interactions between two spins located within a 70 Å radius. Coupling
between the localized electrons on the radicals can be used to determine distances on
a scale that is difficult to access by other methods. Recently, technical advances in
instrument design have taken this technique to the forefront of structural biology.
Important insights into protein structure have been gained by applying SDSL and
DEER spectroscopy to systems which were intractable by more conventional means
such as X-ray crystallography or NMR.
1.5 Spectroscopy
(a) CW-EPR Electron Paramagnetic Resonance (EPR) is a magnetic resonance technique sensitive
to the presence of unpaired electrons. In general, when an electron is placed in an
external magnetic field (B) the spin degeneracy is lifted, giving rise to two energy
levels. This effect, known as the Zeeman interaction, arises from the fact that the
electron possesses both a charge and a magnetic moment (µB). The magnetic moment
is quantized along the external field direction, and may have a projection along this
axis that is either parallel or antiparallel with respect to the applied field, leading to an
energy difference between the two states. According to Boltzman’s equation, the low
energy state will have higher population than the higher energy state, making it

24
possible to observe absorption of radiation at the resonance frequencies. These
concepts are summarized pictorially in Figure 1.6.
Figure 1.6: The magnetic moment (μ) of an electron depicted as arising from the rotating charge (i). An energy diagram representing the effect of an applied magnetic field on the energy states of an unpaired electron (ii). First order energy Hamiltonian summarizing the major interactions affecting the EPR spectrum: the Zeeman interaction and the hyperfine interaction apply to all cases where an electron is coupled to a nucleus while the exchange interaction and the dipolar interaction become relevant for the case of two interacting spins (iii).
In nitroxides the unpaired electron is associated with a nitrogen nucleus giving
rise to a hyperfine interaction. 14N has a nuclear moment of 1 and 99.6% natural
Ener
gy
Field
νh
2121 SDSSJSSAISgBH B ⋅⋅+⋅+⋅⋅+⋅⋅= μ
Zeeman interaction
Nuclear Hyperfine interaction
Exchange interaction
Dipolar interaction
(i)
(iii)
(ii)
µ = g β S
Magnetic moment Zeeman splitting
Spin Hamiltonian

25
isotopic abundance. The (2I+1) energy levels, +1, 0, −1, correspond to the allowed
states on the 14N nucleus. Therefore the nitroxide spectrum in the fast motional
regime is composed of a triplet centered at the giso=2.004 resonant field.
(b) Effect of molecular motion on EPR spectrum of nitroxides in solution Fast limit: The g value of a bound electron generally deviates from the ge of an
isolated electron due to spin-orbit coupling centered on the atoms with significant
unpaired electron spin density. The coupling increases strongly with increasing
atomic number of such nuclei.. As the orbital angular momentum is fixed in the
molecular frame and the spin becomes quantized along the direction of the applied
field, the g-value depends on the orientation of the molecule with respect to the field.
This anisotropy can be described by a tensor with three principal values, gx, gy, and
gz.
In fluid solutions the molecular tumbling rates are much higher than the
differences of the electron Zeeman frequencies between different orientations. In this
situation the g value is orientationally averaged and only the average value can be
measured giso = (gx + gy + gz )/3.
The interaction of the unpaired electron with nuclear spins splits each energy
level into sublevels. As in the case of the g tensor, the hyperfine interaction also
displays anisotropy. Each hyperfine tensor is characterized by three principal values
Ax, Ay, Az, and by the three angles that specify the orientation of its principal axes
system relative to the molecular frame defined by the g tensor.

26
Fluid systems with fast molecular tumbling cause motional averaging of the
hyperfine observable resulting in Aiso = (Ax + Ay + Az)/3. This is due to the Fermi
contact interactions of electrons that reside in an s orbital of the nucleus under
consideration. Anisotropic contributions to the A tensor result from spin density in p,
d, or f orbitals on the nucleus. For a nitroxide, the nuclear spin I = 1 on the 14N atom
is the major nucleus coupled to the electron spin S = 1/2 that resides in the pz orbitals
on the N and O atoms. The hyperfine coupling causes a splitting of the electron spin
levels into three sublevels. As the field is swept with constant microwave irradiation,
three resonance peaks are observed. The nuclear Zeeman interaction shifts the mI =
+1 and mI = −1 sublevels to lower and higher energy respectively. Figure 2.8 shows a
typical spectrum of a nitroxide in solution displaying g and A averaging. EPR spectra
are acquired by field modulation and as a result the resulting signal is usually
displayed in derivative mode.
Rigid limit: We have discussed the effect of an unpaired electron with the nuclear
spin coupled to the 14N atom as in the case of a nitroxide radical. The EPR spectrum
is dominated by the hyperfine interaction of the electron spin with the nuclear spin of
14N and the g value is shifted due to anisotropic spin-orbit coupling between the lone
electron and the 2pz orbital where the spin is located. The isotropic contribution to the
hyperfine interaction observed in fast tumbling cases is due to Fermi contact
interaction in the 2s orbital of the nitrogen. The anisotropic contribution comes from
the spin density on the nitrogen 2pz orbital, the hyperfine interaction is large in the Az
direction and smaller in the Ax and Ay direction due to the orientational dependence of
the electron-nuclear dipolar interaction. Conversely, g shifts are also dependent on the

27
orientation of the 2pz orbital with respect to the external magnetic field. For instance,
in a nitroxide gx represents the case when the field is along the N-O bond. Therefore
if we consider a frozen sample (or powder) where all the orientations are equally
probable, we expect that the triplets of lines at different orientations of the nitroxide
in the applied field will have different splitting, as well as being shifted with respect
to each other. The sum of all the contributions at different orientations gives rise to a
characteristic “powder pattern” displayed in Figure 1.7.
Slow motion regime: The mobility of a spin probe depends on the local viscosity and
its connectivity to a larger macromolecule (e.g. proteins, nucleic acids, polymers). In
the case of a spin label, the mobility depends on the flexibility of the tether
connecting it to the macromolecular backbone, the dynamics of the backbone itself,
and on the global tumbling of the protein as a whole. A measure of the mobility is the
rotational correlation time τr, which corresponds to the characteristic time during
which a molecule maintains its spatial correlation. If the inverse of τr is on the same
order of magnitude as the anisotropy of an interaction, this interaction is partially
averaged and the EPR spectrum will become sensitive to τr and the specific dynamics
experienced by the probe. For nitroxides at X-band the EPR spectrum is dominated
by the hyperfine anisotropy of 150 MHz, which makes the spectra sensitive to
correlation times of the order of a few nanoseconds. Figure 2.8 displays a spectrum in
the intermediate motion regime.

28
Figure 1.7: Representative EPR spectra of nitroxides exhibiting the three dynamic cases described in the text. From the top: the fast motional case, the intermediate case and the rigid limit case.
Τc = 4 x 10⁷ s-1
3350 3360 3370 3380 3390 3400 3410 3420 3430 3440 3450-0.4
-0.3
-0.2
-0.1
0
0.1
0.2
0.3
3350 3360 3370 3380 3390 3400 3410 3420 3430 3440 3450-8
-6
-4
-2
0
2
4
6
8x 10
-3
3350 3360 3370 3380 3390 3400 3410 3420 3430 3440 3450-3
-2
-1
0
1
2
3x 10
-3
Τc = 1 x 10⁹ s-1
Τc = 1 x 10⁶ s-1
Fast Limit
Rigid Limit

29
(c) DEER spectroscopy Double electron-electron resonance (DEER) spectroscopy is a pulsed EPR
technique that makes it possible to measure inter-spin distances larger that 2 nm with
high precision. Distance measurement by EPR is based on dipole-dipole couplings
between the unpaired electrons found on nitroxide radicals. In addition to dipole-
dipole interaction a short range exchange interaction is also present between
uncoupled electrons, but can be neglected at separations greater than 1 nm. In this
case a good approximation is to assume that the dipolar coupling acts between two
point dipoles.
The 3+1-pulse DEER sequence displayed in Figure 1.8 consists of a two-pulse
echo sequence π/2-τ-π on a fixed observe microwave frequency (ω1) and an
additional microwave pulse on a fixed pump frequency (ω2) whose temporal position
is varied between the positions of the two observer pulses. The principle can be
understood in terms of two coupled spins A and B. The A spins are influenced only
by the observer sequence while the B spins are influenced only by the pump pulse
and do not contribute directly to the signal. The π/2-τ1- \π sequence at frequency ω1
acts on spin A to induce a spin echo at τ1. During the evolution of this echo, ω2 is
pulsed at time t to produce a π/2 rotation of the B spins. An evolution time τ2 is
chosen based on relaxation parameters, and is followed by a third pulse at ω1 that
refocuses the remaining spin polarization on the A spins and results in a spin echo at
time τ2 after the pulse. The DEER signal is acquired by measuring the area under the
refocused echo signal and plotting it versus t.

30
Figure 1.8: (i) Schematic diagram displaying the pulse sequence employed in DEER spectroscopy. (ii) Model of a system of coupled spins where the inter-spin distance (dashed line) represents the measurable parameter up to 70 Å
The specific DEER experiments performed here all deal with measuring interspin
distance between nitroxide centers. In this case selection of spins A and B is achieved
by orientational selectivity. Figure 1.9 shows an EPR spectrum of a frozen nitroxide
with indicated the positions of the pump and probe frequencies. By selecting these
positions we are effectively irradiating different populations of the spin probe: the
observe frequency will preferentially excite nitroxides with the Z magnetic axis
parallel to the external field, while the pump frequency will irradiate nitroxides with
the X and Y magnetic axes aligned to the field.
τ1 τ1 τ2 τ2
t
π/2 π π
π
ω1
ω2
Pulse sequence
B0
ON O
N
A B
(i)
(ii)

31
Figure 1.9: Non-derivative absorbance spectrum of a nitroxide showing the position of the observe (ω1) and pump (ω2) frequencies chosen to carry out DEER experiments.
Analysis of the DEER spectrum resulting from a set of coupled spins entails first the
subtraction of a concentration dependent background signal, then the deconvolution
of the time domain signal (Eq 1.2) to the frequency domain (Eq 1.3) from which the
dipolar coupling can be measured (Eq 1.4).
Frequency
ω1
ω2

32
[Eq. 1.2]
]sin))cos(1(1)[exp()(2/
0
θθωλπ
dttkCFtV eeBDEER ∫ −−−=
[Eq. 1.3]
Jddee +−= )1cos3( 2θωω
[Eq. 1.4]
3
2 12 r
gg BohrBAdd
μω =
[Eq 1.5] 3
2 12 r
gg BohrBAdd
μω =
Figure 1.10: Summary of the analytical equations used to derive interspin distances from DEER spectra. The figures represent experimental and calculated fits derived from the corresponding equations where C is the concentration of spin probe, λ is the modulation depth, FB is the fraction of B spins excited by the pump pulse, ωee is the electro-electron coupling and k is a constant.
1.6 Overview The flexibility inherent within all protein structures has long been recognized as an
essential characteristic of receptor-ligand interaction. A careful consideration of the
traditional “lock and key” mechanism of ligand-receptor interaction reveals
inconsistencies when presented with situations where the ligand binding pocket is
located within the protein. In this case it is clear that the conformational changes must
occur that allow ligands to access the binding site. Although crystal structures
produce precise snapshots of single configurations they often are unable to provide
any information about conformational flexibility. Furthermore, protein crystals are

33
grown under non-physiological conditions and therefore the structures derived from
them might not always represent a physiologically relevant conformation.
Few experimental techniques are sensitive to the conformational dynamics
taking place within proteins. NMR spectroscopy can be used to derive structural
constraints for small (< 20 kDa) proteins in solutions, however it suffers from
important limitations such as very low sensitivity that requires proteins to be in mM
concentrations and low resolution, particularly for highly flexible structures. These
limitations are not present in SDSL-EPR. As discussed earlier, this technique can be
used to specifically measure ns timescale dynamics, and extract accurate distance and
distance distribution constraints that reflect conformational flexibility. In this thesis
we apply the emerging technique of SDSL and EPR to study protein flexibility and
the effects of ligand, allosteric and other environmental parameters such as
hydrophobic mismatch and electrostatics on conformational flexibility of proteins.
In Chapter 3, we investigate the dynamic response of the human estrogen
receptor α ligand binding domain (ERα-LBD) to the binding of different ligands and
coactivator peptides SDSL-EPR and DEER spectroscopy. We describe how local
changes in dynamics at position 543 of the C-terminal helix 12 (H12) domain has
provided the first direct experimental demonstration that this domain undergoes
dynamic changes in response to ligand binding that correlate with the ligand’s
biological activity. In line with the driving theme of this work, the local dynamic
results obtained are incorporated into the already existing crystal structure model
thus, completing the static picture available by the addition of protein flexibility
measurements.

34
Ligand-dependent changes are also observable for a label positioned at residue
530 in the H12 hinge region, however much more dramatic changes are observed at
this position in the presence of both ligand and coregulator peptides. We investigated
the ligand/coregulator induced changes in structure by measuring interspin distances
in 530 labeled ERα-LBD dimers using DEER. These results extend the current model
of ERα-LBD action and provide dynamic information on the H12 region as well as
quantitative structural information on the dimer conformation of ERα-LBD in
solution. The results suggest a large-scale remodeling of the ER dimer complex that is
sensitive to details of the ligand structure as well as the nature of the coactivator
sequence.
In Chapter 4 we continue our investigation of the receptor’s flexibility by
looking directly at the interaction between ligand and receptor using two nitroxide
labeled estradiols, HO-2105 and HO-2447. These new compounds proved to be
excellent molecular probes of ligand/receptor interaction with ERα-LBD. EPR
spectroscopy was used to investigate binding properties and local dynamics of the
spin-labeled ligand. Fluorescence spectroscopy demonstrated quenching of both the
fluorescence of estradiol and on the intrinsic tryptophan fluorescence of ERα-LBD by
the nitroxide moiety of the labeled ligand. We describe two methods to assay binding
of the probes to ERα-LBD: (i) an EPR derived binding assay and (ii) an intrinsic
tryptophan fluorescence quenching binding assay. Saturation binding studies of the
estrogen probes using the two assays showed good agreement between the
independent techniques. DEER spectroscopy was used to measure interspin distances

35
between the bound probes in the ERα-LBD homodimer complex. The structural
results are consistent with X-ray crystals of the ERα-LBD dimer and provide new
information about the distribution of conformations in the homodimer. The spin
labeled estradiols here described serve as versatile probes of ligand binding, local
dynamics and structure with potential applications as ER selective imaging agents
and as oxidative stress probes.
Chapter 5 includes results obtained on projects not related to ER, but all
sharing the broader theme of application of EPR to study biophysical systems where
we aim to gain insight into protein flexibility. EPR is a versatile technique that
enables study of a variety of biophysical phenomena. Here we describe applications
of EPR as a method to evaluate singlet oxygen production (1O2), characterize
conformational effects of hydrophobic mismatch on transmembrane helices, develop
methods for characterizing protein self-assembly and characterize unstructured
protein domains. Furthermore, as these projects result from collaborations with
research groups from different disciplines such as organic chemistry, medicinal
chemistry, biochemistry and mechanical engineering they each add a particular set of
challenges.
Chapter 6 evaluates future directions for continuing the investigation into the
molecular basis of ER action. Here we develop a theoretical model for the effect of
ligand/coregulator interaction on ER that is based on the combined results previously
presented. We also consider foreseeable challenges and provide recommendations
relative to experimental design on future investigations of ER with SDSL.

36
Summary Chapter 1 introduces background information on the nuclear receptor (NR)
superfamily. The relevance of estrogen receptor (ER), a member of the NR
superfamily, is discussed as well as an overview of its structure and function. This
Chapter also introduces site directed spin labeling (SDSL) and electron paramagnetic
resonance (EPR) as they apply to the study of protein dynamics and structure. Here
we provide the theoretical background necessary to interpret the experimental results
presented in later chapters. The study design and experimental procedure used to
produce and characterize the necessary ER mutants is described in Chapter 2. In this
chapter we also address so particular concern regarding method development that can
be helpful when optimizing recombinant protein production.

37
Chapter 2: Methods

38
2.1 Study Design The previous chapter establishes the relevance of ER-α as an important target
for breast cancer research and treatment. Antagonist ligands tend to inhibit cancer
growth; therefore it is desirable to understand the specific effect of antagonists and
SERMs on the structure of the receptor as a way to design more potent and more
selective inhibitors of the carcinogenic pathway. It is clear that the complex
pharmacology of estrogens cannot be fully explained by the static conformations of
ER-LBD available from X-ray crystallography. Dynamics of the LBD in response to
different ligands has been implicated in the response of receptors to SERMs 32. The
study described here is designed to combine new physical methods and synthetic
strategies to answer questions about the dynamic behavior and structure of ER that
cannot be addressed comparably by other means.
The ligand series selected for this study have similar binding modes, but
different biological responses ranging from full agonist to partial antagonist to full
antagonist 33-36. Their common estradiol steroid scaffold (Fig 2.1), orients the ligand
in the binding pocket, conserving the interaction of hydroxyl groups at position 3 with
Glu353, Arg394 and at position 17 with His524 respectively 37.The different activities
of the compounds can be attributed to the presence of sidechains at the 11β or 7β
positions as in the case of the antagonist ICI-182-780. Figure 2.1 shows the effect of
11β alkyl substituents on the biological activity of estradiol derivatives as described
by Hochberg et al 34,36.

39
Figure 2.1: Estradiol scaffold showing the 11β position and the effect of alkyl chains of variable length.
Increasing the number of carbons at the 11β position effectively tunes the biological
response of the ligands. By exploiting this recent finding it is possible to
systematically study the effect of agonist SERMs and antagonist on the dynamics and
structure of the H12 region.
Ligand binding is the first step in the estrogenic pathway; however,
coactivator binding determines the final transactivation function of ER. For this
reason it is important to include the effect of allosteric interaction via the AF2 region
as part of a comprehensive characterization of the structural changes occurring during
ER’s activation. We used co-activator derived peptides (D22, SRC-1, TIF-2, RIP-
140), containing the conserved LXXLL motif to investigate the effect of allosteric
interaction. These peptides are known to bind in a ligand dependent fashion to ER-α,
and are commonly used as predictors of a ligands’ biological activity 38.
2.2 Specific aims The following specific aims were identified in the planning stages of this research:
I. Produce mutants of ERα that will allow attachment of spin labels at
strategic points on helix 12
OH
OHCn, 11β n = 0 – 2; agonist n = 3 – 5; SERM n > 5 or bulky; antagonist

40
II. Measure the specific structural and dynamic differences that accompany
binding of agonists and antagonists
III. Measure the specific structural and dynamic differences that accompany
binding of ligand dependent coregulator peptides
IV. Characterize a new class of spin labeled estradiols for applications as
probes of ligand/receptor interaction
The long term objective of this project is to develop a rational basis for designing
therapeutic agents for hormone dependent breast cancer by elucidating the detailed
structural and dynamic changes of the receptor in response to agonist and antagonist
ligands
2.3 Site directed mutation
(a) Selection of mutation sites and site directed mutagenesis Mutations of ER for SDSL have been selected with careful attention to avoiding
possible perturbations of the interactions of H12 with the ER and other proteins. A
number of amino acids that critically mediate the role of H12 in ER’s action have
been identified by various studies 39,40. In the agonist conformation of ER-α
complexed with estradiol, H12 is positioned over the binding pocket. In this
configuration, the underside of H12 (specifically residues L540, L544, and A546)
undergoes a hydrophobic interaction with the receptor, while the outer surface forms
a charged binding region for coactivator docking (AF2). Mutation studies have shown
that the negatively charged amino acids D538, E542 and D545 are necessary for AF2
interaction and subsequent transcriptional activity. From this information it was
deduced that position M543 provides the most likely candidate for SDSL. Molecular

41
modeling on this site indicates that it is most likely to reflect significant ligand
induced changes while minimizing the perturbations to the critical interactions of
H12. Other possible sites meeting these criteria include mutations on L539 and L541.
Based in this information the sites for SDSL were selected to be 543 and 530. Herein
we describe the production of four ER-LBD mutants in addition to the wild type
variant.
Table 2.1: The sequences of the DNA primers used for site directed mutagenesis Primer name Sequence 5’-3’ C381S CCACCTTCTAGAAAGTGCCTGGCTAGAG C417S GAACCAGGGAAAAAGTGTAGAGGGCATG C530S GTACAGCATGAAGAGCAAGAACGTGGTGCM543C(1) CTGCTGGTGGAGTTGCTGGACGCCC M543C(2) CTGCTGGTGGAGTGGCTGGACGCCC M543C(3) CTGCTGGTGGAGTGCCTGGACGCCC
(b) Expression, purification and spin labeling A pET15b vector was used to clone and express ERα-LBD (a.a. 302-552).
This vector encodes for a histidines tag region and thrombin cleavage site at the N-
terminus of the expressed protein. This feature allows for convenient purification with
a Ni-NTA column.
Three mutant constructs plus the wild type ERα-LBD were prepared for the
purpose of this study. The initial step for the production of mutants is the design of
primers to encode the specific mutation. Table 2.1 summarizes the primers used to
achieve the necessary mutations.
The mutants produced are derived from the wild-type ERα ligand-binding
domain (hERα-LBD) (a.a. 302-552) expressed in a pET15b vector 41. The wild type

42
protein contains four cysteines, three of which (C381, C417, C530) are solvent
exposed and therefore reactive to electrophilic labeling, the fourth (C447) is buried
and proven to be unreactive to labeling 42. The mutant construct C318S/C417S was
used to allow the selective labeling of C530. Production of a singly reactive cysteine
at position C543 was accomplished by mutagenesis of M543C in the cysteine-less
construct.
Plasmid mutation was carried out using the QuikChange Kit from Stratagene,
Inc (San Diego, CA). Purification of the plasmids was accomplished with Qiaprep
spin columns (Qiagen) and their sequences confirmed by SeqWright (Houston, TX)
after every round of mutation. Plasmid amplification was achieved in XLt-Blue E.
coli cells (Novagen, San Diego, CA), while protein production was carried out in Bl-
21(DE3)pLysS E. coli (Novagen) in low salt LB media, 18 hour incubation at 37 °C,
followed by induction with 0.5 µM IPTG at 37 °C for 3 hours. Cell pellets were lysed
and solubilized using non-denaturing conditions (2 M NDSB, 10 mM Tris, 100 mM
KCl, 0.2 mg/ml egg white lysozyme from Sigma, St. Louis, MO) and sonication at
4 oC to reduce viscosity.
His tagged ER was purified from the cell lysate with a Ni-NTA affinity column
by a flow through method using standard elution in 300 mM imidazole. Labeling was
accomplished by incubating the eluate, which typically had protein concentration
between 10 and 30 mg/ml, with 5 fold molar excess of iodomethyl spin label (IMSL,
see below) for a minimum of 4 hours. Fractions containing the protein were then
assayed by sodium dodecyl sulfate polyacrylamide gel electrophoresis (SDS-PAGE),

43
and pooled. A ten fold dilution of the pooled fraction with 50 mM Tris, 10% glycerol
at pH 8.1 was used for loading onto a pre-equilibrated cation exchange column. After
extensive washing to remove unreacted label, the elution was carried out with 50 mM
Tris, 10% glycerol at pH 8.1 buffer containing 200 mM KCl. Samples prepared by
this method were found to be >90% pure when assayed by LC-MS. If necessary, the
sample was further purified with Zeba desalting spin columns (Thermo Scientific,
Rockford, IL) to remove residual spin label.
(c) Characterization of purified mutants by LC-MS and [3H]estradiol binding assay Characterization of the mutants and wild type constructs was carried out by
independent measurements. Plasmid sequence was verified by SeqWright (Houston,
TX), MS analysis of the purified protein was conducted by Novatia (NJ) and
[3H]estradiol binding was carried out by the group of Prof. John Katzenellenbogen at
the University of Illinois at Urbana-Champaign (IL). The results of these analyses are
summarized in the following figures.

44
ERα-LBD wild type ATGAAGAAGA ACAGCCTGGC CTTGTCCCTG ACGGCCGACC AGATGGTCAG TGCCTTGTTG 60 GATGCTGAGC CCCCCATACT CTATTCCGAG TATGATCCTA CCAGACCCTT CAGTGAAGCT 120 TCGATGATGG GCTTACTGAC CAACCTGGCA GACAGGGAGC TGGTTCACAT GATCAACTGG 180 GCGAAGAGGG TGCCAGGCTT TGTGGATTTG ACCCTCCATG ATCAGGTCCA CCTTCTAGAA 240 TGTGCCTGGC TAGAGATCCT GATGATTGGT CTCGTCTGGC GCTCCATGGA GCACCCAGGG 300 AAGCTACTGT TTGCTCCTAA CTTGCTCTTG GACAGGAACC AGGGAAAATG TGTAGAGGGC 360 ATGGTGGAGA TCTTCGACAT GCTGCTGGCT ACATCATCTC GGTTCCGCAT GATGAATCTG 420 CAGGGAGAGG AGTTTGTGTG CCTCAAATCT ATTATTTTGC TTAATTCTGG AGTGTACACA 480 TTTCTGTCCA GCACCCTGAA GTCTCTGGAA GAGAAGGACC ATATCCACCG AGTCCTGGAC 540 AAGATCACAG ACACTTTGAT CCACCTGATG GCCAAGGCAG GCCTGACCCT GCAGCAGCAG 600 CACCAGCGGC TGGCCCAGCT CCTCCTCATC CTCTCCCACA TCAGGCACAT GAGTAACAAA 660 GGCATGGAGC ATCTGTACAG CATGAAGTGC AAGAACGTGG TGCCCCTCTA TGACCTGCTG 720 CTGGAGATGC TGGACGCCCA CCGCCTACAT GCGCCC MKKNSLALSLTADQMVSALLDAEPPILYSEYDPTRPFSEASMMGLLTNLADRELVHMINW 60 AKRVPGFVDLTLHDQVHLLECAWLEILMIGLVWRSMEHPGKLLFAPNLLLDRNQGKCVEG 120 MVEIFDMLLATSSRFRMMNLQGEEFVCLKSIILLNSGVYTFLSSTLKSLEEKDHIHRVLD 180 KITDTLIHLMAKAGLTLQQQHQRLAQLLLILSHIRHMSNKGMEHLYSMKCKNVVPLYDLL 240 LEMLDAHRLHAP 252 N-terminal tag = GSSHHHHHHSSGLVPRGSH LC-MS Analysis: 30824 Da target mass
Figure 2.1: cDNA sequencing results with the derived amino acid sequence (A). LC-MS results confirming the target molecular weight for the ER mutant (B)
A
B

45
ERα-LBD cysteine free ATGAAGAAGA ACAGCCTGGC CTTGTCCCTG ACGGCCGACC AGATGGTCAG TGCCTTGTTG 60 GATGCTGAGC CCCCCATACT CTATTCCGAG TATGATCCTA CCAGACCCTT CAGTGAAGCT 120 TCGATGATGG GCTTACTGAC CAACCTGGCA GACAGGGAGC TGGTTCACAT GATCAACTGG 180 GCGAAGAGGG TGCCAGGCTT TGTGGATTTG ACCCTCCATG ATCAGGTCCA CCTTCTAGAA 240 TCTGCCTGGC TAGAGATCCT GATGATTGGT CTCGTCTGGC GCTCCATGGA GCACCCAGGG 300 AAGCTACTGT TTGCTCCTAA CTTGCTCTTG GACAGGAACC AGGGAAAATC TGTAGAGGGC 360 ATGGTGGAGA TCTTCGACAT GCTGCTGGCT ACATCATCTC GGTTCCGCAT GATGAATCTG 420 CAGGGAGAGG AGTTTGTGTG CCTCAAATCT ATTATTTTGC TTAATTCTGG AGTGTACACA 480 TTTCTGTCCA GCACCCTGAA GTCTCTGGAA GAGAAGGACC ATATCCACCG AGTCCTGGAC 540 AAGATCACAG ACACTTTGAT CCACCTGATG GCCAAGGCAG GCCTGACCCT GCAGCAGCAG 600 CACCAGCGGC TGGCCCAGCT CCTCCTCATC CTCTCCCACA TCAGGCACAT GAGTAACAAA 660 GGCATGGAGC ATCTGTACAG CATGAAGTCC AAGAACGTGG TGCCCCTCTA TGACCTGCTG 720 CTGGAGATGC TGGACGCCCA CCGCCTACAT GCGCCCTGAG GATCCGGCTG CTAACAAAGC 780 CCGAAAGGAA NCTNN Peptide Sequence: MKKNSLALSLTADQMVSALLDAEPPILYSEYDPTRPFSEASMMGLLTNLADRELVHMINW 60 AKRVPGFVDLTLHDQVHLLESAWLEILMIGLVWRSMEHPGKLLFAPNLLLDRNQGKSVEG 120 MVEIFDMLLATSSRFRMMNLQGEEFVCLKSIILLNSGVYTFLSSTLKSLEEKDHIHRVLD 180 KITDTLIHLMAKAGLTLQQQHQRLAQLLLILSHIRHMSNKGMEHLYSMKSKNVVPLYDLL 240 LEMLDAHRLHAP 252 N-terminal tag = GSSHHHHHHSSGLVPRGSH Target mass = 30776 Da
Figure 2.2: : cDNA sequencing results with the derived amino acid sequence (A). LC-MS results confirming the target molecular weight for the ER mutant (B).
A
B

46
ERα-LBD C543 (C381S, C417S, C530S, M543C) ATGAAGAAGA ACAGCCTGGC CTTGTCCCTG ACGGCCGACC AGATGGTCAG TGCCTTGTTG 60 GATGCTGAGC CCCCCATACT CTATTCCGAG TATGATCCTA CCAGACCCTT CAGTGAAGCT 120 TCGATGATGG GCTTACTGAC CAACCTGGCA GACAGGGAGC TGGTTCACAT GATCAACTGG 180 GCGAAGAGGG TGCCAGGCTT TGTGGATTTG ACCCTCCATG ATCAGGTCCA CCTTCTAGAA 240 TCTGCCTGGC TAGAGATCCT GATGATTGGT CTCGTCTGGC GCTCCATGGA GCACCCAGGG 300 AAGCTACTGT TTGCTCCTAA CTTGCTCTTG GACAGGAACC AGGGAAAATC TGTAGAGGGC 360 ATGGTGGAGA TCTTCGACAT GCTGCTGGCT ACATCATCTC GGTTCCGCAT GATGAATCTG 420 CAGGGAGAGG AGTTTGTGTG CCTCAAATCT ATTATTTTGC TTAATTCTGG AGTGTACACA 480 TTTCTGTCCA GCACCCTGAA GTCTCTGGAA GAGAAGGACC ATATCCACCG AGTCCTGGAC 540 AAGATCACAG ACACTTTGAT CCACCTGATG GCCAAGGCAG GCCTGACCCT GCAGCAGCAG 600 CACCAGCGGC TGGCCCAGCT CCTCCTCATC CTCTCCCACA TCANGCACAT GAGTAACAAA 660 GGCATGGAGC ATCTGTACAG CATGAAGTCC AAGAACGTGG TGCCCCTCTA TGANCTGCTG 720 CTGGAGTGTC TGGACGCCCA CCGCCTACAT GCGCCCTGAG GATCCGGCTG CTAACAAAGC 780 CCGAAAGGAA GCTGANTTN Peptide Sequence: MKKNSLALSLTADQMVSALLDAEPPILYSEYDPTRPFSEASMMGLLTNLADRELVHMINW 60 AKRVPGFVDLTLHDQVHLLESAWLEILMIGLVWRSMEHPGKLLFAPNLLLDRNQGKSVEG 120 MVEIFDMLLATSSRFRMMNLQGEEFVCLKSIILLNSGVYTFLSSTLKSLEEKDHIHRVLD 180 KITDTLIHLMAKAGLTLQQQHQRLAQLLLILSHIXHMSNKGMEHLYSMKSKNVVPLYXLL 240 LECLDAHRLHAP 252 N-terminal tag = GSSHHHHHHSSGLVPRGSH
Figure 2.3: cDNA sequencing results with the derived amino acid sequence (A). LC-MS results confirming the target molecular weight for the ER mutant (B).
A
B

47
ER-M5 C543-C530 (C381S, C417S, M543C) ATGAAGAAGA ACAGCCTGGC CTTGTCCCTG ACGGCCGACC AGATGGTCAG TGCCTTGTTG 60 GATGCTGAGC CCCCCATACT CTATTCCGAG TATGATCCTA CCAGACCCTT CAGTGAAGCT 120 TCGATGATGG GCTTACTGAC CAACCTGGCA GACAGGGAGC TGGTTCACAT GATCAACTGG 180 GCGAAGAGGG TGCCAGGCTT TGTGGATTTG ACCCTCCATG ATCAGGTCCA CCTTCTAGAA 240 TCTGCCTGGC TAGAGATCCT GATGATTGGT CTCGTCTGGC GCTCCATGGA GCACCCAGGG 300 AAGCTACTGT TTGCTCCTAA CTTGCTCTTG GACAGGAACC AGGGAAAATC TGTAGAGGGC 360 ATGGTGGAGA TCTTCGACAT GCTGCTGGCT ACATCATCTC GGTTCCGCAT GATGAATCTG 420 CAGGGAGAGG AGTTTGTGTG CCTCAAATCT ATTATTTTGC TTAATTCTGG AGTGTACACA 480 TTTCTGTCCA GCACCCTGAA GTCTCTGGAA GAGAAGGACC ATATCCACCG AGTCCTGGAC 540 AAGATCACAG ACACTTTGAT CCACCTGATG GCCAAGGCAG GCCTGACCCT GCAGCAGCAG 600 CACCAGCGGC TGGCCCAGCT CCTCCTCATC CTCTCCCACA TCAGGCACAT GAGTAACAAA 660 GGCATGGAGC ATCTGTACAG CATGAAGTGC AAGAACGTGG TGNCCCTCTA TGACCTGCTG 720 CTGGAGTGTC TGGACGCCCA CCGCCTACAT GCGCCCTGAG GATCCGGCTG CTNACAAAGC 780 CCGAAAGGAA GCTGAGTNN MKKNSLALSLTADQMVSALLDAEPPILYSEYDPTRPFSEASMMGLLTNLADRELVHMINW 60 AKRVPGFVDLTLHDQVHLLESAWLEILMIGLVWRSMEHPGKLLFAPNLLLDRNQGKSVEG 120 MVEIFDMLLATSSRFRMMNLQGEEFVCLKSIILLNSGVYTFLSSTLKSLEEKDHIHRVLD 180 KITDTLIHLMAKAGLTLQQQHQRLAQLLLILSHIRHMSNKGMEHLYSMKCKNVVXLYDLL 240 LECLDAHRLHAP 252 N-terminal tag = GSSHHHHHHSSGLVPRGSH Target Mass = 30764 Da
Figure 2.4: cDNA sequencing results with the derived amino acid sequence (A). LC-MS results confirming the target molecular weight for the ER mutant (B).
A
B

48
ERα-LBD C530 (C381S, C417S) ATGAAGAAGA ACAGCCTGGC CTTGTCCCTG ACGGCCGACC AGATGGTCAG TGCCTTGTTG 60 GATGCTGAGC CCCCCATACT CTATTCCGAG TATGATCCTA CCAGACCCTT CAGTGAAGCT 120 TCGATGATGG GCTTACTGAC CAACCTGGCA GACAGGGAGC TGGTTCACAT GATCAACTGG 180 GCGAAGAGGG TGCCAGGCTT TGTGGATTTG ACCCTCCATG ATCAGGTCCA CCTTCTAGAA 240 TCTGCCTGGC TAGAGATCCT GATGATTGGT CTCGTCTGGC GCTCCATGGA GCACCCAGGG 300 AAGCTACTGT TTGCTCCTAA CTTGCTCTTG GACAGGAACC AGGGAAAATC TGTAGAGGGC 360 ATGGTGGAGA TCTTCGACAT GCTGCTGGCT ACATCATCTC GGTTCCGCAT GATGAATCTG 420 CAGGGAGAGG AGTTTGTGTG CCTCAAATCT ATTATTTTGC TTAATTCTGG AGTGTACACA 480 TTTCTGTCCA GCACCCTGAA GTCTCTGGAA GAGAAGGACC ATATCCACCG AGTCCTGGAC 540 AAGATCACAG ACACTTTGAT CCACCTGATG GCCAAGGCAG GCCTGACCCT GCAGCAGCAG 600 CACCAGCGGC TGGCCCAGCT CCTCCTCATC CTCTCCCACA TCAGGCACAT GAGTAACAAA 660 GGCATGGAGC ATCTGTACAG CATGAAGTGC AAGAACGTGG TGCCCCTCTA TGACCTGCTG 720 CTGGAGATGC TGGACGCCCA CCGCCTACAT GCGCCCTGAG GN MKKNSLALSLTADQMVSALLDAEPPILYSEYDPTRPFSEASMMGLLTNLADRELVHMINW 60 AKRVPGFVDLTLHDQVHLLESAWLEILMIGLVWRSMEHPGKLLFAPNLLLDRNQGKSVEG 120 MVEIFDMLLATSSRFRMMNLQGEEFVCLKSIILLNSGVYTFLSSTLKSLEEKDHIHRVLD 180 KITDTLIHLMAKAGLTLQQQHQRLAQLLLILSHIRHMSNKGMEHLYSMKCKNVVPLYDLL 240 LEMLDAHRLHAP 252 N-terminal tag = GSSHHHHHHSSGLVPRGSH LC-MS Analysis: 30792 Da target mass
Figure 2.5: cDNA sequencing results with the derived amino acid sequence (A). LC-MS results confirming the target molecular weight for the ER mutant (B).
A
B

49
Figure 2.6: [3H]binding assay performed by Kathryn Carlson, in the laboratory of Prof. J. Katzenellenbogen (University of Illinois, Urban-Champaign, IL). From the top: (i) ER-LBD wild type displaying a Kd of 0.15 nM consistent with reported values, (ii) spin labeled ER-LBD at position 543, displaying a Kd of 1.2 nM, (iii) spin labeled ER-LBD at position 530 displaying a Kd of 0.9 nM.
0. 2. 5. 7. 10. 12.0.0
0.0
0.1
0.1
0.20 0.2
0.3
0.3
nM
0 1 2 3 4 5 6 7 8 9 100.000 0.005 0.010 0.015 0.020 0.025 0.030 0.035 0.040 0.045 0.050 0.055
Free (nM)
0.0 2.5 5.0 7.5 10.00.00 0.05 0.10 0.15 0.20 0.25 0.30 0.35 0.40 0.45 0.50 0.55
nM
ER-543 Kd = 1.2 nM
ER-530 Kd = 0.85 nM
ERα-LBD wild type Kd = 0.15 nM
(i)
(ii)
(iii)

50
The results summarized above show that the ER mutants proposed have been
successfully mutated, expressed and purified. Due to reasons discussed in section 6.5,
“Challenges”, only the ERα-LBD wild type, the ER-543 and the ER-530 mutants were
assayed for binding activity by [3H]estradiol assay. The binding assay indicates that high
affinity is retained after mutation and spin labeling of the mutant constructs tested.
2.4 Pitfalls and optimization of experimental conditions Plasmid design: In order for SDSL to be applicable, reactive cysteines need to be added
or removed, in order to produce mutants with cysteines placed at the desired positions. In
the case of ER, of the four cysteines present in the sequence, three are solvent exposed
while a third at position 381 is buried and therefore non-reactive. The mutagenic primers
have been designed individually to incorporate the necessary point mutation. Some
important considerations that go into primer design are:
(i) Primers should be designed with similar annealing efficiency
(ii) Primers should be between 25 and 45 bases in length with a melting
temperature (TM) greater than 75oC.
(iii) The mutation should be close to the middle of the primer in order to
ensure maximum annealing efficiency of the extending ends of the primer.
(iv) Primers should be designed with a GC content of about 40% and terminate
with one or more C or G at the 3’ –end.
Some useful online tools are available to help design optimum primers for the desired
mutations. In this work all primers were checked with PrimerX online primer design tool
(“http://www.bioinformatics.org/primerx/index.htm”).

51
The QuikChange kit from Stratagene (La Jolla, CA) used to introduce and
amplify the point mutations includes all the necessary enzymes for the PCR and
transformation reaction. We used a thermo-cycler to perform PCR. Some optimization of
the PCR procedure was necessary to satisfactory amplification, in particular “extension
time” was found to have the largest effect on synthesis. The final conditions used for the
3.5 Kb plasmid are as follows:
Segment 1 – 1 min at 95oC – meting step
Segment 2 – 1 min at 95oC – melting step
Segment 2 – 1 min at 55oC – annealing step
Segment 2 – 9 min at 65oC – extension step
Segment 2 is repeated 30 times.
Transformation of the PCR products was accomplished using standard protocol
described in detain in the QuikChange instruction manual with a minor modification
regarding the concentrations of cells plated. We found that using 5 μL of the
transformation reaction mixture yielded an optimal amount of cells for selection. The
plating media was composed of 10 g/l LB-broth dry powder, 1 g/l Agar and brought up to
volume with deionized water. Ampicillin (50 μg/l final concentration) was added after
sterilization by autoclave (121oC, 40 min).
Media composition optimization: Several media compositions were screened in order to
optimize expression and recovery of ER protein. Some media tested were: (i) LB broth
(Sigma, St. Louis), (ii) Terrific Broth (Sigma, St. Louis) and (iii) combinations of

52
tryptone and yeast extract. We found that satisfactory condition for cell growth and
protein production are achieved with the following media composition:
16 g/L Tryptone
3.3 g/L Yeast extract
5 g/L NaCl
~ 5 ml/L of 1 M NaOH to adjust the pH to pH 7.2.
Induction conditions: Varying the time and temperature of induction is a common method
to optimize protein production in prokaryotic systems. In the case of ER we found that
induction with isopropylthiolgalactose (IPTG) when the cell concentration reached OD600
~ 2 substantially increased protein yield. The fermentation was inoculated in the media
described above and incubated in a shaking incubator for 15-18 hours at 37oC. When the
cell concentration reached OD600 = 2, the flasks were spiked with 150 μM IPTG and the
induction was allowed to continue at 37oC for 4 hours. The cells were then harvested by
centrifugation at 15000 RPM and stored at −20oC until needed for purification.
Extraction conditions: The extraction step is crucial to ensure proper protein folding.
Prokaryotic expression systems tend to produce inclusion bodies made of misfolded and
aggregated protein that is difficult to refold into a native state. We found that using
extraction buffer with high concentrations of urea or guanidine would yield large
amounts of protein but with very low affinity. In fact, these preparations would quickly
form large precipitates due to protein aggregation. We improved the process by including
Dimethylethyl-(3-Sulfopropyl)-ammonium (NDSB) in the extraction buffer, so that the
final composition of the extraction buffer used in this work is:

53
50 mM Tris, pH 8.1
150 mM KCl
10 % glycerol
2 M NDSB
1 mM PMSF
This extraction buffer produced active protein, although smaller total yields were
observed compared to denaturating buffer conditions.
Purification procedure optimization: The extracted protein was purified in a two column
process that reliably yielded more than 90% pure protein as assayed by SDS-PAGE and
LC-MS. The process consists of an initial capture step with Ni-NTA and a second
refinement step with a cation affinity resin. The purification protocol was described
earlier in this Chapter, however caution should be taken to reduce exposure of the protein
to room temperature. Care should also be taken to minimize the time that the protein
spends in the Ni-NTA elution buffer due to the presence of imidazole. Under optimal
conditions the two chromatographic separations should be carried out in the same day.
DEER acquisition: DEER experiments can accurately provide two important parameters
about interacting spins: (i) distance and (ii) distance distribution. These two parameters
affect the DEER signal in different respects: the distance information is encoded in the
first μs of signal evolution, while the distance distribution might require acquisition up to
several μs in order to be fully resolved. The analysis method used allows us to estimate
the uncertainty for the two parameters. We have developed a method of “baseline
stitching” to address cases where the distance distribution information cannot be easily

54
separated from the baseline. In this method we take spectra at a short evolution time and
spectra at long evolution time and use the initial part of the spectrum to derive distance
constraints and the latter part to properly subtract the baseline. This method holds
promise for cases such as particularly flexible proteins where the distance distribution is
intrinsically large.
Summary: Chapter 2 introduces a coherent study design that allows one to systematically measure
ligand induced effects of agonists, SERMs, and antagonists on the dynamics and structure
of ERα-LBD. This chapter also describes the site directed mutation, production, and
characterization of the proposed mutants using LC-MS and [3H]estradiol binding. The
next Chapter deals with application of the techniques and topics described in both
Chapters 1 and 2. Here we apply SDSL to the mutants produced using the procedure
described in Chapter 2 and analyze the result as part of the goal of integrating existing
information about structure from X-ray data with dynamic information derived from
EPR. Chapter 2 also discusses some important technical concerns regarding plasmid
mutation, protein expression and signal acquisition that have been the focus of
optimization. The next Chapter deals with the application of the techniques so far
described to measure the dynamic response of ER to ligands and coactivators.

55
Chapter 3: Dynamic and structural response of the
estrogen receptor ligand-binding domain to ligand and
coactivator binding

56
3.1 Introduction Estrogen Receptor alpha (ER-α) is a transcription factor belonging to the nuclear
receptor (NR) superfamily that acts to regulate the expression of target genes involved in
development, metabolism and reproduction. ERα transactivation is estradiol dependent
and is directed to genomic estrogen response elements (ERE) by tissue specific co-
activators and co-repressors proteins. Members of the NR family share limited sequence
similarities, however, they are structurally homologous with functionally independent
domains as summarized in Figure 3.1 32,33,43. The full length ER-α is composed of an N-
terminal activation function 1 (AF1) domain, a DNA binding domain, a short hinge
region and the C-terminal ligand binding domain (LBD) where the activation function 2
(AF2) region is located and where selective ligand binding and allosteric protein
interaction occurs. This characteristic architecture makes it possible to investigate the
activity of individual domains separately. Unliganded ER-α is found associated with
chaperone heat shock proteins (HSP90) which stabilize the Apo conformation. Upon
ligand binding, HSP are released and dimers are formed. The general mode of action of
ER-α has been described as a tripartite model where the ligand, dimerized receptor and
specific coregulator complex is necessary to carry out target specific genomic modulation
15.

57
Figure 3.1: Model of ERα-LBD showing ligand induced conformations of helix 12 for agonist (purple, 1ERE) and antagonist (red, 3ERT) ligands (A). Homodimer conformation of ERα-LBD (1ERE) showing helix 12 highlighted in yellow; the labeling positions are marked by spheres, at 543 in blue and at 530 in orange (B). Molecular models were generated with VMD using the Research Collaboratory for Structural Bioinformatics protein data bank (RCSB-PDB) files 1ERE and 3ERT.
In addition to its normal homeostatic functions, ER-α plays a major role in the
progression of estrogen responsive breast cancer and several other disorders such as
osteoporosis, obesity and ovarian cancer 44-46. The importance of ER-α as target of
current breast cancer therapies and as a general model for the action of NRs has attracted
much attention since its initial purification and cloning 13,47.
Structural information available on ER-α up to now has been obtained almost
exclusively from crystallographic studies of ER-LBD bound to ligands with different
A B

58
biological activity 20,48,49. Structures poised in the agonist conformation (e.g. estradiol
bound) differ from antagonist structures mainly in the position of the C-terminal helix 12
(H12). In agonist structures H12 is stabilized in a “closed conformation” which folds over
the binding pocket and forms the AF2 surface where coregulators bind. Ligands with
antagonist character tend to disrupt proper folding of H12 thus inhibiting coregulator
binding which is necessary for ER to carry out its downstream effects. Although crystal
structures have provided valuable insights for elucidating some ligand responses, they
have also been unable to thoroughly explain the action of an important class of ER
binding therapeutic agents known as selective estrogen receptor modulators (SERMs)
50,51. This class of compounds shows promise in clinical applications where SERMs such
as raloxifene and tamoxifen show anti-estrogenic action in estrogen responsive breast
cancer cells while behaving as agonists in other tissues such as the uterus 17. It has been
postulated that SERMs act to partially disrupt the formation of AF2 by affecting the
position of H12, however, the static picture provided by X-ray crystal data has not been
sufficient to explain the complex biological effects of these compounds.
Recently, evidence has emerged pointing to a more active role of allosteric
coregulator binding in defining the structure of ER-α 52,53. Tamrazi et al. used site
specific fluorescent labeling at C530 to probe dynamic changes upon ligand and
coregulator peptide binding providing evidence for a strong stabilizing effect of
coactivator binding on the ER dimer. These finding underline the importance of allosteric
binding as part of the ligand dependent structural remodeling of the receptor. In fact,

59
proper dimer configuration is essential for the downstream transactivation function in the
full length ER-α.
In this chapter we provide direct evidence for dynamic and structural effects of
ligand binding and allosteric coregulator binding on the H12 region of ERα-LBD. Using
site directed spin labeling (SDSL), we introduced an iodomethyl nitroxide spin label
(IMSL) at positions 543 (ERα-LBD C417S, C381S, C530S, M543C) and 530 (ERα-LBD
C417S, C381S) of ERα-LBD 21,34,54. We used electron paramagnetic resonance (EPR) to
monitor local dynamics of the label and double electron-electron resonance (DEER) to
measure structural response of the dimerized receptor to a selected set of ligands and
coregulator peptides. Here, we also report an improved synthetic scheme for production
of IMSL. This label produces a stable thioether linkage and a four bond tether to the α-
carbon. We expect this to make IMSL a more accurate probe of backbone motion
compared with the more widely used methanethiosulfonate spin label (MTSSL) which
produces a five bond tether with an extra degree of rotameric freedom.
The ligand series selected for this study have similar binding modes, but different
biological responses ranging from full agonist to partial antagonist to full antagonist 34-36.
Their common estradiol steroid scaffold, orients the ligand in the binding pocket
conserving the interaction of hydroxyl groups at position 3 with Glu353, Arg394 and at
position 17 with His524 respectively 37. The different activities of the compounds can be
attributed to the presence of side chains at the 11β or 7β positions as in the case of the
antagonist ICI-182-780.

60
We used co-activator derived peptides (D22, SRC-1, TIF-2, RIP-140), containing
the conserved LXXLL motif to investigate the effect of allosteric interaction on the
dynamics of C530 hinge region and on the structure of the ER dimer. These peptides are
known to bind in a ligand dependent fashion to ER-α, and are commonly used as
predictors of a ligands’ biological activity.38,41
3.2 Materials and Methods
(a) Protein Expression, Purification and Spin Labeling The two mutants produced are derived from wild-type ERα ligand-binding
domain (hERα-LBD) (a.a. 302-552) expressed in a pET15b vector (23). The wild type
protein contains four cysteine, three of which (C381, C417, C530) are solvent exposed
and therefore reactive to electrophilic labeling, the fourth (C447) is buried and proven to
be unreactive to labeling 42. The mutant construct C318S/C417S was used to allow the
selective labeling of C530. Production of a singly reactive cysteine at position C543 was
accomplished by mutagenesis of M543C in the cysteine-less construct.
Plasmid mutation was carried out as previously described in Section 2.3.
His tagged ER was purified from the cell lysate with Ni-NTA affinity column
using a flow-through method using standard elution in 300 mM Imidazole. Labeling was
accomplished by incubating the eluate, with typical protein concentration between 10 and
30 mg/ml, with 5 fold mole excess of iodomethyl spin label (IMSL, see below) for a
minimum of 4 hours. Fractions containing the protein were then assayed by SDS-PAGE
electrophoresis, and pooled. A ten fold dilution of the pooled fraction with 50mM Tris,
10% Glycerol at pH 8.1 was used for loading onto a pre-equilibrated cation exchange

61
column. After extensive washing to remove unreacted label, the elution was carried out
with 50mM Tris, 10% Glycerol at pH 8.1 buffer containing 200mM KCl. Samples
prepared by this method were found to be >90% pure when assayed by LC-MS. If
necessary, the sample was further purified with Zeba desalting spin columns (Thermo
Scientific, Rockford, IL) to remove residual spin label.
(b) Ligands The ligand structures used in the study are summarized in Figure 3.2. The ligand
series tested includes agonist, SERM and antagonist ligands: (i) Estradiol (E2) [Estra-
1,3,5(10)-triene-3,17-diol] was purchased from Sigma-Aldrich (St. Luois, MO). (ii) 11β-
2C [Estra-1,3,5(10)-triene-3,17-diol,11-ethenyl-(11β,17β)] 55. (iii) 11β-5C [Estra-
1,3,5(10)-triene-3,17-diol,11-pentyl-,(11β,17β)] 56. (iv) RU 39,411 [Estra-1,3,5(10)-
triene-3,17-diol,11-[4-[2-(dimethylamino)ethoxy]plenyl]-(11β,17β)], 57. (v) RU 58,668
[Estra-1,3,5(10)-triene-3,17-diol,11-[4-[[5-[(4,4,5,5,5-pentafluoropentyl) sulfonyl]pentyl]
oxy]phenyl]-(11β,17β)]. (vi) ICI 182,780 [7β [9]-(4,4,5,5,5-pentafluoropentyl)sulfinyl-
[nonyl]estra-1,3,5(10)triene-3,17β-diol] 58. Compounds ii and iv were prepared by
R.Hanson using the procedures described in the references. Compound iii was prepared
by R. Hochberg using the procedure described in the reference. Compounds v and vi
were provided to R. Hanson by Roussel-Uclaf and Astra-Zeneca respectively.

62
Figure 3.2: Chemical structures of ligands used in the study: (i) Estradiol, (ii) E11β-2, (iii) E11β -5, (iv) RU 39,411, (v) RU 58,668 and (vi) ICI 182,780.
(c) Peptides The coactivator peptides used in this work (Table 3.1) were selected to include the
conserved LXXLL binding motif. All the peptides are known to bind ER-α with ligand
dependent affinity. Steroid Receptor cofactor 1 (SRC-1), receptor interacting protein
(RIP-140), translation initiation factor TIF-2 and random phage display peptide (D22),
were acquired from AnaSpec, Inc (San Jose, CA). The peptide sequences, with the
exception of D22, are derived from naturally occurring coregulator proteins.
O
F F
F
F F
OH
OH
S
(i) (ii) (iii)
(iv) (v) (vi)
OH
OH
OH
OH
O H
O H
N O
O H
O HF
F F F F
O
OS O
OH
OH

63
Table 3.1: Peptide sequences of the peptides used in this study derived from coregulator proteins. The LXXLL motif is shown in boldface. SRC-1 L-T-E-R-H-K-I-L-H-R-L-L-Q-G RIP-140 S-F-S-K-N-G-L-L-S-R-L-L-R-Q-N-Q-D-S-Y hNCoA-2/TIF-2 E-K-H-K-I-L-H-R-L-L-Q-D-S D22 L-P-Y-E-G-S-L-L-L-K-L-L-R-A-P-V-E-E-V
(d) Synthesis of IMSL The iodomethyl spin label employed in this study was synthesized using a new
protocol developed by Adam Hendricks in Prof. Robert Hanson’s laboratory. To 2,2,5,5-
Tetramethyl-3-pyrrolin-1-oxyl-3-carboxylic acid (389mg, 2.11 mmol) in 7mL of freshly
dried THF was added 0.64 mL of triethylamine (4.55 mmols) and the solution was cooled
to 0oC. Ethyl chloroformate (0.30 mL, 3.14 mmols) in 3mL of THF was added dropwise
over 30 minutes and stirring continued at 0oC for another 45 minutes. The reaction
mixture was filtered to remove triethylamine-hydrochloride, and sodium borohydride
(113 mg, 2.99 mmols) in 5mL of water was added over 20 minutes, while maintaining
0oC. After one hour the reaction was stopped and 1N HCl was added slowly to quench
excess sodium borohydride. The solution was extracted with dicloromethane and washed
with brine (3x 30mL). The organic layer was dried over magnesium sulfate. Upon
removal of the magnesium sulfate, florisil was added and the mixture was evaporated.
Purification by flash chromatography (70/30 hexane/ethyl acetate) yielded 220 mg of
yellow crystals, 61.2% yield. IR; 3400cm-1 O-H, 2950 cm-1 alkyl C-H, no carbonyl peaks
present. MP: 74-76oC,

64
To 2,2,5,5-Tetramethyl-3-pyrrolin-1-oxyl-3-ol (48 mg, 0.282 mmol) in
dichloromethane (10 ml) was added triethylamine (0.1 mL, 0.712 mmol), and the solution
was cooled to -10ºC. To this solution methanesulfonyl chloride (0.1mL, 1.283 mmol) was
added and the reaction was stirred for 10 minutes at -10ºC and then overnight at room
temperature. The reaction solution was partitioned between saturated sodium chloride
and dichloromethane. The organic layer was separated and dried over magnesium sulfate,
filtered and evaporated to dryness. The residue was purified via flash chromatography,
(70/30 hexane/ethyl acetate), yielding 49 mg of yellow/green crystals (70% yield). IR:
2989 cm-1 alkyl C-H, 900cm-1 alkene =C-H, 1380 cm-1 and 1135 cm-1 sulfone SO2. MS:
M+2 250.04 100%. MP: 83-84oC.
(e) Mutant characterization Determination of binding affinities (Kd) of spin labeled mutants was carried out by
saturation binding curves using [3]-estradiol in Prof. Katzenellenbogen lab at the
University of Illinois, Urbana-Champaign using previously described methods.59 Protein
activity for spin labeled mutants was determined from [3H]estradiol binding and protein
concentration was estimated using the Bradford assay.60 Purity and molecular weight
were determined from SDS-PAGE and LC-TOF-MS. The results of these analyses are
summarized in Table 3.2. The percent activity reported in Table 3.2 was calculated based
on the molar ratio of 3H-estradiol to receptor in the fully saturated case; in this respect
100% activity represents the case where every receptor present is occupied by a ligand
molecule. It should be noted that even under optimal conditions only about 80% of the
receptor is available for binding. Our results show slightly lower activity ranging from 68

65
to 62% which might be a result of exposure to temperature variations during transport as
well as freeze-quench cycles.
Table 3.2: Summary of the ERα-LBD mutants produced and characterization by TOF-MS and [3H]estradiol binding. Mutant name
Construct Label position Observed mass (Target mass)
Binding affinity (% activity)
ER-543 C381S,C417S, C530S,M543C
543 30748.9 Da (30748 Da)
1.2 nM (68 %)
ER-530 C381S,C417S 530 30792.2 Da (30792 Da)
0.85 nM (62%)
(f) Incubation of labeled receptor with ligand/coactivators: The labeled receptor was incubated under saturating condition for both the ligand and the
coregulator peptide studies. A 2 mM stock solution of the steroid ligands in 1:1
water:DMF solvent was prepared by dissolving the appropriate amount of ligand in 100%
DMF to which water was added. Coregulator stock solutions were prepared by
reconstituting the lyophilized peptides to a final concentration of 1 mM in 20 mM Tris,
pH 8.1. For each mutant, all the measurements reported here are derived from the same
stock of protein. This ensures that the amount of inactive or unlabeled protein is the same
in each experiment, making the changes observed dependent to ligand-receptor
interactions only.
(g) CW-EPR spectroscopy CW-EPR measurements were conducted on a Bruker EMX instrument equipped with
high-sensitivity cylindrical cavity. All spectra were acquired at room temperature at a

66
microwave frequency of 9.37 GHz, 0.2 mW microwave power, with 0.8 G 100 kHz field
modulation amplitude. Each spectrum reported here results from a 30 scan average.
Ligands and coregulators were allowed to bind under saturating condition (3 to 5 fold
molar excess of ligand to protein) for a minimum of 30 min at 4 oC before EPR
measurement.
(h) DEER Spectroscopy For DEER experiments, a 30% glycerol buffer was used for both spin-labeled ER-543
and ER-530 mutants. This buffer ensures glass formation, which provides homogeneous
protein distribution and prevents phase separation induced by micro-crystallization of
water during freezing. Samples (100 μL) in 4 mm O.D. 3.2 mm I.D. quartz capillaries
were fast frozen by dipping into liquid nitrogen immediately before inserting into the
precooled resonator. Pulsed EPR spectra were recorded on a Bruker Elexys 680
spectrometer equipped with a Bruker dielectric ring resonator (model MD-5). In the 4-
pulse DEER experiment 61,62, the frequency of the pump pulse was adjusted to the
resonator dip and the static field was set to the low-field resonance of the nitroxide signal.
To minimize the orientation selection and maximize the fraction of coupled spins (and
thus signal-to-noise), the observed pulse was applied at 65 MHz upfield from the pump
frequency. This arrangement observes the spins at the low field resonance while pumping
the spins at the center of the spectrum. Typical π/2 pulse lengths were 16 ns, and the echo
was integrated using an integration window equal to the echo width. Data were analyzed
using home-written MATLAB software, which assumes a sum of Gaussian-distributed
conformers contributing to the observed echo modulation.

67
The program employs the Monte Carlo/SIMPLEX algorithm to find the distance
distribution resulting in the dipolar evolution function that best describes the
experimental data 63. Selection of the number of Gaussian populations used to describe
the experimental data is based on a statistical F test. The software is available at
http://fajerpc.magnet.fsu.edu.
3.3 Results
(a) Selection of labeling sites The two ERα-LBD mutants constructed have been designed to allow site directed
spin labeling at positions expected to undergo ligand induced changes as predicted by X-
ray structures. Because dynamics of H12 are particularly important to explain
ligand/receptor/coregulator interaction, this domain was labeled directly by placing the
IMSL label at position 543. From the crystal structures available, this position may be
expected to undergo substantial dynamic changes that reflect a transition from the
motionally constrained local environment of the agonist conformation to less constrained
environment in the antagonist state. A [3H]estradiol binding assay shows retention of
high binding affinity for spin labeled ER-543 (1.2 nM compared to 0.11 nM for wild
type) indicating that labeling of position 543 does not severely affect receptor-ligand
interaction.
The hinge region between H11 and H12 at position 530 has been previously
studied using fluorescence labeling and, in one case, spin labeling.64 These studies
demonstrate that position 530 is a good reporter of both ligand binding and dimer
stability. ERα-LBD was therefore spin-labeled at position 530. The label at this position

68
was studied using CW-EPR to investigate local dynamic changes in response to ligand
binding and allosteric coregulator interaction, and DEER spectroscopy to measure the
structural response of the dimer conformation to ligand and coregulator interaction. A
[3H]estradiol binding assay for spin labeled ER-530 confirms retention of high binding
affinity to estradiol with a Kd of 0.9 nM.
(b) Ligand induced dynamic changes of H12 Site directed spin labeling of H12 was carried out on the ERα-LBD mutant ER
543 (C381S/C417S/C530S/M543C) to measure the dynamic effects of ligand binding on
this region by CW-EPR. Mutations C381S, C417S and C530S were necessary to remove
the three solvent exposed cysteines naturally present in the ER-LBD sequence, in
addition we introduced mutation M543C to provide a uniquely reactive cysteine on H12.
Based on available mutational and crystal data, position 543 is expected to tolerate
labeling with IMSL while retaining all the necessary interactions with the ligand; on the
other hand, the IMSL sidechain at this position may interfere substantially with
coregulator recruitment on the AF2 surface. For this reason, the ER-543 mutant was used
only to study ligand binding interactions.
ER-543 proved to be a sensitive reporter of H12 dynamics in response to ligand
activity. The EPR spectra obtained from this mutant, summarized in Figure 3.3, show a
trend of higher mobility with increasing antiestrogen character of the ligand. The agonist
ligands Estradiol and E11β-2 produce very similar spectra that show lineshape features
characteristic of strong immobilization. This is consistent with crystal structures of ER in
the agonist state, in which the label experiences substantial interaction with nearby

69
sidechains. Strikingly, the Apo-ER exhibits similar immobilization, suggesting that the
unliganded receptor exists in a rather tightly folded state.
Figure 3.3: EPR spectra summarizing the effect of ligands on dynamics of ER-543. From the top: Apo, Estradiol, E11β -2, E11β -5, RU 39,411, RU 58,668, ICI 182,780.
Ligands with progressive substitutions at the 11β position of estradiol show direct
effects on the mobility of H12. The five carbon alkyl chain in E11β-5 produces lineshape
changes that suggest an increase in mobility when compared to agonist ligands. This
trend continues with the antagonist ligands RU 39,411 and RU 58,668, which produce
spectra consistent with less rigid motion. Finally, the classic antagonist ICI 182,780
3470 3480 3490 3500 3510 3520 3530 3540 3550 3560
ICI 182,780
RU 58,668
RU 39,441
E11-5
E11-2
Estradiol
Apo
Magnetic Field (Gauss)
Liga
nd

70
yields similar dynamic effects to the antagonist RU 58,668 confirming that mobility of
H12 is correlated with ligand activity.
Changes in probe mobility were evaluated from characteristic lineshape features
of the spectrum. Specifically, the mobility parameter ΔH0−1 was calculated from the
inverse of the width of the central resonance line. The results from this simplified
analysis of the label dynamics are plotted versus ligand in Figure 3.4. A more
comprehensive analysis of the diffusion and order parameters using NLS lineshape fitting
program was inconclusive in producing satisfactory fits to this data. This is not surprising
when we consider that the spectra are composed of multiple components and that up to
40% of the labeled receptor might be inactive and therefore not affected by ligand
binding. Nonetheless, the changes in spectral lineshape are supported by the semi
quantitative ΔH0−1 parameters.
Figure 3.4 shows that agonist ligands such as Estradiol and E11β-2 result in a
high degree of immobilization that surprisingly is reflected in the Apo state as well. In the
case of E11β-5 and RU 39,411 the spectra show gradual changes that are consistent with
an increase in the local dynamics as reflected by ΔH0−1. Finally, the full antiestrogens RU
58,668 and ICI 182,780 provide the highest degree of ligand induced mobility.

71
Figure 3.4: Mobility parameter ΔH0
−1 derived from EPR spectra of ER-543 in the presence of the selected ligands.
(c) Dynamic and structural changes of H12 hinge region in response
to ligand-coregulator interaction
Ligand/coregulator induced dynamic changes of the hinge region of H12 provide
important insights into the structural basis of ER action. Site directed labeling at the C530
position of the hinge region can be conveniently achieved by mutating the solvent
exposed C417 and C381 residues to serine, leaving a single labeling site on the native
cysteine at position 530. Crystallographic data of agonist and antagonist conformations
shows that this hinge region is relatively unstructured but it is expected to undergo
Apo Estradiol E11-2 E11-5 RU 39,411 RU 58,668 ICI 182,7800.2
0.25
0.3
0.35
0.4
0.45
Ligand
ΔH
0-1

72
conformational and dynamic changes that reflect the action of ligand on the relative
position of H12. Previous studies report with retention of wild type like binding
characteristics when either fluorescence or spin labels are attached at position C530 of
ER-LBD. The activity of ERα labeled at position 530 by IMSL was confirmed by
measuring its binding affinity to estradiol.
Spin labeled ER-530 was allowed to bind to each ligand under saturating
conditions. Figure 3.5 summarizes the EPR spectra for the ER-530 bound to each ligand
in the series tested. The unliganded ER-530 Apo shows a higher level of local mobility
compared to ER-543 Apo. Ligand binding causes subtle changes in the EPR lineshape of
ER-530. As one follows the series of ligands from estradiol to E11β-2 and E11β-5 one
first notices lineshape changes consistent with the appearance of a less mobile
component. This effect is observable in the spectral region between 3480 and 3500 Gauss
from the presence of a broad shoulder feature. The antiestrogen character of RU 39,411
produces an increase in local mobility, while both RU 58,688 and ICI 182,780 yield
complex spectra with both slow motional and fast motional components.

73
Figure 3.5: EPR spectra summarizing the effect of ligands on dynamics of ER-530. From the top: Apo, Estradiol, E11β -2, E11β -5, RU 39,411, RU 58,668, ICI 182,780.
Coregulator/ligand binding effects on dynamics of the H12 hinge region was
investigated for four coregulator peptides in the presence of the ligands. EPR spectra
obtained from ER-530/ligand/SRC1 are summarized in Figure 3.6 and show
representative changes in the dynamic modulation of the hinge region in the presence of
ligand and peptide. Changes in the observed dynamics of ER-530 in the presence of
coregulator peptides are evidence of allosteric interaction of the ER/ligand complex with
coregulator peptides. The Apo, estradiol and E11β-2 cases show broader lineshape
features consistent with decreased mobility in the presence of coregulator peptides. As
3460 3480 3500 3520 3540 3560 3580
ICI 182,780
RU 58,668
RU 39,441
E11-5
E11-2
Estradiol
Apo
Magnetic Field (Gauss)
Liga
nd

74
one progresses though the series towards ligands with a more antiestrogen character, the
degree to which the peptide induces dynamics changes of the hinge region decreases
markedly especially when comparing spectra of ER/ligand and ER/ligand/peptide. The
spectra obtained with the antiestrogens RU 39,411, R58,668 and ICI 182,780 show that
peptide has a much smaller effect on lineshape when these antagonist ligands are present,
consistent with the notion that antagonist ligands prevent coregulator peptide recruitment.
Interestingly the SERM E11β-5 produces intermediate changes to those of estradiol and
the antiestrogens. This validates the model of partial agonist for this class of compounds
and provides evidence for an allosteric effect on the receptor’s dynamics. In fact, current
evidence suggests that SERM ligands induce selective binding of coregulators, thus
causing different biological effects in tissues with different coregulator profiles.
Figure 3.7 shows ΔH0−1 mobility parameter computed for both ER/ligand and
ER/ligand/SRC1. The results suggest a decrease in mobility upon addition of peptides
that correlates with the already mentioned lineshape changes. In the presence of the
antiestrogenic ligand RU 39,411, coregulator peptides produce no change in ΔH0−1 and
no difference in lineshape suggesting that peptide binding is inhibited.

75
Figure 3.6: EPR spectra summarizing the effect of ligands + peptide (SRC1) on dynamics of ER-530. From the top: Apo, Estradiol, E11β -2, E11β -5, RU 39,411, RU 58,668, ICI 182,780.
3440 3460 3480 3500 3520 3540 3560 3580 3600
ICI 182,780 + SRC1
RU 58,668 + SRC1
RU 39,411 + SRC1
E11-5 + SRC1
E11-2 + SRC1
Estradiol + SRC1
Apo + SRC1
Magnetic Field (Gauss)
Liga
nd

76
Figure 3.7: Mobility parameter ΔH0−1 derived from EPR spectra of ER-543 in the
presence of the selected ligands (○) and ligands plus SCR-1 peptide (▼).
EPR spectra can be directly correlated to ligand activity by comparing the
cumulative relative squared difference (RSD) between the normalized spectra of
ER/ligand and ER/ ligand/peptide for each of the four coactivator peptides studied. This
approach is justified by the fact that the spectral changes observed in the presence of
peptide give rise to similar lineshape effects that can be compared relative to each other
65. We interpret RSD values as a measure of peptide induced change of dynamics where
Apo Estradiol E11-2 E11-5 RU 39,441 RU 58,668 ICI 182,7800.3
0.35
0.4
ΔH
0-1
Ligand

77
higher RSD values correspond to larger changes and low RSD values correspond to small
changes.
Figure 3.8 shows the RSD values computed for the four peptides studied as a
function of the ligand present. The agonist ligands estradiol and E11β -2 consistently
show higher RSD values compared to the antagonist ligands RU 39,411, RU 58,688 and
ICI 182,780 or the unliganded Apo state. In the case of the SERM E11β-5 the RSD
values are intermediate to those from estrogenic and antiestrogenic compounds and
appear to be quite sensitive to the identity of the coregulator peptide. This observation
supports a model in which SERMs act to differentially disrupt coregulator binding.
Figure 3.8: RSD values computed between spectra of ER-530/ligand and ER-530/ligand/peptide. RSD values are calculated from Σ√(Ia-Ib)2, where Ia and Ib are the spectral intensities of the normalized and aligned spectra at every point.
0
0.1
0.2
0.3
0.4
0.5
0.6
Apo Estradiol E11-2 E11-5 RU 39,411 RU 58,668 ICI 182,780
RIP-140 TIF-2SRC-1 D22
Ligand
RS
D

78
DEER spectroscopy was performed to investigate whether the dynamic changes
noted above arise from structural differences brought about by ligand/coregulator
interaction. ER-530 was examined in the Apo state, bound to Estradiol, and in the
presence of both Estradiol and D22 peptide. In the case of singly labeled ER, DEER
spectroscopy will reflect interspin distances between position 530 on each of the two
halves of the ER dimer. Figure 3.9 summarizes the DEER spectra and the analysis 62. We
find that the combination of Estradiol and coregulator binding has a marked effect on the
structure of the dimer by producing changes in both the distance and the distance
distribution between the halves of the dimer in comparison with the Apo state. More
precisely, the mean distance changes from 30 Å in the Apo and 27 Å in the Estradiol
bound state to 22 Å in the presence of estradiol/D22, while the distance distribution
measured as the half height width of the Gaussian distribution goes from 15 Å to 4.5 Å.
The distance measurements are consistent with both the crystal structures as well as
FRET measurements that show a pronounced stabilization of the dimer structure upon
ligand and peptide binding. These results provide, for the first time, quantitative
measurements of the solution structure of ER dimers and suggest that dynamic changes
described arise from conformational re-modeling of the receptor brought about by ligand
and coregulator interaction.

79
DEER Spectrum Distance Distribution Error Analysis
0.5 1 1.50
0.2
0.4
0.6
0.8
1
t (µs)
Nor
m. I
nten
sity
0 2 4 6 8
r (nm)2 4 6 8
0
1
2
3
4
5
r (nm)
wid
th (n
m)
0.5 1 1.5
0
0.2
0.4
0.6
0.8
1
t (µs)
Nor
m. I
nten
sity
0 2 4 6 8r (nm)
2 4 6 80
1
2
3
4
5
r (nm)
wid
th (n
m)
0.5 1 1.5
0
0.2
0.4
0.6
0.8
1
t (µs)
Nor
m. I
nten
sity
0 2 4 6 8r (nm)
2 4 6 80
1
2
3
4
5
r (nm)
wid
th (n
m)
Figure 3.9: DEER spectra and analysis of ER-530 Apo (top), ER-530/estradiol (middle) and in the ER-530/estradiol/D22 (bottom).
3.4 Discussion Site-directed spin labeling has been applied in this study to measure local
dynamic and structural changes that accompany ligand binding and coregulator peptide
interaction with ER-α LBD. Additionally, we describe an EPR based method to measure
changes in the local dynamic of H12 hinge region that are specific to ligand/coregulator

80
binding. The ligands series selected for this work is designed to systematically test the
effect of substitutions on the estradiol scaffold on H12 dynamics.
Recent work by Dai et al. using Hydrogen Deuterium exchange Mass
Spectrometry (HDX-MS) to measure ligand induced dynamic changes in ER-LBD has
shown that receptor dynamics is an accurate indicator of ligand character 66. Interestingly,
the study reported no change in the dynamics of H12 as a function of binding of ligands
with different biological activities, in contrast to the results reported here, where dynamic
effects of ligand binding on H12 are clearly evident. A consideration of how dynamics is
measured in HDX versus EPR can reconcile these two observations. HDX relies on
differences in the rate of Hydrogen-Deuterium (H-D) exchange in different
conformations of the receptor, which is mainly affected by solvent exposure. Increased
dynamics will likely lead to increased solvent exposure; however, a surface helix such as
H12 is already substantially exposed to the solvent, and it is unclear whether changes in
the backbone flexibility at such a location are observable by this technique. In contrast,
EPR spectra are sensitive to both local environment and backbone flexibility on the ns
timescale. Combining these two observations, the picture that emerges of H12 is that of a
domain with high level of solvent exposure, demonstrated by the fast rate of H-D
exchange, and with a ligand dependent behavior consistent with progressive
destabilization of the backbone structure upon binding of agonist, SERM or antagonist
ligands.
EPR spectra of ER-543 proved to be very sensitive reporters of H12 dynamics,
and point to a significant destabilization of the helix structure in the antagonist

81
conformation. Since spin probe dynamics is affected to a great extent by the local
secondary structure, the dynamic changes observed may be interpreted as reflecting the
combined effects of backbone fluctuation as well as domain motions. IMSL is a
particularly sensitive probe of backbone dynamics due to its shortened tether to the alpha
carbon. The changes observed in ER-543 suggest that the secondary structure of H12 is
directly affected by ligand interaction, so that binding of antiestrogen ligands with long
hydrocarbon chains have a disrupting effect on the helical conformation of H12. The EPR
lineshape is reflective of both local environment and internal rotameric state of the
nitroxide probe. The changes we observe in ER-543, going from an immobilized state to
a more dynamics state, may arise from a change in the local environment where the label
experiences a less stericly hindered motion with antagonist ligands. Alternatively, the
change may be explained by disruption of the secondary helical structure that affects the
interact dynamics of the label through increasing flexibility of the alpha-carbon. The
results further demonstrate that this effect can be controlled by incrementing the length of
hydrocarbon substitutions at the 11β position of estradiol. In essence, the ERα-LBD spin
labeled at position 543 acts as a molecular probe of ligand-receptor interactions that
differentiates agonist, antagonist and SERM ligands based on their effect on H12.
Ligand binding is not the only determinant of ER action, binding of tissue specific
coregulator proteins to AF2 is just as essential to the downstream biological effects of ER
is. Recently, it has become apparent that ligand binding alone is not sufficient to
“commit” H12 to an agonist conformation but allosteric coregulator interaction plays an
important role. We used ER-530 to probe the effects of ligand and coregulator binding on

82
dynamics of the hinge region and on the structure of the ER homodimer. Position 530 has
been extensively targeted for site directed labeling using mainly fluorescent probes but
also spin probes 53,64,67. These studies have been among the first to demonstrate ligand
dependent effects of ligands on ER dynamics. In the context of labeling of position 530,
our investigation is designed to extend the current model by providing measurements of
both ligand and coregulator induced dynamics as well as distance measurements on the
ER dimer.
The hinge region is indirectly affected by ligand binding, but still produced
characteristic changes observable by EPR. A clear stabilizing effect is observed when
both agonist ligands and coregulator peptides are present. We correlated peptide induced
changes with ligand activity and found a trend of motional stabilization for agonist
ligands and lower stabilization of antagonist ligands. Interestingly, the SERM E11β-5
falls between agonist and antagonist and shows peptide specific effects. This observation
allows us to formulate a definition for SERMs that is based on precise effects on the
structure of ER-LBD that results in discrimination in binding among different coactivator
peptides.
The results establish that the stability of the ER-LBD dimer is affected by ligand
binding. DEER measurements of ER530 in the presence of estradiol and coregulator
peptide provide structural evidence to support the dynamic changes observed. Although
we observe a slight enhancement in the stabilization of ER-LBD dimer by agonist
ligands, the most dramatic effect occurs upon allosteric binding of coactivator peptides,
which produces a more compact and ordered dimer structure. This is the first application

83
of DEER spectroscopy to ER-α and as such it may provide insight into the dynamics of
other structurally analogous NRs. In light of these results, ER-α response can be
considered in terms of an order-disorder transition, in which successive ordering
interactions define the biological effect of the receptor.
Although little structural information is available about the unliganded state of
ER-α, the spin-labeling results for Apo-ER contrast with conclusions from structural
studies of other unliganded NRs. The crystal structure of the unliganded nuclear receptor
peroxisome proliferator-activated receptor γ (PPAR-γ) and NMR data on PPARα in both
the Apo form and in complex with ligand shows an overall stabilization of the LBD upon
agonist binding, 68,69. Other studies on similar nuclear receptors, such as the Retinoid X
Receptor (RXR), generally point to an Apo conformation with a substantial degree of
flexibility that undergoes a transition to a more compact structure following ligand
binding 70 . In this study, we observed only minor changes in local dynamics due to
ligand binding at positions 543 and 530. The Apo spectra on both cases closely resemble
the spectra obtained when agonist ligands are present, displaying a constrained
environment at position 543 and more flexible dynamics at position 530. This
observation is also confirmed by the DEER results, where only small differences appear
between Apo and estradiol bound receptor dimer. Despite the similar dynamics, the
agonist bound state yields a more pronounced coregulator induced effect (Figure 3.8)
compared with the Apo state. When these observations are taken together they suggest a
system where the agonist ligand acts to narrow the conformational space of the Apo state
to optimize coregulator binding. As such, the action of the ligand is not only to stabilize

84
the local structure, but more importantly to “prepare” the receptor for coregulator
interaction by favoring the most effective conformation.
3.5 Conclusions The results presented here demonstrate that (i) binding of ligands to ERα-LBD
induce dynamic changes in H12 and in H12 hinge region that directly correlate with the
ligand’s biological activity and (ii) ligand dependent allosteric binding of coregulator
peptides induces dynamic and structural remodeling effects on ERα-LBD. We have used
SDSL and EPR to extend the current model of ERα-LBD action providing dynamic
information on H12 region and quantitative structural information on the dimer
conformation.
In addition to providing new dynamic and structural information about ligand-
receptor interaction, we believe that SDSL applied to ER-LBD can be used as a predictor
of ligand activity and coregulator interaction. Our results show that it is possible to
discriminate agonist, antagonist and SERM ligands with a simple comparative analysis
which are based on the physical response of the receptor to ligand binding. Indeed, a
major finding of this study is that SERMs differentially affect coregulator binding, in a
manner that apparently depends upon the specific recognition sequence of the
coregulator.
Other biologically important members of the NR superfamily such as ERβ, the
Thyroid Receptor and the Androgen Receptor share similar structure and mode of action
with ERα suggesting that the mechanisms here described are likely to represent a
significantly wider group of NRs. Although we have measured ligand induced dynamics

85
of H12, questions still remain about the nature of the structural changes taking place. To
what extent increase in dynamics reflects movement of H12 as a “rigid body” versus
unraveling of the helical domain? What is the effect of non-steroidal ligands? These
questions are relevant to a basic understanding of ligands-receptor interaction and as such
can have importance for the design of therapeutic ligands.
In the final Chapter of this thesis we will explore some ongoing work aimed at
addressing these important questions. In particular we present a new model of
ligand/coregulator induced NR remodeling and discuss the use of double labeled ER to
map more accurately the position and dynamics of H12 with respect to the receptor’s
body.

86
Chapter 4: Characterization of Spin labeled Estradiol

87
4.1 Introduction The steroid estradiol (E2) is responsible for critical physiological functions such as
growth, development and maintenance of many different tissue types (1,2). These effects
are carried out via ligand-activated nuclear receptors known as estrogen receptors (ER),
which function as targeted regulators of gene expression (3).
In addition to carrying out vital homeostasis functions, ER-α is known to
participate in the development and proliferation of estrogen responsive breast cancer as
well as other disease states such as osteoporosis, obesity, and infertility 33,71-74. The
clinical relevance of ER has caused intense interest in the synthesis of small molecules
that can antagonize E2 binding. Many high affinity estrogen derivatives have been
synthesized that can induce agonist, antagonist and partial-antagonist biological
responses. Steroidal derivatives have also been synthesized to provide ER selective
imaging agents for diagnostic purposes. Some of the modifications to the basic estradiol
scaffold include addition of radioactive labels,75,76 IR-active groups,75 organometallic
complexes77 and various fluorophores78,79. Recently the synthesis of a new class of spin
labeled estradiol derivatives was reported where stable radicals in the form of nitroxide
moieties were introduced at the 17β and 16 position on the estradiol scaffold.80 No ER
binding data has been published on these compounds so far, however they are expected to
produce ER selective probes with unique properties such as EPR activity, fluorescence
quenching, sensitivity to local oxidative stress, and enhanced magnetic relaxation of local
environments.
In this chapter we report the EPR, photophysical, and receptor binding
characterization of two previously described nitroxide functionalized estradiol

88
derivatives: HO-2105 and HO-2447 [1-Pyrrolidinyloxy, 2-[(17α)-3,17-dihydroxy-19-
norpregna-1,3,5(10)-trien-20-yn-21-yl]-2,5,5-trimethyl- (9CI)] (Figure 4.1) 80. Binding of
the spin labeled estradiols (SLE) to ERα-LBD was characterized by EPR and intrinsic
tryptophan fluorescence quenching (ITQ). We also investigated photophysical effects of
the nitroxide on E2’s intrinsic fluorescence. DEER spectroscopy was used to measure
interspin distances of bound probes in the ERα-LBD dimer complex providing solution
structure measurements of the homodimer complex. The results presented here offer a
first look at biophysical applications of this unique class of functionalized estradiol.
Figure 4.1: Structures of spin labeled estradiols
4.2 Methods
(a) Protein preparation: ERα ligand-binding domain (hERα-LBD, a.a. 302-552) was expressed in a pET15b
vector (23). Expression and purification procedures are described in Section 2.3.
Briefly, His tagged ER was purified from the cell lysate with Ni-NTA affinity
column by a flow through method using standard elution in 300 mM imidazole. Fractions
containing the protein were then assayed by SDS-PAGE electrophoresis, and pooled. A
ten fold dilution of the pooled fraction with 50mM Tris, 10% glycerol at pH 8.1 was
OO H
OH
N
O
OH
OHN HO-2105 HO-2447

89
necessary for loading onto a pre-equilibrated cation exchange column. After extensive
washing with equilibrate buffer to remove excess imidazole, the elution was carried out
with 50mM Tris, 10% glycerol at pH 8.1 buffer containing 200 mM KCl. Samples
prepared by this method were found to be >90% pure when assayed by LC-MS.
(b) CW-EPR measurements: Continuous wave EPR spectra were obtained using a Bruker EMX spectrometer equipped
with a high sensitivity cylindrical cavity with the following spectral acquisition
parameters: 9.8 GHz frequency, 0.5 Gauss modulation field, 100 kHz modulation
frequency and 20dB attenuation (0.2 mW power). The spectra shown here are averages of
no less than 10 scans.
(c) Fluorescence quenching assay: The assay was carried out in a 50 nM solution of the purified ERα-LBD stock.
Tryptophan fluorescence emission was monitored between 300 nm and 500 nm, while the
excitation wavelength was held at 280 nm. Aliquots of the ligand stock were added to the
protein solution to produce a 1 nM increase in concentration of ligand with every
addition. The sample was mixed by pipetting and allowed to incubate at room
temperature for at least 5 minutes before measuring the fluorescence.
(d) EPR assay Stock solutions of 5 mM HO-2105 and HO-2447 were prepared by dissolving appropriate
amounts of the purified powder in dimethylformamide. Stock solutions of 300 µM ERα-
LBD were purified as described and the concentration was estimated by Bradford assay.
If necessary, protein concentration was performed with Amicon diafiltration cells using a

90
10 kDa molecular weight cut-off membrane to obtain concentrations of about 300 µM
ERα-LBD as estimated by Bradford assay. 1:2 serial dilutions of ERα-LBD stock to a
final volume of 50 µl were performed in 50mM Tris, 10% Glycerol, 150 mM KCl at pH
8.1. Reaction mixtures were spiked with 1 µl of ligand stock to give a final concentration
of 100 µM ligand. Ligand concentration in the reaction mixture was confirmed by spin
counting against a TEMPO standard curve. Reaction mixtures were incubated for a
minimum of 30 min at 4o C and allowed to equilibrate to room temperature prior to EPR
measurements. All measurements were carried on the same protein stocks in order to
account for presence of inactive protein equally.
(e) DEER measurements: Low temperature (65K) DEER spectra were recorded on a Bruker Elexsys 680 with a
Bruker dielectric ring resonator (Bruker, ER 4118X-MD5). 30 wt% of sucrose (final
concentration) was added to the sample to avoid water crystallization and ensure a
homogenous protein distribution. Samples were then transferred into a 4 mm OD/3.2 ID
quartz capillary and snap frozen in liquid nitrogen prior to insertion into the precooled
resonator. The dielectric resonator was overcoupled (low Q factor) to obtain a broad
resonator resonance line and to minimize the interference between the ringing from the
pulses and the signal. DEER was measured using a 4-pulse sequence to provide for the
accurate determination of distance distribution in the range of 2.0-7.0 nm, as described
previously62. The frequency of the pump pulse was adjusted to the resonator dip, and the
observer pulses were applied at 73 MHz lower than the pump frequency. Observing the
spins at the low field resonance while pumping the spins at the center of the spectrum

91
minimizes the orientation selection and maximizes the fraction of coupled spins. Typical
π/2 pulse lengths were 16 ns and π ELDOR pulse length was 32 ns. The echo was
integrated using a window equal to the echo width. Data were analyzed using home-
written MATLAB software, which assumes a sum of 1-4 gaussian-distributed distance
populations contributing to the observed echo modulation. The program employs the
Monte Carlo/SIMPLEX algorithm to find the distance distribution resulting in the dipolar
evolution function that best describes the experimental data. Selection of the number of
Gaussian populations used to describe the experimental data is based on a statistical F
test. The software is available at http://fajerpc.magnet.fsu.edu.
4.3 Results
(a) EPR characterization EPR spectra of nitroxides are sensitive to rotational diffusion rates of the order of
ns. Aqueous solutions of the SLE exhibit a three line spectrum characteristic of fast
tumbling rotation on the ps timescale that averages the anisotropic contributions of the
magnetic g value and hyperfine coupling. Figure 4.2 summarizes the spectra of HO-2105
and HO-2447 in the absence and in the presence of purified ERα-LBD. The lineshape
changes are consistent with going from a freely tumbling state to an immobilized state in
the presence of receptor, demonstrating that both ligands bind to ERα-LBD.

92
Figure 4.2: EPR spectra of HO-2105 (top), HO-2105 in the presence of molar excess of ERα-LBD (bottom), (i). HO-2447 (top) and HO-2447 in the presence of molar excess of ERα-LBD (bottom), (ii). Spectra are an average of 10 scans in 50 mM Tris, 150 mM KCl, 10% glycerol, pH 8.1 at 298K.
We used non-linear least squares lineshape analysis to fit motional parameters to
spectra of spin labeled estradiol bound to ERα-LBD. The resulting fits are shown in
Figure 4.3 and the motional parameters are summarized in Table 4.1. The microscopic
order macroscopic disorder model (MOMD) was used to correlate local dynamics
experienced by the probes with overall tumbling of the receptor ligand complex 22,23.
Although the two ligands are similar, lineshape features suggest differences in their local
motions. HO-2447 in the bound state displays a faster rotational diffusion rate as well as
more isotropic motion (N = 0.98) compared to HO-2105. These differences reflect details
about the local environment of the nitroxide. In HO-2447 the nitroxide is tethered to the
17α position by a propargyl tether while in HO-2105 a more rigid double bond forms a
direct connection between the five-membered nitroxide ring and the estradiol scaffold.
The differences in local mobility can be explained in terms of both local environment and
intrinsic mobility.
3420 3440 3460 3480 3500 3520 3540 3560 3580 3440 3460 3480 3500 3520 3540 3560 3580 3600
(i) (ii)

93
Figure 4.3: EPR spectrum of ERα-LBD bound HO-2105 (gray) and calculated lineshape fit (dashed line), (i). EPR spectrum of ERα-LBD bound HO-2447(gray) and calculated lineshape fit (dashed line), (ii).
Table 4.1. Magnetic and motional Parameter derived from the EPR lineshape fits. Ligand gx gy gz Ax Ay Az R║ N c20 c22 Dα Dβ HO-2105 2.010 2.004 2.002 4.3 5.0 35.8 7.67 0.42 0.82 1.53 22.0 117.9HO-2447 2.008 2.006 2.002 5.0 5.5 35.7 7.85 0.98 1.57 1.06 8.9 142.9
(b) EPR based binding assay In the previous section we have demonstrated that EPR spectroscopy can easily
discriminate between bound and unbound states of the estradiol derivatives HO-2105 and
HO-2447. Here we describe a simple method to evaluate binding affinity
spectroscopically. Figure 4.4 shows EPR spectra resulting from titration of ERα-LBD in
individual solutions containing HO-2105 and HO-2447. By keeping the amount of spin
probe constant and varying the concentration of receptor, we account for exchange
effects that arise at high spin concentrations and alter the lineshape features. The bound
and unbound components can be estimated by two sites NLS fitting 22,23 or, more directly
by measuring the peak to peak intensity (I+1) of the sharp component of the spectrum as a
3260 3280 3300 3320 3340 3360 3380 3400 3420 3440-6 -4 -2 0 2 4 6 x 10 4
3420
3440 3460 3480 3500 3520 3540 3560 3580-3
-2
-1
0
1
2
3x 10 5
(i) (ii)

94
function of receptor concentration. Figure 4.5 was constructed by plotting the difference
in intensity between I+1 in the absence and presence of receptor (I+1,0− I+1,[ER] ) versus
receptor concentration ([ER]). Binding affinities (Kd) for the two compounds were
obtained by fitting the following two state saturation binding curve to the data:
][][max,1
],[1 ERKERI
Id
ER +×
= ++ Eq. 4.1
Using this method we measured binding affinities of Kd = 5.9 μM for HO-2105, and 16.7
μM for HO-2447.
Figure 4.4: (i) EPR spectra of HO-2105 titrated with ERα-LBD. (ii) EPR spectra of HO-2447 titrated with ERα-LBD. The concentration of ligand is held constant at 100 μM, while the concentration of ERα-LBD is decreased from top to bottom.
3420 3440 3460 3480 3500 3520 3540 3560 3580
3420 3440 3460 3480 3500 3520 3540 3560 3580
(i) (ii)

95
Figure 4.5: EPR-derived saturation binding curves for HO-2105 (diamonds) and HO-2447 (squares). Solid lines represent the best fit using a two state saturation binding model.
(c) Electronic absorption and emission properties Nitroxides are known quenchers of excited-states and have been shown to reduce
fluorescence through both inter- and intra-molecular processes 81,82. Figure 4.6 shows the
UV absorbance spectra and fluorescence emission spectra of 2 μM aqueous solutions of
E2, HO-2105 and HO-2447. The UV spectra of E2 and HO2447 both display a
characteristic absorption at 280 nm due to the phenol group that constitutes the A ring of
the steroid. The UV spectrum of HO-2105 is dominated by the diene peak at 248 nm, but
a shoulder at 280 nm is also present, confirming the presence of both diene and phenol
groups. Fluorescence spectroscopy with excitation wavelength at 280 nm shows a clear
ER-LBD concentration (μM)
0
0.00
0.0
0.01
0.0
0.02
0.0
0 5 10 15
Inte
nsity
of b
ound
com
pone
nt (a
u)

96
quenching effect of the intrinsic E2 fluorescence for the nitroxide derivatized estradiols.
We can estimate the quantum yield of HO-2105 and HO-2447 from the reported
fluorescence quantum yield from E2 of 0.11 83. The results are summarized in Table 4.2.
Figure 4.6: UV absorption spectra of E2 (solid line), HO-2105 (dash-dot line) and HO-2447 (dashed line). Right: Fluorescence emission spectra of E2 (solid line), HO-2105 (dash-dot line) and HO-2447 (dashed line).
Table 4.2: Optical parameters derived from UV and fluorescence measurements
(d) Fluorescence quenching binding assay ERα-LBD exhibits intrinsic fluorescence due to the presence of three tryptophan residues
buried within its hydrophobic core.69,84 Based on our modeling studies of the SLE docked
Ligand A280 Emax,311nm (normalized intensity)
ФF
E2 0.019 97.68 (1) 0.11 HO-2105 0.022 23.5 (0.24) 0.028 HO-2447 0.020 28.7 (0.29) 0.031
220 240 260 280 300 320 340 360 380
00.
050.
10.
150.
2
300 320 340 360 380 400 420 440 460 480 500
1020
30
4050
6070
8090
(i) (ii)

97
to available crystal structures we expect that the nitroxide moiety will be positioned well
within a 30 Å radius of the buried tryptophans, and therefore will be able to quench their
fluorescence.85 This effect can be exploited to monitor binding of the SLE. Figure 4.7
summarizes the concentration dependent quenching effect of ligand binding on the intrinsic
fluorescence of ERα-LBD, and the quenching at 340 nm is plotted vs. ligand concentration
in Figure 4.8. This curve may be fitted as previously described to provide an alternative
measure of the binding constant. Using this procedure we derived binding affinities of Kd =
7.5 μM for HO-2105 and 17.7 μM for HO-2447, in good agreement with the EPR derived
affinities. We used TEMPO to investigate non-specific quenching due to random
encounters between free spin label and excited states of the ERα-LBD. Figure 8 also shows
the non-specific quenching action of TEMPO, which exhibits significantly weaker
quenching of ERα-LBD. This observation, and the fact that the quenching effect is linear
with concentration, suggests that TEMPO does not access the protein’s interior to the same
extent as the SLEs. This result verifies that HO-2105 and HO-2447 associate with the
known estradiol binding pocket, which brings the nitroxide sufficiently close to the buried
tryptophans to efficiently quench their fluorescence.

98
Figure 4.7: Emission fluorescence of ERα-LBD as a function of HO-2105 (left) and HO-2447 (right) concentration in 50 mM Tris, 150 mM KCl, 10% glycerol, pH 8.1 at 298K.
Figure 4.8: Fluorescence-derived saturation binding curves for HO-2105 (square), HO-2447 (diamond) and TEMPO (triangle) in 50 mM Tris, 150 mM KCl, 10% glycerol, pH 8.1 at 298K.
300 320 340 360 380 400 420 440 460 480 5000
100 200 300 400 500 600 700 800 900 1000
Wavelength
300 320 340 360 380 400 420 440 460 480 5000
100
200
300
400
500
600
700
800
900
1000
Wavelength
(i) (ii)
Increase HO-2105 Increase
HO-2447
0
10
20
30
40
50
60
70
0 1 2 3 4 5
Concentration of ligand (µM)
Que
nchi
ng e
ffect
(au)

99
(e) Distance measurement of ERα-LBD homodimer using DEER DEER spectroscopy provides accurate interspin distance measurements in systems where
the two paramagnetic centers are separated by distances between 20 to 70 Å 86. ERα-LBD
is known to form homodimers in solution; in fact, the dimer form of ERα is necessary for
proper alignment of the DNA binding domain and therefore its biological action in vivo.87
We performed DEER spectroscopy on ERα-LBD bound to the SLEs as a way to both
confirm ligand binding and provide unique information about the dimer conformation as
measured from the ligand binding pocket. The DEER spectra obtained, illustrated in Figure
4.8, provide information about both distance and distance distribution between the two
paramagnetic centers in each of the receptor/ligand dimer complex. As expected from
modeling studies, HO-2105 yields a significantly shorter distance compared to HO-2447.
This is due to difference in the relative positions of the labels as well as the lengths of their
tethers. HO-2105 produces a distance of 27.5 ± 2 Å, while HO-2447 produces a mean
separation of 35.7 ± 2 Å. The uncertainty for these measurements is calculated using a
Monte-Carlo approach described in Sen et al. and the results are plotted in Figure 4.9.88
Interestingly, we observe broad distance distributions that reflect mobility of the label
within the binding pocket as well as the distribution of distances between the halves of the
ERα-LBD dimer.
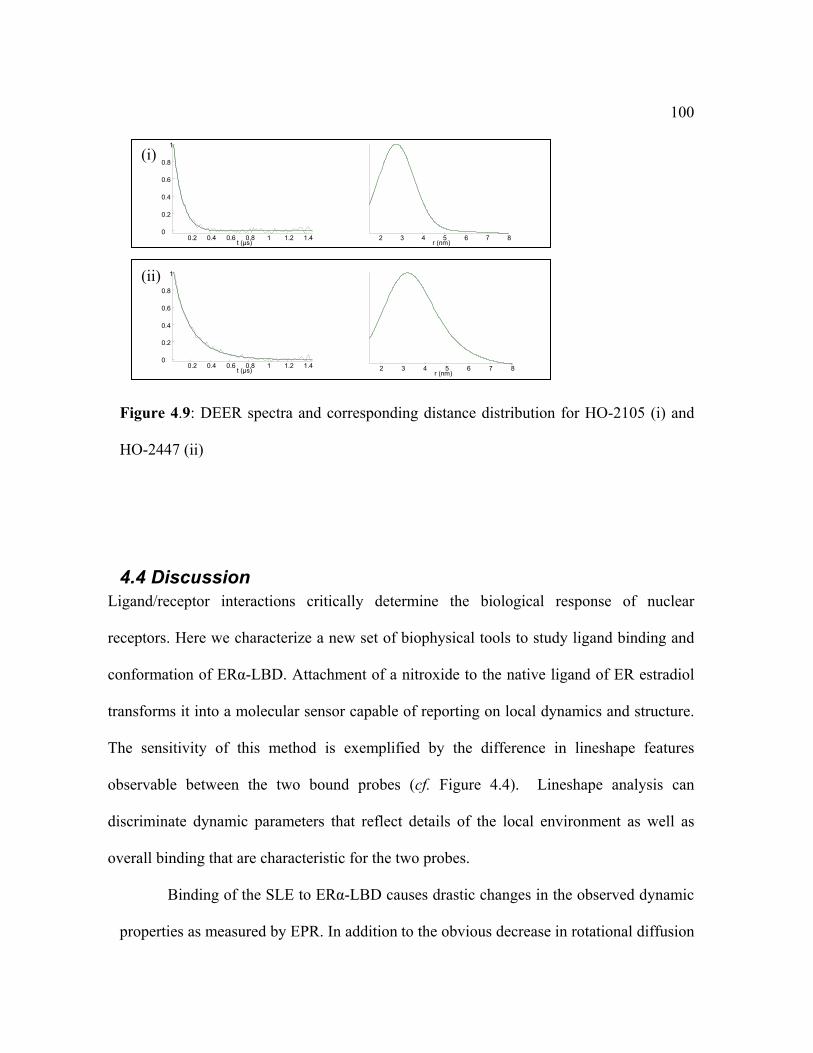
100
Figure 4.9: DEER spectra and corresponding distance distribution for HO-2105 (i) and
HO-2447 (ii)
4.4 Discussion Ligand/receptor interactions critically determine the biological response of nuclear
receptors. Here we characterize a new set of biophysical tools to study ligand binding and
conformation of ERα-LBD. Attachment of a nitroxide to the native ligand of ER estradiol
transforms it into a molecular sensor capable of reporting on local dynamics and structure.
The sensitivity of this method is exemplified by the difference in lineshape features
observable between the two bound probes (cf. Figure 4.4). Lineshape analysis can
discriminate dynamic parameters that reflect details of the local environment as well as
overall binding that are characteristic for the two probes.
Binding of the SLE to ERα-LBD causes drastic changes in the observed dynamic
properties as measured by EPR. In addition to the obvious decrease in rotational diffusion
0.2 0.4 0.6 0.8 1 1.2 1.4 0
0.2
0.4
0.6
0.8
1
t (µs)2 3 4 5 6 7 8
r (nm)
0.2 0.4 0.6 0.8 1 1.2 1.4 0
0.2
0.4
0.6
0.8
1
t (µs) 2 3 4 5 6 7 8r (nm)
(i)
(ii)

101
expected from going from a freely tumbling small molecule to a much larger
receptor/ligand complex, EPR spectra are sensitive to local dynamics that result in
characteristic lineshape features. The sensitivity to local environment make EPR analysis
intrinsically more informative compared to the more commonly used fluorescence
depolarization method, where only relative mobility information can be extracted without
discrimination between local and global contributions to overall dynamics. A limitation
of the EPR method is its relatively low sensitivity compared to fluorescence and radio-
labeling methods, which limits its applicability as a competitive binding assay for high
affinity ligands. More fruitful application of the EPR binding assay method might be to
measure competitive binding of xenoestrogens.89 These steroid compounds have been
tied to human health concerns and usually display lower binding affinities to ER
compared to E2.
Nitroxides impart unique properties to the ligands in addition to EPR activity.
Distance dependent fluorescence quenching is a well known feature of nitroxides that has
recently been used to extract distance measurements in fluorescence/nitroxide labeled
systems 85. By monitoring the intrinsic fluorescence of buried tryptophans in ERα-LBD
as a function of ligand concentration, we have developed a convenient fluorescence
binding assay. Comparison of the quenching effect of SLE to that of TEMPO radical
confirms that the labeled ligands occupy the native estradiol binding pocket close to the
protein interior. Binding affinities derived from the EPR based assay and those derived
from the fluorescence quenching assay are in good agreement and therefore mutually
validating.

102
DEER spectroscopy was used to measure interspin distances between SLE/ERα-
LBD homodimer complexes. The results are consistent with crystal structures of ERα-
LBD bound to estradiol and provide further evidence that SLE bind in the expected
location of the binding pocket. In fact, crystal structures of ERα-LBD docked with HO-
2105 or HO-2447 show interspin distances comparable to the ones obtained
experimentally by DEER spectroscopy. The relatively wide distance distribution
observed can arise from a variety of contributions: (i) rotameric flexibility of the
nitroxide tether, (ii) motion of the SLE within the binding pocket, (iii) conformational
heterogeneity of the homodimer structure.
Some future applications of SLEs may be to study ligand/receptor interaction in
other estrogen-binding proteins such as ERβ or 17β-Hydroxylsteroid Dehydrogenase (17
β-HSD), as probes of local oxidative environment and as targeted contrast agents for
imaging and NMR studies90-92.
4.5 Conclusion The results presented here demonstrate that the two SLEs bind to ERα-LBD. The
nitroxide moiety imparts unique properties to the estradiol scaffold that enable
measurement of ligand binding by EPR and fluorescence spectroscopy. DEER
measurements on SLE bound to ERα-LBD homodimer provided direct structural
information on the ERα-LBD conformation. These findings indicate that this new class of
derivatized estradiols holds promise as biophysical tools for studying ligand/receptor
interaction. Work is currently underway in Prof. Hanson’s laboratory at Northeastern

103
University to explore nitroxide substitutions at the 11β position as a way to increase
binding affinity (see also Chapter 6, Future Directions).
The results here reported provide an exciting first look at a new class of
compounds with applications for xenoestrogen binding assays, structural biology of the
ER complex and ER selective imaging. This work also provides a rare example of the use
of spin-labeled ligands to probe the local binding site environment; furthermore, this is
the only example of DEER spectroscopy used to measure interspin ligand-ligand
separation. The fact that SLE may have significance in imaging of estrogen responsive
breast cancer cells should also be explored. There are at least two mechanisms that might
be employed in this case: direct detection of the unpaired electron through low field EPR
imaging or use of the SLE as ER selective relaxing agents in MRI.
Summary Chapter 3 describes the characterization of a new class of derivatized estradiols:
spin labeled estrogens (SLE). Here we describe two new methods to assay SLE binding
to ERα-LBD, EPR based binding assay and fluorescence quenching binding assay. We
also describe some applications of SLE as a biophysical probe using lineshape analysis
and DEER spectroscopy. The results reported here show the utility of these probes as
tools to investigate both ligand binding as well as solution structure of the receptor-ligand
complex.

104
Chapter 5: Other Projects

105
5.1 Development of an EPR spin trap assay to measure singlet
oxygen sensitization of DNA binding dye compounds
– in collaboration with Prof. Shana Kelley, University of Toronto, Canada
(a) Photodynamic therapy in cancer treatment The idea to use photosensitizers and light to treat disease has existed for many
years. The use of photosensitizers to treat skin cancer was initially attempted in 1903 by
the utilization of eosin and light.93 However, sensitizers such as eosin and acridine
orange are no longer used for photodynamic therapy due to their toxicity and
carcinogenicity. A rapid increase of interest in photodynamic therapy (PDT)commenced
following the first systematic clinical study of PDT for malignant lesions in 1977.93
In PDT, normally three elements are required to induce the desired result: a
sensitizer, light, and oxygen. First, the photosensitizer is administered via topical, oral,
intravascular, or local intratumor injection, followed by an incubation period that allows
the photosensitizer to disperse into the cells. Then the area of interest is irradiated with a
wavelength of light that the photosensitizer absorbs. Photoactivation of the dye results in
the sensitization of 1O2 which is reportedly the major species responsible for the ensuing
cytotoxicity.93 Photosensitizers are often taken up to a greater degree by malignant or
dysplastic tissues, which aids in their ability to cause selective cell death.94
The ideal phototherapeutic agent would have several characteristics. It would
strongly absorb light in the red region of the visible spectrum (600-900 nm), as those
wavelengths can more easily penetrate tissue. The photosensitizer would have highly

106
efficient photochemistry for killing tumor cells. The molecule would exhibit high
selectivity by localizing in tumor cells rather than healthy cells. And lastly, the drug
would rapidly clear the system following treatment, reducing unwanted side-effects.95
The Kelley laboratory developed and synthesized the photosensitizing agent here
discussed. A 1O2 sensitizing chromophore, thiazole orange (TO) was delivered into
human cells and shown to induce cytotoxicity. TO absorbs green light, as it has an
absorbance maximum at 500 nm.96 This makes it less than ideal as a phototherapeutic
agent. Therefore, it was desired to synthesize other cyanine dyes, in order to determine
whether they might be more effective at inducing phototherapy.
Carboxy functionalized cyanine dyes BO, TO, BO3 and TO3 were all synthesized
by Jay Carreon.97 These dyes could then be used for synthesizing dye-peptide conjugates
which could be examined for their ability to sensitize 1O2, enter and kill cells, and
damage biomolecules.
Much work has been done to determine how the conjugation of peptides to dyes
and other biomolecules determines where the cargo localizes in cells. Previous work
demonstrated that the TO-RrRK (R = L-arginine, r = D-arginine, K = L-lysine)
conjugates enter the nucleus of cells. Thus, it was determined to conjugate RrRK to BO,
TO and TO3 and compare their relative properties. The BO3-RrRK conjugate was not
made due to the complicated nature of the synthesis,97 and preliminary results indicating
that BO3 is a poor 1O2 sensitizer.

107
(b) 1O2 specific spin trapping using TEMP One can employ spin-trapping and electron paramagnetic resonance (EPR) to
examine the 1O2 sensitizing capability of different molecules.98-102 2,2,6,6-
tetramethylpiperidine (TEMP) has been shown to react selectively with 1O2 (as opposed
to superoxide radical) to form 2,2,6,6-tetramethylpiperidine oxide (TEMPO). In fact, if
TEMP is added to a common superoxide generating system of xanthine oxidase plus
acetaldehyde, no appreciable amount of spin-trapping is observed. Levels of 1O2 as low
as 10 nM are easily detectable.100,101 Current advanced in cavity design considerably
increase EPR sensitivity and should allow even lower levels of 1O2 to be observed.

108
N
NS
Me
OMe
O
TO-OMe
NNH
HN
O
O
O
NH
NH
HN NH2
HN
NH2
O
O
HN HN
NHNH H2NH2N
TO3-RrRK
NH2
N
NS
Me
NH
HN
O
O
O
NH
NH
HN NH2
HN
NH2
O
O
HN HN
NHNH H2NH2N
BO-RrRK
NH2
NS Me
N
NS
Me
NH
HN
O
O
O
NH
NH
HN NH2
HN
NH2
O
O
HN HN
NHNH H2NH2N
TO-RrRK
NH2
NOMe
O
TO3-OMe
NS Me
N
NS
Me
OMe
O
BO-OMe
Figure 5.1. Structures of cyanine dye methyl esters and cyanine dye-RrRK conjugates. Dyes were synthesized by Jay Carreon. Conjugates were made by Fmoc solid phase peptide synthesis.

109
EPR spin-trapping with TEMP was employed to determine whether the
methylated dyes, BO-OMe, TO-OMe, and TO3-OMe and the conjugates BO-RrRK, TO-
RrRK, and TO3-RrRK sensitize 1O2. All of the dyes sensitize 1O2 to some degree,
however TO, TO3, and conjugates of those dyes are much more efficient than BO or the
BO-conjugate tested. Interestingly, the amount of 1O2 trapped by TEMP with TO-RrRK
is similar if not greater than what is trapped when TO-OMe is irradiated, but the same
trend is not observed with TO3-RrRK conjugate and TO3-OMe. It could be that the
electron density of the chromophore is slightly redistributed by conjugation with the
peptide, or more likely that the peptide interacts with TEMP or 1O2.
DNA binding was found to influence the amount of 1O2 detected by TEMP spin-
trapping during the irradiation of TO-OMe, TO-RrRK, TO3-OMe and TO3-RrRK. Due
to the low levels of 1O2 detected in the photosensitization of BO-OMe and BO-RrRK in
the previous assay, those molecules were not tested. In general, as DNA was added to
the dye solution, a decrease in the amount of 1O2 spin-trapped also declines in a reverse
binding curve until leveling out is observed. This binding behavior becomes more
apparent when comparing the rose bengal (RB) spin trapping with the DNA binding
compounds. RB does not specifically bind DNA, which leads to a more linear decline in
1O2 trapping. The decline in TEMPO• observed in all cases suggests that 1O2 reacts with
the DNA more quickly than it can diffuse into solution to react with TEMP. There is also
a possibility that the triplet state of the cyanine dyes are influenced by the binding to the
DNA, as the photophysics are affected when the molecule is rigidified (Table 1). In
order to determine whether the triplet state is affected, one could look at the triplet-triplet

110
absorption spectra of the molecules with and without DNA. One could also look at the
fluorescence lifetime of the dyes in the presence and absence of DNA and oxygen using
single photon counting. If the relative kinetics differ, it could indicate that the
intersystem crossing rate is affected.
Figure 5.2. Photosensitization of 1O2 by dyes and dye conjugates. Dyes were irradiated in phosphate buffered saline pH 7.2 in D2O in the presence of TEMP and examined by EPR spectroscopy. The resulting signal intensity was quantitated and compared to a standard curve of TEMPO•. The background signal resulting from TEMPO present in the TEMP solution was subtracted.
0
0.5
1
1.5
2
2.5
0 5 10 15 20 25 30
BO-OMeTO-OMeTO3-OMeBO-RrRKTO-RrRK TO3-RrRK
[TEMPO] (1x10⁻⁶ M)
Irradiation time (min)

111
Table 5.1. Fluorescence quantum yields (Ф) for dye derivatives in buffer and DNA measured by Jay Carreon.
compound λmaxAbs
(nm)
λmaxEm
(nm)
Φrel (Buffer) Φrel (DNA)
BO-CO2Me 446 473 0.0002 0.029 ± .002c
TO-CO2Me 503 560 0.0003 0.14 ± 0.0002c TO3- 625 564 0.0012 0.024 ± 0.0003c
aMeasured in samples containing 1.5 μM dye and reported relative to a fluorescein standard. bMeasured in samples containing 1.5 µM dye and reported relative to a rose bengal standard. cMeasured in samples containing 5mM dye and 50mM CT DNA.

112
Figure 5.3. Influence of DNA binding on 1O2 sensitization as detected by spin trapping with TEMP.. To 10µM dye and 50mM TEMP increasing amounts of DNA were added. TEMP spin-trapped less 1O2 with increasing DNA concentration. The cyanine dyes show a pattern indicative of DNA binding, while rose Bengal RB does not (inset).
0
5
10
15
20
25
30
35
0 2 4 6 8 10
RB
TEMPO (1x10⁻⁶)
DNA bp/dye
-1
0
1
2
3
4
5
0 2 4 6 8 10
TO-OMeTO3-OMeTO-RrRKTO3-RrRK
[TEMPO] (1x10⁻⁶)
DNA bp/dye

113
5.2 Effect of membrane thickness on cannabinoid receptor 1
transmembrane helical conformation
– in collaboration with Dr. Elvis Tiburu and Prof. Alexandros Makriyannis, Center for
Drug Discovery (CDD), Northeastern University, Boston, MA
(a) Introduction G protein-coupled receptors (GPCRs) are cell-surface proteins characterized by
seven transmembrane helices 103-106. Cannabinoid receptors (CB1 and CB2) are GPCRs
that are activated by a variety of endogenous cannabinoid agonists (anandamide, 2-
Arachidonoylglycerol) and exogenous cannabinoids (Delta 9-tetrahydrocannabinol), and
couple to Gi/o during signal transduction.107-109 Certain key amino acid sequences in the
transmembrane helices (for example, NPXXY in TM7) define structural motifs that keep
the receptor preferentially locked in an inactive state by forming intramolecular
interactions 110-113. Agonist ligand binding activates the receptor by disrupting these
interactions, thus allowing the protein to undergo conformational transition to the active
state.110-112 The CB1 receptor is predominantly present in the central nervous system, and
is expressed in many regions of the brain including the hippocampus, cerebral cortex,
basal ganglia and cerebellum.114-116 The CB2 receptor is found in certain peripheral
tissues such as the spleen and white blood cells. There is tremendous interest in CB1
because it is among several other rhodopsin-like GPCRs that are targets for
therapeutics.117,118
Alternatively, GPCRs can also be activated through modulation of membrane
properties without any ligand interaction.110 Constitutive activation of GPCRs suggests

114
that the lipid bilayer membrane itself plays a major role in mediating mechanochemical
signal transduction, which would be expected considering the importance of lipid/protein
interactions for the function of membrane proteins.113,119,120 Chachisvilis et al
reconstituted purified GPCRs in liposomes that showed constitutive activity due to
membrane modulation in the absence of agonist ligands.113,120,121 This finding suggests
that the lipid bilayer membrane plays an active role in mediating receptor activation and
signal transduction. In this case functional domains in the transmembrane helices induce
a conformational change responsible for activation of GPCRs. Gudi et al. have also
shown that mechanical forces initiate mechanochemical signal transduction by increasing
membrane tension and altering physical properties of the cell membrane in human B2
bradykinin receptor.110,121
Utilizing synthetic peptides derived from TM7/H8 of CB1 and CB2, we have
previously demonstrated that membrane fluidity increased as a function of peptide
concentration.122 The findings also showed that the peptides increased the degree of
disordering within the bilayer differently, with CB1 influencing membrane fluidity more
than CB2 derived peptides.122 An important consideration that we explored was whether
differences in structural motif at the cytoplasmic helix 8 in both receptor peptides could
serve as potential sites for a conformational bend or twist of functional microdomains in
the peptides within the membrane, resulting in increased membrane permeability.122
These studies hypothesized that membrane fluidity was modulated by conformation
changes in TM7/H8 of CB1 and our conclusions were based on lipid headgroup
perturbation as well as changes in the acyl chain dynamics.

115
The location of certain trigger residues in close proximity in TM7/H8 supports the
notion that membrane thickness could, in addition to altering the tilt angle, also be a
driving force to modify helical conformation and structure. Here, we describe the
dynamics and conformation of the peptide fragment (TM7/H8) from the human
cannabinoid receptor 1 (hCB1) in phospholipid bilayers utilizing solid-state nuclear
magnetic resonance (NMR) and electron paramagnetic resonance (EPR) spectroscopies.
We used 2H- and 15N-labeled mechanically oriented samples of TM7/H8 to identify the
orientation within dimyristoylphosphatidylcholine (DMPC; 14:0) and 1-palmitoyl-2-
oleoyl-sn-glycero-phosphatidylcholine (POPC; 16:0, 18:1) phospholipid bilayer
environments. Solid-state NMR is an established technique used to study the orientation
of membrane proteins in lipid bilayers.123-125 Solid-state 2H NMR spectroscopy in
particular can be used to study the dynamics and orientation of side chain residues in site-
specific 2H labeled integral membrane proteins. Methyl group motions have been well
characterized by 2H NMR studies of CD3-labeled sites of Ala residues in other
transmembrane peptides.126-128 A practical advantage of using a CD3 Ala label as an
NMR probe in addition to the conventional 15N solid-state NMR spectroscopy studies is
that highly intense signals are observed due to the methyl group intrinsic mobility, and
the presence of three chemically equivalent deuterons on each side chain.129 Site specific
15N-labeled Ala studies will provide backbone dynamics and orientation whereas 2H site
specific Ala studies will reveal side chain dynamics and orientation. The chemical shifts
of singly 2H or 15N-labeled Ala TM7/H8 peptide were studied in DMPC and POPC
phospholipid bilayers mechanically oriented between thin glass plates.123,130,131

116
Site-directed spin labeling (SDSL) has emerged as a sensitive method to probe
local dynamics and conformation of proteins using EPR spectroscopy.132-135 The
nitroxide spin label used in this study is designed to covalently and selectively react with
cysteine residue forming a stable thioether bond.135-138 TM7/H8 of CB1 contains two
unique cysteine residues positioned within a complete turn of i to i+4 in TM7. We
produced singly labeled peptides to study changes in dynamics and local environment
between POPC and DMPC model membranes. Doubly labeled TM7/H8 peptide was also
used to monitor secondary structure changes via distance measurements from dipole-
dipole couplings between the two spin labels in 30% trifluoroethanol (TFE) and in the
two membrane systems. The strategy focuses on identifying structural changes of
TM7/H8 in the two model membrane (POPC and DMPC) and determining whether
structural changes are modulated by lipid bilayer environment.
(b) Experimental Procedures POPC and DMPC in chloroform solutions were purchased from Avanti Polar
Lipids (Alabaster, AL) and stored at –20 °C prior to use. 2,2,2-Trifluoroethanol (TFE),
N-[2-hydroxyethylpiperazine-N’-2-ethane] sulfonic acid (HEPES) and EDTA were
obtained from Sigma-Aldrich (Milwaukee, WI). Deuterium-depleted water was
purchased from Sigma-Aldrich (St. Louis, MO). All other chemicals were purchased
from Sigma-Aldrich (St. Louis, MO). The spin label employed in this study is [3-
(iodomethyl)-2,2,5,5-tetramethyl-2,5-dihydropyrrol-1-oxyl], and was purchased from
Toronto Research Chemicals (Toronto, ON).

117
Peptide synthesis and purification: Peptide corresponding to TM7/H8 [hCB1(T377-
E416)] was synthesized using an Applied Biosystems peptide synthesizer (ABI 433A)
equipped for FMOC chemistry at the Molecular Biology Core Facility, Genescript Inc.
The numbering system suggested by Bramblett and coworkers was employed.139 All
amino acids were single coupled, with a total of 9.5 min for the coupling and monitoring
module. The crude peptide was purified on a Dynamax Model, SD-200 high performance
liquid chromatography system, controlled by an Applied Biosystem 1000S Diode Array
Detector. The software used was Dynamax Method Manager (version 1.4.6). The purified
peptide was analyzed by MALDI-TOF using a calibration matrix of α-cyano-4-
hydroxycinnamic acid.
NMR and EPR sample preparation: Bilayers of DMPC and POPC were prepared with a
2 mol% ratio of peptide to lipid according to a slightly modified protocol, as
described.140-143 Appropriate standard solutions of either DMPC or POPC phospholipids
in chloroform were mixed with a suitable amount of peptide dissolved in TFE to give the
desired molar composition (1:100 peptide to lipid molar ratio).142,143 The solvents were
removed under a steady stream of N2 gas in a 12 x 75 mm test tube at ambient
temperature144 and the samples placed in a vacuum desiccator overnight. The 15N NMR
powder sample was then transferred and packed into a 4 mm ZrO2 rotor. The hydrated
sample was prepared by placing the rotor containing the dry sample in a sealed chamber
with saturated ammonium monophosphate (relative humidity 93%). The sample was then
incubated for 6-12 hrs at 45 °C.

118
The mechanically aligned sample was prepared by dissolving the peptides in a
minimal amount of TFE and the solution mixed with either DMPC or POPC (1:100
peptide to lipid mole ratio was used) dissolved in chloroform (20mg/mL) in a pear-
shaped flask. Nitrogen gas was passed through the resulting mixture to reduce the volume
of chloroform to a third of the original volume. The sample was spread on 25 glass plates
of 8.5 mm x 14 mm dimensions and was allowed to dry in a desiccator overnight.145
Deuterium-depleted water was added onto the lipid-peptide mixture and the glass plates
were stacked on top of each other. The stacked glass plates were then placed in a
humidified chamber of ammonium monophosphate at a relative humidity of ~ 93% at 42
°C until the sample became transparent, indicating complete incorporation of the peptide
into the membrane.
Site directed spin labeling was achieved by resuspending the lyophilized peptide
in a solution of 4 M guanidine-HCl, and adding appropriate amount of 0.1 M stock spin
label solution for a final ratio of 3:1 spin label to peptide. The mixture was allowed to
react overnight at 4oC before being purified and characterized. Extra spin label was
removed by dialysis using a 500 Da cut-off membrane. Reverse phase HPLC was further
used to separate the peptide from the unreacted label. Fractions were analyzed by MS to
confirm labeling and by EPR to confirm the nitroxide’s activity.
NMR spectroscopy: For the 2H NMR studies, the quadrupolar echo pulse sequence was
used with quadrature detection capabilities with complete phase cycling of the pulse
pairs. A 3.0 μs 900 pulse, a sweep width of 100 kHz, a recycle delay time of 400 ms, and
a 30 μs interpulse delay were used to accumulate 150,000 transients. Prior to Fourier

119
transformation, an exponential multiplication of 200 Hz line broadening was performed
on the spectra. 2H NMR spectra were obtained at 35 °C for the mechanically aligned
TM7/H8 samples.
15N-labeled solid-state samples were placed in a 4 mm sample rotor in a Bruker
AVANCE 500 WB solid-state NMR spectrometer operating at 50.7 MHz for 15N and
equipped with a triple resonance CPMAS solid-state NMR probe. 15N solid-state NMR
spectra were collected utilizing a standard cross polarization pulse sequence with 1H
decoupling. The following pulse sequence parameters were used; 4.7 μs 1H 90°, 500 ppm
sweep width, 1.5 ms contact time and a 4 s recycle delay with 1H decoupling 144,146. The
spectra were referenced to an external standard of (15NH4)2SO4, (27 ppm). The
experiments were recorded at 35 °C for both DMPC and POPC samples.
For the 2H and 15N-labeled mechanically aligned samples, a double resonance flat coil
probe was used operating at the required temperature in a 700 MHz spectrometer. For the
15N-labeled samples, the following pulse sequence parameters were used: 4.5 μs 1H 90°
pulse, 1.0 ms contact time, 600 ppm sweep width, and a 4 s recycle delay with 1H.129,147-
149
EPR spectroscopy: EPR measurements were conducted on a Bruker EMX instrument
equipped with high-sensitivity cylindrical cavity and fitted with variable temperature
module. For aqueous samples at 308 to 353 K, spectra were was acquired at a microwave
frequency of 9.37 GHz, 2.0 mW microwave power, with 0.5 G 100 kHz field modulation
amplitude. Rigid limit spectra were acquired at 150 K with, 0.2 mW microwave power,
and 1.0 G modulation amplitude, with all other conditions kept the same.

120
(c) Results According to modeling studies, Ala380 is believed to be part of TM7 and
is close to the phospholipid bilayer/water interface.139 The numbering system corresponds
to the position of the amino acids in the full length wild-type receptor proposed by
Bramblett et al.139 We conducted 2H NMR studies of site-specific CD3 labeled Ala380
TM7/H8 peptide mechanically aligned with the bilayer normal perpendicular with respect
to the static magnetic field. The rotation about the Cα-Cβ can be characterized as three
site hopping with a quadrupolar splitting of about 40 kHz for unoriented samples. The 2H
quadrupolar splitting of the unoriented samples of POPC spectrum of Ala380 (Figure 5.4
A) is 40 kHz indicating a peptide with restricted side chain mobility. Similar quadrupolar
splitting has been observed in randomly dispersed 2H-labeled Ala samples of unoriented
Ala residues of other TM proteins incorporated into POPC bilayers. In the aligned POPC
spectrum, the quadrupolar splitting of Ala38 was 32.5 ± 0.1 kHz (Fig. 5.4 B) and 31.0 ±
0.1 kHz in DMPC. The variance was estimated from three different trials. The decreased
quadrupolar splittings of Ala in going from the unoriented to the aligned spectra is most
likely due to an increased mobility of the Ala380 residue. The resolved Pake doublets
clearly show that the sample is well aligned in POPC and DMPC when compared to the
powder spectrum, indicating the peptide is embedded within the lipid bilayer (Fig 5.4 A).
In addition to the 31 kHz Pake doublet observed in the DMPC spectra there are additional
Pake doublets with quadrupolar splittings of 10.3 and 14.1 kHz. These additional Pake
doublets are not observed in the POPC sample. We attribute these inner Pake doublets to
conformational heterogeneity of the peptide in the DMPC membrane environment.

121
We conducted solid-state NMR experiments on 15N-labeled Ala380 in TM7/H8
mechanically aligned on glass plates. 15N solid-state NMR spectroscopy of oriented
membrane peptides has been useful for investigating the polypeptide backbone secondary
structure and topology.140 The spectrum in Figure 5.4 D was obtained from an unoriented
sample of the 15N-labeled Ala380 in TM7/H8 peptide in POPC phospholipid bilayers. In
Figure 5.4 D we noted that the unoriented spectra spans from 215 to 70 ppm indicating
that TM7/H8 backbone is quite rigid in the NMR time scale within the membrane. The
spectrum in Figure 5.4 E was obtained from an oriented sample of the 15N-labeled
Ala380 in TM7/H8 peptide in POPC phospholipid bilayers mechanically aligned on glass
plates. There is a relatively sharp resonance peak at 200 ppm due to the 15N-labeled
Ala380 residues in TM7/H8. Figure 5.4 F was obtained from the same labeled peptide in
aligned DMPC phospholipid bilayers, and exhibits a broad resonance with chemical shift
at 180 ppm. The 15N–labeled Ala380 resonance peaks in POPC and DMPC are downfield
of the unoriented 15N sample (Figure 5.4 D) indicating the residue is embedded within the
phospholipid bilayer. The change in chemical shift between POPC and DMPC reflects a
change in peptide orientation within the two bilayers. However, we also observe an
envelope of spectral overlap of the DMPC sample with intrinsic broadness which
supports the 2H aligned spectrum shown in Fig. 5.4 A and indicates a peptide with
conformational heterogeneity. In order to probe the local conformational properties we
conducted site directed spin labeling and EPR studies on the peptide reconstituted in
DMPC and POPC bilayers.

122
Figure 5.4: One-dimensional solid-state 2H and 15N NMR spectra of site-specific 2H or 15N-labeled Ala380 TM7/H8 in oriented DMPC and POPC phospholipid bilayers. The spectra displayed were collected at 308K for both DMPC and POPC phospholipid bilayers. (A) Chemical shift tensor of unoriented 2H-labeled Ala380 TM7/H8 in POPC, (B) 2H-labeled Ala380 in POPC, and (C) 2H-labeled Ala380 in DMPC. (D) Chemical shift tensor of unoriented selectively 15N-labeled TM7/H8 in POPC, (E) 15N-labeled Ala380 in POPC, and (F) 15N-labeled Ala380 in DMPC. The sequence representing the amino acid residues of helix 7 and the cytoplasmic helix 8 of the cannabinoid receptor-1 receptor with 15N-labeled Ala380 shown in bold face.
Investigation of the dynamic properties of the polypeptide within the
membranes was conducted by SDSL-EPR of peptides singly labeled near the
phospholipid bilayer/water interface at Cys382 (Figure 5.5). Doubly labeled peptides
were used to determine dipolar interactions between Cys382 and Cys386 (i to i + 4) from
which the distance between the two spin labels was estimated using a dipolar broadening
deconvolution method.150 Detailed information about the local dynamics of spin labeled
polypeptides may be obtained by least-squares analysis of the EPR lineshape of singly
Dm hCB1(T377-E416) - TVFAFCSMLCLLNSTVNPIIYALRSKDLRHAFRSMFPSCE

123
labeled peptides.151 In nitroxide spin labeled systems both overall molecular tumbling and
local motion of the label affect the EPR lineshape. Figure 5.6 shows the EPR spectra of
TM7/H8 labeled at Cys382 and reconstituted in POPC, DMPC and TFE/H2O mixture,
DMPC at 308 K. The spectral lineshapes observed in TFE/H2O mixture and POPC are
quite similar, indicating that the nitroxide is experiencing similar structural environments
consistent with fast tumbling of the polypeptide and reorientation of the flexible nitroxide
tether. In DMPC, the nitroxide spectrum shows remarkably different characteristics
including broadening of the resonance lines and lineshape features suggestive of a
comparatively less mobile nitroxide tether.

124
Dm hCB1(T377-E416) - TVFAFCSMLALLNSTVNPIIYALRSKDLRHAFRSMFPSAE
Figure 5.5: EPR spectra of spin labeled TM7/H8 reconstituted in POPC, DMPC and TFE/H2O mixture at 308K. Dashed lines show the results of least squares fitting calculated based on the parameters in Table 1. The sequence representing the amino acid residues of helix 7 and the cytoplasmic helix 8 of the cannabinoid receptor-1 receptor is shown at the top with Cys382 shown in bold face.
We used non-linear least-square lineshape analysis to estimate dynamic
parameters for the three cases under study. As summarized in Table 5.1, the rotational
diffusion parameters (R║ and R┴, with respect to the nitroxide molecular frame), isotropic
hyperfine spitting (Aiso) and mobility parameter ΔH0−1 were estimated for polypeptides
reconstituted in TFE/H2O mixture, POPC, and DMPC using two site fittings. The two site
fitting was chosen based on spectral features (e.g. peak asymmetry, shoulder features)
which suggest the presence of multiple components. Both the rotational parameters and
the more qualitative ΔH0−1 mobility parameter are consistent with the observation that the
0.2 0.4 0.6 0.8 1 1.2 1.40
0.2
0.4
0.6
0.8
1
t (µs)
Nor
m. I
nten
sity
2 3 4 5 6 7 8r (nm)
0.2 0.4 0.6 0.8 1 1.2 1.40
0.2
0.4
0.6
0.8
1
t (µs)
Nor
m. I
nten
sity
2 3 4 5 6 7 8r (nm)
-400 -300 -200 -100 0 100 200 300 400
DMPC
TFE
POPC
Field (Gauss)

125
nitroxide is experiencing similar dynamic environments in TFE/H2O mixture and POPC,
while in DMPC the observed mobility is considerably reduced. In TFE/H2O mixture the
two sites have equivalent Aiso as expected from the presence of a single hydrophilic
phase, whereas peptides reconstituted in POPC and DMPC membranes show the
presence of two phases, with the POPC samples experiencing marked differences
between the two environments.
Table 5.1: Summary of rotational diffusion parameters R║ and R┴ expressed in log10(s-1), isotropic hyperfine spitting, Aiso in MHz, the percent contribution, and mobility parameter ΔH0
−1 in gauss (G) calculated from non-linear least squares fits of spin labeled peptide in POPC, TFE/H2O mixture, and DMPC at 308 K. Fixed parameters in the fits include g-factor (gx, gy, gz) = (2.0085, 2.0056, 2.0020) and inhomogeneous Gaussian line width of 1 G.
POPC TFE/H2O DMPC Site 1 Site 2 Site 1 Site 2 Site 1 Site 2
R║ (log10) 9.13 8.25 9.13 8.19 8.0 7.5 R┴ (log10) 8.88 8.11 8.98 8.12 8.0 7.7 Aiso (MHz) 45.1 43.0 45.10 45.1 43.7 43.0 % pop. 74% 26% 15% 85% 34% 66% ΔH0
−1 (G) 0.73 0.68 0.3
The parameters calculated for spin labeled TM7/H8 in TFE/H2O mixture are
consistent with the fact that the nitroxide is experiencing a low viscosity hydrophilic
solvent in contrast with the POPC samples which show both hydrophilic and hydrophobic
environments. The hydrophilic environment experienced by the nitroxide spin label in
POPC is probably due to its vicinity to the phospholipid headgroup/water interface
region. The smaller Aiso values derived from the DMPC sample implies that the nitroxide

126
is embedded within the phospholipid bilayer in this case, which also affects both the
backbone dynamics and internal rotameric freedom of the spin label.
Nitroxide spin labeled at position Cys382 in TM7/H8 was reconstituted in POPC
phospholipid bilayers to evaluate the effects of temperature on the dynamics of the
nitroxide spin label. As shown in Figure 5.6, the temperature-dependent EPR spectra
indicate two components for this sample in the temperature range from 318 to 343 K,
which are particularly visible at higher temperatures. We used two sites fitting to
estimate Aiso and extract the relative contributions of each component to the spectral
intensity [49]. The results of the fits are summarized in Table 5.2 and confirm the
presence of a hydrophilic phase with Aiso of 45.1 MHz (site 1 in Table 5.2) and a
hydrophobic phase with Aiso of 43.0 MHz (site 2 in Table 5.2). This data suggests that the
local environment surrounding the nitroxide spin label on the peptide is distributed
between the phospholipid/water interface and the hydrophobic core of the POPC lipids.
At lower temperature the hydrophilic phase component accounts for 74% of the spectral
intensity. As the temperature is increases, so does the fraction of the hydrophobic
component which makes up 85% of the spectral intensity at 343K. This behavior is
reversible upon cooling back to 308 K. The TFE/H2O mixture sample shows minor
changes that can be attributed to increased mobility and lower viscosity at higher
temperatures (see Figure 5.7 A). In contrast, the same experiments on the peptides
reconstituted in DMPC lipids show significant increase in spin label mobility at higher
temperatures (Figure 5.7 B).

127
The equilibrium constant for the temperature dependent hydrophilic/hydrophobic
partitioning in TM7/H8/POPC has been estimated from the relative populations
calculated in the least-squares fits. Figure 5.8 shows a van’t Hoff plot from which the
changes in enthalpy (ΔH = +62 kJ/mol) and entropy (TΔS = +60 kJ/mol) may be
determined for the transition from the hydrophobic to the hydrophilic environment. The
signs of Δi and Δi are consistent with a thermally driven immersion of the polar label into
the membrane interior, so that ΔH reflects the energy cost of forcing the polar probe into
the hydrophobic environment [50, 51].
Dm hCB1(T377-E416)– TVFAFCSMLALLNSTVNPIIYALRSKDLRHAFRSMFPSAE
Figure 5.6: EPR spectra of TM7/H8 singly labeled at Cys382 reconstituted in POPC at temperatures from 318 K to 343 K. Dashed lines show the results of two site least square fitting: for the hydrophilic site Aiso = 45.1 MHz, while for the hydrophobic site Aiso = 43.0 MHz. Fixed parameters in the fits include g-factor (gx, gy, gz) = (2.0085, 2.0056, 2.0020) and inhomogeneous Gaussian line width of 1 Gauss. The sequence representing the amino acid residues of helix 7 and the cytoplasmic helix 8 of the cannabinoid receptor-1 receptor is shown at the top with Cys382 shown in bold face.
-300 -
200 -100
0 100
200
300
400
318 K
323 K
328 K
333 K
343 K
Field (Gauss)

128
Table 5.2: Fitting parameters derived from two site least square fits of singly labeled TM7/H8 peptide reconstituted in POPC at different temperatures. Site 1 represents the hydrophilic component with a fixed Aiso of 45.1 MHz and (gx, gy, gz) = (2.0085, 2.0056, 2.0020). Site 2 describes the hydrophobic component with fixed Aiso of 43.0 MHz and (gx, gy, gz) = (2.0085, 2.0056, 2.0020). R || and R┴ correspond to the parallel and perpendicular rotational correlation times and are expressed in units of log10(s-1).
log10 R || log10 R ┴ Population site 1 (%)
Temperature (K)
site 1 site 2 site 1 site 2 308 9.13 8.25 8.88 8.11 74 323 9.25 8.25 8.64 8.5 38 328 9.33 8.28 8.55 8.75 35 333 9.5 8.35 8.57 8.89 21 343 9.45 8.53 8.6 8.88 15
-600 -400 -200 0 200 400 600 -600 -400 -200 0 200 400 600
Figure 5.8: EPR spectra of TM7/H8 singly labeled at Cys382 reconstituted in TFE/H2O mixture at 308 and 343 K (A) and in DMPC at 308 and 343 K (B).
A B
343 K 343 K
308 K308 K
Field (Gauss) Field (Gauss)

129
0.0028 0.0029 0.003 0.0031 0.0032 0.0033 0.0034-2
-1.5
-1
-0.5
0
0.5
1
1.5
2
2.5
3
1/T
Ln(K
)
Figure 5.7: Van’t Hoff plot derived from relative populations of hydrophobic/hydrophilic components as a function of temperature. The equilibrium constant K at temperature T was computed by taking the ratio of relative populations of hydrophobic to hydrophilic components derived from fits. The best fit line ( ln(K) = −7542/T + 23.8 ) provides the estimates ΔH = +62.7 kJ/mol and TΔS = +60 kJ/mol for the transition from the hydrophobic to the hydrophilic environment.
Doubly labeled TM7/H8 at positions Cys382 and Cys386 (i and i+4) was
prepared and reconstituted in TFE/H2O mixture, POPC, and DMPC. The spin-spin
dipolar interaction in doubly labeled systems can be used to extract accurate interspin
separations in the range of 5 to 20 Å from the CW-EPR spectrum 152. Figure 5.8 shows
the rigid limit EPR spectra measured for doubly labeled TM7/H8 peptide in TFE/H2O
mixture, POPC and DMPC lipids. The spectral reconstruction method developed by Fajer
et al. 152 allows evaluation of both the amount of broadening caused by dipolar
interaction as well as the percentage of non-interacting component caused by incomplete

130
labeling or misfolding of the labeled peptide leading to interspin separations beyond the
20 Å detection limit 150. Table 5.3 summarizes the results of the fits. Peptides
reconstituted in TFE/H2O mixture and POPC have a significantly higher fraction of
coupled spins than the DMPC reconstituted peptide. Since all the samples studied were
prepared from the same stock of labeled peptide, the drastic reduction in dipolar coupling
is most likely attributable to conformational heterogeneity of the peptide in DMPC that
brings the paramagnetic centers out of the 20 Å range observable by the dipolar
broadening technique. Distances extracted from electron spin dipolar broadening are
consistent with distances measured between the same two Cys in preliminary high-
resolution NMR measurements recently obtained in Prof. Makryiannis’ lab.
Table 5.3: Results of the dipolar deconvolution for the three cases examined. The error was estimated using a 90% tolerance around the best χ2 value.
Sample Average Distance Distribution % Coupling
TFE/H2O 10.6 ±1.5 Å 8 ±3.5 Å 50 ±1.7 POPC 16.8 ±0.5 Å 6.2 ±3.5 Å 60.3 ±3.5 DMPC 11.6 ±2 Å 6.2 ±5 Å 14.3 ±1

131
Sm hCB1(T377-E416)– TVFAFCSMLCLLNSTVNPIIYALRSKDLRHAFRSMFPSAE
Figure 5.9: Rigid limit spectra of doubly labeled TM7/H8 in TFE/H2O MIXTURE, POPC and DMPC. All spectra were signal averaged for 30 scans. The sequence representing the amino acid residues of helix 7 and the cytoplasmic helix 8 of the cannabinoid receptor-1 receptor is shown at the top with Cys328 and Cys386 shown in bold face. Starting from the top, each set of plots consists of single labeled reference spectrum, double labeled spectrum, calculated fit and residual.
(d) Discussion The lipid bilayer is a dynamic structure held together by hydrophobic and lipid/lipid
interactions 153. Because of the high degree of spatial inhomogeneity, the interior of the
lipid bilayer is characterized by strong lateral pressure forces that vary greatly with the
depth within the bilayer 153. It has been suggested that changes in bilayer pressure
profiles are responsible for activation of certain membrane proteins such as gated
membrane channels and GPCRs 153. The crystal structure of rhodopsin has revealed
important structural features concerning all GPCRs. In the rhodopsin structure, the
TFE POPC DMPC

132
orientation of TM7 within the bilayer is dictated by a conformational change in H8. This
conformational change is governed either by the surrounding environment or the
interaction of the polar residues with the lipid headgroups.
We have used a combined NMR and EPR approach to determine the effect of
membrane thickness on the conformation of TM7/H8 peptide representing the C-terminus
of the cannabinoid receptor 1 in two model membranes. The differences in the 2H and 15N
NMR spectra produced in POPC and DMPC lipids suggest that the peptide’s structural
ordering is affected by the shorter DMPC membrane. First the 2H quadrupolar splittings
of Ala380 labeled TM7/H8 in both POPC (33 kHz) and DMPC (31 kHz) phospholipid
bilayers were slightly different within the limits experimental error (± 0.1). The
differences in splitting of the labeled sites in the two different phospholipid bilayers as
well as the appearance of several Pake doublets in the DMPC sample may be due to
several reasons: temperature effects, differences in protein-lipid interactions, a decrease
in wobbling of the side chain Ala380 peptide in POPC lipids relative to DMPC, a change
in the tilt of the TM7/H8 peptide, or a combination of all these different effects. First of
all, the temperature did not have any major effect on the 2H quadrupolar splittings and
15N chemical shifts shown in Figure 1 because we conducted the same experiments at
lower temperatures. The same 2H Pake patterns and 15N chemical shifts were obtained at
both 25oC and 35oC for the mechanically aligned samples. Thus the differences in the
spectra in POPC and DMPC could be due to multiple effects associated with all the
factors mentioned above.

133
To further investigate these differences we applied site directed spin labeling and
EPR as a more sensitive probe of the local environment. EPR measurement of peptide
labeled at position Cys382 confirms marked differences in the local dynamics of the
peptide reconstituted in TFE/H2O mixture, POPC and DMPC. TM7/H8 produces similar
fast motional spectral lineshapes in POPC and TFE/H2O mixture, in contrast with the
more complex slow motional spectrum observed in DMPC. A temperature study of the
TM7/H8 reconstituted in POPC lipids over the range of 308 to 343 K showed the
presence of two components in the EPR spectrum that can be attributed to a hydrophilic
phase that predominates at lower temperatures, and a hydrophobic phase that becomes
more pronounced at high temperature. Partitioning between hydrophobic and hydrophilic
environments suggests that the nitroxide is positioned near the phospholipid bilayer/water
interface. As the temperature is increased, the peptides undergo conformational changes
that position the label in a more hydrophobic environment. This interpretation is
supported by ΔH and ΔS values extracted from van’t Hoff analysis of the relative
populations. In contrast, the peptide does not undergo the same temperature-dependent
partitioning in DMPC, demonstrating different orientation and dynamics of the nitroxide
reporter group within the membrane.
We measured dipolar broadening in doubly labeled peptide reconstituted in
TFE/H2O mixture, POPC and DMPC lipids as a way to extract interspin distances. The
results highlight the effect of hydrophobic mismatch on the structure of the peptide.
Samples reconstituted in TFE/H2O mixture and POPC showed a high degree of coupling
with distances of 10.6 (± 0.5) Å and 16.8 (± 1) Å respectively, whereas the DMPC

134
reconstituted peptide showed a much lower level of interspin interaction. The large
coupling between labels located at i and i+4 is strongly indicative of an α-helical
structure in TFE/H2O mixture or POPC, whereas the peptide undergoes a conformational
adjustment in the shorter DMPC bicelles that causes the interspin distances to exceed the
20 Å detection limit of the dipolar interaction technique. The average distance between i
and i+4 labels of the same peptide in TFE/H2O mixture was estimated from the high-
resolution NMR structure to be 7 Å. The interspin distance measurements from the EPR
compare with the high-resolution structure considering the tether length and rotamer
structure of the spin labels.
In Figure 5.10 we present a molecular model of Cys382 spin labeled TM7/H8 to
help visualize the position of the nitroxide spin label within the POPC lipid bilayer. The
16.8 Å interspin distance between Cys382 and Cys386 (i to i+4) residues measured in
TM7/H8 indicates an extended helix in POPC which justifies positioning the nitroxide
reporter group close to the headgroup/water interface. As the temperature is elevated the
probe more frequently samples the hydrophobic environment due to increased peptide
motion and membrane phase transitions. In DMPC, the majority of the interspin distances
observed for TM7/H8 are outside the range of the dipolar-broadening technique applied
here. However, the measured distance of 11.6 Å, which corresponds to only 14% of the
peptide population, places the spin probe well within the hydrophobic bilayer.
Conformational heterogeneity in DMPC underlines the contrast with the POPC case
where more than 60% of the peptide population produces dipolar coupling. We take this

135
as evidence that modulation of the bilayer thickness has a direct effect on the
transmembrane helix conformation.
Figure 5.10: Molecular model of TM7/H8 in POPC with the nitroxide label at position 382 depicted in blue. The model shows the proximity of the nitroxide reporter group to the lipid headgroup/water interface.
When we combine the solid state NMR and EPR results the emerging picture
provides insights into the structure and dynamics of the membrane bound TM7/H8
peptide. In the POPC lipid environment, there exists essentially one conformation for the
peptide, whereas DMPC induces conformational heterogeneity in the peptide. The NMR
data therefore show that reducing the membrane thickness decreases the conformational
ordering of the peptide within DMPC. Spin label experiments confirm this result and add
structural details about the environment of the spin probe.

136
Implication of membrane hydrophobic thickness for backbone flexibility of TM7/H8.
TM7/H8 is an integral domain of CB1 that is strongly tied to receptor activity. In
this context, the results presented here have direct implications for the biological function
of the CB1 receptor. Constitutive activation drives compartment-selective endocytosis of
CB1 across membranes of different thickness 154. Structural remodeling across
membranes requires conformational modulation of the transmembrane helices. A key
feature of the TM7/H8 ability to respond to different membrane thicknesses depends on
the presence of a conserved motif NPXXY which is present in most GPCRs. Proline
residues are known to destabilize α-helices in globular proteins, but in transmembrane
helices such as those of the cannabinoid receptors, the NPXXY motif may provide a
flexible α helix which is sensitive to hydrophobic mismatch and a response mechanism
that allows conformational modifications when moving from one membrane system to
another. Characterization of the NPXXY motif in various single- or multi-transmembrane
spanning proteins also reveals its diverse role in mediating internalization and targeting
120,154. Normally long and rigid transmembrane domains compensate for hydrophobic
mismatch when reconstituted into shorter membranes by tilting. However, for flexible
helices with NPXXY microdomains, other mechanism such as kinking and
conformational changes might be important. We postulate that the kink at P394 residue in
TM7 is crucial for conformational modulation in DMPC, which may occur in concert
with additional structural rearrangements in the other CB1 receptor transmembrane
helices, and may be important for constitutive activation of GPCRs.

137
(e) Conclusion In conclusion, our solid-state NMR and EPR data on the structure of the 40-mer peptide
in POPC clearly indicate that the first 23 amino acid residues form an α-helical structure
embedded within the bilayer. This description is supported by a recently acquired high-
resolution structure of TM7/H8 in detergent micelles (unpublished experiments). When
the same peptide is introduced into the narrower DMPC bilayer, a distinct change in the
structure of the transmembrane segment is observed, which suggest that the peptide has
variable structural elements within DMPC lipids. Our results thus suggest that the bilayer
width can play a role in modulating the structure of the transmembrane helices within
GPCRs. The observed change in conformation of the TM7/H8 may be in response to
membrane thickness and provides important evidence for the molecular mechanism of
constitutive endocytic activity observed in most GPCRs. This might be evidence that
compartment-selective endocytosis of CB1 across membranes of different thickness
requires a conformational change within the transmembrane helix.

138
5.3 Molecular-scale force measurements in a coiled-coil peptide by electron spin resonance – in collaboration with Guarav Sharma and Prof. Dinos Mavroidis, Department of Mechanical Engineering, Northeastern University, Boston, MA
Fabrication of multi-component nanostructures requires the assembly of
molecular scale components into ordered arrays. Biological systems offer examples of
self-assembling structures that come together to form functional entities 155. Coiled-coil
peptides are particularly interesting biological models that naturally form robust
multimers, and that can be tuned to yield dimers and trimers, as well as large fiber
assemblies with predictable morphologies 156-160 . In order for these structures to find
applications as nanodevices, new methods are being developed that predict and measure
their mechanical properties at the nanoscale level 161-163. In this section we demonstrate a
new experimental method for measuring inter-coil forces that is based on electron spin-
labeling and double electron-electron resonance (DEER) spectroscopy.
The model system used for these measurements is based on the α-helical coiled
coil leucine zipper portion of the yeast transcriptional activator GCN4 164 (residues 249-
281 of PDB entry 1YSA; hereinafter GCN4-LZ). The coiled-coil structure consists of
two identical polypeptide chains ~4.5 nm long and ~3 nm wide.
To accomplish the force measurement, a leucine zipper peptide was synthesized
with a spin label attached at residue 246 near the N-terminus, as shown in Figure 5.11.
This location places a label near the end of the each helix, with the objective of forming
the coiled-coil dimer and determining the distribution of distances between the two labels
as described below. The Multicoil score 165 was used to estimate the propensity of this
sequence to form a coiled-coil leucine zipper, based on the identities of the amino acids

139
in positions a-g of the coil (cf. Figure 5.11), where a score between 0.5 and 1.0 indicates
probable coiled-coil formation. Neglecting the TOAC residue, the score for the GCN4-
LZ sequence is 0.83, indicating a strong propensity to form a coiled-coil dimer that is
most likely reinforced by the tendency of the TOAC residue to adapt a helical backbone
conformation.
Distance measurements can be obtained by measuring the electron spin-spin
dipolar interaction using double electron-electron resonance (DEER) spectroscopy.166
The TOAC spin label 167-169 was selected for this application because of its rigid fused
ring structure (shown in Figure 5.11), which eliminates motion of the spin-bearing
nitroxide group relative to the peptide backbone, thus ensuring that spin-spin distance
measurements directly reflect the inter-backbone distance. The GCN4-LZ sequence was
constructed with a triglycine sequence added N-terminal to the TOAC added to further
reduce the mobility of the label 167,168,170,171.

140
Figure 5.11. Coiled-coil leucine zipper structure investigated in this work, indicating structure and position of the TOAC spin label in the sequence and within the leucine zipper motif. Right: cartoon of the coiled-coil dimer conformation, showing the location TOAC labels.
Solid phase peptide synthesis using Fmoc-protection chemistry was performed by
the research group of Prof. Gary Lorigan of Miami University (Oxford, OH) on a 433A
Peptide Synthesizer from Applied Biosystems Inc., Foster City, CA.
Figure 5.12 shows a CW-EPR spectrum from the TOAC-labeled coiled-coil
structure at pH 7. Dynamic parameters (cf. Fig. 5.12 caption) were obtained by least-
squares fitting of the slow-motional lineshape151,172 with consensus magnetic parameters
for TOAC.170,173 The labeled coil-coil structure exhibited significantly anisotropic
motion, with the principal diffusion axis (i.e. the long axis of the dimer) perpendicular to
a
a'
b
b'c
c'
d
d'
e
e'
f f'
g
g'
abcdefg abcdefg abcdefg abcdefg WT GGGXRMKQLEDK VEELLSK NYHLENE VARLKKLVGER
ONH
ON
TOAC

141
the magnetic x direction and approximately 30° away from magnetic z, consistent with
the direction estimated from a molecular model. Also shown in Figure 5.12 is the CD
spectrum of the peptide confirming the Multiscore prediction of a coiled-coil
conformation.
Figure 5.12. X-Band CW-EPR spectrum of the labeled coiled-coil dimer at room temperature. Dotted line shows least-squares slow-motional lineshape. Least-squares values of the rotational diffusion constants parallel and perpendicular to the major axis of the molecule (shown by dashed line) were R|| = 1.8×10⁹ s−1, R⊥, = 1.9×10⁷ s−1, with diffusion tilt angle βD= 25°. Fixed-value parameters in the fit were the electronic g-factor (gx, gy, gz) = (2.0085, 2.0056, 2.0020), 14N hyperfine tensor (Ax, Ay , Az) = (21, 9.0, 105) MHz, inhomogeneous Gaussian linewidth 1.9 Gauss, and diffusion tilt angle αD = 90°. Inset: CD spectrum of the peptide displaying the characteristic features of an alpha-helical coiled-coil.
3460 3480 3500 3520 3540 3560 3580Magnetic Field (Gauss)
200 220 240-
0
1
2
3
Wavelength
Elli
ptic
ity βD

142
Four-pulse double electron-electron resonance (DEER) spectroscopy was
performed at 65 K, and the results are summarized in Figure 5.13. The time domain
signal (Figure 5.13 A) was baseline-subtracted and then Fourier-transformed to give the
spectrum shown in Figure 3B. The spectra reflect a frequency distribution given by
( )3
22210
41cos3
hrgg
πθβμν −
= [5.1]
where g1 and g2 are the isotropic g-factors of each electron, β is the Bohr magneton, μ0 is
vacuum permeability, h is Planck’s constant, r is the interspin distance, and θ is the angle
between the magnetic field and the interspin vector. The spectrum exhibits the
characteristic “Pake pattern” with turning points corresponding to θ = 0° and θ = 90° (cf.
Eq [5.1]) from which the distribution of interspin distances r can be derived. Figure 5.13
C shows the distance distribution functions P(r) obtained from the DEERAnalysis2006
program 174 using model-independent Tikhonov analysis. The resulting distribution of
distances exhibited a large fraction of the population at a distance of 2.2 nm, very close to
the distance of 2.3 estimated from a molecular model of the TOAC-labeled dimer
conformation (Fig. 5.11). The model-independent analysis also indicated a small fraction
of spins with larger separation distances, which may reflect a minor degree of interaction
between coiled-coil units. The distribution of distances in the main fraction is very
narrow (about 0.14 nm), confirming that the coiled-coil adopts a compact and well-
defined structure.

143
0 0.5 1Time (μ sec)
A
-20 0 20Frequency (MHz)
B
1.5 2 2.5 3Distance (nm)
C
Figure 5.13: (A) Time domain DEER signal showing modulation from spin-spin interaction. (B) Frequency domain DEER signal showing characteristic Pake pattern of an isotropically distributed pair of dipoles, obtained by Fourier transform of the data in (A) after baseline subtraction (straight line); (C) Solid line shows distribution of distances between spin labels obtained by model-independent Tikhonov analysis of the DEER spectrum as described in the text. Symbols show distance distribution calculated from molecular dynamics using the adaptive biasing force method as described in the text.

144
The distance distribution obtained from DEER spectroscopy may be used to
calculate the mean force between the halves of the coiled coil by analogy with the
method used in potential of mean force (PMF) molecular dynamics (MD)
calculations.175,176 In this type of calculation, the average force Fξ along a selected
“reaction coordinate” ξ (in this case the distance between labeled residues of the coiled-
coil) is related to the derivative of the free energy A(ξ):
( )dA Fd ξξξ
= − [5.2]
Over the course of an MD trajectory, the instantaneous force along ξ is tabulated as a
function of ξ in small bins of width δξ, from which the derivative dA(ξ)/dξ (and thus the
free energy A(ξ)) may be estimated. Optionally, one may apply an adaptive biasing force
(ABF) that cancels the instantaneous force in order to overcome local free energy barriers
and ensure uniform sampling of the ξ coordinate. A(ξ) is then related to the probability
P(ξ) of finding the system at coordinate ξ by the PMF equation:175,176
0)(ln)( APTkA B +−= ξξ [5.3]
Assuming P(ξ) is given by the spin label distance distribution measured by DEER, one
may work backwards from the experimental P(ξ) to find A(ξ) from Equation 5.2, and
then numerically calculate dA(ξ)/dξ to find the average force on the coiled-coil peptide.
Figure 5.13 C compares the experimental measurement of P(ξ) with that
calculated from a 4 ns MD trajectory using the adaptive biasing force (ABF) method as
implemented in the NAMD program [39] (round symbols). The coiled-coil dimer was

145
solvated and equilibrated in a 50 Åx50 Åx70 Å cell using standard methods, and chloride
ions added to neutralize the total charge. The simulations employed the CHARMM27
force-field [40], the particle mesh Ewald method [42] for electrostatic interactions, a
switching function for van der Waals interactions with switching distance of 10 Ǻ and a
cutoff of 12 Å, and the ShakeH [43] algorithm with a to fix hydrogen bond lengths
relative tolerance of 1.0 x 10⁻⁸. Calculations were carried out using the Nosé-Hoover NPT
ensemble at 1 atm and 298 K [44] with a damping coefficient of 5 ps and a 2 fs
integration time step. The reaction coordinate ξ was chosen as the distance separating the
centers of mass of the backbone atoms residue 246 in the two chains, and was restricted
to 10 ≤ ξ ≤ 35 Å, allowing the peptide to evolve freely from closed to open state. Since
the DEER experiment measures distances between the electron spins, the curve
calculated from MD curve was shifted by 0.77 nm to take into account the additional
distance between the backbone and the midpoint of the N—O bond of both spin labels
and assist visualization of the two distance distributions.
As Figure 5.13 C shows, the shapes of the calculated and experimental distance
distributions are in excellent agreement. The forces obtained by taking the derivatives of
each curve calculated from the population distributions according to Eq. [5.2] are 110±10
pN for the experimental data and 90±10 pN for the curve calculated from MD. These
values are also quite comparable to typical protein folding and unfolding forces that have
been measured by single-molecule methods.177
It is important to note that the method presented here does require the assumption
that the distribution observed under the conditions of DEER spectroscopy (i.e. in frozen

146
solution) reflects the equilibrium distribution of coiled-coil conformations in solution at
room temperature. This is a reasonably good approximation so long as the freezing is
rapid enough to quench the motions of the system effectively. The availability of model-
independent methods such as Tikhonov analysis for obtaining distributions is another
advantage of the method presented here.
It is also worth emphasizing that accurate force measurements by this method
requires the use of a rigidly attached label such as TOAC; the presence of a flexible tether
as employed in more commonly used spin probes would lead to a broader distance
distribution and systematic underestimation of the forces between the labeled protein
domains. A variety of strategies for immobilizing spin labels relative to the protein have
been employed, including as the attachment of bulky groups on the label that sterically
hinder its motion178 and the use of bifunctional labels that immobilize the nitroxide via
two points of attachment.179
The method described here establishes the utility of EPR for quantitatively measuring
the mechanical properties of peptides and peptide-based nanodevices. Furthermore, these
results add to our understanding of coiled coils motifs, which represent an important and
common mode of protein-protein interaction. EPR has some key advantages for
measuring structural and mechanical properties of coiled-coil motifs: it is uniquely
sensitive to the distance scale that is relevant for the range of motion of such systems,
and, it can measure the full distribution of intramolecular distances, from which
properties including structural flexibility and intermolecular force can be measured. Such

147
capabilities will be critical for the design of nanoscale active devices with targeted
functions.
5.4 SDSL investigation into the structure of UmuD – in collaboration Prof. Penny Beuning, Department of Chemistry and Chemical Biology, Northeastern University, Boston, MA
(a) Background UmuD is a manager protein that regulates the activity of Y-family of DNA
polymerases in E. coli. This class of proteins is involved in response to DNA damage and
in regulating DNA replication. UmuD’s function is linked to translesion DNA synthesis
and it relies on a self cleavage activation step and on interaction with other proteins
(Figure 5.14). Understanding the molecular mechanism underlying the action of UmuD is
important for elucidating the cell’s response to mutagenesis. In collaboration with Prof.
Beuning, we are working to elucidate structural features of the UmuD dimer.
We use SDSL to introduce a nitroxide probe at a site of interest as a way to
monitor local dynamics and structure. Relatively little is known about the structure of
UmuD, due to difficulties with crystallization of the uncleaved form. Some studies
suggest that UmuD might be in an intrinsically disordered state 180. Furthermore, it was
suggested that UmuD might form several types of dimers arrangements 181. Our goal is to
further the understanding of the structure of UmuD by adding information about local
dynamics and inter-dimer distance. Understanding UmuD’s structure in solution is
critical to understanding how UmuD regulates the cellular response to DNA damage.

148
Figure 5.14: Schematic representation of UmuD dimer as it undergoes self-cleavage. The star represents the position of the spin labeling site.
(b) Initial results UmuD naturally contains a single cysteine at position 24 that becomes part of a 24-mer
self-cleavage peptide as part of UmuD2 activation. The self-cleavage yields the active
form of, UmuD2`, which interacts with multiple transcription factors. Our first SDSL
experiment is aimed at confirming the proper labeling and establishing that the labeled
protein is still active. In this respect, we used a thiol specific spin label and confirmed
binding by observing lineshape changes. Furthermore, we confirmed retention of self
cleavage by monitoring the appearance of the fast motional signal due to the small
cleavage product. The result of the self cleavage assay are summarized in Figure 5.15.
UmuD2 UmuD2’
Local dynamics Dimer distance
Auto-cleavage

149
Figure 5.15 Stacked EPR spectra of spin labeled UmuD taken at different times where the dotted line highlights the appearance of the fast motional component (i). Plot of the fast motional component as a function of incubation time for pH 7 condition (▲) and for alkaline condition (♦) where the solid lines represent the computed fits (ii).
The appearance of a fast motional component with a pH dependent rate is consistent with
known behavior of UmuD2 self-cleavage activation. This result shows that Cys-24 can be
labeled without affecting the native behavior of the protein. For convenience, it would be
desirable to look at a mutant that does not undergo self-cleavage as a way to investigate
the conformation of the “arms” region of UmuD. The S60A mutant of UmuD is known to
assume the native conformation but does not undergo self-cleavage 181. We spin labeled
the UmuD60A mutant and confirmed that (i) the fast component in not formed, and (ii)
the EPR lineshape is identical to UmuD wild type, suggesting retention of native
structure. The EPR spectra of UmuD-wt and UmuD60A are summarized in Figure 5.16.
346 348 350 352 354 356 358
0
0.2
0.4
0.6
0.8
1
1.2
0 50 100 150 200 250 300
Alk data Alk fit pH7 Data pH7 Fit
Time (hours) Magnetic Field (Gauss)
(i) (ii)

150
Figure 5.16: CW-EPR spectra of UmuD-wt (i) and UmuD60A (ii)
Structural information about the dimer conformation of full length UmuD is
limited due in part to flexibility of the cleavable arm region. DEER spectroscopy can be
used to provide information about both structure through measuring interspin distances
and conformation flexibility by measuring distance distribution. Our initial
characterization of spin labeled UmuD60A using DEER spectroscopy has provided some
of the first structural information about this region of the protein. Figure 5.17 summarizes
the results and analysis of DEER spectroscopy. We measure an interspin distance of 40 ±
3 Å and a wide distance distribution consistent with a high degree of conformational
flexibility.
Figure 5.17: DEER spectrum and analysis of singly labeled UmuD 60A.
Magnetic Field (Gauss)
(i)
3440 3460 3480 3500 352 3540 3560 3580 3600
(ii)
Time (µs) Distance (nm) Distance (nm)
3440 3460 3480 350 3520 3540 3560 3580 3600Magnetic Field (Gauss)

151
(c) Ongoing work
The initial results described above provide an encouraging first look at the
applicability of SDSL and EPR to study structural details of UmuD conformation. The
ongoing effort is to prepare mutants with different labeling sites as a way to map the local
dynamics and inter-dimer distances. Additionally a double mutant will also be prepared
to establish the conformation of the dimer and to distinguish between cis or trans
conformers.

152
Chapter 6: Ongoing and Future Work

153
6.1 Distance measurements in ER dimer
(a) Hypothesis of dimer remodeling
In previous chapters, the application of DEER spectroscopy to singly labeled ERα-LBD
was explored. Homodimers spontaneously form both in the unliganded state of ERα-LBD
and in the ligand bound receptor. This makes it possible to measure distances between the
two halves of the singly labeled dimer. In Chapter 3 we described the effects of ligand
binding and coregulator interaction on the dimer distance measured from the 530
position. Similarly, spin labeled estradiol have been used in Chapter 4 to measure
distances between the homodimer. The results have provided for the first time
quantitative measurements of the dimer conformation of ERα-LBD in solution. DEER
measurements, both confirm and elaborate the model put forth from X-ray crystal data.
In particular, these results add the new dimension of distance distribution. We
find that the ERα-LBD dimer is characterized by a substantial degree of conformational
heterogeneity, which is reflected in the wide distance distributions obtained from both
530 labeled ER-LBD and SLE bound receptor. Interestingly, we have observed a marked
change in distance and distance distribution when both agonist ligands and coregulator
peptides are present. This change reduces the inter-molecular distance between the labels
at the 530 position and also considerably reduces the distance distribution suggesting a
more rigid conformation. CW-EPR also confirms this result, showing a marked change in
local dynamics at position 530 upon addition of coregulator peptides. As discussed

154
earlier, these results are consistent with previous fluorescence studies where evidence for
an allosteric stabilization event was presented.
The dimer interface in NRs has been shown to be influenced by ligand and
coactivator binding in the retinoid X receptor LBD (RXR-LBD) heterodimers. In this
case, ligand biding is thought to directly affect the conformation of H11 which constitutes
a large portion of the dimer interface. Similar mechanisms might be regulating the ER-
LBD dimer. Our results allow us to formulate a hypothesis for the effect of ligand and
coregulator peptide binding on the dimer conformation of the receptor.
The unliganded state of ER-LBD is postulated to exist in a number of
interconnecting micro-states, so that as ligand is added, the energetic profile of the
receptor is changed. The energy changes are difficult to characterize experimentally;
however, based on our results we see that ligand interaction does not appreciably affect
the dynamics or the conformation of the dimer as measured by DEER. The ligand does
have an effect on the degree to which peptides stabilize the dimer (c. f. Figure 6.1). This
points to a kinetic effect of ligand binding, where the ligand acts is to reduce the
activation energy (ΔE*) between microstates. In other words, ligand binding does not
affect the relative population between microstates, but it does affect the level of
coactivator recruitment. Even though the apo and holo-ER display similar dynamics and
conformation, they interact differently with the coregulator. The similar dynamics and
conformation points to the fact the relative energy between the microstates is not
significantly affected by ligand binding; however, the observation that the holo state
interacts more efficiently with the coregulators implies that the ligand facilitates

155
conversion to microstates which will be favored by coregulator interaction. These active
conformations are more likely to interact with the coregulator peptide, locking the overall
structure of the receptor. This hypothesis is summarized pictorially in Figure 6.1 where
the case of allosteric interaction in the absence of ligand is also explored.
Figure 6.1: Energy landscape depicting the ligand effect of estradiol binding and coregulator interaction on ER-LBD.
From a structural point of view, it would be desirable to continue the investigation
of the dimer conformation by mapping several distance constraints as a function of ligand
and coregulator interaction. Future work toward this goal should focus on spin labeling of
H11, which constitutes the major dimerization surface in the receptor. Some initial results
have been achieved by looking at inter-dimer distances for ER-543 labeled mutants.
These results are summarized in Figure 6.2. The distances extracted from DEER spectra
of ER-543 dimers agree with crystal structures, but the distance distribution cannot be
accurately derived from these results because of uncertainties in determining the baseline
background. We are currently developing new detection method to address these cases.
E
Degenerate microstates
Apo Holo Holo + CoR
Ligand binding
ΔE* ΔE*
Apo + CoR
coregulator Ligand + coregulator

156
The technical difficulties arise from a combination of factors: (i) fast spin-lattice
relaxation, (ii) broad distributions and (iii) low spin concentrations. The fast relaxation
limits the evolution time available, therefore the slow modulations arising from samples
with broad distance distribution cannot be fully resolved. This leads to difficulties in
calculating the baseline component and increases uncertainty in the measurements. An
average distance can still be measured reliably even for these samples because this
information can be derived from the first part of the spectrum which is less influenced by
incomplete baseline subtraction.
(b) Saturation recovery EPR
Saturation recovery EPR (ST-EPR) is a pulsed EPR technique used to measure dynamics
on the μs timescale. Briefly, in ST-EPR a strong microwave pulse is applied to a portion
of the spectrum creating a saturated “hole”. Since only a portion of the spectrum is being
targeted, only selected orientations will be affected by the pulse. It is then possible to
measure dynamics as these spins rotate causing the hole to spread out at a characteristic
rate. This method could in principle provide important information about the rate of
inter-conversion between different microstates of the receptor.

157
6.2 Double labeled ER
(a) Experimental considerations
In Chapter 2 we described the production and characterization of five ER-LBD mutants,
one of which is designed to be labeled and two sites: position 530 and position 543. This
mutant was created to allow the measurement of ligand dependent changes in
conformation of H12 with respect to the hinge region. DEER spectroscopy is in principle
capable of resolving multiple distances, provided that they are well defined and that a
long enough T2 relaxation time is available to allow sufficient evolution time.
In the case of the double labeled ER-530-543, there are some experimental challenges
which must be addressed. The doubly labeled dimer would in principle provide up to six
different spin-spin distances: two deriving from the intra-molecular interaction of interest
between spins at position 530 and 543, and the remaining four due to inter-molecular
interaction between the dimers. Assuming the halves of the homodimer are equivalent,
this should lead to a maximum of three measurable distance distributions. We have
designed two experiments to help up tease apart the inter- and intra- molecular
contributions: (i) spin dilution, (ii) immobilization to a substrate.
(b) Spin dilution
A simple method to selectively reinforce the relative contribution of the intra-molecular
coupling is by diluting the doubly labeled ER-LBD with unlabeled ER-LBD. This
method relies on equilibrium exchange between ER-530-543 and unlabeled ER-LBD,
and therefore assumes that dimerization is equally probable for homodimers and

158
heterodimers. Figure 6.2 summarizes the spin dilution approach and shows the computed
relationship between the total signal and the intra-molecular signal of interest.
Figure 6.2: Spin dilution scheme highlighting the different combinations of inter and intra-molecular interaction possible within a mixture of doubly labeled and unlabeled ER-LBD (i). Graphical representation showing the dependence of signal intensity (purple), intra-molecular component (green) and relative of intra-molecular component (blue) on the percent dilution (ii).
The graph shows that in order to achieve a 90% contribution of intra-molecular signal, a
60% relative dilution of the doubly labeled ER is necessary, making the ratio of labeled
to unlabeled protein about 1:2.
(c) Immobilization to substrate
As an alternative to spin dilution, ER-LBD decorated beads could be used to artificially
enrich the heterodimer fraction. The method consists of immobilizing unlabeled ER-LBD
to a functionalized bead substrate. This can be accomplished routinely using streptavidin
conjugated beads and biotinylated ER-LBD. Biotinylation is a common protein
derivatization procedure that ensures a strong interaction between the beads and the
Intra-molecular
Intra-molecular
Inter-molecular
Unlabeled – EPR
Spin dilution experiment: signal dependence
0
20
40
60
80
100
120
0 20 40 60 80 100 120
Relative dilution of spin labeled ER (%)R
elat
ive
sign
al (%
)
Total Intra-molecular signalDEER signalWeighted intra-molecular signal
Unlabeled
Double labeled
(i) (ii)

159
modified protein. In fact, the biotin-streptavidin interaction is one of the strongest non-
covalent interactions in nature with a Kd ≈ 10-15 M. This strong interaction will ensure
that ER remains bound to the beads, thus reducing homodimer formation. At this point
the doubly labeled ER-LBD can be introduced, and the excess can be washed away. This
method will yield heterodimer-decorated beads that can be directly used for DEER
experiments. The method is summarized in Figure 6.3.
Figure 6.3: Schematic representation of the production of ER-LBD decorated beads to be used to enrich the heterodimer component of the DEER spectrum.
(d) Initial results
Streptavidin-bead conjugate
Biotinilated ERα-LBD
+
+
Bead decorated with labeled ER heterodimers

160
We cloned, expressed, purified and spin labeled ER-543,530 as previously described.
Figure 6.4 shows the CW-EPR spectra resulting from the doubly labeled mutant. Initial
analysis of the spectrum suggest that it can be easily deconvoluted as a sum of both ER-
530 and ER-543 spectra, suggesting that both sites have been successfully spin labeled
and retain their original conformations. This interpretation is summarized in Figure 6.4.
Currently, we are continuing work with our collaborators at the National High
Magnetic Field Laboratory (NHMFL) in Tallahassee, Florida, to develop a spin dilution
protocol.
Figure 6.4: EPR spectrum of double labeled ER-543,530 (i). EPR spectra of ER-543 (red), ER-530 (green) and result of the addition of the two spectra (dashed) (ii).
3440 3460 3480 3500 3520 3540 3560 3580 3600Magnetic Field (Gauss)

161
6.3 Electrostatic actuation of leucine zipper peptide dimer
(a) Initial results and interpretations
The recent explosion of research in nanotechnology has spurred interest in biologically
inspired nanorobotics,182-184 requiring the development of actuators, joints, motors, and
other machine components on the molecular scale. Because the laws governing their
action may differ substantially from those that govern macroscopic devices, it is
imperative to develop methods to characterize their mechanical properties quantitatively.
In this section we present a preliminary experimental characterization of the action of a
previously proposed design architecture for a novel peptide-based nano-actuator.185-187
The design is based on the α-helical coiled coil leucine zipper portion of the yeast
transcriptional activator GCN4 164 (residues 249-281 of PDB entry 1YSA; hereinafter
GCN4-LZ) which is engineered to obtain an environmentally-responsive device. The
dimeric coiled-coil peptide consists of two identical polypeptide chains ~4.5nm long and
~3nm wide. The actuation mechanism depends on modification of the electrostatic
charges on histidine residues introduced into the peptide, which is achieved by varying
the pH of the solution. Molecular dynamics (MD) calculations have identified specific
amino acid sequences that are predicted to adopt the coiled-coil configuration and to
exhibit reversible opening as a function of ambient pH.185-187
To test the theoretical predictions, peptides were synthesized with a spin label
attached near the N-terminus end open end of each helix, with the objective of forming
the coiled-coil dimer and measuring the distance between the labeled ends by

162
determining the electron spin-spin interaction using electron spin resonance (ESR).166
The TOAC spin label167-169 was selected for this application because of its rigid fused
ring structure, which eliminates motion of the labels relative to the helices, and ensures
that measurements directly reflect the inter-helix distance.
Solid phase peptide synthesis using Fmoc-protection chemistry was performed by
the group of Prof. Gary Lorigan of Miami University (Oxford, OH) on a 433A Peptide
Synthesizer from Applied Biosystems Inc., Foster City, CA. The sequences investigated
are shown in Figure 6.4 together with the structure of the TOAC label. These sequences
were selected based on their Multicoil score165, which indicates the propensity of a
sequence to form a coiled-coil based on the identities of the amino acids in positions a-g of
the coil (cf. Figure 6.4). The control sequence, WT, was constructed as GCN4-LZ with an
N-terminal triglycine added to maintain the same number of residues in all sequences
studied, and to reduce the mobility of the TOAC label167,168,170,171. Sequence M1 is
GCN4-LZ with three histidines at the N-terminus, and M3CT consists of five mutations
of the WT sequence: L253H, K256H, E259H, L261H and Y265H, distributing five
histidines over about half the length of the coil.1 N-terminal trialanine was added to
sequence M3CT to reduce the label mobility. Mutants WT, M1, and M3CT gave average
Multicoil scores of 0.83, 0.92, and 0.93 respectively,188 where a score between 0.5 and 1.0
indicates probable coiled-coil formation. The α-helical content of all samples over the pH
range studied was verified by CD spectroscopy.

163
Figure 6.4: Coiled-coil leucine zipper sequences investigated in this work. Locations of histidine residues substituted into the M1 and M3CT sequences are shown in boldface. Upper right inset: structure of the TOAC spin label. At right is a cartoon of the coiled-coil dimer in its closed conformation, with the TOAC labels explicitly shown.
Figure 6.5 shows CW-EPR spectra from each of the labeled constructs at pH 7.0; the
corresponding spectra at pH 4.0 were effectively identical to these. Whereas the M1
spectrum quite closely resembles that of WT, the M3CT spectrum is considerably
narrower. Dynamic parameters (cf. Fig. 6.5) were obtained by least-squares fitting of the
slow-motional lineshape151,172 with reported magnetic parameters for TOAC.170,173 The
WT and M1 sequences exhibited quite similar anisotropic motion, with the principal
diffusion axis (i.e. the long axis of the dimer) perpendicular to the magnetic x direction
and approximately 30° away from magnetic z, consistent with the direction estimated
from a molecular model. In contrast, the M3CT sample showed much faster and
essentially isotropic motion. These results indicate that M1 most likely forms the same
a
a'
b
b'c
c'
d
d'
e
e'
f f'
g
g'
abcdefg abcdefg abcdefg abcdefg WT GGGXRMKQLEDK VEELLSK NYHLENE VARLKKLVGER M1 HHHXRMKQLEDK VEELLSK NYHLENE VARLKKLVGER M3CT AAAXRMKQHEDH VEHLHSK NHHLENE VARLKKLVGER
ONH
ON
TOAC

164
dimeric structure as the native sequence, whereas M3CT does not form a standard leucine
zipper.
3460 3480 3500 3520 3540 3560 3580
C
B
A
Magnetic Field (Gauss)
Figure 6.5: X-Band CW-EPR spectra of labeled dimers with sequences (A) WT, (B) M1 and (B) M3CT at pH 7.0 and room temperature. Dashed lines show least-squares slow-motional lineshape. Least-squares values of the isotropic rotational diffusion constant R , the rotational anisotropy N, and the βD diffusion tilt were (A) R = 8.7×10⁷ s−1 , N = 95, βD= 25°; (B) R = 4.5×10⁷ s−1 , N = 30, βD= 26°; and (C) R = 1.2×10⁷ s−1, N = 1. Fixed-value parameters in the fits include electronic g-factor (gx, gy, gz) = (2.0085, 2.0056, 2.0020), 14N hyperfine tensor (Ax, Ay , Az) = (21., 9.0, 105) MHz, inhomogeneous Gaussian linewidth 1.9 Gauss, and diffusion tilt angle αD = 90°.

165
Four-pulse double electron-electron resonance (DEER) experiments were performed for
all sequences at pH 4.0 and 7.0 at 65 K. The time domain signals were Fourier-
transformed to give the spectra shown in Figure 6.5 A for each of the sequences studied.
The spectra reflect a frequency distribution given by
( )
3
22210
41cos3
hrgg
πθβμ
ν−
= [6.1]
where g1 and g2 are the isotropic g-factors of each electron, β is the Bohr magneton, μ0 is
vacuum permeability, h is Planck’s constant, r is the interspin distance, and θ is the angle
between the magnetic field and the interspin vector. The spectra exhibit the characteristic
“Pake pattern” with turning points corresponding to θ = 0° and θ = 90° (cf. Eq [6.1]) In
addition, this pattern reflects the distribution of interspin distances r. Figures 6.5 B and
6.5 D shows the distance distribution functions P(r) obtained from the
DEERAnalysis2004 program 189 using a one or two Gaussian distribution model.
The DEER spectrum of WT at pH 7.15 is well described by a single Gaussian
distribution centered at 22 Å, very close to the distance of 23 Å estimated from a
molecular model of the TOAC labeled “closed” zipper conformation (Fig. 6.6). At pH 4.0
a second population appears that can be fit using a Gaussian distribution centered at 36 Å,
corresponding to an open conformation. At pH 7.15, M1 also appears predominantly in
the “closed” configuration (22 Å) with a small population at a longer distance evident in
the Pake pattern At pH = 4.0, most of the population shifts to a second distribution
centered at 43 Å. The DEER spectra of M3CT indicates two components with more open

166
structures than WT or M1 at both pH values, consistent with the result from cw-ESR that
this sequence does not adopt the same coiled-coil structure as the other sequences.
DEER spectra were also analyzed using the model-independent Tikhonov
regularization190. This procedure gave a narrow distribution at 22Å for each of the closed
configuration samples. For M1 at low pH, it gave a broad and somewhat irregular
distribution, consistent with the presence of an open configuration, but difficult to
quantify in terms of open vs. closed populations. To validate our interpretation of the
two-Gaussian model, the relative intensities of the open and closed distributions were
titrated vs. pH, as shown in Fig. 6.6 E. The results are well approximated by a simple
two-state equilibrium model (solid line), suggesting that the two-Gaussian distribution
model is adequate to characterize the state of the device.
Our results clearly demonstrate the possibility of constructing peptide-based
environmentally responsive nanoactuators, and establish the utility of EPR for assessing
the activity of such devices and quantitatively measuring their mechanical properties.
EPR has several key advantages for this application. First, it is uniquely sensitive to the
distance scale that is relevant for the range of motion of such devices. Secondly, it can
measure the full distribution of intramolecular distances, from which such properties as
structural flexibility and actuating force can be measured. Such capabilities will be
critical for the design of nanoscale active devices with targeted functions.

167
pH = 4.0
pH = 7.0
A
pH = 4.0
pH = 7.0
B
-20 0 20
pH = 4.0
pH = 7.0
C
Frequency (MHz)0 2 4 6
pH = 4.0
pH = 7.0
Distance (nm)
D
4 5 6 7 8
0.5
0.6
0.7
0.8
0.9
f clos
ed
pH
Figure 6.6:: DEER results. Rows 1 and 2, WT pH 7 and pH 4. Rows 3 and 4, M1 pH7 and pH 4. Rows 5 and 6 M3pH7 andpH4

168
(b) Difficulties with initial interpretation
Our initial interpretation used normalized DEER spectra as the basis for deriving distance
distribution for the coupled spins. This approximation was justified by the fact that the
sample concentration was kept constant within each pH titration experiment.
Furthermore, the peptide sequence in known to form exclusively coiled-coil dimers in the
pH region tested. This approximation does not affect the validity of the distances
measured at pH 7.0; however, since we are interested in quantifying two different
components (open vs closed conformations), it is important to verify the assumption in
the raw, non-normalized DEER spectra.
We encountered some difficulties reconciling DEER signal intensities when
comparing samples with same spin concentration but different pHs. It appears that as the
pH was titrated from 7 to 4 the DEER signal would increase in intensity. Since the DEER
signal depends on the fraction of coupled spins, the most obvious explanation is that the
amount of spin coupling is increasing at low pH. In other words, if at pH 7 each spin is
interacting with the complementary spin in the coiled-coil dimer, we observe that at
lower pH each spin is interacting with more than one conjugate spin. This is usually the
case with systems undergoing polymerization or aggregation, where more than one
interaction is possible. This hypothesis seems to be supported by a simple test shown in
Figure 6.6, which shows the ratio of the signals from M1 at pH 4 and at pH 7. The result
(curve 3) shows that the modulation due to the short distance is completely removed and
the second component is left unaltered. This implies that the fraction of closed spins does

169
not change, and the additional component is due to a second, pH dependent, population
of interacting spins. Physically this could be explained with peptide tetramers.
Aggregation or polymerization is difficult to rationalize, particularly if we
consider that the peptide become positively charged at low pH and should tend to repel
itself. An alternative explanation is the effect of orientational distribution of the nitroxide
axes with respect to each other. Molecular modeling and our cw-EPR dynamic studies
confirm that the coiled-coil conformation is retained for in the labeled peptide. The
symmetry of the coiled-coil defines precise orientations of the two coupled nitroxides
with respect to each other. The N-O bond axes (e.g. the magnetic x axis) are pointed 180 o
away from each other because of the C2 symmetry of the coiled-coil, and the z axes are
tilted ~30o away from the coiled-coil long axis. As described in Chapter 2, the DEER
signal is acquired by selecting different orientation for pump (x,y) and observe (z)
frequencies. The intensity of the signal depends on the transfer of magnetization between
the two orientations in a system of coupled spins which depends on the orientations of the
two spins with respect to each other. We can think of the spectra as being composed of
two populations of spins: the close one is highly ordered with small spin-coupling
efficiency due to the fixed orientation of the nitroxides, and the open one with a less
ordered interspin orientation and higher coupling efficiency. In this scenario the open
conformation will contribute relatively more to the spectrum intensity.
Currently it is unclear which model better represents the reality of the system.
Other experimental parameters such as cryo-protectants, ionic strength, amino acid
sequence and label position should be explored. Nonetheless, the model and the idea of

170
creating biologically inspired nano-devices that can be controlled is an exciting one and
worth pursuing.
Figure 6.6: Analysis of the raw DEER signal for M1: M1 at pH 7.0 (1), M1 at pH 4.0 (2), result of quotient between curve (2) and curve (1) (from a private communication with Peter Borbat, ACERT, Cornell University, Ithaca, NY).

171
6.4 Initial characterization of 11β spin labeled estradiol
In Chapter 4 we describe the characterization of two spin labeled estradiols using EPR
and fluorescence spectroscopy. The results obtained from that study clearly demonstrate
the utility of an estradiol-nitroxide conjugate that can specifically bind ER and report
details about local environment, structure and binding interaction. The two compounds
described, HO-2105 and HO-2447, can be synthesized using well established techniques
but it is possible to construct SLE with higher affinity by placing the nitroxide derivative
at the 11β position of the estradiol scaffold. Figure 6.7 shows the structure of AH-5-20, a
compound produced by J. Adam Hendricks in Prof. R. Hanson’s laboratory at
Northeastern University, Boston. This compound is expected to bind ER with higher
affinity compared to the 17α or 16 substituted compounds previously described.
O NH O
OH
OHNNHN
N
Figure 6.2: Structure of AH-5-20
An initial characterization of the binding of AH-5-20 to ER-LBD was carried out.
Figure 6.x shows a stacked plot of AH-5-20 in solution (top) and AH-5-20 in the
presence of ER-LBD. The changes observed are characteristic of a decrease in rotation

172
and an increase in the anisotropy of the rotation experienced by the nitroxide probe. This
is consistent with the SLE binding to ER-LBD.
Figure 6.3: cw-EPR spectra of AH-5-25 unbound (top) and bound to ER-LBD (bottom)
3440 3460 3480 3500 3520 3540 3560 3580 3600Magnetic Field (Gauss)

173
Figure 6.9: EPR spectra and lineshape fits (dotted line) for AH-5-20 unbound (i) and bound to ER-LBD (ii). The table summarizes the rotational and magnetic parameters calculated for the two cases. Table 6.1: Lineshape fitting parameters, where the rotation parameters (Rx,y,z) are reported as negative log of the correlation time and the hyperfine values are reported in Gauss. Rotational parameters [-log(τc)] Common magnetic parameter Unbound (i) Bound (ii) g-tensor A-tensor Rx Ry Rz Rx Ry Rz gx gy gz Ax Ay Az 8.9 9.1 8.1 8.68 6.6 7.99 2.009 2.006 2.002 5.3 5.9 37.8
We used NLS lineshape fitting to extract rotational parameters from the EPR
spectra. The results are summarized in Table 1 and are consistent with binding of the SLE
to ER-LBD. In particular, we notice an increase in the anisotropy of the rotation upon
binding that places the fast axis of rotation in the magnetic x direction of the nitroxide.
From these initial results we can conclude that the compound AH-5-20 binding to ER-
LBD and in the bound state the major axis of rotational diffusion is close to N-O bond
axis. Figure 6.11 shows the relevant interaction of estradiol within the binding pocket 37.
The compound AH-5-20 is not expected to disrupt these important interactions.
3440 3460 3480 3500 3520 3540 3560 3580 3600-5
-4
-3
-2
-1
0
1
2
3
4
5 x 10 4
3440 3460 3480 3500 3520 3540 3560 3580 3600-3
-2
-1
0
1
2
3x 10⁴
(i) (ii)

174
Figure 6.10: Coordination of estradiol within the binding cavity; the fast rotation axis of the nitroxide is depicted along the N-O bond in accordance with NLS fitting results.
6.5 Challenges
All the experiments described in this thesis require optimization of a number of
parameters. The next sections summarize some of the most crucial and challenging
obstacles faced.
(a) ER stability
Estrogen Receptor is normally found associated with HSP90 when unactivated by ligand
binding. This suggests that the receptor protein might be prone to unfolding or
aggregation. During the course of this study one of the major hurdles has been to
combine high protein yield with production of active protein. It was noted early on, that a
large amount of expressed protein would be lost to inclusion bodies. In order to minimize
these losses, several induction and extraction conditions were explored. IPTG
H2O
O N H O
O H
OHN
N H N
N
Glu 535 Arg 394
His 524

175
concentration and induction time were adjusted to reduce the level of overexpression.
This helped to increase the concentration of soluble protein fraction at extraction.
The extraction condition was also optimized. We found that the commercially
available extraction buffer, CellLyticX (Sigma), would have to be diluted at least 10X in
order to prevent solubilization of inactive protein.
Purification was greatly aided by selection of a His-tagged plasmid construct. We
found that cold room conditions were necessary to prevent losses due to aggregation.
Considerable precipitation was usually found after the first purification step with Ni-NTA
resin. Closer examination of the pellet by SDS-PAGE shows enrichment of contaminants
compared to the soluble fraction. This prompted the addition of a second cation exchange
purification step that removed the remaining impurities. This procedure also seemed to
improve stability and receptor activity as measured by [3H]estradiol binding.
(b) ER activity assay
The most common assay of estradiol binding is [3H]estradiol binding. In the course of
this study we produced at least one ER-LBD mutant (ER-543) that was not previously
described and therefore needed to be characterized to establish retention of binding
affinity. The assay consists in measuring the bound [3H]estradiol as a function of protein
concentration. The bound radio labeled estradiol is separated from the unbound by adding
a slurry of Dextran coated charcoal to the reaction mixture. The charcoal binds the free
estradiol and is usually separated from the bound estradiol by centrifugation or filtration.
Our attempts to establish the same protocol in-house were unsuccessful. One of the
obstacles encountered was the lack of a dedicated centrifuge for radioactive samples.

176
This limited our options to using filtration in order to separate the charcoal from the
protein mixture. We found that the protein would not filter efficiently through the
membrane and therefore it was impossible to estimate a binding curve. Future attempts
should include use a dedicated centrifuge that has the advantage of decreasing the cost of
analysis and the technical difficulty of the procedure.
6.6 Broader Impact
The results provided here demonstrate how measuring protein flexibility by
SDSL-EPR can significantly enrich the static picture of ligand-receptor interaction
available from crystal structures and more generally add details to the response of protein
conformation to external stimuli. During the course of this thesis we have examined local
changes in dynamics and structure of ER in response to ligand and allosteric binding. We
have also looked at new ways to probe structural flexibility using SLE that offer for the
first time a tool for establishing the dynamics of ligands within a receptor’s binding
pocket. These investigations provide the first quantitative solution structure
measurements for ER-LBD. Although the mean distance constraints derived from DEER
results match well with crystal structures, our measurements add an important new level
to the emerging picture of ligand induced structural remodeling that was previously
unavailable. Based on these results we were able to formulate a new theory of receptor-
ligand interaction for NRs that involved successive levels of structural remodeling that
directly regulate biological action. The broader impact of this work goes beyond
understanding a general model of ligand-receptor interactions; in fact, the results suggest
new pharmacological avenues that can be used to target aberrant NR behavior. The strong

177
effect of allosteric interaction described in Chapter 3 points to this step as being
necessary to direct the biological response of NR. In this respect, it would be desirable to
design compounds that specifically disrupt this interaction such as the peptide-mimetic
compounds being developed in Prof. Hanson’s laboratory. The potential advantage of
such an approach is in being able to target specific pathways of ER action while allowing
the normal functioning to continue undisturbed. Our direct evaluation of allosteric
binding using SDSL-EPR would offer a unique tool to establish the structural effect of
coregulator binding to ER.
The central topic of structural flexibility is an integral part of how receptors and
ligands interact. In Chapter 4 we described some very unique spin labeled estrogens that
introduce a nitroxide directly into the ER’s binding pocket. In addition to being useful
reporters of ligand interaction, we used these probes as structural tool by looking at the
distance distribution occurring between the ER dimers. The initial results reported here
offer an interesting glimpse into some future applications of spin labeled estradiols.
These compounds can be used as ER selective relaxing agents for MRI applications
where estrogen responsive breast cancer cells need to be visualized. SLE also will prove
important for future investigation of ER structure, in fact, the emerging technique of spin
enhanced NMR can be used to elucidate structural folds of the ligand-receptor complex.
Our investigation also looked at effects of environmental factors on structural
flexibility. We looked at hydrophobic mismatch using CB1-TM7 as a model and
electrostatic effects using leucine zipper peptide dimer. In both case we found order-
disorder transitions than can be directly quantified by both CW-EPR and DEER

178
spectroscopy. Taken together, the approaches described in this work are significant in the
way that elements from traditionally separate disciplines such as medicinal chemistry,
magnetic resonance and physical chemistry have been combined to answer specific
questions that are not easily accessible by conventional methods. In this light, the major
impact of this work is the coming together of several philosophies of scientific inquiry,
with the common goal of measuring experimentally protein flexibility.

179
References (1) Bain, D. L.; Heneghan, A. F.; Connaghan-Jones, K. D.; Miura, M. T. Annu Rev
Physiol 2007, 69, 201-20.
(2) Trotter, K. W.; Archer, T. K. Molecular and Cellular Endocrinology 2007, 265, 162-167.
(3) Reschly, E. J.; Iyer, M.; Krasowski, M. D.; Venkataramanan, R. Drug Metabolism Reviews 2006, 38, 223-224.
(4) Laudet, V. Acta Pharmacologica Sinica 2006, 27, 19-19.
(5) Tabe, Y.; Konopleva, M.; Kondo, Y.; Contractor, R.; Tsao, T.; Konoplev, S.; Shi, Y.; Ling, X.; Watt, J. C.; Tsutsumi-Ishii, Y.; Ohsaka, A.; Nagaoka, I.; Issa, J. P.; Kogan, S. C.; Andreeff, M. Cancer Biol Ther 2007, 6, 1967-77.
(6) Okazuka, K.; Masuko, M.; Seki, Y.; Hama, H.; Honma, N.; Furukawa, T.; Toba, K.; Kishi, K.; Aizawa, Y. Int J Hematol 2007, 86, 246-9.
(7) Zheng, X.; Seshire, A.; Ruster, B.; Bug, G.; Beissert, T.; Puccetti, E.; Hoelzer, D.; Henschler, R.; Ruthardt, M. Haematologica 2007, 92, 323-31.
(8) McPhaul, M. J. Best Pract Res Clin Endocrinol Metab 2008, 22, 373-88.
(9) Perez-Martinez, F. C.; Alonso, V.; Sarasa, J. L.; Manzarbeitia, F.; Vela-Navarrete, R.; Calahorra, F. J.; Esbrit, P. Histol Histopathol 2008, 23, 709-15.
(10) Cutress, M. L.; Whitaker, H. C.; Mills, I. G.; Stewart, M.; Neal, D. E. J Cell Sci 2008, 121, 957-68.
(11) Khan, M. N.; Khan, A. A. Curr Oncol 2008, 15, S30-40.
(12) Ingraham, B. A.; Bragdon, B.; Nohe, A. Curr Med Res Opin 2008, 24, 139-49.
(13) Green S; Walter P; Kumar V Nature 1986, 320, 134-139.
(14) Hess, R. A.; Gist, D. H.; Bunick, D.; Lubahn, D. B.; Farrell, A.; Bahr, J.; Cooke, P. S.; Greene, G. L. Journal of Andrology 1997, 18, 602-611.
(15) Katzenellenbogen, J. A.; O'Malley, B. W.; Katzenellenbogen, B. S. Mol Endocrinol 1996, 10, 119-31.
(16) Pike, A. C. W.; Brzozowski, A. M.; Hubbard, R. E.; Bonn, T.; Thorsell, A.-G.; Engstrom, O.; Ljunggren, J.; Gustafsson, J.-A.; Carlquist, M. EMBO Journal 1999, 18, 4608-4618.
(17) Pike, A. C. W.; Brzozowski, A. M.; Walton, J.; Hubbard, R. E.; Thorsell, A.-G.; Li, Y.-L.; Gustafsson, J.-A.; Carlquist, M. Structure (Cambridge, MA, United States) 2001, 9, 145-153.
(18) Jensen, E. V. Perspect Biol Med 1962, 6, 47-59.

180
(19) Howell, A.; Robertson, J. F. R.; Quaresma Albano, J.; Aschermannova, A.; Mauriac, L.; Kleeberg, U. R.; Vergote, I.; Erikstein, B.; Webster, A.; Morris, C. J Clin Oncol FIELD Full Journal Title:Journal of clinical oncology : official journal of the American Society of Clinical Oncology 2002, 20, 3396-403.
(20) Shiau, A. K.; Barstad, D.; Loria, P. M.; Cheng, L.; Kushner, P. J.; Agard, D. A.; Greene, G. L. Cell 1998, 95, 927-937.
(21) Hubbell, W. L.; McHaourab, H. S.; Altenbach, C.; Lietzow, M. A. Structure (London) 1996, 4, 779-783.
(22) Budil, D. E.; Kolaczkowski, S. V.; Perry, A.; Varaprasad, C.; Johnson, F.; Strauss, P. R. Biophysical Journal 2000, 78, 430-438.
(23) Khairy, K.; Budil, D.; Fajer, P. Journal of Magnetic Resonance 2006, 183, 152-159.
(24) Tombolato, F.; Ferrarini, A.; Freed, J. H. J Phys Chem B 2006, 110, 26260-71.
(25) Tombolato, F.; Ferrarini, A.; Freed, J. H. J Phys Chem B 2006, 110, 26248-59.
(26) Columbus, L.; Hubbell, W. L. Trends in Biochemical Sciences 2002, 27, 288-295.
(27) Columbus, L.; Hubbell, W. L. Biophysical Journal 2002, 82, 24a-24a.
(28) Sale, K.; Song, L.; Liu, Y. S.; Perozo, E.; Fajer, P. J Am Chem Soc 2005, 127, 9334-5.
(29) Banham, J. E.; Baker, C. M.; Ceola, S.; Day, I. J.; Grant, G. H.; Groenen, E. J. J.; Rodgers, C. T.; Jeschke, G.; Timmel, C. R. Journal of Magnetic Resonance 2008, 191, 202-218.
(30) Pannier, M.; Veit, S.; Godt, A.; Jeschke, G.; Spiess, H. W. Journal of Magnetic Resonance 2000, 142, 331-340.
(31) Rabenstein, M. D.; Shin, Y. K. Proceedings of the National Academy of Sciences of the United States of America 1995, 92, 8239-8243.
(32) Germain, P.; Altucci, L.; Bourguet, W.; Rochette-Egly, C.; Gronemeyer, H. Pure and Applied Chemistry 2003, 75, 1619-1664.
(33) Gronemeyer, H.; Gustafsson, J. A.; Laudet, V. Nature Reviews Drug Discovery 2004, 3, 950-964.
(34) Zhang, J. X.; Labaree, D. C.; Hochberg, R. B. Journal of Medicinal Chemistry 2005, 48, 1428-1447.
(35) Hanson, R. N.; Napolitano, E.; Fiaschi, R. Journal of Medicinal Chemistry 1998, 41, 4686-4692.
(36) Zhang, J. X.; Labaree, D. C.; Mor, G.; Hochberg, R. B. Journal of Clinical Endocrinology and Metabolism 2004, 89, 3527-3535.

181
(37) Celik, L.; Lund, J. D. D.; Schiott, B. Biochemistry 2007, 46, 1743-1758.
(38) Ozers, M. S.; Ervin, K. M.; Steffen, C. L.; Fronczak, J. A.; Lebakken, C. S.; Carnahan, K. A.; Lowery, R. G.; Burke, T. J. Molecular Endocrinology 2005, 19, 25-34.
(39) Kato, S.; Sato, T.; Watanabe, T.; Takemasa, S.; Masuhiro, Y.; Ohtake, F.; Matsumoto, T. Cancer Chemother Pharmacol 2005, 56 Suppl 1, 4-9.
(40) Tenbaum, S.; Baniahmad, A. Int J Biochem Cell Biol 1997, 29, 1325-41.
(41) Eiler, S.; Gangloff, M.; Duclaud, S.; Moras, D.; Ruff, M. Protein Expression and Purification 2001, 22, 165-173.
(42) Hegy, G. B.; Shackleton, C. H. L.; Carlquist, M.; Bonn, T.; Engstrom, O.; Sjoholm, P.; Witkowska, H. E. Steroids 1996, 61, 367-373.
(43) Nilsson, S.; Makela, S.; Treuter, E.; Tujague, M.; Thomsen, J.; Andersson, G.; Enmark, E.; Pettersson, K.; Warner, M.; Gustafsson, J.-A. Physiological Reviews 2001, 81, 1535-1565.
(44) Russo, I. H.; Russo, J. Journal of Mammary Gland Biology and Neoplasia 1998, 3, 49-61.
(45) Pujol, P.; Rey, J. M.; Nirde, P.; Roger, P.; Gastaldi, M.; Laffargue, F.; Rochefort, H.; Maudelonde, T. Cancer Research 1998, 58, 5367-5373.
(46) Feigelson, H. S.; Henderson, B. E. Carcinogenesis 1996, 17, 2279-2284.
(47) Toft D.; J., G. Proceedings of the National Academy of Sciences of the United States of America 1966, 55, 1574-1581.
(48) Tanenbaum, D. M.; Wang, Y.; Williams, S. P.; Sigler, P. B. Proceedings of the National Academy of Sciences of the United States of America 1998, 95, 5998-6003.
(49) Warnmark, A.; Treuter, E.; Gustafsson, J. A.; Hubbard, R. E.; Brzozowski, A. M.; Pike, A. C. W. Journal of Biological Chemistry 2002, 277, 21862-21868.
(50) Shang, Y.; Brown, M. Science (Washington, DC, United States) 2002, 295, 2465-2468.
(51) Nettles, K. W.; Greene, G. L. Annual Review of Physiology 2005, 67, 309-333.
(52) Tamrazi, A.; Carlson, K. E.; Rodriguez, A. L.; Katzenellenbogen, J. A. Molecular Endocrinology 2005, 19, 1516-1528.
(53) Tamrazi, A.; Carlson Kathryn, E.; Katzenellenbogen John, A. Mol Endocrinol FIELD Full Journal Title:Molecular endocrinology (Baltimore, Md.) 2003, 17, 2593-602.

182
(54) Hubbell, W. L.; Cafiso, D. S.; Altenbach, C. Nature Structural Biology 2000, 7, 735-739.
(55) Hanson, R. N.; Napolitano, E.; Fiaschi, R. J Med Chem 1990, 33, 3155-60.
(56) Loozen, H. J. J.; Schoonen, W. G. E. J. PCT Int. Appl. 2000, 24pp.
(57) Jin, L.; Borras, M.; Lacroix, M.; Legros, N.; Leclercq, G. Steroids 1995, 60, 512-8.
(58) Wakeling, A. E.; Dukes, M.; Bowler, J. Cancer Res 1991, 51, 3867-73.
(59) Carlson, K. E.; Choi, I.; Gee, A.; Katzenellenbogen, B. S.; Katzenellenbogen, J. A. Biochemistry 1997, 36, 14897-14905.
(60) Katzenellenbogen, J. A.; Heiman, D. F.; Carlson, K. E.; Lloyd, J. E. Recept.-Binding Radiotracers 1982, 1, 93-126.
(61) Brown, L. J.; Sale, K. L.; Hills, R.; Rouviere, C.; Song, L. K.; Zhang, X. J.; Fajer, P. G. Proceedings of the National Academy of Sciences of the United States of America 2002, 99, 12765-12770.
(62) Sen, K. I.; Logan, T. M.; Fajer, P. G. Biochemistry 2007, 46, 11639-11649.
(63) Fajer, P. G.; Gyimesi, M.; Malnasi-Csizmadia, A.; Bagshaw, C. R.; Sen, K. I.; Song, L. K. Journal of Physics-Condensed Matter 2007, 19, -.
(64) Hurth, K. M.; Nilges, M. J.; Carlson, K. E.; Tamrazi, A.; Belford, R. L.; Katzenellenbogen, J. A. Biochemistry 2004, 43, 1891-1907.
(65) Muller, F.; Grande, H. J.; Harding, L. J.; Dunham, W. R.; Visser, A. J.; Reinders, J. H.; Hemmerich, P.; Ehrenberg, A. Eur J Biochem FIELD Full Journal Title:European journal of biochemistry / FEBS 1981, 116, 17-25.
(66) Dai, S. Y.; Chalmers, M. J.; Bruning, J.; Bramlett, K. S.; Osborne, H. E.; Montrose-Rafizadeh, C.; Barr, R. J.; Wang, Y.; Wang, M. M.; Burris, T. P.; Dodge, J. A.; Griffin, P. R. Proceedings of the National Academy of Sciences of the United States of America 2008, 105, 7171-7176.
(67) Tamrazi, A.; Katzenellenbogen, J. A. Methods in Enzymology 2003, 364, 37-53.
(68) Uppenberg, J.; Svensson, C.; Jaki, M.; Bertilsson, G.; Jendeberg, L.; Berkenstam, A. J Biol Chem 1998, 273, 31108-12.
(69) Gee, A. C.; Katzenellenbogen, J. A. Molecular Endocrinology 2001, 15, 421-428.
(70) Johnson, B. A.; Wilson, E. M.; Li, Y.; Moller, D. E.; Smith, R. G.; Zhou, G. J Mol Biol 2000, 298, 187-94.
(71) Russo, J.; Russo, I. H. Innovative Endocrinology of Cancer 2008, 630, 52-56.
(72) Russo, J.; Russo, I. H. Journal of Steroid Biochemistry and Molecular Biology 2006, 102, 89-96.

183
(73) Linsalata, M.; Messa, C.; Russo, F.; Cavallini, A.; Dileo, A. Scandinavian Journal of Gastroenterology 1994, 29, 67-70.
(74) Bartella, V.; Cascio, S.; Fiorio, E.; Auriemma, A.; Russo, A.; Surmacz, E. Cancer Research 2008, 68, 4919-4927.
(75) Kuiper, G. G. J. M.; Carlsson, B.; Grandien, K.; Enmark, E.; Haggblad, J.; Nilsson, S.; Gustafsson, J. A. Endocrinology 1997, 138, 863-870.
(76) Jaouen, G.; Vessieres, A.; Butler, I. S. Accounts of Chemical Research 1993, 26, 361-369.
(77) Lo, K. K. W.; Lee, T. K. M.; Lau, J. S. Y.; Poon, W. L.; Cheng, S. H. Inorganic Chemistry 2008, 47, 200-208.
(78) Van de Wiele, C.; De Vos, F.; Slegers, G.; Van Belle, S.; Dierckx, R. A. Eur J Nucl Med 2000, 27, 1421-33.
(79) Guengerich, F. P. Life Sci 1990, 47, 1981-8.
(80) Sar, C. P.; Jeko, J.; Fajer, P.; Hideg, K. Synthesis 1999, 1039-1045.
(81) Mitsui, M.; Kobori, Y.; Kawai, A.; Obi, K. Journal of Physical Chemistry A 2004, 108, 524-531.
(82) Venanzi, M.; Gatto, E.; Bocchinfuso, G.; Palleschi, A.; Stella, L.; Baldini, C.; Formaggio, F.; Toniolo, C. Journal of Physical Chemistry B 2006, 110, 22834-22841.
(83) Meshalkin, Y. P.; Cherkasova, O. P.; Fedorov, V. I.; Samoilova, E. S. Optics and Spectroscopy 2002, 92, 32-35.
(84) Karunakaran, S. Y.; Thomas, T. J.; Thomas, T. Biophysical Journal 2004, 86, 497a-497a.
(85) Zhu, P. Z.; Clamme, J. P.; Deniz, A. A. Biophysical Journal 2005, 89, L37-L39.
(86) Fajer, P. G. Journal of Physics-Condensed Matter 2005, 17, S1459-S1469.
(87) Tamrazi, A.; Katzenellenbogen, J. A. Nucelar Receptors 2003, 364, 37-53.
(88) Aiello, E. J.; Buist, D. S. M.; Wagner, E. H.; Tuzzio, L.; Greene, S. M.; Lamerato, L. E.; Field, T. S.; Herrinton, L. J.; Haque, R.; Hart, G.; Bischoff, K. J.; Geiger, A. M. Breast Cancer Research and Treatment 2008, 107, 397-403.
(89) Waring, R. H.; Ayers, S.; Gescher, A. J.; Glatt, H. R.; Meinl, W.; Jarratt, P.; Kirk, C. J.; Pettitt, T.; Rea, D.; Harris, R. M. J Steroid Biochem Mol Biol 2008, 108, 213-20.
(90) Cascio, C.; Russo, D.; Drago, G.; Gaizzi, G.; Passantino, R.; Guarneri, R.; Guarneri, P. Experimental Eye Research 2007, 85, 166-172.
(91) Goldzieher, J. W. Am J Obstet Gynecol 1990, 163, 318-22.

184
(92) Russo, J.; Lareef, A. H.; Balogh, G.; Guo, S.; Russo, I. H. Journal of Steroid Biochemistry and Molecular Biology 2003, 87, 1-25.
(93) De Rosa, F. S.; Bentley, M. V. Pharm Res 2000, 17, 1447-55.
(94) Ackroyd, R.; Kelty, C.; Brown, N.; Reed, M. Photochem Photobiol 2001, 74, 656-69.
(95) Stilts, C. E.; Nelen, M. I.; Hilmey, D. G.; Davies, S. R.; Gollnick, S. O.; Oseroff, A. R.; Gibson, S. L.; Hilf, R.; Detty, M. R. J Med Chem 2000, 43, 2403-10.
(96) Nygren, J.; Svanvik, N.; Kubista, M. Biopolymers 1998, 46, 39-51.
(97) Carreon, J. R., Boston College, 2006.
(98) Hideg, E., Spetea, Cornelia, and Imre Vass Photosynthesis Research 1994, 39, 191-199.
(99) Zang, L. Y.; Misra, B. R.; van Kuijk, F. J.; Misra, H. P. Biochem Mol Biol Int 1995, 37, 1187-95.
(100) Lion, Y.; Delmelle, M.; van de Vorst, A. Nature 1976, 263, 442-3.
(101) Moan, J.; Wold, E. Nature 1979, 279, 450-1.
(102) Hideg, E.; Vass, I.; Kalai, T.; Hideg, K. Methods Enzymol 2000, 319, 77-85.
(103) Minneman, K. P. Mol Interv 2001, 1, 108-16.
(104) Mukhopadhyay, S.; Howlett, A. C. Eur. J. Biochem. 2001, 268, 499-505.
(105) Palczewski, K.; Kumasaka, T.; Hori, T.; Behnke, C. A.; Motoshima, H.; Fox, B. A.; Le Tong, I.; Teller, D. C.; Okada, T.; Stenkamp, R. E.; Yamamoto, M.; Miyano, M. Science 2000, 289, 739-745.
(106) Seifert, R.; Wenzel-Seifert, K. Naunyn Schmiedebergs Arch Pharmacol 2002, 366, 381-416.
(107) Matsuda, L. A. Crit Rev Neurobiol 1997, 11, 143-66.
(108) Munro, S.; Thomas, K. L.; Abu-Shaar, M. Nature 1993, 365, 61-5.
(109) Wise, A.; Gearing, K.; Rees, S. Drug Discov Today 2002, 7, 235-46.
(110) Gudi, S.; Nolan, J. P.; Frangos, J. A. Proc Natl Acad Sci U S A 1998, 95, 2515-9.
(111) Shi, L.; Liapakis, G.; Xu, R.; Guarnieri, F.; Ballesteros, J. A.; Javitch, J. A. J. Biol. Chem. 2002, 277, 40989-96.
(112) Yao, X.; Parnot, C.; Deupi, X.; Ratnala, V. R.; Swaminath, G.; Farrens, D.; Kobilka, B. Nat. Chem. Biol. 2006, 2, 417-22.
(113) Lee, A. G. Biochim Biophys Acta 2004, 1666, 62-87.
(114) Matsuda, L. A.; Bonner, T. I.; Lolait, S. J. NIDA Res Monogr 1992, 126, 48-56.

185
(115) Herkenham, M. Ann N Y Acad Sci 1992, 654, 19-32.
(116) Tsou, K.; Brown, S.; Sanudo-Pena, M. C.; Mackie, K.; Walker, J. M. Neuroscience 1998, 83, 393-411.
(117) Gilchrist, A. Trends Pharmacol Sci 2007, 28, 431-7.
(118) Gilchrist, A.; Blackmer, T. Curr Opin Drug Discov Devel 2007, 10, 446-51.
(119) Cullis, P. R.; de Kruijff, B. Biochem. Biophys. Acta 1979, 559, 328-339.
(120) Leterrier, C.; Bonnard, D.; Carrel, D.; Rossier, J.; Lenkei, Z. J. Biol. Chem. 2004, 279, 36013-36021.
(121) Chachisvilis, M.; Zhang, Y. L.; Frangos, J. A. Proc. Natl. Acad. Sci. USA 2006, 103, 15463-8.
(122) Tiburu, E. K.; Karp, E. S.; Birrane, G.; Struppe, J. O.; Chu, S.; Lorigan, G. A.; Avraham, S.; Avraham, H. K. Biochemistry 2006, 45, 7356-65.
(123) Opella, S. J. Nat. Struct. Biol. 1997, 4, 845-848.
(124) Pines, A.; Gibby, M.; Waugh, J. S. J. Chem. Phys. 1973, 59, 569-590.
(125) Porcelli, F.; Buck, B.; Lee, D. K.; Hallock, K. J.; Ramamoorthy, A.; Veglia, G. J. Biol. Chem. 2004, 270, 45815-45823.
(126) van der Wel, P. C.; Strandberg, E.; Killian, J. A.; Koeppe, R. E., 2nd Biophys J 2002, 83, 1479-88.
(127) Lee, K. C.; Cross, T. A. Biophys J 1994, 66, 1380-7.
(128) Jones, D. H.; Rigby, A. C.; Barber, K. R.; Grant, C. W. Biochemistry 1997, 36, 12616-24.
(129) Strandberg, E.; Ozdirekcan, S.; Rijkers, D. T. S.; van der Wel, P. C. A.; Koeppe II, R. E.; Liskamp, R. M. J.; Killian, J. A. Biophys. J. 2004, 86, 37093721.
(130) Cross, T. A. Methods. Enzymol. 1997, 289, 672-696.
(131) Cross, T. A.; Opella, S. J. Curr. Opin. Struct. Biol. 1994, 4, 574-581.
(132) Altenbach, C.; Cai, K.; Klein-Seetharaman, J.; Khorana, H. G.; Hubbell, W. L. Biochemistry 2001, 40, 15483-92.
(133) Altenbach, C.; Klein-Seetharaman, J.; Cai, K.; Khorana, H. G.; Hubbell, W. L. Biochemistry 2001, 40, 15493-500.
(134) Columbus, L.; Hubbell, W. L. Trends Biochem. Sci. 2002, 27, 288-95.
(135) Inbaraj, J. J.; Laryukhin, M.; Lorigan, G. A. J Am Chem Soc 2007, 129, 7710-1.
(136) Columbus, L.; Hubbell, W. L. Biochemistry 2004, 43, 7273-87.
(137) Jeschke, G.; Polyhach, Y. Phys Chem Chem Phys 2007, 9, 1895-910.

186
(138) Rabenstein, M. D.; Shin, Y. K. Proc Natl Acad Sci U S A 1995, 92, 8239-43.
(139) Bramblett, R. D.; Panu, A. M.; Ballesteros, J. A.; Reggio, P. H. Life Science 1995, 56, 1971-1982.
(140) Opella, S. J.; Stewart, P. L. Methods in Enzymology 1989, 179, 242-275.
(141) Makriyannis, A.; Banijamali, A.; Van der Schyf, C.; Jarrell, H. NIDA Research Monograph 1987, 79, 123-133.
(142) Tiburu, E. K.; Karp, E. S.; Birrane, G.; Struppe, J. O.; Chu, S.; Lorigan, G. A.; Avraham, S.; Avraham, H. K. Biochemistry 2006, 45, 7356-7365.
(143) Dave, P. C.; Tiburu, E. K.; Damodaran, K.; Lorigan, G. A. Biophys. J. 2004, 86, 1564-1573.
(144) Marassi, F. M.; Opella, S. J. Current Opinion in Structural Biology 1998, 8, 640-648.
(145) Ketchem, R. R.; Hu, W.; Cross, T. A. Science 1993, 261, 1457-1460.
(146) Hallock, K. J.; Lee, D. K.; Ramamoorthy, A. Biophysical Journal 2003, 84, 3052-3060.
(147) Whiles, J. A.; Glover, K. J.; Vold, R. R.; Komives, E. A. J. Magn. Reson. 2002, 158, 149-156.
(148) Whiles, J. A.; Brasseur, R.; Glover, K. J.; Melacini, G.; Komives, E. A.; Vold, R. R. Biophys. J. 2001, 80, 280-293.
(149) Jones, D. H.; Barber, K. R.; VanDerLoo, E. W.; Grant, W. M. Biochemistry 1998, 37, 16780-16787.
(150) Fajer, P. G. 2000, R. Meyers, ed. Wiley, and Sons, London.
(151) Budil, D. E.; Lee, S.; Saxena, S.; Freed, J. H. J. Magn. Reson., Ser. A 1996, 120, 155-189.
(152) Berliner, L.; Eaton, S.; Eaton, G. Distance Measurements in Biological Systems by EPR; Kluwer: Dordrecht, 2001; Vol. 19.
(153) Gullingsrud J.; Schulten, K. Biophys. J. 2004, 86, 3496 –3509. .
(154) Leterrier, C.; Laine, J.; Darmon, M.; Boudin, H.; Rossier, J.; Lenkei, Z. J Neurosci 2006, 26, 3141-53.
(155) Ulijn, R. V.; Smith, A. M. Chemical Society Reviews 2008, 37, 664-675.
(156) Zimenkov, Y.; Conticello, V. P.; Guo, L.; Thiyagarajan, P. Tetrahedron 2004, 60, 7237-7246.
(157) Ryadnov, M. G.; Woolfson, D. N. Nature Materials 2003, 2, 329-332.

187
(158) Pandya, M. J.; Spooner, G. M.; Sunde, M.; Thorpe, J. R.; Rodger, A.; Woolfson, D. N. Biochemistry 2000, 39, 8728-34.
(159) Ogihara, N. L.; Ghirlanda, G.; Bryson, J. W.; Gingery, M.; DeGrado, W. F.; Eisenberg, D. Proc Natl Acad Sci U S A 2001, 98, 1404-9.
(160) Papapostolou, D.; Bromley, E. H.; Bano, C.; Woolfson, D. N. J Am Chem Soc 2008, 130, 5124-30.
(161) Apgar, J. R.; Gutwin, K. N.; Keating, A. E. Proteins-Structure Function and Bioinformatics 2008, 72, 1048-1065.
(162) Grigoryan, G.; Keating, A. E. Journal of Molecular Biology 2006, 355, 1125-1142.
(163) Wagner, D. E.; Phillips, C. L.; Ali, W. M.; Nybakken, G. E.; Crawford, E. D.; Schwab, A. D.; Smith, W. F.; Fairman, R. Proc Natl Acad Sci U S A 2005, 102, 12656-61.
(164) Ellenberger, T. E.; Brandl, C. J.; Struhl, K.; Harrison, S. C. Cell 1992, 71, 1223-1237.
(165) Wolf, E.; Kim, P. S.; Berger, B. Protein Science 1997, 6, 1179-1189.
(166) Eaton, S. S.; Eaton, G. R. Distance Measurements in Biological Systems by EPR; Academic/Plenum Publishers: New York, 2000; Vol. 19.
(167) Hanson, M. P.; Martinez, G. V.; Millhauser, G. L.; Formaggio, F.; Crisma, M.; Toniolo, C.; Vita, C. Pept.: Chem., Struct. Biol., Proc. Am. Pept. Symp., 14th 1996, 533-534.
(168) Hanson, P.; Anderson, D. J.; Martinez, G.; Millhauser, G.; Formaggio, F.; Crisma, M.; Toniolo, C.; Vita, C. Mol. Phys. 1998, 95, 957-966.
(169) Toniolo, C.; Valente, E.; Formaggio, F.; Crisma, M.; Pilloni, G.; Corvaja, C.; Toffoletti, A.; Martinez, G. V.; Hanson, M. P.; Millhauser, G. L.; et al. J Pept Sci 1995, 1, 45-57.
(170) Inbaraj, J. J.; Cardon, T. B.; Laryukhin, M.; Grosser, S. M.; Lorigan, G. A. J Am Chem Soc. 2006 128, 9549-9554.
(171) Inbaraj, J. J.; Laryukhin, M.; Lorigan, G. A. Journal of the American Chemical Society 2007, 129, 7710-7711.
(172) Budil, D. E.; Earle, K. A. In Advanced ESR Methods in Polymer Chemistry; Schlick, S., Ed.; John Wiley & Sons: New York, 2006, p 53-83.
(173) Nesmelov, Y. E.; Karim, C. B.; Song, L.; Fajer, P. G.; Thomas, D. D. Biophysical Journal 2007, 93, 2805-2812.
(174) Jeschke, G.; Panek, G.; Godt, A.; Bender, A.; Paulsen, H. Appl. Magn. Reson. 2004, 26, 223-244.

188
(175) Darve, E.; Pohorille, A. Journal of Chemical Physics 2001, 115, 9169-9183.
(176) Otter, W. K. D.; Briels, W. J. Molecular Physics 2000, 98, 773-781.
(177) Samorì, B.; Zuccheri, G.; Baschieri, R. Chemphyschem. 2005, 6, 29-34.
(178) Mchaourab, H. S.; Kalai, T.; Hideg, K.; Hubbell, W. L. Biochemistry 1999, 38, 2947-2955.
(179) Losel, R. M.; Philipp, R.; Kalai, T.; Hideg, K.; Trommer, W. Bioconjugate Chemistry 1999, 10, 578-582.
(180) Simon, S. M.; Sousa, F. J.; Mohana-Borges, R.; Walker, G. C. Proc Natl Acad Sci U S A 2008, 105, 1152-7.
(181) Beuning, P. J.; Simon, S. M.; Zemla, A.; Barsky, D.; Walker, G. C. J Biol Chem 2006, 281, 9633-40.
(182) Mirkin, C. A.; Niemeyer, C. M. Nanobiotechnology II; Wiley -VCH Verlag GmbH & Co.: Weinheim, 2007.
(183) Ummat, A.; Dubey, A.; Mavroidis, C. In CRC Handbook on Biomimetics: Mimicking and Inspiration of Biology; Bar-Cohen, Y., Ed.; CRC Press: Boca Raton, Fl, 2004.
(184) Ummat, A.; Dubey, A.; Sharma, G.; Mavroidis, C. In The Biomedical Engineering Handbook; 3rd ed.; Yarmush, M. L., Ed.; CRC Press: Boca Raton, Fl, 2004.
(185) Sharma, G., Northeastern University, 2007.
(186) Sharma, G.; Rege, K.; Budil, D. E.; Yarmush, M. L.; Mavroidis, C. International Journal of Robotics Research 2008, submitted.
(187) Sharma, G.; Rege, K.; Budil, D. E.; Yarmush, M. L.; Mavroidis, C. Nanotechnology 2008, submitted
(188) Wolf, E.; Kim, P. S.; Berger, B. 1997; Vol. 2008.
(189) Jeschke, G.; Panek, G.; Godt, A.; Bender, A.; Paulsen, H. Appl. Magn. Reson. 2004, 26, 223-244.
(190) Chiang, Y.-W.; Borbat, P. P.; Freed, J. H. Journal of Magnetic Resonance 2005, 172, 279-295.