eport onsultant raft - harvard university · pdf filearray of sources and to assess the...
TRANSCRIPT

THE STATE OF DEMAND RESPONSE IN CALIFORNIA
Prepared For:
California Energy Commission
Prepared By: Ahmad Faruqui and Ryan Hledik The Brattle Group
DR
AFT
CO
NSU
LTA
NT
REP
OR
T
April 2007
CEC-200-2007-003-D


Prepared By: The Brattle Group Ahmad Faruqui and Ryan Hledik San Francisco, California Contract No.700-05-002 Prepared For: California Energy Commission David Hungerford Project Manager Sylvia Bender Manager Demand Analysis Office Scott W. Matthews Deputy Director Energy Analysis Division B.B Blevins Executive Director
DISCLAIMER This report was prepared as the result of work sponsored by the
California Energy Commission. It does not necessarily represent the views of the Energy Commission, its employees or the State of California. The Energy Commission, the State of California, its employees, contractors and subcontractors make no warrant, express or implied, and assume no legal liability for the information in this report; nor does any party represent that the uses of this information will not infringe upon privately owned rights. This report has not been approved or disapproved by the California Energy Commission nor has the California Energy Commission passed upon the accuracy or adequacy of the information in this report.

ABSTRACT By reducing system loads during critical‐peak times, demand response (DR) can help reduce the threat of brownouts and blackouts. DR is also widely regarded as having an important role in lowering power costs—and customer bills, by making organized wholesale power spot markets more competitive and efficient and less subject to the abuse of market power. Consequently, there is common agreement among California’s energy policy makers, utilities, independent system operator and other interested parties that DR should be a key resource option. The Brattle Group was engaged by the California Energy Commission—as part of the 2007 Integrated Energy Policy Report (IEPR) process—to gather inputs from a broad array of sources and to assess the accomplishments and shortcomings of DR activities in California. This assessment will explore the Energy Commission’s “load management” authority as a way to achieve higher levels of cost‐effective DR. The California Energy Action Plan II (EAP II) places DR at the top of the resource procurement loading order with energy efficiency (EE). It specifies that five percent of system peak demand be met by DR in 2007. However, despite significant past and continuing efforts by all of the parties, this goal is unlikely to be achieved. How soon and whether the goal can be achieved are open questions. Despite California’s accomplishments in DR, the question remains: are new policy instruments necessary to expedite, extend and solidify the adoption of DR? This draft white paper is the first deliverable from this project. Its purpose is to define the current state of DR in California, laid out in this chapter, report key stakeholder observations and comments on DR policy, draw lessons learned from DR policy outside of California, both in the U.S. and internationally and lay out ideas that could help move California forward.
KEY WORDS demand response, peak load, load management, electricity rate, electric utility, energy efficiency, economic analysis

TABLE OF CONTENTS
EXECUTIVE SUMMARY ....................................................................................................................................1 Demand Response Goals..............................................................................................................................1 Barriers .............................................................................................................................................................1 Demand Response in Other Regions ..........................................................................................................3 Pathways to the Future ..................................................................................................................................3
CHAPTER 1: CALIFORNIA DEMAND RESPONSE GOALS AND ACCOMPLISHMENTS, 2007 ........5 Introduction ......................................................................................................................................................5 A Brief Recent History ....................................................................................................................................6 The Energy Action Plan: Initiating DR Goals in California ........................................................................6 Specific Developments for Large and Small Customers.........................................................................10 Current Goals and Budget ...........................................................................................................................11 Demand Response Acceleration after the July 2006 Heat Storm .........................................................13 Current 2007 Demand Response Programs ............................................................................................14 Outstanding Issues .......................................................................................................................................18
Measurement and Evaluation.................................................................................................................18 Cost Effectiveness ...................................................................................................................................19 Enrolled Versus Expected Participation................................................................................................19
Conclusions ...................................................................................................................................................20 CHAPTER 2: CONVERSATIONS WITH STAKEHOLDERS .....................................................................22
CHAPTER 3: THE STATE OF DR OUTSIDE OF CALIFORNIA...............................................................32 Introduction ....................................................................................................................................................32 Comparing Demand Response Programs ................................................................................................32
Price-based programs .............................................................................................................................33 Real time pricing (RTP) ....................................................................................................................................... 33 Critical peak pricing (CPP) .................................................................................................................................. 34 Time-of-use pricing (TOU) .................................................................................................................................. 35
Incentive-based programs ......................................................................................................................36 Voluntary reduction vs. mandatory reduction ................................................................................................... 37 Active bid vs. call from utility ............................................................................................................................... 38 Utility-controlled reduction vs. participant-controlled ....................................................................................... 38 Price-triggered vs. emergency/reliability-triggered .......................................................................................... 39 Market-based payment vs. fixed price............................................................................................................... 39 Other program characteristics ............................................................................................................................ 39 Technology Assistance / Financial Incentive.................................................................................................... 40
Barriers to DR ...........................................................................................................................................40 CHAPTER 4: PATHWAYS TO THE FUTURE .............................................................................................43
Regulatory Policy Issues..............................................................................................................................45 Analytical Needs ...........................................................................................................................................46 Customer Perceptions and Program Design Needs................................................................................48 Technological Issues ....................................................................................................................................52 Conclusions ...................................................................................................................................................53

APPENDIX A: SPECIFIC HIGHLIGHTS OF THE NOVEMBER 2006 CPUC DECISION .....................54
APPENDIX B: TAXONOMY OF DEMAND RESPONSE PROGRAMS....................................................55 Price-Based Programs .................................................................................................................................55 Reliability-Based (or Emergency-Based) Programs ................................................................................56
APPENDIX C: LIST OF ACRONYMS ...........................................................................................................57
SIDEBAR 1: VALUING DEMAND RESPONSE BENEFITS IN EASTERN PJM ....................................59
SIDEBAR 2: INEQUITIES OF FLAT RATES................................................................................................62
SIDEBAR 3: INEQUITIES CREATED BY CALIFORNIA’S AB 1X LEGISLATION .................................64
SIDEBAR 4: ESTIMATING THE HEDGING COST PREMIUM IN FLAT ELECTRICITY RATES .........67
SIDEBAR 5: REVISING THE SPM TO ACCOUNT FOR LOSS OF SERVICE QUALITY .....................69
ENDNOTES........................................................................................................................................................74
BIBLIOGRAPHY ................................................................................................................................................78 Documents from California Public Utilities Commission .........................................................................81

LIST OF FIGURES Figure 1: 2004 Load Duration Curve for California IOUs................................................ 7 Figure 2: Distribution of Bill Impacts with Hedging Cost Premium and Demand Response .............................................................................................................................. 51 Figure 3: Cumulative Energy Savings of California Standards and Energy Efficiency Programs ............................................................................................................................... 52 Figure 4: Price Impact of 3% Load Reduction in 5 MADRI Zones for Average Peak Load Conditions.................................................................................................................... 61 Figure 5: Pre- and Post-Crisis Utility Rate Comparison................................................ 65
LIST OF TABLES Table 1: Demand Response Goals As Defined in 2003 ................................................. 8 Table 2: DR Goals as Revised in 2004 ............................................................................. 8 Table 3: Annual California DR Budgets (2003 - Present)............................................. 13 Table 4: Total Anticipated DR from Price Responsive Programs ............................... 16 Table 5: Total Anticipated DR from Interruptible Programs ......................................... 17 Table 6: Total DR from California IOUs........................................................................... 17 Table 7: Sample Public Reaction to PG&E’s AMI Business Case.............................. 49 Table 8: Annual Benefits from 3 percent Load Reduction in the top 100 Hours in 5 MADRI Zones ....................................................................................................................... 61 Table 9: Customer Population Characteristics ............................................................... 63 Table 10: Cross-Subsidy Over 10-Year Period Resulting From Flat Rate ................ 63 Table 11: Benefit (Loss) From Disproportionate Rate Increase Since Crisis ............. 66 Table 11: Benefit (Loss) From AB 1X Over Next Ten Years ........................................ 66 Table 13: Simulated Distribution of Hedging Cost Premium ......................................... 68 Table 14: Bill Savings and Consumer Surplus (Dollars/Month).................................... 70 Table 15: Quantifying Net Benefits (Dollars/Month) ....................................................... 73

EXECUTIVE SUMMARY This paper reviews the state’s demand response goals and existing program activities to achieve those goals, identifies barriers to attain these goals, reviews the lessons learned from demand response in other regions of the United States and in other countries, and identifies pathways to the future. It is written to help the state implement the loading order policy articulated in the Energy Action Plan II that places energy efficiency and demand response at the top of the loading order for procurement of new resources to meet electricity supply needs.
Demand Response Goals The state will fall short of achieving its goal of reducing system peak demand for the three investor‐owned utilities by five percent this summer. This goal specifically applies to price‐response programs that can be called on a day‐ahead basis and are designed to address forecasted peaks or supply constraints. Price‐response programs are likely to reduce peak demand by 2.2 percent, or less than half of the target percentage. The five percent goal for demand response was intended to promote new price responsive demand response programs, and therefore does not include pre‐existing programs that have a reliability trigger. Reliability programs are called on a day‐of basis and are designed to deal with unpredictable, emergency conditions in the grid. They include interruptible service programs and direct load control programs. If the likely impact of these programs were to be combined with the likely impact of price response programs, the total impact of demand response programs on this summer’s peak demand is likely to be 5.7 percent.
Barriers To identify why the state’s demand response goals will not be achieved this year, the Brattle Group interviewed two dozen stakeholders within and outside of California. These conversations were conducted by phone, email and personal interviews. The trade literature on the subject and recent presentations at workshops, seminars and conferences were also reviewed. Several reasons for not meeting the demand response goals emerged from these conversations. First, the goals focused solely on price response programs, which require advanced interval meters. When the goals were set only customers with greater than 200kW demand—representing about one‐fourth of the system peak
1

load—had these meters. Achieving the five percent goal from large customers alone requires that they reduce their peak demand by about twenty percent. Second, even by 2011, when advanced metering infrastructure will be installed for customers under 200 kilowatts, a large portion of the electricity consumption in this class will continue to be protected from rate changes by Assembly Bill 1X (Keeley, Chapter 4, Statutes of 2001), possibly through the year 2021, depending on how the statute is interpreted. The utilities have proposed voluntary critical peak pricing rates and peak time rebates to accommodate the AB 1X provisions in an effort to allow residential customers the opportunity to participate, but the true potential for demand response from these customers is unlikely to be achieved due to a combination of complications, including the potential loss of their current AB1X subsidy, the need to sign up, and the built‐in disincentive to customers with high peak demand. Third, large customers already face time‐of‐use (TOU) rates that charge higher prices for consumption and demand during peak periods. While many of the largest customers have been on TOU for years, over 23,000 advanced interval meters were installed for customers with greater than 200kW of demand as a result of AB 29X (Kehoe, Chapter 8, Statutes of 2001‐02). The legislation required that all meter recipients shift to TOU rates. Much of the potential for peak load reduction from these customers has already been realized as they have adapted their operations to higher peak prices. Related issues include the perception that the incentive levels are too low to create much customer interest and that technologies to facilitate load reductions are not. Finally, it is not clear that existing measurement and evaluation methodologies are valid, since the estimated impacts vary quite a bit depending on how baseline values are established. Adding credibility to these concerns is the fact that a large portion of the price response is coming from State Water Project pumping load. If that response was to be excluded from the analysis, the overall demand response achievements would drop substantially. In light of these developments, it appears necessary to rethink the goals and redesign the programs. The current approach may be much too utility‐centric and agency‐centric and may need to be replaced with an approach focused on customer needs and infrastructure constraints. This would involve reformulating the cost‐benefit tests and improving measurement and evaluation protocols.
2

Demand Response in Other Regions Demand response is widely regarded as a valuable resource in all regions. A recent study conducted for PJM Interconnection, LLC shows that just a three percent reduction in demand during the top 20 five‐hour blocks in its five mid‐Atlantic states could produce annual benefits of $280 million a year. California remains a national and international leader in the field of demand response, and may possibly be the only state to have a clearly specified loading order and a specific goal for demand response. The state has made major strides in energy efficiency, holding per capita electricity consumption around 7,500 kilowatt hours since the early seventies while the rest of the U.S. has seen an average fifty percent increase. California is moving ahead to install advanced metering infrastructure for residential and small commercial and industrial customers. Similar moves are underway in Italy and the Canadian province of Ontario. In addition, dynamic pricing options are being tested elsewhere in Canada, Australia, New Zealand and throughout the U.S. In the mid‐1970s, California was a national leader in managing peak demand as one of the first states to institute mandatory time‐of‐use pricing for the largest customers. In the early 2000s, it was one of the first states to install advanced meters on all customers above 200 kilowatts. California now lags behind states with restructured power markets where all large customers (above one megawatt)face default hourly real‐time pricing tariff and most regions with active demand response programs have both day‐ahead and day‐of programs‐‐using a combination of pricing and rebate payments to encourage customers to lower peak loads and/or shift load to off‐peak periods.
Pathways to the Future While California is considered one of the leaders in demand response in many respects, the problems currently slowing adoption of demand response in California can be grouped into four broad categories: regulatory policy issues, analytical needs, customer perception and program design needs and technological issues. Regulatory policy issues are some of the most widely identified barriers to demand response. These barriers include the need to develop realistic goals for demand response, the need to deal with constraints created by the AB 1X rate freeze and the
3

need to ensure that default rates reflect the policy objective of cost‐based pricing. Solving these issues may require addressing the tension between promoting economic efficiency and fairness and maintaining the current AB 1X subsidies. Analytical issues include modifying existing cost‐benefit methodologies for evaluating demand‐side programs, developing protocols for measuring demand response impacts and developing innovative rate designs that incorporate the risks of outages and high peak generation costs. Current efforts to develop workable dynamic rate designs and effective protocols for measuring demand response impacts are steps toward solving these problems. There is a need to better educate customers about the costs embodied in current rates, the benefits that could come from broad adoption of time‐varying and dynamic rates, the true impacts on their electricity costs that would come from such a change and the options they have for responding. Many customers assume such rates would amount to rate increases when in fact utility revenue would not change—customers whose consumption patterns reflect below average peak consumption would see bill reductions; those with above‐average peak consumption would see increases that reflect the degree to which their peak consumption is currently receiving a hidden subsidy from other customers. Rate and program designs must be developed that better reflect the value of demand response to the electricity system and the value of consumption to customers. Those designs also must reflect a better understanding of customer perceptions, needs and ability to respond as well as being effectively marketed to customers. There is still some perception that technological barriers remain for DR. While substantial advances have been made in enabling technologies and automation, additional progress is still needed. The use of existing technologies that facilitate and automate demand response should be integrated into program and tariffs offerings while further development of such technologies should continue. Finally, California has successfully pursued its energy efficiency goals through a combination of programs and standards. Indeed, at least half of the efficiency gains that have been realized since 1975 have been due to standards. Now may be the time to examine the potential for using standards to achieve the state’s demand response goals.
4

CHAPTER 1: CALIFORNIA DEMAND RESPONSE GOALS AND ACCOMPLISHMENTS, 2007
Introduction By reducing system loads during critical‐peak times, demand response (DR) can help reduce the threat of brownouts and blackouts. DR is also widely regarded as having an important role in lowering power costs—and customer bills, by making organized wholesale power spot markets more competitive and efficient and less subject to the abuse of market power. Consequently, there is common agreement among California’s energy policy makers, utilities, independent system operator and other interested parties that DR should be a key resource option. The California Energy Action Plan II (EAP II) places DR at the top of the resource procurement loading order with energy efficiency (EE). It specifies that five percent of system peak demand be met by DR in 2007. However, despite significant past and continuing efforts by all of the parties, this goal is unlikely to be achieved. How soon and whether the goal can be achieved are open questions. Despite California’s accomplishments in DR, the question remains: are new policy instruments necessary to expedite, extend and solidify the adoption of DR? The Brattle Group was engaged by the California Energy Commission—as part of the 2007 Integrated Energy Policy Report (IEPR) process—to gather inputs from a broad array of sources and to assess the accomplishments and shortcomings of DR activities in California. This assessment will explore the Energy Commission’s “load management” authority as a way to achieve higher levels of cost‐effective DR. This draft white paper is the first deliverable from this project. Its purpose is to define the current state of DR in California, laid out in this chapter, report key stakeholder observations and comments on DR policy (Chapter 2), draw lessons learned from DR policy outside of California, both in the U.S. and internationally (Chapter 3) and lay out ideas that could help move California forward (Chapter 4). The draft white paper will be discussed at an April 19, 2007 workshop and will ultimately contribute to the Energy Commission’s 2007 Integrated Energy Policy Report. This chapter focuses first on describing state energy policy decisions that followed the state’s Energy Crisis of 2000‐01 and then discusses the evolution of California’s
5

DR policies from 2002 through 2006. It then provides a snapshot of current DR policy, highlighting its defining characteristics and identifying the goals it has established for California’s investor‐owned utilities. Finally, these goals are compared to the current effectiveness of the utilities’ existing DR programs.
A Brief Recent History In the wake of the worst energy crisis in the state’s history, the Energy Commission and the California Public Utilities Commission (CPUC) initiated joint rulemaking proceedings on DR, advanced metering, and dynamic pricing in June 2002 (CPUC Rulemaking 02‐06‐001). At that time, the investor‐owned utilities (IOUs) and the large publicly owned utilities were just completing the installation of advanced, interval meters for large customers funded by Assembly Bill 29X (Kehoe, Chapter 4, Statutes of 2001) through the Energy Commission. The initial emphasis on developing the state’s DR policy to take advantage of the new meters focused on using the CPUC’s regulatory authority over the IOUs. The CPUC rulemaking was intended to pursue DR primarily through developing business cases for extending advanced metering infrastructure (AMI) to all customers and developing associated time‐varying and dynamic rates for large customers. The purpose was to promote DR’s ability to serve as a resource that would “enhance electric system reliability, reduce power purchase and individual consumer costs, and protect the environment.”1 Through the proceeding, three working groups were formed to investigate such programs, develop budgets for these programs, and identify statewide goals. It is important to note that the primary focus of these efforts was to develop policies that focused on price‐based DR, like dynamic rates, rather than to invest more in the existing incentive‐based DR programs such as Interruptible Service. The following summarizes the evolution of DR in this context, as it flowed from the activities of the three working groups.
The Energy Action Plan: Initiating DR Goals in California Working Group 1 (WG1) was comprised of policymakers from the CPUC, the Energy Commission, and the California Power Authority (CPA) and was charged with providing guidance to participating parties throughout the proceeding. A major product of WG1 was an appendix to CPUC Decision 03‐06‐036 that defined a vision for demand response in California. The paper also contributed to a broader effort that produced the first EAP. Initially published in May 2003, the EAP was a
6

product of a coordinated effort by California’s energy agencies with the following goal:
Ensure that adequate, reliable, and reasonably‐priced electrical power and natural gas supplies, including prudent reserves, are achieved and provided through policies, strategies, and actions that are cost‐effective and environmentally sound for California’s consumers and taxpayers.2
The EAP identifies EE and DR as top priorities, proposing actions to “optimize energy conservation and resource efficiency.” As the EAP indicates, there is significant potential for DR in California. For example, as seen in Figure 1, the coincident peak demand of the three California IOUs exceeded 37,296 megawatts (MW) during only one percent of the hours in 2004. However, the maximum hourly coincident peak demand was 41,811 MW. This difference of over 4,500 MW is an illustration of the rarely‐used capacity that could be avoided in future capacity expansions through more effective DR policy.
Figure 1: 2004 Load Duration Curve for California IOUs3
0
5,000
10,000
15,000
20,000
25,000
30,000
35,000
40,000
45,000
0
500
1,00
0
1,50
0
2,00
0
2,50
0
3,00
0
3,50
0
4,00
0
4,50
0
5,00
0
5,50
0
6,00
0
6,50
0
7,00
0
7,50
0
8,00
0
8,50
0
Hours (Sorted from Highest to Lowest)
Coi
ncid
ent H
ourly
Dem
and
of C
A IO
Us
(MW
) Coincident peak demand = 41,811 MW
1% of hours greater than 37,296 MW
5% of hours greater than 33,026 MW
Additionally, the EAP suggested that the state “implement a voluntary dynamic pricing system to reduce peak demand by as much as 1,500 to 2,000 megawatts by
7

2007.” This was the first identification of an explicit goal for DR in California. This goal was further refined and published by the CPUC in a June 2003 Decision as shown in Table 1:4
Table 1: Demand Response Goals As Defined in 2003
Year PG&E SCE SDG&E2003 150 MW 150 MW 30 MW2004 400 MW 400 MW 80 MW2005 3% of Peak 3% of Peak 3% of Peak2006 4% of Peak 4% of Peak 4% of Peak2007 5% of Peak 5% of Peak 5% of Peak
These targets were revised subsequently since the actual peak reduction from DR consistently lagged behind the goals. For example, in 2004, the intermediate DR goals for 2004 and 2005 were decreased significantly, as shown in Table 2.
Table 2: DR Goals as Revised in 2004
Year PG&E SCE SDG&E2004 302 MW 205 MW 24 MW2005 450 MW 628 MW 125 MW
It was also necessary to define the type of DR that was allowed to count toward the targets. This eventually led to the distinction between price‐responsive programs and reliability driven programs. In a January 2005 CPUC Decision, the two types of DR programs were defined as follows:5 • Price‐Responsive Programs: “Customers choose how much load reduction they
can provide based on either the electricity price or a per‐kilowatt (kW) or kilowatt‐hour (kWh) load reduction incentive.”
• Reliability Triggered Programs: “Customers agree to reduce their load to some
contractually‐determined level in exchange for an incentive, often a commodity price discount.”
In other words, in price‐responsive programs, customers are responding to a price signal that is built into their electricity rate (for example, a higher price during peak periods than during off‐peak periods). The definition of price‐responsive programs was also extended in the CPUC Decision to include any DR program in which the signal is provided on a day‐ahead basis, regardless of whether the program’s trigger is price, a forecasted metric of high load levels, or a “reliability” indicator such as
8

temperature or system demand. Alternatively, reliability‐triggered programs that provide the DR signal on a shorter time frame, such as day‐of or hour‐ahead, are not considered price‐responsive. Historically, California has relied on reliability‐triggered programs, such as direct load control of central air conditioners through receiver switches and curtailable and interruptible rates, to achieve peak demand reductions. However, given the near‐term plans to enable customers with AMI technology, much of the focus of current and future DR policy has been on the price‐responsive and signal‐responsive programs that this technology facilitates.6 This is highlighted in the CPUC decision that only price‐responsive programs count towards the IOUs’ assigned DR goals. This distinction was driven by the need to narrow the DR goal such that it focused both on new DR efforts and DR that leaves the choice to participate up to the customer. The reasoning behind this distinction was further articulated in a recent Energy Commission white paper:
Current reliability programs make implicit judgments about the load value during critical periods. Dispatchable air conditioning cycling programs that shut off cooling on hot days and interruptible programs that shut down industrial production, are crude reflections of the much more finely tuned opportunities customers have with market‐based tariffs. The fundamental premise of price‐sensitive demand response is allowing customers to choose when and how to use electricity in response to a price signal that both reflects actual costs and applies to all customers.7
In 2005, the Energy Commission and the CPUC published the Energy Action Plan II (EAP II), which continued to identify EE and DR as the top two priorities for meeting California’s growing energy needs and provided more detailed suggestions for promoting their adoption. In particular, the EAP II laid out twelve actions that would be taken to facilitate DR in the state. Many of these actions focused on the installation of AMI and its integration with dynamic pricing programs. Additionally, despite changes to the intermediate DR goals, the EAP II continued to stress the initial five percent target for DR:
Identify and adopt new programs and revise current programs as necessary to achieve the goal to meet five percent demand response by 2007 and to make dynamic pricing tariffs available for all customers.8
This goal still exists for DR in California today.
9

Specific Developments for Large and Small Customers Working Group 2 (WG2) focused on the development of DR programs and related policies for large customers (customers with greater than 200 kW of monthly demand). Its participants included the major stakeholders such as the three IOUs, the Office of Ratepayer Advocates, the California Independent System Operator (California ISO), large customer trade associations, and others. The policies were initially designed to capitalize on smart meters already installed at the sites of many large commercial and industrial (C&I) customers. An important distinction between the policy efforts dedicated to larger customers and those that have been focused on smaller residential customers is that many C&I customers already have smart meters installed on site and are thus equipped to immediately take advantage of dynamic pricing. Many of the early policy decisions pertaining to large customers are included in a June 2003 Decision by the CPUC.9 As part of the proceeding, discussion centered on whether a standard DR tariff, such as Critical‐Peak Pricing (CPP), should be adopted as the default rate for all large C&I customers. The CPUC decided that the DR tariff would initially be voluntary. This tradeoff between mandatory and voluntary rates, and the advantages and disadvantages of each, is elaborated upon in the interviews with DR stakeholders found in Chapter 2 of this white paper. Ultimately, the CPUC approved four DR programs for large customers: CPP, an Hourly Pricing Option (HPO) for San Diego Gas and Electric Company’s (SDG&E) customers, an IOU Demand Bidding Program (DBP), and a CPA Demand Reserves Program. These programs were allocated an initial budget of $23.8 million in 2003, with an additional $9.3 million allocated for 2004.10 Working Group 3 (WG3) was concerned with developing DR policies for small commercial and residential customers with billing demand less than 200 kW. Because these customers were not equipped with advanced metering technology, WG3’s discussions centered on developing a pilot to test the potential for DR in residential and small C&I customers. This effort resulted in the California Statewide Pricing Pilot (SPP), which was a multi‐million dollar study designed to:
Gather specific information about price elasticities and customer preferences, testing the following features: California’s current regulatory, energy, and economic climate; critical peak pricing with and without automated response; preferences of small commercial and residential
10

customers; a variety of electricity usage levels, appliance holdings, and climate zones; and voluntary rates.11
The SPP began in July 2003 and ran through December of 2004. Roughly 2,500 residential customers participated in the pilot over this time period. Initially, the study received a budget of $12 million dollars for calendar year 2003, but this was incrementally expanded in later years. 12 The duration of SPP was also extended through the summer of 2005 for commercial and industrial customers. The SPP study concluded that customers do respond to price signals and that significant DR could be achieved through well‐designed dynamic pricing strategies. The study found that customers responded to dynamic pricing, and that this responsiveness was a function of many additional factors including climate, rate structure, whether the customer had central air conditioning, and the customer’s prior usage patterns.13 Ultimately, the findings of this study provided the evidence necessary to support utility AMI filings. To date, Pacific Gas and Electric Company (PG&E) has received approval for deployment of its AMI infrastructure and is installing advanced meters; SDG&E is poised to begin the final stages of selecting vendors and beginning deployment (subject to a CPUC decision scheduled for April 12, 2007); and Southern California Edison (SCE) filed an application in December, 2006 seeking approval of its AMI deployment plan.
Current Goals and Budget As mentioned previously, the current DR target defined by the CPUC for each IOU is to meet five percent of system peak demand with price‐responsive DR programs by the summer peak season of 2007. Since 2003 when these final 2007 goals — as well as annual intermediate goals — were set, IOU achievements have not matched the targets. Periodically, the IOUs filed plan revisions to change programs and add new programs to move toward their peak reduction goals. One approach to increase the achievements has been to significantly increase DR budgets.
11

Table 3 below summarizes the annual budgets from 2003 to the present.
12

Table 3: Annual California DR Budgets (2003 - Present)14 Approval for… Amount SourceCalendar year 2003 SPP budget $12 million Decision 03-03-0362003 budget for DR programs for large customers $23.8 million Decision 03-06-032Total 2003 Budget $35.8 millionCalendar year 2004 SPP budget $7.2 million Decision 04-01-0122004 budget for DR programs for large customers $10.2 million Decision 03-06-032Total 2004 Budget $17.2 million2005 budget for DR programs for SCE $93.7 million Decision 05-01-0562005 budget for DR programs for SDG&E $18.0 million Decision 05-01-0562005 budget for DR programs for PG&E $87.4 million Decision 05-01-0562005 incremental budget for SPP $0.7 million Decision 05-07-011Total 2005 Budget $199.8 million2006-08 budget for DR programs for SCE $101.0 million ($33.7 million/year) Decision 06-03-0242006-08 budget for DR programs for SDG&E $52.6 million ($17.5 million/year) Decision 06-03-0242006-08 budget for DR programs for PG&E $108.7 million ($36.2 million/year) Decision 06-03-024Total 2006-08 Budget $262.3 million ($87.4 million/year) On an annual basis, the current (2006‐08) total California DR budget of $87.4 million per year is more than twice as large as the budget of $35.8 million that was allocated in 2003, the first year of the Statewide Pricing Pilot.15 This budget is expected to increase even further. Additionally, in response to the heat storm of summer 2006 that tested reliability in California’s electricity grid, utilities were directed to file plans for new additions to their existing DR programs. The utilities proposed a number of enhancements to the existing DR programs in September 2006 and the CPUC issued a decision on November 30, 2006 approving a number of those enhancements for the summer of 2007. Although a few program details are still pending before the CPUC, the IOU proposals enhance many of their offerings to encourage additional customer participation. However, the majority of new DR capability is expected to come from about 275 MWs of direct load control—an expansion to SCE’s air conditioning cycling program and a new air conditioning cycling program for PG&E.
Demand Response Acceleration after the July 2006 Heat Storm California and the West experienced an extremely intense heat storm in late July 2006 that strained the state’s electrical system. The four‐year effort of the California policy makers, utilities and stakeholders on DR paid off when customers participating in DR programs played a critical role by reducing their energy usage when called upon by the utilities and the California ISO.
13

In testifying before the State Senate Committee of Governmental Organizations on August 9 2006, Yakout Mansour, President and CEO of the California ISO, provided information that showed just how extreme the heat storm was in relation to “bad case” and even “worst case” planning assumptions. Moreover, Mr. Mansour indicated that conservation, DR, interruptible programs and the California ISO’s Voluntary Load Reduction Program “played a significant role in making it through the tough days.” On November 30, 2006, the CPUC drew several conclusions from the events of summer 2006:
• Utility DR programs are a key element of a broader and integrated approach to system management that engages customer’s system demand during periods of critical need and potential system instability.
• Although there is much work to be done, the utilities and their customers continue to identify ways to improve existing DR and propose innovative new ideas.
• The need for the extraordinary efforts undertaken to prevent a system compromise during July, however, motivates us to pursue DR programs that are more aggressive, more successful, and more inventive.
The new policy reiterated that DR and EE are at the top of the state’s loading order, and that policy makers firmly believe California can lower energy costs and increase electric system reliability by expanding DR efforts.
Current 2007 Demand Response Programs While none of the IOUs so far have been able to achieve the state’s desired target of five percent peak demand reduction by 2007, the utilities have made progress in both the effectiveness of their DR programs and in the range and appeal of programs which they provide. A brief description of existing price‐responsive programs is provided below.16 A taxonomy of additional DR programs can be found in Appendix B.
• Critical Peak Pricing (CPP): Participants are charged critical peak energy rates that are considerably higher than what they would pay on their otherwise applicable tariff. In return, participants pay lower on‐peak and partial‐peak rates for the remainder of the summer or year. A CPP event is triggered when the utility forecasts high market prices, system constraints or high temperatures.
14

• Demand Bidding Programs (DBP): Participants bid the amount of MW that they can reduce on days that the utility needs demand reduction. The utility can call for bids on a day‐ahead or day‐of basis. Participants are compensated only for the actual amount of reduction they provide.
• CPA Demand Reserves Partnership (CPA DRP)/Capacity Bidding Program: For the summer of 2007, the CPA DRP is being replaced by the Capacity Bidding Program. The new program contains most of the major elements of the existing program and is expected to attract additional participation while retaining most of the current participating capacity. In the program, aggregators are paid a monthly capacity payment based on the amount of load they can deliver via contracts with bundled and direct access participants. The aggregators are also paid an energy payment for the actual amounts of energy reduced. While the CPA DRP program was triggered by the utilities for economic reasons or Department of Water Resources for reliability reasons, the new capacity bidding programs utilize a “soft” trigger that allows the utility some discretion in calling the program, allowing actual system need to be considered rather than any specific economic or reliability proxy, such as temperature, to determine when an event is called. In addition, the program allows customers to choose the magnitude of their load reduction commitment, the length of that commitment, and the timing of the notice they receive—all with varying levels of compensation.
• Peak Day Credit: Customers who participate would receive a bill credit for reducing their power consumption below their baseline usage calculation on critical peak days.
• Technical Assistance/Technical Incentives: The Technical Assistance Program is an energy audit service designed to help customers identify methods for reducing energy costs and to encourage greater participation in demand response and energy efficiency programs. The Technology Incentive Program is a financial incentive program intended to encourage customer adoption and installation of demand response measures. The financial incentive is associated with the level of energy reduction the technology can provide.
• Business Energy Coalition (BEC): The BEC is a demonstration project intended to engage major accounts in an effective DR program. A customized engineering assessment of the facility is complete and customers receive near real‐time usage information for their facilities to assist in the daily monitoring of their usage.
15

These DR programs have reduced peak demand for the IOUs. Tables 4‐6 summarize these impacts by program type for each utility both in terms of MWs and as a percentage of peak demand, and include the emergency/ reliability triggered programs for comparison.17
Table 4: Total Anticipated DR from Price Responsive Programs
Demand Response Program Peak Reduction (MW)
Reduction as % of Expected
2007 IOU Peak Demand
Service Accounts
PG&ECritical Peak Pricing 67 0.3% 619Demand Bidding Programs 261 1.3% 1,130CPA Demand Reserves Partnership 245 1.3% 184Business Energy Coalition 16 0.1% 62
Total PG&E DR from Price Responsive Programs 588 3.0% 1,995
SCECritical Peak Pricing 3 0.0% 25Demand Bidding Programs 207 0.9% 1,135CPA Demand Reserves Partnership 163 0.7% 100
Total SCE DR from Price Responsive Programs 373 1.6% 1,260
SDG&ECritical Peak Pricing 21 0.5% 149Demand Bidding Programs 11 0.3% 69CPA Demand Reserves Partnership 19 0.4% 26Peak Day Credit 35 0.8% 721Technical Assistance/Technical Incentive 10 0.2% 114
Total SDG&E DR from Price Responsive Programs 96 2.1% 1,079
PG&E is expecting to achieve roughly a three percent reduction in peak demand in 2007 from price‐responsive DR programs. SCE is expected to achieve a 1.6% reduction. SDG&E offers the longest list of price responsive programs and is expected to achieve a 2.1% reduction from these programs.
16

Table 5: Total Anticipated DR from Interruptible Programs
Demand Response Program Peak Reduction (MW)
Reduction as % of Expected
2007 IOU Peak Demand
Service Accounts
PG&ENon-Firm 267 1.4% 93Base Interruptible Program 35 0.2% 30Optional Binding Mandatory Curtailment 12 0.1% 36
Total PG&E DR from Interruptible Responsive Programs 314 1.6% 159
SCEI-6 283 1.2% 305Base Interruptible Program 395 1.7% 241A/C Cycling Pilot 443 1.9% 208,006Optional Binding Mandatory Curtailment 9 0.0% 11Agriculture and Pumping Interruptible Program 74 0.3% 391
Total SCE DR from Interruptible Programs 1,204 5.2% 208,954
SDG&EBase Interruptible Program 0 0.0% 1Peak Generation 63 1.4% 70Smart Thermostat 2 0.0% 4,036Summer Saver 30 0.7% 18,641
Total SDG&E DR from Interruptible Programs 95 2.1% 22,748
PG&E’s interruptible programs, which have a reliability trigger, are expected to provide 1.6% peak demand reduction. SCE’s peak reduction is expected to be closer to 5.2%, including a large contribution from it’s A/C cycling program. SDG&E’s interruptible programs are expected to yield an impact of 2.1% of reduced peak demand in 2007.
Table 6: Total DR from California IOUs
Peak Reduction (MW)
Reduction as % of Expected 2007
Peak DemandService Accounts
Expected 2007 Non-Coincident Peak Demand of IOUs 47,014
Total DR from Price Responsive Programs 1,056 2.2% 4,334Total DR from Interruptible Programs 1,613 3.4% 231,861Grand Total Demand Response of IOUs 2,669 5.7% 236,195
17

On the whole, the California IOUs are expecting to achieve roughly 1,056 MW of peak demand reduction through price‐responsive DR programs in 2007, representing a 2.2% of the system peak. This is less than half of the 2007 goal of five percent set by the CPUC. However, including demand reductions from interruptible DR programs would increase the estimated total reduction to 5.7% of the system peak.
Outstanding Issues There are several unresolved policy issues with respect to the state’s DR goals and the impact of the current programs on peak demand. These include the need to develop valid and reliable measurement and evaluation protocols, the need to develop methods for assessing cost‐effectiveness and comparing program investment decisions, and the need to determine how to count the potential impact from participating customers toward meeting the goal.
Measurement and Evaluation One critical area of DR policy that continues to be refined is developing standards to measure and evaluate the impacts of DR programs. In a November 2005 Decision, the CPUC identified the need for standard industry protocols for measuring and quantifying the impacts of DR programs. Specifically, it noted that “demand response programs…are not well integrated into the planning process, and do not have adopted measurement and evaluation protocols.” Furthermore, the CPUC stated:
…until the industry develops further trust that demand response will deliver demand reductions when needed, demand response will continue to be dismissed in the resource planning and acquisition process. In order to build that trust, we need to develop industry protocols for measuring load response capability and results…18
The CPUC Decision then called for the utilities to prepare a set of draft protocols for estimating the impacts of DR programs on peak demand. Workshops were held during the spring of 2006 and a new Order Instituting Rulemaking (OIR) was issued in January, 2007 to address demand response measurement protocol development and cost‐effectiveness analysis. The new rulemaking will also address integrating
18

DR load impact measurement with California ISO operations and the potential of revising the DR goals in light of improved measurement and evaluation protocols.
Cost Effectiveness No final determination has been made in the development of California‐wide standards for measuring the cost effectiveness of DR programs. Through the CPUC’s DR proceedings, stakeholders have agreed that several methodologies could be used to assess the effectiveness of DR programs. The tests found in the Standard Practice Manual (SPM) represent one common approach.19 However, consensus has not been reached to adopt these tests as the industry standard. This issue is included in a new CPUC Rulemaking on DR measurement and evaluation.
Enrolled Versus Expected Participation A related issue is the debate over which method should be used when reporting the impacts of DR. There are three ways to report these impacts: enrolled, demonstrated, and expected. Enrolled MW reflects some estimate maximum amount of response that might be achieved from customers enrolled in existing programs. Demonstrated MW relies on actual performance data, which is currently unreliable due to changing programs and enrollment as well as too few event days so far to develop reliable statistical estimates. It is anticipated that this may become the standard way of reporting impacts. Expected MW represents resource planners’ best estimates of demand reduction, based on assumptions about enrollment and performance, among other things. The IOUs generally report enrolled MW when comparing their DR performance to the stated five percent target. This allows the utility to take some risks in pursuing new DR programs that may not indicate immediate benefits on an “expected MW” basis. However, resource planners need reliable, probable estimates of expected demand reduction when managing system resources. In this case, expected MW would be a more appropriate reporting measure. On this issue, and in its relevance to the definition of the five percent DR target, some additional clarity is needed. In addition to requiring estimates of expected value, it may also be necessary to require estimates of expected variance, so that the state can derive estimates of the “value at risk” associated with DR programs.
19

Conclusions While these conclusions are preliminary, they will be expanded upon and further examined in subsequent interviews, workshops, and research throughout this project.
• The California IOUs are likely to achieve less than half of the five percent DR target established by the CPUC and the Energy Commission in 2003 for the year 2007. A new CPUC rulemaking will address DR goals issues later this year.
• To expand the number of DR programs and their impacts, annual DR budgets have more than doubled since 2003.
• DR programs are still being approved in the absence of fully‐developed cost‐effectiveness methodology, but a new CPUC rulemaking will address this issue over the rest of 2007.
• Despite the shortfall of the current DR programs, they produced a significant response during the extreme heat wave of July 2006. This has led to further understanding and emphasis by all parties on the importance of DR and has led the California utilities to consider expanding their portfolio of DR programs.
• Based on these initial findings, there appear to be two broad policy paths than can be taken in pursuit of the current DR goals.
- Business As Usual: DR was credited with helping to reduce demand during the heat storm of 2006 and DR programs have subsequently been accelerated. There is reasonable assurance that DR will play a significant role in the summers of 2007 and 2008 even without a large contribution from dynamic rates and price‐sensitive programs. While the five percent for price‐sensitive demand response programs is unlikely to be met under this approach, other DR resources can be obtained with sufficient investment that will provide reliability benefits, though other policy goals may not be achieved. For this path, the remaining questions include: What can be done to speed this up and make it more efficient? What factual information is needed to enlighten this policy choice?
- Policy Change: As more financial resources are invested and experience accumulates, California’s DR capability is increasing in an evolutionary way. But the vision for DR resources articulated in the EAP II may not be realized without significant policy changes. The utilities have committed to AMI, which will likely be deployed to the smaller customers later in this decade, but policy changes that make dynamic tariffs available to small customers
20

will be required to realize the potential from that investment. Although participation in price‐response DR programs has been disappointing, large customers have adapted their operations in response to TOU rates and have provided emergency reliability protection to the grid. Two efforts at the CPUC to develop default dynamic rates for large customers have failed to win approval; future efforts will be included in the individual utility General Rate Cases. For this path, the remaining policy questions include: How should dynamic rates be structured to fairly allocate costs and benefits within and across customer rate classes? What further research and analysis is needed to make a substantial contribution to this decision?
21

CHAPTER 2: CONVERSATIONS WITH STAKEHOLDERS As noted in Chapter 1, California’s energy policy, as articulated in the EAP, says that growing demand for electricity should be met first by energy efficiency and demand response, next by renewable resources, and then by other clean generation options. The benefits of DR are now widely accepted by policy makers around the globe. For a recent estimate of such benefits that has been performed for the PJM Interconnection LLC, see Sidebar 1 at the end of this paper. California set a goal of meeting five percent of system peak demand through price‐response, day‐ahead DR programs in 2007. As of this writing, it appears unlikely that this goal will be achieved. Since the state is will soon be setting new goals for 2009‐2011, it is appropriate to ask why the current goals are not being achieved. To answer this question, the Brattle Group interviewed a diverse group of individuals with first‐hand knowledge of DR programs in the state. Given the short time available in which to conduct the interviews, some interviews were conducted in person, some over the telephone and some via email. Respondents included representatives of the state’s investor‐owned and municipal utilities, intervener groups, equipment vendors, and academics, and were told that their individual responses would be kept confidential. Interviews were also conducted with a small number of professionals in other states who are involved in DR. The resulting information was supplemented with additional information from prior interviews, statements from a variety of recent workshops and seminars, and literature reviews. The findings from this extended set of conversations with stakeholders are summarized in this chapter for 20 specific issues associated with DR. The questions begin with general topics about the state of DR in California, followed by questions about specific barriers and their relative significance. From the answers to these questions, one can infer solutions to the barriers and begin to identify a path going forward. These are further expanded upon in Chapter 4.
1. How can the state improve its activities to promote DR? Most respondents felt that the state should set realistic goals for DR and convey them in a transparent and timely fashion to all market participants. They wanted the cost‐effectiveness criteria for screening programs to be clearly laid out. Goals should be based on economic potential, some argued, and not on technical potential. One
22

person opined that many DR programs were not cost‐effective. Some respondents believe that the Standard Practice Manual (SPM), widely and successfully used to screen energy efficiency programs for the past two decades, had to be modified to deal with the specific time‐dependent nature of DR programs. They cited the difference in value between day‐ahead and day‐of programs, a feature which is not recognized in the SPM. Some mentioned the “call option” nature of DR programs as being a unique attribute that does not have a counterpart in the SPM. Others mentioned the change in value of service that is brought about by the programs as being another neglected programmatic attribute. One individual said that if the state is serious about instituting price‐sensitive DR, it should take that priority into account when setting rates. The implication was that the current DR and rate setting policies were mired in contradictions. In a related comment, another person said that the state should place all customers on advanced meters and default dynamic pricing rates or at the minimum, time‐of‐use (TOU) rates. They should have the option of going to a non‐varying tariff that would include a mark‐up for the hedging premium. Another individual said the state could play a role in measuring and evaluating the impact of DR programs and policies. Several individuals noted that the state should invest in a vigorous public relations campaign to educate the public about the time‐varying and dynamic nature of power costs. Another individual said the state should insist that advanced meters should be IP addressable and use EPRI’s IntelliGrid Architecture as the basis. One person called for better coordination between retail DR programs, including dynamic pricing, and wholesale markets. He called for better integration and communication with grid operations and showing clearly how DR contributes to reliability and/or lowers the forecast of peak demand. He suggested that minimal DR infrastructure would be helpful, e.g., something like ICBS in ISO New England and a messaging system that communicates price and reliability signals that enable automated DR to occur. One person opined that DR was a crutch for the state commissions and utilities who did not wish to supply energy to the grid. He said the state’s energy goals would be better served by focusing on EE. One individual suggested certifying DR programs and letting them bid into the California ISO ancillary services market. Another called for instituting web‐based automated DR programs to third party aggregators. Finally, one said if the state was really serious about DR, it needed to take out the politics.
23

2. What do you think of the state’s current loading order in regard to DR? The loading order received widespread support among respondents, and at least one respondent congratulated the state’s policy makers for having clearly articulated their vision. However, just about everyone said there was a visible disjuncture between the lofty vision of the loading order and the meager reality on the ground. For example, one participant said that the loading order seemed to express a preference for DR, but did not articulate a methodology for quantifying that preference. This essentially meant that DR options would be evaluated on an equal footing with generation options, not on a preferential footing. Another participant cited how the state would give preferential treatment to wind generation in order to overcome certain technical limitations of that resource option, and wondered why DR was not given any such treatment. One individual called upon the need to examine the environmental benefits of DR and to factor those into its assessment, regardless of whether they were positive or negative. Another one suggested that all externalities, including those associated with DR, should be priced. Finally, one noted that the loading order sounded good but the state had not figured out how to make it happen. All it was focused on doing was promoting reliability‐centric programs that would not by themselves meet the goal of increasing the price elasticity of the demand curve and thereby lowering wholesale prices and mitigating market power. However, another respondent expressed a concern that price‐based programs that produced impacts on a day‐ahead basis may not be counted as DR by California ISO. One person expressed a concern that the CAISO’s Market Redesign and Technical Upgrade process would eliminate the concept of Stage I, II and III alerts and was uncertain how this would allow DR programs to be triggered. 3. The current DR goals make a distinction between price‐sensitive and emergency demand response. Is this appropriate? While several people agreed that there were good structural reasons for making this distinction, and while a few supported the need to make price‐sensitive programs the domain for achieving the five percent goal, many felt the distinction was not appropriate. This point was made by the investor‐owned utilities. The utilities felt that the emergency DR programs were making a vital contribution to the state’s desire to maintain system reliability and avoid blackouts and rotating outages and wondered why they had been left out of the goal. Some argued that it was difficult to achieve the five percent goal when most customers in the state did not have advanced metering capability. One individual suggested that an aggregate goal
24

should be specified and utilities should be given the flexibility to use all available programmatic means for achieving it. Another person said that DR should only be used in emergency situations. 4. Should electric rates be redesigned to encourage DR? Just about everyone said yes. Most people agreed that electric rates should be cost‐based and given the non‐storable nature of electricity, they should vary by time of day. Given the state’s problem during the Energy Crisis of 2000‐01, there was a strong consensus that customers should have to pay a higher price during the days when the power system encounters critical conditions. They should have the option of buying through at the higher price, if they so chose, or to curtail and/or to shift lower value activities to less costly periods. However, virtually everyone agreed that it was difficult, if not impossible, to redesign rates to encourage DR, given the current institutional and political constraints on rate design. Some of the reasons are elaborated upon in the balance of this chapter. One individual noted that rates should simply be designed to encourage EE. 5. Is the voluntary nature of the current crop of DR programs a benefit or a hindrance? Should any programs be offered in a default mode if advanced meters are already in place? Specifically, would it be good policy to make dynamic pricing for all customers the default rate for all customers? This question drew conflicting responses, with some saying that the voluntary nature of the programs represented the true spirit of capitalism in action, i.e., providing choices to customers, but others argued that it guaranteed the perpetuation of existing rate subsidies. The latter said that by making cost‐based rates an elective option, the state was giving customers a pass to avoid paying their fair share of costs. They called for making dynamic pricing the default rate for all customers who were equipped with advanced metering. All agreed that customer participation rates in a voluntary, opt‐in program were likely to be low and that fact may make it difficult to achieve the state’s DR goals. Some called on the DR goals to be accompanied by likely estimates of customer participation rates. Others insisted that DR programs should only be voluntary.
25

6. Existence of a rate freeze on the first two tiers of consumption imposed by AB 1X. AB 1X places a rate freeze on the first one hundred and thirty percent of baseline consumption for residential consumers of electricity.20, 21 There is some uncertainty about when the restrictions would be lifted. According to some respondents, the restrictions will continue until 2015, when the contracts begin to expire. According to others, they will continue until the bonds are paid off, some time in 2022. All residential customers receive discounted electricity due to AB 1X. It is estimated that for about half of all residential customers, all of their consumption falls into those first two tiers and thus it is completely covered by the rate freeze. Among the remaining customers, half of their usage falls within Tiers 1 and 2. Thus, in aggregate terms, about seventy to seventy‐five percent of residential usage is sheltered by the rate freeze. Most respondents felt that the rate freeze imposed by AB 1X is a serious constraint on the state’s ability to replace non‐time varying rates with dynamic pricing. Respondents noted that ways had been found around the rate freeze by offering voluntary dynamic pricing programs and introducing new concepts that leave rates unchanged, such as the peak time rebate One respondent suggested that the language in the statute could be modified so it does not refer to the rates as such but to the customer’s cost. I.e., if dynamic pricing rates would lower the customer’s cost for the one hundred and thirty percent of baseline usage, they would be allowed. Another respondent indicated that even if the AB 1X restrictions were not there, utilities would be reluctant to move to default dynamic pricing because of the fear of adverse customer reaction. However, another respondent commented that while this fear is understandable, it may be possible to overcome it with customer education and information. He cited the fact that in the late 1970s, the state moved all commercial and industrial customers above 500 kW to mandatory TOU rates. These conversations indicated that it is unclear that there is widespread support for exposing customers to the high costs they impose on the system during the top 100 hours of the year.
26

7. How significant is lack of AMI to the successful deployment of DR?
This question was answered by some saying it was a significant barrier, since AMI was not deployed in the state, and others saying it was no longer a barrier since all three investor‐owned utilities had decided to pursue AMI. Everyone agreed that without AMI, dynamic pricing could not be offered to small customers; however, there was general agreement that AMI is a necessary but not sufficient condition for achieving the DR goals. Participants cited the lack of dynamic pricing for large customers, even though they all have advanced meters. 8. Lack of cost‐effective technologies that allow customers to respond to DR Examples of cost‐effective technologies include smart thermostats that respond to high prices by raising the setback, whole house gateway systems that allow multiple devices to be similarly made price sensitive, advanced energy management systems in commercial buildings and process control systems in industrial facilities that can reduce load when needed. Several respondents said this was a legitimate barrier, but a few qualified their responses by saying that the technologies existed commercially. They said that customer awareness was low and given the low level of market penetration, the cost of the technologies was high, creating a Catch‐22 situation. A few argued that the marketing infrastructure (the value chain from the equipment manufacturer to the retailer and the installing contractor) was in its infancy. One individual suggested that a “market transformation” initiative akin to that pursued in the energy efficiency business was needed to allow rapid penetration of smart (price sensitive) control technologies in customer premises that would allow them to see the full benefits of DR. Another individual stated that DR would only succeed if it was accompanied by automation of appliances and buildings; this would take out the hassle factor for consumers. 9. Lack of consumer interest in DR due to either an inability to further curtail peak loads and/or a concern about the small size of bill savings that would ensure from DR Lack of consumer interest was cited by all respondents as a “highly significant” barrier. Many customers in California feel they have already done all they can do to become efficient consumers of electricity. Large customers on mandatory TOU rates
27

feel they have already shifted as much of their peak usage to off‐peak periods as they can, given their business constraints. In the context of dynamic pricing rates, some noted that the traditional requirement of revenue neutrality guaranteed customer indifference. Unless customers see significant bill savings, they are unlikely to participate. The example of Commonwealth Edison’s real‐time pricing (RTP) program for residential customers was cited as an illustration of creative rate making. Customers who chose the RTP rate are given a credit that reflects the lower cost of serving them.22 One utility participant said that some of his large commercial customers were happy to respond to phone calls on critical days by reducing load, even without any financial incentives. At the same time, they did not want to formally participate in a DR program because the paperwork and other requirements were very costly and the savings were not proportionately large.23
10. Ineffective program design and marketing. Most participants agreed that further improvements were needed, since insufficient numbers of customers were enrolled in DR programs. One participant suggested that a workshop be convened to identify lessons learned from other states and other countries. Another suggested that the best practices from energy efficiency programs be exported to the design and marketing of DR programs. Still another person suggested that a barrier was created by having a plethora of DR programs being offered by multiple parties, suggesting the need for consolidation. Finally, a few participants suggested the need for integrating EE and DR programs, since they serve the same customer. They argued customers do not know or wish to know the finer points of distinction between various customer‐side programs that are directed toward them. They want to lower their energy bills and ensure the lights stay on. 11. Fear of utilities about fully recovering costs. Some said the fear of cost recovery had been adequately addressed by the decoupling provisions that are in effect. Others said that AMI investments were being undertaken only after cost recovery had been granted. In general, the opinion was that this is not a problem in California but may well be a problem in other states. 12. Fear that DR would trigger customer backlash. This was cited as a concern by some respondents. They felt that poorly designed and marketed DR could trigger such a backlash. For example, if DR was over‐used, it
28

could cause customer fatigue. Or, if customers felt they were doing a lot of load curtailment and shifting, but not seeing commensurate benefits, they would feel taken advantage of, as happened during Puget Sound Energy’s TOU program. There was also a concern that the very notion that prices during critical periods would rise by a factor of five would trigger a ratepayer revolt. Others argued that if the dynamic pricing rate was presented as a practical way to save money, even for customers with the greatest peak load, a revolt could be averted. They cited the fact that customers were broadly familiar with the notion of TOU pricing, since they had been exposed to it through airfares and cell phone plans. The focus groups conducted prior to the Statewide Pricing Pilot (SPP) showed that nine out of ten customers quickly grasped the concept of TOU and dynamic pricing and were able to think of ways of saving money when they were provided with good information. One person said that automation of appliances and buildings would help overcome customer fears and prevent a backlash. Another person argued this was largely a public relations issue that could be managed, since two‐thirds of customers were subsidizing the remaining one‐third. A transition process that was “rich” in education and that allowed people time to adapt to new, dynamic pricing regimes was needed to remove this inter‐customer rate subsidy. One person said that fear of a customer revolt was keeping utility executives from moving rapidly on the pricing redesign front.
13. Confusion with EE programs and inability to distinguish between the two. This concern was voiced by some of the stakeholders but they felt it was becoming less of an issue, as programs were becoming better integrated. As an example, one person mentioned that high‐SEER rated central air conditioning programs were being tied in with rebate‐based direct load control programs. Another person cited the example of a utility in Nevada where rebates for high‐SEER central air conditioners are only provided if the customer agrees to be placed on a TOU rate. However, others felt it remained a source of confusion in the marketplace. One person said the way forward was to take a customer systems approach, which would integrate DR and EE incentives.
14. Concern about environmental effects of DR programs. Most participants said they were aware of this concern, that DR programs might increase load significantly in the off‐peak periods and/or for all periods combined,
29

thus resulting in greater discharges of harmful emissions. However, they said this issue had not surfaced in California. They felt the SPM should be modified to include consideration of all effects, including environmental ones. One individual, who cited the $8/ton that is charged for carbon dioxide emissions and the ten percent adder to avoided costs that is included to monetize the costs of NOx and SOx emissions, said that benchmarks were available for valuing environmental impacts. 15. Some have argued that that DR makes the competitive wholesale power market run by the California ISO work more competitively and reduce price spikes. Do you agree? Most people agreed with this statement but were unable to quantify it, given California’s limited experience. They were optimistic that this statement would be validated once the MRTU market came into being next year. 16. Lack of retail competition or direct access. No one argued that lack of retail competition was a barrier. However, they did argue for the inclusion of third‐party aggregators as a way of bringing innovative program designs and marketing channels. One respondent said that utilities lacked the skills and motivation to truly implement innovative DR programs such as dynamic pricing. Another respondent argued that the utilities really did not understand the customer and were better suited to running the wires business. 17. Low capacity and energy prices. One respondent argued this was a serious issue. He mentioned that during last year’s heat storm, prices in the wholesale markets did not rise to abnormal levels. Others agreed that it was difficult to get people focused on DR during a surplus market. One person opined that in general, it was hard to justify programs based on low probability but high impact events. However, another individual argued that the best time to bring in the infrastructure of DR and matching smart prices was when plentiful supply existed. Otherwise, prices would rise suddenly during critical times, causing a consumer backlash. 18. No recent history of blackouts. One respondent said it was hard to get people motivated about DR unless they saw a tangible, immediate benefit from it. She cited the 2001 Energy Crisis when the
30
presence of blackouts acted as a strong motivator for getting people to conserve, even without a price change. 19. State‐federal coordination. This issue was noted by some respondents, but simply to acknowledge that while it was a barrier in the implementation of DR in other states, it had not surfaced as a barrier in California. 20. Retail‐wholesale market disjuncture. Lack of a functioning day‐ahead market was cited as a major barrier by some respondents. One person commented that the creation of such a market next year when the MRTU takes effect will make a major difference. It will be easier to set dynamic prices with reference to a functioning wholesale market than without reference to one.
31

CHAPTER 3: THE STATE OF DR OUTSIDE OF CALIFORNIA
Introduction The purpose of this chapter is to compare the state of DR in California to that in other locations, both domestic and international. We begin by outlining DR programs that are being offered outside of California, and compare and contrast these programs against California’s current offerings. When the information is available, we quantify the level of demand reduction achieved through the existing DR programs and policies. We also identify some of the most significant barriers to DR that exist outside of California. DR programs are offered widely across the U.S. by both utilities and regional transmission organizations (RTOs) and independent system operators (ISOs). According to a recent study by the Federal Energy Regulatory Commission (FERC), 234 U.S. electric utilities offer DR programs.24 Further research conducted by the Department of Energy (DOE) shows that most large C&I electricity customers in 42 of the 50 states have DR and load management options available through their utility, RTO/ISO, or both.25 In another recent study, 48 of 50 U.S. utilities surveyed had DR options available to most residential customers, and all 50 had a DR option available to C&I customers.26 Internationally, DR programs have been widely pursued both in developed countries and emerging economies, as shown in a recent study conducted on behalf of the World Bank.27 There are lessons to be learned from these DR policies. For instance, are there any unique programs being offered internationally that should be pursued in California? Do these programs face the same barriers that have slowed California’s DR adoption? How successful have these programs been in reducing peak demand?
Comparing Demand Response Programs In a recent DOE report to Congress, DR programs were assigned to two broad categories:
Price‐based demand response programs give customers time‐varying rates that reflect the value and cost of electricity in different time periods. Armed with this information, customers tend to use less electricity at times when electricity prices are high.
32

Incentive‐based demand response programs pay participating customers to reduce their loads at times requested by the program sponsor, triggered either by a grid reliability problem or high electricity prices.28
We use terminology in this chapter as we provide a survey of DR programs being offered outside of California.29
Price‐based programs
Real time pricing (RTP)
Participants in RTP programs pay the hourly market price for electricity. Depending on their size, participants are typically made aware of the hourly prices on either a day‐ahead or hour‐ahead basis, with larger customers — typically above one MW of load — facing hour‐ahead prices. These programs most accurately reflect the cost of producing electricity during each hour of the day, and thus provide the best price signals to customers, giving them the incentive to reduce consumption at the most expensive times. RTP programs are typically only offered to larger C&I customers on an opt‐in basis, although Niagara Mohawk has RTP as a default rate. Georgia Power has one of the most successful RTP programs for C&I customers. With over 1,600 customers enrolled, the utility has achieved a 750 MW reduction during high priced hours.30 This represents seventeen percent of demand during those hours.31 Depending on the price level, the fraction of participants responding ranged from forty percent to eighty percent. Maryland, Pennsylvania, and the Carolinas are a few of the other states that also have real time pricing options available to C&I customers. In fact, RTP is available in any state that has a restructured power market, and in many cases, such as New Jersey, New York, and Illinois, it is the default rate. Over 70 utilities have offered RTP either in a pilot or as a permanent program.32 However, in a recent survey of 65 utilities (both domestic and international), only one (Commonwealth Edison) currently offers residential RTP.33 Through this program, participants are notified of the hourly prices on a day‐ahead basis and receive a participation credit in addition to the potential bill savings that they could realize by participating in the program. The program was expanded to all residential
33

customers in January 2007 after approximately 1,100 customers, representing roughly 330 MW of demand, participated in the RTP pilot. Internationally, RTP is used by ESKOM, the state‐owned utility in South Africa, for its largest customers. ESKOM has 1,400 MW of load on day ahead RTP. These customers drop their load by 350‐400 MW for up to three consecutive hours when faced with high prices.34 RTP has also been offered as the standard rate for large customers in other regions, such as England and Wales, Australia, and New Zealand.35
Critical peak pricing (CPP)
Under a CPP rate, participating customers pay higher peak period prices than they would on their otherwise applicable tariff during peak hours on the few days when wholesale prices are the highest. In return, the customers pay a lower off‐peak price that more accurately reflects lower off‐peak energy costs for the duration of the season (or year). Thus, the CPP rate attempts to convey the true cost of power generation to electricity customers and provides them with a price signal that more accurately reflects energy costs as well as the opportunity to minimize their electricity bills. While different forms of CPP are currently being offered by the IOUs in California, CPP is not available in most other parts of the U.S. It has, however, been offered to small customers by Gulf Power in Florida. In Gulf Power’s “GoodCents Select” program, the CPP rate is offered as a rider on top of a TOU rate. Gulf Power estimates that it had roughly 6,000 participants enrolled by 2003, accounting for roughly one MW of demand reduction.36 In Pennsylvania, a pilot was conducted by GPU (now FirstEnergy) in 1997 to test the impacts of a CPP rate. The study found that peak demand reductions resulting from the critical peak rate were around twenty‐six percent on average.37 CPP pilots have been conducted in several other states as well, including Florida, North Carolina, Ohio, and South Carolina, suggesting that CPP may become more widely available in the near future. Outside of the U.S., a form of CPP is being offered by Electricite de France (EdF), through their “Tempo” rate program. This program features two daily pricing periods and three types of days, which are named after the colors of the French flag.
34

The blue days are the most numerous (300) and least expensive; the white days are the next most numerous (43) and mid‐range in price; and the red days are the least numerous (22) and the most expensive. The ratio of prices between the most expensive time period (red peak hours) and the least expensive time period (blue off‐peak hours) is about fifteen, reflecting the corresponding ratio in marginal costs. CPP was originally offered in France in 1993 as a voluntary program and currently has over 120,000 enrolled participants.38 In Canada, Hydro Ottawa is in the process of beginning their “Smart Price Pilot”, which will test the impacts of CPP, TOU, and a relatively new rate scheme called Peak Time Rebate (PTR) on 375 voluntary residential participants.39 The PTR program is related to CPP, but instead of a higher rate during critical events, participants are provided a rebate for every kWh of load reduction during the critical period. This was recently tested in California by Anaheim Public Utilities and was subsequently adopted by SDG&E. The Ottawa pilot will be the first residential PTR pilot outside of California. Both PTR and CPP will be offered in conjunction with Hydro Ottawa’s TOU rate program, which is expected to be the largest in North America by 2007. Orion Energy New Zealand, a distribution utility, has also implemented CPP over the last decade. The utility initially introduced CPP along with demand‐side management (DSM) programs designed to reduce consumption and demand Orion no longer runs the DSM programs, but the pricing alone has remained hugely effective in the market, delivering significant peak demand reductions. Orion’s peak demand today is still the same as it was some nine years ago despite high economic growth.40
Time‐of‐use pricing (TOU)
Time‐of‐use rates are the most common of the time‐varying pricing options. The rates can vary by season (i.e. a higher rate in the summer than winter) or over the course of a day (a higher rate during the peak period than the off‐peak period). TOU rates are very common with residential customers and have been deployed widely across the U.S. Utilities in other parts of the U.S. have achieved significant impacts through TOU rate offerings. Salt River Project (SRP) and Arizona Public Service (APS) are examples of utilities that have successfully implemented residential TOU rates. In the Phoenix area, these utilities have enrolled nearly one‐third of their customers on TOU rates. APS offers multiple TOU options to encourage a higher rate of
35

participation, and combines one of the options with a demand charge. Both utilities have stressed the importance of educating customers about the rates, potential bill savings, and benefits to the grid.41 TOU rates have also been offered with some success in the Pacific Northwest, despite the fact that it is a low‐priced region with cheap hydroelectric power. In particular, BC Hydro was able to attract customers to its TOU rate by offering a variety of pricing options that allowed the utility to identify market segments and customers that would benefit the most from the various pricing schemes.42 Internationally, TOU is also popular for large customers. In Australia, ETSA Utilities currently offers a seasonal tariff, and utilities and retailers are beginning to introduce tiered TOU rates to residential and small C&I customers as well. The province of Ontario is currently rolling out an advanced metering infrastructure. By the year 2010, it is expected that all customers will be on default TOU rates. These rates will feature three pricing periods, with the peak period costing three times as much as the off‐peak period and the mid‐peak period costing two times as much.43 Additionally, some studies have found that TOU rates can lead to reductions not only in peak demand but also in consumption. For example, Finland has been offering TOU rates to residential customers since the 1970s. The program has been successful in reducing load, with a 1992 study finding that the program has reduced energy consumption for participating customers by three percent.44 China has also had particular success with TOU. In Beijing, by the end of 2003, 77,400 consumers representing sixty‐two percent of total consumption were on TOU prices. About 700 MW was shifted as a result of this pricing structure. Other parts of China, such as Jiangsu, Guangdong, and Shanghai, have had comparable success with TOU rates. Similarly, in Thailand, several versions of TOU rates have reduced peak demand by as much as 700 MW of .45
Incentive‐based programs Incentive‐based programs come in many forms, such as Demand Bidding, Emergency Demand Response, Curtailable Service, and Direct Load Control. Most states and countries provide incentive‐based programs in some form, and typically have a much longer history with these types of programs than with price‐based programs. Incentive‐based programs can be implemented either by an ISO/RTO, or by a utility itself. They all provide an incentive to reduce load that is not in the form
36

of a retail electricity rate. The primary criteria that differentiate these programs are as follows:
Voluntary reduction vs. mandatory reduction
One of the major distinctions between various incentive‐based programs is whether the participant’s demand reduction is voluntary or mandatory. In voluntary programs, the participant does not face repercussions if he does not provide a demand reduction. However, mandatory programs typically involve a stiff penalty fee for non‐compliance. Interruptible service programs and capacity market programs generally incorporate such a penalty. There is also a distinction between programs with voluntary participation and those with mandatory participation. While demand reduction is mandatory for participants in interruptible service programs, enrollment in these programs is voluntary. However, there are also programs, such as SDG&E’s 20/20 program for small commercial and industrial customers, in which all customers are enrolled and are eligible for the incentive, but are not required to reduce demand when events are called. Many states offer programs with both voluntary and mandatory curtailment policies. For example, BG&E’s Economic Load Response Program rewards customers for curtailing load voluntarily when notified by the utility, but does not penalize for non‐compliance. The company also has a Firm Capacity Incentive program in which customers receive a higher payment for a prearranged amount of load curtailment, but are penalized if this curtailment is not met. Programs run by PJM follow a similar structure. California utilities offer both types of programs as well. Internationally, interruptible service programs with mandatory curtailment have also been widely offered. In Australia, the most prevalent DR program is an interruptible program named Callable C&I. Under this program, customers agree to a mandatory load curtailment for a specified number of events or hours in exchange for a discount or credit.46 A recent study has suggested that the total market potential for this program is 2,300 MW, representing over eighty‐five percent of Australia’s potential demand reduction through DR.47 Spain’s program, called Flexible Interruptibility System, also has mandatory curtailment as a characteristic. Over 200 large C&I customers are enrolled in this program, representing 2,400 MW of curtailable load and 6.3 percent of peak demand.
37

Active bid vs. call from utility
A second important distinction is whether the program participant actively bids its proposed reduction into a market at a specified price when he so chooses, or if the participant is called when the utility or ISO needs the reduction. In the first instance, the participant has the flexibility to specify both the price and time at which the load reduction will be available, and is not required to reduce load unless the bid is accepted. Programs such as these are often referred to as demand bidding programs. Ancillary services programs also involve bidding load curtailments into a market. Demand bidding programs are offered by many utilities across the country, although the most well‐known programs are offered by ISOs. NYISO, ISO New England, and PJM all offer sizeable demand bidding programs. These programs are generally offered to large C&I customers with at least 100 kW of curtailable load. In California, demand bidding programs provide a significant share of the state’s DR. In fact, the day‐ahead demand bidding programs are generally the largest of the “price responsive” category of DR programs.48 Sweden and Finland are both examples of countries with some form of demand bidding or ancillary service program. These countries each have roughly 400 to 500 MW of load under contract through the programs.
Utility‐controlled reduction vs. participant‐controlled
In most DR programs, the participant ultimately controls whether he reduces his electricity consumption. However, in direct load control (DLC) programs, the utility remotely controls equipment at the participant’s site. A recent survey found that DLC is the most widely offered residential DR program, with more than thirty‐five percent of the surveyed utilities offering DLC in some form.49 In Florida, Gulf Power has reported forty percent reductions in peak demand from certain groups of customers on its direct load control program.50 A common form of DLC for residential customers is called A/C cycling, in which the customer’s central air conditioning system is effectively turned down by the utility on days of system emergencies. BGE’s Rider 5 program is one example of this. In California, SCE also offers an A/C cycling program while PG&E is offering a new A/C cycling program beginning this summer. Internationally, Hydro One in Ontario, Canada launched a new residential DLC program in the summer of 2006. The program provides customers with a free smart
38

thermostat that allows them to control the setting on their central air conditioning remotely over the internet. The technology will also give Hydro One the ability to increase the temperature of the participant’s house up to a maximum of two degrees during critical events in the summer. In Australia, much of the focus of a recent study was on the potential for DLC. However, the study found that only six percent of Australia’s total DR potential could be met through DLC because most electric customers do not have central air conditioning.51
Price‐triggered vs. emergency/reliability‐triggered
Many incentive‐based programs are only called at times when the system operator or utility determines that the need for peak load reduction is critical. This can occur either when electricity prices are high or when demand is near the reserve margin and there is an increased risk of grid failure (such as blackouts). This distinction does not define any particular program, but is something that can vary within a program category. For example, a participant in a voluntary interruptible service program could be called in the event of high prices, or in the event of a system emergency (such as PJM’s Economic Load Response and Emergency Load Response programs, respectively). In California, the IOUs implement programs that are triggered by both price and system emergencies, as do most other ISOs and utilities in the U.S.
Market‐based payment vs. fixed price
Incentive‐based programs also differ in terms of the nature of the incentive that is being offered. Many programs, such as PSE&G’s Curtailable Electric Service program, offer a pre‐specified fixed price per kW of reduced peak demand. In the case of PSE&G’s program, $6.48 is provided for every kW reduction below a baseline amount specified by the utility. Other programs, like ISO New England’s Real‐Time Demand Response Program, offer a payment that is the higher of the real time LMP and a guaranteed floor price of $350/MWh or $500/MWh (depending on response time) for voluntary load reduction during critical periods.
Other program characteristics
The amount of response time that is provided to the participant is another characteristic of these programs. Some programs will provide a call for demand
39

reduction the day before it is needed, and other programs will provide as little as 15‐30 minutes of notice. The incentives are generally higher for programs with shorter response times.52 Additionally, some programs allow distributed generation to be used to replace the curtailed load, while other programs require a net load reduction.
Technology Assistance / Financial Incentive
A final type of program that does not fit neatly into the above categories is Technology Assistance and Financial Incentives53. Under this program, customers receive assistance to identify ways to reduce their peak demand. They also receive financial incentives to pursue these demand reductions. In Connecticut, CP&L’s participating customers receive $300/kW to $500/kW for demand reduction resulting from newly installed equipment. In California, all three IOUs offer similar programs.
Barriers to DR Many countries and states outside of California face barriers to DR that are similar to those in the California, as described in Chapter 2 of this white paper, as well as significant additional barriers. These barriers are described below and compared to the DR barriers in California. Implementation restrictions: Many consider the CPUC’s current interpretation of State Water Code Section 80110, established through AB1X to be a significant barrier to DR in California. The code prohibits:
. . . increas[ing] the “electric charges in effect on the date that the act that adds this section becomes effective [February 1, 2001] for residential customers for existing baseline quantities or usage by those customers of up to one hundred and thirty percent of existing baseline quantities, until such time as the department [the State Department of Water and Power] has recovered the costs of power it has procured for the electrical corporation’s retail end use customers. . . “54
The CPUC has interpreted this language as a cap on increases in the electricity rates for the first portion of each residential customer’s usage.55 This effectively restricts the ability of utilities to offer TOU or dynamic rates to residential customers because it would likely be impractical to charge customers under two completely
40

different rate structures when the shift between those structures was contingent upon their rate of consumption between meter read dates. Utilities in New York currently face a similar problem. In New York, state law prohibits utilities from placing residential customers on mandatory TOU rates, forcing them to provide these rates on an opt‐in basis and effectively reducing the participation rate. Additionally, many areas in PJM have had low, fixed tariffs that, when contrasted with wholesale prices, do not provide incentive for participation in DR programs. However, these areas are beginning to increase their rates. As this happens and customers look for additional ways to reduce their electricity bills, the popularity of time‐varying rates could improve. Financial disincentives for utilities: Outside of California, many utilities lack the financial incentive to provide DR programs and reduce peak demand because utilities are compensated based on sales volume. This has not been a barrier to DR in California due to the decoupling of profits and sales volumes which allows California IOUs to recover lost revenue that would otherwise result from load management. Outside of California, decoupling has also been approved in Oregon and is being considered in other states. Lack of funding: According to a recent FERC study, policies regarding the disbursement of state funds that were previously dedicated to energy efficiency can prove to be a significant barrier to obtaining appropriate funding for DR programs. In particular, in Connecticut a commissioner indicated that there was a lack of support for allocating a portion of the system benefit charge to DR programs.56 Similarly, in California the size of the EE budget is much larger than that of DR. One participant in the interviews cited in Chapter 2 suggested that his utility was spending $5 on EE for every dollar spent on DR. Technological barriers: Just as many of California’s small customers (less than 200 kW of demand) do not currently have AMI, the low market penetration of interval meters in Australia has posed a similar barrier to DR for residential customers there. However, as AMI rollouts increase, such as the statewide rollout that will take place in Victoria in 2008, it will be possible to provide more customers with dynamic pricing.57 This is also the case in California, where one IOU is already ramping up its AMI rollout, another is poised to begin the implementation process following a CPUC decision due for approval in early April 2007, and a third is in the process of preparing its formal application to the CPUC.
41

Lack of measurement and evaluation standard: To accurately assess the benefits of DR, it is necessary to have standardized practices for quantifying and measuring the value of demand reduction. In California, while some cost‐effectiveness tests have been developed, no standard has been set. The issue is being examined in a new CPUC proceeding (R.07‐01‐041). According to the recent FERC study on DR, this continues to be a problem for other states in the U.S. as well. The study finds that practices for calculating peak demand reduction are highly inconsistent across ISOs. Furthermore, this study finds that there has been “no consistency in the evaluation methodologies that have been conducted by the ISOs on their programs.”58 In fact, the study identifies California as a leader in these areas. Lack of customer awareness and educations: A study on DR in Australia cites a lack of customer education as an early barrier to DR. The study suggests that not only do customers need to fully understand the dynamic rate structure, but they should also be made aware of the financial and societal benefits of participating in DR programs.59 Lack of customer awareness and education has also been cited by Toronto Hydro Energy Services as a potential market transformation barrier for DR.60 As discussed in Chapter 2 of this white paper, lack of consumer interest and ineffective program marketing are recognized as potential barriers to DR in California as well. Competing jurisdictions between state and federal government: A frequently cited barrier to DR is the conflict between RTOs and state public utility commissions for control over DR programs. However, a recent study found this is not as significant as many have thought. Interestingly, the one geographic area in which the study did note some jurisdictional‐related issues was California. The study finds that DR programs have remained primarily with the utilities, rather than as a shared responsibility with the California ISO, and the California ISO’s ability to become involved in DR is further complicated by the existence of two regulatory agencies in the state.61 However, this was not identified as a major barrier in the survey described in Chapter 2 of this white paper. Uncertainty/Risk: Customers, retailers and manufacturers have shown some hesitation in investing in the equipment and training necessary to implement DR programs. This has been cited as a particular concern in PJM. Furthermore, a FERC study cites the inherent “boom and bust” nature of DR programs as an impediment to their adoption. Volatility in electricity prices has also posed a barrier because DR programs tend to expose customers to a greater amount of uncertainty in prices.
42

CHAPTER 4: PATHWAYS TO THE FUTURE It is unlikely that California will meet its goal of a five percent reduction in system peak demand through price‐based DR programs since current projections indicate that the likely impact will be 2.2 percent for the three IOUs combined. When compared with DR progress in other regions, both within and outside the United States, California is ahead in some respects and behind in others. However, California does deserve credit for establishing a specific goal for price‐based DR and for clearly defining the role of DR in its resource procurement loading order. California also deserves credit for having installed smart meters on all customers above 200 kW after the 2001 electricity crisis and for beginning to move toward equipping all other customers where it has been shown to be cost‐effective for all ratepayers. To put this development in perspective, the Canadian province of Ontario plans to change all its meters to smart meters by the year 2010 and to move all customers to default TOU rates. Italy’s national utility, ENEL, is replacing all meters with smart meters, largely on the basis of operational saving. Australia is conducting pricing pilots to quantify the benefits of DR and similar tests are underway in countries such as New Zealand. Historically, California was one of the first states in the United States to make TOU rates mandatory for commercial and industrial customers above 500 kW. This happened soon after the passage of the Public Utility Regulatory Policies Act (PURPA) in 1978 due to the leadership of the Energy Commission through its load management standards authority. This move toward cost‐based pricing was taken by the state’s policymakers even though it meant the elimination of subsidies from flatter‐than‐average customers to peakier‐than‐average customers, i.e., it involved sizeable transfer payments within the rate classes. Severin Borenstein has quantified these transfer payments with a data set of more than a thousand large customers located in northern California.62 He finds that the transfer payments were large and significant. Interestingly, he also quantifies the “second generation” transfer payments that would occur if these customers were now moved from mandatory TOU rates to mandatory real‐time pricing (RTP). Borenstein finds that the two generations of transfer payments are roughly equal in size, under a variety of different assumptions about RTP price volatility and customer price elasticity of demand. He suggests using a two‐part RTP design, like the one used by Georgia Power Company, to mitigate adverse customer bill impacts
43
and to overcome their risk aversion. Although California’s IOUs have been looking at such rate designs, progress toward even a simplified CPP rate design has been stymied. Perhaps a two‐part CPP rate design should be considered. This idea and others for broadening the appeal of dynamic pricing are discussed later in this chapter. Borenstein’s research points out a neglected policy issue: why was it easier for the state to make the first transition (from flat to TOU rates) than to make the second one (from TOU rates to CPP or RTP rates), given that both transitions involved equally sized transfers between customers? In both cases, a crisis had taken place in energy markets. The first crisis was in world oil markets. The second crisis was in California’s electricity markets. For California electricity ratepayers, the second crisis is arguably more important than the first. Is it true that, as is often argued, customers have taken all the actions they could take? This is contradicted by findings from recent work on “Auto DR” being conducted by the Demand Response Research Center, which indicates that many large customers are able to drop loads by between ten and fourteen percent without severe negative impacts on comfort or operations. Many states in the east and mid‐west that have restructured their power markets have moved all large customers, typically those above one MW load, to default hourly RTP rates. These customers can opt‐out to other rates and/or purchase financial hedge products being offered by competitive providers. California has been reluctant to make such a move. However, a case could be made for moving these customers to default dynamic tariffs, whether RTP or CPP, and giving the option of switching to other rates being offered by the utilities. This idea is elaborated upon in a 2002 paper by Severin Borenstein, Michael Jaske, and Arthur Rosenfeld, which suggests that all customers, residential and C&I, be placed on some form of default time‐varying or dynamic rate.63 California’s leadership is undisputed in the field of energy efficiency.. During the past three decades, the state has instituted stringent standards for energy efficient appliances and building construction. As a result, per capita electricity consumption in the state has been roughly constant at around 7,500 kWh per year while it has risen by about fifty percent in the U.S. as a whole. Like all other regions, however, California is struggling with a host of issues when it comes to realizing the market potential for DR. Its load duration curve, shown in Chapter 1, is nearly as “peaky” during the top 100 hours of the year as it is in most other regions where residential load is a major segment of total system load. In
44

California, ten percent of the system peak demand occurs in the top 100 hours, or 1.1 percent of the hours in a year. In Ontario, Canada, for example, the top 32 hours (or 0.4 percent of the hours of the year) account for 2,000 MW of load against a peak load of 27,000 MW.64 Similarly, in PJM fifteen percent of the system peak occurs during only two percent of the hours per year.65 Many of the issues facing the widespread adoption of DR in California were raised in conversations with stakeholders as summarized in Chapter 2. California needs to resolve the 20 issues listed in that Chapter to expand the size of the DR in its resource portfolio. While the 20 issues are inter‐related and complex, it is easier to discuss them by grouping them into four broad categories: regulatory policy issues, analytical needs, customer perception and program design needs, and technological issues. Each of these is discussed below.
Regulatory Policy Issues Regulatory policy issues include the need to develop realistic goals for DR, address constraints created by the AB 1X rate freeze that applies to seventy percent of electricity consumed by residential customers, address the problems created by inter‐customer rate subsidies within the residential class, and ensure that default rates reflect the state’s policy objective of cost‐based pricing while also achieving explicitly articulated social goals such as CARE discounts and baseline protections for basic levels of consumption. The current goals differentiate between day‐ahead notification, that is, price‐responsive programs with the goal of reducing predictable peak loads on critical days, and day‐of notification, for reliability‐triggered programs that have the goal of mitigating unpredictable emergency conditions threatening system reliability. It may be useful to re‐think this distinction, especially in light of the following comments from the 2005 Large Customer Evaluation Report, which stated:
Our analysis … has shown that the large customer market for voluntary, price responsive programs is still immature. With the exception of one large customer’s contributions … impacts from the 2005 day‐ahead programs represent only a small fraction of the CPUC’s price‐responsive DR goals.
The report also noted that the market potential for achieving greater DR impacts was small given the modest level of current incentives. It noted that it may “take many years to reach the CPUC’s price‐responsive goals, if they could be reached at
45

all.”66 As a way of improving the chances of success, the report recommends disaggregating the goals by customer size category. For customers with under 200 kW demand, one of the key issues is the problem posed by inter‐customer rate subsides. Currently, the higher cost of serving peak load is borne by all customers as a basic rate component. Thus customers with higher than average peak demand are being subsidized by customers with lower than average peak demand. Unless these subsidies are phased out, many of the state’s 10 million customers will not find it attractive to participate in price‐based DR programs. Two sidebars at the end of this white paper illustrate the magnitude of the problem posed by the existing rate subsidies and show that these subsidies amount to billions of dollars and represent a serious disincentive to meeting DR goals. Sidebar 3 addresses subsidies created by the AB 1X rate freeze and Sidebar 2 deals with subsidies created by non‐time varying default rates.
Analytical Needs Analytical needs include modifying existing cost‐benefit methodologies for evaluating demand‐side programs, developing protocols for measuring the impact of DR programs, and developing innovative rate designs that account for the varying degrees of risk that are embodied in dynamic pricing rates versus traditional, non‐time varying rates and static TOU rates. Existing cost‐benefit methodologies are laid out in the Standard Practice Manual (SPM). They were originally designed for evaluating energy efficiency programs that are expected, in general, to hold constant the level of service. DR programs, by definition, change the level of service—at least temporarily. Thus, an allowance has to be made for the loss of service to the customer in assessing their cost‐effectiveness. One way of doing this is to move away from the traditional SPM tests, such as the participant test, the total resource cost test and rate impact test, to one based on an “economic surplus” test perspective that evaluates changes in consumer surplus and producer surplus caused by the DR program. An example appears in Sidebar 5 at the end of this paper. Another cost‐effectiveness issue that needs to be accounted for is the “call option” nature of DR programs. DR programs are intrinsically dynamic and create option value that goes beyond the value created by static energy efficiency programs and even by traditional TOU rate programs. Programs that can be called on a day‐ahead basis are more valuable than their static counterparts and programs that can be
46

called on a day‐of basis are more valuable than those that are called on a day‐ahead basis. In terms of measuring program impacts, the Statewide Pricing Pilot (SPP) demonstrated the power of econometric models for estimating the impact of different pricing regimes. The experimental nature of the pilot enabled accurate measurements by featuring control and treatment groups and before/after treatment measurements. The SPP found that CPP rates could reduce average residential peak demand by about thirteen percent. The underlying impact estimation model, PRISM, has been used by all three investor‐owned utilities to develop business cases for AMI. However, because of AB 1X limitations and concerns about customer backlash, none of the utilities has proposed to make dynamic pricing rates such as CPP the default tariff. Thus, their impact projections are lower than the market potential. A rough estimate of the market potential can be obtained by applying the thirteen percent average load reduction to the residential peak demand of 15,000 MW, yielding an estimate of 1,950 MW.67 It is important to keep in mind that this projection does not account for customers deploying smart thermostats or other enabling technologies, which was demonstrated in the pilot to further boost response to twenty‐six percent. If even a third of the customers had smart thermostats installed, the weighted average impact would rise to some seventeen percent, yielding an estimate of 2,500 MW. The impact potential estimates from the SPP do not account for longer‐term impacts that may occur as customers learn and adapt their lifestyles to incorporate the peak cost of electricity into their energy use and technology purchase decisions. On the other hand, the impact of 1,950 MW does not account for customers opting out of the default tariff to a non‐dynamic tariff, which may lower the aggregate impact by as much as twenty percent. This simple approach to estimating market potential is not intended to convey definitive estimates, since those are the province of an ongoing research project funded by the Energy Commission. However, they are suggestive of the possibilities. The econometric methodology pioneered in the SPP can be applied to quasi‐experimental and non‐experimental data of the type that flows from actual program adoption. It can be used to infer normal or “baseline” usage levels from which observed usage levels can estimated to infer DR program impacts. Another methodology was used in the Large Customer Evaluation report, which was charged with analyzing the impact of DR programs for customers above 200 kW
47

demand. This analysis pointed out that the 3‐day baseline method commonly used in the industry was prone to an upward bias of two to four times the true impact. The report recommended using a 10‐day method. The biases inherent in any such method need to be assessed further. However, a key challenge in all such measurements is that they tend to focus on short‐term behavioral changes, unless specific control technologies such as smart thermostats are also used in the program design. In that instance, certain types of long‐term impacts can be inferred. However, to observe all long‐term impacts, one would have to allow new end‐use technologies such as thermal energy storage to be installed and for sufficient time to elapse so that customer behavior can be fully adapted. The only way that can be observed is through designing new experiments and/or observing customer behavior over a minimum of five years. In certain instances, international experience can be useful, especially with storage systems. Such data is available for several European countries, particularly for heat storage.
Customer Perceptions and Program Design Needs Everyone, including the IOUs, agrees that ineffective program design and marketing pose a significant threat to achieving the state’s DR goals. Much can be done in the area of educating customers about the need for DR and redesigning DR programs so they appeal to customers. But before educational materials are developed, it would be useful to understand customer perceptions, concerns and needs. Before the SPP was launched, 11 focus groups were conducted throughout the state to gather insights about potential barriers to customer participation in the pilot. The insights from the focus groups helped in redesigning the “welcome package” that was sent out to participants, provided insights on how to simplify monthly electricity bills and were helpful in conceiving the website load shape displays. They also helped prove that customers could understand dynamic prices. It may be useful to conduct focus groups this summer to identify customer concerns and issues before pushing through with the next wave of DR programs. This is especially important to do since there are widespread misperceptions about dynamic pricing. Soon after the CPUC approved PG&E’s AMI business case, and the event was cited in the mass media, one of the newspapers in northern California ran a Saturday Forum to gauge public reaction. Letter writers provided a variety of perspectives, all of which provide unique insights into customer perceptions and misperceptions.
The main objections are summarized below, along with suggested solutions.
48

Table 7: Sample Public Reaction to PG&E’s AMI Business Case
Issue Objection Solution 1 Costs do not vary by time‐of‐
day so there is no reason for rates to vary by time of day
Show customers that costs do vary by time of day and explain to them, in simple language, that electricity cannot be stored economically in large quantities and that peaking capacity costs a lot more than baseload capacity.
2 There is no reason for demand response. The California energy crisis was caused by market manipulation by corrupt energy traders.
Again, this is an opportunity to educate customers. While not every customer understands demand and supply curves, a surprisingly large number do. Even those who don’t can be persuaded by reference to examples from other industries where demand response keeps prices in check.
3 My energy company is a monopoly. Why would they want to do something that would lower my bills?
Yes, it is a monopoly but a regulated one. It is designed to serve a public purpose. For years, utilities have been helping customers lower their bills by offering energy efficiency programs. Dynamic pricing programs are an extension of the same concept.
4 I cannot curtail my peak loads because I have young kids, old parents, sick relatives or because I work at home.
Not every customer needs to respond during every event but everyone has an incentive through these new tariffs to save on their monthly energy bill. The SPP showed that eighty percent of the response came from only thirty percent of the customers, so even within the SPP there were probably several customers who did not respond at all. Similar results showing that a large portion of the DR impact comes from relatively few customers have been found by Duke Power, Georgia Power and Niagara Mohawk with their large customer dynamic pricing programs. They were also documented in the large customer impact evaluation report.
5 Since meter readers will no longer be needed, why do I have to pay for the installation of new meters?
Show customers that the initial costs of the new meters are offset by operational benefits and demand response benefits over the long term
49

Utility program design is often encumbered with constraints that flow from traditional ratemaking practices. The most obvious problem is posed by the provision of revenue neutrality, which means that any move toward dynamic pricing would make half of the customers worse off. This will create fear and misperception about bill increases even among the half that will be made better off, since no one knows for sure on which side of the neutral‐impact line they lie. This fear and its potential political ramifications may be a significant barrier to implementation. There are several ways for dealing with this problem:
• Use a two‐part rate design. This has worked well for RTP rates and could also be used for other dynamic pricing rates, such as CPP. In a variation of this method, further price protection would be provided by instituting price caps and floors on the RTP rates (such protections are already built into CPP rates).
• Tilt the rate computation so the dynamic pricing rate would make more than half of the customers better off.
• Provide a one‐time or recurring cash incentive for customers who join the program. Similar payments are often made for reliability‐triggered programs.
• Give a limited‐term bill protection guarantee to customers while they learn how to adapt to the new rates.
• Give participating customers a credit equal to the hedging premium.
The last approach mentioned requires some elaboration. It would involve crediting customers for the hedging cost premium that is embodied in today’s non‐time varying rates. As shown in Sidebar 4, a very conservative estimate for the hedging cost premium is three percent.68 If no credit is given for the hedging cost premium, and if there is no DR, half of the customers would be made worse off with dynamic pricing (under the revenue neutral principle). However, if policy makers want to broaden the appeal of dynamic pricing rates, they should explore what Illinois is doing under the leadership of Commissioner Bob Lieberman of the Illinois Commerce Commission. Commonwealth Edison is providing a credit equal to the hedging premium, which it has estimated to be ten percent for its residential RTP program. Some analysts at the 2006 National Town Meeting on DR, drawing upon research conducted on large customer markets in
50

New York, suggested that the hedging premium may be as high as twenty‐five to thirty percent. For now, with a conservative estimate of three percent and assuming that the average customer will show a DR impact of ten percent, more than ninety‐five percent of customers would be better off with CPP than with traditional, non‐time varying rates.69 The results, based on actual customer load profiles from a sample of two hundred customers located in the mid‐Atlantic region, are shown in the figure below. Figure 2: Distribution of Bill Impacts with Hedging Cost Premium
and Demand Response
-25%
-20%
-15%
-10%
-5%
0%
5%
10%
15%
20%
0% 10% 20% 30% 40% 50% 60% 70% 80% 90% 100%
Percentile of Customer Base
Elec
tric
ity B
ill In
crea
se (D
ecre
ase)
Revenue Neutral
Credit for Hedging Cost Premium
Demand Response Plus Credit for Hedging Cost Premium
Customers with Peakier ConsumptionCustomers with Flatter Consumption
In addition, to facilitate the introduction of new, market based ideas into program design and marketing, it would be useful to give an expanded role to third‐party aggregators. They would bring the innovativeness associated with retail competition to the market place, and overcome some of the limitations associated with lack of direct access in California’s market.
51

Finally, it may be important to identify any lessons that can be learned from the state’s extensive history with EE programs. EE spending is about five times the size of DR spending. By 2003, California had saved nearly 40,000 GWh of energy consumption through EE programs and standards. Roughly half of this reduction has been a result of the state’s EE standards alone,70 as illustrated in Figure 3. Figure 3: Cumulative Energy Savings of California Standards and
Energy Efficiency Programs
Source: Energy Commission Staff Report, Options for Energy Efficiency in Existing Buildings. December 2005. Data Source: Energy Commission SDM forecast model output How can the DR market be similarly transformed? One of the transforming factors has been the Energy Commission’s appliance and building efficiency standards, as carried out under Titles 20 and 24, which raises the question whether the Energy Commission should revisit its load management standards that helped kick‐start the DR effort in the late 1970s.
Technological Issues While many experts believe that technology no longer poses a barrier to the rapid deployment of DR, the issue comes up enough number of times that it needs to be addressed. There are several reasons why that might be the case. First, there is still a perception that technology is a barrier. This needs to be addressed for policy makers and customers alike. A substantial body of research and
52

market experience already exists that demonstrates the viability of active load reduction technologies and EE technologies that provide load reductions. A white paper summarizing the current market for such technologies could help address this issue. Second, while advanced metering, billing and communication technology may be available, they are not widely deployed. The reasons should be catalogued and prioritized. Again, a white paper may be useful. It should address the following factors by market segment: high cost, poor reliability, lack of availability, lack of contractor installation, and lack of after‐sales service capability. Third, it may be that the primary concern is not about metering and billing systems but about control technologies. Finally, there is definitely a concern about end‐use technologies and systems such as thermal energy systems, back‐up generation and so on.
Conclusions While Californiaʹs DR goal is unlikely to be met this year, substantial progress has been made in laying the foundation necessary to surpass that goal in the future. Installation of the advanced metering infrastructure needed to support dynamic rates and pay‐for‐performance programs for all customers has started. Analytical issues have been identified and development of improved methods of measuring impacts and comparing program cost‐effectiveness is underway. Customer needs are being identified and program designs are improving. Barriers to progress have been revealed by current implementation efforts. State energy policymakers can now quickly build from this foundation with increased and more‐focused policy options and programs to achieve the stateʹs demand response goals in the near future.
53

APPENDIX A: SPECIFIC HIGHLIGHTS OF THE NOVEMBER 2006 CPUC DECISION More attractive options for customers: Simpler incentive structures, more flexible rules for the programs, simplified enrollment processes, and enabling customers to participate in some programs through third‐party aggregators. PG&E’s Air Conditioning Cycling (AC) Program is approved: AC Cycling is a device that can switch off a customer’s air conditioner unit when the utility needs immediate reductions in load. Customers who participate in this program typically receive a bill credit. PG&E has proposed a program to install 5,000 switches in 2007 and fund 10 years of operating and maintenance costs. Increased incentives for technologies that will enable customer participation: Incentives were increased for the Technical Incentives program, a rebate program that offsets the costs of enabling technology that a customer installs to participate in demand response programs. Permanent Load Shifting is encouraged: The utilities are directed to solicit 5‐year proposals from customers and aggregators for permanent load shifting that can be implemented by summer 2007. Each utility was directed to file an advice letter with their proposals by February 28, 2007.
54

APPENDIX B: TAXONOMY OF DEMAND RESPONSE PROGRAMS DR programs can be grouped into two classes, price‐based and reliability based. Most DR programs are regarded as dispatchable on a day‐ahead or day‐of basis. Within each class, there are several sub‐types.
Price-Based Programs The objective of this class of programs is to improve economic efficiency in the consumption of electricity and to ensure that customer energy service needs are being met at lowest cost. Well‐designed pricing programs can also be more equitable than traditional rates, since they do a better job of matching rates to costs and eliminate subsidies between customers. A representative list of rate options appears below. Real Time Pricing (RTP). Prices may vary on an hourly and sometime on a semi‐hourly basis. Customers are provided the prices on a day‐ahead or hour‐ahead basis. RTP may apply to a customer’s entire usage (one‐part rate) or to their usage that deviates from a pre‐specified baseline usage (two‐part rate). RTP may be offered with a price‐cap and a price‐floor to better manage customer risk. Variable Peak Pricing (VPP). Prices vary by time‐of‐day but they are known to the customer for peak and off‐period periods. However, they are not known in advance for the critical‐peak period. Critical‐Peak Pricing (CPP). Prices vary by time‐of‐day and are known to the customer for all pricing periods except that the customer does not know when prices in the critical‐peak period may be called. These prices are called on a day‐ahead or day‐of basis. Time‐of‐Day (TOD) Pricing. Prices vary by time‐of‐day. Since this rate is not dispatchable, it is not a form dynamic pricing and for this reason, most analysts do not consider it a DR program. However, it is a “time‐based” rate and meets the requirements of EPACT 2005. Seasonal Pricing. Prices vary by season. This rate faces the same issues as a TOD rate when it comes to it being classified as a DR program.
55

Reliability-Based (or Emergency-Based) Programs The objective of this class of programs is to prevent rolling brownouts and blackouts, i.e., to keep the lights on. Load curtailment incentives (pay for performance). Customers are paid a specified amount per MWh curtailed in response to a call that is made on a day‐of basis. This requires the specification of a baseline or normal usage. Curtailable/interruptible rates. Customers pay a lower rate in return for agreeing to curtail or interrupt their processes to a pre‐specified level. This program requires the specification of a baseline or normal usage. Direct load control of air conditioners and water heaters. In return for a financial incentive, customers agree to have the utility control key end‐uses such as air conditioners and water heaters. Ancillary services programs. Customers bid load curtailments into various ancillary services markets and agree to be on standby if their bid is accepted. They receive a payment if they are called by the ISO/RTO. Capacity markets programs. Customers offer load curtailments as a replacement to existing generation in the market. They are generally called day‐of if the curtailment is needed. Large penalties are often assessed in the event of non‐compliance. Demand bidding/buy‐back programs. Customers bid load curtailments at market prices in competition with supply‐side resources.
56

APPENDIX C: LIST OF ACRONYMS AC — Air conditioning AMI — Advanced metering infrastructure APS — Arizona Public Service BEC — Business Energy Coalition C&I — Commercial and industrial CARE — CPA — California Power Authority CPA DRP — CPA Demand Reserves Partnership CPP — Critical Peak Pricing CPUC — California Public Utilities Commission DBP — Demand Bidding Program DLC — Direct load control DOE — Department of Energy DR — Demand response DRP — Demand Reserves Program DSM — Demand side management EAP — Energy Action Plan EE — Energy efficiency FERC — Federal Energy Regulatory Commission GWh — Gigawatthour HPO — Hourly Pricing Option IEPR — Integrated Energy Policy Report IOU — Investor‐owned utility ISO — Independent system operator kW — Kilowatt kWh — Kilowatthour MRTU — MW — Megawatt MWh — Megawatthour OIR — Order Instituting Rulemaking PG&E — Pacific Gas and Electric Company PTR — Peak Time Rebate RTO — Regional transmission organization RTP — Real‐time pricing SCE — Southern California Edison SDG&E — San Diego Gas and Electric Company SPM — Standard Practice Manual
57

SPP — Statewide Pricing Pilot SRP — Salt River Project TOD — Time‐of‐Day Pricing TOU — Time‐of‐use VPP — Variable Peak Pricing WG1 — Working Group 1 WG2 — Working Group 2 WG3 — Working Group 3
58

SIDEBAR 1: VALUING DEMAND RESPONSE BENEFITS IN EASTERN PJM When summer heat waves cause the demand of electricity to peak, they often also cause wholesale electricity prices to rise substantially above their average levels. However, since most electricity customers face retail rates that do not reflect this movement in wholesale market prices, they do not modify their consumption patterns, causing a significant drop in economic efficiency. Soon after the Western Power Crisis, EPRI did a study of how DR could have benefited the state’s electricity users. Under fairly plausible assumptions about customer participation in dynamic pricing programs, the study found that DR would have lowered peak loads by 1,000 to 2,000 MW and that would have translated into a reduction in summer peak prices of six to nineteen percent. This would have lowered energy costs in the summer by $0.3 to $1.2 billion. PJM Interconnection, LLC (PJM) and the Mid‐Atlantic Distributed Resources Initiative (MADRI) have just completed a new study on the value of DR. The objective of the study was to quantify market impacts and customer benefits that would result form a modest three percent reduction of peak loads during the top 20 five‐hour blocks in the service areas of its five mid‐Atlantic utilities (BGE, Delmarva, PECO, PEPCO and PSEG). The study used a simulation‐based approach to quantify the market impact that the specified three percent load reductions would have brought about in 2005 and under a variety of alternative market conditions. The analysis was performed with the Dayzer market simulation model, which was calibrated to accurately represent the PJM market using data provided by PJM and public sources. By comparing market simulations with and without curtailments, the following results were obtained: • Curtailing three percent of each selected zone’s super‐peak load, which reduces
PJM’s peak load by 0.9 percent, yields an average energy market price reduction of $8‐$25 per megawatt‐hour, or five to eight percent on average, during the 133 to 152 hours in which curtailment occurs in at least one service area. The range in average impacts depends on market conditions. As shown in Figure 1, even these modest three percent load reductions can reduce market prices by $50 to $75 per megawatt‐hour in some of the hours.
• Assuming all loads (either customers or their retail providers) are exposed to
spot prices, the estimated price reductions could benefit non‐curtailed loads in
59

MADRI states by $57‐$182 million per year. The potential energy market benefits to the entire PJM system amount to $65‐$203 million per year. Producer surplus would decrease by a nearly equal amount.
• The market impact in each zone would be substantially smaller if it curtailed its
load in isolation from the other zones. By the same token, the market impact would be larger if more than five zones implemented DR programs or if greater amounts of DR participation were achieved.
The study also estimated benefits to DR program participants: • The energy market benefit that resulted from curtailing load of much lesser value
than the price of energy on the spot market was estimated to be $85 to $234 per megawatt‐hour or $9 to $26 million per year based on the results of the Dayzer simulations and simplifying assumptions about the economic value customers place on their curtailable load.
• The reduction in capacity needed to meet reserve adequacy requirements for a
load shape that has been modified by reducing the peaks was estimated to be $73 million per year (again for curtailment of three percent of load in the five zones), based on an assumed capacity price of $58 per kilowatt‐year.
More rigorous analyses of these participant benefits would be needed, along with an assessment of the costs of equipment and administration of demand response programs, in order to fully evaluate the net benefits to participants. Several additional categories of DR benefits were not quantified. These include enhanced competitiveness of energy and capacity markets, reduced price volatility, the provision of insurance against extreme events that have not been captured in the scenarios considered, reduced capacity market prices, and deferred T&D costs. In addition, because the study focused on curtailments to day‐ahead schedules, the estimates do not capture the additional benefits that would accrue from real‐time demand response, which can mitigate the effects of unexpected increases in load, generation outages, and transmission disruptions. The entire study is available at: http://www.energetics.com/madri/pdfs/BrattleGroupReport.pdf Related presentations are also posted at: http://www.brattle.com/News/News.asp?NewsID=340
60

Table 8: Annual Benefits from 3 percent Load Reduction in the top 100 Hours in 5 MADRI Zones
Quantified Benefits in MADRI States
Quantified Benefits in Other PJM States
Unquantified Benefits Caveats
Benefits to Non-Curtailed
Load
$57-182 Million (energy only)
(5-8% price reduction
in curtailed hours)
$7-20 Million (energy only)
(1-2% price reduction
in curtailed hours)
● Capacity price decrease due to reduced demand;● Enhanced competitiveness in energy and capacity markets; ● Real-time vs. day-ahead; ● Value of reduced volatility;● Insurance against extreme events;● Avoided T&D costs.
● Probably significantly offset in long-run equilibrium as capacity and capacity prices adjust; "long-run" might not be so long.● Load shifting and demand elasticity offest some benefit in short-term.
Energy Benefits toCurtailed
Load
$9-26 Million
($85-234/MWh price reduction
in curtailed hours)
n/a n/a ● Based on simplifying assumptions regarding the value of load that is curtailed.
Capacity Benefits toCurtailed
Load
$73 Million
(assuming $58/kW-Yr)
n/a n/a● Based on generic long-run cost of avoided capacity;● Ignores costs of equipment and DR program administration.
Total Annual Benefits
$138-281 Million $7-20 Million● Additional benefits to non-curtailed load could be large.
● Includes both the solid economic efficiency gains to curtailed load and the less robust benefits to non-curtailed loads.
Figure 4: Price Impact of 3% Load Reduction in 5 MADRI Zones for
Average Peak Load Conditions
61

SIDEBAR 2: INEQUITIES OF FLAT RATES Almost three decades after the passage of PURPA, most rates across the country do not vary by time of day, even though the cost of electricity does show such variation. It is widely known that this is economically inefficient. In this sidebar, we show this is also inequitable. Customers are overpaying for electricity produced during off‐peak hours and underpaying for electricity produced during peak hours. Thus, customers with a higher‐than‐average portion of their consumption occurring during peak hours are underpaying for electricity and this cost is being borne by customers who consume a lower‐than‐average portion during peak hours. How large is this cross‐subsidy? The magnitude can be illustrated with reference to a simple example for a state such as California. The actual numbers will, of course, vary by rate, by utility and by state. Let’s divide electricity customers into three groups based on their load profiles: Average Users, whose hourly load profile corresponds to the class peak; Peaky Users, whose load profile has greater than average concentration in the peak period; and Flat Users, whose load profile has less than average concentration in the peak period. Let’s set the peak period from noon to 6 pm. Average Users consume electricity in proportion to the ratio of peak to off‐peak hours so twenty‐five percent of their consumption occurs during the peak hours. Peaky Users consume forty percent during peak hours and Flat Users ten percent. Let’s also assume that the population is equally divided between the three types of users and that there are a total of 10 million customers in the state. Finally, let us set each customer’s average monthly consumption at 500 kWh. Now we can calculate the total cost of electricity for each of the consumption profiles under two different rates: A flat rate and a TOU rate. A similar approach can be used to estimate costs under dynamic pricing rates, such as CPP. The flat rate is assumed to be 10 cents/kWh and applies around the clock. The marginal cost of electricity during the peak period is 20 cents/kWh and 6.7 cents/kWh during the off‐peak period and these are used to establish the peak and off‐peak TOU rates. Table 8 summarizes the characteristics of the customer population.
62

Table 9: Customer Population Characteristics
Monthly Consumption (kWh per Customer)Weighted Average Rates
(cents/kWh)Peak Off-Peak Total Flat TOU
Flat 50 (10%) 450 (90%) 500 (100%) 10.00 8.00Average 125 (25%) 375 (75%) 500 (100%) 10.00 10.00Peaky 200 (40%) 300 (60%) 500 (100%) 10.00 12.00
Consumption Profile
Given these assumptions, we can calculate the total costs incurred by each consumption profile over a ten year period for both the flat and TOU rates. This is done by multiplying each customer’s peak and off‐peak consumption by the corresponding rate and summing over both the number of months in the period (120) and the number of customers belonging to each consumption profile (3.3 million). A discount rate of four percent is used to yield a present value. Finally, by subtracting the total costs incurred under the flat rate from the total costs incurred under the TOU rate, we can estimate the cross‐subsidy that results from flat rates. As shown in Table 10, while Average Users do not experience any benefit or loss under the flat rate, Flat Users are paying $3.92 billion above what they would have paid under a TOU rate and Peaky Users are benefiting from this subsidy. Table 10: Cross-Subsidy Over 10-Year Period Resulting From Flat
Rate
Monthly Electricity Cost ($)
Flat TOUFlat 50.00 40.00 (10.00) (3.92)Average 50.00 50.00 0.00 0.00Peaky 50.00 60.00 10.00 3.92
Consumption Profile
Total Benefit/Loss ($ Billions)
Monthly Benefit/Loss From
Flat Rate ($)
63

SIDEBAR 3: INEQUITIES CREATED BY CALIFORNIA’S AB 1X LEGISLATION At the height of the California Energy Crisis, Governor Gray Davis signed Assembly Bill 1X as an urgency statute on February 1, 2001. The statute was passed “to address the rapid, unforeseen shortage of electric power and energy available in the state and rapid and substantial increases in wholesale energy costs and retail energy rates that endanger the health, welfare, and safety of the people of [California].”71 Among other provisions, it has been interpreted to have imposed a rate freeze on all residential usage under one hundred and thirty percent of baseline usage. Thus, when the state sought to recover the extraordinary costs of the crisis from retail customers, it was compelled to impose the higher costs in a disproportionate manner. The average rate increase was twenty percent, but for customers in higher usage blocks, it was as high as fifty‐five percent. Five years later, these cross‐subsidies have gone largely un‐noticed and, because of the inability of the CPUC to allocate normal increases in utility operating costs due to inflation onto the portion of consumption protected by the rate cap, costs in the higher tiers have increased substantially and will continue to increase until the rate cap is removed. The magnitude of these subsidies is very large. We estimate it with reference to three classes of customers: Low Users, Typical Users, and High Users. The monthly average consumption for these three classes is 350 kWh/month, 560 kWh/month, and 2,000 kWh/month, respectively. Additionally, based on anecdotal information, we have assumed that fifty percent of California’s utility customers are in the Low User class, twenty‐five percent are Typical Users, and twenty‐five percent are High Users. Given that there are approximately ten million utility customers in California; one can calculate the number of customers belonging to each class. The effect of the new rate on each class can be calculated as the electricity costs that each class incurred under the AB 1X rate plan, minus the costs that they would have incurred under a plan in which the rates were increased proportionately across all classes. While rates vary across California’s three investor‐owned utilities, we have used PG&E’s pre‐Crisis and post‐Crisis rates to illustrate the results. Since these rates have continued to change since the crisis ended, we have used the average rate that has prevailed over the past five years.
64

Figure 5: Pre- and Post-Crisis Utility Rate Comparison
0.00
0.05
0.10
0.15
0.20
0.25
0 100 200 300 400 500 600 700 800 900 1000
Monthly Consumption (kWh/Month)
Ret
ail E
lect
ricity
Rat
e (c
ents
/kW
h)
Avg Post-Crisis RateProportional IncreasePre-Crisis Rate
Given the average rates before and after the crisis, it is possible to calculate the total revenues that are being generated by the new rate, and subsequently, the amount by which the pre‐Crisis rates would need to be increased proportionally to achieve this same effect. The revenues are calculated according to the following formula: Monthly Revenue = Average Class Monthly Consumption x Class Rate x Months Since Crisis For each class, the difference between the total electricity costs under the post‐Crisis rate and the “Proportional Increase” rate represents the net benefit (or loss) resulting from the disproportionate new rate. The benefit/loss can then be calculated over the time period that has elapsed since the Crisis. Table 11 summarizes these results. If the average rate structure is used, High Users have been hit with a tax of $4.1 billion. If the lowest rate structure is used, the estimate drops to $3 billion and it rises to $10.6 billion if the highest rate structure is used.72
65
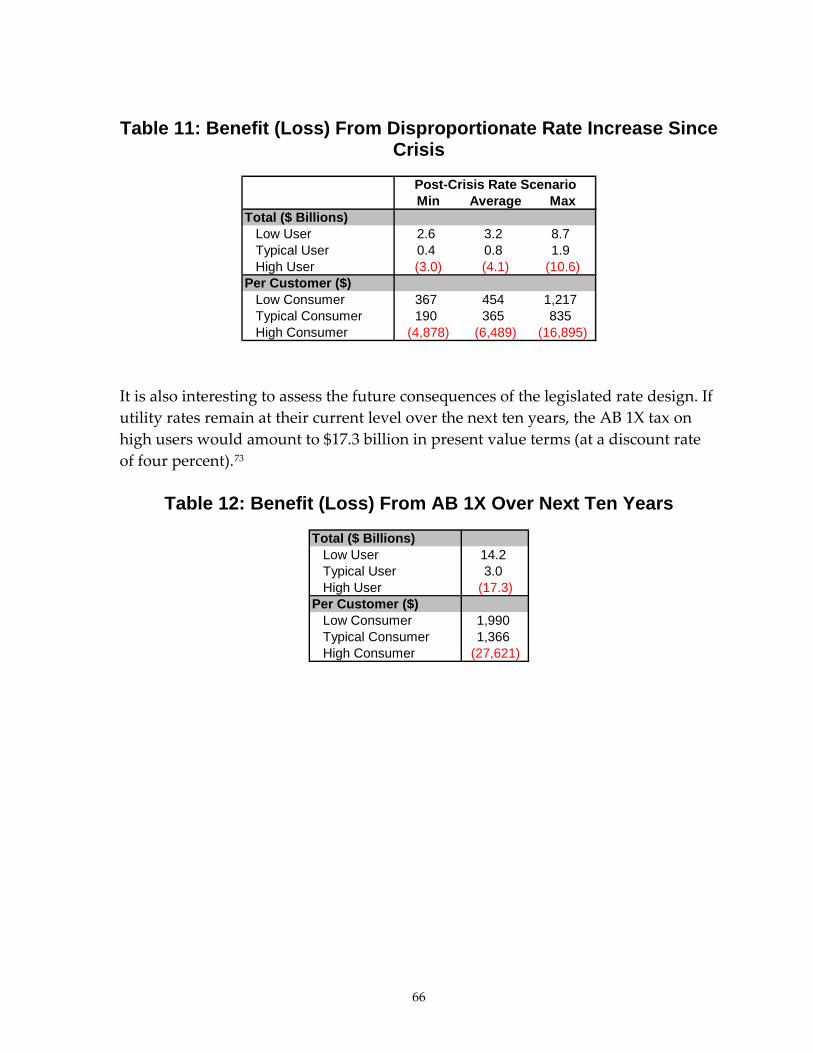
Table 11: Benefit (Loss) From Disproportionate Rate Increase Since
Crisis
Post-Crisis Rate ScenarioMin Average Max
Total ($ Billions)Low User 2.6 3.2 8.7Typical User 0.4 0.8 1.9High User (3.0) (4.1) (10.6)
(4,878) (6,489) (16,895)
Per Customer ($)Low Consumer 367 454 1,217Typical Consumer 190 365 835High Consumer
It is also interesting to assess the future consequences of the legislated rate design. If utility rates remain at their current level over the next ten years, the AB 1X tax on high users would amount to $17.3 billion in present value terms (at a discount rate of four percent).73
Table 12: Benefit (Loss) From AB 1X Over Next Ten Years
Total ($ Billions)Low User 14.2Typical User 3.0High User (17.3)
(27,621)
Per Customer ($)Low Consumer 1,990Typical Consumer 1,366High Consumer
66

SIDEBAR 4: ESTIMATING THE HEDGING COST PREMIUM IN FLAT ELECTRICITY RATES Wholesale electricity spot markets are volatile, reflecting the variations in the marginal cost of electricity production over time. However, when retail rates are flat, the consumer is given protection from this volatility. As a result, flat rates embody an implicit but real hedging cost premium that accounts for the value of this reduction in exposure to price volatility. How can this be quantified? The hedging premium is exponentially proportional to the volatility of loads, the volatility of spot prices, and the correlation between loads and spot prices.74 This can be represented as follows: π = exp( σL . σP . ρL,P ) Where: π = Risk Premium σL = Load Volatility σP = Spot Price Volatility ρL,P = Correlation Between Load and Spot Price For example, if price volatility was assumed to be 0.6, load volatility was 0.2, and the correlation between load and the spot price was 0.4, the resulting estimate of the hedging premium would be five percent. In other words, on average, customers are paying five percent more than they would if they were simply exposed to spot prices. With an assumption about the distribution of these three variables, a Monte Carlo simulation can be used to approximate a distribution around this premium. Assuming that the variables are all triangularly distributed with a minimum of 0 and a maximum of 1, a Monte Carlo simulation of 1,000 iterations produces the hedging premium distribution shown in the following figure.
67

Table 13: Simulated Distribution of Hedging Cost Premium
0%
1%
2%
3%
4%
5%
6%
7%
8%
0% 2% 4% 6% 8% 10%
12%
14%
16%
18%
20%
22%
24%
26%
28%
30%
32%
34%
36%
38%
40%
42%
44%
46%
48%
50%
52%
54%
56%
58%
60%
62%
64%
66%
68%
70%
Risk Premium
Prob
abili
ty o
f Occ
urin
g
Distribution Statistics: Mean = 11% Median = 8% Mode = 5%
The mean, median and mode of the premium are eleven percent, eight percent, and five percent, respectively. The standard deviation is ten percent.
68

SIDEBAR 5: REVISING THE SPM TO ACCOUNT FOR LOSS OF SERVICE QUALITY Under current regulatory practice, cost‐effectiveness analyses of DR programs are based on the SPM family of tests. A primary limitation of the SPM family of tests is that it does not account for the loss in consumer welfare that occurs when consumers reduce peak period usage nor the gain in consumer welfare that occurs from increased off‐peak usage. Thus, we can expect the participant test used in the SPM to have a bias. To assess the magnitude of the bias, it is useful to introduce the concept of consumer surplus (CS). This is the difference between the value consumers derive from consumption and the amount they spend on that consumption. The value consumers derive from consumption, or the consumer’s willingness to pay, equals the sum of the marginal utilities of the various units consumed. For a normal good, the marginal utility declines with additional units consumed, and is reflected in the familiar downward sloping shape of the demand curve. If the price of a commodity goes up, CS shrinks and if the price goes down, it expands. As noted earlier, there is no reference to CS in SPM, which relies instead on changes in the consumer’s bill to measure changes in consumer welfare. The writers of the SPM were not confident that regulators and other policy makers would put much faith in estimated price elasticities, which are a critical element of estimating CS. They were concerned that controversies about the price elasticities would enter the discussion, and prevent any consensus from developing about the program’s cost‐effectiveness. Thus, they choose to focus only on bill changes. It is important to keep in mind that the bulk of the applications of SPM were expected to involve technology programs, and not rate programs. The price of electricity was held constant in such calculations, since the developers of SPM were mostly concerned about energy efficiency programs and technology‐based load management programs. Changes in the quantity of electricity consumed were determined exogenously, and were often based on engineering rules of thumb. It was common to reduce electric usage in proportion to the efficiency change represented by a movement from the old technology to the new technology. When SPM tests are applied to rate programs, such as a time‐of‐use (TOU) rate, it is no longer possible to ignore price elasticities. These are necessary for predicting the new quantities that would result from the new prices. Since the old and new prices are known, along with old quantities, price elasticities can be used to predict new quantities. Thus, old and new bills can be estimated, and bill changes derived by
69

subtracting the new bill from the old. However, we have the information that is needed to calculate CS. TOU rates raise prices during the peak period and lower them during the off‐peak period. Higher prices during the peak period result in lowered consumption, and “consumer loss”; lower prices during the off‐peak period raise consumption, and “consumer gain.” It is an empirical question whether the gain is greater than the loss.
Table 14: Bill Savings and Consumer Surplus (Dollars/Month)
Price Elasticity of Demand Peak Share of Monthly Use (%)
Variable ‐0.1 ‐0.2 ‐0.5 ‐1.0
Bill Savings 7.2 14.4 36 72 10 Consumer
Surplus 3.6 7.2 18 36
Bill Savings 1.05 2.1 5.25 10.5 30 Consumer
Surplus 0.525 1.05 2.625 5.25
Bill Savings 0.8 1.60 4.0 8.0 50 Consumer
Surplus 0.4 0.8 2.0 4.0
There is a strong relationship between bill savings and consumer surplus for revenue‐neutral rates. For two‐period TOU rates that are revenue‐neutral, bill savings are twice as large as consumer surplus. This can be seen by considering the following example. The customer is assumed to consume 1,000 kWh per month and face a flat rate of 5 cents/kWh. She later moves to a revenue‐neutral TOU rate with a peak price of 7 cents/kWh and an off‐peak price of 3 cents/kWh. Her original monthly bill is $50 and her new bill, with unchanged usage values, is also $50. Thus, the TOU is revenue‐neutral. The results are summarized in Table 13 under a variety of assumptions about the share of peak usage in monthly usage and about the price elasticity of demand in the peak and off‐peak periods.75 In all cases, changes in CS are positive, indicating that welfare is improved by shifting to TOU rates, i.e., consumers gain more by increasing off‐peak usage than they lose by reducing peak usage. However, the estimated value of CS is exactly half the value of bill savings. This general result holds for a wide variety of cases with linear demand, revenue‐neutral TOU rates, equal peak and off‐peak elasticities, and zero cross‐price elasticities.
70

For simplicity, we had assumed the incremental cost of TOU metering to be zero. Both bill savings and consumer surplus would decline by the same amount if these costs would be introduced in the calculation. The SPM tests also include the TRC and RIM tests defined further below. The economic welfare tests include the producer surplus test and the economic surplus test. Producer surplus (PS) is the difference between the total revenue from producing a certain amount of electricity and the cost incurred in producing those units. Graphically, it constitutes the triangular area below the price line and to the left of the marginal cost curve. Economic surplus is the sum of the CS and PS. In a competitive market, price equals marginal costs, and at that point ES is maximized. The value that customers place on the utility derived from consuming the last unit is exactly equal to the marginal cost of producing that unit. Economic efficiency is maximized. Any other price would reduce welfare, and this constitutes one of the central theorems of welfare economics. Thus, from the perspective of welfare economics, the objective should be to maximize ES, which will not often yield the same policy conclusions as maximizing either the TRC or RIM tests. In the real world, and especially in the world of electricity, prices are rarely based on marginal costs. Under cost‐of‐service regulation of electric monopolies, prices are often set equal to average costs. Thus, they exceed marginal costs during the off‐peak period and are below marginal costs during the on‐peak period. There is a potential for improving economic efficiency by raising prices during the on‐peak period and lowering them during the off‐peak period, so that they better approximate the marginal costs of electricity. The new prices need to reflect both marginal energy and marginal capacity costs. A shift to TOU pricing would improve economic efficiency in the aggregate, i.e., for all customers, if it raises ES. However, even if ES rises in the aggregate, some customers may be made worse off. This should not prevent that policy from being implemented, according to the Kaldor‐Hicks criterion in welfare economics.76 This argues that if the gainers from a public policy can compensate the losers, that policy is worth doing. The Kaldor‐Hicks criterion allows a wider variety of policies to be considered than the more restrictive Pareto criterion, which would only allow such policies to be undertaken that made no one worse off, and made at least one person better off. A simple example of the relationship between the SPM tests and economic surplus is provided below. This example continues the discussion of the previous consumer who uses 1,000 kWh per month. She is assumed to use half of that in the peak period and the other half in the off‐peak period. The flat rate and TOU rates are as discussed earlier and the price elasticity of demand in both periods is ‐0.50. For
71

simplicity, we have assumed that the marginal cost curve is constant at 5 cents/kWh. This assumption is often made when evaluating demand‐side programs since they do not change the demand‐supply balance sufficiently to change the value of marginal costs. The following definitions are used in measuring the different welfare impacts: Bill Savings = Old Bill – New Bill = P x Q ‐ Pʹ x Qʹ = Participant Test Benefits = Revenue Loss (which is considered a cost under RIM but disregarded under TRC, since it is a transfer payment between participants and non‐participants), where the primes denote new values associated with TOU pricing; this formula is applied individually to peak and off‐peak periods and the results are added to obtain a monthly value. TRC = Total Resource Cost = Delta Q x MC, and it was similarly computed as the sum of peak and off‐peak values. RIM = Ratepayer Impact Measure = TRC – Bill Savings = Producer Surplus (defined below). Delta CS = difference between the value that accrues to consumers when they consume a given quantity and the amount they spend in order to consume it. For the peak period, it is the sum of the area of the rectangle bounded by the new and old price at the new quantity and the triangle with height equal to Delta P and base equal to Delta Q. Delta PS = difference between revenues that accrue to producers from selling a given quantity and their cost in producing it. Delta ES = Delta CS + Delta PS The results are summarized in Table 14. The table shows that as prices rise in the peak period, customers experience a negative bill impact of $300. The opposite occurs in the off‐peak period, where the bill falls by $700. The total bill for the month falls by $400. This is the customer’s bill savings and represents her benefits under the Participant Test of the SPM. Marginal costs fall by $700 in the peak period and rise by $300 during the off‐peak period, yielding a net value of $400 in avoided costs. This is the value of the TRC test since there are no administrative program costs or metering costs in the example. The RIM test is the sum of the TRC values and revenue losses (i.e., negative bill savings) and computes to zero. The change in consumer surplus is $200, which is again half of the amount of bill savings. The change in producer surplus is zero and the economic surplus, being the sum of
72

consumer surplus and producer surplus, works out to $200. In this example, the TRC test is $400, and suggests that that program should be implemented. The economic surplus test is also positive but half the size of the TRC test. The RIM test is zero. It will not take much of a change in the underlying assumptions to create a situation where the SPM tests and ES will diverge.
Table 15: Quantifying Net Benefits (Dollars/Month)
Time Period Row Variable
Peak Off‐Peak Monthly
(1) Bill Savings (participant)
‐300 +700 +400
(2) Avoided costs (TRC)
+700 ‐300 +400
(3) = (2) – (1) Impact on rates (RIM)
+1000 ‐1000 0
(4) Consumer surplus (CS)
‐900 +1100 +200
(5) Producer surplus
+1000 ‐1000 0
(6) = (4) + (5) Economic surplus
+100 +100 +200
73

ENDNOTES 1 California Public Utilities Commission, Decision 03‐03‐036, March 13, 2003. 2 Energy Action Plan. May 13, 2003. http://www.energy.ca.gov/energy_action_plan/ 2003‐05‐08_ACTION_PLAN.pdf 3 Based on historical 2004 hourly load data filed by the utilities in FERC Form 714. 4 California Public Utilities Commission, Decision 03‐06‐032. June 5, 2003. Page 9. 5 California Public Utilities Commission, Decision 05‐01‐056. January 27, 2005. Page 4. 6 2005 Integrated Energy Policy Report. California Energy Commission. November, 2005. Page 74. 7 Energy Commission Staff. Implementing California’s Loading Order for Electricity Resources. CEC‐400‐2005‐043. July 2005. 8 Energy Action Plan II. September 21, 2005. http://www.energy.ca.gov/energy_action _plan/2005‐09‐21_EAP2_FINAL.pdf 9 California Public Utilities Commission, Decision 03‐06‐032. June 5, 2003. 10 California Public Utilities Commission, Decision 03‐06‐032. June 5, 2003. Attachment B, Pages 1 and 3. 11 California Public Utilities Commission, Decision 03‐03‐036. March 13, 2003. Page 10. 12 California Public Utilities Commission, Decision 03‐03‐036. March 13, 2003. Page 57. 13 Impact Evaluation of the California Statewide Pricing Pilot. Charles River Associates. March 16, 2005. 14 Note that the IOUs were authorized to carry over and make available the remaining budget dollars from one year to the next. The figures in this table represent the authorized budgets for each year excluding carryover allocations. 15 $12 million for the residential and small C&I customers, plus $23.8 million for large C&I customers. 16 Program descriptions are adapted from Decision 05‐01‐056 and Decision 06‐03‐024. 17 Sources of MW reductions and service accounts are the Reports on Interruptible Load Programs and Demand Response Programs for January 2007. These reports are filed monthly by each California IOU. The 2007 peak demand forecast for each IOS is derived from the Energy Commission’s “Staff Forecast of 2007 Peak Demand,” June 2006. 18 California Public Utilities Commission, Decision 05‐11‐009. Page 11 19 Governor’s Office of Planning and Research. California Standard Practice Manual: Economic Analysis of Demand Side Programs and Projects. July 2002. http://drrc.lbl.gov/pubs/CA‐SPManual‐7‐02.pdf. The first edition of this manual was issued in 1983, jointly authored by staffs of the California Public Utilities Commission and the California Energy Commission. A revised edition was issued in 1987‐1988. 20 The language used in the act is the following: “In no case shall the Commission increase the electricity charges in effect on the date that the act that adds this section becomes effective for residential customers for existing baseline quantities or usage by those customers up to one hundred and thirty percent of existing baseline quantities, until such time as the department [Department of Water Resources] has recovered the costs of power it has procured for the electrical corporation’s retail end use customers as provided in this division.” ( Section 80110 of the Water Code). There is some confusion about the date when the rates were locked in, with some suggesting February 1, 2001 and others suggesting January 19, 2002. 21 The first one hundred percent of baseline consumption is referred to as Tier 1 and the next 30 percent as Tier 2. Currently, there are three additional tiers for customers served by the investor‐owned utilities. Tier 3 is usage between one hundred and thirty and two hundred percent of
74

baseline, Tier 4 is usage between two hundred and three hundred percent of baseline and Tier 5 usage is above three hundred percent of baseline. 22 The lower cost can be estimated by using a well‐known formula, which expresses the “risk premium” as an exponential function of retail load volatility, wholesale price volatility and retail load‐wholesale price correlation. Monte Carlo simulations under a variety of plausible assumptions yield a median value of six percent. 23 This phenomenon has also been observed in some international markets. For example, in one utility that serves industrial customers along the Persian Gulf, large customers are more than happy to curtail load when the utility calls them, even in the absence of a formal DR program. They feel they are doing what is necessary to keep the lights on and being a good corporate citizen. 24 FERC Staff. Assessment of Demand Response & Advanced Metering. AD‐06‐2‐000. August 2006. 25 DOE Federal Energy Management Program website: http://www1.eere.energy.gov/femp/program/utility/utilityman_energymanage.html 26 Energy & Environmental Economics. A Survey of Time‐of‐Use Pricing and Demand Response Programs. Prepared for the EPA. July 2006 27 Faruqui, Ahmad. Applications of Dynamic Pricing in Developing and Emerging Economies. Prepared for the World Bank. May 2005. 28 U.S. Department of Energy, Benefits of Demand Response in Electricity Markets and Recommendations for Achieving Them, A Report to the United States Congress Pursuant to Section 1252 of the Energy Policy Act of 2005 and Federal Energy Regulatory Commission, Assessment of Demand Response & Advanced Metering, Staff Report, Docket Number AD‐06‐2‐000, August 2006. 29 For information on additional DR programs outside of California that are not covered here, see Appendix J of the Working Group 2 Demand Response Program Evaluation – Program Year 2004. Prepared by Quantum Consulting and Summit Blue Consulting. December 2004. 30 Braithwait, Steven and O’Sheasy, Michael. RTP Customer Demand Response. As published in Electricity Pricing in Transition, pages 181‐190. Copyright 2002. 31 GAO, Electricity Markets: Consumers Could Benefit from Demand Programs, But Challenges Remain (GAO‐04‐844, August 2004), 22–23. 32 Galen Barbose, Charles Goldman, & Bernie Neenan, A Survey of Utility Experience with Real Time Pricing, Lawrence Berkeley National Laboratory: LBNL‐54238, 2004. 33 Energy & Environmental Economics. A Survey of Time‐of‐Use Pricing and Demand Response Programs. July 2006. Page 6 34 Faruqui, Ahmad and Snow, Jim. Mitigating the impact of rising air conditioning loads on utility economics. 2003. 35 Wolak, Frank. Market Design and Price Behavior in Restructured Electricity Markets: An International Comparison. As published in Pricing in Competitive Electricity Markets, pages 127‐152. Copyright 2000. 36 FERC Staff. Assessment of Demand Response and Advanced Metering. August 2006. Page 58. 37 Braithwait, Steven. Residential TOU Price Response in the Presence of Interactive Communication Equipment. As published in Pricing in Competitive Electricity Markets, pages 359‐373. Copyright 2000. 38 Faruqui, Ahmad and Snow, Jim. Mitigating the impact of rising air conditioning loads on utility economics. 2003. 39 Peak Time Rebate is also sometimes referred to as Critical Peak Rebate (CPR).
75

40 Faruqui, Ahmad and Snow, Jim. Mitigating the impact of rising air conditioning loads on utility economics. 2003. 41 FERC Staff. Assessment of Demand Response and Advanced Metering. August 2006. Page 55. 42 Chung, Allan, Lam, Jeff, and Hamilton, William. Innovative Retail Pricing: A Pacific Northwest Study. As published in Electricity Pricing in Transition, pages 207‐220. Copyright 2002. 43 Voluntary CPP rates may also be offered to customers. 44 King, Chris and Delurey, Dan. Efficiency and Demand Response: Twins, Siblings, or Cousins? Public Utilities Fortnightly. March 2005. 45 Faruqui, Ahmad. Applications of Dynamic Pricing in Developing and Emerging Economies. Prepared for the World Bank. May 2005. 46 IEA. Roadmap for Demand Response in the Australian National Electricity Market. December 2006. 47 CRA International. Assessing the Value of Demand Response in the NEM. December 2006. 48 As stated in Chapter 1 of this white paper, many day ahead programs are considered to be “price responsive” under the CPUC’s definition. 49 Gunn, Randy. Market Potential Benchmark Survey Results, Step 1: North American Utility. Submitted by Summit Blue Consulting to the IEA’s Demand Side Management Program Task XIII study. January 2005. 50 U.S. Department of Energy, Benefits of Demand Response in Electricity Markets and Recommendations for Achieving Them, A Report to the United States Congress Pursuant to Section 1252 of the Energy Policy Act of 2005 and Federal Energy Regulatory Commission, Assessment of Demand Response & Advanced Metering, Staff Report, Docket Number AD‐06‐2‐000, August 2006. Page 34 51 CRA International. Assessing the Value of Demand Response in the NEM. December 2006. 52 It should be noted that this is also a distinction that can be applied to some of the price‐based programs, particularly some variations of CPP. 53 Also commonly referred to as Technical Assistance and Technology Incentives (TA/TI) by many utilities. 54 State of California Water Code, §80110 55 See, for example, California Public Utilities Commission Decision 04‐04‐020. 56 FERC Staff. Assessment of Demand Response and Advanced Metering. August 2006. Page 131. 57 International Energy Agency. Roadmap for Demand Response in the Australian National Electricity Market. December 2006. Page 30. 58 FERC Staff. Assessment of Demand Response and Advanced Metering. August 2006. Page 130. 59 International Energy Agency. Roadmap for Demand Response in the Australian National Electricity Market. December 2006. Page 30. 60 Toronto Hydro Energy Services. Development of an Electricity Demand Management and Demand Response Program for Commercial Buildings: Report on Design Charette. November 28, 2003. 61 Earle, Robert and Faruqui, Ahmad. Demand Response and the Role of Regional Transmission Operators. EPRI. December 2006 62 Borenstein, Severin. Wealth Transfers Among Large Customers from Implementing Real‐Time Retail Electricity. The Energy Journal. Volume 28, Number 2. April 2007. 63 Borenstein, Severin, Jaske, Michael, and Rosenfeld, Arthur. Dynamic Pricing, Advanced Metering, and Demand Response in Electricity Markets. UCEI. October 2002. 64 Murphy, Paul. The Secrets of Successful AMI Deployment – The Ontario Experience. Presentation to NARUC Winter Meetings, Washington, DC. February 19, 2007.
76
65 DRAM. Demand Response and Advanced Metering Fact Sheet. Based on data from PJM’s State of the Market Report 2000. 66 Quantum Consulting Inc. and Summit Blue Consulting LLC, “Evaluation of 2005 statewide large nonresidential day‐ahead and reliability demand response programs,” Final Report, April 28, 2006. 67 For large customer CPP programs, an estimate of seven percent was derived for the year 2005 by WG 2. However, given the small number of participants, this only represented 11 MW. And most of this was delivered by a very small number of participants. The DBP program load drops averaged one percent of baseline load and this amounted to 11 MW. 68 We computed several measures of central tendency all of which are above three percent. The Mean, median, and mode estimates of the hedging cost premium are eleven percent, eight percent, and five percent, respectively. 69 Ahmad Faruqui, “Bringing dynamic pricing to the mass market,” NARUC Winter Convention, Washington, DC, February 2007. 70 California Energy Commission Staff. Options for Energy Efficiency in Existing Buildings. CEC‐400‐2005‐039‐CMF. December 2005. 71 AB 1X Stats. 2001 (1st Extraordinary Sess.), ch. 4, §7, p. 16. 72 It should be noted that AB1X does not allow the first two rate tiers to grow with inflation. This will effectively cause the outer tiers to continue to rise relative to the lower tiers, and our estimates are conservative as a result. 73 Note that AB1X could potentially be in effect until the year 2021. Our 10‐year study horizon is conservative in comparison. 74 For a derivation, see the first chapter of Ahmad Faruqui and Kelly Eakin, editors, Pricing in Competitive Electricity Markets, Kluwer Academic Publishers, 2000. 75 These ranges are reflective of percentages of use when the peak TOU period is defined as four to six hours during week days. 76 See, for example, the discussion in Ch. 16 of William J. Baumol, Economic Theory and Operations Analysis, 2nd ed. (Englewood Cliffs, NJ: Prentice Hall, 1965).
77
BIBLIOGRAPHY Barbose, Galen, Charles Goodman, and Bernie Neenan, 2004, A Survey of Utility
Experience with Real Time Pricing. Berkeley: Lawrence Berkeley National Laboratory.
Baumol, William J. Economic Theory and Operations Analysis, 1965, Second Edition,
Engelwood Cliffs: Prentice Hall, 311‐330. Borenstein, Severin, 2007, Wealth Transfers among Large Customers From Implementing
Real‐Time Retail Electricity, The Energy Journal 28 (2007). Borenstein, Severin, Michael Jaske, and Arthur Rosenfeld, 2002, Dynamic Pricing,
Advanced Metering and Demand Response in Electricity Markets, University of California, Berkeley. Berkeley: Center for the Study of Energy Markets.
Braithwait, Steven, 2002, Residential TOU Price Response in the Presence of Interactive
Communication Equipment, Competitive Electricity Markets, pp 359‐373. Braithwait, Steven, and Michael OʹSheasy, 2002, RTP Customer Demand Response,
Electricity Pricing in Transition. pp 181‐190. California, Assembly Bill 1X, 2001, 1st Extraordinary Session. Sacramento. State of
California Water Code, §80110. California Energy Commission, May 8, 2003, Energy Action Plan, California Public
Utilities Commission, and Conservation Financing Authority. California Energy Commission, September 21, 2005, Energy Action Plan II, California
Public Utilities Commission, and Conservation Financing Authority. California Energy Commission December 2005, Commission Report: Options for
Energy Efficiency in Existing Buildings. <http://www.energy.ca.gov/2005publications/CEC‐400‐2005‐039/CEC‐400‐2005‐039‐CMF.PDF>.
California Energy Commission, 2005, Implementing Californiaʹs Loading Order for
Electricity Resources, Sacramento, California.
78

California Energy Commission, 2005, Integrated Energy Policy Report. Sacramento, California.
California Energy Commission, 2006, Staff Forecast of 2007 Peak Demand. Sacramento, California.
Chung, Allan, Jeff Lam, and William Hamilton, 2002 Innovative Retail Pricing: a Pacific Northwest Study, Electricity Pricing in Transition, pp 207‐220.
CRA International, 2005, Impact Evaluation of the California Statewide Pricing Pilot.
CRA International, 2006, Assessing the Value of Demand Response in the NEM.
Demand Response and Advanced Metering Coalition, 2002, Demand Response and Advanced Metering Fact Sheet, Based on Data From PJMʹs State of the Market Report 2000, Washington, DC.
Earle, Robert, and Ahmad Faruqui, 2006, Demand Response and the Role of Regional
Transmission Operators, Electric Power Research Institute. Energy & Environmental Economics, 2006, A Survey of Time‐of‐Use Pricing and
Demand Response Programs, Prepared for the EPA. Faruqui, Ahmad, and Jim Snow, 2003, Mitigating the Impact of Rising Air Conditioning
Loads on Utility Economic, CRA International. Faruqui, Ahmad, and Kelly Eakin, eds., 2000, Pricing in Competitive Electricity
Markets, Kluwer Academic, 2000. Faruqui, Ahmad, 2005, Applications of Dynamic Pricing in Developing and Emerging
Economies, Prepared for the World Bank, CRA International. Faruqui, Ahmad, February 2007, Bringing Dynamic Pricing to the Mass Market,
National Association of Regulatory Utility Commissioners, NARUC Winter Convention, Washington, DC.
Federal Energy Regulatory Committee, August 2006, Assessment of Demand Response & Advanced Metering, Decision number AD‐06‐2‐000.
79

Governorʹs Office of Planning and Research, 1987, California Standard Practice Manual: Economic Analysis of Demand Side Programs and Projects, Sacramento, California.
International Energy Agency, 2006, Roadmap for Demand Response in the Australian
National Electricity Market. King, Chris, and Dan Delurey, 2005, Efficiency and Demand Response: Twins, Siblings,
or Cousins? Public Utilities Fortnightly (2005). Mansour, Yakout, Presentation, August 9, 20006, California Independent System
Operator. Murphy, Paul, February 19, 2007, The Secrets of Successful AMI Deployment ‐‐ the
Ontario Experience, National Association of Regulatory Utility Commissioners NARUC Winter Meetings, Washington, DC.
Quantum Consulting Inc. and Summit Blue Consulting LLC, 2006, Evaluation of 2005
Statewide Large Nonresidential Day‐Ahead and Reliability Demand Response Programs.
Quantum Consulting Inc. and Summit Blue Consulting LLC, 2004, Working Group 2
Demand Response Program Evaluation ‐‐ Program Year 2004, Final Report. <http://www.goodcents.com/Info/research.htm>.
Summit Blue Consulting, 2005, Market Potential Benchmark Survey Results, Step 1:
North American Utility, Submitted to the IEA ‐‐ Demand Side Management Program Task XIII Study.
Toronto Hydro Energy Services, 2003, Development of an Electricity Demand
Management and Demand Response Program for Commercial Buildings: Report on Design Charette.
United States Department of Energy, August 2006, A Report to the United States
Congress Pursuant to Section 1252 of the Energy Policy Act of 2005 and Federal Energy Regulatory Commission, Assessment of Demand Response & Advanced Metering. No. AD‐06‐02‐000.
United States Department of Energy, December 12, 2006, Program Areas: Energy‐
Efficiency Funds and Demand Response Programs, Federal Energy
80

Management Program. <http://www1.eere.energy.gov/femp/program/utility/utilityman_energymanage.html>.
United States Environmental Protection Agency, 2006, A Survey of Time‐of‐Use
Pricing and Demand Response Programs, Energy & Environmental Economics, p 62.
United States Department, GPO, United States, Cong. House, 2006, Benefits to
Demand Response in Electricity Markets and Recommendations for Achieving Them, a Report to the United States Congress Pursuant to Section 1252 of the Energy Policy Act of 2005 and Federal Energy Regulatory Commission, Assessment of Demand Response, Washington, DC.
United States Government, United States, Cong. Senate, August 2004, Report to the
Chairman, Committee on Government Affairs, U.S. Senate: Electricity Markets ‐ Consumers Could Benefit From Demand Programs, But Challenges Remain. <http://www.gao.gov/new.items/d04844.pdf>.
Wolak, Frank, 2000, Market Design and Price Behavior in Restructured Electricity
Markets: an International Comparison, Competitive Electricity Markets, pp 127‐152.
Documents from California Public Utilities Commission Assigned Commissionerʹs Ruling Augmenting August 6, 2006 Ruling Requiring Utility
Proposals to Augment 2007 Demand Response Programs, August 22, 2006, Public Utilities Commission of the State of California, No. Application 05‐06‐006. <http://www.cpuc.ca.gov/EFILE/RULINGS/59082.pdf>.
Assigned Commissionerʹs Ruling Requiring Utility Proposals to Augment 2007 Demand
Response Programs, August 9, 2006, Public Utilities Commission of the State of California, No. Application 05‐06‐006. <http://www.cpuc.ca.gov/EFILE/RULINGS/58757.pdf>.
Assigned Commissioner and Administrative Law Judgeʹs Ruling Directing the Filing of
Rate Design Proposals for Large Customers, December 8, 2004, Public Utilities Commission of the State of California, No. Rulemaking 02‐06‐001 <http://www.cpuc.ca.gov/PUBLISHED/RULINGS/42078.htm>.
81

Assigned Commissioner and Administrative Law Judgeʹs Ruling on the Budget for the
Statewide Pricing Pilot, Advanced Demand Response System, and Information Display Pilot, April 18, 2005, Public Utilities Commission of the State of California, No. Rulemaking 02‐06‐011. <http://www.cpuc.ca.gov/PUBLISHED/RULINGS/45588.htm>.
Assigned Commissioner and Administrative Law Judgeʹs Ruling Regarding Participation of
the California Energy Commission, August 14, 2006, Public Utilities Commission of the State of California. No. Application 05‐03‐015. <http://www.cpuc.ca.gov/EFILE/RULINGS/58867.pdf>.
Decision Approving Settlement on Pre‐Deployment Costs, August 25, 2005, Public
Utilities Commission of the State of California, No. Application 05‐03‐015, Decision 05‐08‐018. <http://www.cpuc.ca.gov/PUBLISHED/FINAL_DECISION/49120.htm>.
Decision Closing This Rulemaking and Identifying Future Activities Related to Demand
Response, November 18, 2005, Public Utilities Commission of the State of California No. Rulemaking 02‐06‐001, Decision 05‐11‐009. <http://www.cpuc.ca.gov/PUBLISHED/FINAL_DECISION/51376.htm>.
Decision Adopting Settlement, March 15, 2006, Public Utilities Commission of the State
of California, No. Decision 06‐03‐024. <http://www.cpuc.ca.gov/PUBLISHED/FINAL_DECISION/54493.htm>.
Final Opinion Authorizing Pacific Gas and Electric Company to Deploy Advanced Metering
Infrastructure, July 20, 2006, Public Utilities Commission of the State of California, No. Application 05‐06‐028, Decision 06‐07‐027. <http://www.cpuc.ca.gov/PUBLISHED/FINAL_DECISION/58362.htm>.
Interim Opinion in Phase 1 Addressing Demand Response Goals and Adopting
Tariffs and Programs for Large Customers. No. Rulemaking 02‐06‐001, Decision03‐06‐032. Public Utilities Commission of the State of California. 5 June 2003. <http://www.cpuc.ca.gov/PUBLISHED/FINAL_DECISION/26965.htm>.
Interim Opinion in Phase 1 Adopting Pilot Program for Residential and Small Commercial
Customers. March 14, 2003, Public Utilities Commission of the State of California, No. Rulemaking: 02‐06‐001, Decision 03‐03‐036.
82

<http://www.cpuc.ca.gov/PUBLISHED/FINAL_DECISION/24435.htm>. Opinion Adopting an Incremental Budget for the Statewide Pricing Pilot, Advanced
Demand Response System, and Information Display Pilot. July 21, 2005, Public Utilities Commission of the State of California, No. Rulemaking 02‐06‐001, Decision 05‐07‐011. <http://www.cpuc.ca.gov/PUBLISHED/FINAL_DECISION/48137.htm>.
Opinion Adopting Pacific Gas and Electric Company, Southern California Edison Company,
and San Diego Gas & Electric Companyʹs Long‐Term Procurement Plans. December 16, 2004, Public Utilities Commission of the State of California, No. Rulemaking 04‐04‐003, Decision 04‐12‐048. <http://www.cpuc.ca.gov/PUBLISHED/FINAL_DECISION/43224.htm>.
Opinion Approving 2004 Budget Request for the Statewide Pricing Pilot for Residential and
Small Commercial Customers, January 8, 2004, Public Utilities Commission of the State of California, No. Rulemaking 02‐06‐001, Decision 04‐01‐012. <http://www.cpuc.ca.gov/PUBLISHED/FINAL_DECISION/33227.htm>.
Opinion Approving 2005 Demand Response Goals, Programs and Budgets, January 27,
2005, Public Utilities Commission of the State of California, No. Rulemaking 02‐06‐001, Decision 05‐01‐056. .<http://www.cpuc.ca.gov/PUBLISHED/FINAL_DECISION/44881.htm>.
Order Adopting Changes to 2007 Utility Demand Response Programs, November 30,
2006, Public Utilities Commission of the State of California, No. Decision 06‐11‐049. <http://www.cpuc.ca.gov/PUBLISHED/FINAL_DECISION/62281.htm>.
Order Denying Rehearing of Decision (D.) 04‐02‐057, April 1, 2004, Public Utilities
Commission of the State of California, No. Rulemaking 01‐05‐047, Decision 04‐04‐020. <http://www.cpuc.ca.gov/PUBLISHED/Graphics/35448.PDF>.
Order Instituting Rulemaking on Policies and Practices for Advanced Metering, Demand
Response, and Dynamic Pricing, June 2, 2004, Public Utilities Commission of the State of California, No. Rulemaking 02‐06‐001. <http://www.cpuc.ca.gov/word_pdf/RULINGS/37089.doc>.
83