epm1 high density stainless steel by richard r. phillips engineered pressed materials dennis hammond...
TRANSCRIPT

EPM 1
High Density Stainless Steel
By Richard R. Phillips Engineered Pressed Materials
Dennis HammondApex Advanced Technologies

EPM 2
Process Overview and Key Features of the Technologies
• Blending additive package with lubricant• Water atomized powder -100 mesh• Sintered Density >96.0%; up to 99%+ of theoretical• Properties comparable or superior to wrought materials• Standard tooling / conventional pressing• Normal compaction range

EPM 3
Process Overview and Key Features of the Technologies
• Reduction or elimination of green density split via designed lubrication package
• Molding to mass• Controlled debinding / Sintering 2150F to
2550F degrees in 100% Hydrogen for 60min.
• Sintering on low friction high temperature plates

EPM 4
Process Overview and Key Features of the Technologies
• Plates Zircar ZAL-45 alumina or BN coated Graphite or ceramic
• Properties are a typical of P/M and aligned to wrought products
• Interconnected porosity is eliminated• Mechanical, Physical (electrical,
magnetically …) and Chemical properties are enhanced

EPM 5
High Density P/M Stainless Steel Obstacles
• Relative poor compressibility compared to theory or compared to closing off interconnecting porosity
• High oxide content and difficult to break them down during sintering without very high temperatures
• High temperatures required for efficient sintering
• Distortion during sintering• Abrasive nature of Stainless Steel in
compacting

EPM 6
Possible Solutions
• Compressibility- inherent in material • Oxide content –inherent in process of
making powder • Sintering temperature- inherent with the high
oxide content• Break down the oxides during processing
and make consolidation easier • Deal with the abrasives and distortions by
techniques and highly efficient lubrication

EPM 7
Dimensional Control Variables
• Green density gradients - highly effective mobile lubricant, volume at G.D.
• Elephant foot- caused by friction forces on support medium- reduced friction medium
• Temperature –tendency to slump with temperature and time- controlled time and temperature
• Liquid phase components- uniformity of temperature

EPM 8
Activated Stainless
• Additive’s coated on the surface of powder• Additional additives ad mixed to powder
including a highly efficient lubricant package• Controlled de-bind in air• Sinter at conventional temperatures in
Hydrogen• Pressing equivalent to conventional S.S.

EPM 9
Stainless Steel Materials Processed
• 316 L
• 409Cb
• 434 L
• 304 L
• 410 L
• 410+C
• 17-4pH

EPM 10
Stainless Steel Materials Processed
• Activated and Standard from 2150F to 2534F in 100%H2 for 60min.
• Density vs Temperature
• Ultimate, Yield & Elongation vs Temp.
• Un-notched Charpy Impacts & Elongation vs Temperature
• Hardness & Ultimate vs Temperature

EPM 11
Apex Advanced Technologies Activated vs. StandardWater Atomized 316L S.S. Sintered
6.8
7
7.2
7.4
7.6
7.8
2100 2250 2350 2400 2450 2500 2524
Temperature (0F)
Sin
tere
d D
ensi
ty (g
/cc)
Water Atomized 316L, treated
Standard 316L with 1% Acrawax
94% of Theoretical Density
Non-Interconnected Porosity
Interconnected Porosity
DT = 7.95 g/cc

EPM 12
316L Sintered Tempature vs. Tensile Strength and Elongation
49,800 49,600
53,700
63,900
49,400
55,300
29,300
24,500 25,20027,600
14.0%
17.5%
23.0%
38.5%
18.0%
25.0%
0
10,000
20,000
30,000
40,000
50,000
60,000
70,000
2100 2150 2200 2250 2300 2350 2400 2450 2500
Tempature F
Ten
sile
Str
eng
th p
si
12.0%
17.0%
22.0%
27.0%
32.0%
37.0%
% E
lon
gat
ion
Ultimate Tensile Strength Sintered
Ultimate Tensile Strength Annealed
0.2% Yeild Strength Sintered
0.2% Yeild Strength Annealed
% Elongation
% Elongation Annealed

EPM 13
316L Impact and Elongation vs. Sintering Tempature
60
87
158
229
102
165
14.0%
17.5%
23.0%
38.5%
18.0%
25.0%
0
50
100
150
200
250
2100 2150 2200 2250 2300 2350 2400 2450 2500
Tempature F
Imp
act
foo
t-p
ou
nd
s
12.0%
17.0%
22.0%
27.0%
32.0%
37.0%
% E
lon
gat
ion Impact Sintered
Impact Annealed
% Elongation
% Elongation Annealed

EPM 14
316L Tensile Strength and Hardness vs. Sintering Tempature
49,800 49,600
53,700
63,900
49,400
55,300
43
45 45
57
45
44
30,000
35,000
40,000
45,000
50,000
55,000
60,000
65,000
70,000
2100 2150 2200 2250 2300 2350 2400 2450 2500
Tempature F
Ten
sile
Str
eng
th p
si
40
42
44
46
48
50
52
54
56
58
Har
dn
ess
HR
BW
Ultimate Tensile Strength Sintered
Ultimate Tensile Strength Annealed
Hardness Sintered
Hardness Annealed

EPM 15

EPM 16
409Cb Tensile Strength and Elongation vs. Sinter Tempature
45,700
54,100
56,90057,700
27,800
31,000
35,10033,500
34,200
40,500
7.0%
14.0%
16.5%
19.0%18.5%
19.5%
20,000
25,000
30,000
35,000
40,000
45,000
50,000
55,000
60,000
2100 2150 2200 2250 2300 2350 2400 2450 2500
Tempature F
Ten
sile
Str
eng
th p
si
5.0%
7.0%
9.0%
11.0%
13.0%
15.0%
17.0%
19.0%
21.0%
% E
lon
gat
ion
Ultimate Tensile Strength Sintered
Ultimate Tensile Strength Annealed
0.2% Yeild Strength Sintered
0.2% Yeild Strength Annealed
% Elongation
% Elongation Annealed

EPM 17
409Cb Impact and Elongation vs. Sintered Tempature
19
118
158
272
155
180
7.0%
14.0%
16.5%
19.0%18.5%
19.5%
0
50
100
150
200
250
300
2100 2150 2200 2250 2300 2350 2400 2450 2500
Tempature F
Imp
act
0.0%
5.0%
10.0%
15.0%
20.0%
25.0%
% E
lon
gat
ion Sintered Impact
Annealed Impact
% Elongation
Annealed Elongation
EPM 18
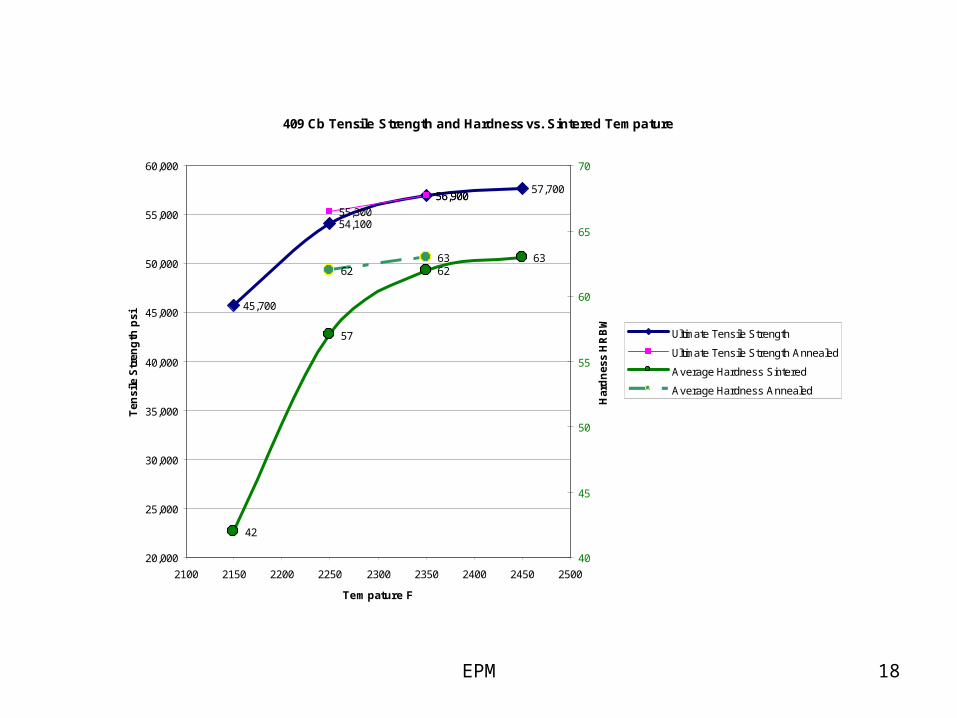
409 Cb Tensile Strength and Hardness vs. Sintered Tempature
45,700
54,100
56,90057,700
55,300
56,900
42
57
6263
6263
20,000
25,000
30,000
35,000
40,000
45,000
50,000
55,000
60,000
2100 2150 2200 2250 2300 2350 2400 2450 2500
Tempature F
Ten
sile
Str
eng
th p
si
40
45
50
55
60
65
70
Har
dn
ess
HR
BW
Ultimate Tensile Strength
Ultimate Tensile Strength Annealed
Average Hardness Sintered
Average Hardness Annealed

EPM 19

EPM 20
434L Tensile Strength and Elongation vs. Sinter Tempature
54,300
58,300
60,500 60,500
37,500
38,90039,600
38,300
59,900
62,300
43,70042,600
12.0%
15.5%
16.0%
18.5%
30,000
35,000
40,000
45,000
50,000
55,000
60,000
65,000
2100 2150 2200 2250 2300 2350 2400 2450 2500
Tempature F
Ten
sile
Str
eng
th p
si
11.0%
12.0%
13.0%
14.0%
15.0%
16.0%
17.0%
18.0%
19.0%
% E
lon
gat
ion
Ultimate Tensile Strength
Yeild Strength
Ultimate Tensile Strength Annealed
0.2% Yeild Strength Annealed
% Elongation Annealed
% Elongation

EPM 21
434L Impact and Elongation vs. Sinter Tempature
81
92
117
149
97
141
12.0%
15.5%
16.0%
18.5%
15.5%
19.0%
80
90
100
110
120
130
140
150
2100 2150 2200 2250 2300 2350 2400 2450 2500
Tempature F
Imp
act
foo
t-p
ou
nd
s
10.0%
11.0%
12.0%
13.0%
14.0%
15.0%
16.0%
17.0%
18.0%
19.0%
20.0%
Impact Sintered
Impact Annealed
% Elongation
% Elongation Annealed

EPM 22
434L Tensile Strength and Hardness vs. Sinter Tempature
54,300
58,300
60,500 60,500
59,900
62,300
6566
6768
73
75
54,000
55,000
56,000
57,000
58,000
59,000
60,000
61,000
62,000
63,000
2100 2150 2200 2250 2300 2350 2400 2450 2500
Tempature F
Ten
sile
Str
eng
th p
si
50
55
60
65
70
75
80
Har
dn
ess
HR
BW
Ultimate Tensile Strength Sintered
Ultimate Tensile Strength Annealed
Hardness Sintered
Hardness Annealed

EPM 23
Water Atomized 304L St.S. Sintered Activated vs. Standard
7.02
7.15
7.25
7.61
7.77
7.426 7.426 7.426 7.426 7.426
6.85
6.9
7.03
7.17
7.3
6.80
7.00
7.20
7.40
7.60
7.80
8.00
2100 2150 2200 2250 2300 2350 2400 2450 2500 2550
Tempature F
Den
sity
g/c
c
Density, treated
94% Theoretical Density
Density Standert 1% Acraw ax

EPM 24
304L Sintered Tempature vs. Tensile Strength and % Elongation
49,800
56,50058,400
67,700
52,200
59,900
28,90027,700
31,000
9.0%
17.0%
23.0%
30.0%
15.0%
28.0%
20,000
25,000
30,000
35,000
40,000
45,000
50,000
55,000
60,000
65,000
70,000
2100 2150 2200 2250 2300 2350 2400 2450 2500
Tempature F
Ten
sile
Str
eng
th p
si
9.0%
14.0%
19.0%
24.0%
29.0%
% E
lon
gat
ion
Ultimate Tensile Strength Sintered
Ultimate Tensile Strength Annealed
Yeild Strength Sintered
Yeild Strength Annealed
% Elongation
% Elongation Annealed

EPM 25
304L Impact and Elongation vs. Sinter Tempature
72
120
274 274
163
274
9.0%
17.0%
23.0%
30.5%
15.0%
28.0%
50
100
150
200
250
2100 2150 2200 2250 2300 2350 2400 2450 2500
Tempature F
Imp
act
foo
t-p
ou
nd
s
0.0%
5.0%
10.0%
15.0%
20.0%
25.0%
30.0%
35.0%
40.0%
% E
lon
gat
ion
Impact Sintered
Impact Annealed
% Elongation
% Elongation Annealed

EPM 26
304L Tensile Strength and Hardness vs. Sinter Tempature
49,800
56,500
58,400
67,700
52,200
59,900
52
55
57
64
57 57
40,000
45,000
50,000
55,000
60,000
65,000
70,000
2100 2150 2200 2250 2300 2350 2400 2450 2500
Tempature F
Ten
sile
Str
eng
th p
si
50
52
54
56
58
60
62
64
66
Har
dn
ess
HR
BW
Ultimate Tensile Strength Sintered
Ultimate Tensile Strength Annealed
Hardness Sintered
Hardness Annealed

EPM 27

EPM 28
410+C Density vs. Sinter Tempature
6.80
7.02
7.08
7.13
6.75
6.80
6.85
6.90
6.95
7.00
7.05
7.10
7.15
2100 2150 2200 2250 2300 2350 2400 2450 2500
Tempature F
Den
sity
g/c
c

EPM 29
410+ Tensile Strength and Elongation vs. Sintering Tempature
90,200
112,900
67,700
47,700
194,200
141,100
58,700
44,800
30,600
147,800
101,300
1.5%
0.0%
1.5%
17.0%
2.0% 2.0%
0
50,000
100,000
150,000
200,000
250,000
2100 2150 2200 2250 2300 2350 2400 2450 2500
Tempature F
Ten
sile
Str
eng
th p
si
0.0%
2.0%
4.0%
6.0%
8.0%
10.0%
12.0%
14.0%
16.0%
18.0%
% E
lon
gat
ion
Ultimate Tensile Strength Sintered
Ultimate Tensile Strength Annealed
0.2% Yeild Strength Sintered
0.2% Yeild Strength Annealed
% Elongation
% Elongation Annealed

EPM 30
410+ Impact and Elongation vs. Sintering Tempature
16
5
6.17
23
9.1
12.3
1.5%
0.1%
1.5%
17.0%
2.0% 2.0%
0
5
10
15
20
25
2100 2150 2200 2250 2300 2350 2400 2450 2500
Tempature F
Imp
act
foo
t-p
ou
nd
s
0.0%
2.0%
4.0%
6.0%
8.0%
10.0%
12.0%
14.0%
16.0%
18.0%
% E
lon
gat
ion
Impact Sintered
Impact Annealed
% Elongation
% Elongation Annealed

EPM 31
410+ Tensile Strength and Hardness vs. Sinter Tempature
90,200
112,900
67,700
47,700
194,200
141,100
76
103
55
48
111
98
45,000
65,000
85,000
105,000
125,000
145,000
165,000
185,000
205,000
2100 2150 2200 2250 2300 2350 2400 2450 2500
Tempature F
Ten
sile
Str
eng
th p
si
40
50
60
70
80
90
100
110
120
Har
dn
ess
HR
BW
Ultimate Tensile Strength Sintered
Ultimate Tensile Strength Annealed
Hardness Sintered
Hardness Annealed
EPM 32
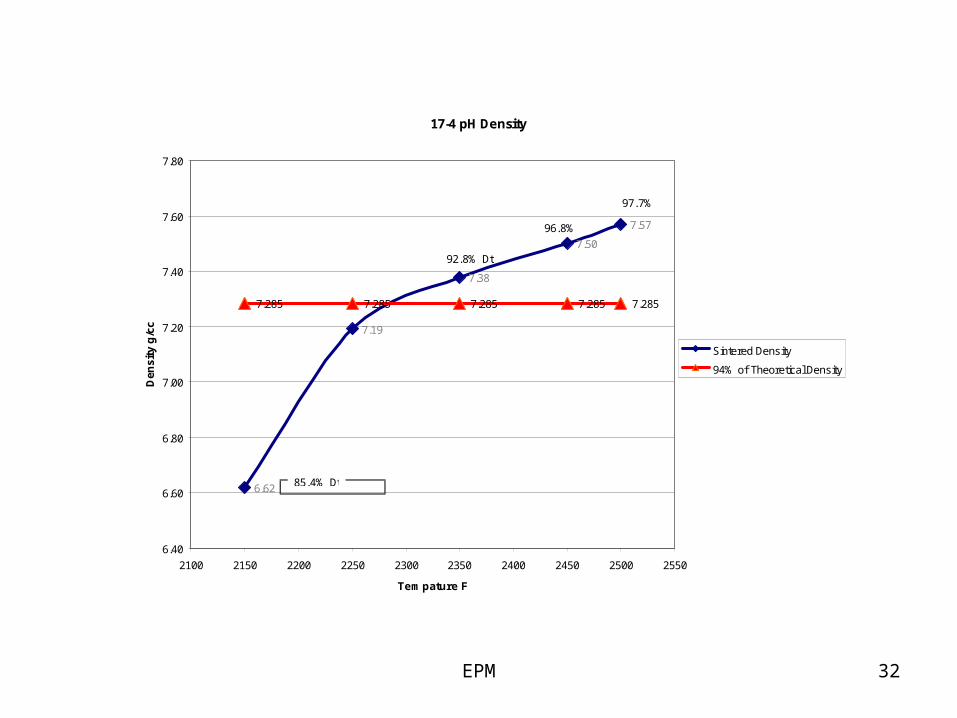
17-4 pH Density
6.62
7.19
7.38
7.50
7.57
7.285 7.285 7.285 7.285 7.285
6.40
6.60
6.80
7.00
7.20
7.40
7.60
7.80
2100 2150 2200 2250 2300 2350 2400 2450 2500 2550
Tempature F
Den
sity
g/c
c
Sintered Density
94% of Theoretical Density
85.4% Dt
92.8% Dt
96.8%
97.7%

EPM 33
17-4pH Impact and Elongation vs. Sinter Tempature
15
30
40
97
42
70
1.5%
2.0%
3.0% 3.0%3.0%
4.0%
0
20
40
60
80
100
120
2100 2150 2200 2250 2300 2350 2400 2450 2500
Tempature F
Imp
act
foo
t-p
ou
nd
s
0.0%
0.5%
1.0%
1.5%
2.0%
2.5%
3.0%
3.5%
4.0%
4.5%
% E
lon
gat
ion Impact Sintered
Impact Annealed
% Elongation
% Elongation Annealed

EPM 34
17-4pH Tensile and Hardness vs. Sintering Tempature
92,100
122,000 122,200
118,200
123,000
117,200118,100
84
97
94
99
102
98 98
90,000
95,000
100,000
105,000
110,000
115,000
120,000
125,000
2100 2150 2200 2250 2300 2350 2400 2450 2500 2550
Tempature F
Ten
sile
Str
eng
th p
si
80
85
90
95
100
105
Har
dn
ess
HR
BW
Ultimate Tensile Strength Sintered
Ultimate Tensile Strength Annealed
Hardness Sintered
Hardness Annealed