episodic radon changes in subsurface soil gas along active faults and possible relation to...
TRANSCRIPT
JOURNAL OF GEOPHYSICAL RESEARCH, VOL. 85, NO. B6, PAGES 3065-3078, JUNE 10, 1980
Episodic Radon Changes in Subsurface Soil Gas Along Active Faults and Possible Relation to Earthquakes
CHI-Yu KING
U.S. Geological Survey, Menlo Park, California 94025
Subsurface soil gas along active faults in central California has been continuously monitored by the Track Etch method to test whether its radon-isotope content may show any premonitory changes useful for earthquake prediction. The monitoring network was installed in May 1975 and has since been gradu- ally expanded to consist of more than 60 stations along a 380-km section of the San Andreas fault system between Santa Rosa and Cholame. This network has recorded several episodes, each lasting several weeks to several months, during which the radot• concentration increased by a factor of approximately 2 above average along some long, but limited, fault segments (---100 km). These episodes occurred in dif- ferent seasons and do not appear to be systematically related to changes in meteorological conditions. However, they coincided reasonably well in time and space with larger local earthquakes above a thresh- old,tnagnitude of about 4.0. These episodic radon changes may be caused by a changing outgassing rate in the fault zones in response to some episodic strain changes, which incidentally caused the earthquakes.
INTRODUCTION
Radon, a radioactive but chemically inert gas, is constantly generated all over the earth, normally in minute amounts by the omnipresent radium in the crustal materials. Radon ema- nation and migration in the earth and in the atmosphere have been the subjects of numerous studies [see Tanner, 1964, 1978]. Radon has been used, for example, as a pointer to bur- ied uranium (the progenitor of radium and radon) deposits, as a tracer of moving air and groundwater masses, as an in- dicator of faults, and more recently as a possible tool for earthquake prediction. Measurements made in Russia and China indicate that the radon content of groundwater shows anomalous changes (increases in most cases) prior to some large earthquakes [Ulornov and Mayashey, 1967; Liu et al., 1975]. Some of these radon 'anomalies' were recorded at such great distances (several hundred kilometers, see $ultank- hodzhayes et al. [1976]) from the epicenters of the reportedly related earthquakes that it has been difficult to develop a rea- sonable explanation for the causal relation between the two physical processes.
In May 1975 the U.S. Geological Survey began to monitor radon content of subsurface soil gas along some active faults in central California (stations 1-20, Figure 1) to test whether this parameter might also show any useful earthquake-related changes. There are several reasons for our choosing to mon- itor radon in soil gas instead of in groundwater. First, we had at our disposal a newly developed technique, Track Etch, which is simple and inexpensive. Second, there had been some clues that this parameter might be useful. It was observed, for example, that soil gas is commonly enriched in radon in the fault zones and that the near-surface air showed significant in- creases in its radon content at about the time of occurrence of
some earthquakes [Okabe, 1956]. It is also known, however, that other environmental factors such as barometric pressure, temperature, rainfall, and wind speed can strongly affect the radon content of air above and near the ground surface. Therefore when designing the present experiment, we decided to try to maximize possible tectonic signals in the soil-gas ra- don data and to minimize the effects of all other variables by the following procedures: (1) adopt the Track Etch technique,
This paper is not subject to U.S. copyright. Published in 1980 by the American Geophysical Union.
which makes integrated measurements over relatively long pe- riods (a week or more) in order to smooth out meteor- ologically induced rapid fluctuations; (2) make measurements more than « m below the ground surface in reasonably well- protected holes; (3) select sites that are in, or very near, active faults where the materials are relatively weak and the tectonic strains therefore likely to be amplified, and away from low places, where water might easily accumulate.
As reported earlier [King, 1978], our preliminary data re- corded by 20 stations along a 60-kin strip of the San Andreas and Hayward-Calaveras faults near Hollister showed two spa- tially coherent episodes of anomalously high radon concentra- tion that coincided in time with the occurrence of the two
largest local earthquakes (magnitude 4.3 and 4.0, A and D and stations 1-20 in Figure 1). The patterns of these radon in- creases and their coincidence with earthquakes are very simi- lar to the Russian observations for radon in groundwater, sug- gesting a possible radon-earthquake correlation. However, the two radon episodes were separated in time by nearly 1 year (46 weeks) and might conceivably have been caused by some seasonal effect. Clearly, more data and analyses are needed to clarify the true nature and cause of these radon episodes and their usefulness in earthquake prediction. Consequently, we have continued and expanded our monitoring effort. Several additional radon episodes and earthquakes (Table 1) have been recorded since the initial recordings. This additional in- formation provides us an opportunity to further explore in this paper the possible relation between radon changes and earthquakes.
EXPERIMENTAL METHOD
The Track Etch method [Fleischer et al., 1975; Gingrich, 1975] used here for radon monitoring measures the amount of alpha radiation generated by radon and its isotopes, thoron and actinon, by the following procedure. A small piece of plastic film (cellulose nitrate, sensitive only to alpha radiation) is attached to the inside bottom of a plastic cup (9 cm high with a 7-cm aperture). The cup is then put upside-down in the bottom of a shallow hole (10 cm in diameter and about 70 cm deep, Figure 2) to expose the film to the soil gas, usually for a period of 1 or 2 weeks, after which the cup is replaced by a new one. The retrieved film is chemically etched to enlarge
Paper number 9B 1389. 3065
3066 KING: GEOCHEMICAL MEASUREMENTS
Santa Rosa
San Francisco ..
:l•Napa
I I
•59 0 E ß
i
San dose•
o F
N
38'
t8 $9
37'
3 A
ß RADON STATION
0 EARTHQUAKE EPICENTER
0 50 KM I I I i I
I I
II 14
21 20
23
©24
25 Parkf•eld 27
123' 122' 121' 120'
36'
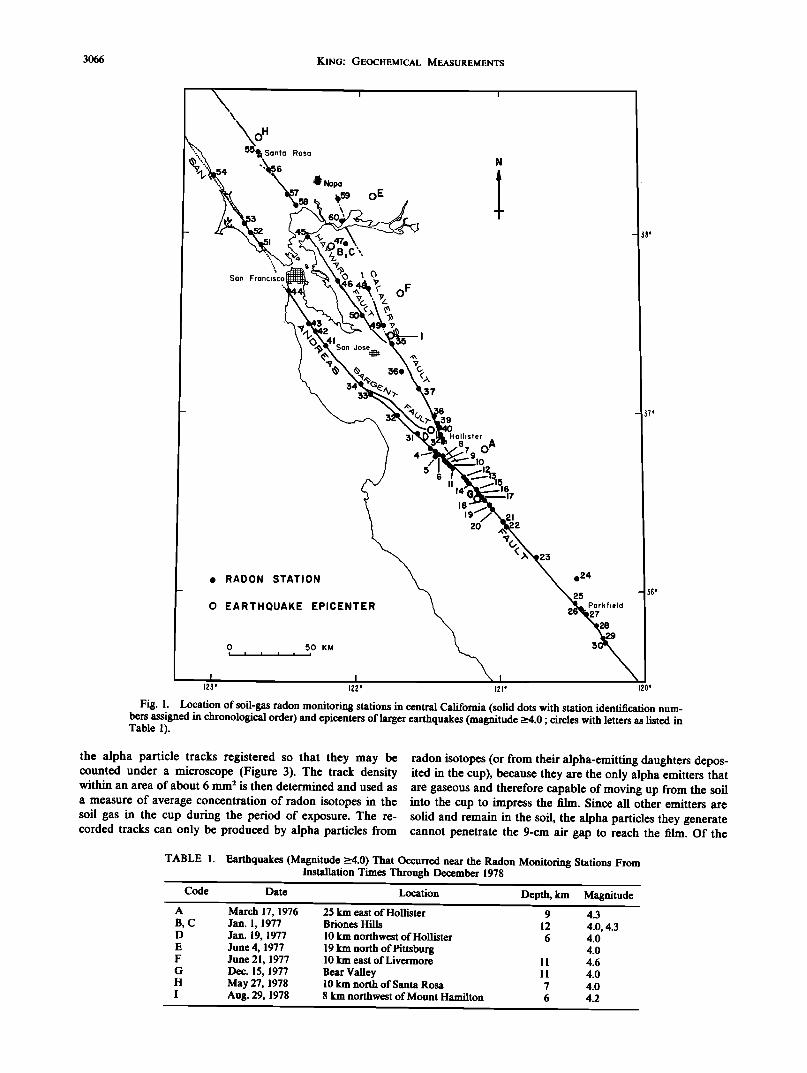
Fig. 1. Location of soil-gas radon monitoring stations in central California (solid dots with station identification num- bers assigned in chronological order) and epicenters of larger earthquakes (magnitude _>4.0' circles with letters as listed in Table 1).
the alpha particle tracks registered so that they may be counted under a microscope (Figure 3). The track density within an area of about 6 mm 2 is then determined and used as a measure of average concentration of radon isotopes in the soil gas in the cup during the period of exposure. The re- corded tracks can only be produced by alpha particles from
radon isotopes (or from their alpha-emitting daughters depos- ited in the cup), because they are the only alpha emitters that are gaseous and therefore capable of moving up from the soil into the cup to impress the film. Since all other emitters are solid and remain in the soil, the alpha particles they generate cannot penetrate the 9-cm air gap to reach the film. Of the
TABLE 1. Earthquakes (Magnitude _>4.0) That Occurred near the Radon Monitoring Stations From Installation Times Through December 1978
Code Date Location Depth, km Magnitude A March 17, 1976 25 km east of Hollister 9 4.3 B, C Jan. 1, 1977 Briones Hills 12 4.0, 4.3 D Jan. 19, 1977 10 km northwest of Hollister 6 4.0 E June 4, 1977 19 km north of Pittsburg 4.0 F June 21, 1977 10 km east of Livermore 11 4.6 G Dec. 15, 1977 Bear Valley 11 4.0 H May 27, 1978 10 km north of Santa Rosa 7 4.0 I Aug. 29, 1978 8 km northwest of Mount Hamilton 6 4.2

KING: GEOCHEMICAL MEASUREMENTS 3067
PLASTIC CAP
GROUND SURFACE
PLASTIC PIPE
70cm
76 cm
RADON DETECTOR FILM
9.$cm
TRACK ETCH CUP
Fig. 2. A schematic cross section of a radon monitoring station.
three isotopes, radon is probably the largest contributor to the recorded alpha radiation, because it has the longest half-life (3.8 d as compared with $$ s and 4 s for thoron and actinon, respectively). In this study we shall consider the total alpha
radiation and not attempt to differentiate the various contri- butions.
The monitoring hole is supported by a plastic pipe (76 cm long, Figure 2), which also serves to keep surface water away from the hole. The pipe is capped to reduce the meteor- ological effect on the measurements. Most stations are located in or very near active fault zones. We tried to avoid low places where water might accumulate, but some holes were still occa- sionally partly filled with water. Moisture was sometimes found condensed on the films; but the film areas that had been covered by water droplets were recognizable under the micro- scope and were not included for track counting so that pos- sible moisture effect on detection sensitivity might be avoided. Films were usually protected against excessive heat that might anneal the particle tracks.
The monitoring stations were installed in groups. Stations 1-20, 21-30, 31-40, 41-50, $1-60 were installed in May 1975, March 1976, April 1976, July-December 1976, and February- April 1977, respectively. Together they cover a 380-km section of the San Andreas fault system from Santa Rosa to Cholame (Figure 1). Some of the stations (10, 11, 31) were later relo- cated. Several control stations (B$-B8) were installed in June 1976 near and to the south of station 18 along a road approxi- mately perpendicular to the San Andrea fault at a distance of 3-7 km from the fault. In March 1977, stations C$-C8 were installed in the vicinity of station 20 at different depths to check the depth dependence of radon concentration. Cups were usually changed once a week for stations 1-20, B$-B8 and C$-C8 and once every 2 weeks for the remaining stations. Occasionally, cups were left in the ground longer. In such cases the radon values given are those averaged over longer time intervals (e.g., the beginning of the time series for sta- tions 41-44, Figure 6a). Some cups were lost, resulting in data gaps.
The San Andreas fault system monitored in this study is a
Fig. 3. Photomicrograph of alpha particle tracks in an exposed and etched Track Etch film. Tracks are about 5-10/•m wide and 10-50/•m long (photograph by Terraalex Corporation).

LLI
C3
0 0
Z ß o
z
'1 STATION 3
_.•
II1[1•
I- STATION 4
L .n . . iL lI.._• ..•]JtlLI} • _.._ll•...lttIJlI.•lil]i • i""iiIlI, ill i,Iiil•I•riilliliiilililk ._•m• •j i[ 'll•i •i• ilI•l• di•hl•I•liliIlillllilllI lllililiIilI Ill ililiilillllllllilillililiIlili•l•IH!Iiilii•I•i•lI!lI iI Iililli•Iillil IillliliilJillililililililiiI
ß
STATION 5
IIl]111111til]l]1111111!111111111111111[[iltltl
STATION 6
w •.o •.,• a '•'" D G •. • •, ß ß ß ß
I'Y' •) 3.5 3.73.6 38 1:33 3.8
Z
TIME
Fig. 4a
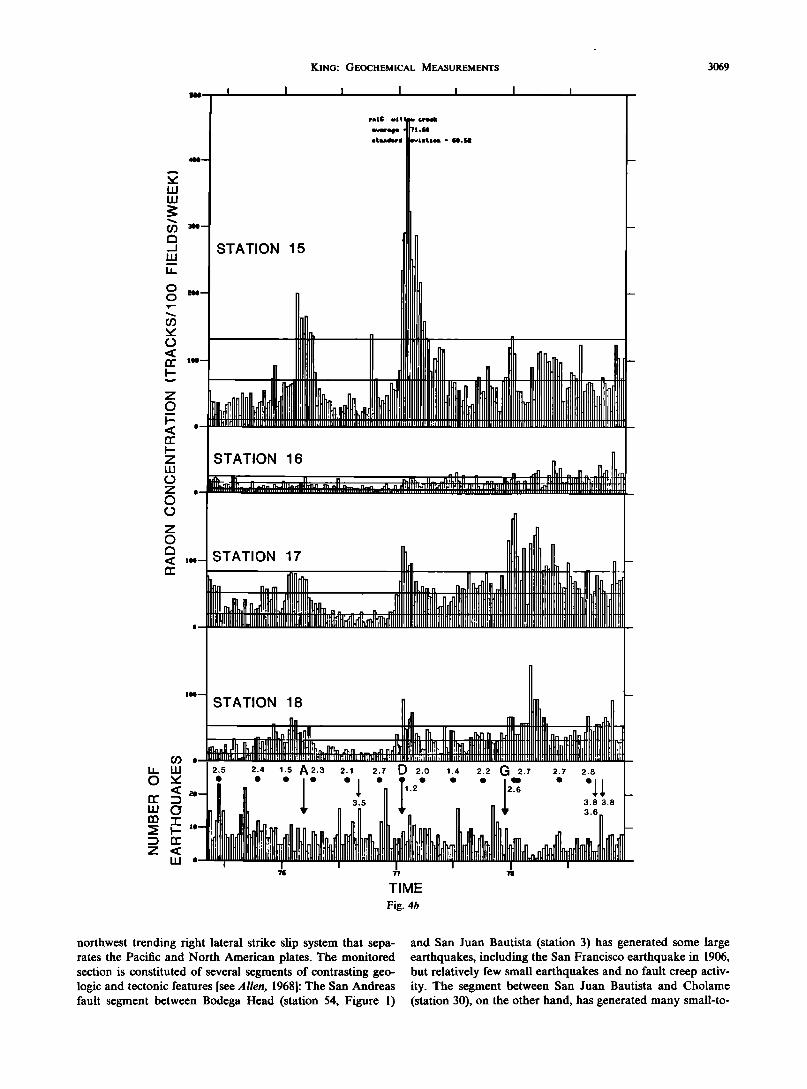
Fig. 4. Time series of radon concentration recorded at two clusters of stations and local seismicity and surface fault creep events: (a) at stations 3-6, occupying a 7-km segment of the San Andreas fault in San Juan Bautista; (b) at stations 15-18, occupying a 2-km segment of the same fault in M½lcndy Ranch. Shown as weekly values of radon concentration in units of "number of tracks per 100 'fields of view' per week" during a time period of 3« years from the begining of mon- itoring in May 1975 to about the end of 1978. Each unit is equivalent to a radioactivity of 2.7pC1 -• (R. L. Fl½ischcr, per- sonal communication, 1977). Straight lines in each plot represent mean radon value and one standard deviation above and below the mean for the period shown. Each seismicity plot shows weekly number of earthquakes of magnitude 1.0 and larger within 10 km of each cluster of stations. Larger fault creep events (slip more than I mm) are represented by dots, amounts of slippage in mm; larger quakes by arrows (larger arrows for magnitude _>4.0, smaller arrows for magnitude be- tw½½n 3.5 and 3.9) within 30 km of the clusters. Earthquakes of magnitude _>4.0 are listed in Table 1.
KING: GEOCHEMICAL MEASUREMENTS 3069
I • I I I I
r•l• •t t ½rmm•
s%m•tmrd
LU LU
C•
0 0
03
,< cr I--
Z
I-- ,< cr I--
LU
o
Ll LL!
0 ß
STATION 15
STATION 16 . "! ufla_ lh _ - fi n ' n.,ITk II• _ri•!i•G • .. lkr11. nlllI,l •l•111L.]•]-r•klr•4]Llllhitilin MIl•rrJl•_ dl -n_r',•.Jlli•,dNm•Z•. A•nJ[ •• •TWlI•.•Ml•I]•IH•!•IF•I•!!lIHI !•111•!1111111111111111!••H• Ill II I 11111•111n• !Ul il n lll i ill,! iii Illll III q Inl II I IIIIINIlllllm I1 II •11k In Illll HI H IllIll 1111i 1211 .ll Inll• IllHi i 11 litIll I III1•1 It ll II Ill I1 lilt Ill lip •tlll II rill [I Ill iz • II •]__
z
Illdl
STATION 18 ]] /llIL !1 I . . ,. I!• _ ,•.Jlllll,, ,JL_J
2.5 2.4 •.5 A2.3 2.1 2.7 d 2.0 1.4 2.2 G 2.7 2.7 2.8 • • • I • • I • • • • • I• • •1 I
, , I • , / '-• I •.• • II !l • 3 5 II / i 3.8 3.8 -- ' • • 3.s
TIME
Fig. 4b
northwest trending right lateral strike slip system that sepa- rates the Pacific and North American plates. The monitored section is constituted of several segments of contrasting geo- logic and tectonic features [see Allen, 1968]: The San Andreas fault segment between Bodega Head (station 54, Figure 1)
and San Juan Bautista (station 3) has generated some large earthquakes, including the San Francisco earthquake in 1906, but relatively few small earthquakes and no fault creep activ- ity. The segment between San Juan Bautista and Cholame (station 30), on the other hand, has generated many small-to-

3070 KING: GEOCHEMICAL MEASUREMENTS
z
z
IZ!
4,, • I t ! • I J
• STATIONS 1-2 ••nll -
,• __•_ ,• •. ,n!HI•In •_••!1••11 Illlllll!•nn. •11111Jll••n,, •11HIlh•• !•!111:[[• i o !I1•111111111t•111111111111111111111111111111111111111IIII1•!11111111111
; STATIONS 3-6 •i•1 L , I . • •,Jllllllll J!111111111 •• . ]L• !!•1111h • I• .• ,_• _•lhl ß 71•II,_,••11fil!111111111111•,a • •111111ill!111tlll•l•W!It,tl•11•1111111111111•1111111II!111!•]11••111• ß •111•1111111•11111111111111111111111111111 •••••••••••• _
•- STATIONS Z-14 -
11'd]l•llrlHIll ..dlmll•HIIIHIIIIIIl• n n., ,,,,T/llllllllh- [ I• 1 l• m • tllhtlllllll m !li!l• Ilillllllllil•h 11111111111lHlllllillillllll•t•llll•!111[IJ[llllll ] II I[I III IJ IIJJIIIIIllllllllllllll IIHIIJJlII]I
STATIONS 15-20 ldl [• ,• !llHIi• n il n ,- ß _ • .11111111WI•, : .,.,fin •1111••]t11II •n••
' ••o.••lH]lllll•_.•,_ ,. •ilIIIHIlI]I•I•I1H•H•llIl!II•Ii•IliI[•IIIIIII•IlII•t•IlIIIHIIlII- STATIONS B5-B8
illliiiiil][i[ii]i[i[iiii[ii]]i]iii[iiiiiii]liii[ iiiiiimJl]iiiii]iiii[ 111•illl '1111111111111111111111111111111111111 fl. ' f • - 111. I!!•
TIME
Fig. 5. Time series of normalized radon concentration recorded at five small arrays of stations (1-2 on the Hayward- Claveras fault, 3-6, 7-14, and 15-20 from northwest to southeast along the San Andreas fault, and B5-B8 several kilome- ters off the San Andreas fault) and weekly number of earthquakes of magnitude 1.0 and larger within about 30 km of these stations. Straight lines represent the mean values (1.0) and standard deviations. Arrows indicate occurrence of larger earth- quakes (magnitude _>4.0, Table 1). The flat beginning for the B5-B8 array is due to long exposure time, data gap to lack of measurements (because of lack of funds).
KING: GEOCHEMICAL MEASUREMENTS 3071
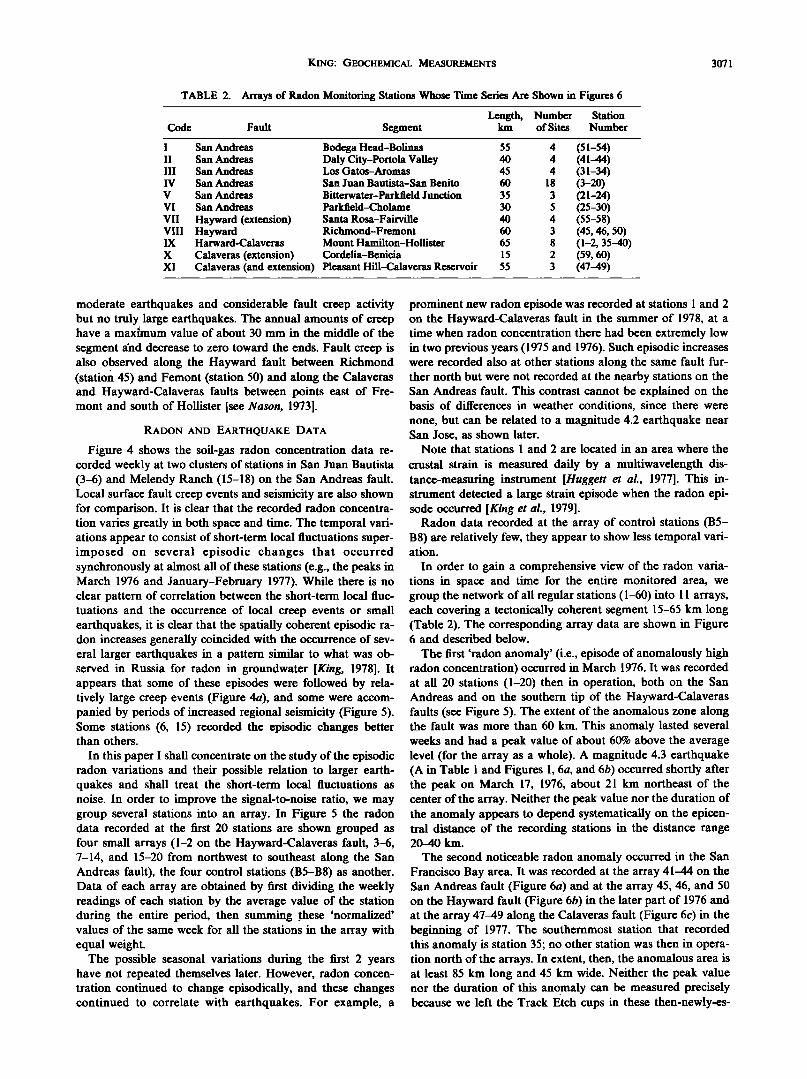
TABLE 2. Arrays of Radon Monitoring Stations Whose Time Series Are Shown in Figures 6
Code Length, Number Station
Fault Segment km of Sites Number
I San Andreas II San Andreas III San Andreas IV San Andreas V San Andreas VI San Andreas
VII Hayward (extension) VIII Hayward IX Harward-Calaveras
X Calaveras (extension) XI
Bodega Head-Bolinas Daly City-Portola Valley Los Gatos-Aromas
San Juan Bautista-San Benito Bitterwater-Parkfield Junction Parkfield-Cholame Santa Rosa-Fairville Richmond-Fremont Mount Hamilton-Hollister Cordelia-Benicia
Calaveras (and extension) Pleasant Hill-Calaveras Reservoir
55 4 (51-54) 40 4 (41-44) 45 4 (31-34) 60 18 (3-20) 35 3 (21-24) 30 5 (25-30) 40 4 (55-58) 60 3 (45, 46, 50) 65 8 (1-2, 35-40) 15 2 (59, 60) 55 3 (47-49)
moderate earthquakes and considerable fault creep activity but no truly. large earthquakes. The annual amounts of creep have a maxhnum value of about 30 mm in the middle of the segment find decrease to zero toward the ends. Fault creep is also observed along the Hayward fault between Richmond (station 45) and Femont (station 50) and along the Calaveras and Hayward-Calaveras faults between points east of Fre- mont and south of Hollister [see Nason, 1973].
RADON AND EARTHQUAKE DATA
Figure 4 shows the soil-gas radon concentration data re- corded weekly at two clusters of stations in San Juan Bautista (3-6) and Melendy Ranch (15-18) on the San Andreas fault. Local surface fault creep events and seismicity are also shown for comparison. It is clear that the recorded radon concentra- tion varies greatly in both space and time. The temporal vari- ations appear to consist of short-term local fluctuations super- imposed on several episodic changes that occurred synchronously at almost all of these stations (e.g., the peaks in March 1976 and January-February 1977). While there is no clear pattern of correlation between the short-term local fluc- tuations and the occurrence of local creep events or small earthquakes, it is clear that the spatially coherent episodic ra- don increases generally coincided with the occurrence of sev- eral larger earthquakes in a pattern similar to what was ob- served in Russia for radon in groundwater [King, 1978]. It appears that some of these episodes were followed by rela- tively large creep events (Figure 4a), and some were accom- panied by periods of increased regional seismicity (Figure 5). Some stations (6, 15) recorded the episodic changes better than others.
In this paper I shall concentrate on the study of the episodic radon variations and their possible relation to larger earth- quakes and shall treat the short-term local fluctuations as noise. In order to improve the signal-to-noise ratio, we may group several stations into an array. In Figure 5 the radon data recorded at the first 20 stations are shown grouped as four small arrays (1-2 on the Hayward-Calaveras fault, 3-6, 7-14, and 15-20 from northwest to southeast along the San Andreas fault), the four control stations (B5-B8) as another. Data of each array are obtained by first dividing the weekly readings of each station by the average value of the station during the entire period, then summing .these 'normalized' values of the same week for all the stations in the array with equal weight.
The possible seasonal variations during the first 2 years have not repeated themselves later. However, radon concen- tration continued to change episodically, and these changes continued to correlate with earthquakes. For example, a
prominent new radon episode was recorded at stations I and 2 on the Hayward-Calaveras fault in the summer of 1978, at a time when radon concentration there had been extremely low in two previous years (1975 and 1976). Such episodic increases were recorded also at other stations along the same fault fur- ther north but were not recorded at the nearby stations on the San Andreas fault. This contrast cannot be explained on the basis of differences in weather conditions, since there were none, but can be related to a magnitude 4.2 earthquake near San Jose, as shown later.
Note that stations I and 2 are located in an area where the
crustal strain is measured daily by a multiwavelength dis- tance-measuring instrument [Huggett et al., 1977]. This in- strument detected a large strain episode when the radon epi- sode occurred [King et al., 1979].
Radon data recorded at the array of control stations (B5- B8) are relatively few, they appear to show less temporal vari- ation.
In order to gain a comprehensive view of the radon varia- tions in space and time for the entire monitored area, we group the network of all regular stations (1-60) into 11 arrays, each covering a tectonically coherent segment 15-65 km long (Table 2). The corresponding array data are shown in Figure 6 and described below.
The first 'radon anomaly' (i.e., episode of anomalously high radon concentration) occurred in March 1976. It was recorded at all 20 stations (1-20) then in operation, both on the San Andreas and on the southern tip of the Hayward. Calaveras faults (see Figure 5). The extent of the anomalous zone along the fault was more than 60 km. This anomaly lasted several weeks and had a peak value of about 60% above the average level (for the array as a whole). A magnitude 4.3 earthquake (A in Table I and Figures 1, 6a, and 6b) occurred shortly after the peak on March 17, 1976, about 21 km northeast of the center of the array. Neither the peak value nor the duration of the anomaly appears to depend systematically on the epicen- tral distance of the recording stations in the distance range :20-40
The second noticeable radon anomaly occurred in the San Francisco Bay area. It was recorded at the array 41-44 on the San Andreas fault (Figure 6a) and at the array 45, 46, and 50 on the Hayward fault (Figure 6b) in the later part of 1976 and at the array 4749 along the Calaveras fault (Figure 6c) in the beginning of 1977. The southernmost station that recorded this anomaly is station 35; no other station was then in opera- tion north of the arrays. In extent, then, the anomalous area is at least 85 km long and 45 km wide. Neither the peak value nor the duration of this anomaly can be measured precisely because we left the Track Etch cups in these then-newly-es-

3072 KING: GEOCHEMICAL MEASUREMENTS
z
z ill
z ¸
z
Ill
STATIONS 51-54
STATIONS 41-44
_ •m min. ]llI•1IT1 Illhllrlllb!i• • II1111•111••1• Illlll•1111111!h!11111111111111I•11IIIItllllllllllillI•
rrr•lIl•!ll IllllIllllllllll!llllllJll!lllll!llllllIlll illl Ill !11IIIlIIIIllllIIIll!lIllIIlII!llIlIIlIIII!IIlIliII_
STATIONS 3-20 D G
A
Illlllll•... _ •IIlllilllilIHllllllllldiflt•Ii•llIlll•lillllllllll•t,tllllUllllllhll IlllIl!!!Illl•lllJl Illlllll IlIIllIliIllfmlllllllllIIlllllllllllllllllllllIl!!lllllll Ill!lJllll!ll!illlllllllllllllll!lllll!lllllllt!lllllllll!lll!
STATIONS 21-24 .• .m Ill ,,mJ &HillIll Illl• •. •tl!i• •.,IL•III III11
• _ •IIIIIIII•IIIII•IIU•l•IIIII•I•III•IIrlMIIIIII•Il•I•IIIIIIIII•I•IIIII•I•I•II•IIII !l•ll I IlI!• • II Ill I III Illl II Ill Illll II I I Ii II Ill Illllll Illl Illilllllll III II Ill illllllll IIl!ll !llll II II I Ill l I Illllllll II!
STATIONS 25-30 ll•
TIME
Fig.
Fig. 6. Time series of normalized radon concentration recorded by the entire network of regular stations grouped into 11 arrays as shown in Table 2: (a) along the San Andreas fault; (b) along the Hayward and the Hayward-Calaveras fault; (c) along the Calaveras fault and extension. Note that some arrays may be only partly in operation at times (e.g., the begin- ning of arrays 35-40 and 1-2). Also, cups were sometimes left in the ground longer than usual, resulting in loss of time resolution in the recorded radon variations (e.g., beginning of 41-44). An arrow indicates the occurrence of an earthquake of magnitude _•4.0 (Table 1).
tablished stations too long, not knowing an anomaly was oc- curring. The peak is estimated to be roughly twice the average level, the duration, several months. A swarm of earthquakes, the largest of magnitude 4.3 and 4.0 (B and C), occurred on January 8, 1977 (after the radon peaks recorded on the San Andreas and the Hayward faults but before the radon peak on the Calaveras fault), in Briones Hills between the Hayward and the Calaveras faults [Bolt et al., 1977].
At the beginning of 1977, at about the same time as the sec-
ond anomaly, the third radon episode occurred along the San Andreas fault between San Juan Bautista (3) and Cholame (Figure 6a), covering a distance of more than 170 km. This anomalous zone was separated from the second anomalous zone by a 50-km-long area between San Jose and San Juan Bautista-Hollister in which no significant radon anomaly was recorded on either the San Andreas (31-34) or the Hayward- Calaveras (36-40, 1-2). This radon anomaly has a peak value of more than a factor of 2 above the average level and a dura-

KING: GEOCHEMICAL MEASUREMENTS 3073
z
z
LU
j I I I I I •
IIIIlllllll!•I•l•!111• Illil!11 ITh Iilil!1111111illiililllllliliiiill!!l!illll I ,11 _
B,O
- STATIONS 45,46,50 • -
' li',l!1111111/I Jllllllll ,I il i 111I ,till[ ilIlllllll!lIl, ilIII!ll
3074 KING: GEOCHEMICAL MEASUREMENTS
z
I-
I- z LIJ o z o
z
i.u
- STATIONS 59-60 -- .. . m
..
B,C
_ STATIONS 47-49 , - ß ' ,
TIME Fig. 6c
to soil-gas radon. Such processes presumably would be unre- lated to those that generate earthquakes, and the apparent re- lations between the earthquakes and the radon anomalies from such causes would be spurious.
The main difficulty in attributing the observed radon anom- aly to some episodic increases in cosmic ray bombardment is that no such increases were noticed at the time of the radon
episodes. If cosmic rays did in fact affect the detectors in the field, then they should have affected the detectors in storage as we!!. One would then expect to see a systematic increase in particle count on the films with storage time. No such system- atic increase is found. A few unused films of various storage times were incidentally examined and none of them found to contain any significant number of tracks.
If changes in weather conditions were the main cause of the observed radon anomalies, then one would expect to see a sig- nificant seasonal component in the radon variations, and this component would be synchronous throughout the study area because the climatic conditions of the area are quite uniform. The recorded radon anomalies occurred in different seasons,
however, and had well-defined spatial limits beyond which the variations were quite different.
Weather data recorded at San Jose, which is near the center of the radon network, are given in Figure 7 for comparison with the radon data. No consistent correlation is found be-
tween the radon variations and the variations of any of these weather parameters. Consider rainfall, for example. If winter rainfalls were responsible for the radon episodes of March 1976 and January 1977 at stations 3-20, then the heavier rain- falls during the following winter should have caused a larger radon episode. This clearly did not happen. Moreover, there was no rain at all in the summer of 1978 when the radon epi-
sode (the fifth) along the Hayward-Calaveras and Hayward faults occurred.
To illustrate the lack of seasonal effect in the radon data, we show in Figure 8 the autocorrelation functions of several rep- resentative radon time series (arrays 1-2, 3-6; larger arrays 21-30, 31-40) and of the atmospheric temperature data shown in Figure 7. The prominent annual cycle in the temperature data is not shared by the radon data.
What intracrustal processes, then, can possibly cause the episodic radon changes? Was the increased amount of radon generated at the earthquake sources (6-12 km deep, see Table 1) and transported to the detectors near the surface, or was it generated locally near the detectors? If locally generated, what is the mechanism that provided the linkage between the earthquake sources and the radon detectors that are separated vertically by 6-12 km?
In view of the short half-life of radon (3.8 d) and its slow speed of migration in the ground [see Tanner, 1964], it is ex- tremely unlikely that the increased amounts of radon re- corded near the surface came from the relatively deep sources of earthquakes. Such increases are much likelier to be gener- ated locally near the detectors by some earthquake-related processes along the faults.
Two kinds of crustal processes may possibly increase the subsurface radon concentration: (1) mechanical disturbance of local soil such as seismic shaking or fault slip that may en- hance the local emanation coefficient; or (2) increased pore pressure in the fault zone that forces pore fluids to flow up- ward toward the surface, where the pressure stays relatively constant, pushing deeper gas that contains more radon to the detectors [King, 1978].
If local mechanical disturbance was responsible for the epi-

KING: GEOCHEMICAL MEASUREMENTS 3075
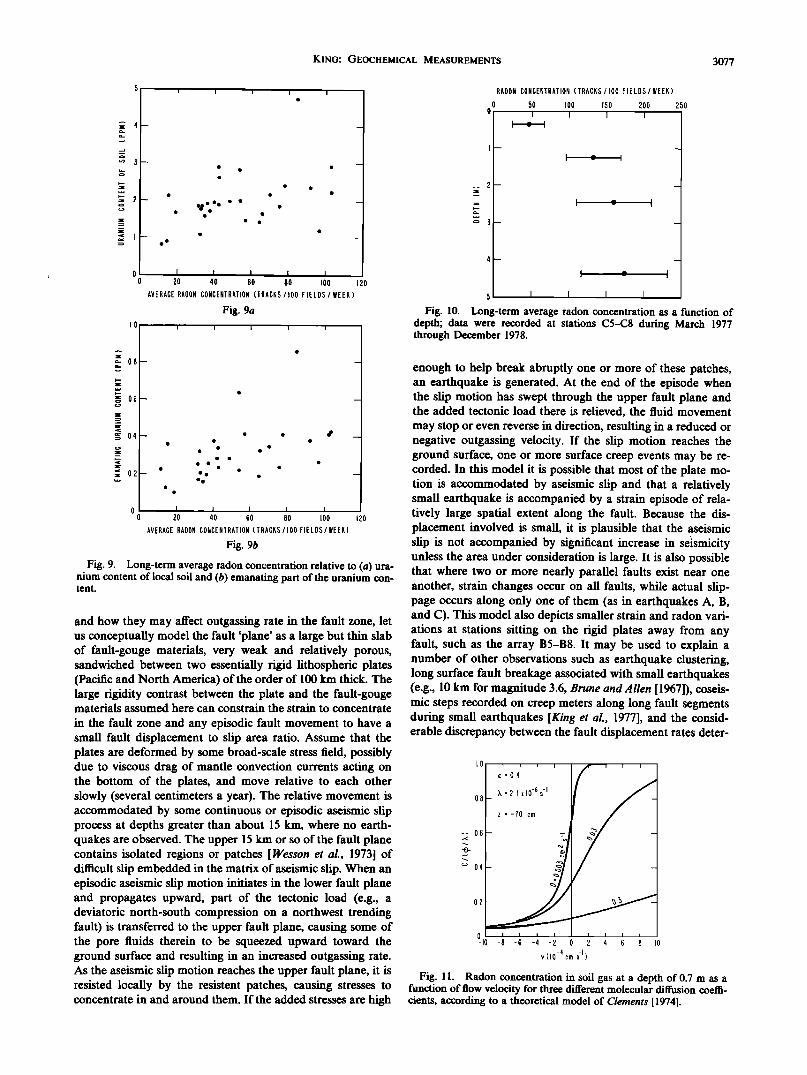
sodic radon increases recorded, then we should have seen some systematic radon changes caused by surface creep events, by smaller but closer earthquakes, and by rainfall. No such changes have been observed. The radon concentration does not even appear to depend significantly on the amount of radium (or equivalent amount of uranium) in the local soil. Soil samples were collected from the bottom of a number of these and other monitoring holes and their equivalent ura- nium contents and 'emanating' parts of the uranium contents determined by gamma ray spectroscopy. The measured ura- nium contents and their emanating parts were then plotted in Figure 9 relative to the long-term average radon levels for these stations. No significant correlation was found to exist.
It appears that the only reasonable cause for the observed episodes of high radon concentration is some episodic in- creases in outgassing rate along the faults. Similarly, episodes of unusually low radon concentration may be caused by downward flow of the radon-poor atmospheric air into the
soil. It is well known that subsurface radon concentration in-
creases rapidly with depth (see data recorded at stations C5- C8 shown in Figure 10). The profile of radon concentration relative to depth is very sensitive to gas flow, owing to the slowness of radon diffusion in soil. As estimated previously [King, 1978], to increase or decrease the radon concentration at the detection level by a factor of 2 requires an upward or downward flow rate of only ---t0 -4 cm s-' (or ---t0 cm d -l) for typical dry soil. The curves of Figure t t show how radon con- centration C at a depth (-z) of 0.7 m depends on the apparent gas-flow velocity v for three different molecular diffusion coef- ficients D of radon in soil, based on a theoretical steady state model by Clements [1974]. Here • is radon production rate, X its decay constant, and E soil porosity (assumed to be 0.4). Ac- tual values of D have not been measured but are expected to be approximately within the range 0.003-0.03 cm 2 s -•.
The proposition that gas flow dominates diffusion in caus- ing radon to migrate in the fault zones may also explain why
iii ,< lad Ii
_z ,<
ii .... I ß r
J I I I , i I
G
?
' ' 4? " ' , i I • I i I
, , ,
, .• , •,? , ./, ,
TIME
,.,,..
Fig. 7. Time series of weekly amount of rainfall, atmospheric temperature (minimum of each week), and barometric pressure (weekly average value of daily readings of noon time) recorded at San Jose.

3076 KING: GEOCHEMICAL MEASUREMENTS
STATIONS I-2
I I I I I I I I I
1.0
I I I I ' I I I I I I
1.0
z STATIONS 21-:50
o
ø00
I I • I I I I I ! I I
1.0
STATIONS 31 - 40
0.0
• • I I I I I I I I
1.0 o .
0.0
-0.8 , 0 50 I•10
TIME LAG (WEEKS)
Fig. 8. Correlograms of radon data recorded at two small arrays (1-2, 3-6) and two large arrays (21-30, 31-40) and of atmospheric temperature data shown in Figure 7.
the measured radon concentration was not grossly affected by such factors as rainfall, seismic shaking, and surface creep events, since these factors mainly affect the diffusion mechanism.
The next set of questions, then, is: What causes the fault zones to 'breathe' episodically, and why are the involved fault segments so long (---100 km, which is much larger than the es- timated source dimensions of earthquakes in the magnitude 4 range)?
One possible cause for episodic increases in outgassing rate is episodic strain changes in the fault zone which may con- ceivably be associated with some large-scale subsurface aseis- mic slip episodes. Several observations suggest that radon concentration may increase with increasing volumetric com- pression. For example, the fifth radon episode, detected on the
Hayward-Calaveras fault near Hollister, coincided in time with a strain episode (north-south compression) recorded there by a multiwavelength distance-measuring instrument. Also, Track Etch radon measurements made at the Nevada Test Site showed that soft-gas radon concentration increased significantly during the time period in which some under- ground nuclear explosions were detonated and was somewhat depressed in subsequent periods [Wollenberg et al., 1977]. Such changes can be attributed to increased crustal compres- sion caused by the explosions and decreased compression caused by subsequent collapse of the explosion-created cav- ities.
In order to visualize how strain episodes of large spatial ex- tent may occur along a major fault, such as the San Andreas,
KING: GEOCHEMICAL MEASUREMENTS 3077
0.6--
• 04--
;02-
i
ß
O-- i I I I I 0 20 40 60 80 IO0 120
AVERAGE RADON CONCENTRATION (TRACKS/lO0 FIELDS / WEEK)
Fig. 9a
I I I I i
ß ß ,1"
0 0 0 40 60 80 IO0 120 AVERAGE RADON CONCENTRATION (TRACKS/IO0 FIELDS/WEEK)
Fig. 9b
Fig. 9. Long-term average radon concentration relative to (a) ura- nium content of local soil and (b) emanating part of the uranium con- tent.
and how they may affect outgassing rate in the fault zone, let us conceptually model the fault 'plane' as a large but thin slab of fault-gouge materials, very weak and relatively porous, sandwiched between two essentially rigid lithospheric plates (Pacific and North America) of the order of 100 km thick. The large rigidity contrast between the plate and the fault-gouge materials assumed here can constrain the strain to concentrate
in the fault zone and any episodic fault movement to have a small fault displacement to slip area ratio. Assume that the plates are deformed by some broad-scale stress field, possibly due to viscous drag of mantle convection currents acting on the bottom of the plates, and move relative to each other slowly (several centimeters a year). The relative movement is accommodated by some continuous or episodic aseismic slip process at depths greater than about 15 km, where no earth- quakes are observed. The upper 15 km or so of the fault plane contains isolated regions or patches [Wesson et al., 1973] of difficult slip embedded in the matrix of aseismic slip. When an episodic aseismic slip motion initiates in the lower fault plane and propagates upward, part of the tectonic load (e.g., a deviatoric north-south compression on a northwest trending fault) is transferred to the upper fault plane, causing some of the pore fluids therein to be squeezed upward toward the ground surface and resulting in an increased outgassing rate. As the aseismic slip motion reaches the upper fault plane, it is resisted locally by the resistent patches, causing stresses to concentrate in and around them. If the added stresses are high
_ 2
RADON CONCENTRATION (TRACKS/IO0 FIELDS/WEEK)
0 50 IO0 150 200 0 I I I I
' e I
I -- -{
5 I
L _. I
25O
Fig. 10. Long-term average radon concentration as a function of depth; data were recorded at stations C5-C8 during March 1977 through December 1978.
enough to help break abruptly one or more of these patches, an earthquake is generated. At the end of the episode when the slip motion has swept through the upper fault plane and the added tectonic load there is relieved, the fluid movement may stop or even reverse in direction, resulting in a reduced or negative outgassing velocity. If the slip motion reaches the ground surface, one or more surface creep events may be re- corded. In this model it is possible that most of the plate mo- tion is accommodated by aseismic slip and that a relatively small earthquake is accompanied by a strain episode of rela- tively large spatial extent along the fault. Because the dis- placement involved is small, it is plausible that the aseismic slip is not accompanied by significant increase in seismicity unless the area under consideration is large. It is also possible that where two or more nearly parallel faults exist near one another, strain changes occur on all faults, while actual slip- page occurs along only one of them (as in earthquakes A, B, and C). This model also depicts smaller strain and radon vari- ations at stations sitting on the rigid plates away from any fault, such as the array B5-B8. It may be used to explain a number of other observations such as earthquake clustering, long surface fault breakage associated with small earthquakes (e.g., 10 km for magnitude 3.6, Brune and •411en [1967]), coseis- mic steps recorded on creep meters along long fault segments during small earthquakes [King et al., 1977], and the consid- erable discrepancy between the fault displacement rates deter-
IO i ! i I -- • :04
6 I
08- X=2 I xlO- s- z = -70 cm
O2
I I I I I I I I
Olo -8 6 -4 2 0 2 4 6 8 IO _ _ _
v(lO -4 s -{ cm )
--06
Fig. 11. Radon concentration in soil gas at a depth of 0.7 m as a function of flow velocity for three different molecular diffusion coeffi- cients, according to a theoretical model of Clements [1974].

3078 KING: GEOCHEMICAL MEASUREMENTS
mined geodetically and the rates derived from seismic mo- ments.
Large-scale strain episodes may have been recorded in the Aleutians [Major and Tocher, 1971] but not in California di-
\ .
rectly on strain instruments, except, the instrument mentioned previously [Hugget et al., 1977]. When more instruments •of this kind are deployed in properly chosen locations, they may possibly record some significant data related to the existence and nature of such strain episodes.
IMPLICATIONS FOR EARTHQUAKE PREDICTION
The results of this study suggest some limited usefulness of monitoring radon in subsurface soil gas for predicting earth- quakes in the magnitude range of 4.0-4.3 in the study area. They also point out some potential problems in the precision of predicting earthquake time (before or after the radon peak?), location (an earthquake may occur anywhere in or near a long anomalous fault zone), and magnitude (because the energy released by the earthquake appears to be only a small fraction of that released aseismically). The data are not sufficient to firmly establish a causal relation between radon anomalies and earthquakes or to give an empirical equation that will relate the amplitude, duration, and spatial dimension of a radon anomaly to the magnitude and location of the re- lated earthquake or earthquakes. It is not clear why some sites appear to be more favorable than others for detecting the ra- don anomalies (larger permeability?). More data are needed, especially for larger earthquakes and from areas in different tectonic settings (e.g., on a thrust fault), to see whether radon anomalies occur also, and if they do, in what pattern.
If the proposed mechanism for the observed radon anoma- lies is correct, i.e., if the episodic radon increase is caused by an increased outgassing rate in the fault zone in response to some episodic increases in crustal compression, then it is de- sirable to try to monitor the concentration of some other gases such as helium, carbon dioxide and mercury in soil gas and in groundwater. Increases in outgassing are often evident at the time of earthquake by the occurrence of such phenomena as mud volcanoes and bubbles in water wells; and they are possi- bly responsible for a number of other premonitory phenom- ena, such as certain strange sounds, smells, and fog. In com- position, crustal gas differs greatly from atmospheric air. Such differences may be what is causing some of the earthquake-re- lated aberrant behavior of animals on and beneath the ground surface. For example, deeper crustal gas is poorer in oxygen. The rise of deeper gas to shallow depths where some sub- surface animals live probably would force them to leave for survival. Other animals may behave aberrantly because of an increased number of ions in the air, since radon isotopes and their decay daughters are the chief ionizing agents near the earth's surface [see Pierce, 1976].
Acknowledgments. I thank W. A. Gaman, C. Walkingstick, and B. Williamson for technical assistance, A. Smith for measurements of uranium content of soil samples, and M. G. Bonilla, J.P. Eaton, J. H. Healy, J. C. Savage, and R. Robinson for helpful comments on the paper. The use of trade names does not constitute endorsement by the U.S. Geological Survey.
REFERENCES
Allen, C. R., The tectonic environments of seismically active and in- active areas along the San Andreas fault system, in Proceedings of Conference on Geological Problems of San Andreas System, Stan- ford Univ. Publ. Geol. Sci., 9, 70-82, 1968.
Bolt, B. A., J. Stiffer, and R. Uhrhammer, The Brions Hills earth- quake swarm of January 8, 1977, Contra Costa County, California, Bull. $eismal. Sac. Amer., 67, 1555-1564, 1977.
Brune, J. N., and C. R. Allen, A low-stress-drop, low-magnitude earthquake with surface faulting: The Imperial, California, earth- quake of March 4, 1966, Bull. Seismal. Sac. Amer., 57, 501-514, 1967.
Clements, W. E., The effect of atmospheric pressure variation on the transport of 222Rn from the soil to the atmosphere, Ph.D. thesis, New Mexico Inst. Mining and Technol., Socorro, 1974.
Fleischer, R. L., P. B. Price, and R. M., Walker, Nuclear Tracks in Solids, Principles and Applications, University of California Press, Berkeley, 1975.
GingriCh, J. E., Results from a new uranium exploration method, Trans. Sac. Mining Eng. AIME, 258, 61-64, 1975.
Huggett, G. R., and L. E. Slater, Fault slip episodes near Hollister, California: Initial results using a multiwavelength distance-measur- ing instrument, J. Geophys. Res., 82, 3361-3368, 1977.
King, C.-Y., Radon emanation on San Andreas fault, Nature, 271, 516-519, 1978.
King, C.-Y., L. E. Slater, and J. Langbein, A comparison of soil-gas radon and crustal strain data (abstract), Earthquake Notes, 49(4), 44, 1979.
King, C.-Y., R. D. Nason, and R. O. Burford, Coseismic steps re- corded on creep meters along the San Andreas fault, J. Geophys. Res., 82, 1655-1662, 1977.
Liu, P., D. Wan, and T. Wan, Studies of forecasting earthquakes in the light of the abnormal variations of radon concentration in groundwater (in Chinese), Acta Geophys. Sinica, 18, 279-283, 1975.
Major, M. W., and D. Tocher, Deformation without earthquakes, the central Aleutians, Geol. Soc. Amer. Abstr. Programs 3(2), 154, 1971.
Nason, R. D., Fault creep and earthquakes on the San Andreas fault, in Proceedings of the Conference on Tectonic Problems of the San Andreas Fault System, Stanford Univ. Publ. Geol. Sci., 13, 275-285, 1973.
Okabe, S., Time variation of the atmospheric radon-content near the ground surface with relation to some geophysical phenomena, Univ. Kyoto, Mem. Coil. Sci., 28, 99-115, 1956.
Pierce, E. T., Atmospheric electricity and earthquake prediction, Geophys. Res. Lett., 3, 185-188, 1976.
Sultankhodzhayev, A. N., I. G. Chernov, and T. Zakirov, Hydro- geoseismological premonitors of the Gazli earthquake (in Russian), Dokl. Akad. Nauk Uzb. SSSR, 7, 51-53, 1976.
Tanner, A. B., Radon migration in the ground: A review, in The Natu- ral Radiation Environment, Symposium Proceedings, Houston, Texas, April 10-13, 1963, edited by J. A. S. Adams and W. M. Low- der, pp. 161-190, University of Chicago Press, Chicago, Ill., 1964.
Tanner, A. B., Radon migration in the ground: A supplementary re- view, The Natural Radiation Environment III, Symposium Pro- ceedings, Houston, Texas, April 23-28, 1978, Rep. CONF-780422, U. S. Dep. of E, nergy, Washington, D.C., 1980.
Ulomov, V. I., and B. Z. Mavashev, A precursor of a strong tectonic earthquake, Dokl. Acad. Sci. USSR Earth Sci. Sect., 176, 9-11, 1967.
Wesson, R. L., R. O. Burford, and W. L. Ellsworth, Relationship be- tween seismicity, fault creep and crustal loading along the central San Andreas fault, in Proceedings of the Conference on Tectonic Problems of the San Andreas Fault System, Standard Univ. Publ. Geol. Sci., 13, 303-321, 1973.
Wollenberg, H., T. Straume, A. Smith, and C.-Y. King, Variations in radon-222 in soil and groundwater at the Nevada Test Site, Rep. 5905, 6 pp., Lawrence Berkeley Lab., Berkeley, Calif., 1977.
(Received March 29, 1979; revised September 14, 1979;
accepted September 28, 1979.)