epidemiological studies based on small sample sizes – a
TRANSCRIPT

Ersbøll AK, Ersbøll BK: Epidemiological studies based on small sample sizes – astatisticians point of view. Acta vet. scand. 2003. Suppl. 98, 127-140. – We consider3 basic steps in a study, which have relevance for the statistical analysis. They are: studydesign, data quality, and statistical analysis. While statistical analysis is often consideredan important issue in the literature and the choice of statistical method receives much at-tention, less emphasis seems to be put on study design and necessary sample sizes. Fi-nally, a very important step, namely assessment and validation of the quality of the datacollected seems to be completely overlooked.Examples from veterinary epidemiological research and recommendations for each stepare given together with relevant references to the literature.
small data set; design; data management; data quality; statistical analysis; samplesize; power; simulation.
Acta vet. scand. 2003, Suppl. 98, 127-140.
Acta vet. scand. Suppl. 98 - 2003
Epidemiological Studies Based on Small Sample Sizes– A Statistician’s Point of View
By Annette Kjær Ersbøll1 and Bjarne Kjær Ersbøll2
1Department of Animal Science and Animal Health, The Royal Veterinary and Agricultural University, Den-mark, and 2Informatics and Mathematical Modelling, The Technical University of Denmark, Denmark
IntroductionThere are 3 main issues in a study: design, dataquality (data management), and statistical anal-ysis (Fig. 1). In the statistical literature muchemphasis is put on performing the correct sta-tistical analysis. In contrast to this, standard sta-tistical methods are often used in the veterinaryliterature and much more emphasis is put on in-terpreting the outcome of the statistical analy-sis. However, in neither case is the statisticalanalysis able to correct the consequences of abadly designed study or deal meaningfully withdata of dubious quality. The aspects of choos-ing a sensible study design and the influence ofsample size are usually not reported and are not
very well represented outside purely statisticalliterature. In fact, in the authors' opinion sur-prisingly many statistical analyses are per-formed on data where little or no reflection atall has been made on study design and neces-sary sample size. Very often, just a few extrathoughts about a study design could have dras-tically improved the outcome of the study - inmany cases at no extra cost or at a marginal ex-tra cost. Furthermore, power calculations in thedesign phase can help design the study effi-ciently and stop studies that only have a smallchance of supporting the study hypothesis. Fi-nally, a nearly totally overlooked area is that ofdata quality. Even a carefully planned experi-ment can be rendered worthless if data collec-tion is not performed correctly. After data col-lection data can be checked for errors indifferent ways, in some cases data are expected
Design Data management Analysis
Figure 1. Three important phases in a study.

to behave according to some pattern, dates areknown to be ordered for instance, growthcurves are (usually) expected to growmonotonously, etc. Even more importantly,data can be monitored for consistency duringcollection, thereby permitting changes to thecollection procedure to be made so possiblemisunderstandings are corrected at the source.For illustrative purposes examples of small datasets are given initially. We continue by describ-ing experimental design, data quality and con-trol and finally analysis of small data sets. Thepaper is concluded with perspectives and rec-ommendations.
ExamplesFour examples of small data sets are used for il-lustration:
Example 1: Healing of wounds in horsesThe aim of this hypothetical study was to eval-uate 2 different antibiotics (A and B) in combi-nation with 2 bandages (I and II) for healing ofwounds in horses. Selection of study design isthe main problem in this example.
Example 2: Moderate coliform mastitisThe aim of the study was to evaluate avoidanceof antibiotics in treatment of moderate coliformmastitis in dairy cows (Katholm & Andersen2001). Thirteen cows were included in thestudy (CFU/cm2<142), 7 of these were treatedwith antibiotics. On day 21 the cows were eval-uated for clinical recovery (restored or not).
Example 3: Nematodes in sows and pigletsThe aim of the study was to investigate the in-fluence of multiple nematode infections onpiglet's performance (Thamsborg et al. 2001).Thirty-nine sows were included in the studyand given one of 3 infection levels: control (12sows), low triggered (13 sows) and high trig-gered (14 sows). Each litter was divided into 2
groups, one group in each litter was given an in-fectious dose, the other group in each litter wasnot. This example was included for its interest-ing design, even it is not a 'small data set'.
Example 4: Milk yield in dairy cowsHow many herds and how many cows per herdshould be included in the study in order todemonstrate a significant difference in milkyield for Jersey and Holstein cows? For illus-tration both the continuous outcome and a di-chotomised outcome (milk yield above or be-low 18 kg) have been used.
Study designDesign covers all the problems and considera-tions made before data collection starts. In thefollowing aspects on design, sample size andpower, compliance and randomisation will bediscussed.
DesignResearch studies are performed using either anobservational design or an experimental design(Fig. 2). Most epidemiological research isbased on observational studies. Observationalstudies are characterised by the fact that infor-mation of subjects is collected without affect-ing them in a pre-planned manner, often withlittle or no control on subjects. By contrast, in
128 A. Kjær Ersbøll & B. Kjær Ersbøll
Acta vet. scand. Suppl. 98 - 2003
Case-controlObservational Cohort
Cross-sectional
Cross-overExperimental Factorial (Parallel)
Latin square
{{
Figure 2. Examples of designs for observationaland experimental studies.

experimental studies the events are influencedand the effect of the interventions of subjectsare investigated. Experimental studies includeclinical trials (Pocock 1983), field trials and lab-oratory studies. Experimental studies are usu-ally performed in order to compare the effect ofdifferent treatments on the outcome andstronger conclusions/inferences can usually bedrawn compared to observational studies. Un-der experimental conditions problems withconfounders can be reduced or eliminated bycareful selection of subjects (e.g. same breed,gender and age). Observational studies can beeither prospective (data are collected forward intime) or retrospective (data refer to past events)whereas experimental studies are alwaysprospective. The 3 basic designs used in observational stud-ies are cohort, case-control and cross-sectionaldesigns, as illustrated in Fig. 3. In a cohortstudy, groups of subjects with different levels ofthe study factor (exposure) are included and in-formation on the development of the outcomee.g. of a particular disease (or condition) for agiven period of time is collected prospectively.In a case-control study a number of subjectswith the disease (cases) are identified alongwith unaffected subjects (controls). Hereby,cases and controls are selected from 2 differentpopulations. Study factors are collected retro-spectively. In cross-sectional studies subjectsare selected from the population without know-
ledge on the study factors or disease status. Thecurrent disease status and (present or past) ex-posure level are collected at the same time.Comparison of the basic designs and other de-signs used in observational studies, and a dis-cussion of advantages and disadvantages of thedifferent designs are discussed by e.g. Klein-baum et al. (1982), Woodward (1999) and Alt-man (1991).The simplest intervention design (experimentalstudy) is a parallel group design, where subjectsare allocated to one of 2 (or more) treatments.All subjects within a treatment group receivethe same treatment. Otherwise, all subjects aretreated similarly. If further study factors are tobe evaluated, a factorial design can be used. Ina factorial design subjects are allocated to thecombinations of the factors. Two or more levelsfor each factor can be used. A parallel design isa one-way factorial design. A Latin square de-sign is a special case of a three-way factorial de-sign having the same number of levels for all 3factors. An advantage of using a Latin squaredesign is that the number of subjects to be in-cluded is limited. However, interactions be-tween the 3 factors cannot be estimated. An al-ternative to the parallel design is a cross-overdesign (Senn 1993) in which each treatment isgiven at different times to each subject. This hasthe advantage of eliminating the inter-subjectvariability under certain assumptions, the mostimportant being that of no carry-over effect.
Studies based on small sample sizes 129
Acta vet. scand. Suppl. 98 - 2003
Design Past Present Future
Cohort Exposure Disease
Case-control Exposure Disease
Cross-sectional DiseaseExposure
Figure 3. Overview of the 3 commonly used designs in observational studies.

In Example 1 (Healing of wounds in horses) different designs can be suggested for the hy-pothetical experimental study. However, not alldesigns might be appropriate from a veterinarypoint of view. Due to practical issues only a lim-ited number of horses can be used, that is lessthan 10 horses. A Latin square design can beused in which 8 horses are included in 2 groupsof 4 horses. An example is given in Table 1.
In Example 2 (Moderate coliform mastitis) 13cows were included. The design is given in Fig.4. The study is an observational study with acohort design, where cows with mastitis werefollowed for 21 days and evaluated for clinicalrecovery. Antibiotic treatment is the exposureand clinical recovery after 21 days is the out-come.
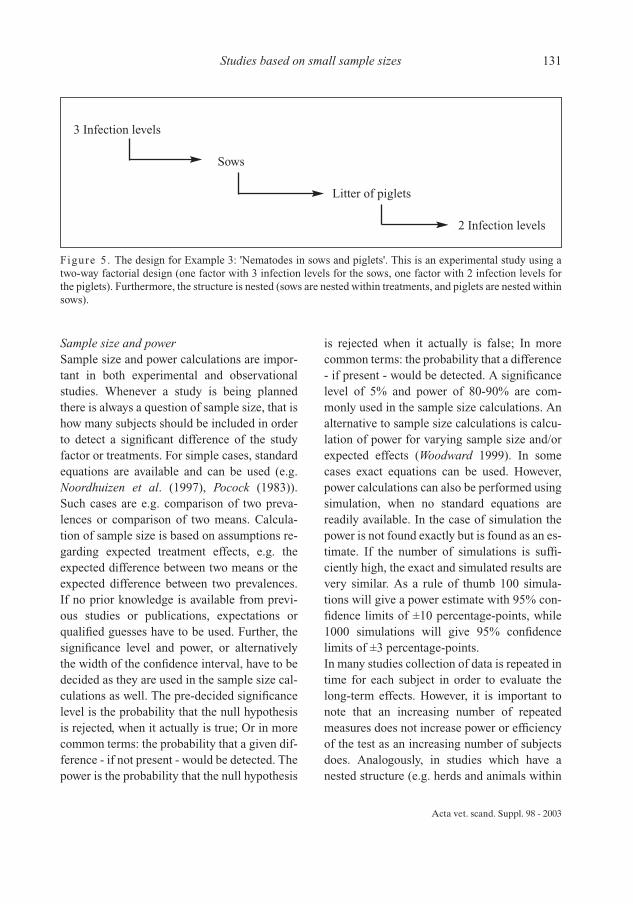
In Example 3 (Nematodes in sows and piglets)39 sows were given different infection levels ofnematodes and half of the piglets in each litterwere given an infection as well. The structure ofthe study is given in Fig. 5. The study is an ex-perimental study using a factorial design with 2factors (one factor with 3 levels for sows, onefactor with 2 levels for piglets). Note, that it isnot a standard two-way factorial design sincepiglets are nested within sows, which again arenested within infection levels for sows.
130 A. Kjær Ersbøll & B. Kjær Ersbøll
Acta vet. scand. Suppl. 98 - 2003
Table 1. A Latin square design for Example 1:Healing of wounds in horses. Horses are allocatedinto 4 treatment groups (A, B, C, D) that are combi-nations of 2 different antibiotics and 2 types of ban-dage.
Leg positionHorse ID
I II III IV
1 Right fore leg A B D C2 Left fore leg B C A D3 Right hind leg D A C B4 Left hind leg C D B A
Figure 4. The structure of Example 2: 'Moderate coliform mastitis'. This is an observational study with a co-hort design. Antibiotics used is exposure and clinically restored is the outcome.
Clinically restored +
Antibiotics +
Clinically restored -
Cows with
coliform mastitis
Clinically restored +
Antibiotics -
Clinically restored -
Sample size and powerSample size and power calculations are impor-tant in both experimental and observationalstudies. Whenever a study is being plannedthere is always a question of sample size, that ishow many subjects should be included in orderto detect a significant difference of the studyfactor or treatments. For simple cases, standardequations are available and can be used (e.g.Noordhuizen et al. (1997), Pocock (1983)).Such cases are e.g. comparison of two preva-lences or comparison of two means. Calcula-tion of sample size is based on assumptions re-garding expected treatment effects, e.g. theexpected difference between two means or theexpected difference between two prevalences.If no prior knowledge is available from previ-ous studies or publications, expectations orqualified guesses have to be used. Further, thesignificance level and power, or alternativelythe width of the confidence interval, have to bedecided as they are used in the sample size cal-culations as well. The pre-decided significancelevel is the probability that the null hypothesisis rejected, when it actually is true; Or in morecommon terms: the probability that a given dif-ference - if not present - would be detected. Thepower is the probability that the null hypothesis
is rejected when it actually is false; In morecommon terms: the probability that a difference- if present - would be detected. A significancelevel of 5% and power of 80-90% are com-monly used in the sample size calculations. Analternative to sample size calculations is calcu-lation of power for varying sample size and/orexpected effects (Woodward 1999). In somecases exact equations can be used. However,power calculations can also be performed usingsimulation, when no standard equations arereadily available. In the case of simulation thepower is not found exactly but is found as an es-timate. If the number of simulations is suffi-ciently high, the exact and simulated results arevery similar. As a rule of thumb 100 simula-tions will give a power estimate with 95% con-fidence limits of ±10 percentage-points, while1000 simulations will give 95% confidencelimits of ±3 percentage-points.In many studies collection of data is repeated intime for each subject in order to evaluate thelong-term effects. However, it is important tonote that an increasing number of repeatedmeasures does not increase power or efficiencyof the test as an increasing number of subjectsdoes. Analogously, in studies which have anested structure (e.g. herds and animals within
Studies based on small sample sizes 131
Acta vet. scand. Suppl. 98 - 2003
3 Infection levels
Sows
Litter of piglets
2 Infection levels
Figure 5. The design for Example 3: 'Nematodes in sows and piglets'. This is an experimental study using atwo-way factorial design (one factor with 3 infection levels for the sows, one factor with 2 infection levels forthe piglets). Furthermore, the structure is nested (sows are nested within treatments, and piglets are nested withinsows).

herds, where treatment regime is given at theherd level) it is often more advantageous from astatistical point of view to include more herdsand fewer animals in each herd rather thanfewer herds and many animals within eachherd.In Example 4 (Milk yield in dairy cows) it was
of interest to calculate the necessary number ofherds and number of cows within each herd inorder to demonstrate a significant difference inmilk yield between the 2 breeds Jersey and Hol-stein. There is no easily accessible standardequation for this sample size calculation. In-stead, simulation of power has been performed
132 A. Kjær Ersbøll & B. Kjær Ersbøll
Acta vet. scand. Suppl. 98 - 2003
Figure 6. Power for Example 4: 'Milk yield in dairy cows' given for number of herds and number of cowswithin herds for each breed. A continuous (A) and a dichotomised (>18 kg or ≤18 kg) outcome (B) have beenused.

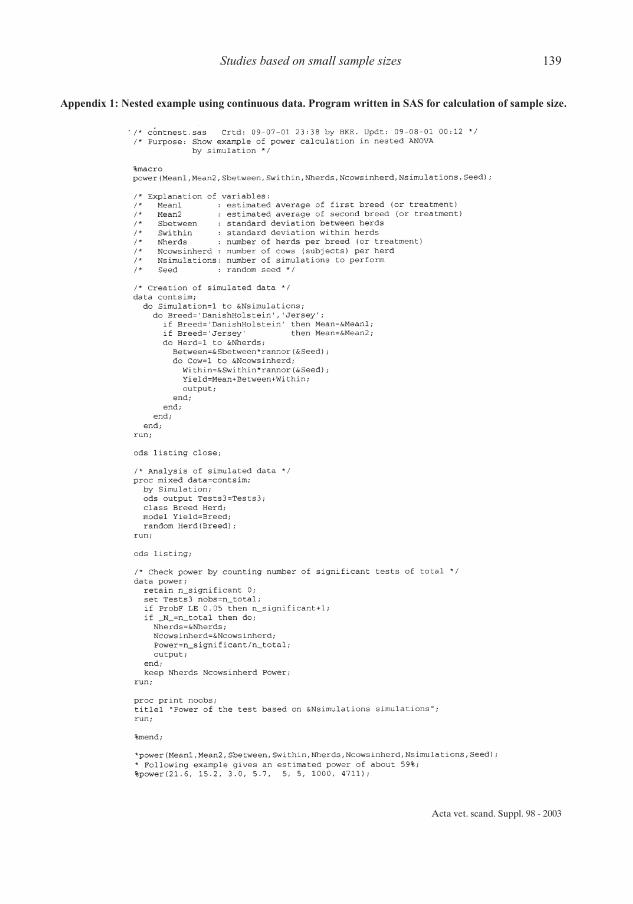
for a varying number of herds and a varyingnumber of cows within herds. The calculatedsample size is for each breed. A continuous out-come (milk yield) and dichotomized outcome(milk yield >18 kg or ≤ 18 kg) have been usedfor power simulations. The SAS program usedis given in the Appendices 1 and 2. Fig. 6.shows in both cases that the effect of includingmany herds with fewer animals is preferable toincluding fewer herds and many animals withineach herd. For the example with 5 herds and 10animals per herd for each breed the power is72% for the continuous outcome and 52% forthe dichotomous outcome. Changing that to 10herds and 5 animals per herd for each breed thepower rises to 93% for the continuous and 91%for the dichotomous cases, respectively. Thereason for this perhaps surprising result is thatthe p-value for a breed (or treatment) effect de-pends heavily on the variance between herds,even though it may be smaller than the variancebetween animals within herds.
ComplianceFor different reasons a part of the subjects in-cluded in the study might drop out before theend of the study (e.g. trading, death). Thesewithdrawals might be a problem in relation todemonstration of significant effects, if the sig-nificance is based on a sample size, which hasbeen reduced due to drop out. Therefore, the es-timated sample size should be increased in ac-cordance with the expected percentage of with-drawal. If for instance the sample size needed isestimated at 100 subjects, and the expectedwithdrawal is 20%, in total 125 subjects shouldbe included in the study.
RandomisationRandomisation is important (1) to prevent (orreduce) bias (systematic error) and (2) to pro-vide a basis for statistical analysis such as sig-nificance tests. In epidemiological research bias
is defined as: confounding, misclassification, in-formation bias, and selection bias (see e.g.Kleinbaum et al. 1982, Noordhuizen et al.1997). Bias can occur in a study if there is pref-erential assignment of subjects to the study fac-tor(s) in experimental studies or differential se-lection of subjects in observational studies.Randomisation will ensure that the variation indata is evenly distributed between the subjects.Further, randomisation will help balance thedistribution of other variables e.g. confounderssuch as age, gender and breed. The types of ran-domisations commonly used are (1) simple(complete), (2) restricted (block), (3) multi-stage, and (4) stratified. Simple randomisationmeans that each subject is included without at-tention to possible confounders. Block randomi-sation ensures a similar number of subjectswithin each level of the study factor. Multistagesampling is used when data have a multilevelstructure such as herds and subjects withinherds. First, herds are randomly selected; sec-ondly, subjects within herds are randomly se-lected. Stratified randomisation is used whenone or more factors are known to have an influ-ence on the outcome, such as age, gender, andbreed. The inclusion of subjects is balanced re-garding the factors. Stratification might be aproblem in studies with small data sets as thenumber of strata (combinations of the factorsused in stratification) can approach or even ex-ceed the number of subjects. An acceptable al-ternative is minimisation, which is a non-ran-dom allocation of subjects to study factors(Altman 1991). Minimisation has advantagesover both simple and stratified randomisation,when sample size is small. The factor groups arevery similar even for several study factors. The study in example 1 (Healing of wounds inhorses) used a latin square design. There are anumber of possible latin squares with 4 levelsof each factor. First, one of these latin squaresis randomly selected (simple random selec-
Studies based on small sample sizes 133
Acta vet. scand. Suppl. 98 - 2003

tion). Next, the 4 horses are block randomisedto the combinations of the 2 remaining factors.In example 2 (Moderate coliform mastitis) sim-ple randomisation was used to allocate cows toantibiotic treatment or not. Simple randomisa-tion was also used in example 3 (Nematodes insows and piglets) in order to allocate sows to the3 infection levels and piglets to the 2 infectionlevels. Example 4 (Milk yield in dairy cows)used a two-stage sampling. Herds were ran-domly selected among all Danish dairy herds.Cows within herds were randomly selected.
Data qualityData quality is always very important, even fora large data set. However, in most studies theimportance of data management is underesti-mated. Inappropriate data quality may lead tostatistical analysis based on incomplete and er-roneous data resulting in wrong conclusions.The importance of efficient data managementcan therefore not be stressed enough. Datamanagement includes collection of data, organ-ising data in a database and data control (check-ing data). When constructing the database,common ways to minimize the number of typ-ing errors are by (1) entering data twice andidentify discrepancies or (2) performing a com-plete proofreading of data entered into thedatabase. In the following data control and cor-rection of data will be discussed. Problems withclinical examinations will be discussed in rela-tion to small data sets. Data management in-cluding data control has been a very importantpart (time and cost) of human clinical trials (seee.g. Pocock (1983) and Altman (1991)). In vet-erinary medicine not much has been writtenabout data management and how to performdata control. However, e.g. Rothman & Green-land (1998) give some suggestions. Data quality is especially important when deal-ing with small studies. Identification of strangeobservations is nearly impossible, due to the
limited number of observations. For a large dataset it is often possible to identify a strange ob-servation by evaluating the distribution of dataand identify a strange observation as being out-standing from the remaining observations.However, with a small number of subjects, it isoften difficult to evaluate if one observation isdubious by comparing it to the (empirical) dis-tribution of the remaining observations.
Data controlData control will usually result in improveddata quality. Data control can be performedduring data collection as well as after data col-lection. Performing data control during collec-tion of data might identify specific problemswith some of the recordings which can bechanged and thereby improve the validity andquality of future recordings. Data controlshould always be performed after data collec-tion and before statistical analysis is initiated.Depending on the type of variables differentprocedures of data checking can be used. Thetypes of variables can be divided into qualita-tive (dichotomous, nominal, ordinal), quantita-tive (discrete and continuous) and miscella-neous (e.g. dates). Qualitative data as breed andgender have pre-specified values or codes.Therefore, qualitative data can be checked byidentifying impossible values. For quantitativedata as weight and milk yield it is not possibleto precisely identify incorrect values. It should,however, be possible to specify a range withlower and upper limits of reasonable values forthe variable. However, values outside the rangeare not necessarily incorrect, they are justflagged for possible further examination. Datacontrol also includes evaluating the frequencydistribution and completeness of data. Consis-tent ordering of dates can be checked. Logicalcontrol can be used in order to evaluate consis-tency of the data set (e.g. parity given for cowsonly and not for bulls) and identifying strange
134 A. Kjær Ersbøll & B. Kjær Ersbøll
Acta vet. scand. Suppl. 98 - 2003

observations (e.g. scatterplots of the relationbetween 2 continuous variables and time pro-files for each subject).
Correction of dataWhenever a wrong or strange observation hasbeen identified a decision has to be made re-garding data editing. Suspicious values shouldbe checked with the original data forms (if theyexist) and errors corrected. Other values mightbe left unchanged or coded as missing informa-tion. Elimination of subjects and/or valuesshould in general be avoided.
Clinical examinationsClinical examinations made by e.g. the veteri-nary practitioner are to some extent subjectiveand might be wrong (misclassification bias).Technically speaking, each veterinary practi-tioner might have his/her own sensitivity (abil-ity to assess true positive) and specificity (abil-ity to assess true negative). In small data sets itmight have a large influence if some of the clin-ical examinations are wrong. In order to im-prove the clinical examinations, the agreement
(intra- and inter-observer variations) betweene.g. two observers can be calculated. Similarly,agreement between repeated evaluations per-formed by the same observer at different timescan be evaluated.
Statistical analysisThe main aim of a statistical analysis is to usethe information from a (random) sample of sub-jects to make inferences about the relevant pop-ulation. Most analyses will include hypothesistesting and estimation of the effect of the studyfactors (e.g. treatments). Having a large data setoften implies robust analyses and results, mean-ing that we can obtain the same results in dif-ferent analyses. In case of a small data set evensmall changes in the analysis and/or changes inthe data set might inflate the results. Testing theeffect of a study factor (e.g. two treatments) isdone by comparison of the difference betweenthe treatments relative to the standard error ofthe difference. Sample size and standard errorare inversely related implying a large standarderror when sample size is small. A small studymay therefore fail to detect a (significant) dif-
Studies based on small sample sizes 135
Acta vet. scand. Suppl. 98 - 2003
Table 2. The influence of data quality on the association between antibiotics used and clinically restored on day21 in Example 2: Moderate coliform mastitis. One of the clinical evaluations has been changed and the influenceon the significance level (p-value) is given. Table A is the original data, tables B-D are modifications. Figures inboldface and italic are clinical examinations that have been changed.
AClinically restored
Yes No
Anti- Yes 7 0biotic No 2 4
Test for association : p=0.020.
BClinically restored
Yes No
Anti- Yes 6 1biotic No 2 4
Test for association: p=0.100
CClinically restored
Yes No
Anti- Yes 7 0biotic No 1 5
Test for association: p=0.005
DClinically restored
Yes No
Anti- Yes 7 0biotic No 3 3
Test for association: p=0.070

ference that is really present. With a decreasingsample size we will usually see an increasingp-value towards non-significance. In the fol-lowing the choice of method, improvement ofanalysis and non-parametric tests will be dis-cussed.The importance of quality of data is illustratedby Example 2: Moderate coliform Mastitis(Table 2). The association between using an-tibiotics and being clinically restored on day 21was significant (p=0.02 using Fisher's exacttest). If just one of the clinical evaluations ischanged from restored to not restored or visaversa, the association might not be significantany longer. In 2 of 3 cases where one evaluationis changed, a non-significant association isseen.
Choice of methodThe choice of method depends on the type ofoutcome (also called the response variable). Adichotomous outcome is a qualitative variablewith only two levels such as diseased yes/no. Acontinuous outcome is a variable, which cantake all possible values such as weight gain andmilk yield. However, the continuous outcomeoften has a lower and/or upper bound (e.g. milkyield cannot be negative). In case of a dichoto-mous outcome the relevant analyses include χ2-test, Fisher's exact test, McNemar's test and lo-gistic regression. The relevant analyses with acontinuous outcome include the t-test (forpaired and un-paired observations), analysis ofvariance and linear regression. With other typesof outcomes such as ordinal or nominal vari-ables with more than two levels ordinal logisticregression, multinomial logistic regression andloglinear models can be used (e.g. Hosmer &Lemeshow 2000, Agresti 1990).
Improvement of analysisCorrect model specification is crucial in allanalyses. The study factors and possible con-
founders should be included in the model.However, in a study with a small number ofsubjects, it might be impossible to include con-founders as well as study factors in the sameanalysis. The number of variables, which can beincluded in the model, depends on the numberof subjects. Depending on the number of levelsfor each factor, 2-3 study factors can be evalu-ated with e.g. 20 subjects. Confounding mightbe difficult to deal with having small data sets.Possible confounders are often evaluated by in-cluding these variables in the analysis or by per-forming analyses stratified by these variables.However, having fewer subjects it might be im-possible to include confounders due to limiteddegrees of freedom. Repeated measures are of-ten recorded in order to evaluate long term ef-fects. However, many repeated measures cangenerally not compensate for a limited numberof subjects. Logistic regression analysis of a dichotomousoutcome can be improved using exact logisticregression (LogXact). In a study including herds and subjects withinherds it can be impossible to include herds as arandom effect if the number of subjects is lim-ited. If strange observations have been identified inthe data control and no obvious explanation canbe found, the importance of the strange obser-vation can be evaluated by analysis. In the anal-ysis the strange observation can be included orleft out in turn. Differences between the 2 anal-yses can help identify an influential observa-tion. For small data sets, however, eliminationof even a "normal observation" might causedramatic differences in the results. This ap-proach is therefore not possible for small datasets. Consistent evaluation of the influence ofstrange observations is therefore nearly impos-sible for small data sets. This indicates furtherthe importance of having high quality data. Model validation can be used in order to vali-
136 A. Kjær Ersbøll & B. Kjær Ersbøll
Acta vet. scand. Suppl. 98 - 2003

date the results. Ideally, this is done using theoriginal subjects for estimation of the model.Validation is then performed using new sub-jects, by estimation of the outcome for the newsubjects using the developed resulting model.Differences between the estimated and ob-served outcome for the new subjects indicatethe performance of the resulting model. How-ever, it is often not feasible to collect validationdata and the original data must be used for thewhole validation process. With a large data set,this will normally be done by dividing data into2 subsets, one subset is used for developing andestimating the model (learning subset), theother subset is used to validate the model (testsubset). The difference between the observedand predicted values for the test subset is calcu-lated and is used as an indicator of model qual-ity. The learning subset often comprises 1/2 or2/3 of the complete data set depending on num-ber of observations in the complete data set. Fora small data set, this is often not possible, as thenumber of observations in the learning subsetmay be too small to estimate the model. Instead,validation can be performed using cross-valida-tion (Weisberg 1985). Here, one of the mostcommonly used methods is the so-called leave-one-out technique. Simulation and bootstrapping are further meth-ods that can be used in order to understand, im-prove, and validate the models.
Non-parametric methodsNon-parametric methods are also called distri-bution-free tests and rank methods. For the sim-plest parametric tests there are correspondingnon-parametric tests e.g. Mann-Whitney's testand Wilcoxon's test correspond to t-test for un-paired observations, Wilcoxon's signed ranktest corresponds to t-test for paired observa-tions, Kruskall Wallis's test and Friedman's testcorrespond to one-way and two-way analysis ofvariance, respectively. A non-parametric test is
a test where no assumptions regarding the out-come have to be fulfilled. However, there arestill assumptions which must be fulfilled(Conover 1980). In general, the non-parametrictests are not as informative as parametric meth-ods because the non-parametric methods useranks instead of original values. The non-para-metric methods are therefore mainly used fortesting hypotheses and not for estimation. If the assumptions for performing a parametrictest are satisfied, the non-parametric tests arenot as efficient as the parametric. The relativeefficiency between 2 similar tests can be calcu-lated as the sample size needed using one testcompared to the sample size needed for the sec-ond test under similar conditions (Conover1980). The relative efficiency of non-paramet-ric tests compared to the corresponding para-metric test is often small. Therefore, if the as-sumptions for performing a parametric test arefulfilled, it is easier to detect significant effectsusing the parametric test compared to the rele-vant non-parametric methods. Furthermore,parametric methods offer a much richer class ofmodels than non-parametric methods.
AcknowledgementsThe authors would like to thank SM Thamsborg andPH Andersen from The Royal Veterinary and Agri-cultural University, Denmark and J Katholm, Vivild,Denmark for providing us with examples of smalldata sets. We would also like to thank an anonymousreviewer for numerous comments which helped clar-ify the paper.
ReferencesAgresti A: Categorical data analysis. John Wiley &
Sons, New York 1990.Altman DG: Practical statistics for medical research.
Chapman & Hall, London 1991.Conover WJ: Practical non-parametric statistics,
2.ed. John Wiley & Sons, New York 1980.Hosmer DW, Lemeshow S: Applied logistic regres-
sion, 2.ed., John Wiley & Sons, New York, 2000.Katholm J, Andersen PH: (2001) Treatment of col-
iform mastitis in bovine practice - can antibiotics
Studies based on small sample sizes 137
Acta vet. scand. Suppl. 98 - 2003

be avoided? In: Proceedings from The 11th Inter-national Conference on Production Diseases inFarm Animals, 2001, 12-16 August, Frederiks-berg, Denmark. Acta vet. scand. 2003, Suppl. 98.
Kleinbaum DG, Kupper LL, Morgenstern H: Epi-demiologic research. Van Nostrand Reinhold,New York 1982.
Noordhuizen JPTM, Frankena K, van der Hoofd CM,Graat EAM: Application of quantitative methodsin veterinary epidemiology. Wageningen Press,Wageningen 1997.
Pocock SJ: Clinical trials. A practical approach. JohnWiley & Sons, New York 1983.
Senn S: Cross-over trials in clinical research. JohnWiley & Sons, New York 1993.
Thamsborg SM, Mejer H, Roepstorff A, Ersbøll AK,Eriksen L: Effects of nematodes on health andproductivity of outdoor sows and sucklingpiglets. In: Proceedings from the 18th Interna-tional Conference of the WAAVP, p53, 2001.Held in Stresa, Italy.
Weisberg S: Applied linear regression. Wiley & Sons,New York 1985.
Woodward M: Epidemiology. Study design and dataanalysis. Chapman & Hall/CRC, London 1999.
Rothman KJ, Greenland S: Modern Epidemiology.Lippincott - Raven Publishers, Philadelphia1998.
SammendragEpidemiologiske studier baseret på små datasæt - enstatistikers synspunkt.
Vi betragter tre vigtige trin i et studie, som har rele-vans for den statistiske analyse. De er: design afstudiet, data kvalitet og statistisk analyse. Mensstatistisk analyse ofte bliver betragtet som et vigtigtelement i litteraturen og valget af statistisk metodefår megen opmærksomhed, så synes der at blive lagtmindre vægt på design af studiet og nødvendigstikprøvestørrelse. Endelig bliver et meget vigtigt el-ement, nemlig undersøgelse og validering af de ind-samlede data's kvalitet, oftest overset.Eksempler fra veterinær epidemiologi og anbe-falinger for hvert af trinnene bliver givet sammenmed relevante referencer til litteraturen.
138 A. Kjær Ersbøll & B. Kjær Ersbøll
Acta vet. scand. Suppl. 98 - 2003
Peer reviewed contribution to 11. International Conference on Production Diseases in Farm Animals, 12-16 Au-gust 2001, The Royal Veterinary and Agricultural University, Frederiksberg, Denmark.
Reprints may be obtained from: Annette Kjær Ersbøll, Department of Animal Science and Animal Health, TheRoyal Veterinary and Agricultural University, Grønnegårdsvej 8, DK-1870 Frederiksberg C Denmark. E-mail: [email protected], tel: +45 35 28 30 21, fax: +45 35 28 30 22.
Studies based on small sample sizes 139
Acta vet. scand. Suppl. 98 - 2003
Appendix 1: Nested example using continuous data. Program written in SAS for calculation of sample size.

140 A. Kjær Ersbøll & B. Kjær Ersbøll
Appendix 2: Nested example using dichotomous data. Program written in SAS for calculation of sample size.