epi info vector surveillance mobile application · epi info vector surveillance ... 1.5 cloud...
TRANSCRIPT

Epi Info Vector Surveillance
Mobile Application
User Manual

Table of Contents 1 Installation Instructions .................................................................................................................................8
1.1 System Requirements .................................................................................................................................8
1.2 Downloading the App to a Mobile Device ..................................................................................................8
1.3 App Settings ................................................................................................................................................8
1.4 Lab Mode ....................................................................................................................................................9
1.5 Cloud Configuration and Syncing Data .................................................................................................... 10
1.5.1 Suggested Cloud Settings for Field Collection ................................................................................. 10
1.5.2 Suggested Cloud Settings for Lab Collection ................................................................................... 10
1.5.3 Suggested Cloud Settings for Syncing Data Only ............................................................................. 11
1.5.4 A Note about “Suggestions” ............................................................................................................ 11
1.5.5 Setting up a Cloud Service ............................................................................................................... 11
1.5.6 Syncing with the Cloud .................................................................................................................... 13
1.6 Geography ............................................................................................................................................... 14
2 Overview ..................................................................................................................................................... 17
3 Collecting Field Data ................................................................................................................................... 17
3.1 Location ................................................................................................................................................... 18
3.1.1 New or Existing Records .................................................................................................................. 18
3.1.2 Scan a Barcode ................................................................................................................................ 19
3.1.3 Structure Type ................................................................................................................................. 20
3.1.4 GPS Details ....................................................................................................................................... 21
3.1.5 Demographics, family ...................................................................................................................... 22
3.1.6 Demographics, address ................................................................................................................... 23
3.1.7 Place Details..................................................................................................................................... 24
3.1.8 Entomology Menu (Field) ................................................................................................................ 25
3.2 Trapping (Field) ........................................................................................................................................ 26
3.2.1 New or Existing Traps ...................................................................................................................... 26
3.2.2 Trap Type ......................................................................................................................................... 27
3.2.3 Trap Retrieval .................................................................................................................................. 29
3.3 Collection (Field) ...................................................................................................................................... 31
3.3.1 New Collection Activity .................................................................................................................... 33
3.3.2 Adult ................................................................................................................................................ 34
3.3.3 Larvae/Pupae ................................................................................................................................... 35

3
3.4 CDC Bottle Bioassay (Field) ...................................................................................................................... 47
3.4.1 Mosquito Population Parameters .................................................................................................. 47
3.4.2 Mosquito Genus .............................................................................................................................. 49
3.4.3 Assay Test Type ............................................................................................................................... 50
3.4.4 Insecticide Selection ........................................................................................................................ 52
3.4.5 Replicate Parameters ...................................................................................................................... 55
3.4.6 Review ............................................................................................................................................. 56
3.4.7 Time Interval Testing ....................................................................................................................... 57
3.4.8 Total Mosquito Counts .................................................................................................................... 58
3.4.9 Optional Parameters ....................................................................................................................... 59
3.5 Cone Bioassay (Field) ............................................................................................................................... 60
3.5.1 Field Cone Bioassay Data Form ....................................................................................................... 62
3.6 Adult Vector Control ................................................................................................................................ 64
3.6.1 Indoor Spraying ............................................................................................................................... 69
3.6.2 Outdoor Spraying ............................................................................................................................ 71
3.6.3 Source Reduction ............................................................................................................................. 75
4 Collecting Lab Data ..................................................................................................................................... 76
4.1 Retrieving Records for Lab Activities ....................................................................................................... 77
4.2 Trapping (Lab) .......................................................................................................................................... 79
4.2.1 Ovitraps ........................................................................................................................................... 81
4.2.2 All Adult Traps ................................................................................................................................. 82
4.3 Collection (Lab) ........................................................................................................................................ 91
4.3.1 Adult ................................................................................................................................................ 92
4.3.2 Larvae/Pupae ................................................................................................................................... 99
4.4 Cone Bioassay (Lab Only)....................................................................................................................... 103
4.4.1 Lab Cone Bioassay Data Form ....................................................................................................... 104
5 Transfer Data ............................................................................................................................................ 106
5.1 Export Data to CSV format .................................................................................................................... 106
5.2 Sync to Epi Info for Windows ................................................................................................................ 106
6 Data Analysis: From the app itself ............................................................................................................ 107
7 Data Analysis: Using Epi Info for Windows............................................................................................... 107
8 Process Flow Diagrams ............................................................................................................................. 109
9 Contacts for Troubleshooting Issues With The App ................................................................................. 117

4
10 References ................................................................................................................................................ 117
11 Disclaimers ............................................................................................................................................... 117
12 Frequently Asked Questions..................................................................................................................... 118

5
Table of Figures Figure 1. App Settings Menu ......................................................................................................................................9
Figure 2. Suggested Cloud Settings for Field Data Collection ................................................................................. 10
Figure 3. Suggested Cloud Settings for Lab Data Collection .................................................................................... 11
Figure 4. Suggested Cloud Settings for Syncing Only .............................................................................................. 11
Figure 5. Cloud Service ............................................................................................................................................ 12
Figure 6. Login Screen for Box Account ................................................................................................................... 13
Figure 7. Menu and Cloud Icon for Syncing Data .................................................................................................... 14
Figure 8. Menu Items from the Home screen ........................................................................................................ 14
Figure 9. Capturing Region ...................................................................................................................................... 15
Figure 10. Stratifying by Region during analysis ...................................................................................................... 15
Figure 11. Download a KML or KMZ file of your location ........................................................................................ 16
Figure 12. Delete the “default” KML and replace it with the one you downloaded ............................................... 16
Figure 13. Main Screen ............................................................................................................................................ 17
Figure 14. Default New Record Screen .................................................................................................................... 18
Figure 15. Sample Location Data ............................................................................................................................ 19
Figure 16. Structure Barcode and Structure Type ................................................................................................... 21
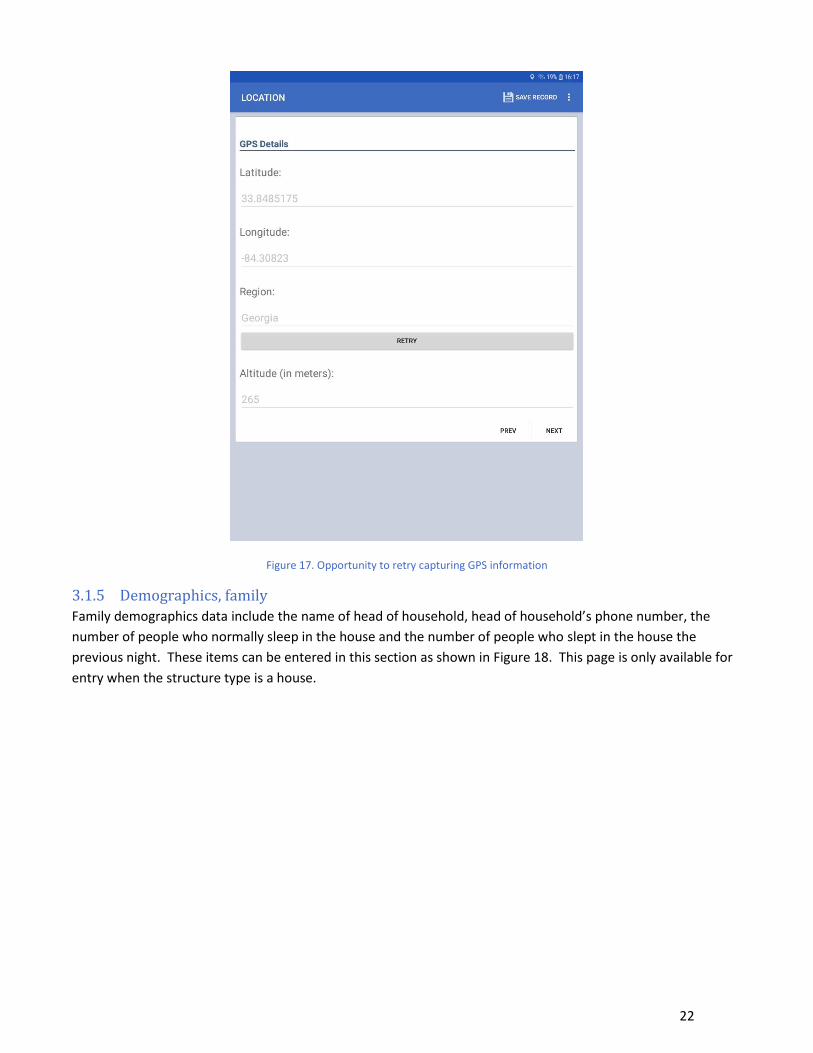
Figure 17. Opportunity to retry capturing GPS information ................................................................................... 22
Figure 18. Demographics, Family for a House ......................................................................................................... 23
Figure 19. Demographics, Address Details for All Structure Types. ........................................................................ 24
Figure 20. Place details for All Structure Types ....................................................................................................... 25
Figure 21. Entomology Menu ................................................................................................................................. 26
Figure 22. Trapping Records Screen ....................................................................................................................... 27
Figure 23. Trap Type and Location ......................................................................................................................... 28
Figure 24. Example Trapping Record Screen ........................................................................................................... 29
Figure 25. Trap Retrieval ......................................................................................................................................... 30
Figure 26. Save Record ........................................................................................................................................... 31
Figure 27. Field Collection Record Screen, No Records. ......................................................................................... 32
Figure 28. Field Collection Records Screen, With Example Records ...................................................................... 33
Figure 29. Field Collection Life Stage ....................................................................................................................... 34
Figure 30. Aspirator ................................................................................................................................................. 35
Figure 31. Larvae/Pupae Field Collection ................................................................................................................ 36
Figure 32. Larvae/Pupae Container Status ............................................................................................................. 37
Figure 33. Positive Identification of Larvae/Pupae ................................................................................................. 38
Figure 34. Reason for Not Applying Larvicide......................................................................................................... 39
Figure 35. Specify Larvicide Used. ........................................................................................................................... 40
Figure 36. Field Collection Larvicide Formulation and Amount .............................................................................. 41
Figure 37. Field Collection Larval Water Container Types ....................................................................................... 42
Figure 38. Field Collection Container Details .......................................................................................................... 43
Figure 39. Field Collection Survey Results ............................................................................................................... 44
Figure 40. Count of negative containers when larvae/pupae are not present ....................................................... 45
Figure 41. Unknown status of container. ............................................................................................................... 46
Figure 42. CDC Bottle Bioassay Records Example ................................................................................................... 47
Figure 43. CDC Bottle Bioassay Mosquito Population Form ................................................................................... 48
6
Figure 44. CDC Bottle Bioassay List of Mosquito State and Origins ....................................................................... 48
Figure 45. CDC Bottle Bioassay List of Collection Methods ..................................................................................... 49
Figure 46. CDC Bottle Bioassay List of Physiological Status .................................................................................... 49
Figure 47. CDC Bottle Bioassay Mosquito Genus Form ........................................................................................... 50
Figure 48. CDC Bottle Bioassay Test Selection Form ............................................................................................... 51
Figure 49. CDC Bottle Bioassay Test Selection Form, Synergist Test Options ........................................................ 52
Figure 50. CDC Bottle Bioassay Synergist List .......................................................................................................... 52
Figure 51. Table of Diagnostic Doses and Diagnostic Times for Anopheles and Aedes Mosquitos ........................ 53
Figure 52. CDC Bottle Bioassay Insecticide Form for Aedes Species ....................................................................... 53
Figure 53. CDC Bottle Bioassay Insecticide Form for Anopheles Species ................................................................ 54
Figure 54. CDC Bottle Bioassay Insecticide Form for Other Species ....................................................................... 55
Figure 55. CDC Bottle Bioassay, Replicate Selection for Diagnostic and Synergist Tests ........................................ 56
Figure 56. CDC Bottle Bioassay, Replicate Selection for Intensity Tests (Example) ................................................ 56
Figure 57. Example CDC Bottle Bioassay Review Form ........................................................................................... 57
Figure 58. CDC Bottle Bioassay Example Time Interval Screen ............................................................................... 58
Figure 59. CDC Bottle Bioassay Example Total Mosquito Count Screen ................................................................. 59
Figure 60. CDC Bottle Bioassay Optional Parameters ............................................................................................ 60
Figure 61. Cone Bioassay ......................................................................................................................................... 61
Figure 62. Cone Bioassay Records Screen .............................................................................................................. 62
Figure 63. Cone Bioassay Data Field Collection Form ............................................................................................ 63
Figure 64. Cone Bioassay Data Field Collection Form ............................................................................................. 64
Figure 65. Vector Control Initial Records Page ........................................................................................................ 65
Figure 66. Vector Control Study Form ..................................................................................................................... 66
Figure 67. Vector Control Kind of Study Site Form .................................................................................................. 67
Figure 68. Vector Control Form to Determine Use of Ring Design ......................................................................... 68
Figure 69. Vector Control Form To Determine Center Of Ring ............................................................................... 69
Figure 70. Vector Control Form to Determine Indoor Spraying .............................................................................. 70
Figure 71. Vector Control Form for Indoor Insecticide ........................................................................................... 71
Figure 72. Vector Control Form to Determine Outdoor Spraying ........................................................................... 72
Figure 73. Vector Control Form for Outdoor Spraying ............................................................................................ 73
Figure 74. Vector Control Form for Larviciding ....................................................................................................... 74
Figure 75. Vector Control Form for Larvicide Type ................................................................................................. 75
Figure 76. Vector Control Form for Source Reduction ............................................................................................ 76
Figure 77 Differences between Field and Lab Functions ........................................................................................ 77
Figure 78. Lab Location Records .............................................................................................................................. 78
Figure 79. Lab Entomology Menu............................................................................................................................ 79
Figure 80. Lab Trapping Records Screen ................................................................................................................. 80
Figure 81. Lab Trapping, Verifying Trap Date and Type .......................................................................................... 81
Figure 82. Lab Trapping, Egg Total for Ovitraps ...................................................................................................... 82
Figure 83. Lab Trapping, Aedes Present ................................................................................................................. 83
Figure 84. Lab Trapping, Counting Aedes Adults .................................................................................................... 84
Figure 85. Lab Trapping, Culex Present .................................................................................................................. 85
Figure 86. Lab Trapping, Counting Culex Adults ...................................................................................................... 86
Figure 87. Lab Trapping, Anopheles Present .......................................................................................................... 87

7
Figure 88. Lab Trapping, Counting Anopheles Adults .............................................................................................. 88
Figure 89. Lab Trapping, Other Species Present...................................................................................................... 89
Figure 90. Lab Trapping Total Mosquitoes Summary .............................................................................................. 90
Figure 91. Lab Collection Records Screen................................................................................................................ 91
Figure 92. Lab Collection, Life Stage Selection ....................................................................................................... 92
Figure 93. Lab Collection, Aedes Present ................................................................................................................ 93
Figure 94. Lab Collection, Adult Aedes Counts ....................................................................................................... 94
Figure 95. Lab Collection, Culex Present ................................................................................................................ 95
Figure 96. Lab Collection, Adult Culex Counts ......................................................................................................... 96
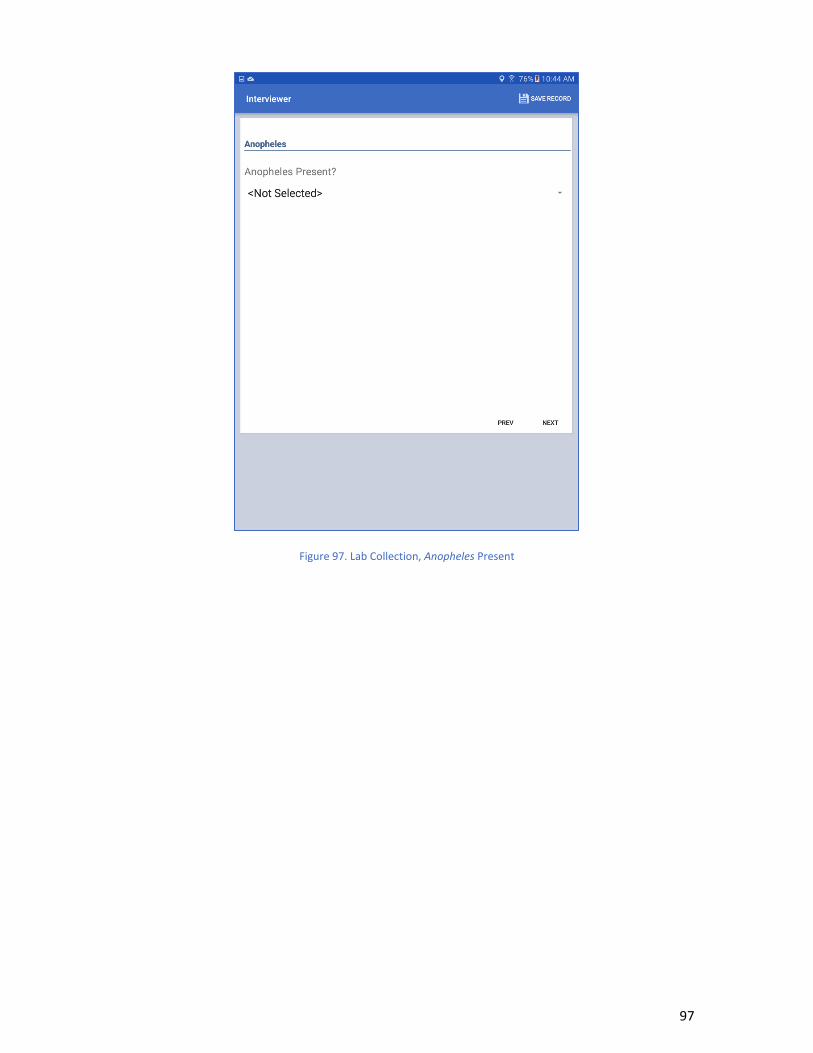
Figure 97. Lab Collection, Anopheles Present ......................................................................................................... 97
Figure 98. Lab Collection, Adult Anopheles Counts ................................................................................................. 98
Figure 99. Lab Collection, Other Species Present .................................................................................................... 99
Figure 100. Lab Collection, Larvae Present ........................................................................................................... 100
Figure 101. Lab Collection, Larvae Species Counts................................................................................................ 101
Figure 102. Lab Collection, Pupae Present ............................................................................................................ 102
Figure 103. Lab Collection, Emerged Pupae Counts .............................................................................................. 103
Figure 104. Initial Lab Cone Bioassay Records Screen .......................................................................................... 104
Figure 105. Cone Bioassay Data Lab Collection Screen ........................................................................................ 105
Figure 106. Analysis Screen ................................................................................................................................... 107
Figure 107. Epi Info Example Dashboard ............................................................................................................... 108
Figure 108. Flow Diagram for a Location Record .................................................................................................. 110
Figure 109. Flow Diagram for Field Trapping Records .......................................................................................... 111
Figure 110. Flow Diagram for Field Collection Records ......................................................................................... 112
Figure 111. Flow Diagram for Lab Collection Records ........................................................................................... 113
Figure 112. Flow Diagram for Field Cone Bioassay Records .................................................................................. 114
Figure 113. Flow Diagram for Lab Cone Bioassay Records .................................................................................... 115
Figure 114. Flow Diagram for Adult Vector Control Records ................................................................................ 116

8
1 Installation Instructions
1.1 System Requirements Ensure that your mobile device meets the following requirements:
1. is capable of running Android version 4.0 or higher,
2. has as 256MB RAM or more,
3. has 6MB free space,
4. has a rear-facing camera capable of auto focus.
The app can run on either a phone or tablet, however users should be aware that some device manufacturers
may change the position and/or appearance of elements such as menus and buttons. If data will be transferred
from the mobile device to a PC you will also need to meet the system requirements for a PC listed below.
Data analysis may require Epi Info for Windows. To use Epi Info for Windows you will need the following:
1. Windows Vista, 7, 8 or 10,
2. Microsoft .NET Framework version 4.5,
3. Permissions to read, write, and execute on the desktop (Note: administrative privileges are NOT
needed).
To use a cloud service for syncing data from one or more devices you may need they following:
1. An account with a supported cloud service (see Section 1.4)
2. An internet connection using Wi-Fi or a cellular service
1.2 Downloading the App to a Mobile Device The app can be installed directly to your mobile device. To download the latest version of the app, open the
following link on your mobile web browser:
https://goo.gl/ziM77M
If your Android device meets the minimum system requirements, an “install” button will appear. Click it to
install the app. Note that the app requires access to key device features such as the internal storage and the
built-in GPS.
1.3 App Settings Prior to using the app it may be necessary to configure it based on the intended use, i.e., whether or not the app
will be used in the field or lab, the use of a cloud service, etc. Select Settings from the menu button displayed as
three vertical dots in the far upper right hand corner of the screen to access the screen shown in Figure 1.
Before using the app on your device it is suggested to select a Device ID by clicking the item labeled “Device ID”
in the Identification section of the settings screen. Choosing your own Device ID rather than defaulting to the
value provided may simplify the process of syncing file names in a multi-user environment.

9
Figure 1. App Settings Menu
1.4 Lab Mode By default, the app is installed in Field Mode, i.e., the mode that allows technicians to conduct surveys in the
field, record the setting and collection of traps, etc. For simplicity in data entry, this mode hides questions that
can only be answered by looking under a microscope, such as the exact number of eggs or the species/sex of a

10
mosquito. To set up a device for use in the lab, simply switch on the setting labeled “Use app in LAB mode”.
Note that while this mode will enable the types of questions described above, it also disables functions that do
not apply to the stationary laboratory setting, such as capturing the GPS coordinates of a house or interviewing
household residents.
1.5 Cloud Configuration and Syncing Data Data collected on a mobile device can be transferred using a cloud service, i.e., a service made available to users
from an Internet connection that provides a shared data storage resource on demand. In order to use the app in
a multi-user environment, a cloud service can be used to aid in data collection. Depending on how the app is
used, you may need to configure cloud access to enable certain data access features. Settings can be changed at
any time.
1.5.1 Suggested Cloud Settings for Field Collection
If you are using the app for field data collection, the suggested cloud settings are to upload data to cloud only,
enable sync on save, and enable cloud data deletion. These settings are shown in Figure 2.
Figure 2. Suggested Cloud Settings for Field Data Collection
1.5.2 Suggested Cloud Settings for Lab Collection
If you are using the app for lab data collection the suggested cloud settings are to upload and download data to
cloud, enable sync on save, and disable cloud data deletion. These settings are shown in Figure 3.

11
Figure 3. Suggested Cloud Settings for Lab Data Collection
1.5.3 Suggested Cloud Settings for Syncing Data Only
If you are using a dedicated mobile device for syncing with a desktop version of Epi Info for data analysis the
suggested cloud settings are to download data from cloud only, disable sync on save, and disable cloud data
deletion. These settings are shown in Figure 4.
Figure 4. Suggested Cloud Settings for Syncing Only
1.5.4 A Note about “Suggestions”
We understand that circumstances will vary by region and type of organization utilizing the app. The settings
above have been piloted in several countries and have shown to be useful when field technicians share tablets
for collecting data and there is a single lab tablet for entering lab results. However, your circumstances (for
example, limited bandwidth or multiple labs, may call for a different combination of settings. Before establishing
a protocol for your group, we recommend piloting the app with a few devices and users to determine the best
settings for your circumstances.
1.5.5 Setting up a Cloud Service
One advantage of using a mobile device for data collection is the ability to synchronize wirelessly with a cloud
service, allowing a team to collect data together. Several options are available for a cloud service: Box, Secure
FTP, and Microsoft Azure. The use of a Secure Shell FTP server or a Microsoft Azure account requires IT staff
familiar with the respective technologies to configure the app, administer the cloud service, and maintain the

12
data. The rest of this section will describe a typical process of setting up a Box account. While not as feature
rich as the other options, a Box account is easier and quicker to setup and can allow for syncing of data between
field and lab versions of the app running on separate tablets.
From the App Settings Screen, Figure 1, click on Cloud Service in the “Cloud Synchronization” section and select
Box as shown in Figure 5.
Figure 5. Cloud Service
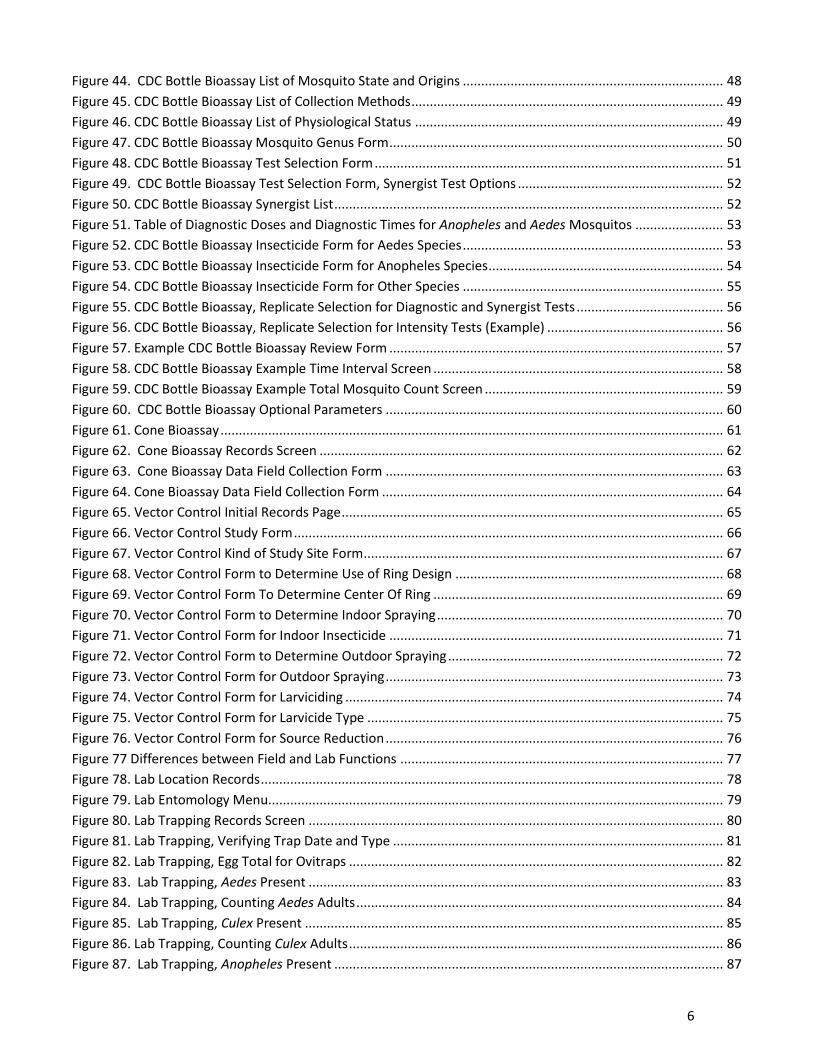
Use the back button on your android device to return to the main screen and choose “Sign in to Box account”
from the menu. You should see a screen prompting you for the email address and password of your Box
account, as shown in Figure 6. If you do not have a box account, visit http://www.box.com and choose an
appropriate plan (there is a free “individual” plan available as of the time of this document). After you have
entered an email address and username for an active Box account, click the “Authorize” button to continue.
Please be sure to “Grant access to Box” if you are prompted to do so.
13
Figure 6. Login Screen for Box Account
1.5.6 Syncing with the Cloud
From any of the Records screens (i.e., Locations, Figure 14; Trapping, Figure 22 and Figure 80; Collection, Figure
27 and Figure 91; Cone Bioassay, Figure 62 and Figure 104; and Adult Vector Control, Figure 65), you can click
the cloud icon(s) next to an individual record to sync individually, Figure 7. Alternatively, from the Home screen
of the app, choose “Sync with Cloud” from the menu (vertical ellipse) in the upper right of the screen to sync all
of the records, Figure 8.

14
Figure 7. Menu and Cloud Icon for Syncing Data
Figure 8. Menu Items from the Home screen
1.6 Geography As you may have gathered while installing it, the app allows users to capture GPS coordinates in the field. Along
with the coordinates, it will also capture the altitude and accuracy in meters and try to determine the name of
the geographic region the user is in, Figure 9. The latter is useful for categorical data analysis and meaningful
stratification of vector indices, Figure 10.

15
Figure 9. Capturing Region
Figure 10. Stratifying by Region during analysis
The Epi Info Vector Surveillance App captures the region information by referencing a KML or KMZ file located in
the device’s storage. The app installs with a default KML file of US States. If you are not seeing a valid region
name being captured, you can replace the default KML file with a KML or KMZ file of your own, Figure 12. Up to
date KMZ files for countries can be found here: http://gadm.org, Figure 11, and KML files of various breakdowns
of US States and territories can be found here: https://go.usa.gov/xnTdX.

16
Figure 11. Download a KML or KMZ file of your location
Figure 12. Delete the “default” KML and replace it with the one you downloaded
17
The default KML file is located in your device’s Download\EpiInfoEntomology folder. Please ensure that you
delete the default KML file as the app only supports one reference geography file at any given time, Figure 12.
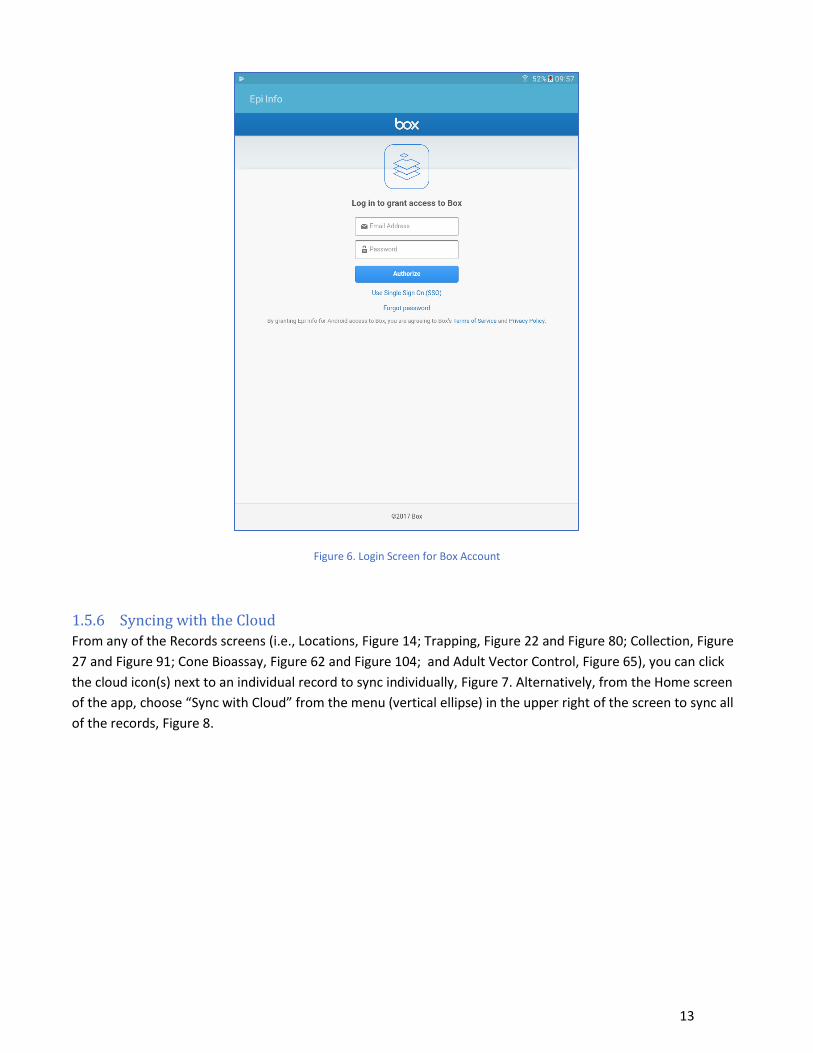
2 Overview The Epi Info Vector Surveillance App allows you to conduct entomological data collection on android phones or
tablets. The app allows data collection activities. e.g., trapping, collection, cone bioassays, and adult vector
control, to be related to individual locations. The data can be collected using a cloud service or, if cellular
service is unable, stored locally until service is available. Data can also be manually transferred to a PC using a
USB connection.
3 Collecting Field Data Samples collected during field activities are performed using the Field version of the app. All collection activities
begin from the main screen shown in Figure 13 by clicking on the “Collect Data” button at the bottom of the
screen.
Figure 13. Main Screen

18
3.1 Location A location is defined as a place of residence or other setting where human–vector contact can occur (e.g. house,
cemetery, place of worship, school, etc.). Once a location record is made, trapping, collection, and/or assay
activities can then be performed as described in subsequent sections of this manual. All locations should be
identified with a unique ID using a barcode or QR code. Barcodes should be affixed to the structure in such a
way as to prevent contact with rain or sunlight, and should be located in a location that is easy to scan when
returning to the location.
3.1.1 New or Existing Records
If this is the first time using the app you will see a screen with (0) records as shown in Figure 14. A new record is
added by clicking the “+” button in the lower left corner of the screen.
Figure 14. Default New Record Screen
Once a location has been added it will appear in the Locations record list, an example of which is shown in 5.
Records on this screen will list the following details:
Structure Barcode, the ID from a scanned barcode;

19
Latitude, from where the barcode was scanned, and
Inspection Date, the date the record was created.
Clicking an existing record from the list with a valid barcode value will take you directly to the Entomology Menu
(covered in Section 3.1.8). Associated with each record in the list is a cloud icon which if clicked will sync with a
cloud account if one has been setup for the device when cellular or Wi-Fi service is available.
Figure 15. Sample Location Data
3.1.2 Scan a Barcode
A barcode should be attached to each location, preferably in a place that is protected from rain and sunlight.
The latitude and longitude of your Location is automatically entered upon scanning the barcode. It is important
to not scan until you are physically at the location. Also keep in mind that the tablet may not be able to obtain
latitude and longitude information from inside certain structures. If you cannot obtain latitude and longitude
information, move to another position until the data can be collected.
20
To use the barcode scanning feature, you will need to have a barcode scanning app installed. There are several
freely available apps available in the Google Play Store. A barcode or a QR Code can be used, as long as the
barcode content consists of a unique number. A 3-5 digit alpha, numeric, or alpha-numeric value encoded in
plain format is suggested for the Structure ID.
3.1.2.1 Scanning a New Location
To associate a barcode with a new Location record, click the “SCAN BARCODE” button on the Structure Type
Screen, Figure 16. It is also possible to update an existing Location with a new barcode value using this method,
however the previous value will be permanently deleted and overwritten with the new barcode result. New
barcodes cannot be entered from the menu of the main Locations record screen – that feature is only used for
scanning existing locations as described next.
3.1.2.2 Scanning Existing Locations
Barcodes for existing Location records can be scanned by clicking the “Scan Barcode” button in the menu bar of
the Location Records screen, shown in Figure 15. Scanning a barcode that has not been attached to a Location
will result in a “No matching records found” message displayed on the screen of your device. Once a barcode is
associated with a Location, scanning it again will take you directly to the Entomology Menu for that Location
(see Section 3.1.8).
3.1.3 Structure Type
Indicate the structure type as either a house, cemetery, place of worship, school, or other. If selecting “other”,
you can specify it in more detail. Note: depending on the screen size of your mobile device it may be necessary
to manually scroll vertically to see the value entered when choosing “other”. See Figure 16 for an example of
the Structure Type entry screen when choosing “other” as the type. Again, keep in mind that you may need to
scroll down on your device to see all data entry fields.
If the selected structure type is a house, you will be taken to the Demographic, Family screen, discussed in
Section 3.1.5. For all other structure types you will be directed to the Demographic, Address page discussed in
Section 3.1.6.

21
Figure 16. Structure Barcode and Structure Type
3.1.4 GPS Details
The app will automatically capture the coordinates of the user’s location along with altitude and accuracy in
meters and the geographic region (see section 1.6). However, if due to various circumstances such as obstructed
view of the sky or weather, the coordinates may be blank or highly inaccurate. The “retry” button, Figure 17, is
available to try capturing the coordinates again. If you are satisfied with the information captured, simply
proceed to the next page.
22
Figure 17. Opportunity to retry capturing GPS information
3.1.5 Demographics, family
Family demographics data include the name of head of household, head of household’s phone number, the
number of people who normally sleep in the house and the number of people who slept in the house the
previous night. These items can be entered in this section as shown in Figure 18. This page is only available for
entry when the structure type is a house.

23
Figure 18. Demographics, Family for a House
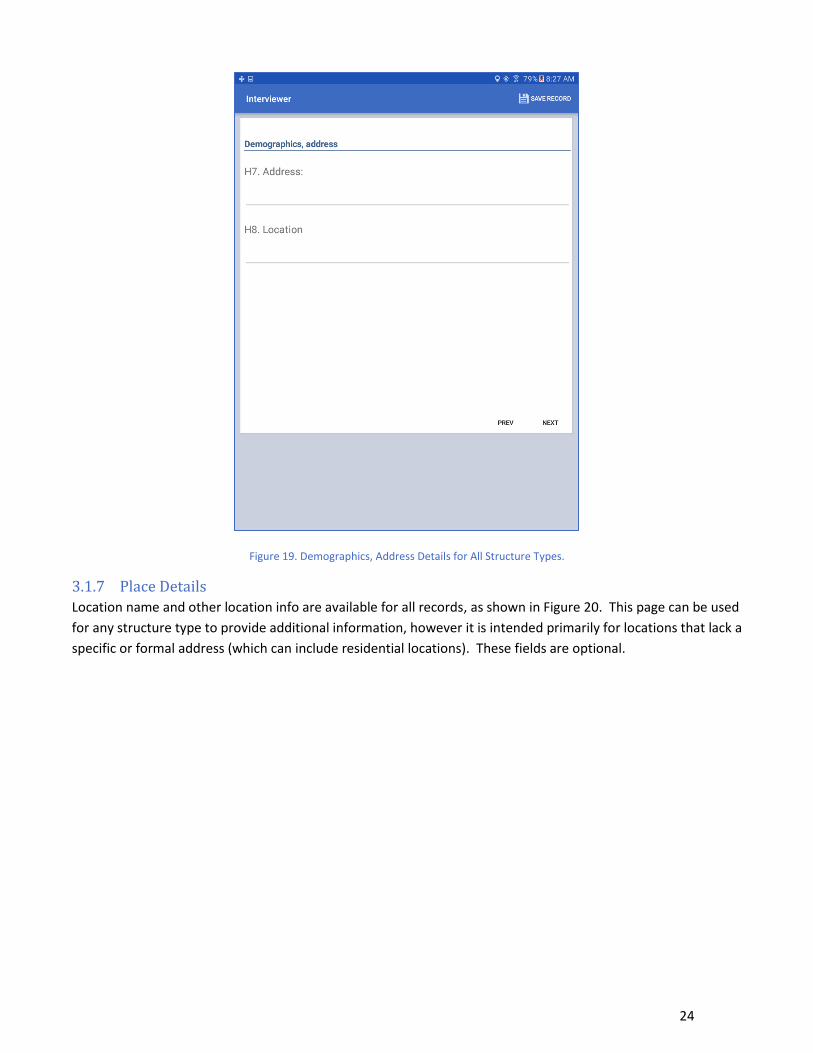
3.1.6 Demographics, address
Address and location fields are available for all structure types, as shown in Figure 19. The address should be
the proper address (e.g., the mailing address), and the location field can be used to provide additional details.
Keep in mind latitude and longitude values for the Location are not derived from values entered on this page,
the geolocation information is associated with the Location upon scanning the barcode as explained in Section
3.1.2.
24
Figure 19. Demographics, Address Details for All Structure Types.
3.1.7 Place Details
Location name and other location info are available for all records, as shown in Figure 20. This page can be used
for any structure type to provide additional information, however it is intended primarily for locations that lack a
specific or formal address (which can include residential locations). These fields are optional.

25
Figure 20. Place details for All Structure Types
3.1.8 Entomology Menu (Field)
The entomology menu, as shown in Figure 21, is the primary access point for creating new records associated
with the current location for the following activities:
Trapping
Collection
Bottle Bioassay
Cone Bioassay
Adult Vector Control
Each of these activities are discussed in more detail in their respective sections that follow. For existing
locations, the Entomology menu will be displayed when scanning the barcode as described in Section 3.1.1.

26
Figure 21. Entomology Menu
3.2 Trapping (Field) Multiple field trapping events can be associated with a location. A variety of traps can be used for surveillance
efforts; for further information on which trap(s) to use please consult the references provided in Section 10.
3.2.1 New or Existing Traps
Similar to the Locations list, a blank list will appear until the first trapping record is entered, as shown in Figure
22. A new trapping event is entered by clicking on the large circular “+” button in the lower right corner of the
page.
It is during the activity of setting a trap that a new record is created, which is then available later when retrieving
the trap. A Trapping record will have different data screens that appear depending on whether the trap is being
set for the first time (i.e., when the record is created created) or when a trap is retrieved.

27
Figure 22. Trapping Records Screen
3.2.2 Trap Type
Upon setting a new trap, the app allows for recording five different types of traps as shown in Figure 23:
Ovitrap
Gravid
GAT
BG
Light
Other than Ovitraps, which are for egg collection, all other traps refer to adult specimens. For more information
on the individual traps and when to use them, please refer to the References in Section 10 of this document.
In addition to the trap type, the location of the trap should be indicated as either inside or outside the structure.

28
Figure 23. Trap Type and Location
After saving the trapping record, the user is returned to the trapping records list and a new entry is now present,
indicating the set date, set time, and trap type. An example of a trapping record is shown in Figure 24. At this
point you can return to this trapping record to enter retrieval information, or click on the “+” button to create a
new trapping event.

29
Figure 24. Example Trapping Record Screen
3.2.3 Trap Retrieval
The trap retrieval page, Figure 25, is shown when clicking on an entry in the Trapping records list. The barcode
associated with this event should be displayed on this page (in Figure 25 the example value is “3PE9”). You will
need to record this value, along with the date, for retrieving a trap.
Click the checkbox labeled “Trap Retrieved” to document the retrieval activity. You should see a dialog box
reminding you to write the barcode number and the date on your sample. Next, indicate any issue with the
trap. Typically you will enter “none”, however If something happened that prevented the successful retrieval of
the trap it can be documented here. Common issues with a trap that may prevent retrieval include the trap
being stolen, removed, damaged, or not working. You can also specify “other” issues with a trap, as shown in
the example in Figure 25. Lastly, indicate whether the retrieved trap was positive or negative for presence of

30
mosquitoes. When finished, please save your record by clicking the “Save Record” menu item on the next page
in the app, shown in Figure 26.
Figure 25. Trap Retrieval

31
Figure 26. Save Record
3.3 Collection (Field) The field collection module is used for adult mosquitoes and larvae/pupae. The larvae/pupae section of the
module can also be used to record larval vector control when applicable (for Adult Vector Control, please see
Section 3.6).
When accessed for the first time for a given location, no records will appear in the Collection Record List, as
shown in Figure 27. Create a new collection record by clicking the large “+” icon in the lower right corner of the
page.
Once Collection records have been entered they will appear in this list with the following details (see example in
Figure 28):
Collection Type, either Adult or Larvae/Pupae;
Collection Date, the date the record was created; and
Container State, either Positive, Negative, or Unknown.

32
The meaning and significance of these values will be further explained in this section.
Figure 27. Field Collection Record Screen, No Records.

33
Figure 28. Field Collection Records Screen, With Example Records
3.3.1 New Collection Activity
Select whether you are collecting adults or larvae/pupae, as shown in Figure 29. The selection will determine
which set of entry forms will appear next. If you are collecting both adults and larvae/pupae, you must create a
new collection record for each type. When collecting larvae/pupae, a new, separate collection record will be
created for each container that is positive.

34
Figure 29. Field Collection Life Stage
3.3.2 Adult
Field collection data for adult specimens, collected with an aspirator, include the start and stop times as shown
in Figure 30, as well as whether or not any mosquitos were caught. You will be prompted to save your data on
the subsequent page by clicking the “save record” button in the menu (this is the same screen shown in Figure
26) and return to the Collection Records screen where you can enter additional records, or exit the app.

35
Figure 30. Aspirator
3.3.3 Larvae/Pupae
When collecting larvae and pupae samples, a dialog window will appear to remind you to record all containers
that have water in them, even if they are covered, and exclude all containers that do not contain water inside,
shown in Figure 31.
When determining container status, Figure 32, indication of positive, negative and unknown larvae/pupae
container status will be handled differently and result in a different set of questions presented. Negative
containers will not require a count of larvae/pupae, or further intervention, therefore it is only necessary to
count all negative containers and the total number of each type. You will only need to create a single collection
record that will consist of a count of all negative container types. For positive containers, create a new,
separate collection record for each container that is positive. If you encounter a mix of positive and negative
containers, you should have separate records for each positive container and one record for all negative
containers.
It may not be possible to determine whether or not a container is positive or negative, in which case you can
select “unknown” for the status. Create a new, separate collection record for each container that is unknown.
All three scenarios for larvae/pupae status, i.e., positive, negative, and unknown, are addressed in further detail
below.

36
Figure 31. Larvae/Pupae Field Collection

37
Figure 32. Larvae/Pupae Container Status
3.3.3.1 When Larvae or Pupae are Present
When positive identification of samples is made, estimate numbers of both pupae and larvae as a range using
the following extents:
0
1-10
10-50
>50+
Record separate values for both larvae and pupae, see Figure 33.

38
Figure 33. Positive Identification of Larvae/Pupae
Additionally, indicate any intervention performed from the following three options:
no intervention,
physical intervention,
or larvicide.
An accurate response is necessary to determine which set of questions need to be answered next. If “No
Intervention” was indicated, the user is prompted to specify the reason, see Figure 34. You can then enter any
additional remarks, Figure 39.

39
Figure 34. Reason for Not Applying Larvicide
When larvicide is selected as the intervention type, select form the following:
Abate,
Altosid,
Bti (Bacillus thuringiensis israelensis),
other
Figure 35 shows an example of the prompt that will appear when selecting “other” for indicating a larvicide that
is not listed.

40
Figure 35. Specify Larvicide Used.
After selecting a larvicide, enter the formulation and amount added to the container. See the fields in Figure 36.

41
Figure 36. Field Collection Larvicide Formulation and Amount
For example, if half a briquette of Bti was used to treat a container, enter 0.5 as the number of units for
Briquettes, and either leave the number of units for Granules and Liquid blank or enter 0.
Physical intervention implies emptying, moving, or covering the container of water with larvae/pupae.
Select the type of container from the list shown in Figure 37, which consists of the following:
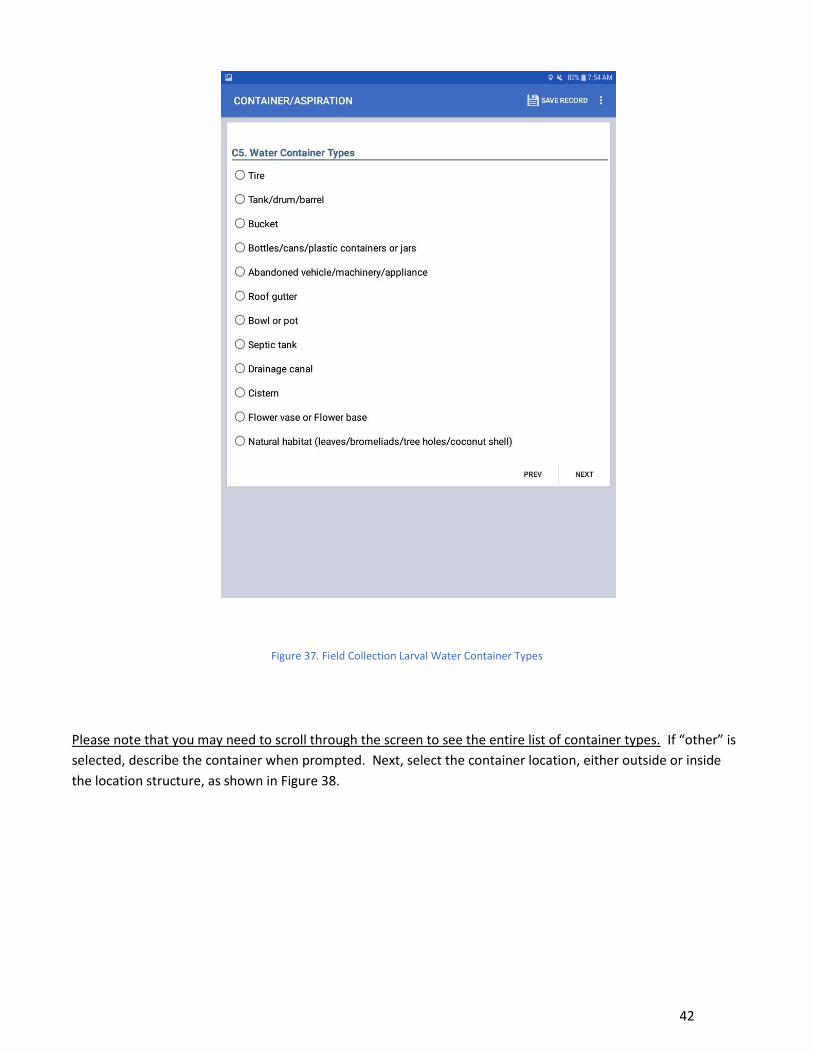
42
Figure 37. Field Collection Larval Water Container Types
Please note that you may need to scroll through the screen to see the entire list of container types. If “other” is
selected, describe the container when prompted. Next, select the container location, either outside or inside
the location structure, as shown in Figure 38.

43
Figure 38. Field Collection Container Details
The final entry screen provides an opportunity to record any additional remarks as shown in Figure 39.

44
Figure 39. Field Collection Survey Results
When finished, save and return to the main collection screen, Figure 27. You can now enter more records if you
observe more than one positive container. Remember, you should have a separate record for each container
that is positive or unknown for larvae/pupae.
3.3.3.2 When Larvae or Pupae are Not Present
When you have containers with water that have no larvae/pupae present, count all of the negative containers
and enter the total amounts as shown in Figure 40. You may have to scroll to see all the container types.

45
Figure 40. Count of negative containers when larvae/pupae are not present
You can also enter additional remarks if needed; the screen is the same as Figure 39. When finished, save and
return to the main collection screen, Figure 28. You can enter additional records if you have positive or
unknown containers, but you should only have one record for all negative containers.

46
3.3.3.3 When Larvae or Pupae Presence is Unknown
There may be situations in which a container’s status cannot be determined (e.g., the container is out of reach,
there is a barrier between you and the container, etc.). If you cannot tell if a container is negative or positive,
create a new record and select “Unknown”. Then indicate if the container is accessible, and the type of
intervention performed, as shown in Figure 41. If the container is accessible, state why the presence of larvae is
unknown, as shown in Figure 41.
Indicate any intervention performed, type of water container, container location, and any remarks as described
in Section 3.3.3.1.
Save the record and return to the main collection screen, Figure 28. You can enter another record if you have
additional containers that are unknown for larvae/pupae presence. Similar to positive containers, you should
have a separate record for each container that is unknown.
Figure 41. Unknown status of container.

47
3.4 CDC Bottle Bioassay (Field) The CDC bottle bioassay modules allow for collection of time mortality data with diagnostic, synergist, and
intensity testing of insecticides, according to the standards methods outlined here. It is possible to record data
for three types of bioassays: diagnostic, synergistic, or intensity. The module can be used for any insect species,
but is optimized for Aedes and Anopheles diagnostic testing.
Note: When clicking on an existing record you may receive a popup window indicating the time at which the
bioassay test was done.
Figure 42. CDC Bottle Bioassay Records Example
3.4.1 Mosquito Population Parameters
The first screen of the CDC Bottle Bioassay module is for recording information related to the mosquito
population being tested, as shown in Figure 43.

48
Figure 43. CDC Bottle Bioassay Mosquito Population Form
The stage and origin of mosquitoes are selected from the options shown in Figure 44.
Figure 44. CDC Bottle Bioassay List of Mosquito State and Origins
If the first option, Adults, wild collected, is selected, enter a collection method, as shown in Figure 45.

49
Figure 45. CDC Bottle Bioassay List of Collection Methods
If choosing Other for a collection method, specify the collection method used. Next, the physiological status of
the mosquitoes is selected from the following options in Figure 46.
Figure 46. CDC Bottle Bioassay List of Physiological Status
Finally, the minimum and maximum age of the mosquitoes can also be entered as integer values on the form.
3.4.2 Mosquito Genus
The mosquito genus used in the CDC Bottle Bioassay module can be either
Aedes,
Anopheles,
Culex, or
Other
If “Other” is selected, specify the genus when prompted, as in Figure 47. It is possible to specify a different
species for the control used in the CDC Bottle Bioassay. The default is to use the same genus as the test genus,
in which case no change is needed. A notes field is also provided on the screen to enter additional information,
such as the species used.

50
Figure 47. CDC Bottle Bioassay Mosquito Genus Form
3.4.3 Assay Test Type
Select the assay type, as shown in Figure 48. Three types of bioassays can be recorded: diagnostic, synergistic,
or intensity.

51
Figure 48. CDC Bottle Bioassay Test Selection Form
When selecting a diagnostic test, the insecticide used will be based upon pre-defined diagnostic doses for the
genus selected, discussed in Section 3.4.4. When selecting a synergist test, the synergist name and
concentration are entered in the form, Figure 49. Available synergists are listed in Figure 50.
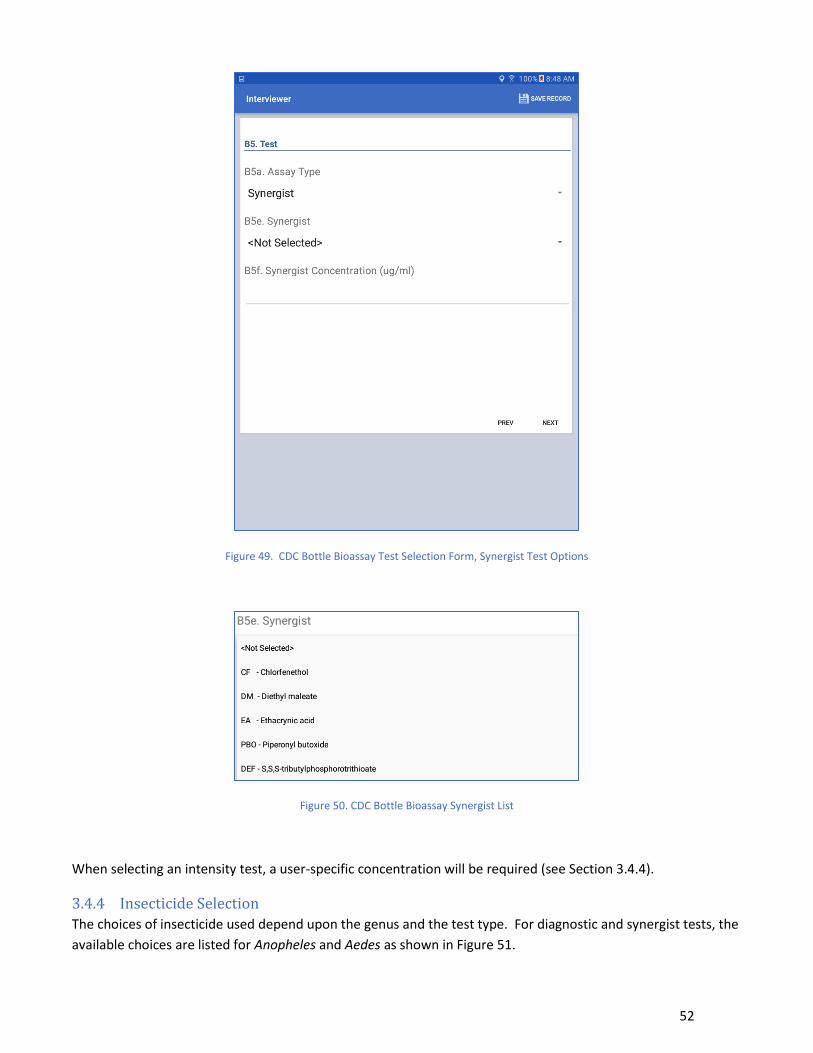
52
Figure 49. CDC Bottle Bioassay Test Selection Form, Synergist Test Options
Figure 50. CDC Bottle Bioassay Synergist List
When selecting an intensity test, a user-specific concentration will be required (see Section 3.4.4).
3.4.4 Insecticide Selection
The choices of insecticide used depend upon the genus and the test type. For diagnostic and synergist tests, the
available choices are listed for Anopheles and Aedes as shown in Figure 51.

53
Insecticide Anopheles Diagnostic Dose
Aedes Diagnostic Dose
Diagnostic Time
Bendiocarb 12.5 12.5 30
Cyfluthrin 12.5 10 30
Cypermethrin 12.5 10 30
DDT 100 75 45
Deltamethrin 12.5 10 30
Fenitrothion 50 50 30
Lambda-cyhaolthrin 12.5 10 30
Malathion 50 50 30
Permethrin 21.5 15 30
Primiphos-methyl 20 -- 30 Figure 51. Table of Diagnostic Doses and Diagnostic Times for Anopheles and Aedes Mosquitos
These options are presented as a drop-down selection for Aedes as shown in Figure 52, and Anopheles as shown
in Figure 53.
Figure 52. CDC Bottle Bioassay Insecticide Form for Aedes Species

54
Figure 53. CDC Bottle Bioassay Insecticide Form for Anopheles Species
For Culex and Others where diagnostic doses are not available, select both the insecticide and concentration for
the test as shown in Figure 54.
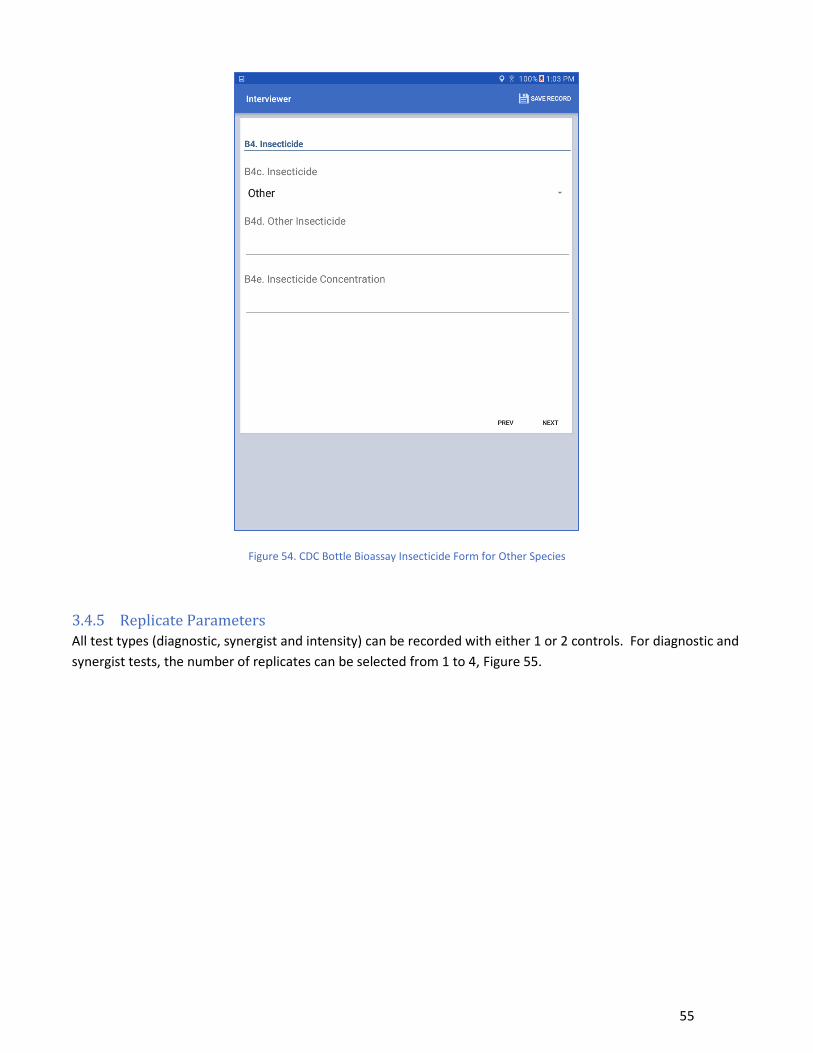
55
Figure 54. CDC Bottle Bioassay Insecticide Form for Other Species
3.4.5 Replicate Parameters
All test types (diagnostic, synergist and intensity) can be recorded with either 1 or 2 controls. For diagnostic and
synergist tests, the number of replicates can be selected from 1 to 4, Figure 55.

56
Figure 55. CDC Bottle Bioassay, Replicate Selection for Diagnostic and Synergist Tests
When performing an Intensity test, data is entered similar to a diagnostic test, however diagnostic doses do not
apply; i.e., a concentration value is entered manually. Any number of concentrations can be recorded as each
concentration, or intensity, is entered as a separate record in the module.
Figure 56. CDC Bottle Bioassay, Replicate Selection for Intensity Tests (Example)
3.4.6 Review
Prior to entering time mortality data, a review screen is available to display the values selected for the test; an
example is shown in Figure 57. It may be necessary to scroll down the screen to view all values.

57
Figure 57. Example CDC Bottle Bioassay Review Form
3.4.7 Time Interval Testing
After reviewing the values selected, a series of data entry screens, one for each time interval from 0 minutes
through 120 minutes, are available for entry of time mortality data. Note that is may be necessary to scroll the
screen to view all data fields. For each control and replicate, the option is provided to record both alive and
dead mosquito counts. It is not necessary to provide a value for both fields. Only one is needed, usually
whichever is easier to count based upon the status of a particular bottle. However, the number of dead
mosquitoes is recommended. Each control and replicate is highlighted to facilitate data entry.
At the bottom of each time interval screen is an option to indicate termination of the test. If this option is
selected, further time interval screens will not appear and you will go directly to a summary screen.

58
Figure 58. CDC Bottle Bioassay Example Time Interval Screen
3.4.8 Total Mosquito Counts
After selecting to terminate a test or 120 minutes, whichever is earlier, enter total mosquitos in each bottle on
the summary screen, Figure 59. To assist in counting final totals and error checking, the total (dead + alive)
number of mosquitoes recorded at each time interval is highlighted for each control and replicate on this screen.

59
Figure 59. CDC Bottle Bioassay Example Total Mosquito Count Screen
3.4.9 Optional Parameters
The final screen for the CDC Bottle Bioassay provides fields for entering the assay date, the Investigator name or
initials, an optional assay ID, and the ambient temperature, as shown in Figure 60. All fields are optional and not
required for determining the outcome of the test. The assay date defaults to the current date and may be
changed as necessary. An assay ID can be used to associate multiple tests with each assay, as in the case of an
intensity test run at multiple concentrations.
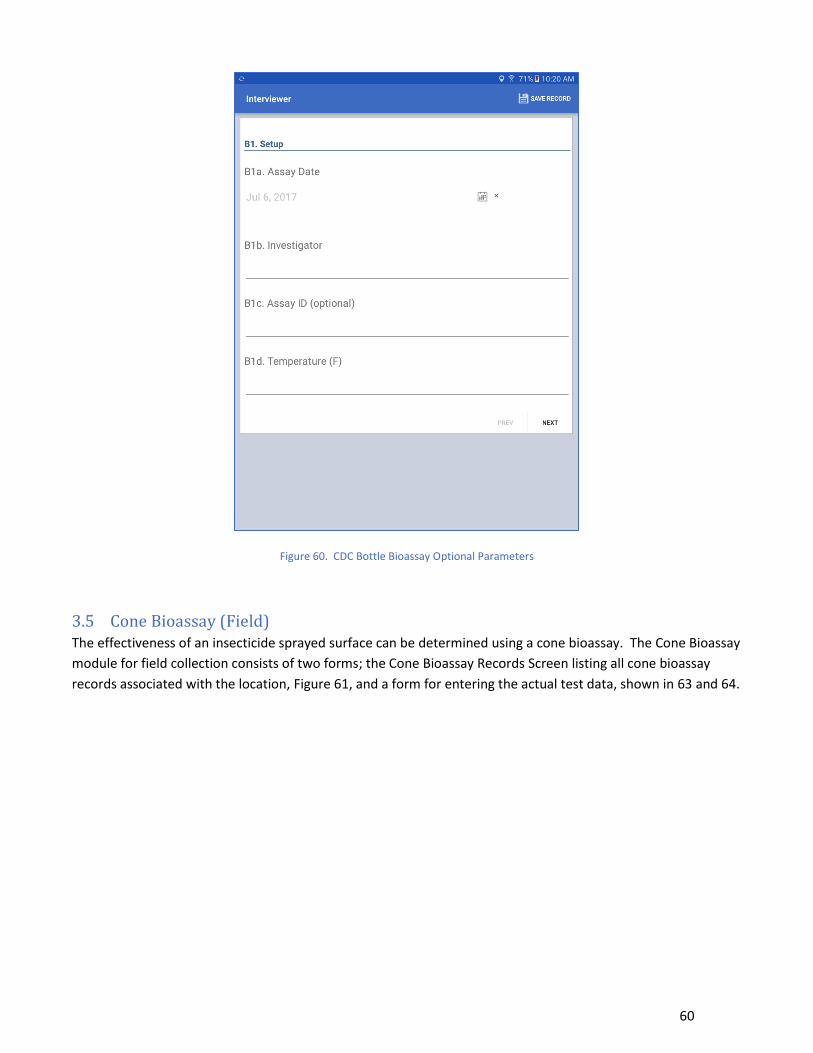
60
Figure 60. CDC Bottle Bioassay Optional Parameters
3.5 Cone Bioassay (Field) The effectiveness of an insecticide sprayed surface can be determined using a cone bioassay. The Cone Bioassay
module for field collection consists of two forms; the Cone Bioassay Records Screen listing all cone bioassay
records associated with the location, Figure 61, and a form for entering the actual test data, shown in 63 and 64.

61
Figure 61. Cone Bioassay
Create a new cone bioassay record by clicking the large “+” icon in the lower right corner of the page.
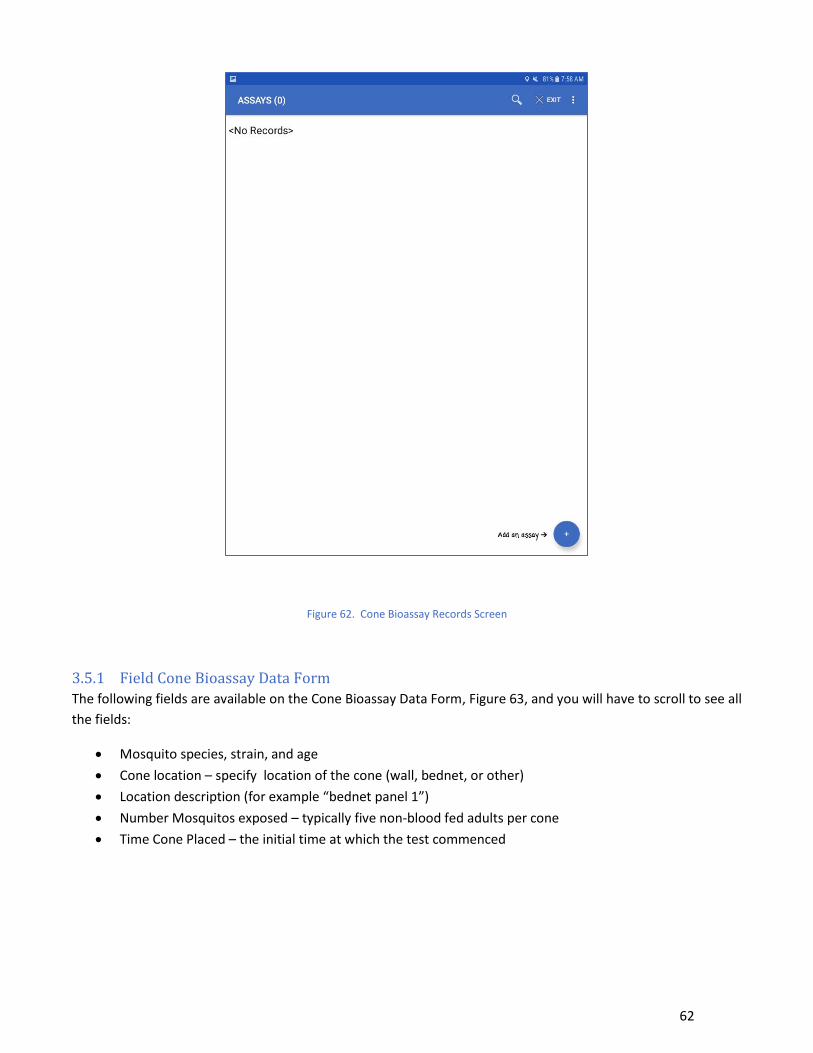
62
Figure 62. Cone Bioassay Records Screen
3.5.1 Field Cone Bioassay Data Form
The following fields are available on the Cone Bioassay Data Form, Figure 63, and you will have to scroll to see all
the fields:
Mosquito species, strain, and age
Cone location – specify location of the cone (wall, bednet, or other)
Location description (for example “bednet panel 1”)
Number Mosquitos exposed – typically five non-blood fed adults per cone
Time Cone Placed – the initial time at which the test commenced

63
Figure 63. Cone Bioassay Data Field Collection Form
Complete all the entry of the fields in Figure 63 and then press the clock on “time cone placed” as soon as you
begin the assay, then press “next” to proceed to the second page of the assay entry, shown in Figure 64. The
fields in Figure 64 are:
Time Cone Picked – time after the Time Cone Placed
KD60 minutes – number of mosquitoes knocked down after 30 minutes
KD60 min Percent – A calculated field (read-only) represented as
𝐾𝐷60% =𝐾𝐷30𝑚𝑖𝑛𝑢𝑡𝑒𝑠
𝑁𝑥 100
Where N is the Number of mosquitoes exposed
Calculate button – press to calculate and display the KD 60 min Percent value

64
You will have to set your own timer for one hour, but as soon as the one hour is up, touch the clock for “time
cone picked” in Figure 64 to record the time that you ended the assay. Then enter the number of mosquitoes
knocked down after 60 minutes and press the calculate button. This will cause the KD60 percent to be
automatically calculated.
Figure 64. Cone Bioassay Data Field Collection Form
Save the record and return to the Cone Bioassay Records Screen. You can now enter another cone bioassay
record or exit the app.
3.6 Adult Vector Control Vector Control activities can be entered in the field version of the app via the “Adult Vector Control” button
from the Entomology Menu (see Section 3.1.8). When opened for the first time for a new location, no records
will appear in the Vector Control List, as shown in Figure 65.

65
Figure 65. Vector Control Initial Records Page
First, indicate if this is a study, as shown in Figure 66.

66
Figure 66. Vector Control Study Form
If “yes”, indicate the type of study, either case or control, shown in Figure 67.

67
Figure 67. Vector Control Kind of Study Site Form
Next (or if the answer to the previous question was “no”), you will be asked if you are using the ring design, as
shown in Figure 68. For more information on using the ring design, see Karl S, Halder N, Kelso JK, Ritchie SA,
Milne GJ., in the References section.
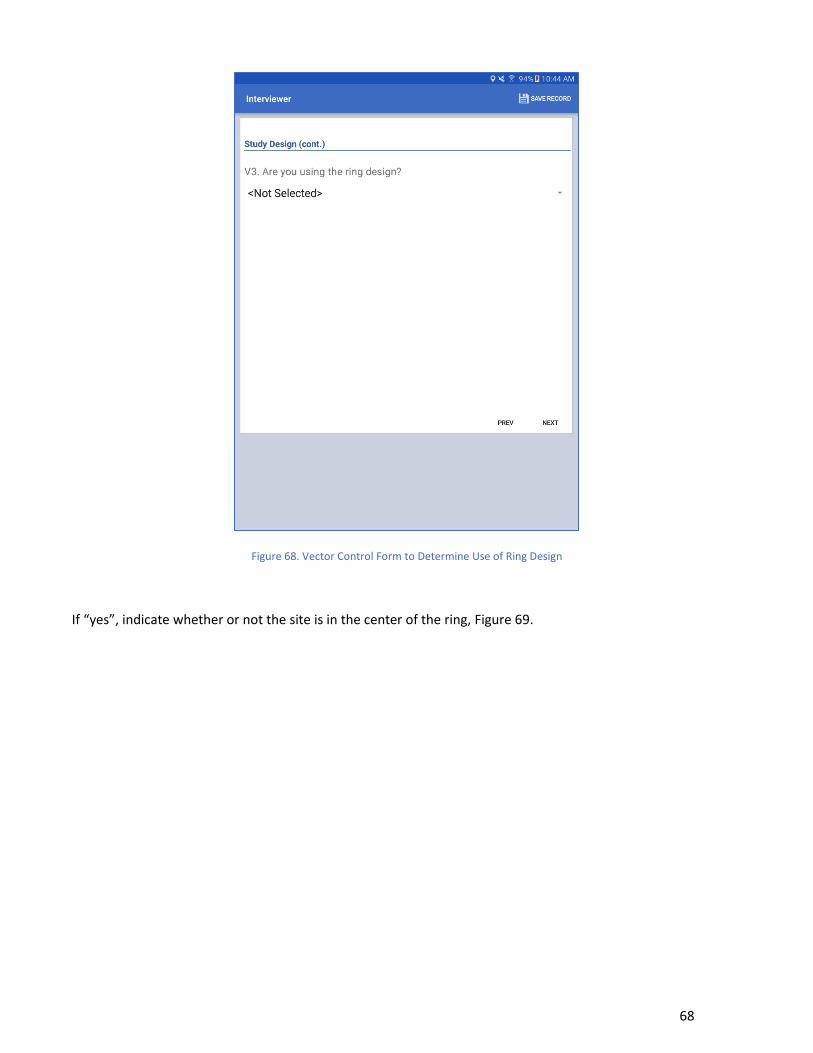
68
Figure 68. Vector Control Form to Determine Use of Ring Design
If “yes”, indicate whether or not the site is in the center of the ring, Figure 69.

69
Figure 69. Vector Control Form To Determine Center Of Ring
3.6.1 Indoor Spraying
For all Adult Vector Control records, either a study design or ring design, indicate if the site is receiving indoor
spraying, Figure 70. If not, go to Outdoor Spraying, Section 3.6.2.

70
Figure 70. Vector Control Form to Determine Indoor Spraying
When Indoor Spraying occurs, indicate the type of indoor insecticide used. If your insecticide is not listed in the
drop-down box. If the insecticide is not listed, select “Other” and specify the insecticide as shown in Figure 71.
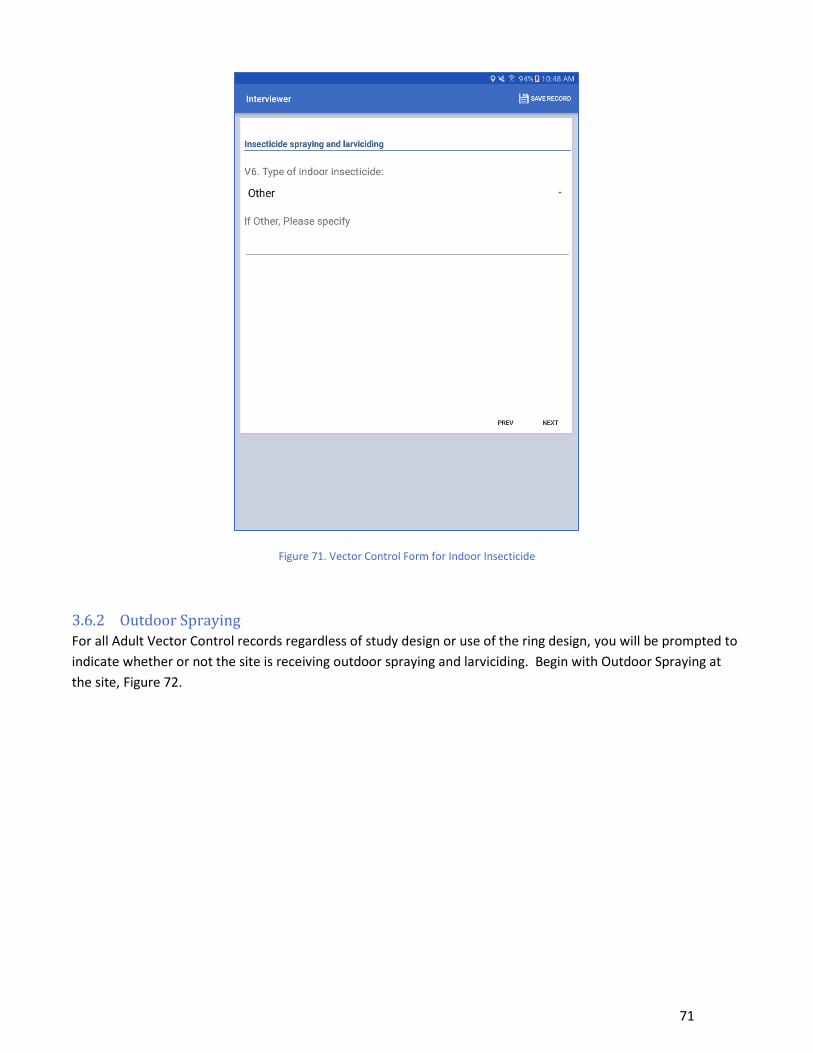
71
Figure 71. Vector Control Form for Indoor Insecticide
3.6.2 Outdoor Spraying
For all Adult Vector Control records regardless of study design or use of the ring design, you will be prompted to
indicate whether or not the site is receiving outdoor spraying and larviciding. Begin with Outdoor Spraying at
the site, Figure 72.

72
Figure 72. Vector Control Form to Determine Outdoor Spraying
If yes, next indicate the type of outdoor insecticide used, Figure 73. If the insecticide is not listed, select “Other”
and specify the insecticide.

73
Figure 73. Vector Control Form for Outdoor Spraying
Next indicate whether or not larviciding is used at the site, Figure 74.

74
Figure 74. Vector Control Form for Larviciding
If yes, indicate the type of larvicide used, Figure 75. If a larvicide is not listed, select “Other” and specify the
larvicide.

75
Figure 75. Vector Control Form for Larvicide Type
3.6.3 Source Reduction
For all Adult Vector Control records indicate whether or not source reduction is being done at the site, Figure 76.

76
Figure 76. Vector Control Form for Source Reduction
After entering a response, save the record to return to the Vector Control Records screen. You can then enter
additional records or exit.
4 Collecting Lab Data Samples collected during field activities are available for lab analysis using the Lab mode of the app (see Section
1.4). While similar to the Field mode, key differences of the Lab mode are:
No barcode scanning capability
Search capability (to navigate to a specific record ID)
Location records are read only, new locations records cannot be created
Bidirectional (upload and download) data transfer when syncing records to the cloud (the suggested
transfer mode for the field version of the app is upload only)
Different activities performed by the lab and field modes of the app are shown in Figure 77.

77
Activity FIELD LAB
Locations Create new locations Read only
Trapping Setting and Retrieving Traps Counting eggs and adults and differentiating species
Collection Adult and Larvae/Pupae Collection Counting larvae/pupae and adults and differentiating species
Bottle Bioassay Calculate percent resistant to certain insecticides
--
Cone Bioassay Calculate percent knockdown at 60 minutes
Calculate mortality after 24 hours
Adult Vector Control Record vector control studies -- Figure 77 Differences between Field and Lab Functions
4.1 Retrieving Records for Lab Activities Similar to the field mode, records are listed on the locations screen that appears after clicking on the “Collect
Data” button on the main screen (see Error! Reference source not found.). Note that in order for records to a
ppear in this list, they must first be successfully entered in field mode or downloaded from the cloud. In case of
the latter, the data would have been uploaded to the cloud previously from a device that was in field mode.
From the Locations screen shown in Figure 78, records can be selected by either clicking directly on an item in
the list, or by clicking on the magnifying class icon in the app menu and manually entering a value to search for a
specific location ID.

78
Figure 78. Lab Location Records
When a record is selected from the list, you will see the lab version of the entomology menu as shown in Figure
79. You will not see any field records associated with field trapping, collection, or cone bioassays entries for this
location; the lab version of the app is only for entering records for trapping, collection, and cone bioassays
performed in the lab.

79
Figure 79. Lab Entomology Menu
4.2 Trapping (Lab) The lab trapping module is used to record mosquito counts for traps returned to the lab that were set in the
field. From the lab entomology menu, select “Trapping” to reach the Lab Trapping Records screen as shown in
Figure 80. A new record can be added by clicking the “+” button in the lower left corner of the screen.

80
Figure 80. Lab Trapping Records Screen
You can have many traps of the same type or different types from one location, but remember each trap
requires a new record in the app. Enter the set date for the trap and the trap type you are evaluating as shown
in Figure 81.

81
Figure 81. Lab Trapping, Verifying Trap Date and Type
4.2.1 Ovitraps
For ovitraps, the only information requested is the egg total as shown in Figure 82.

82
Figure 82. Lab Trapping, Egg Total for Ovitraps
Save the record to return to the Lab Trapping Records screen. You can enter more trapping records for the
location or exit from the app.
4.2.2 All Adult Traps
All adult traps (Gravid, BG, GAT, and light traps) collect similar information, starting with whether or not Aedes
species are present, as shown in Figure 83.

83
Figure 83. Lab Trapping, Aedes Present
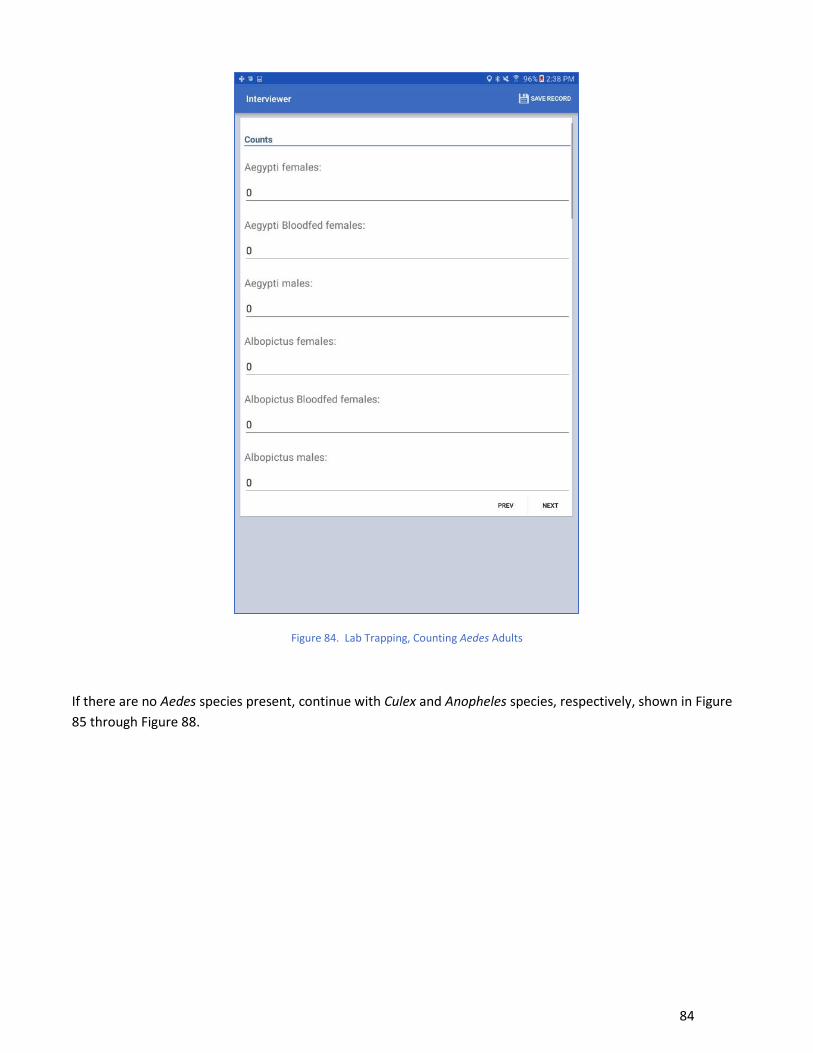
If yes, enter separate values for:
Aedes aegypti females, blood fed females, and males
Aedes albopictus females, blood fed females, and males
These fields are shown in Figure 84. You will have to scroll to see all the fields.
84
Figure 84. Lab Trapping, Counting Aedes Adults
If there are no Aedes species present, continue with Culex and Anopheles species, respectively, shown in Figure
85 through Figure 88.

85
Figure 85. Lab Trapping, Culex Present

86
Figure 86. Lab Trapping, Counting Culex Adults

87
Figure 87. Lab Trapping, Anopheles Present
88
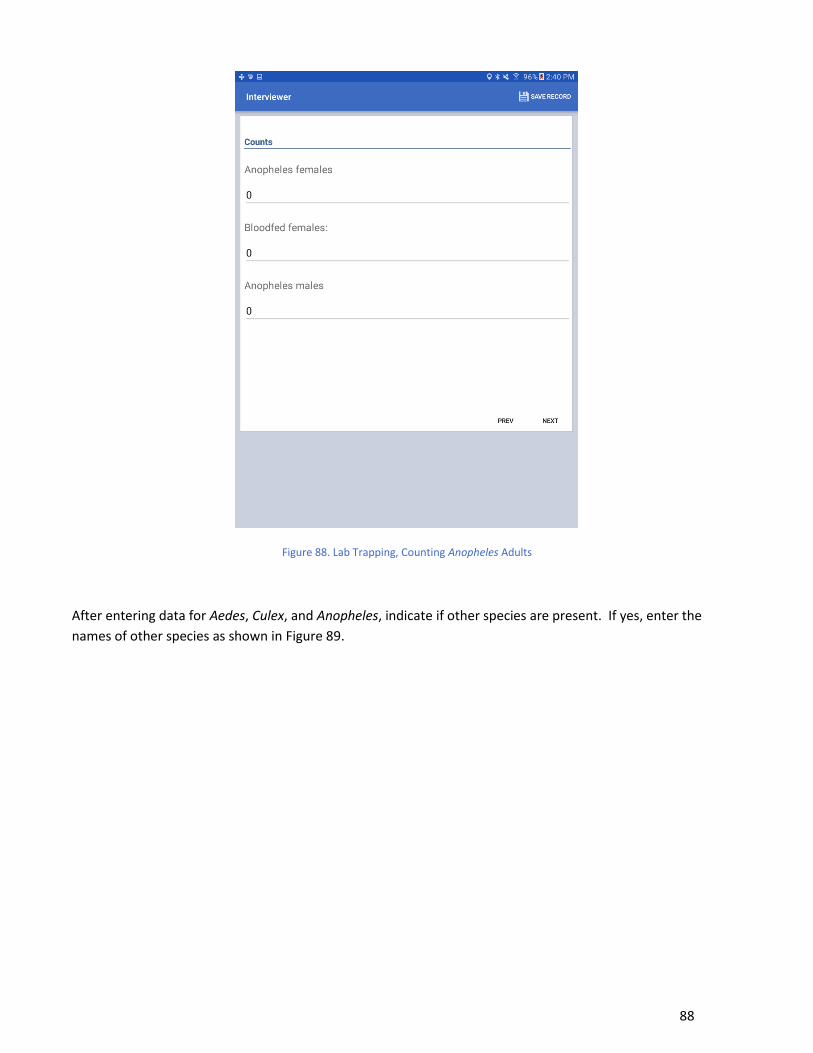
Figure 88. Lab Trapping, Counting Anopheles Adults
After entering data for Aedes, Culex, and Anopheles, indicate if other species are present. If yes, enter the
names of other species as shown in Figure 89.

89
Figure 89. Lab Trapping, Other Species Present
The final screen during Lab Trapping will display a summary of the information you entered for the adult trap, as
shown in Figure 90. You will have to scroll to see all the results.

90
Figure 90. Lab Trapping Total Mosquitoes Summary

91
If needed, return to a previous screen to correct an entry or entries. If the information is correct, save the
record to return to the Lab Trapping Records screen where you can enter additional trapping records or exit.
4.3 Collection (Lab) The lab collection module is used to record mosquito counts from samples collected in the field. From the
entomology menu, select “Collection” to reach the Lab Collection Records screen, Figure 91. A new record can
be added by clicking the “+” button in the lower left corner of the screen.
Figure 91. Lab Collection Records Screen
A new lab collection record should be created for each sample returned from the field. First, indicate whether
the sample collected is adults or larvae/pupae as shown in Figure 92.

92
Figure 92. Lab Collection, Life Stage Selection
4.3.1 Adult
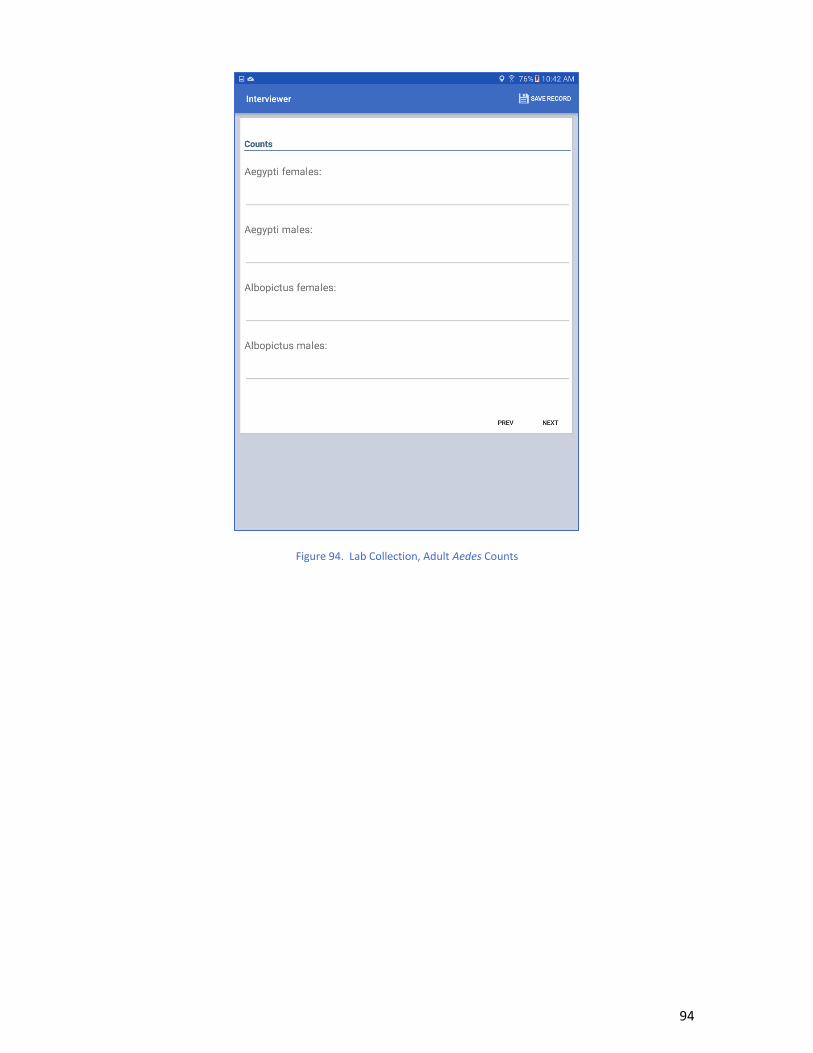
Recording of adult mosquitoes is similar to recording adult mosquitoes from trapping activities described in
Section 4.2.2. Start with whether or not Aedes species are present, Figure 93. If the answer is yes, enter
separate values for the following:
Aedes aegypti females, blood fed females, and males
Aedes albopictus females, blood fed females, and males
These fields are shown in Figure 94. If there are no Aedes species present, you will be prompted for Culex and
Anopheles presence, respectively, as shown in Figure 95 through Figure 98.

93
Figure 93. Lab Collection, Aedes Present
94
Figure 94. Lab Collection, Adult Aedes Counts

95
Figure 95. Lab Collection, Culex Present

96
Figure 96. Lab Collection, Adult Culex Counts
97
Figure 97. Lab Collection, Anopheles Present

98
Figure 98. Lab Collection, Adult Anopheles Counts
After entering data for Aedes, Culex, and Anopheles, indicate whether or not any other species are present. If
the answer is yes, enter the names of other species, Figure 99. Save the record to return to the Lab Collections
Records screen where you can enter additional collection records or exit.

99
Figure 99. Lab Collection, Other Species Present
4.3.2 Larvae/Pupae
Larvae/Pupae Lab Collection starts with indicating whether or not larvae are present, Figure 100. If the answer is
yes, enter separate values for the number of Aedes, Anopheles, and Culex larvae, Figure 101.

100
Figure 100. Lab Collection, Larvae Present

101
Figure 101. Lab Collection, Larvae Species Counts
Next, indicate whether or not pupae are present, Figure 102. If the answer is yes, enter separate values for the
number of
Aedes aegypti females emerged,
Aedes aegypti males emerged,
Aedes albopictus females emerged,
Aedes albopictus males emerged,
Culex females emerged,
Culex males emerged,
Anopheles females emerged,
and Anopheles males emerged.
These fields are shown in Figure 103. You may need to scroll down the screen in order to view and enter all
fields on this form. Save the record to return to the Lab Collection Records screen and either enter additional
collection records for the location or exit from the app.

102
Figure 102. Lab Collection, Pupae Present

103
Figure 103. Lab Collection, Emerged Pupae Counts
4.4 Cone Bioassay (Lab Only) The lab cone bioassay module is similar to the field cone bioassay, the difference being the endpoint for
determination efficacy of the insecticide. For the lab cone bioassay, the assay endpoint is mortality after 24
hours, whereas the field cone bioassay uses percent knockdown at 60 minutes (KD60). From the entomology
menu, select “Cone Bioassay” to reach the Lab Collection Records screen, Figure 9183. A new record can be
added by clicking the “+” button in the lower left corner of the screen.

104
Figure 104. Initial Lab Cone Bioassay Records Screen
4.4.1 Lab Cone Bioassay Data Form
The following fields are available on the Cone Bioassay Data Form as shown in Figure 84, you will have to scroll
to see all fields:
Date that cone was placed in the field
Time Cone Placed in the field – the initial time at which the test commenced
Cone location – specify the location that the cone was placed
Location description – describe the location, for example bednet panel 1
Time after 24 hours – enter the time that you are recording the data for mortality after 24 hours
Number Mosquitos exposed – typically five non-blood fed adults per cone
Mortality 24-hour – number of dead mosquitoes after 24 hours
Percent Mortality 24-hour – A calculated field (read-only) represented as

105
𝑀𝑜𝑟𝑡𝑎𝑙𝑙𝑖𝑡𝑦24 ℎ𝑟% =𝑀𝑜𝑟𝑡𝑎𝑙𝑖𝑡𝑦 24 ℎ𝑜𝑢𝑟𝑠
𝑁𝑥 100
Where N is the Number of mosquitoes exposed
Calculate button – press to calculate and display the Percent Mortality 24-hour value
After entering the date and location information for the cone (which will be used to link the data to the
appropriate cone in the field), enter the number of mosquitoes that were originally exposed in the cone and
then the number that were knocked down after 24 hours and press the calculate button. This will cause the
KD24 percent to be automatically calculated.
Figure 105. Cone Bioassay Data Lab Collection Screen
106
5 Transfer Data
5.1 Export Data to CSV format A convenient way to get all of the raw data from the device is to export it to CSV format. From the home screen
menu of the app, select “Export all data”. This process may take a few seconds (or minutes, depending on the
amount of data) and will provide a notification when completed. All CSV files are generated and saved under the
device’s Download\EpiInfoEntomology\Output folder. If the device has an app capable of reading CSV files, such
as Google Sheets, the user can view the raw data using the device itself. Otherwise, the files can be copied to a
PC via USB.
5.2 Sync to Epi Info for Windows In order to transfer data from a mobile device to Epi Info for Windows, you will need to have the latest version
of Epi Info installed on your PC and a copy of the app’s project file, which is available here.
1. From the home screen menu on the app, select “Create Sync File” to create one or more sync files.
2. Create a password for the sync file(s). This password will be required to access the sync file(s) when
connecting to Epi Info on your PC.
3. Connect the mobile device to your PC and open the Epi Info™ software on your PC.
4. From the Epi Info™ main menu, select Enter Data or select Tools > Enter Data. The Enter tool opens.
5. Open the project and form used to collect the data on the mobile device.
6. From the File menu, select Import Data > From mobile device.
7. Click the Browse button next to the Mobile sync file text box and select the sync file created with the
mobile device. The file will be located in the Downloads > EpiInfoEntomology> SyncFiles folder on the
mobile device.
8. Click Open. Note the file format, “Epi Info for Android” sync files.
9. Select the Type of Import from the options listed.
a. Update and append records – Records in the destination form containing the same
GlobalRecordId values as the source form will be updated (overwritten) if there is new
information. However, values in the destination table will never be overwritten with a null or
missing value. All other records will be appended (added) to the end of the table.
b. Update records only – Records in the destination form containing the same GlobalRecordId
values as the source form will be updated (overwritten) if there is new information. However,
values in the destination table will never be overwritten with a null or missing value. All other
records will be ignored.
c. Append records only – All records in the source form will be appended (added) to the end of the
table. No records will be updated (overwritten).
10. Click Import. “Import Complete” will appear at the bottom of the dialog box upon successful completion
of the import.
11. The data displays in the Enter tool at the end of the Record List. This information is now ready to be
analyzed with the Visual Dashboard.

107
6 Data Analysis: From the app itself The app provides automatic calculation of various indices and presents the data in charts and maps, Figure 106.
The indices will automatically be stratified by region if the information is being captured (see Section 1.6). The
filter icon in the bottom right-hand corner can be used to further filter the results by date range. Note that the
analysis results are based on the data that are currently residing in the device. Data that have been uploaded
from other devices to the cloud but not downloaded to the current device will not be reflected in the analysis.
Figure 106. Analysis Screen
7 Data Analysis: Using Epi Info for Windows The desktop version of Epi Info can be used to analyze the data collected from the mobile app, with results that
can be displayed using a collection of user-configured gadgets such as rate gadgets. An example is shown in
Figure 1076. Note that in order to use the rate gadgets shown in the example, you will need Epi Info version
7.2.2.0 or higher (earlier versions of Epi Info do not include the rate gadget).

108
Figure 107. Epi Info Example Dashboard
A dashboard can be configured to display data in many different ways and can be used to calculate many
different indices. Suggested indices include:
Container Index
House Index
Breteau Index
Pupae Index
Pupae per Container
Pupae per Person

109
8 Process Flow Diagrams Figure 108 through Figure 114 show the flow for each data collection module of the app. All data collection
activities begin with the creation of a Location record, Figure 108. Data collection for trapping, collection, cone
bioassays and adult vector control activities are accessed via an Entomology Menu. Collection and cone
bioassays have separate process flow diagrams for the field of lab versions of the app, respectively.
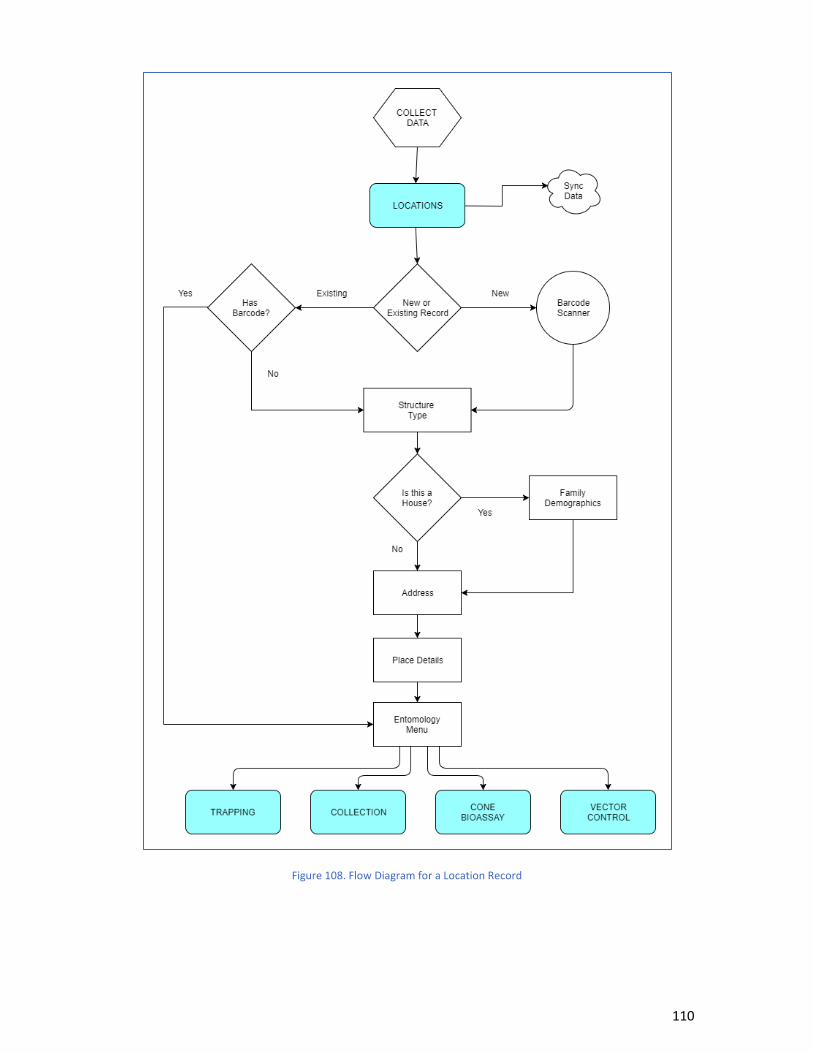
110
Figure 108. Flow Diagram for a Location Record

111
Figure 109. Flow Diagram for Field Trapping Records
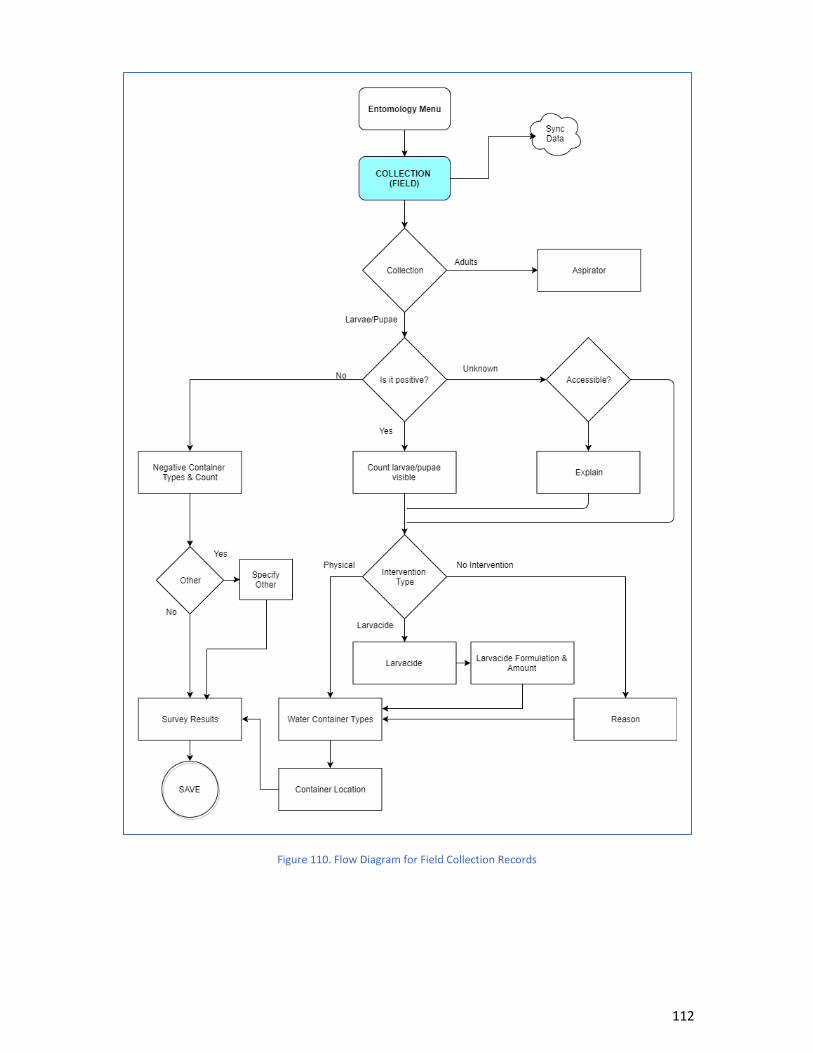
112
Figure 110. Flow Diagram for Field Collection Records

113
Figure 111. Flow Diagram for Lab Collection Records

114
Figure 112. Flow Diagram for Field Cone Bioassay Records

115
Figure 113. Flow Diagram for Lab Cone Bioassay Records
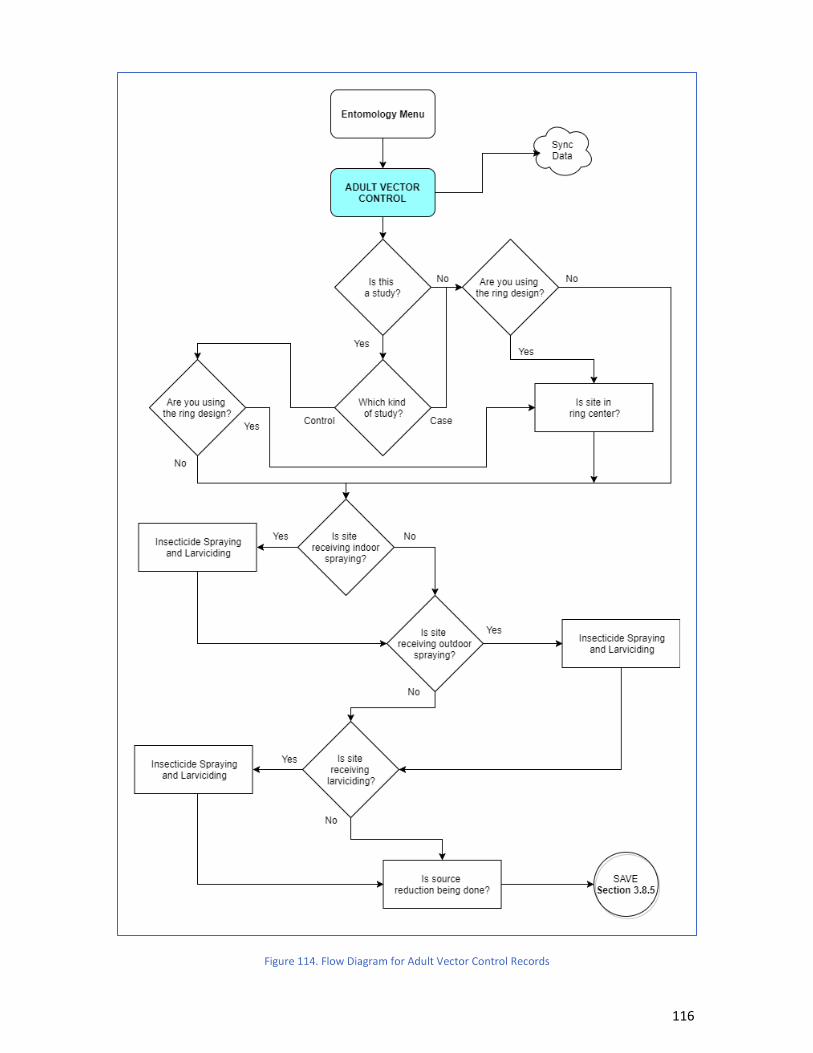
116
Figure 114. Flow Diagram for Adult Vector Control Records

117
9 Contacts for Troubleshooting Issues With The App If you encounter a problem with the app or need technical assistance, please contact the Epi Info Help Desk at:
Epi Info Help Desk for Technical Assistance
(404) 498-6190 voice
For answers to commonly asked questions, please visit the Epi Info website at www.cdc.gov.
Also, the Epi Info Web Board provides a forum for user questions and answers. Join the group by creating a user
account at phconnect.org. Follow the instructions to join.
10 References
CDC Zika Virus Website, CDC.
Epi Info Visual Dashboard: Performing Statistical Analyses with Visual Tools, CDC
Epi Info™ User Guide, CDC.
Karl S, Halder N, Kelso JK, Ritchie SA, Milne GJ. A spatial simulation model for dengue virus infection in urban
areas. BMC Infect Dis. 2014 Aug 20;14:447. doi: 10.1186/1471-2334-14-447.
Vector control operations framework for Zika virus, World Health Organization.
Zika Virus Fact Sheet, World Health Organization.
11 Disclaimers
Links located at this site to nonfederal organizations are provided solely as a service to our users.
These links do not constitute an endorsement of these organizations nor their programs by the
Centers for Disease Control and Prevention (CDC) or the federal government, and none should be inferred. CDC is not responsible for the content contained at these sites.
Use of trade names and commercial sources is for identification only and does not imply endorsement by the
Division Parasitic Diseases and Malaria, Center for Global Health, Centers for Disease Control and Prevention,
the Public Health Service, or the U.S. Department of Health and Human Services.
Limitation of Liability
The materials embodied in the Epi Info™ Mobile Application are "as-is" and without warranty of any kind,
express, implied or otherwise, including without limitation, any warranty of fitness for a particular purpose. In
no event shall the Centers for Disease Control and Prevention (CDC) or the United States (U.S.) Government be
118
liable to the user or to anyone else for any direct, special, incidental, indirect or consequential damages of any
kind, or any damages whatsoever, including without limitation, loss of profit, loss of use, savings or revenue, loss
of data or the claims of third parties, whether or not CDC or the U.S. Government has been advised of the
possibility of such loss, however caused and on any theory of liability, arising out of or in connection with the
possession, use or performance of this software.
12 Frequently Asked Questions
1. Can I use the Epi Info™ Companion for Android app from the Google Play Store to work with the
Vector Surveillance data?
No. The Vector Surveillance app is distinct from the generic Epi Info Companion for Android. Please
ensure that you download the Vector Surveillance app from https://goo.gl/ziM77M. Both apps can be
installed safely on the same device.
2. Can I use both the field and lab versions of the app on the same mobile device?
Yes. Please refer to Section 1.4.
3. How do I delete a record?
When viewing a list of records, press down on the record you want to delete for several seconds, a
“Delete Record” dialog window will appear, click to delete the record.