epfl sti article figures
TRANSCRIPT

7/31/2019 EPFL STI Article Figures
http://slidepdf.com/reader/full/epfl-sti-article-figures 1/54
FromMarconi
to
Moore
Circuitsand
Systems
for
Communications
–
StillaChallenge?
Acknowledgements: Prof. H. Meyr, M. Witte,
F. Borlenghi (RWTH-Aachen)

7/31/2019 EPFL STI Article Figures
http://slidepdf.com/reader/full/epfl-sti-article-figures 2/54
Guglielmo Marconi
1897 : Wireless Telegraph Company
1909 : Nobel Price in Physics
2
„It isdangerousto put limitsonwireless“
Source: Intel Corporation
GordonMoore
1968:CofoundedINTELCorporation
2005
:
Marconi
Society
Lifetime
AchievementAwardMoore‘slaw (1965/75) pacestheevolution
of integratedcircuitsuntiltoday

7/31/2019 EPFL STI Article Figures
http://slidepdf.com/reader/full/epfl-sti-article-figures 3/54
Marconi’sfirst wirelesstelegraph(1895)
3
Mechanicalcontinuouswave RF signalgenerator
Core of an early daysradio telegraph receiver
Electrochemical demodulatorfor voice ~1900

7/31/2019 EPFL STI Article Figures
http://slidepdf.com/reader/full/epfl-sti-article-figures 4/54
4
De Forest Audion radioreceiver from 1906
Texas Instruments firstsilicon transistor (1954)
First transistor radio:TI Regency TR-1 (1954)

7/31/2019 EPFL STI Article Figures
http://slidepdf.com/reader/full/epfl-sti-article-figures 5/54
5
Mobilesubscriptions
outrunfixedtelephone
subscriptions
Numberof fixedline
subscriptionsstarts
decreasing
Broadbandmobilesubscriptions
outrunfixedinternetsubscriptions
M.Witte,2010

7/31/2019 EPFL STI Article Figures
http://slidepdf.com/reader/full/epfl-sti-article-figures 6/54
Introduction:SomeHistory
ScalingLaws,Trends,andObservations
Arethere
still
challenges??
• SomeexampleswhyIthinkYES
TheEndof Moore’sLaw
• Thelimitof wirelessORmotivationforsomemorefancyresearch
6

7/31/2019 EPFL STI Article Figures
http://slidepdf.com/reader/full/epfl-sti-article-figures 7/54
7
Moore’sLaw
2xevery
24months
2 x e v e r y
1 8 m o n t h s
E d h o l m
’ s L a w

7/31/2019 EPFL STI Article Figures
http://slidepdf.com/reader/full/epfl-sti-article-figures 8/54
Newmultiplexing
schemes
allow
to
allocate
more
bandwidthtoasingleuserforhigherpeakthroughput
Spectralefficiencyincreasesdueto
• Higherordermodulationschemes
• Spatialmultiplexing
8
GSM
•270kHz
•GMSK
EDGE
•270kHz
•8PSK
EEDGE
•2x270kHz
•32QAM
UMTS
•5MHz
•QPSK
HSPA
•5MHz
•16
QAM
HSPA+
•2x2MIMO
•64QAM
LTE
•4x4MIMO
•20MHz
LTEA
•8x8MIMO
•20100MHz
802.11
•DBPSK
•11MHz
802.11b
•CCK
•11MHz
802.11a/g
•64QAM
•20MHz
802.11n
•40MHz
•64QAM
•2x2MIMO
802.11n
•40MHz
•64QAM
•4x4MIMO
802.11ac
•80160MHz
•256QAM
•8x8MIMO
802.11
ad•1.7GHz
•16QAM
Morecomplex
receivers

7/31/2019 EPFL STI Article Figures
http://slidepdf.com/reader/full/epfl-sti-article-figures 9/54
Imbalancebetween
complexity
and
integration
density
Dataratedoublesevery18months
Algorithm
complexity
grows
(spectral
efficiency)
9
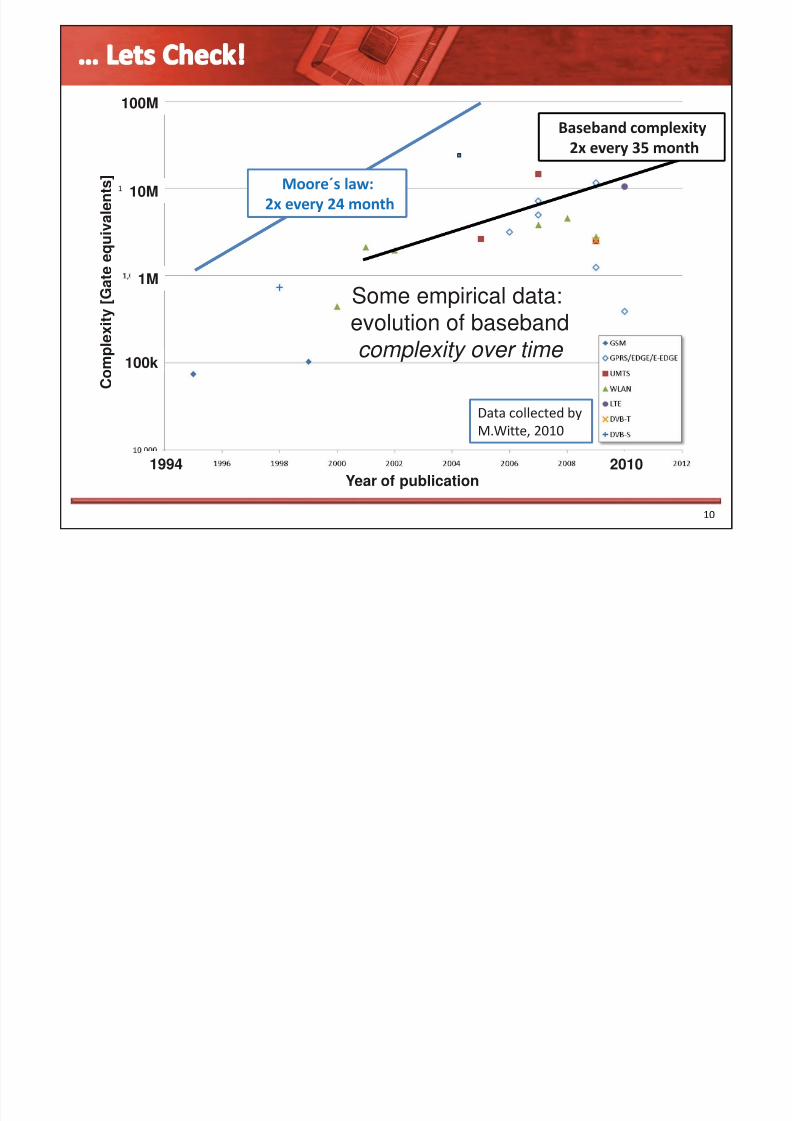
2x every24 months
2x every18 months
«Complexityof
baseband
processing
outruns
technologycapabilities»
7/31/2019 EPFL STI Article Figures
http://slidepdf.com/reader/full/epfl-sti-article-figures 10/54
10
Moore´slaw:
2xevery
24
month
Basebandcomplexity
2xevery35month
C o m p l e x i t y [ G
a t e e q u i v a l e n
t s ]
Datacollectedby
M.Witte,2010
Some empirical data:evolution of baseband
complexity over time
Year of publication1994 2010
1M
10M
100M
100k

7/31/2019 EPFL STI Article Figures
http://slidepdf.com/reader/full/epfl-sti-article-figures 11/54
11
Moore´slaw:
2xevery
24
month
Basebandcomplexity
2xevery35month
C o m p l e x i t y [ G
a t e e q u i v a l e n
t s ]
Datacollectedby
M.Witte,2010
Some empirical data:evolution of baseband
complexity over time
Year of publication1994 2010
1M
10M
100M
100k
Numberof Transistorsrequiredfor
integrationgrows
less
rapidly
than
“complexity”

7/31/2019 EPFL STI Article Figures
http://slidepdf.com/reader/full/epfl-sti-article-figures 12/54
Technologyscaling
reduces
both
area
and
delay
Example
12
180 45
Feature size [nm]
# G a t e s / m
m 2
O p . f r e q u e
n c y
180 45
Feature size [nm]
180 45
Feature size [nm]
G o p s / s / m m
2 Some saturation
around 65-45nm
180nm 90nm 45nm
Clock freq. 100MHz 200MHz 400MHz
16x16 Mult+
overhead(50/50)20kum2 5kum2 1.25kum2
5Gops/s/mm2 40Gops/s/mm2 320Gops/s/mm2

7/31/2019 EPFL STI Article Figures
http://slidepdf.com/reader/full/epfl-sti-article-figures 13/54
13
2000
• Liuetal.
• 112mm2
• 250nm
2004
• Uvieghara etal.
• 46mm2
• 130nm
2006
• Luftner etal.
• 43mm2
• 90nm
2009
• Shirasaki etal.
• 66mm2
• 45nm
2G 2.5G 3.5G3G
Someexamples
of
digital
cellular
ASICs
from
ISSCC

7/31/2019 EPFL STI Article Figures
http://slidepdf.com/reader/full/epfl-sti-article-figures 14/54
Cellularmodems
require
multi
standard support
Neverthelessthenumberof discretemodemcomponents
decreasesrapidly
14
0
5
10
15
94 97 00 03 06
C o m p o n e n t
s
Source: Dr. H. Eul,Keynote at 2010VLSI Conference
•Reduces cost (PCB, packaging, andmanufacturing
•More space for battery and display
GSMEDGEWCDMAHSPA+LTELTE-A
3G (WCDMA/HSPA)
2G (GSM/EDGE)
Legacy supportguarantees
coverage

7/31/2019 EPFL STI Article Figures
http://slidepdf.com/reader/full/epfl-sti-article-figures 15/54
Integrationof
application
and
modem
functionality
• Additionalairinterfaces,connectivityoptions,andstorage
• 3DGraphicsandVideo
• Powerfulapplicationprocessors
15
C o m m u n i c a t i o n
A p p l i c a t i o n
Ito et al.; ISSCC 2007
3GPPModemcovers
40%of thechiparea

7/31/2019 EPFL STI Article Figures
http://slidepdf.com/reader/full/epfl-sti-article-figures 16/54
Powerconsumption
and
energy
efficiency
16
Energy efficiency
Data download
Power consumption
Standby/voice
Determinedbyleakage
andstandbyactivity
Determinedbyactive
powerconsumption

7/31/2019 EPFL STI Article Figures
http://slidepdf.com/reader/full/epfl-sti-article-figures 17/54
Powerconsumption
and
energy
efficiency
17
Energy efficiency
Data download
Power consumption
Standby/voice
Determinedbyleakage
andstandbyactivity
Determinedbyactive
powerconsumption
J. Ayers, et al..,”An Ultralow-Power Receiver for Wireless Sensor Networks,” JSSC 2010
P. Petrus, et al., ” An Integrated Draft 802.11n CompliantMIMO Baseband and MAC Processor,“ ISSCC 2007
Simple OOK radio for sensor nodes
0.18 nJ/bit (complete transceiver)
Technology: 0.18 um Technology: 0.18 um
802.11n WLAN transceiver
3 nJ/bit (digital PHY/MAC only)
Highspectralefficiencycomesatthecostof poorenergy
efficiency

7/31/2019 EPFL STI Article Figures
http://slidepdf.com/reader/full/epfl-sti-article-figures 18/54
18
OFF Standby Voice Data
Useful datatraffic
Power
Verypoor Poor OK Good
Energy efficiency

7/31/2019 EPFL STI Article Figures
http://slidepdf.com/reader/full/epfl-sti-article-figures 19/54
19
OFF Standby Voice Data
Useful datatraffic
Power
Verypoor Poor OK Good
Energy efficiency
Leakageandstandbycurrentsdominateas
• DSPbecomesmoreenergyefficient
• Workloaddecreases(e.g.,standby)
Challenge:EnergyProportionality
Usehighenergywhen
needto“workhard”Lowenergywhen“doing
little”is“goodenough”

7/31/2019 EPFL STI Article Figures
http://slidepdf.com/reader/full/epfl-sti-article-figures 20/54
S. Kunie, et al., ” Low power architecture and designtechniques for mobile handset LSI Medity M2,“ ASP-DAC, 2008
176 9550 250
500
0
200
400
600
800
Tx Rx
RF BB PA
45nm >40%of thedigitaldiecovered
bybaseband
signal
processing
RX:Basebandconsumesmostof thetotalpower
285 360345
540300
0
500
1000
Tx Rx
RF BB PAS. G. Sankaran, et al., ” Design and Implementationof a CMOS 802.11n SoC,“ Comm. Magazine 2009
>70%areacoveredby
basebandsignal
processing
DSPconsumessignificantpowercomparedtoRF(especiallyRX)
130nm
Letscheck
two
examples
2x2MIMOWLAN(IEEE802.11n)
3GPPHandsetASIC/MPSoC
20

7/31/2019 EPFL STI Article Figures
http://slidepdf.com/reader/full/epfl-sti-article-figures 21/54
21
7/31/2019 EPFL STI Article Figures
http://slidepdf.com/reader/full/epfl-sti-article-figures 22/54
22
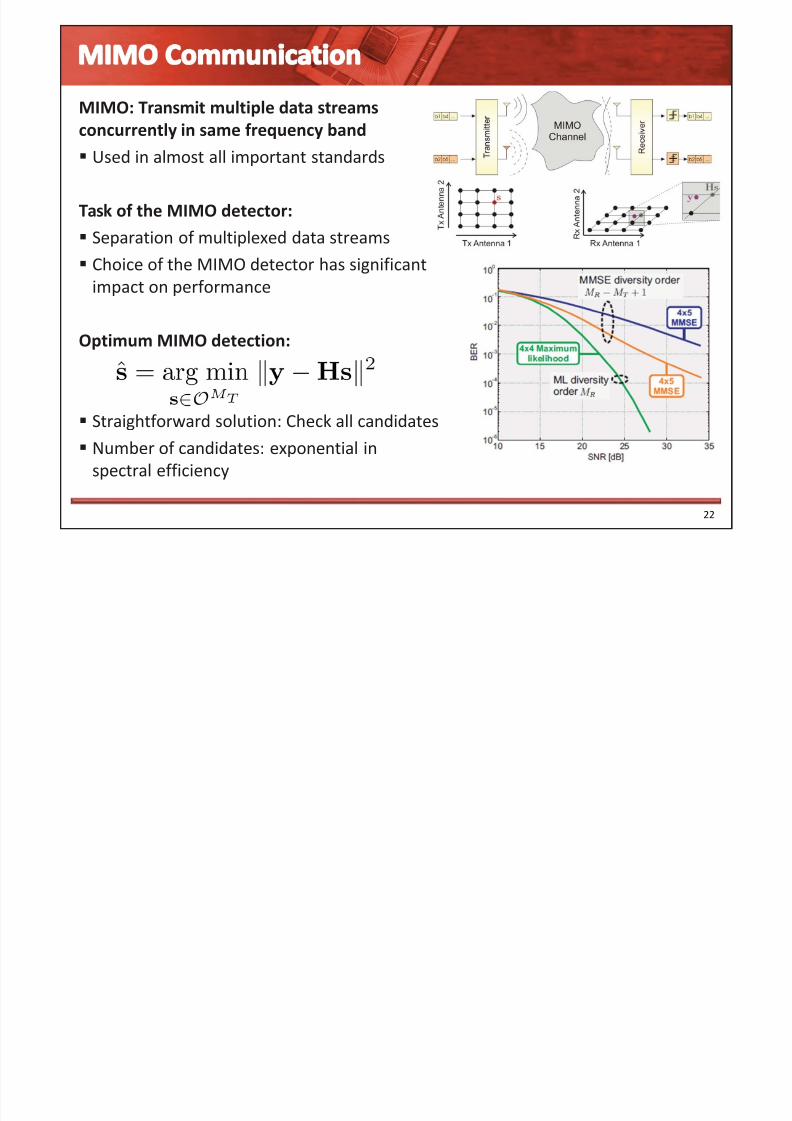
MIMO:Transmit
multiple
data
streams
concurrentlyinsamefrequencyband
Usedinalmostallimportantstandards
Taskof theMIMOdetector:
Separationof multiplexeddatastreams
Choiceof theMIMOdetectorhassignificant
impactonperformance
OptimumMIMOdetection:
Straightforwardsolution:Checkallcandidates
Numberof candidates:exponentialin
spectralefficiency

7/31/2019 EPFL STI Article Figures
http://slidepdf.com/reader/full/epfl-sti-article-figures 23/54
2002:4stream
MIMO
over
UMTS
Spectralefficiency8bits/s/Hz
Examine256candidates
4million
times
per
second
23
Source: Bell Labs Wireless Research, Holmdel, NJ
2002 : MIMO over UMTS with1 Mbps for 31 users (8 bits/s/Hz)
2009:MIMOWLAN
Spectralefficiency24bits/s/Hz
Examine
2
24
candidates
40milliontimespersecond
2009 : MIMO WLAN 600 Mbps(24 bits/s/Hz)

7/31/2019 EPFL STI Article Figures
http://slidepdf.com/reader/full/epfl-sti-article-figures 24/54
Spheredecoding
Maptheproblemtoatreesearch
Usebranchandboundstrategy
forcomplexity
reduction
STSspheredecodingprovides
softinformationforchanneldecoder
24
2007 : STS Soft-outputsphere-decodingwith 10-40 Mbit/s
250nm2mm2
71M nodes/s
Requires
completelynew
architectures
Treesearchisverydifferent
fromtypical
DSP
algorithms

7/31/2019 EPFL STI Article Figures
http://slidepdf.com/reader/full/epfl-sti-article-figures 25/54
Spheredecoding
Maptheproblemtoatreesearch
Usebranchandboundstrategy
forcomplexity
reduction
STSspheredecodingprovides
softinformationforchanneldecoder
25
2007 : STS Soft-outputsphere-decodingwith 10-40 Mbit/s
250nm2mm2
71M nodes/s
Requires
completelynew
architectures
Treesearchisverydifferent
fromtypical
DSP
algorithms
2mm
2mm
25mm2
Nearoptimumperformance@600Mbps
4parallelinstances
workatat320MHz
1.28Gnodes/s
802.11n
Technology shrink &architecture optimization

7/31/2019 EPFL STI Article Figures
http://slidepdf.com/reader/full/epfl-sti-article-figures 26/54
Exchangereliability
information
between
MIMO
detector
andchanneldecoder
Convergetooptimumsolutioninmultipleiterations
Iterationsrequiresoftin
softoutMIMOdetection,
whichis
even
more
complex
ComplexityforN iterations
increasesatleastNfold
26

7/31/2019 EPFL STI Article Figures
http://slidepdf.com/reader/full/epfl-sti-article-figures 27/54
3GPP2007:
Extension
of
2G
system
GSM
/
EDGEtowardhigherdatarates
Highermodulationorder(16QAMand32QAM)
1.2xhighersymbolrate
Bandwidthremains
unaltered
Optimumreceiver:Maximumlikelihood
sequenceestimation(MLSE)
Complexitygrowsexponentiallyin
spectral
efficiency
and
channel
length
27
modulation order / alphabet size
branches
2 4 8 16 324
64
1024
65k
1000k
GSM
EDGE
EvolvedEDGE
Strongneed for equalization
Impractical evenina32nm process
32QAM Tx-signal(Evolved EDGE)
7/31/2019 EPFL STI Article Figures
http://slidepdf.com/reader/full/epfl-sti-article-figures 28/54
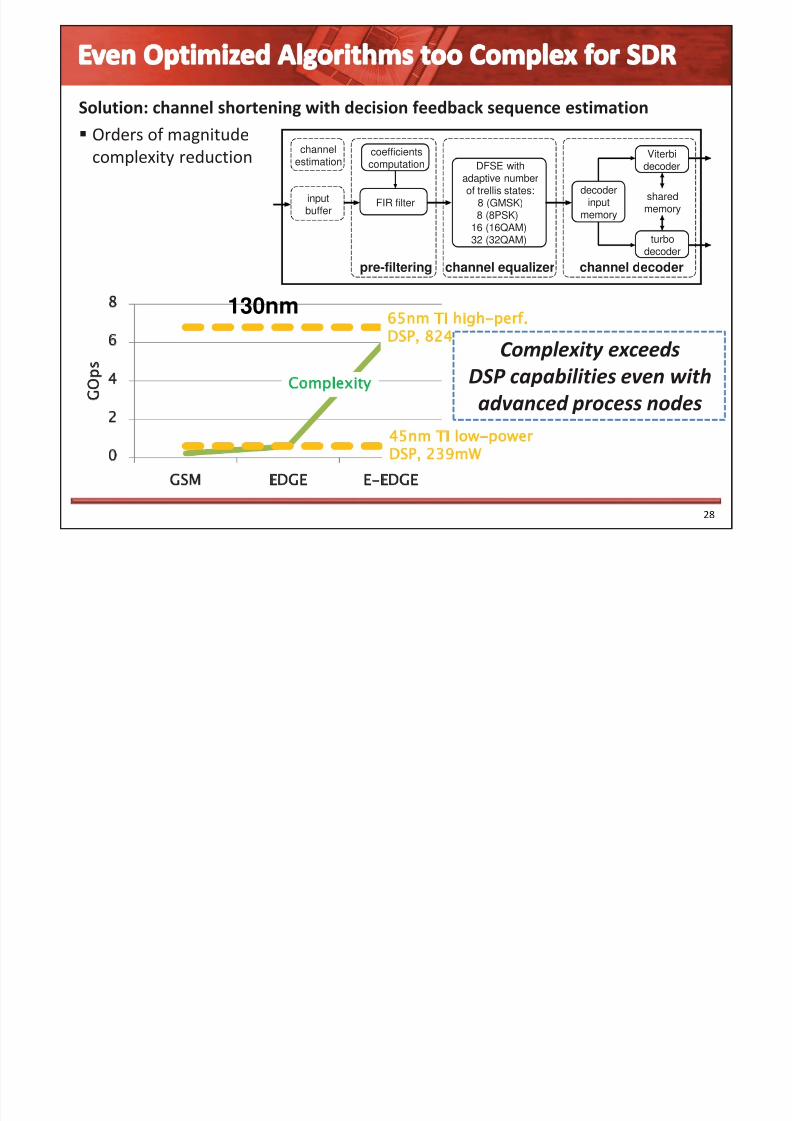
Solution:channel
shortening
with
decision
feedback
sequence
estimation
Ordersof magnitude
complexityreduction
28
channelestimation
inputbuffer
coefficientscomputation
FIR filter
pre-filtering channel equalizer channel decoder
Viterbidecoder
turbodecoder
decoder
inputmemory
DFSE withadaptive numberof trellis states:
8 (GMSK)8 (8PSK)
16 (16QAM)32 (32QAM)
sharedmemory
130nm
Complexity exceedsDSP capabilitiesevenwithadvanced processnodes

7/31/2019 EPFL STI Article Figures
http://slidepdf.com/reader/full/epfl-sti-article-figures 29/54
Solution:channel
shortening
with
decision
feedback
sequence
estimation
Ordersof magnitude
complexityreduction
29
channelestimation
inputbuffer
coefficientscomputation
FIR filter
pre-filtering channel equalizer channel decoder
Viterbidecoder
turbodecoder
decoder
inputmemory
DFSE withadaptive numberof trellis states:
8 (GMSK)8 (8PSK)
16 (16QAM)32 (32QAM)
sharedmemory
130nm
Complexity exceedsDSP capabilitiesevenwithadvanced processnodes
Averg. power at VDD=1.2V
EDGE (8PSK, CC) 6.8mWE-EDGE (16QAM, TC) 11.2mW
E-EDGE (32QAM, TC) 19.9mW
Dedicated ASIC solution[Benkeser et al., ISSCC2010]

7/31/2019 EPFL STI Article Figures
http://slidepdf.com/reader/full/epfl-sti-article-figures 30/54
Example:Low
Density
Parity
Check
Decoder
1962:inventedbyR.G.Gallager
• PerformanceclosetotheShannonlimit(onparwithTurbocodes)
• Initiallyconsideredtocomplexforeconomicimplementation
1999:
re
discovered
by
MacKay
and
Neal• VLSItechnologyallowedfortheimplementationof LDPCcodes
Today:LDPC
codes
are
optional
or
mandatory
in
almost
all
relevantstandards
30

7/31/2019 EPFL STI Article Figures
http://slidepdf.com/reader/full/epfl-sti-article-figures 31/54
Iterativemessage
passing
Largenumberof identicalcomputationalunits,operating
inparallel exploitsresourcesavailablefromscaling
Differentstandardsuse
differentcodes
Differentcodesrequired
withineachstandard
Computationaleffort
acrossstandards
spans
3ordersof magnitude
Computationaleffortperbitremainsalmostconstant
31

7/31/2019 EPFL STI Article Figures
http://slidepdf.com/reader/full/epfl-sti-article-figures 32/54
Referencedesign:
LDPC
decoder
for
IEEE
802.11n
208MHzclockfrequency
780Mbpsthroughput
3.4mm2 siliconarea
Workload~50100GOps
32
3.9 nJ/bit
2.3W @ 600Mbps
180nm

7/31/2019 EPFL STI Article Figures
http://slidepdf.com/reader/full/epfl-sti-article-figures 33/54
Referencedesign:
LDPC
decoder
for
IEEE
802.11n
208MHzclockfrequency
780Mbpsthroughput
3.4mm2 siliconarea
Workload~50100GOps
Max.throughput almost
doubles withhalf siliconarea
Canwedostillbetter??
33
3.9 nJ/bit2.3W @ 600Mbps
180nm
600 pJ/bit360mW @ 600Mbps
90nm
6.4x better
energy efficiency
Constant
throughput
Technologyscalingprovidessignificantenergysavings

7/31/2019 EPFL STI Article Figures
http://slidepdf.com/reader/full/epfl-sti-article-figures 34/54
VoltageFrequency
Scaling:
make
things
worse
to
make
them
better
Designacircuitthatworksfasterthanplanned(e.g.,byreplication)
• Whenrunningatthesamespeedandvoltage,energyefficiencybecomesworse
Utilizethefactthat
• Reducevoltageuntilit justmeetsthedelayconstraint
34
/N

7/31/2019 EPFL STI Article Figures
http://slidepdf.com/reader/full/epfl-sti-article-figures 35/54
VoltageFrequency
Scaling:
make
things
worse
to
make
them
better
Designacircuitthatworksfasterthanplanned(e.g.,byreplication)
• Whenrunningatthesamespeedandvoltage,energyefficiencybecomesworse
Utilizethefactthat
• Reducevoltageuntilit justmeetsthedelayconstraint
35
/N
1/N
better
energy
efficiency

7/31/2019 EPFL STI Article Figures
http://slidepdf.com/reader/full/epfl-sti-article-figures 36/54
VoltageFrequency
Scaling:
make
things
worse
to
make
them
better
Designacircuitthatworksfasterthanplanned(e.g.,byreplication)
• Whenrunningatthesamespeedandvoltage,energyefficiencybecomesworse
Utilizethefactthat
• Reducevoltageuntilit justmeetsthedelayconstraint
36
/N
1/N
better
energy
efficiency

7/31/2019 EPFL STI Article Figures
http://slidepdf.com/reader/full/epfl-sti-article-figures 37/54
37

7/31/2019 EPFL STI Article Figures
http://slidepdf.com/reader/full/epfl-sti-article-figures 38/54
Productiontest
is
needed
Identifychipswith
productiondefects
Classifyfunctional
dies
accordingtothespeed
theycanreach
Microprocessors:functionaldiessoldat
differentpricesdependingontheirspeed
CommunicationASICs:
need
to
run
at
apredefined
fixed
clock
speed
• Slowdiesmustbediscarded
• Fastdiesdonotexploitbetterperformance
38
M a n u f a c t u r i n g
P r o
d u c t i on
t e s t
Yield target
>95%
Speed binningimproves yield

7/31/2019 EPFL STI Article Figures
http://slidepdf.com/reader/full/epfl-sti-article-figures 39/54
path delay
#
o f o
c c u r a n c e s
VDD=nominal
VDD=low
target delay
target delay
VoltageScaling
Quadraticpowersavings
x Increasesmeandelaymaking
circuitsslower
x Increasesalsodelayvariance
makinghardertomeettargetperformance
ConventionalSolution
Overdesign:assumepessimistic
guardbands(timing,voltage)
x Higherpowerconsumptionon
average
x Limitthereturnsperformance,power)fromtechnologyscaling
39
130nm 90nm 65nm 45nm 32nm
Supply voltage approaches thethreshold voltage
More
dies
may
fail
to
meettargetperformance

7/31/2019 EPFL STI Article Figures
http://slidepdf.com/reader/full/epfl-sti-article-figures 40/54
40
6 bits
4 streams
108 tones every 3.6 ms
48 tones every 4 sm1 stream
1 bit
6 Mbps
600 MbpsMIMOdetector
Channeldecoder
arrival rate(bandwidth & CP length) bits/tone
PHYthroughput
MIMOdetector
Channeldecoder
SNR
(distance)
ErrorrateThroughput
(rate)
Rate adaptation is routinely used to deal with constantly varying channel conditions

7/31/2019 EPFL STI Article Figures
http://slidepdf.com/reader/full/epfl-sti-article-figures 41/54
41
6 bits
4 streams
108 tones every 3.6 ms
48 tones every 4 sm1 stream
1 bit
6 Mbps
600 MbpsMIMOdetector
Channeldecoder
arrival rate(bandwidth & CP length) bits/tone
PHYthroughput
MIMOdetector
Channeldecoder
SNR
(distance)
ErrorrateThroughput
(rate) Put thisscalability toservice for better energy efficiency and
toleranceagainst processvariations
Rate adaptation is routinely used to deal with constantly varying channel conditions

7/31/2019 EPFL STI Article Figures
http://slidepdf.com/reader/full/epfl-sti-article-figures 42/54
42
Iterativereceivers
/decoders:
data
passesmultipletimesthroughthe
samealgorithm
Performance
improves
with
each
iteratrion
Deminishing returns afterfew iterations
Achieve same rate only ata shorter distance
Achievable rate decreases

7/31/2019 EPFL STI Article Figures
http://slidepdf.com/reader/full/epfl-sti-article-figures 43/54
43
Iterativereceivers
/decoders:
data
passesmultipletimesthroughthe
samealgorithm
Performance
improves
with
each
iteratrion
Deminishing returns afterfew iterations
Achieve same rate only ata shorter distance
Achievable rate decreases
Yield improvement:exploit scalability toretain functionality under process
variations

7/31/2019 EPFL STI Article Figures
http://slidepdf.com/reader/full/epfl-sti-article-figures 44/54
Basebandprocessor
is
comprised
of
logic
and
memory(onchipandsometimesoff chip)
PredictionfromITRSroadmap:
Primaryconcern:embedded(small mediumsize)
memories
in
DSP
blocks Occupyasignificantpercentageof thearea
Consumeasignificantshareof thepower
Memoriesaretheprimarysourceof failure(yieldloss)
44
Memorybecomes
dominantissue

7/31/2019 EPFL STI Article Figures
http://slidepdf.com/reader/full/epfl-sti-article-figures 45/54
Manufacturingcircuits(memories)thatareactually
functionalandrobustbecomesincreasinglydifficult
45
Denserandlargermemoriesaremoresusceptibletoradiation
Processvariationleadstostaticerrorsanddysfunctionalcells
Reduced
noise
margins
and
supply
noise
induce
errors
in
weak
cells

7/31/2019 EPFL STI Article Figures
http://slidepdf.com/reader/full/epfl-sti-article-figures 46/54
Faulttolerant
by
design:
Channelfading(randomfluctuationof
signalstrength)
Unknown(noisy)channelparameters
Thermalnoise
and
interference
Systemlevelmechanismstorestore
reliablebehavior:
Forwarderrorcorrectioncoding
Automaticrepeatrequest
Applicationlevelfaulttolerance
(e.g.,
video
over
UDP)
46

7/31/2019 EPFL STI Article Figures
http://slidepdf.com/reader/full/epfl-sti-article-figures 47/54
47
ProposedParadigm
Relaxyieldrequirement(forinherentlyresilientsystems)
Selldieswithlimitedamountof defects(brokenmemorycells)
ConventionalParadigm
100%reliability,
accept
area
&
poweroverheadSellonlydefectfreedies

7/31/2019 EPFL STI Article Figures
http://slidepdf.com/reader/full/epfl-sti-article-figures 48/54
Conventionalyield
definition
Acceptingonlychipswithnodefects
ProposedyielddefinitionY(Nf )forsystemswithinherenthardwareerror
resilience
Chipswith
at
most
Nf faulty
memory
cells
pass
inspection
48
Accepting more defects means
Higher yield, and/or
Lower voltage & power
What is the impact on system-
level metrics (throughput) ?

7/31/2019 EPFL STI Article Figures
http://slidepdf.com/reader/full/epfl-sti-article-figures 49/54
Example :Communication
system with bit
interleaved
coded modulation (BICM)
HSPDA.WiMAX,3GPPLTE,GSM,WLAN,…
49
Interleaver memory:stores
reliability information of thereceived data bits
Faultmodel
:de
interleaver
built
from
unreliablememory(5%BER)
Binarysymmetric channel
Randomized error locations
0 5 10 15 200
1
2
3
4
5
6
7
8
SNR [dB]
M a x .
A c h i e v a b l e R a t e [ b p c u ]
Collaboration with TU-Vienna (Matz, Novak)

7/31/2019 EPFL STI Article Figures
http://slidepdf.com/reader/full/epfl-sti-article-figures 50/54
Example :Communication
system with bit
interleaved
coded modulation (BICM)
HSPDA.WiMAX,3GPPLTE,GSM,WLAN,…
50
Interleaver memory:stores
reliability information of thereceived data bits
Faultmodel
:de
interleaver
built
from
unreliablememory(5%BER)
Binarysymmetric channel
Randomized error locations
0 5 10 15 200
1
2
3
4
5
6
7
8
SNR [dB]
M a x .
A c h i e v a b l e R a t e [ b p c u ]
Unreliablecircuit behavior canbeincorporated intothe performanceanalysisof communicationsystems
Collaboration with TU-Vienna (Matz, Novak)

7/31/2019 EPFL STI Article Figures
http://slidepdf.com/reader/full/epfl-sti-article-figures 51/54
51
Explorethe
resilience
limits of
wirelesscommunication systems to
hardwaredefects
Simulation
of
complete
HSPA+
system,witherrorinjection(in
HARQ memory)
Inject
‘CircuitErrors’
Forvariousdefectrates(Nf )
creatememoryinstances
withrandomfaultlocations
T r a n s m i t t e r
HSPA+ System LLR StorageHARQ memory:
Bitflipsatrandomlocations

7/31/2019 EPFL STI Article Figures
http://slidepdf.com/reader/full/epfl-sti-article-figures 52/54
52
20errors(Nf =0.01%,200kbLLRstorage)
(Almost)same
throughput
as
for
defect
free
hardware
2’000errors(Nf =1%)
Achieverequiredthroughput(butclearpenaltyw.r.t.defectfreehardware)
Powerreductionbyallowinglowvoltages(~200mVless)

7/31/2019 EPFL STI Article Figures
http://slidepdf.com/reader/full/epfl-sti-article-figures 53/54
NewAlgorithmsandArchitecturesforBypassingthe
ExponentialComplexityAssociatedwithSpectralEfficiency
ImprovingEnergyEfficiency(nJ/bit)andAchieving
EnergyProportionality
in
Communications
ExploitingSystem
Level
Error
Tolerance
to
Cope
with
the
Issuesof DeppSubmicronIntegration
53

7/31/2019 EPFL STI Article Figures
http://slidepdf.com/reader/full/epfl-sti-article-figures 54/54
54
Signalprocessing algorithms:MIMOdetection,sparsechannel estimation,equalization,
CSADCs
for spectrum sensing
Systemdesignand test (prototypeimplementations):MIMO,visible light communication,
communication over plastic optical fibers,GSM/Evolved EDGE,TDSCDMA
VLSI
circuits
for
communications:
circuit
techniques
for
low
power
and
ultra
high
speed
signalprocessing,faulttolerantsignalprocessingfordeepsubmicronVLSI,VLSIfor
embeddedsystems
http://tcl.epfl.ch/