epcor utilities incs responsibility for financial reporting the preparation and presentation of the...
TRANSCRIPT

Consolidated Financial Statements of
EPCOR UTILITIES INC.
Years ended December 31, 2016 and 2015

Management's responsibility for financial reporting
The preparation and presentation of the accompanying consolidated financial statements of EPCOR Utilities Inc. are the
responsibility of management and the consolidated financial statements have been approved by the Board of Directors. In
management's opinion, the consolidated financial statements have been prepared within reasonable limits of materiality in
accordance with International Financial Reporting Standards. The preparation of financial statements necessarily requires
judgment and estimation when events affecting the current year depend on determinations to be made in the future.
Management has exercised careful judgment where estimates were required, and these consolidated financial statements
reflect all information available to March 2, 2017. Financial information presented elsewhere is consistent with that in the
consolidated financial statements.
To discharge its responsibility for financial reporting, management maintains systems of internal controls designed to provide
reasonable assurance that the Company's assets are safeguarded, that transactions are properly authorized and that relevant
financial information is reliable, accurate and available on a timely basis. The internal control systems are monitored by
management, and evaluated by an internal audit function that regularly reports its findings to management and the Audit
Committee of the Board of Directors.
The consolidated financial statements have been audited by KPMG LLP, the Company’s external auditors. The external
auditors are responsible for auditing the consolidated financial statements and expressing their opinion on the fairness of the
financial statements in accordance with International Financial Reporting Standards. The auditors' report outlines the scope of
their audit and states their opinion.
The Board of Directors, through the Audit Committee, is responsible for ensuring management fulfills its responsibilities for
financial reporting and internal controls. The Audit Committee, which is composed of independent directors, meets regularly
with management, the internal auditors and the external auditors to satisfy itself that each group is discharging its
responsibilities with respect to internal controls and financial reporting. The Audit Committee reviews the consolidated financial
statements and management’s discussion and analysis and recommends their approval to the Board of Directors. The external
auditors have full and open access to the Audit Committee, with and without the presence of management. The Audit
Committee is also responsible for reviewing and recommending the annual appointment of the external auditors and approving
the annual external audit plan.
On behalf of management,
Stuart Lee Guy Bridgeman
President and Chief Executive Officer Senior Vice President and Chief Financial Officer
March 2, 2017

EPCOR UTILITIES INC. Consolidated Financial Statements
Years ended December 31, 2016 and 2015
Auditors' Report ................................................................................................................................................... 1
Financial Statements:
Consolidated Statements of Comprehensive Income ..................................................................................... 2
Consolidated Statements of Financial Position ............................................................................................... 3
Consolidated Statements of Changes in Equity .............................................................................................. 4
Consolidated Statements of Cash Flows ........................................................................................................ 5
Notes to the Consolidated Financial Statements ............................................................................................. 6

KPMG LLP 2200, 10175 101 St NW Edmonton AB T5J 0H3 Telephone (780) 429-7300 Fax (780) 429-7379 www.kpmg.ca
KPMG LLP is a Canadian limited liability partnership and a member firm of the KPMG network of independent member firms affiliated with KPMG International Cooperative (“KPMG International”), a Swiss entity. KPMG Canada provides services to KPMG LLP.
INDEPENDENT AUDITORS’ REPORT
To the Shareholder of EPCOR Utilities Inc.
We have audited the accompanying consolidated financial statements of EPCOR Utilities Inc., which comprise the
consolidated statements of financial position as at December 31, 2016 and December 31, 2015, the consolidated statements
of comprehensive income, changes in equity and cash flows for the years then ended, and notes, comprising a summary of
significant accounting policies and other explanatory information.
Management’s Responsibility for the Consolidated Financial Statements
Management is responsible for the preparation and fair presentation of these consolidated financial statements in accordance
with International Financial Reporting Standards, and for such internal control as management determines is necessary to
enable the preparation of consolidated financial statements that are free from material misstatement, whether due to fraud
or error.
Auditors’ Responsibility
Our responsibility is to express an opinion on these consolidated financial statements based on our audits. We conducted our
audits in accordance with Canadian generally accepted auditing standards. Those standards require that we comply with
ethical requirements and plan and perform the audit to obtain reasonable assurance about whether the consolidated financial
statements are free from material misstatement.
An audit involves performing procedures to obtain audit evidence about the amounts and disclosures in the consolidated
financial statements. The procedures selected depend on our judgment, including the assessment of the risks of material
misstatement of the consolidated financial statements, whether due to fraud or error. In making those risk assessments, we
consider internal control relevant to the entity’s preparation and fair presentation of the consolidated financial statements in
order to design audit procedures that are appropriate in the circumstances, but not for the purpose of expressing an opinion
on the effectiveness of the entity’s internal control. An audit also includes evaluating the appropriateness of accounting
policies used and the reasonableness of accounting estimates made by management, as well as evaluating the overall
presentation of the consolidated financial statements.
We believe that the audit evidence we have obtained in our audits is sufficient and appropriate to provide a basis for our audit
opinion.
Opinion
In our opinion, the consolidated financial statements present fairly, in all material respects, the consolidated financial position
of EPCOR Utilities Inc. as at December 31, 2016 and December 31, 2015, and its consolidated financial performance and its
consolidated cash flows for the years then ended in accordance with International Financial Reporting Standards.
Chartered Professional Accountants March 2, 2017 Edmonton, Canada
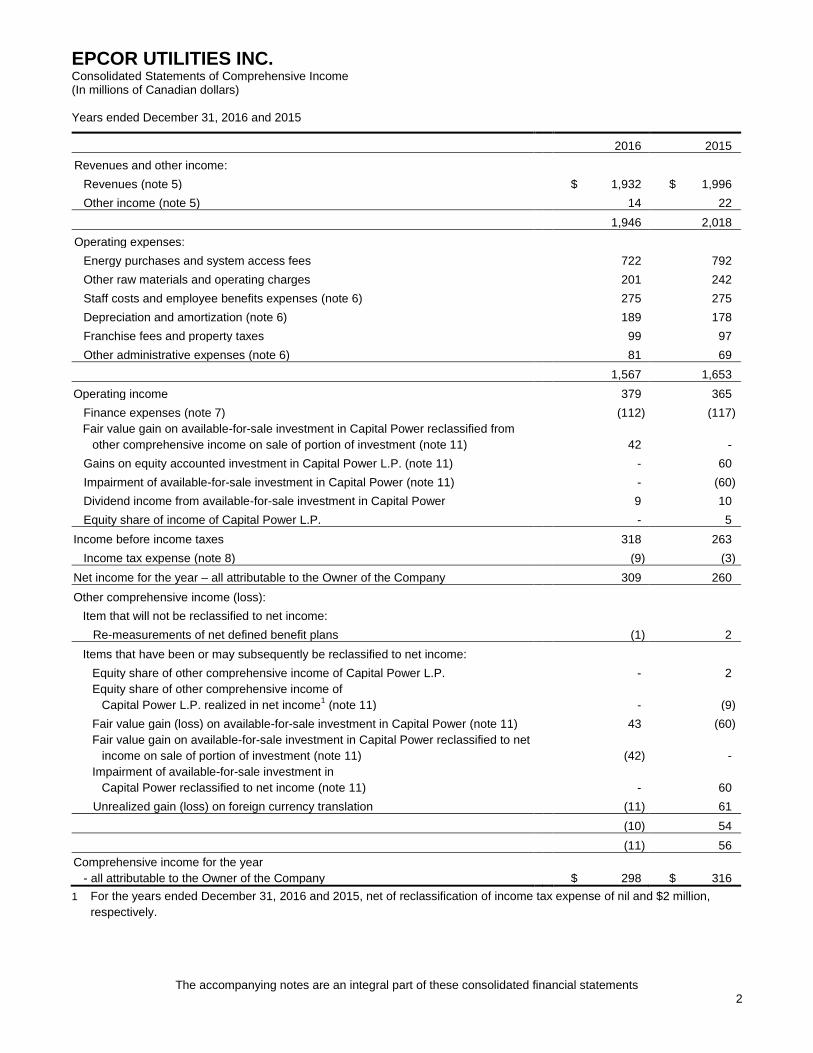
EPCOR UTILITIES INC. Consolidated Statements of Comprehensive Income (In millions of Canadian dollars)
Years ended December 31, 2016 and 2015
The accompanying notes are an integral part of these consolidated financial statements 2
2016 2015
Revenues and other income:
Revenues (note 5) $ 1,932 $ 1,996
Other income (note 5) 14 22
1,946 2,018
Operating expenses:
Energy purchases and system access fees 722 792
Other raw materials and operating charges 201 242
Staff costs and employee benefits expenses (note 6) 275 275
Depreciation and amortization (note 6) 189 178
Franchise fees and property taxes 99 97
Other administrative expenses (note 6) 81 69
1,567 1,653
Operating income 379 365
Finance expenses (note 7) (112) (117)
Fair value gain on available-for-sale investment in Capital Power reclassified from
other comprehensive income on sale of portion of investment (note 11) 42 -
Gains on equity accounted investment in Capital Power L.P. (note 11) - 60
Impairment of available-for-sale investment in Capital Power (note 11) - (60)
Dividend income from available-for-sale investment in Capital Power 9 10
Equity share of income of Capital Power L.P. - 5
Income before income taxes 318 263
Income tax expense (note 8) (9) (3)
Net income for the year – all attributable to the Owner of the Company 309 260
Other comprehensive income (loss):
Item that will not be reclassified to net income:
Re-measurements of net defined benefit plans (1) 2
Items that have been or may subsequently be reclassified to net income:
Equity share of other comprehensive income of Capital Power L.P. - 2
Equity share of other comprehensive income of
Capital Power L.P. realized in net income1 (note 11) - (9)
Fair value gain (loss) on available-for-sale investment in Capital Power (note 11) 43 (60)
Fair value gain on available-for-sale investment in Capital Power reclassified to net
income on sale of portion of investment (note 11) (42) -
Impairment of available-for-sale investment in
Capital Power reclassified to net income (note 11) - 60
Unrealized gain (loss) on foreign currency translation (11) 61
(10) 54
(11) 56
Comprehensive income for the year
- all attributable to the Owner of the Company $ 298 $ 316
1
For the years ended December 31, 2016 and 2015, net of reclassification of income tax expense of nil and $2 million,
respectively.

EPCOR UTILITIES INC. Consolidated Statements of Financial Position (In millions of Canadian dollars)
December 31, 2016 and 2015
Approved on behalf of the Board,
Hugh J. Bolton Vito Culmone Director and Chairman of the Board Director and Chairman of the Audit Committee 3
The accompanying notes are an integral part of these consolidated financial statements
2016 2015
ASSETS
Current assets:
Cash and cash equivalents (note 9) $ 191 $ 36
Trade and other receivables (note 10) 325 620
Available-for-sale investment in Capital Power (note 11) 6 -
Inventories (note 12) 14 15
536 671
Non-current assets:
Other financial assets (note 13) 265 317
Deferred tax assets (note 14) 84 77
Available-for-sale investment in Capital Power (note 11) - 167
Property, plant and equipment (note 15) 4,983 4,568
Intangible assets and goodwill (note 16) 293 288
5,625 5,417
TOTAL ASSETS $ 6,161 $ 6,088
LIABILITIES AND EQUITY
Current liabilities:
Trade and other payables (note 17) $ 299 $ 259
Loans and borrowings (note 18) 15 242
Deferred revenue (note 19) 25 32
Provisions (note 20) 25 37
Derivatives (note 21) - 2
Other liabilities (note 22) 26 27
390 599
Non-current liabilities:
Loans and borrowings (note 18) 1,905 1,875
Deferred revenue (note 19) 1,016 959
Deferred tax liabilities (note 14) 46 35
Provisions (note 20) 86 84
Derivatives (note 21) - 10
Other liabilities (note 22) 46 11
3,099 2,974
Total liabilities 3,489 3,573
Equity attributable to the Owner of the Company:
Share capital (note 23) 24 24
Accumulated other comprehensive income (note 24) 86 97
Retained earnings 2,562 2,394
Total equity 2,672 2,515
TOTAL LIABILITIES AND EQUITY $ 6,161 $ 6,088

EPCOR UTILITIES INC. Consolidated Statements of Changes in Equity (In millions of Canadian dollars)
December 31, 2016 and 2015
The accompanying notes are an integral part of these consolidated financial statements 4
Accumulated other comprehensive income (loss) Equity
attributable
to the Owner
of the
Company
Share
capital
(note 23)
Cash flow
hedges
(note 24)
Investment
in Capital
Power
(note 24)
Available-
for-sale
financial
assets
(note 24)
Cumulative
translation
account
(note 24)
Employee
benefits
account
(note 24)
Retained
earnings
Equity at December 31, 2014 $ 24 $ (5) $ 12 $ 1 $ 44 $ (11) $ 2,275 $ 2,340
Net income for the year - - - - - - 260 260
Other comprehensive
income (loss):
Re-measurements of
net defined benefit plans - - - - - 2 - 2
Equity share of
other comprehensive
income of Capital Power L.P. - - 2 - - - - 2
Equity share of
other comprehensive
income of Capital Power L.P.
realized in net income - 5 (14) - - - - (9)
Fair value loss
on available-for-sale
investment in Capital Power - - - (60) - - - (60)
Impairment of available-for-sale
investment in Capital Power
reclassified to net income - - - 60 - - - 60
Unrealized gain on
foreign currency translation - - - - 61 - - 61
Total comprehensive income (loss) - 5 (12) - 61 2 260 316
Dividends - - - - - - (141) (141)
Equity at December 31, 2015 24 - - 1 105 (9) 2,394 2,515
Net income for the year - - - - - - 309 309
Other comprehensive
income (loss):
Re-measurements of
net defined benefit plans - - - - - (1) - (1)
Fair value gain
on available-for-sale
investment in Capital Power - - - 43 - - - 43
Fair value gain on
available-for-sale investment
in Capital Power reclassified
to net income on sale of
portion of investment - - - (42) - - - (42)
Unrealized loss on
foreign currency translation - - - - (11) - - (11)
Total comprehensive income (loss) - - - 1 (11) (1) 309 298
Dividends - - - - - - (141) (141)
Equity at December 31, 2016 $ 24 $ - $ - $ 2 $ 94 $ (10) $ 2,562 $ 2,672

EPCOR UTILITIES INC. Consolidated Statements of Cash Flows (In millions of Canadian dollars)
Years ended December 31, 2016 and 2015
The accompanying notes are an integral part of these consolidated financial statements 5
2016 2015
Cash flows from (used in) operating activities:
Net income for the year $ 309 $ 260
Reconciliation of net income for the year to cash from (used in) operating activities:
Interest paid (128) (116)
Finance expenses (note 7) 112 117
Income taxes recovered 1 1
Income tax expense (note 8) 9 3
Depreciation and amortization (note 6) 189 178
Change in employee benefits provisions (8) (3)
Contributions received (note 19) 21 30
Deferred revenue recognized (note 19) (37) (24)
Fair value change on derivative instruments (note 21) (2) (1)
Fair value gain on available-for-sale investment in Capital Power reclassified from other
comprehensive income on sale of portion of investment (note 11) (42) -
Gains on equity accounted investment in Capital Power L.P. (note 11) - (60)
Impairment of available-for-sale investment in Capital Power (note 11) - 60
Equity share of income from Capital Power L.P. - (5)
Dividend income from available-for-sale investment in Capital Power (9) (10)
Other (3) 5
Funds from operations 412 435
Change in non-cash operating working capital (note 26) 63 (19)
Net cash flows from operating activities 475 416
Cash flows from (used in) investing activities:
Acquisition or construction of property, plant and equipment and intangible assets1 (502) (463)
Business acquisitions (note 25) (51) -
Proceeds on disposal of property, plant and equipment 19 24
Change in non-cash investing working capital (note 26) 5 3
Net payments received (advances) on other financial assets (note 13) 314 (55)
Payment of Gold Bar transfer fees - (1)
Net proceeds on sale of a portion of available-for-sale investment in Capital Power 204 -
Net proceeds on sale of a portion of equity accounted investment in Capital Power L.P. - 216
Distributions received from Capital Power 12 19
Net cash flows from (used) in investing activities 1 (257)
Cash flows from (used in) financing activities:
Net repayment of short-term loans and borrowings (98) (5)
Proceeds from issuance of long-term loans and borrowings 52 -
Repayment of long-term loans and borrowings (141) (10)
Provisions 7 (4)
Dividends paid (141) (141)
Net cash flows used in financing activities (321) (160)
Increase (decrease) in cash and cash equivalents 155 (1)
Cash and cash equivalents, beginning of year 36 37
Cash and cash equivalents, end of year $ 191 $ 36
1
Interest payment of $5 million (2015 – $6 million) is included in acquisition or construction of property, plant and equipment and intangible assets.

EPCOR UTILITIES INC. Notes to the Consolidated Financial Statements (Tabular amounts in millions of Canadian dollars unless otherwise indicated) Years ended December 31, 2016 and 2015
6
1. Nature of operations
EPCOR Utilities Inc. (the Company or EPCOR) builds, owns and operates electrical transmission and distribution
networks, water and wastewater treatment facilities and infrastructure, and provides electricity, water and natural gas
products and services to residential and commercial customers.
The Company operates in Canada and the United States (U.S.) with its registered head office located at 2000, 10423 -
101 Street NW, Edmonton, Alberta, Canada, T5H 0E8.
The common shares of EPCOR are owned by The City of Edmonton (the City). The Company was established by
Edmonton City Council under City Bylaw 11071.
2. Basis of presentation
(a) Statement of compliance
These consolidated financial statements have been prepared by management in accordance with International
Financial Reporting Standards (IFRS) as issued by the International Accounting Standards Board (IASB). These
consolidated financial statements were approved and authorized for issue by the Board of Directors on March 2,
2017.
(b) Basis of measurement
The Company's consolidated financial statements are prepared on the historical cost basis, except for its beneficial
interest in the sinking fund held with the City, available-for-sale investment in Capital Power, derivative financial
instruments and contingent consideration, which are measured at fair value.
3. Significant accounting policies
The accounting policies set out below have been applied consistently to all years presented in these consolidated financial
statements unless otherwise indicated.
(a) Basis of consolidation
These consolidated financial statements include the accounts of EPCOR and its wholly owned subsidiaries at
December 31, 2016. Subsidiaries are entities controlled by the Company. The Company controls an entity when it is
exposed to, or has rights to, variable returns from the performance of the entity and has the ability to affect those
returns through its control over the entity. Subsidiaries are fully consolidated from the date on which EPCOR obtains
control, and continue to be consolidated until the date that such control ceases to exist. All intercompany balances
and transactions have been eliminated on consolidation. Unrealized gains arising from transactions with equity-
accounted associates are eliminated against the investment to the extent of the Company’s interest in the investee.
Unrealized losses are eliminated in the same way as unrealized gains, but only to the extent that there is no evidence
of impairment. The financial statements of the subsidiaries are prepared for the same reporting period as EPCOR,
using consistent accounting policies.
(b) Changes in significant accounting policies
The Company adopted amendments to various accounting standards effective January 1, 2016 and the amendments
did not have a significant impact on these consolidated financial statements.
(c) Business combinations and goodwill
Acquisitions of subsidiaries and businesses are accounted for using the acquisition method. The determination of
whether or not an acquisition meets the definition of business combination under IFRS requires judgment and is
assessed on a case by case basis. The consideration for an acquisition is measured at the fair value of the assets
given, equity instruments issued and liabilities incurred or assumed at the date of acquisition in exchange for control
of the acquired business. The consideration transferred does not include amounts related to the settlement of pre-
existing relationships. Such amounts are recognized in net income. Transaction costs that the Company incurs in
connection with a business combination, other than those associated with the issue of debt or equity securities, are
expensed as incurred.

EPCOR UTILITIES INC. Notes to the Consolidated Financial Statements (Tabular amounts in millions of Canadian dollars unless otherwise indicated) Years ended December 31, 2016 and 2015
7
Identifiable assets acquired and liabilities assumed in a business combination are measured initially at their fair
values at the date of acquisition. Any contingent consideration payable is measured at fair value at the acquisition
date. If the contingent consideration is classified as equity then it is not re-measured and settlement is accounted for
within equity. Subsequent changes in the fair value of contingent consideration that is not classified as equity are
recognized in net income.
Goodwill is measured as the excess of the fair value of the consideration transferred less the fair value of the
identifiable assets acquired and liabilities assumed. Subsequently, goodwill is measured at cost less accumulated
impairment losses, if any. Goodwill is reviewed for impairment annually or more frequently if events or changes in
circumstances indicate the carrying amount may be impaired. Impairment is determined by assessing the recoverable
amount of the cash generating unit to which goodwill relates. Where the recoverable amount of the cash generating
unit is less than the carrying amount, an impairment loss is recognized.
(d) Revenue recognition
Revenue is recognized to the extent that it is probable that economic benefits will flow to the Company for the
provision of goods or services and where the revenue can be reliably measured. Revenues are measured at the fair
value of the consideration received or to be received, excluding discounts, rebates and sales taxes or duty.
Certain water services contracts contain multiple-deliverables arrangements. Each deliverable that is considered to
be a separate unit of account is accounted for individually. Significant judgment is required to determine an
appropriate allocation of the total contract value to each unit of account based on the relative fair values of each unit.
If the fair value of the delivered item is not reliably measurable, then revenue is allocated based on the difference
between the total arrangement consideration and the fair value of the undelivered units of account. The primary
identifiable deliverables under such contracts are plant construction and project upgrades and expansions, financing
or leasing of upgrades, and facilities operations and maintenance.
The Company’s principal sources of revenue and recognition of these revenues for financial statement purposes are
as follows:
Sale of goods
Revenues from sales of electricity and water are recognized upon delivery. These revenues include an estimate of
the value of electricity and water consumed by customers and billed subsequent to the reporting period.
Revenues from the sale of other goods are recognized when the products have been delivered and collectability is
probable.
Provision of services
Revenues from the provision of electricity distribution and transmission services and wastewater treatment services
are recognized over the period in which the service is performed and collectability is reasonably assured. Revenues
from the provision of other services are recognized when the services have been rendered and collectability is
probable.
Construction contracts
Contract revenue from the construction of water and wastewater treatment plants and other project upgrades and
expansions provided to customers is recognized in profit or loss on the percentage of completion basis when the
projected final cost of a construction contract can be reliably estimated. Contract revenue includes the initial amount
agreed in the contract plus any variations in contract work, claims and incentive payments, to the extent that it is
probable that they will result in revenue and can be reliably measured. Percentage of completion is estimated based
on an assessment of progress towards the completion of contract tasks. These estimates may result in the
recognition of unbilled receivables when the revenues are earned prior to billing customers. If progress billings
exceed costs incurred plus recognized profits, then the difference is presented as deferred revenue in the statement
of financial position. Contract expenses are recognized as incurred unless they create an asset related to future
contract activity.

EPCOR UTILITIES INC. Notes to the Consolidated Financial Statements (Tabular amounts in millions of Canadian dollars unless otherwise indicated) Years ended December 31, 2016 and 2015
8
When the outcome of a construction contract cannot be estimated reliably, contract revenue is recognized only to the
extent of contract costs incurred that are likely to be recoverable.
Provisions for estimated losses on uncompleted contracts are made for the full amount of the projected loss in the
period in which the losses are identified. Revenues and costs related to variations are included in the total estimated
contract revenue and expenses when it is probable that the customer will approve the variation and the amount of
revenue arising from the variation can be reliably measured.
Revenues earned under finance leases
Finance income earned from arrangements where the Company leases water and wastewater assets to customers
are accounted for as finance leases, as described in note 3(h).
Interest income
Revenue from the financing of project upgrades and expansions is recognized over the term of each contract using
the effective interest method based on the fair value of the loan calculated at inception for each contract.
Interest income related to the loans receivable from Capital Power are recognized over the terms of the loans based
on the interest rate applicable to each loan.
(e) Income taxes
Under the Income Tax Act (Canada) (ITA), a municipally owned corporation is subject to income tax on its taxable
income if the income from activities for any relevant period that was earned outside the geographical boundaries of
the municipality exceeds 10% of the corporation’s total income for that period. As a result of these and other
provisions, certain Canadian subsidiaries of the Company are taxable under the ITA and provincial income tax acts.
The U.S. subsidiaries are subject to income taxes pursuant to U.S. federal and state income tax laws.
Current income taxes for the current or prior periods are measured at the amount expected to be recovered from or
payable to the taxation authorities based on the tax rates that are enacted or substantively enacted by the end of the
reporting period.
Deferred tax assets and liabilities are recognized for the deferred tax consequences attributable to differences
between the financial statement carrying amounts of existing assets and liabilities and their respective tax bases.
Deferred tax assets and liabilities are measured using enacted or substantively enacted rates of tax expected to apply
to taxable income in the years in which those temporary differences are expected to be recovered or settled. The
effect of a change in tax rates on deferred tax assets and liabilities is recognized in income in the period that includes
the date of enactment or substantive enactment. Deferred tax assets and liabilities are offset if there is a legally
enforceable right to offset current tax liabilities and assets, and they relate to income taxes levied by the same tax
authority on the same taxable entity, or on different tax entities, but they intend to settle current tax liabilities and
assets on a net basis or their tax assets and liabilities will be realized simultaneously.
A deferred tax asset is recognized for unused tax losses, tax credits and deductible temporary differences, to the
extent that it is probable that future taxable profits will be available against which they can be utilized. Deferred tax
assets are reviewed at each reporting date and are reduced to the extent that it is no longer probable that the related
tax benefit will be realized.
Deferred tax liabilities are recognized for taxable temporary differences associated with investments in subsidiaries
except where the Company is able to control the timing of the reversal of the temporary differences, and it is probable
that the temporary difference will not reverse in the foreseeable future. Deferred tax assets arising from deductible
temporary differences associated with investments in subsidiaries are only recognized to the extent that the
temporary difference will reverse in the foreseeable future and the Company judges that it is probable that there will
be sufficient taxable income against which to utilize the benefits of the temporary differences. Deferred tax assets and
liabilities are not recognized if the temporary difference arises from the initial recognition of goodwill arising from a
business combination or from the initial recognition (other than in a business combination) of other assets and
liabilities in a transaction that affects neither taxable income nor accounting income.

EPCOR UTILITIES INC. Notes to the Consolidated Financial Statements (Tabular amounts in millions of Canadian dollars unless otherwise indicated) Years ended December 31, 2016 and 2015
9
Current and deferred taxes are recognized in profit or loss except to the extent that they relate to items recognized
directly in equity or in other comprehensive income.
(f) Cash and cash equivalents
Cash and cash equivalents include cash and short-term, highly liquid investments that are readily convertible to
known amounts of cash and which are subject to an insignificant risk of changes in value.
(g) Inventories
Small parts and other consumables, the majority of which are consumed by the Company in the provision of its goods
and services, are valued at the lower of cost and net realizable value. Cost includes the purchase price,
transportation costs and other costs to bring the inventories to their present location and condition. The costs of
inventory items that are interchangeable are determined on an average cost basis. For inventory items that are not
interchangeable, cost is assigned using specific identification of their individual costs. Net realizable value is the
estimated selling price in the ordinary course of business, less the estimated costs of completion and the estimated
costs necessary to make the sale. Previous write downs of inventories from cost to net realizable value can be fully
or partially reversed if supported by economic circumstances. The Company estimates the value of inventory that is
expected to be used in the construction of property, plant and equipment (PP&E) and reports this value as
construction work in progress under PP&E.
(h) Lease arrangements
At the inception of an arrangement entered into for the use of an asset, the Company determines whether such an
arrangement is, or contains, a lease. A specific asset is the subject of a lease if fulfillment of the arrangement is
dependent on the use of the specific asset and the arrangement conveys a right to use the asset. An arrangement
conveys the right to use the asset if the right to control the use of the underlying asset is transferred. Where it is
determined that the arrangement contains a lease, the Company classifies the lease as either a finance or operating
lease dependent on whether substantially all the risks or rewards of ownership of the asset have been transferred.
Where the Company is the lessor, finance income related to leases or arrangements accounted for as finance leases
is recognized in a manner that produces a constant rate of return on the net investment in the lease. The net
investment in the lease is the aggregate of net minimum lease payments and unearned finance income discounted at
the interest rate implicit in the lease. Unearned finance income is deferred and recognized in net income over the
lease term.
Where the Company is the lessee, leases or other arrangements that transfer substantially all of the benefits and
risks of ownership of property to the Company are classified as finance leases. All other arrangements that are
determined to contain a lease are classified as operating leases. Rental payments under arrangements classified as
operating leases are expensed on a straight-line basis over the term of the lease. Lease incentives received are
recognized as an integral part of the total lease expense, over the term of the lease.
(i) Property, plant and equipment
PP&E are recorded at cost, net of accumulated depreciation and accumulated impairment losses, if any.
Cost includes contracted services, materials, direct labor, directly attributable overhead costs, borrowing costs on
qualifying assets and decommissioning costs. Where parts of an item of PP&E have different estimated economic
useful lives, they are accounted for as separate items (major components) of PP&E.
The cost of major inspections and maintenance is recognized in the carrying amount of the item if the asset
recognition criteria are satisfied. The carrying amount of a replaced part is derecognized. The costs of day-to-day
servicing are expensed as incurred.
Depreciation of cost less residual value is charged on a straight-line basis over the estimated economic useful lives of
items of each depreciable component of PP&E, from the date they are available for use, as this most closely reflects
the expected usage of the assets. Land and construction work in progress are not depreciated. Estimating the
appropriate economic useful lives of assets requires significant judgment and is generally based on estimates of life
characteristics of similar assets. The estimated economic useful lives, methods of depreciation and residual values

EPCOR UTILITIES INC. Notes to the Consolidated Financial Statements (Tabular amounts in millions of Canadian dollars unless otherwise indicated) Years ended December 31, 2016 and 2015
10
are reviewed annually with any changes adopted on a prospective basis.
The ranges of estimated economic useful lives for PP&E assets used are as follows:
Water and wastewater treatment and distribution 3 – 95 years
Electricity transmission and distribution 3 – 65 years
Retail systems and equipment 3 – 8 years
Corporate information systems and equipment 2 – 15 years
Leasehold improvements 5 – 25 years
Gains and losses on the disposal of PP&E are determined as the difference between the net disposal proceeds and
the carrying amount at the date of disposal. The gains or losses are included within depreciation and amortization.
(j) Capitalized borrowing costs
The Company capitalizes interest during construction of a qualifying asset using the weighted average cost of debt
incurred on the Company's external borrowings or specific borrowings used to finance qualifying assets. Qualifying
assets are considered to be those that take a substantial period of time to construct.
(k) Intangible assets
Intangible assets with finite lives are stated at cost, net of accumulated amortization and impairment losses, if any.
The cost of a group of intangible assets acquired in a transaction, including those acquired in a business combination
that meet the specified criteria for recognition apart from goodwill, is allocated to the individual assets acquired based
on their relative fair value.
Customer rights represent the costs to acquire the rights to provide electricity services to particular customer groups
for a finite period of time. Other rights represent the costs to acquire the rights, for finite periods of time, to access
electricity delivery corridors, to the supply of water, to provide sewage treatment and transportation services, to
withdraw groundwater and to the supply of potable water for emergency and peak purposes. Customer and other
rights are recorded at cost at the date of acquisition. A subsequent expenditure is capitalized only when it increases
the future economic benefit in the specific asset to which it relates.
The cost of intangible software includes the cost of license acquisitions, contracted services, materials, direct labor,
along with directly attributable overhead costs and borrowing costs on qualifying assets.
Amortization of the cost of finite life intangible assets is recognized on a straight-line basis over the estimated
economic useful lives of the assets, from the date they are available for use, as this most closely reflects the
expected usage of the asset. Work in progress is not amortized. The estimated economic useful lives and methods of
amortization are reviewed annually with any changes adopted on a prospective basis.
The estimated economic useful lives for intangible assets with finite lives are as follows:
Customer rights 20 years
Software 2 – 20 years
Other rights 12 – 50 years
Water rights 100 years
Certificates of convenience and necessity (CCN) represent the costs to acquire the exclusive rights for the Company
to serve within its specified geographic areas in the U.S. for an indefinite period of time. CCN are not amortized but
are subject to review for impairment at the end of each reporting period.
Gains or losses on the disposal of intangible assets are determined as the difference between the net disposal
proceeds and the carrying amount at the date of disposal. The gains or losses are included within depreciation and
amortization.

EPCOR UTILITIES INC. Notes to the Consolidated Financial Statements (Tabular amounts in millions of Canadian dollars unless otherwise indicated) Years ended December 31, 2016 and 2015
11
(l) Service concession arrangements
Service concession arrangements are contracts between the Company and government entities and can involve the
design, build, finance, operation and maintenance of public infrastructure in which the government entity controls (i)
the services provided by the Company and (ii) significant residual interest in the infrastructure. Service concession
arrangements are classified in one of the following categories:
(i) financial asset
The Company recognizes a financial asset arising from service concession arrangement when it has an
unconditional right to receive a specified amount of cash or other financial asset over the life of the arrangement.
The financial asset is measured at the fair value of consideration received or receivable. When the Company
delivers more than one category of activities in a service concession arrangement, the consideration received or
receivable is allocated by reference to the relative fair value of the activity, when amounts are separately
identifiable.
(ii) intangible asset
The Company recognizes an intangible asset arising from service concession arrangement when it has a right to
charge for usage of the public infrastructure. The intangible asset, recognized as consideration for providing
construction or upgrade services under a service concession arrangement, is measured at fair value upon initial
recognition. Subsequent to initial recognition, the intangible asset is measured at cost less accumulated
amortization and impairment losses, if any.
Revenue under the service concession arrangements is recognized as per the revenue recognition policy of the
Company described in note 3(d) by reference to each activity when the amount of revenue is separately identifiable.
The accounting for investment in contracts with government entities requires the application of judgment in
determining if they fall within the scope of IFRIC 12 – Service Concession Arrangements (IFRIC 12). Additional
judgment also needs to be exercised when determining, among other things, the classification to be applied to the
service concession asset (i.e. financial asset or intangible asset), allocation of consideration between revenue
generating activities, classification of cost incurred on such concessions and the effective interest rate to be applied to
the service concession asset. Contracts falling under IFRIC 12 require use of estimates over the term of the
arrangement, and therefore any change in the long term estimates could result in significant variation in the amounts
recognized under service concession arrangements.
(m) Deferred revenue
Certain assets may be acquired or constructed using non-repayable government grants or contributions from
developers or customers. Non-refundable contributions received towards construction or acquisition of an item of
PP&E which are used to provide ongoing service to a customer are recorded as deferred revenue and are amortized
on a straight line basis over the estimated economic useful lives of the assets to which they relate.
(n) Provisions
A provision is recognized if, as a result of a past event, the Company has a present legal or constructive obligation
that can be estimated reliably, and it is probable that an outflow of economic benefits will be required to settle the
obligation. Provisions are determined by discounting the expected future cash flows at a pre-tax rate that reflects
current market assessments of the time value of money and the risks specific to the liability. The increase in the
provision due to the passage of time is recognized as a financing expense over the estimated time period until
settlement of the obligation. Significant judgment is required to determine whether a past event results in a liability
that is recognized in the statement of financial position. In addition, quantifying such provision also involves a certain
amount of estimation in respect of the amount and timing of outflows of economic benefits and therefore it is possible
that the assumptions used in measuring the provision may differ from future outcomes and the impact of such
variations could be material.
The Company recognizes a decommissioning provision in the period in which a legal or constructive obligation is
incurred. A corresponding asset for the decommissioning cost is added to the carrying amount of the associated
PP&E, and is depreciated over the estimated useful life of the asset.

EPCOR UTILITIES INC. Notes to the Consolidated Financial Statements (Tabular amounts in millions of Canadian dollars unless otherwise indicated) Years ended December 31, 2016 and 2015
12
The Company may receive contributions from customers, homebuilders, real estate developers, and others to fund
construction necessary to extend service to new areas. Certain of these contributions may be refunded over a limited
period of time as new customers begin to receive service or other contractual obligations are fulfilled. The portion of
contributions which are estimated to be refunded in the future are recorded as provisions. The remaining
contributions are classified as deferred revenue.
(o) Employee benefits
The employees of the Company are either members of the Local Authorities Pension Plan (LAPP) or other defined
benefit or defined contribution pension plans.
The LAPP is a multi-employer defined benefit pension plan. The trustee of the plan is the Alberta President of
Treasury Board and Minister of Finance and the plan is administered by a Board of Trustees. The Company and its
employees make contributions to the plan at rates prescribed by the Board of Trustees to cover costs and an
unfunded liability under the plan. The rates are based on a percentage of the pensionable salary. The most recent
actuarial report of the plan discloses an unfunded liability. It is accounted for as a defined contribution plan as the
LAPP is not able to provide information which reflects EPCOR's specific share of the defined benefit obligation or
plan assets that would enable the Company to account for the plan as a defined benefit plan. Accordingly, the
Company does not recognize its share of any plan surplus or deficit.
The Company maintains additional defined contribution and defined benefit pension plans to provide pension benefits
to certain management employees and employees who are not otherwise served by the LAPP, including employees
of new or acquired operations. Employees not otherwise served by LAPP comprise less than 17% of total employees
(2015 – 17%).
Short-term employee benefit obligations are measured on an undiscounted basis and are expensed as the related
service is provided. A liability for short-term employee benefits is recognized for the amount expected to be paid if the
Company has a legal or constructive obligation to pay this amount as a result of past service provided by the
employee and the obligation can be estimated reliably.
The Company recognizes the contribution payable to a defined contribution plan as an expense and a liability in the
period during which the service is rendered.
(p) Derivative financial instruments
The Company uses various risk management techniques to reduce its exposure to movements in electricity prices,
interest rates and foreign currency exchange rates. These include the use of derivative financial instruments such as
forward contracts or contracts-for-differences and interest rate swaps. Such instruments may be used to establish a
fixed price for electricity, fixed interest rates for borrowings or anticipated transactions denominated in a foreign
currency. Embedded derivatives are separated from the host contract and accounted for as a derivative if certain
criteria are met.
The Company sells electricity to customers under a Regulated Rate Tariff (RRT). As part of the RRT, the amount of
electricity to be economically hedged, the hedging method and the electricity selling prices to be charged to these
customers is determined by a regulatory approved Energy Price Setting Plan (EPSP). Under the EPSP, the Company
manages its exposure to fluctuating wholesale electricity spot prices and consumption volume by entering into
financial electricity purchase contracts up to 120 days in advance of the month of consumption in order to
economically hedge the price of electricity under a well-defined risk management process set out in the EPSP. Under
these instruments, the Company agrees to exchange, with a single creditworthy and adequately secured
counterparty, the difference between the Alberta Electric System Operator (AESO) market price and the fixed
contract price for a specified volume of electricity for the forward months, all in accordance with the EPSP. The
Company may enter into additional financial electricity purchase contracts outside the EPSP to further economically
hedge the price of electricity.
Interest rates swaps are used by the Company to manage interest rate risks associated with long-term loans and
borrowings and result in securing fixed interest rates over the term of the loans and borrowings against the floating
interest rate.

EPCOR UTILITIES INC. Notes to the Consolidated Financial Statements (Tabular amounts in millions of Canadian dollars unless otherwise indicated) Years ended December 31, 2016 and 2015
13
Foreign exchange forward contracts may be used by the Company to manage foreign exchange exposures,
consisting mainly of U.S. dollar exposures, resulting from anticipated transactions denominated in foreign currencies.
All derivative financial instruments are recorded at fair value as derivative assets or derivative liabilities on the
statement of financial position, to the extent they have not been settled, with all changes in the fair value of
derivatives recorded in net income. At initial recognition, transaction costs attributable to the derivative financial
instruments are recognized in net income.
The fair value of derivative financial instruments reflects changes in the electricity prices, interest rates and foreign
exchange rates. Fair value is determined based on exchange or over-the-counter price quotations by reference to bid
or asking price, as appropriate, in active markets. Fair value amounts reflect management’s best estimates using
external readily observable market data, such as forward prices, interest rates, foreign exchange rates and discount
rates for time value. It is possible that the assumptions used in establishing fair value amounts will differ from future
outcomes and the impact of such variations could be material.
(q) Non-derivative financial instruments
Financial assets are identified and classified as one of the following: measured at fair value through profit or loss,
loans and receivables, or available-for-sale financial assets. Financial assets are measured at fair value through profit
or loss if classified as held for trading or designated as such upon initial recognition. Financial liabilities are classified
as measured at fair value through profit or loss or as other financial liabilities.
Financial assets and financial liabilities are presented on a net basis when the Company has a legally enforceable
right to set off the recognized amounts and intends to settle on a net basis or to realize the asset and settle the
liability simultaneously.
Financial instruments at fair value through profit or loss
The Company may designate financial instruments as measured at fair value through profit or loss when such
financial instruments have a reliably determinable fair value and where doing so eliminates or significantly reduces a
measurement or recognition inconsistency that would otherwise arise from measuring assets and liabilities or
recognizing gains and losses on them on a different basis.
Upon initial recognition, directly attributable transaction costs are recognized in net income as incurred. Changes in
fair value of financial instruments measured at fair value through profit or loss are recognized in net income.
Loans and receivables
Cash and cash equivalents, trade and other receivables, and other financial assets are classified as loans and
receivables.
The Company's loans and receivables are recognized initially at fair value plus directly attributable transaction costs,
if any. After initial recognition, they are measured at amortized cost using the effective interest method less any
impairment as described in note 3(r). The effective interest method calculates the amortized cost of a financial asset
or liability and allocates the finance income or expense over the term of the financial asset or liability using an
effective interest rate. The effective interest rate is the rate that exactly discounts estimated future cash payments or
receipts through the expected life of the financial instrument, or a shorter period when appropriate, to the net carrying
amount of the financial asset or financial liability.
Available-for-sale financial assets
Available-for-sale financial assets are non-derivative financial assets that are designated as available-for-sale and
that are not classified in other categories. These assets are initially recognized at fair value plus directly attributable
transaction costs. Subsequent to initial recognition, they are measured at fair value with unrealized gains and losses,
other than impairment losses, recognized in other comprehensive income and presented within equity in the fair value
reserve. On derecognition of an available-for-sale financial asset, the cumulative gain or loss that was previously held
in equity is transferred to net income.

EPCOR UTILITIES INC. Notes to the Consolidated Financial Statements (Tabular amounts in millions of Canadian dollars unless otherwise indicated) Years ended December 31, 2016 and 2015
14
The Company's beneficial interest in the sinking fund with the City and available-for-sale investment in Capital Power
do not meet the criteria for classification in any of the previous categories and are classified as available-for-sale
financial assets and measured at fair value with changes in fair value reported in other comprehensive income until it
is disposed of or becomes impaired, as described in note 3(r).
Other financial liabilities
The Company’s trade and other payables, debentures and borrowings, contributions from customers and developers
and other liabilities are classified as other financial liabilities and recognized on the date at which the Company
becomes a party to the contractual arrangement. Other financial liabilities are derecognized when the contractual
obligations are discharged, cancelled or expire.
Other financial liabilities are initially recognized at fair value including debenture discounts and premiums, plus
directly attributable transaction costs, such as issue expenses, if any. Subsequently, these liabilities are measured at
amortized cost using the effective interest rate method.
(r) Impairment of financial assets
The Company's financial assets held as loans and receivables or available-for-sale assets are assessed for indicators
of impairment at each reporting date. An impairment loss for financial assets is recorded when it is identified that
there is objective evidence that one or more events has occurred, after the initial recognition of the asset, that has
had a negative impact on the estimated future cash flows of the asset and that can be reliably estimated. The
objective evidence for these types of assets is as follows:
(i) For listed and unlisted investments in equity securities classified as available-for-sale, a significant or prolonged
decline in the fair value of the investment below its cost is considered to be objective evidence of impairment.
Impairment losses recognized are not reversed in subsequent periods.
(ii) For all other financial assets, including finance lease receivables, objective evidence of impairment includes
significant financial difficulty of the counterparty or default or delinquency in interest or principal payments.
(iii) Trade receivables and other assets that are not assessed for impairment individually are assessed for
impairment on a collective basis. Objective evidence of impairment includes the Company's past experience of
collecting payments as well as observable changes in national or local economic conditions.
For financial assets carried at amortized cost, the amount of the impairment loss recognized is the difference between
the asset's carrying amount and the present value of estimated future cash flows discounted at the asset's original
effective interest rate. If, in a subsequent period, the amount of the estimated impairment loss increases or decreases
because of an event occurring after the impairment was recognized, the previously recognized impairment loss is
adjusted within net income.
(s) Impairment of non-financial assets
The carrying amounts of the Company’s non-financial assets are reviewed at each reporting date to determine
whether there is any indication of impairment. Non-financial assets include PP&E, intangible assets and goodwill. For
goodwill and intangible assets that have indefinite useful lives or that are not yet available for use, the recoverable
amount is estimated each year at the same time.
The recoverable amount of an asset or cash-generating unit is the greater of its value in use and its fair value less
costs to sell. In assessing value in use, the estimated future cash flows are discounted to their present value using a
pre-tax discount rate that reflects current market assessments of the time value of money and the risks specific to the
asset. For the purpose of impairment testing, assets that cannot be tested individually are grouped together into the
smallest group of assets that generates cash inflows from continuing use that are largely independent of the cash
inflows of other assets or groups of assets (the cash-generating unit, or CGU). For the purposes of goodwill
impairment testing, goodwill acquired in a business combination is allocated to the CGU, or the group of CGUs, that
is expected to benefit from the synergies of the combination. This allocation is subject to an operating segment ceiling
test and reflects the lowest level at which that goodwill is monitored for internal reporting purposes.

EPCOR UTILITIES INC. Notes to the Consolidated Financial Statements (Tabular amounts in millions of Canadian dollars unless otherwise indicated) Years ended December 31, 2016 and 2015
15
The Company’s corporate assets do not generate separate cash inflows. If there is an indication that a corporate
asset may be impaired, then the recoverable amount is determined for the CGU to which the corporate asset
belongs.
An impairment loss is recognized if the carrying amount of an asset or its CGU exceeds its estimated recoverable
amount. Impairment losses are recognized in net income. Impairment losses recognized in respect of CGUs are
allocated first to reduce the carrying amount of any goodwill allocated to the units, and then to reduce the carrying
amounts of the other assets in the unit (group of units) on a pro rata basis.
An impairment loss in respect of goodwill is not reversed. In respect of other non-financial assets, impairment losses
recognized in prior periods are assessed at each reporting date for any indications that the loss has decreased or no
longer exists. An impairment loss is reversed if there has been a fundamental change, since the date of impairment,
which may improve the financial performance of the non-financial asset. An impairment loss is reversed only to the
extent that the asset’s carrying amount does not exceed the carrying amount that would have been determined, net of
depreciation or amortization, if no impairment loss had been recognized.
(t) Foreign currency transactions and translation
Foreign currency transactions
Transactions denominated in currencies other than the Canadian dollar are translated at exchange rates in effect at
the transaction date. At each reporting date, monetary assets and liabilities denominated in foreign currencies are
translated at the exchange rate in effect at the end of the reporting period. Other non-monetary assets and liabilities
are not retranslated unless they are carried at fair value. The resulting foreign exchange gains and losses are
included in net income.
Foreign operations translation
On consolidation, the assets and liabilities of foreign operations that have a functional currency other than Canadian
dollars are translated into Canadian dollars at the exchange rates in effect at the end of the reporting period.
Revenues and expenses are translated at the average monthly exchange rates prevailing during the period. The
resulting translation gains and losses are deferred and included in the cumulative translation account in accumulated
other comprehensive income. The functional currency of the Company’s U.S. operations is the U.S. dollar.
(u) Segment reporting
An operating segment is a component of the Company that engages in business activities from which it may earn
revenues and incur expenses, including revenues and expenses that relate to transactions with any of the Company’s
other components. Transactions between segments are made under terms that approximate market value. The
accounting policies of the segments are the same as those described in note 3 and other relevant notes and are
measured in a manner consistent with that of the consolidated financial statements. The results for all operating
segments, for which discrete financial information is available, are reviewed regularly by the Company’s management
to assess its performance and make decisions about resources to be allocated to the segment.
Segment results that are reported to management include items directly attributable to the segment as well as those
that can be allocated on a reasonable and consistent basis. Unallocated items comprise mainly corporate assets,
head office expenses and income tax assets and liabilities.
Segment capital expenditure is the total cost incurred during the period to acquire or construct PP&E and intangible
assets other than goodwill.
The Company uses significant judgment in identification and aggregation of business segments. In particular, the
Canadian and U.S. water operating segments are aggregated as one reportable segment since both operating
segments offer similar water and wastewater services, the processes to treat water and wastewater are similar in
both operating segments, the customer bases for each operating segment are similar, and both segments operate
under similar rate-regulations.

EPCOR UTILITIES INC. Notes to the Consolidated Financial Statements (Tabular amounts in millions of Canadian dollars unless otherwise indicated) Years ended December 31, 2016 and 2015
16
(v) Standards and interpretations not yet applied
A number of new standards, amendments to standards and interpretations have been issued by the IASB and the
International Financial Reporting Interpretations Committee the application of which is effective for periods beginning
on or after January 1, 2017. Those which may be relevant to the Company and may impact the accounting policies of
the Company are set out below. The Company does not plan to adopt these standards early. The extent of the impact
of adoption of the standards has not yet been determined.
IFRS 9 – Financial Instruments (IFRS 9), which replaces IAS 39 – Financial Instruments: Recognition and
Measurement, eliminates the existing classification of financial assets and requires financial assets to be measured
based on the business model in which they are held and the characteristics of their contractual cash flows. Gains and
losses on re-measurement of financial assets at fair value will be recognized in profit or loss, except for an investment
in an equity instrument which is not held-for-trading. Changes in fair value attributable to changes in credit risk of
financial liabilities measured under the fair value option will be recognized in other comprehensive income with the
remainder of the change recognized in profit or loss unless an accounting mismatch in profit or loss occurs at which
time the entire change in fair value will be recognized in profit or loss. Derivative liabilities that are linked to and must
be settled by delivery of an unquoted equity instrument must be measured at fair value. The impairment model has
also been amended by introducing a new ‘expected credit loss’ model for calculating impairment, and new general
hedge accounting requirements. The effective date for implementation of IFRS 9 has been set for annual periods
beginning on or after January 1, 2018.
IFRS 15 - Revenue from Contracts with Customers (IFRS 15), which replaces IAS 11 - Construction Contracts and
IAS 18 - Revenue and related interpretations, is effective for annual periods commencing on or after January 1, 2018.
IFRS 15 introduces a new single revenue recognition model for contracts with customers and two approaches to
recognizing revenue: at a point in time or over time. The model features a contract-based five-step analysis of
transactions to determine whether, how much and when revenue is recognized. New estimates and judgmental
thresholds have been introduced, which may affect the amount and / or timing of revenue recognized. The
requirements of the standard also apply to the recognition and measurement of gains and losses on sale of some
non-financial assets that are not part of the entity’s ordinary activities.
IFRS 16 – Leases (IFRS 16), which replaces IAS 17 – Leases (IAS 17), is effective for annual periods commencing
on or after January 1, 2019. IFRS 16 combines the existing dual model of operating and finance leases in IAS 17 into
a single lessee model. Under the new single lessee model, a lessee will recognize lease assets and lease liabilities
on the statement of financial position initially measured at the present value of unavoidable lease payments. IFRS 16
will also cause expenses to be higher at the beginning and lower towards the end of a lease, even when payments
are consistent throughout the term. Leases for duration of twelve months or less and leases of low value assets are
exempted from recognition on the statement of financial position. Lessors will continue with a dual lease classification
model and the classification will determine how and when a lessor will recognize lease revenue and what assets will
be recorded.
4. Use of judgments and estimates
The preparation of the Company’s consolidated financial statements in accordance with IFRS requires management to
make judgments in the application of accounting policies, and estimates and assumptions that affect the reported amounts
of income, expenses, assets and liabilities as well as the disclosure of contingent assets and liabilities at the date of the
consolidated financial statements.
(a) Judgments
Information about critical judgments in applying accounting policies that have the most significant effect on the
amounts recognized in the consolidated financial statements are included in notes:
Note 3(c) – Business acquisitions
Note 3(d) – Revenue recognition
Note 3(l) – Service concession arrangements
Note 3(n) – Provisions
Note 3(u) – Segment reporting

EPCOR UTILITIES INC. Notes to the Consolidated Financial Statements (Tabular amounts in millions of Canadian dollars unless otherwise indicated) Years ended December 31, 2016 and 2015
17
(b) Estimates
The Company reviews its estimates and assumptions on an ongoing basis and uses the most current information
available and exercises careful judgment in making these estimates and assumptions. Adjustments to previous
estimates, which may be material, are recorded in the period in which they become known. Actual results may differ
from these estimates.
Assumptions and uncertainties that have a significant risk of resulting in a material adjustment within the next
financial year include:
Revenues
By regulation, electricity wire service providers in Alberta have four months to submit the final electricity load
settlement data after the month in which such electricity was consumed. The data and associated processes and
systems used by the Company to estimate electricity revenues and costs, including unbilled consumption, are
complex. The Company’s estimation procedures will not necessarily detect errors in underlying data provided by
industry participants including wire service providers and load settlement agents.
Fair value measurement
For accounting measures such as determining asset impairments, purchase price allocations for business
combinations, recording financial assets and liabilities, and the recording and disclosure of certain non-financial
assets, the Company is required to estimate the fair value of certain assets or obligations. Estimates of fair value may
be based on readily determinable market values or on depreciable replacement cost or discounted cash flow
techniques employing estimated future cash flows based on a number of assumptions and using an appropriate
discount rate. Financial instruments, other than those classified as loans and receivables and other financial liabilities,
are recorded at fair value which may require the use of estimated future prices.
Deferred taxes
Significant estimation and judgment is required in determining the provision for income taxes. Recognition of deferred
tax assets in respect of deductible temporary differences and unused tax losses and credits is based on
management’s estimation of future taxable profit against which the deductible temporary differences and unused tax
losses and credits can be utilized. The actual utilization of these deductible temporary differences and unused tax
losses and credits may vary materially from the amounts estimated.
5. Revenues and other income
2016 2015
Revenue
Energy and water sales $ 1,268 $ 1,314
Provision of services 600 566
Construction revenues 50 102
Finance lease income 14 14
1,932 1,996
Other income
Interest income on long-term receivable from Capital Power 14 21
Other - 1
14 22
$ 1,946 $ 2,018

EPCOR UTILITIES INC. Notes to the Consolidated Financial Statements (Tabular amounts in millions of Canadian dollars unless otherwise indicated) Years ended December 31, 2016 and 2015
18
6. Expense analysis
2016 2015
Included in staff costs and employee benefits expenses
Post-employment defined contribution plan expense $ 36 $ 36
Post-employment defined benefit plan expense 6 5
Included in depreciation and amortization
Depreciation of property, plant and equipment 168 152
Amortization of intangible assets 19 18
Loss on disposal of assets 2 8
189 178
Included in other administrative expenses
Operating lease expenses 16 15
Lease recoveries through sub-lease (6) (5)
7. Finance expenses
2016 2015
Interest on loans and borrowings $ (117) $ (123)
Capitalized interest (note 15) 5 6
$ (112) $ (117)
8. Income tax expense
2016 2015
Current income tax recovery (expense) $ (4) $ 1
Deferred income tax recovery (expense)
Relating to origination and reversal of temporary differences (11) (25)
Change in tax rates - 13
Recognition of previously unrecognized deferred tax assets 6 8
(5) (4)
Total income tax expense $ (9) $ (3)
Income taxes differ from the amounts that would be computed by applying the federal and provincial income tax rates as
follows:
2016 2015
Income before taxation $ 318 $ 263
Income tax at the statutory rate of 27% (2015 – 26%) (86) (68)
(Increase) decrease resulting from:
Income exempt from income taxes at statutory rates 59 53
Non-taxable amounts 2 2
Change in recognition of deferred tax assets 18 (1)
Change in tax rates on deferred taxes - 13
Effect of higher tax rate in the U.S. (3) (1)
Other 1 (1)
Total income tax expense $ (9) $ (3)
During the year ended December 31, 2015, the Government of Alberta increased the provincial corporate tax rate from
10% to 12% effective July 1, 2015. Accordingly, the change in provincial corporate tax rate increased the Company’s tax

EPCOR UTILITIES INC. Notes to the Consolidated Financial Statements (Tabular amounts in millions of Canadian dollars unless otherwise indicated) Years ended December 31, 2016 and 2015
19
rate for the year ended December 31, 2015, to 26% and for the years 2016 onward to 27%.
9. Cash and cash equivalents
2016 2015
Cash on deposit $ 137 $ 36
Cash equivalents 54 -
$ 191 $ 36
Restricted balances
Under certain agreements between the Company and the Natural Gas Exchange (NGX) for the purchase of electricity
derivative financial instruments, the Company established separate bank accounts through which the settlement of the
electricity derivative financial contracts are processed in conjunction with letters of credit and cash as collateral. As
security for the payment and performance of its obligations, the Company assigned a first ranking security interest on the
balance of these accounts to the NGX. The Company’s use of this cash is restricted to these purposes. At December 31,
2016, $2 million (2015 – $3 million) was held in these bank accounts.
10. Trade and other receivables
2016 2015
Trade receivables $ 179 $ 216
Accrued revenues 125 120
Gross accounts receivable 304 336
Allowance for doubtful accounts (5) (3)
Net accounts receivable 299 333
Income tax recoverable 2 2
Prepaid expenses 6 5
307 340
Current portion of long-term receivables (note 13) 18 280
$ 325 $ 620
Details of the aging of accounts receivable and analysis of the changes in the allowance for doubtful accounts are
provided in note 29.
11. Investment in Capital Power
In these consolidated financial statements, Capital Power refers to Capital Power Corporation and its subsidiaries,
including Capital Power L.P., except where otherwise noted or the context indicates otherwise. Capital Power builds, owns
and operates power plants in North America and manages its related electricity and natural gas portfolios by undertaking
trading and marketing activity.
At December 31, 2015 the Company owned 9,391,000 common shares of Capital Power Corporation representing
approximately 9% of the issued and outstanding common shares of Capital Power Corporation. During the year ended
December 31, 2016, the Company sold 9,141,636 common shares of Capital Power Corporation for net proceeds of $204
million. The Company also reclassified fair value gains of $42 million to net income, representing the realized portion of
fair value gains on available-for-sale investment in Capital Power Corporation previously recognized in other
comprehensive income. At December 31, 2016, the Company owned 249,364 common shares of Capital Power
Corporation.
In January 2017 the Company sold the remaining 249,364 common shares of Capital Power Corporation for net proceeds
of $6 million.

EPCOR UTILITIES INC. Notes to the Consolidated Financial Statements (Tabular amounts in millions of Canadian dollars unless otherwise indicated) Years ended December 31, 2016 and 2015
20
The change in available-for-sale investment in Capital Power is detailed as follows:
2016 2015
Balance, beginning of the year $ 167 $ -
Transfer on reclassification from investment in Capital Power L.P. - 197
Net gain on initial recognition as available-for-sale asset - 30
Fair value gain (loss) recorded in other comprehensive income 43 (60)
Sale of portion of investment (204) -
Balance, end of year $ 6 $ 167
The common shares of Capital Power Corporation are listed on the Toronto Stock Exchange under the symbol CPX. At
December 31, 2016, the quoted market price of the common shares of Capital Power Corporation was $23.23 per share
(2015 – $17.77 per share).
Prior to April 2, 2015, the Company owned 18,841,000 equity accounted limited partnership units of Capital Power L.P.
which were exchanged on April 2, 2015 for an equal number of common shares of Capital Power Corporation. On the
same date, the Company sold 9,450,000 shares and reclassified the remaining 9,391,000 shares as an available-for-sale
investment. Details of gains on equity accounted investment in Capital Power L.P. realized in net income during the year
ended December 31, 2015 are as follows:
2015
Gain on sale of a portion of investment $ 24
Gain on reclassification of investment as available-for-sale asset 36
$ 60
Details of equity share of other comprehensive income of Capital Power L.P., reclassified in net income during the year
ended December 31, 2015 are as follows:
2015
Amount realized on sale of portion of investment1 $ (4)
Amount realized on reclassification of investment as available-for-sale asset2 (5)
$ (9)
1 Net of reclassification of income tax expense of $1 million.
2 Net of reclassification of income tax expense of $1 million.
Subsequent to reclassification of the investment as available-for-sale, the Company determined that the fair value of the
investment in Capital Power Corporation had declined significantly since it was initially reclassified as an available-for-sale
asset. Accordingly, it was concluded that the available-for-sale investment in Capital Power was impaired and as a result,
the Company recognized an impairment and reclassified the accumulated loss of $60 million before tax from other
comprehensive income to net income during the year ended December 31, 2015.
12. Inventories
During the year ended December 31, 2016, $25 million (2015 – $23 million) was expensed to other raw materials and
operating charges.
No significant inventory write-downs were recognized in the years ended December 31, 2016 or 2015. No significant
reversals of previous write-downs were recorded in the years ended December 31, 2016 or 2015.
At December 31, 2016 or 2015, no inventories were pledged as security for liabilities.
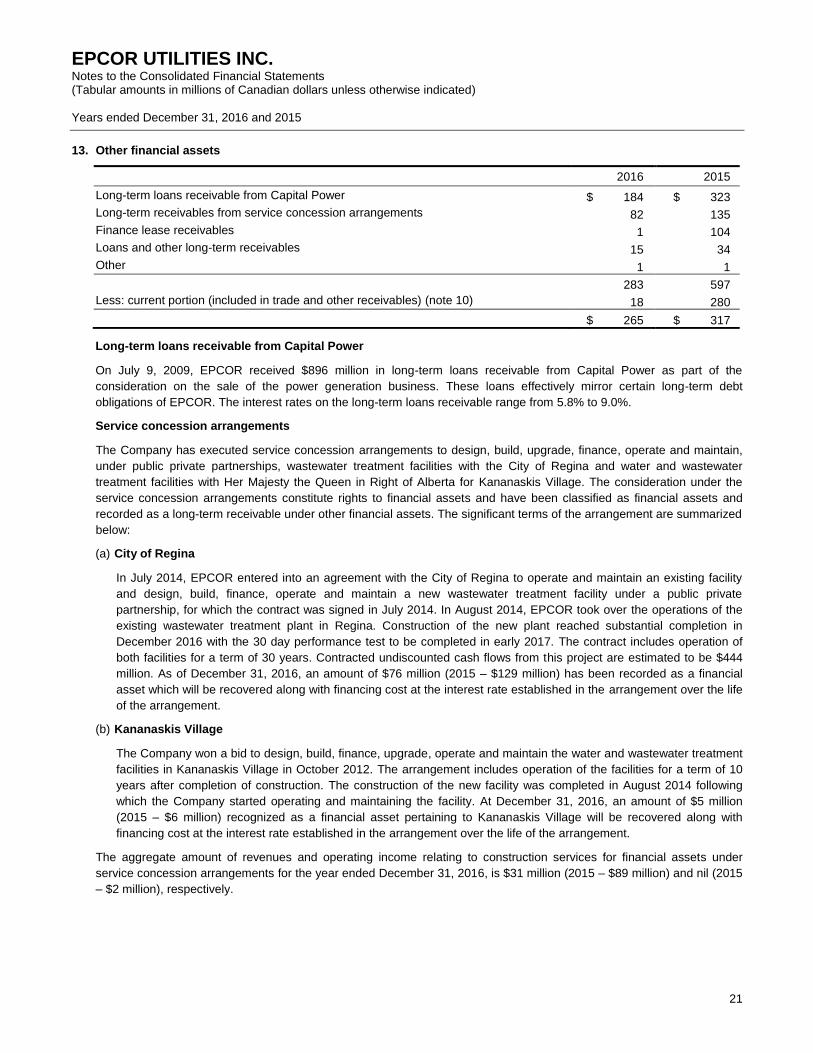
EPCOR UTILITIES INC. Notes to the Consolidated Financial Statements (Tabular amounts in millions of Canadian dollars unless otherwise indicated) Years ended December 31, 2016 and 2015
21
13. Other financial assets
2016 2015
Long-term loans receivable from Capital Power $ 184 $ 323
Long-term receivables from service concession arrangements 82 135
Finance lease receivables 1 104
Loans and other long-term receivables 15 34
Other 1 1
283 597
Less: current portion (included in trade and other receivables) (note 10) 18 280
$ 265 $ 317
Long-term loans receivable from Capital Power
On July 9, 2009, EPCOR received $896 million in long-term loans receivable from Capital Power as part of the
consideration on the sale of the power generation business. These loans effectively mirror certain long-term debt
obligations of EPCOR. The interest rates on the long-term loans receivable range from 5.8% to 9.0%.
Service concession arrangements
The Company has executed service concession arrangements to design, build, upgrade, finance, operate and maintain,
under public private partnerships, wastewater treatment facilities with the City of Regina and water and wastewater
treatment facilities with Her Majesty the Queen in Right of Alberta for Kananaskis Village. The consideration under the
service concession arrangements constitute rights to financial assets and have been classified as financial assets and
recorded as a long-term receivable under other financial assets. The significant terms of the arrangement are summarized
below:
(a) City of Regina
In July 2014, EPCOR entered into an agreement with the City of Regina to operate and maintain an existing facility
and design, build, finance, operate and maintain a new wastewater treatment facility under a public private
partnership, for which the contract was signed in July 2014. In August 2014, EPCOR took over the operations of the
existing wastewater treatment plant in Regina. Construction of the new plant reached substantial completion in
December 2016 with the 30 day performance test to be completed in early 2017. The contract includes operation of
both facilities for a term of 30 years. Contracted undiscounted cash flows from this project are estimated to be $444
million. As of December 31, 2016, an amount of $76 million (2015 – $129 million) has been recorded as a financial
asset which will be recovered along with financing cost at the interest rate established in the arrangement over the life
of the arrangement.
(b) Kananaskis Village
The Company won a bid to design, build, finance, upgrade, operate and maintain the water and wastewater treatment
facilities in Kananaskis Village in October 2012. The arrangement includes operation of the facilities for a term of 10
years after completion of construction. The construction of the new facility was completed in August 2014 following
which the Company started operating and maintaining the facility. At December 31, 2016, an amount of $5 million
(2015 – $6 million) recognized as a financial asset pertaining to Kananaskis Village will be recovered along with
financing cost at the interest rate established in the arrangement over the life of the arrangement.
The aggregate amount of revenues and operating income relating to construction services for financial assets under
service concession arrangements for the year ended December 31, 2016, is $31 million (2015 – $89 million) and nil (2015
– $2 million), respectively.

EPCOR UTILITIES INC. Notes to the Consolidated Financial Statements (Tabular amounts in millions of Canadian dollars unless otherwise indicated) Years ended December 31, 2016 and 2015
22
Finance lease receivables
Approximate future payments to the Company are as follows:
Minimum lease receivable Present value of minimum
lease receivable
2016 2015 2016 2015
Within one year $ - $ 110 $ - $ 103
After one year but not more than five years 1 - 1 -
More than five years - 1 - 1
Less: unearned finance income - (7) - -
$ 1 $ 104 $ 1 $ 104
In 2009, the Company acquired potable water and wastewater treatment plant assets for approximately $100 million and
agreed to lease the assets back to Suncor for a 20-year term after which Suncor had the option to purchase the assets
from the Company for a specified price. As part of the arrangement, the Company also agreed to construct additional
water and wastewater treatment plant assets for Suncor and to operate and maintain the original assets acquired and
leased back to Suncor and the additional constructed assets over the 20-year lease term.
In February 2015, Suncor gave notice to the Company that it would exercise its contractual rights to buy back the leased
assets and terminate the related financing and operating agreements. In accordance with the terms of the notice, the
transfer of assets and operations back to Suncor was completed by August 2016.
14. Deferred tax assets / liabilities
Deferred tax assets are attributable to the following:
2016 2015
Losses carried forward $ 83 $ 78
Investment in partnerships 6 5
Canadian resource expenditures 8 8
Provisions 8 8
Deferred revenue 108 106
Other items 16 -
Tax assets 229 205
Set off by tax liabilities (145) (128)
Net tax assets $ 84 $ 77
Deferred tax liabilities are attributable to the following:
2016 2015
Other financial assets $ 1 $ 3
Intangible assets and goodwill 18 17
Property, plant and equipment 172 142
Other items - 1
Tax liabilities 191 163
Set off by tax assets (145) (128)
Net tax liabilities $ 46 $ 35

EPCOR UTILITIES INC. Notes to the Consolidated Financial Statements (Tabular amounts in millions of Canadian dollars unless otherwise indicated) Years ended December 31, 2016 and 2015
23
The changes in temporary differences during the years ended December 31, 2016 and 2015 were as follows:
Balance,
beginning
of 2016
Recognized
in net
income
Recognized on
business
acquisitions
Foreign currency valuation
adjustment and other
Balance,
end of
2016
Losses carried forward $ 78 $ 5 $ - $ - $ 83
Investment in partnerships 5 1 - - 6
Canadian resource expenditures 8 - - - 8
Provisions 8 - - - 8
Deferred revenue 106 4 1 (3) 108
Other financial assets (3) 2 - - (1)
Intangible assets and goodwill (17) (4) 3 - (18)
Property, plant and equipment (142) (11) (22) 3 (172)
Other items (1) (2) 18 1 16
$ 42 $ (5) $ - $ 1 $ 38
Balance,
beginning
of 2015
Recognized
in net
income
Recognized
in other
comprehensive
income, net of re-classes to net income
Foreign currency valuation
adjustment and other
Balance,
end of
2015
Losses carried forward $ 78 $ (2) $ - $ 2 $ 78
Investment in partnerships (4) 7 2 - 5
Canadian resource expenditures 7 1 - - 8
Provisions - 1 - 7 8
Deferred revenue 78 12 - 16 106
Other financial assets - - - (3) (3)
Intangible assets and goodwill (11) (3) - (3) (17)
Property, plant and equipment (103) (18) - (21) (142)
Other items 5 (2) - (4) (1)
$ 50 $ (4) $ 2 $ (6) $ 42
The Company has the following deductible temporary differences for which no deferred tax assets have been recognized:
2016 2015
Non-capital losses $ 106 $ 125
Capital losses 280 265
Other deductible temporary differences 46 115
The Company also has taxable temporary differences of $174 million (2015 - $155 million), associated with investments in
subsidiaries, for which no deferred tax liability has been recognized. In addition, no deferred tax liability has been
recognized in respect of unremitted earnings of subsidiaries as the Company is in a position to control the timing of the
reversal of temporary difference and it is probable that such differences will not be reversed in the foreseeable future.
The non-capital losses expire between the years 2028 and 2036.
Deferred tax assets have been recognized to the extent that it is probable that taxable income will be available against
which the deductible temporary difference can be utilized. The Company has recognized deferred tax assets in the

EPCOR UTILITIES INC. Notes to the Consolidated Financial Statements (Tabular amounts in millions of Canadian dollars unless otherwise indicated) Years ended December 31, 2016 and 2015
24
amount of $84 million (2015 – $77 million), the utilization of which is dependent on future taxable profits in excess of the
profits arising from the reversal of existing taxable temporary differences. The recognition of these deferred tax assets is
based on taxable income forecasts that incorporate existing circumstances that will result in positive taxable income
against which non-capital loss carry-forwards can be utilized as well as management’s intention to implement specific
income tax planning strategies that will allow for the offset of remaining deductible temporary differences against future
earnings of taxable entities within the consolidated group.
15. Property, plant and equipment
Construction
work in
progress Land
Water
treatment &
distribution
Electricity
transmission
& distribution
Retail
systems &
equipment
Corporate
information
systems &
other Total
Cost
Balance, beginning of 2016 $ 139 $ 55 $ 3,456 $ 2,235 $ 3 $ 55 $ 5,943
Additions1 472 1 74 3 - 4 554
Additions through business acquisitions - - 71 - - - 71
Disposals and retirements - (8) (14) (22) (1) (4) (49)
Transfers into service (453) - 202 249 - 2 -
Transfers - - - 1 - - 1
Foreign currency
valuation adjustments (1) - (24) - - - (25)
Balance, end of 2016 157 48 3,765 2,466 2 57 6,495
Accumulated depreciation
Balance, beginning of 2016 - - 770 580 2 23 1,375
Depreciation - - 92 70 - 6 168
Disposals and retirements - - (10) (13) (1) (4) (28)
Foreign currency
valuation adjustments - - (3) - - - (3)
Balance, end of 2016 - - 849 637 1 25 1,512
Net book value, end of 2016 $ 157 $ 48 $ 2,916 $ 1,829 $ 1 $ 32 $ 4,983

EPCOR UTILITIES INC. Notes to the Consolidated Financial Statements (Tabular amounts in millions of Canadian dollars unless otherwise indicated) Years ended December 31, 2016 and 2015
25
Construction
work in
progress Land
Water
treatment &
distribution
Electricity
transmission
& distribution
Retail
systems &
equipment
Corporate
information
systems &
other Total
Cost
Balance, beginning of 2015 $ 146 $ 55 $ 3,064 $ 2,023 $ 3 $ 82 $ 5,373
Additions1 439 - 52 7 - 4 502
Disposals and retirements - (1) (14) (14) - (32) (61)
Disposals through divesture2 (6) - (20) - - - (26)
Transfers into service (447) - 229 217 - 1 -
Transfers - - - 2 - - 2
Foreign currency
valuation adjustments 7 1 145 - - - 153
Balance, end of 2015 139 55 3,456 2,235 3 55 5,943
Accumulated depreciation
Balance, beginning of 2015 - - 686 526 1 48 1,261
Depreciation - - 82 62 1 7 152
Disposals and retirements - - (10) (8) - (32) (50)
Disposals through divesture2 - - (7) - - - (7)
Foreign currency
valuation adjustments - - 19 - - - 19
Balance, end of 2015 - - 770 580 2 23 1,375
Net book value, end of 2015 $ 139 $ 55 $ 2,686 $ 1,655 $ 1 $ 32 $ 4,568
1 Additions include non-cash contributed assets of $65 million (2015 – $62 million).
2 As per the terms of an agreement with the City of White Rock, the Company sold the White Rock utility operations to
the City of White Rock.
Borrowing costs capitalized during the year ended December 31, 2016, were $5 million (2015 – $6 million) (note 7). The
weighted average rates used to determine the borrowing costs eligible for capitalization ranged from 4.21% to 5.84%
(2015 – 3.91% to 5.78%).
There are no security charges over the Company’s property, plant and equipment.

EPCOR UTILITIES INC. Notes to the Consolidated Financial Statements (Tabular amounts in millions of Canadian dollars unless otherwise indicated) Years ended December 31, 2016 and 2015
26
16. Intangible assets and goodwill
Goodwill
Customer
rights
Other
rights CCN Software Total
Cost
Balance, beginning of 2016 $ 50 $ 51 $ 66 $ 92 $ 167 $ 426
Additions through acquisition - - - - 6 6
Additions through business acquisitions 3 - 13 - - 16
Internally generated additions - - - - 1 1
Disposals and retirements - - - - (6) (6)
Change in construction
work in progress - - - - 7 7
Transfers - - - - (1) (1)
Foreign currency
translation adjustments (1) - (1) (3) - (5)
Balance, end of 2016 52 51 78 89 174 444
Accumulated amortization
Balance, beginning of 2016 - 38 6 - 94 138
Amortization - 3 2 - 14 19
Disposals and retirements - - - - (6) (6)
Balance, end of 2016 - 41 8 - 102 151
Net book value, end of 2016 $ 52 $ 10 $ 70 $ 89 $ 72 $ 293
Goodwill
Customer
rights
Other
rights CCN Software Total
Cost
Balance, beginning of 2015 $ 42 $ 51 $ 54 $ 75 $ 183 $ 405
Additions through acquisition - - 7 3 25 35
Internally generated additions - - - - 1 1
Disposals and retirements - - - - (34) (34)
Change in construction
work in progress - - (3) - (6) (9)
Transfers - - - - (2) (2)
Foreign currency
translation adjustments 8 - 8 14 - 30
Balance, end of 2015 50 51 66 92 167 426
Accumulated amortization
Balance, beginning of 2015 - 36 4 - 111 151
Amortization - 2 1 - 15 18
Disposals and retirements - - - - (32) (32)
Foreign currency
translation adjustments - - 1 - - 1
Balance, end of 2015 - 38 6 - 94 138
Net book value, end of 2015 $ 50 $ 13 $ 60 $ 92 $ 73 $ 288

EPCOR UTILITIES INC. Notes to the Consolidated Financial Statements (Tabular amounts in millions of Canadian dollars unless otherwise indicated) Years ended December 31, 2016 and 2015
27
There are no security charges over the Company's intangible assets. Included in customer rights are the Company’s
customer rights to operate in the FortisAlberta service territory which expire on December 31, 2020.
For purposes of impairment testing, CCN has been allocated to cash-generating units as follows:
2016 2015
Cash generating unit:
Water segment – Water Arizona $ 86 $ 88
Water segment – Others 3 4
$ 89 $ 92
For purposes of impairment testing, goodwill acquired through business combinations has been allocated to cash-
generating units as follows:
2016 2015
Cash generating unit:
Water segment – Chaparral $ 12 $ 12
Water segment – Water Arizona 31 31
Water segment – Others 9 7
$ 52 $ 50
The most recent reviews of goodwill were performed in the fourth quarter for each cash generating unit. Management
reviewed conditions since the last review was performed and determined that no circumstances occurred since then to
require a revision to the assumptions used in the value in use calculations.
The recoverable amount of the regulated cash generating units was determined based on a value in use calculation using
cash flow projections from financial budgets prepared by senior management covering a twenty year period. The
recoverable amount for the non-regulated cash generating unit was calculated using the projected cash flows for the life of
the project. The projections were based on cash flow projections for the most recent long-term plan, which covered
periods up to five years, with the projections for the balance of the period extrapolated using growth rates between 1.90%
and 4.43% (2015 – between 1.80% and 2.63%) that are in line with the long-term average growth rate for the industry.
The pre-tax discount rates applied to cash flow projections are as follows:
2016 2015
Cash generating unit:
Water segment – Chaparral 8.96% 8.46%
Water segment – Water Arizona 6.39% 6.23%
Water segment – Others 7.06% 6.34%
Key assumptions used in value-in-use calculations
The future cash flows of the underlying businesses are relatively stable since they relate primarily to ongoing water supply
in a rate-regulated environment. In the case of cash generating units operating under a rate-regulated environment,
revenues are set by the regulators to cover operating costs and to earn a return on the rate base, which is set at the
regulator’s approved weighted average cost of capital for the underlying utility. For non-regulated cash generating units,
revenues are estimated based on long-term water supply contracts executed with the customers, which include escalation
in rates and volumes over the term of the contracts.
The calculation of value in use for the cash generating units is most sensitive to the following assumptions:
Discount rates
The discount rates used were estimated based on the weighted average cost of capital for the cash generating unit,
which, in the case of rate-regulated businesses, are the approved rate of return on capital allowed by the regulators.
These rates were further adjusted to reflect the market assessment of any risk specific to the cash generating unit for
which future estimates of cash flows have not been adjusted.
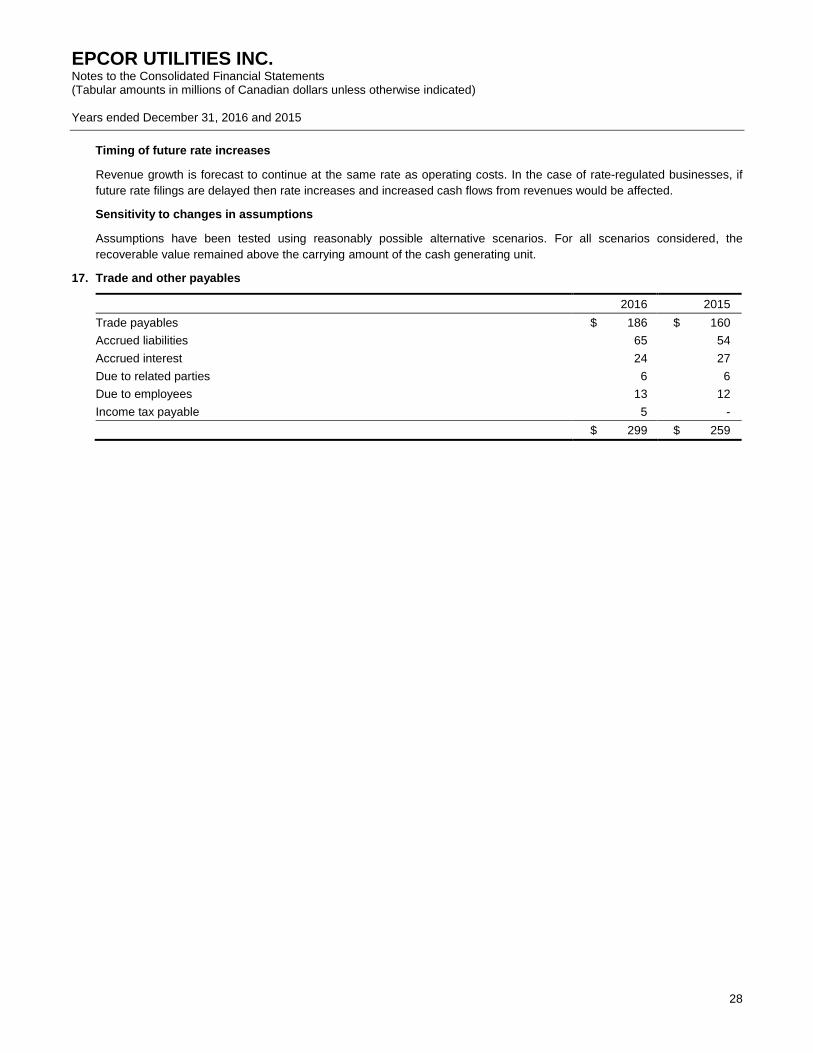
EPCOR UTILITIES INC. Notes to the Consolidated Financial Statements (Tabular amounts in millions of Canadian dollars unless otherwise indicated) Years ended December 31, 2016 and 2015
28
Timing of future rate increases
Revenue growth is forecast to continue at the same rate as operating costs. In the case of rate-regulated businesses, if
future rate filings are delayed then rate increases and increased cash flows from revenues would be affected.
Sensitivity to changes in assumptions
Assumptions have been tested using reasonably possible alternative scenarios. For all scenarios considered, the
recoverable value remained above the carrying amount of the cash generating unit.
17. Trade and other payables
2016 2015
Trade payables $ 186 $ 160
Accrued liabilities 65 54
Accrued interest 24 27
Due to related parties 6 6
Due to employees 13 12
Income tax payable 5 -
$ 299 $ 259

EPCOR UTILITIES INC. Notes to the Consolidated Financial Statements (Tabular amounts in millions of Canadian dollars unless otherwise indicated) Years ended December 31, 2016 and 2015
29
18. Loans and borrowings
Effective
interest rate 2016 2015
Long-term loans and borrowings
Obligation to the City, net of sinking fund
Due in 1-5 years at 8.50% (2015 – 8.50%) 11.04% $ 13 $ 19
Due in 6-10 years at 7.01% (2015 – 7.01%) 7.01% 14 16
Due in 16-25 years at 5.20% (2015 – 5.20%) 5.36% 64 70
91 105
Public debentures
At 6.75%, due in 2016 6.94% - 130
At 5.80%, due in 2018 6.02% 400 400
At 6.80%, due in 2029 7.05% 150 150
At 5.65%, due in 2035 5.88% 200 200
At 6.65%, due in 2038 6.83% 200 200
At 5.75%, due in 2039 5.88% 200 200
At 4.55%, due in 2042 4.65% 300 300
1,450 1,580
Private debt notes
Bonds at 3.74%, due in 2021 3.80% 185 191
Bonds at 5.00%, due in 2041 5.08% 150 155
Bonds at 3.94% due in 2029 4.01% 1 -
Bonds at 3.63% due in 2041 3.70% 54 -
390 346
1,931 2,031
Other borrowings
Deferred debt issue costs (11) (12)
Total long-term loans and borrowings 1,920 2,019
Short-term loans – commercial paper - 98
Total Loans and borrowings 1,920 2,117
Less: current portion 15 242
$ 1,905 $ 1,875
Obligation to the City
Debentures were issued, on behalf of the Company, pursuant to the City Bylaw authorization. The outstanding debentures
are a direct, unconditional obligation of the City. The Company’s obligation to the City matches the City’s obligation
pursuant to the debentures. The 8.50% debentures, maturing in the year 2018 and totaling $13 million (2015 - $19 million)
rank as subordinated debt. In the event of default on other interest obligations, the coupon and sinking fund payments on
the subordinated debt may be deferred for a period of up to five years, not exceeding the maturity date. If still in default at
the end of five years, all unpaid payments plus accrued interest thereon may be repaid by issuing common shares to the
City. Except for the subordinated debt, the obligation to the City will rank at least equal to all future debt that may be
issued by the Company.
The Company makes annual contributions into the sinking fund of the City pertaining to certain debenture issues. These
payments constitute effective settlement of the respective debt as the sinking fund accumulates to satisfy the underlying
debenture maturity. For any specific City debenture sinking fund requirements, the payment obligation ceases on maturity
of the debenture. The sinking fund is measured at fair value and presented net of its related debenture.

EPCOR UTILITIES INC. Notes to the Consolidated Financial Statements (Tabular amounts in millions of Canadian dollars unless otherwise indicated) Years ended December 31, 2016 and 2015
30
Public debentures
The public debentures are unsecured direct obligations of the Company and, subject to statutory preferred exemptions,
rank equally with all other unsecured and unsubordinated indebtedness of the Company. The debentures are redeemable
by the Company prior to maturity at the greater of par and a price specified under the terms of the debenture.
Private debt notes
During the year, the Company issued US$40 million private debt notes maturing in 2041 at an interest rate of 3.63%. The
private debt notes were issued in U.S. dollars, are unsecured direct obligations of the Company and, subject to statutory
preferred exemptions, rank equally with all other unsecured and unsubordinated indebtedness of the Company. The
private debt notes are redeemable by the Company prior to maturity at the greater of par and a price specified under the
terms of the private debt notes.
Commercial paper and bankers’ acceptances
In the normal course of business, the Company provides financial support and performance assurances including
guarantees, letters of credit and surety bonds to third parties in respect of its subsidiaries. Bank lines of credit are
unsecured and are available to the Company up to an amount of $575 million (2015 – $575 million), comprised of
committed amounts of $550 million (2015 – $550 million) and uncommitted amounts of $25 million (2015 – $25 million) as
described in note 29. Letters of credit totaling $73 million (2015 – $48 million) have been issued under these facilities to
meet the credit requirements of electricity market participants and to meet conditions of certain service agreements.
Amounts borrowed and letters of credit issued, if any, under these facilities which are not payable within one year are
classified as non-current loans and borrowings.
The Company’s commercial paper program has an authorized capacity of $350 million (2015 – $350 million). At
December 31, 2016 commercial paper totaling nil (2015 – $98 million) was outstanding.
19. Deferred revenue
2016 2015
Balance, beginning of year $ 991 $ 870
Contributions received 83 74
Revenue recognized (37) (24)
Transfers from provisions 10 39
Recognized on business acquisition 1 -
Transfer on sale of business - (5)
Foreign currency valuation adjustments (7) 38
Other - (1)
1,041 991
Less: current portion 25 32
Balance, end of year $ 1,016 $ 959
Contributions received include non-cash contributions of $62 million (2015 – $39 million).
The deferred revenue balance as of December 31, 2015 has been recast by $39 million (note 20).
20. Provisions
2016 2015
Contributions from customers and developers $ 21 $ 23
Employee benefits 89 98
Other 1 -
111 121
Less: current portion 25 37
$ 86 $ 84

EPCOR UTILITIES INC. Notes to the Consolidated Financial Statements (Tabular amounts in millions of Canadian dollars unless otherwise indicated) Years ended December 31, 2016 and 2015
31
Contributions from customers and developers
2016 2015
Balance, beginning of year $ 23 $ 35
Contributions received 13 22
Transfers to deferred revenue (10) (39)
Contributions refunded (3) (3)
Foreign currency valuation adjustment (2) 8
Balance, end of year $ 21 $ 23
Contributions received include non-cash contributions of $3 million (2015 – $23 million).
During the fourth quarter of 2016, the Company determined that certain contributions received from customers and
developers, which had previously been recognized as provisions throughout each quarter in 2016 and at December 31,
2015, were no longer refundable at the respective reporting dates. Accordingly, the Company has reclassified $10 million
(2015 recast $39 million) from provisions to deferred revenue in the consolidated statements of financial position.
Employee benefits
2016 2015
Other short-term employee benefit obligation $ 18 $ 29
Post-employment benefit obligation 51 48
Other long-term employee benefit obligation 20 21
$ 89 $ 98
Post-employment benefits
Total cash payments for pension benefits for the year ended December 31, 2016, consisting of cash contributed by the
Company to the LAPP, other defined contribution and benefit plans, and cash payments directly to beneficiaries for their
unfunded pension plan, were $39 million (2015 – $39 million). Total contributions expected to be paid in 2017 to the
LAPP, other defined contribution and benefit plans, and cash payments directly to beneficiaries for their unfunded pension
plan are $39 million.
Other long-term employee benefits
Other long-term employee benefits consist mainly of obligations for benefits provided to employees on long-term disability
leaves.
21. Derivatives
Derivative financial instruments are held for the purpose of electricity price risk management and interest rate risk
management.
The derivative financial instruments used for risk management purposes as described in note 29 consist of the following
assets and liabilities:
Derivative financial liabilities
2016 2015
Electricity price forward contracts $ - $ 2
Interest rate swaps (note 29) - 10
$ - $ 12
Current $ - $ 2
Non-current - 10
$ - $ 12

EPCOR UTILITIES INC. Notes to the Consolidated Financial Statements (Tabular amounts in millions of Canadian dollars unless otherwise indicated) Years ended December 31, 2016 and 2015
32
Electricity price forward contracts
The forward contracts used to mitigate electricity price risk management consist of the following:
2016 2015
Derivative instruments liabilities
Fair value $ 1 $ 9
Cash paid to counterparty (1) (7)
Net fair value $ - $ 2
Net notional buys
Terawatt hours of electricity 1.1 1.2
Range of contract terms (in years) 0.1 to 0.3 0.1 to 0.3
The fair value of electricity derivative financial instruments reflects changes in the forward electricity prices, net of cash
payments to or from the counterparty. During the course of the contract, daily payments are made to or received from the
counterparty to settle the fair value of the contracts.
Fair value is determined based on quoted exchange index prices by reference to bid or asking price, as appropriate, in
active markets. Fair value amounts reflect management’s best estimates using external readily observable market data
such as forward electricity prices. It is possible that the assumptions used in establishing fair value amounts will differ from
future outcomes and the impact of such variations could be material.
Changes in fair value on electricity derivative financial instruments are recorded in energy purchases and system access
fees.
22. Other liabilities
2016 2015
Customer deposits $ 26 $ 27
Contingent consideration 36 -
Leasehold inducements 10 11
72 38
Less: current portion 26 27
$ 46 $ 11
Contingent consideration
The contingent consideration is the present value of the Company’s commitment to pay Blue Water Project 130 L.P. (Blue
Water) approximately US$34 million on occurrence of future events (note 25). The Company is reasonably certain that it
will be required to settle this commitment by way of cash payments and has accordingly recognized the liability for
contingent consideration in the consolidated statements of financial position. The change in the liability for contingent
consideration is as follows:
2016
Contingent consideration recognized on business acquisition $ 34
Foreign currency valuation adjustments 2
$ 36

EPCOR UTILITIES INC. Notes to the Consolidated Financial Statements (Tabular amounts in millions of Canadian dollars unless otherwise indicated) Years ended December 31, 2016 and 2015
33
23. Share capital
Authorized shares
Unlimited number of voting common shares without nominal or par value.
Issued shares
Three common shares to the City.
24. Accumulated other comprehensive income
Cash flow hedges
This comprises the effective portion of the cumulative net change in the fair value of cash flow hedging instruments related
to hedged transactions that had not yet occurred prior to the disposal of the power generation business in 2009.
Consequent to the partial sell down of the equity accounted investment in Capital Power L.P. and reclassification of the
remaining investment as available-for-sale asset in the year ended December 31, 2015, the Company reclassified and
realized the remaining portion of cash flow hedging instruments in net income.
Investment in Capital Power
The investment in Capital Power was comprised of the Company’s equity share in other comprehensive income and loss
of Capital Power L.P. Consequent to the partial sell down of the equity accounted investment in Capital Power L.P. and
reclassification of remaining investment as available-for-sale asset in the year ended December 31, 2015, the Company
reclassified and realized the remaining portion of its share of other comprehensive income from Capital Power L.P. in net
income.
Available-for-sale financial assets
This comprises the cumulative net change in the fair value of the Company’s beneficial interest in the sinking fund and
investment in Capital Power Corporation, until the investments are derecognized or impaired.
Cumulative translation account
The cumulative translation account represents the cumulative portion of gains and losses on retranslation of foreign
operations that have a functional currency other than Canadian dollars. The cumulative deferred gain or loss on the
foreign operation is reclassified to net income only on disposal of the foreign operation.
Employee benefits account
The employee benefits account represents the cumulative impact of actuarial gains and losses, and return on plan assets
excluding interest income from the Company’s defined benefit pension plans.
25. Business acquisitions
Blue Water 130 Pipeline
On August 19, 2016, the Company completed the acquisition of the assets of Blue Water Project 130 L.P. (Blue Water)
and Cross County Water Supply Corporation (CCWSC) through its wholly owned U.S. subsidiaries EPCOR 130 Project
Inc. and 130 Regional Water Supply Corporation respectively for total consideration of $82 million (US$64 million).
The assets acquired from Blue Water and CCWSC include an 85 kilometer (53 mile) water supply pipeline, near Austin,
Texas, U.S., with designed capacity of nearly 18 million gallons per day along with groundwater well production systems
and long term wholesale water supply agreements.

EPCOR UTILITIES INC. Notes to the Consolidated Financial Statements (Tabular amounts in millions of Canadian dollars unless otherwise indicated) Years ended December 31, 2016 and 2015
34
The purchase price was allocated to the assets acquired and liabilities assumed based on their estimated fair values on
the date of acquisition, in Canadian dollars as follows:
2016
Fair value of net assets acquired:
Intangible assets $ 13
Goodwill 2
Property, plant and equipment 68
Deferred revenue (1)
Net assets acquired at fair value $ 82
Consideration:
Cash $ 48
Contingent consideration 34
Total consideration $ 82
To fund the acquisition, the Company issued US$40 million private debt notes (note 18).
The intangible assets of $13 million consist of the right to receive groundwater up to the maximum capacity of the pipeline
for a period of at least 99 years.
The goodwill recognized at fair value of $2 million includes the value of the expected benefits to the Company by providing
a commercial platform to develop other similar projects and future cost synergies which may result from the Company’s
expanded operations in the State of Texas, U.S. The goodwill will be deductible for income tax purposes.
Contingent consideration with a fair value of $34 million was recognized at the date of acquisition. The contingent
consideration consists of the Company’s commitment to pay Blue Water (i) a fee of up to US$32 million based on securing
newly executed long term contracts for the supply of water and (ii) US$2 million upon execution of certain pending
agreements with third parties, being facilitated by Blue Water. There is no time limit related to the contingent
consideration. These amounts are included within other liabilities on the consolidated statements of financial position.
The transaction has been accounted for using the acquisition method in conformity with IFRS 3 Business Combinations
with the results of operations included in the consolidated financial statements from the date of acquisition. Total revenue
and net income included in the consolidated statements of comprehensive income since the date of acquisition to
December 31, 2016 was $1 million and nil respectively. The consolidated statements of comprehensive income up to
December 31, 2016 would have included estimated revenue and net income of $4 million and nil respectively had the
acquisition of assets occurred on January 1, 2016.
Management used assumptions and estimates about future events in the determination of fair values. The assumptions
and estimates with respect to the determination of the fair value of PPE, intangible assets and contingent consideration
required the most judgment. Based on those assumptions and estimates the purchase price was allocated to the identified
assets and liabilities including goodwill and contingent consideration. The fair value was estimated by applying standard
valuation techniques. The fair value measurement is based on significant inputs which are not observable in the market.
The key assumptions in determination of fair value included the discount rate, future growth rates and expected execution
of new contracts for the supply of water. The allocation of the purchase price was internally determined based on the
relative fair values of the assets and liabilities. Goodwill was estimated based on the applicable incremental benefits of the
acquisition. The fair value of contingent consideration was based on management’s expectation of execution of new long-
term water supply contracts with customers and the execution of pending agreements, discounted to their present value.
Willow Valley Water Company
On May 9, 2016, the Company completed the acquisition of the regulated water utility assets of Willow Valley Water
Company, providing water services in the Bullhead City area of Arizona, U.S., for cash consideration of $3 million (US$2
million).
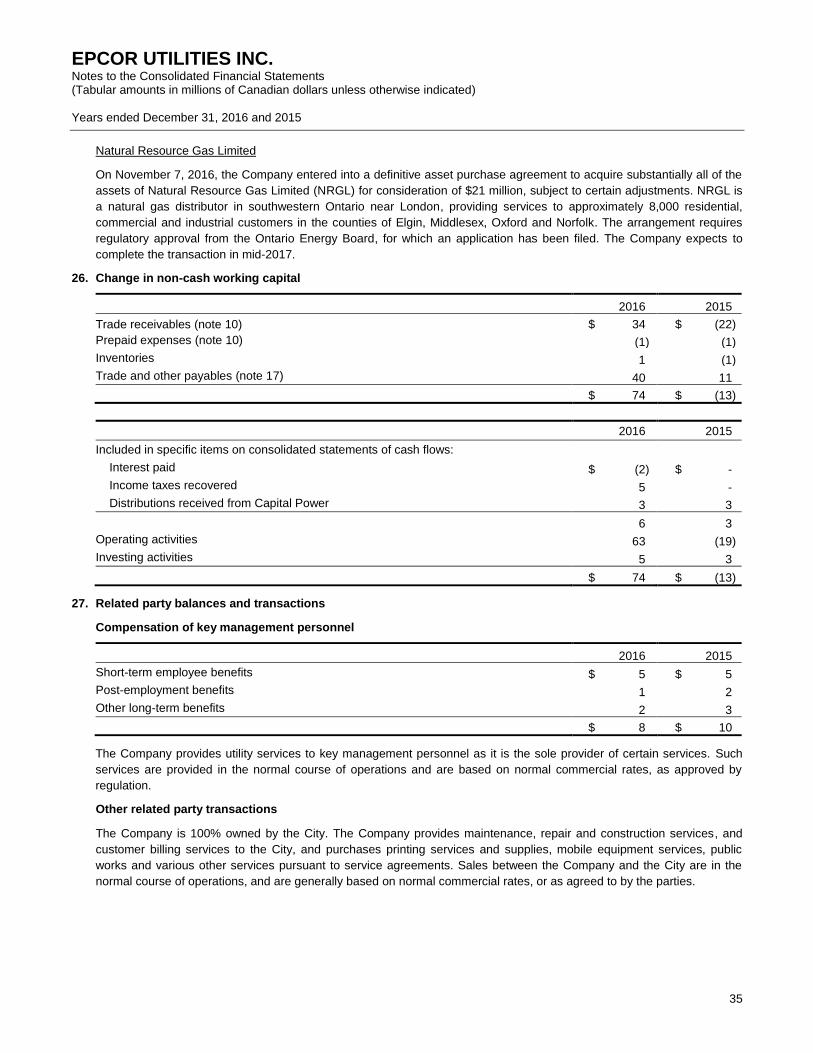
EPCOR UTILITIES INC. Notes to the Consolidated Financial Statements (Tabular amounts in millions of Canadian dollars unless otherwise indicated) Years ended December 31, 2016 and 2015
35
Natural Resource Gas Limited
On November 7, 2016, the Company entered into a definitive asset purchase agreement to acquire substantially all of the
assets of Natural Resource Gas Limited (NRGL) for consideration of $21 million, subject to certain adjustments. NRGL is
a natural gas distributor in southwestern Ontario near London, providing services to approximately 8,000 residential,
commercial and industrial customers in the counties of Elgin, Middlesex, Oxford and Norfolk. The arrangement requires
regulatory approval from the Ontario Energy Board, for which an application has been filed. The Company expects to
complete the transaction in mid-2017.
26. Change in non-cash working capital
2016 2015
Trade receivables (note 10) $ 34 $ (22)
Prepaid expenses (note 10) (1) (1)
Inventories 1 (1)
Trade and other payables (note 17) 40 11
$ 74 $ (13)
2016 2015
Included in specific items on consolidated statements of cash flows:
Interest paid $ (2) $ -
Income taxes recovered 5 -
Distributions received from Capital Power 3 3
6 3
Operating activities 63 (19)
Investing activities 5 3
$ 74 $ (13)
27. Related party balances and transactions
Compensation of key management personnel
2016 2015
Short-term employee benefits $ 5 $ 5
Post-employment benefits 1 2
Other long-term benefits 2 3
$ 8 $ 10
The Company provides utility services to key management personnel as it is the sole provider of certain services. Such
services are provided in the normal course of operations and are based on normal commercial rates, as approved by
regulation.
Other related party transactions
The Company is 100% owned by the City. The Company provides maintenance, repair and construction services, and
customer billing services to the City, and purchases printing services and supplies, mobile equipment services, public
works and various other services pursuant to service agreements. Sales between the Company and the City are in the
normal course of operations, and are generally based on normal commercial rates, or as agreed to by the parties.

EPCOR UTILITIES INC. Notes to the Consolidated Financial Statements (Tabular amounts in millions of Canadian dollars unless otherwise indicated) Years ended December 31, 2016 and 2015
36
The following summarizes the Company’s related party transactions with the City:
2016 2015
Consolidated Statements of Comprehensive Income
Revenues (a) $ 94 $ 87
Other raw materials and operating charges (b) 9 9
Franchise fees and property taxes (c) 92 90
Finance expense (d) 9 10
(a) Included within revenues are electricity and water sales of $4 million (2015 – $4 million), service revenue including
the provision of maintenance, repair and construction services of $82 million (2015 – $75 million) and customer billing
services of $8 million (2015 – $8 million).
(b) Includes certain costs of printing services and supplies, mobile equipment services, public works and various other
services pursuant to service agreements.
(c) Composed of franchise fees of $57 million at 0.39 cents per kilowatt hour of electric distribution sales volume for
direct connect customers and 0.76 cents per kilowatt hour for all other customers (2015– $55 million at 0.72 cents per
kilowatt hour for all customers), franchise fees of $20 million at 8% (2015 – $20 million at 8%) of qualifying revenues
of water services and waste water services, and property taxes of $15 million (2015 – $15 million) on properties
owned within the City municipal boundaries.
(d) Composed of interest expense on the obligation to the City at interest rates ranging from 5.20% to 8.50% (2015 –
5.20% to 8.50%).
The following summarizes the Company’s related party balances with the City:
2016 2015
Consolidated Statements of Financial Position
Trade and other receivables $ 34 $ 50
Property, plant and equipment (e) 5 4
Trade and other payables (f) 8 7
Loans and borrowings (note 19) 90 105
Deferred revenue (g) 2 1
(e) Costs of capital construction for electric and water distribution infrastructure.
(f) Includes nil (2015 – $1 million) for drainage and construction services provided by the City.
(g) Contributions received for capital projects.

EPCOR UTILITIES INC. Notes to the Consolidated Financial Statements (Tabular amounts in millions of Canadian dollars unless otherwise indicated) Years ended December 31, 2016 and 2015
37
28. Financial instruments
Classification
The classification of the Company’s financial instruments at December 31, 2016 and 2015 is summarized as follows:
Classification
Fair value
hierarchy
Fair value
through
profit or loss
Loans and
receivables
Other
financial
liabilities
Available-
for-sale
Measured at fair value
Available-for-sale investment
in Capital Power (note 11)
X Level 1
Beneficial interest in
sinking fund (note 18)
X Level 1
Derivatives (note 21)
Financial electricity
purchase contracts – designated X Level 1
Interest rate swaps – designated X Level 2
Other liabilities (note 22)
Contingent consideration – designated X Level 3
Measured at amortized cost
Cash and cash equivalents (note 9) X Level 1
Trade and other receivables (note 10) X Level 3
Other financial assets (note 13) X Level 2
Trade and other payables (note 17) X Level 3
Debentures and borrowings (note 18) X Level 2
Other liabilities (note 22)
Customer deposits X Level 3
Fair value
The carrying amounts of cash and cash equivalents, trade and other receivables, current portion of other financial assets,
trade and other payables and certain other liabilities (including customer deposits) approximate their fair values due to the
short-term nature of these financial instruments.
The carrying amounts and fair values of the Company’s remaining financial assets and liabilities are as follows:
2016 2015
Carrying
amount
Fair
value
Carrying
Amount
Fair
value
Available-for-sale investment in Capital Power (note 11) $ 6 $ 6 $ 167 $ 167
Non-current portion of other financial assets (note 13)1 264 275 316 330
Loans and borrowings (note 18)
Debentures and borrowings 2,007 2,328 2,198 2,527
Beneficial interest in sinking fund (87) (87) (81) (81)
Derivatives (note 21) - - 12 12
Other liabilities (note 22)
Contingent consideration 36 36 - -
1 Excluding finance lease receivables $1 million (2015 – $1 million).

EPCOR UTILITIES INC. Notes to the Consolidated Financial Statements (Tabular amounts in millions of Canadian dollars unless otherwise indicated) Years ended December 31, 2016 and 2015
38
Fair value hierarchy
The financial instruments of the Company that are recorded at fair value have been classified into levels using a fair value
hierarchy. A Level 1 valuation is determined by unadjusted quoted prices in active markets for identical assets or liabilities.
A Level 2 valuation is based upon inputs other than quoted prices included in Level 1 that are observable for the
instruments either directly or indirectly. A Level 3 valuation for the assets and liabilities are not based on observable
market data.
Available-for-sale investment in Capital Power
The available-for-sale investment in Capital Power represents an investment in common shares of Capital Power
Corporation. The fair value of the investment is based on the quoted price of common shares of Capital Power
Corporation (CPX) on the Toronto Stock Exchange at December 31, 2016 and 2015.
Other financial assets
The fair value of the Company's unsecured long-term receivable from Capital Power is based on a current yield for the
Company's receivable at December 31, 2016 and 2015. This yield is based on an estimated credit spread for Capital
Power over the yields of long-term Government of Canada bonds that have similar maturities to the Company's
receivable. The estimated credit spread is based on Capital Power's indicative spread as published by independent
financial institutions.
The fair values of the Company’s other long-term loans and receivables are based on the estimated interest rates implicit
in comparable loan arrangements plus an estimated credit spread based on the counterparty risks at December 31, 2016
and 2015.
Loans and borrowings
The fair value of the Company’s long-term public debt is based on the pricing sourced from market data as of December
31, 2016 and 2015. The fair value of the Company’s remaining long-term loans and borrowings is based on determining a
current yield for the Company’s debt at December 31, 2016 and 2015. This yield is based on an estimated credit spread
for the Company over the yields of long-term Government of Canada bonds for Canadian dollar loans and U.S. Treasury
bonds for U.S. dollar loans that have similar maturities to the Company’s debt. The estimated credit spread is based on
the Company’s indicative spread as published by independent financial institutions. The Company’s long-term loans and
borrowings (including the current portion) include City debentures which are offset by payments made by the Company
into the sinking fund. The Company’s beneficial interest in the sinking fund is a related party balance and has been
recorded at fair value as it has been classified as an available-for-sale financial asset. The fair value of the beneficial
interest in the sinking fund is based on quoted market values as determined by the City at or near the reporting date.
Short-term loans and borrowings are measured at amortized cost and their carrying value approximate their fair value due
to the short-term nature of these financial instruments.
Contingent consideration
The payment of contingent consideration is mainly dependent on securing newly executed long term contracts for the
supply of water, the timing of which is uncertain. The fair value of the Company’s contingent consideration is determined
based on the expected timing of execution of such new contracts and the resulting cash flows are then discounted at risk
adjusted discount rates. Any change in the timing of execution of new contracts, discount rate or foreign exchange rate
can have material impact on the fair value of contingent consideration.
Timing of execution of new contracts
If the timing of execution of new contracts is advanced by 2 years then the fair value of the contingent consideration will
increase by $4 million. Alternatively, if the timing of execution of new contracts is delayed by 2 years then the fair value
of the contingent consideration will decrease by $5 million.
Discount rate
A 50 basis point change in discount rate will change the fair value of the contingent consideration by $1 million.

EPCOR UTILITIES INC. Notes to the Consolidated Financial Statements (Tabular amounts in millions of Canadian dollars unless otherwise indicated) Years ended December 31, 2016 and 2015
39
Foreign exchange rate
A 10% change in the foreign exchange rate will change the fair value of the contingent consideration by $4 million.
Derivatives
The fair value of the Company’s financial electricity purchase contracts is determined based on exchange index prices in
active markets. Fair value amounts reflect management’s best estimates using external readily observable market data
such as forward electricity prices.
The fair value of the Company’s interest rate swaps is based on valuations obtained from the counterparty. The fair value
is determined by the counterparty using a discounted cash flow model. The inputs used include notional amounts, the
quoted forward Canadian Dealer Offering Rate (CDOR) curve, the contractual fixed settlement rate and an applicable
discount factor.
It is possible that the assumptions used in establishing fair value amounts will differ from future outcomes and the impact
of such variations could be material.
29. Financial risk management
Overview
The Company is exposed to a number of different financial risks arising from business activities and its use of financial
instruments, including market risk, credit risk, and liquidity risk. The Company’s overall risk management process is
designed to identify, assess, measure, manage, mitigate and report on business risk which includes financial risk.
Enterprise risk management is overseen by the Board of Directors and senior management is responsible for fulfilling
objectives, targets, and policies approved by the Board of Directors. EPCOR’s Corporate Treasurer in conjunction with the
Company’s Internal Audit function provides the Board of Directors with an enterprise risk assessment quarterly. Risk
management strategies, policies and limits are designed to help ensure the risk exposures are managed within the
Company’s business objectives and risk tolerance. The Company’s financial risk management objective is to protect and
minimize volatility in earnings and cash flow.
Financial risk management including foreign exchange risk, interest rate risk, liquidity risk and the associated credit risk
management is carried out by the centralized Treasury function in accordance with applicable policies. The Audit
Committee of the Board of Directors, in its oversight role, performs regular and ad-hoc reviews of risk management
controls and procedures to help ensure compliance.
Risks related to Capital Power
Significant reliance is placed on the capacity of Capital Power to honor its back-to-back debt obligations with EPCOR.
Should Capital Power fail to satisfy these obligations, EPCOR’s capacity to satisfy its debt obligations would be reduced
and EPCOR would need to satisfy its own debt obligations by other means. As per agreement, the back-to-back debt
obligations may be called by EPCOR for repayment. Repayment must occur within 180 days of notice.
Capital Power has indemnified EPCOR for any losses arising from its inability to discharge its liabilities, including any
amounts owing to EPCOR in relation to the long-term loans receivable.
Market risk
Market risk is the risk of loss that results from changes in market factors such as electricity prices, foreign currency
exchange rates, interest rates and equity prices. The level of market risk to which the Company is exposed at any point in
time varies depending on market conditions, expectations of future price or market rate movements and the composition
of the Company’s financial assets and liabilities held, non-trading physical asset and contract portfolios, and trading
portfolios. The Company’s financial exposure management policy is approved by the Board of Directors and the
associated procedures and practices are designed to manage the foreign exchange risk and interest rate risk throughout
the Company.

EPCOR UTILITIES INC. Notes to the Consolidated Financial Statements (Tabular amounts in millions of Canadian dollars unless otherwise indicated) Years ended December 31, 2016 and 2015
40
To manage the exposure related to changes in market risk, the Company may use various risk management techniques
including derivative financial instruments such as forward contracts, contracts-for-differences or interest rate swaps. Such
instruments may be used for an anticipated transaction to establish a fixed price denominated in a foreign currency or
electricity or to secure fixed interest rates.
The sensitivities provided in each of the following risk discussions disclose the effect of reasonable changes in relevant
prices and rates on net income at the reporting date. The sensitivities are hypothetical and should not be considered to be
predictive of future performance or indicative of earnings on these instruments. The Company’s actual exposure to market
risks is constantly changing as the Company’s portfolio of debt, equity instruments, foreign currency and commodity
contracts changes. Changes in fair values or cash flows based on market variable fluctuations cannot be extrapolated
since the relationship between the change in the market variable and the change in fair value or cash flows may not be
linear. In addition, the effect of a change in a particular market variable on fair values or cash flows is calculated without
considering interrelationships between the various market rates or mitigating actions that would be taken by the Company.
Electricity price and volume risk
EPCOR sells electricity to regulated rate option (RRO) customers under a RRT. All electricity for the RRO customers is
purchased in real time from the AESO in the spot market. Under the RRT, the amount of electricity to be economically
hedged, the hedging method and the electricity selling prices to be charged to these customers is determined by the
EPSP. Under the EPSP, the Company uses financial contracts to economically hedge the RRO requirements and
incorporate the price into customer rates for the applicable month. Fixed volumes of electricity are economically hedged
using financial contracts-for-differences up to 120 days in advance of the month in which the electricity (load) is consumed
by the RRO customers. The volume of electricity economically hedged in advance is based on load (usage) forecasts for
the consumption month. When consumption varies from forecast consumption patterns, EPCOR is exposed to prevailing
market prices when the volume of electricity economically hedged is short of actual load requirements or greater than the
actual load requirements (long). Exposure to variances in electricity volume can be exacerbated by other events such as
unexpected generation plant outages and unusual weather patterns.
Under contracts-for-differences the Company agrees to exchange, with a single creditworthy and adequately secured
counterparty, the difference between the AESO electricity spot market price and the fixed contract price for a specified
volume of electricity up to 120 days in advance of the consumption date, all in accordance with the EPSP. The contracts-
for-differences are referenced to the AESO electricity spot price and any movement in the AESO price results in changes
in the contract settlement amount. If the risks of the EPSP were to become untenable, EPCOR could test the market and
potentially re-contract the procurement risk under an outsourcing arrangement at a certain cost that would likely increase
procurement costs and reduce margins. The Company may enter into additional financial electricity purchase contracts
outside the EPSP to further economically hedge the price of electricity.
At December 31, 2016, holding all other variables constant, a $5 per megawatt hour increase / decrease in the forward
electricity spot price would increase / decrease net income by approximately $5 million (2015 – $6 million). In preparing
the sensitivity analysis, the Company compared average AESO electricity spot prices to the forward index price for the
past 24 months. Based on historical fluctuations, the Company estimates that the fair value of the contracts could increase
or decrease by up to $22 million (2015 – $35 million) with a corresponding change to net income.
Foreign exchange risk
The Company is exposed to foreign exchange risk on foreign currency denominated future transactions and firm
commitments, and monetary assets and liabilities denominated in a foreign currency and on its net investments in foreign
subsidiaries.
The Company’s financial exposure management policy attempts to minimize material exposures arising from movements
in the Canadian dollar relative to the U.S. dollar or other foreign currencies. The Company’s direct exposure to foreign
exchange risk arises on commitments denominated in U.S. dollars. The Company coordinates and manages foreign
exchange risk centrally by identifying opportunities for naturally occurring opposite movements and then dealing with any
material residual foreign exchange risks.

EPCOR UTILITIES INC. Notes to the Consolidated Financial Statements (Tabular amounts in millions of Canadian dollars unless otherwise indicated) Years ended December 31, 2016 and 2015
41
The Company may use foreign currency forward contracts to fix the functional currency of its non-functional currency cash
flows thereby reducing its anticipated foreign currency denominated transactional exposure. The Company looks to limit
foreign currency exposures as a percentage of estimated future cash flows.
At December 31, 2016, holding all other variables constant, a 10% change in exchange rate would change the private
debt balance by $39 million (2015 – $35 million).
Interest rate risk
The Company is exposed to changes in interest rates on its cash and cash equivalents, and floating-rate short-term loans
and obligations. The Company is also exposed to interest rate risk from the possibility that changes in the interest rates
will affect future cash flows or the fair values of its financial instruments. Interest rate risk associated with short-term loans
and borrowings is immaterial due to its short-term maturity. At December 31, 2016 and 2015, all long-term debt was fixed
rate.
The Company entered into the following interest rate swaps to manage its interest rate risk in the Regina Wastewater
project as described below:
Type Term Notional amount Fixed rate Floating rate index
Pay fixed, receive
floating
August 1, 2014 –
January 3, 2017
Range of
$18 – $136
1.55% 1-month CDOR
Pay fixed, receive
floating
January 3, 2017 –
June 1, 2044
$67 3.51% 1-month CDOR
The counterparty to the swap arrangements is a major Canadian financial institution. During their respective terms, the
swaps are being net cash settled on a monthly basis. The Company does not anticipate any material adverse effect on its
financial covenants resulting from its involvement in this type of swap arrangement, nor does it anticipate non-
performance by the counterparty.
During the year, the Company terminated the long term “pay fixed, receive floating” interest rate swap by settlement of the
outstanding liability of $14 million to the counterparty. Subsequent to the year ended December 31, 2016, the remaining
short term interest rate swap was also settled on January 3, 2017.
Equity Price Risk
Equity price risk refers to the risk that the fair value of an investment will fluctuate as a result of changes in equity markets.
The Company is exposed to equity price risk arising from its available-for-sale investment in the common shares of
Capital Power Corporation which are listed on TSX. At December 31, 2016, an increase or decrease of $1.00 in market
price of common shares of Capital Power Corporation will result in an increase or decrease of nil (2015 - $9 million) in the
fair value of Company’s available-for-sale investment in Capital Power, respectively.
Credit risk
Credit risk is the possible financial loss associated with the inability of counterparties to satisfy their contractual obligations
to the Company, including payment and performance. The Company’s counterparty credit risk management policy is
approved by the Board of Directors and the associated procedures and practices are designed to manage the credit risks
associated with the various business activities throughout the Company. Credit and counterparty risk management
procedures and practices generally include assessment of individual counterparty creditworthiness and establishment of
exposure limits prior to entering into a transaction with the counterparty. Exposures and concentrations are subsequently
monitored and are regularly reported to senior management. Creditworthiness continues to be evaluated after
transactions have been initiated, at a minimum, on an annual basis. Credit risk includes the Capital Power back-to-back
debt obligations with EPCOR as described above. To manage and mitigate credit risk, the Company employs various
credit mitigation practices such as master netting agreements, pre-payment arrangements from retail customers, credit
derivatives and other forms of credit enhancements including cash deposits, parent company guarantees, and bank letters
of credit.

EPCOR UTILITIES INC. Notes to the Consolidated Financial Statements (Tabular amounts in millions of Canadian dollars unless otherwise indicated) Years ended December 31, 2016 and 2015
42
Maximum credit risk exposure
The Company’s maximum credit exposure is represented by the carrying amount of the following financial assets:
2016 2015
Cash and cash equivalents1 (note 9) $ 191 $ 36
Trade and other receivables2
(note 10) 299 333
Other financial assets (note 13) 283 597
$ 773 $ 966
1 This table does not take into account collateral held. At December 31, 2016, the Company held cash deposits of $26
million (2015 – $27 million) as security for certain counterparty accounts receivable and derivative contracts. The
Company is not permitted to sell or re-pledge this collateral in the absence of default of the counterparties providing
the collateral.
2 The Company’s maximum exposures related to trade and other receivables by major credit concentration is
composed of $212 million (2015 – $209 million) related to rate-regulated customer balances. At December 31, 2016,
the Company held credit enhancements to mitigate credit risk on trade and other receivables in the form of letters of
credit of $1 million (2015 – $1 million), performance bonds of $1 million (2015 – nil) and parental guarantees of $263
million (2015 – $252 million).
Credit quality and concentrations
The Company is exposed to credit risk on outstanding trade receivables associated with its energy and water sales
activities and agreements with the AESO and on electricity supply agreements with wholesale and retail customers. The
Company is also exposed to credit risk from its cash and cash equivalents, derivative instruments and long-term financing
arrangements receivable.
The credit quality of the Company’s trade and other receivables, by major credit concentrations, finance lease receivables,
and other financial assets at December 31, 2016 and 2015, was as follows:
2016 2015
Investment grade
or secured1,2
%
Unrated
%
Investment grade
or secured1,2
%
Unrated
%
Trade and other receivables
Rate-regulated customers3 - 24 - 34
Non rate-regulated customers 65 11 62 4
Total trade and other receivables 65 35 62 38
Cash and cash equivalents 100 - 100 -
Loans and other long-term receivables 100 - 100 -
1 Credit ratings are based on the Company’s internal criteria and analyses, which take into account, among other
factors, the investment grade ratings of external credit rating agencies when available.
2 Certain trade receivables and other financial assets are considered to have low credit risk as they are either secured
by the underlying assets, secured by other forms of credit enhancements, or the counterparties are local or provincial
governments.
3 Rate-regulated customer trade receivables include distribution and transmission, water sales, rate-regulated and
default electricity supply receivables. Under the Electric Utilities Act (Alberta), the Company provides electricity supply
in its service area to residential, agricultural and small commercial customers at regulated rates and to those
commercial and industrial customers who have not chosen a competitive offer and consume electricity under default
supply arrangements.

EPCOR UTILITIES INC. Notes to the Consolidated Financial Statements (Tabular amounts in millions of Canadian dollars unless otherwise indicated) Years ended December 31, 2016 and 2015
43
Rate-regulated customer credit risk
Credit risk exposure for residential and commercial customers under regulated electricity and water supply rates is
generally limited to amounts due from customers for electricity and water consumed but not yet paid for. The Company
mitigates credit risk from counterparties by performing credit checks and on higher risk customers, by taking pre-payments
or cash deposits. The Company monitors credit risk for this portfolio at the gross exposure level.
Trade and other receivables and allowance for doubtful accounts
Trade and other receivables consist primarily of amounts due from retail customers including commercial customers, other
retailers, government-owned or sponsored entities, regulated public utility distributors, and other counterparties.
Commercial customer contracts provide performance assurances through letters of credit, irrevocable guarantees and
bonds. For other retail customers, represented by a diversified customer base, credit losses are generally low and the
Company provides for an allowance for doubtful accounts on estimated credit losses.
The aging of accounts receivables was as follows:
December 31, 2016 Gross accounts
receivables Allowance for
doubtful accounts Net accounts
receivables
Current1 $ 279 $ - $ 279
Outstanding 31 to 60 days 11 - 11
Outstanding 61 to 90 days 5 2 3
Outstanding more than 90 days 9 3 6
$ 304 $ 5 $ 299
December 31, 2015 Gross accounts
receivables Allowance for
doubtful accounts Net accounts
receivables
Current1 $ 293 $ - $ 293
Outstanding 31 to 60 days 20 - 20
Outstanding 61 to 90 days 5 1 4
Outstanding more than 90 days 18 2 16
$ 336 $ 3 $ 333
1 Current amount represents trade and other receivables outstanding up to 30 days. Amounts outstanding for more
than 30 days are considered past due.
Bad debt expense of $9 million (2015 – $5 million) recognized in the year relates to customer amounts that the Company
determined may not be fully collectable. Allowances for doubtful accounts are determined by each business unit
considering the unique factors of the business unit's trade and other receivables. Allowances and write-offs are
determined either by applying specific risk factors to customer groups' aged balances in trade and other receivables or by
reviewing material accounts on a case-by-case basis. Reductions in trade and other accounts receivable and the related
allowance for doubtful accounts are recorded when the Company has determined that recovery is not possible.
The change in the allowance for doubtful accounts was as follows:
2016 2015
Balance, beginning of year $ 3 $ 3
Additional allowances created 9 5
Recovery of receivables 2 1
Receivables written off (9) (6)
Balance, end of year $ 5 $ 3
At December 31, 2016, the Company held $24 million (2015 – $27 million) of customer deposits for the purpose of
mitigating the credit risk associated with trade and other receivables from residential and business customers.

EPCOR UTILITIES INC. Notes to the Consolidated Financial Statements (Tabular amounts in millions of Canadian dollars unless otherwise indicated) Years ended December 31, 2016 and 2015
44
Liquidity risk
Liquidity risk is the risk that the Company will not be able to meet its financial obligations as they become due. The
Company's liquidity is managed centrally by the Company’s Treasury function. The Company manages liquidity risk
through regular monitoring of cash and currency requirements by preparing short-term and long-term cash flow forecasts
and by matching the maturity profiles of financial assets and liabilities to identify financing requirements. The financing
requirements are addressed through a combination of committed and demand revolving credit facilities and financings in
public or private debt capital markets.
The Company has revolving extendible credit facilities, which are used principally for the purpose of backing the
Company’s commercial paper program and providing letters of credit, as outlined below:
December 31, 2016 Expiry
Total
facilities
Banking
commercial
paper issued
Letters of
credit and
other facility
draws
Net
amounts
available
Committed
Syndicated bank credit facility1 November 2019 $ 200 $ - $ 73 $ 127
Syndicated bank credit facility November 2020 350 - - 350
Total committed 550 - 73 477
Uncommitted
Bank line of credit No expiry 25 - - 25
$ 575 $ - $ 73 $ 502
December 31, 2015 Expiry
Total
facilities
Banking
commercial
paper issued
Letters of
credit and
other facility
draws
Net
amounts
available
Committed
Syndicated bank credit facility1 November 2018 $ 200 $ - $ 48 $ 152
Syndicated bank credit facility November 2020 350 98 - 252
Total committed 550 98 48 404
Uncommitted
Bank line of credit No expiry 25 - - 25
$ 575 $ 98 $ 48 $ 429
1 Restricted to letters of credit.
The Company's $350 million committed syndicated bank credit facility is available and primarily used for short-term
borrowing and backstopping EPCOR’s $350 million commercial paper program. The committed syndicated bank credit
facilities cannot be withdrawn by the lenders until expiry, provided that the Company operates within the related terms and
covenants. The extension feature of EPCOR’s committed syndicated bank credit facilities give the Company the option
each year to re-price and extend the terms of the facilities by one or more years subject to agreement with the lending
syndicate. The Company regularly monitors market conditions and may elect to enter into negotiations to extend the
maturity dates.
The Company has credit ratings of A- and A (low), assigned by Standard and Poor's and DBRS Limited, respectively.
The Company has a Canadian base shelf prospectus under which it may raise up to $1 billion of debt with maturities of
not less than one year. At December 31, 2016, the available amount remaining under this Canadian base shelf
prospectus was $1 billion. The Canadian base shelf prospectus expires in December 2017.
The undiscounted cash flow requirements and contractual maturities of the Company's non-derivative financial liabilities,
including interest payments, are as follows:

EPCOR UTILITIES INC. Notes to the Consolidated Financial Statements (Tabular amounts in millions of Canadian dollars unless otherwise indicated) Years ended December 31, 2016 and 2015
45
At December 31, 2016:
2017 2018 2019 2020 2021 2022 and thereafter
Total
contractual
cash flows
Trade and other payables1 $ 275 $ - $ - $ - $ - $ - $ 275
Loans and borrowings2 15 413 7 7 192 1,297 1,931
Interest payments on
loans and borrowings 112 100 80 79 79 1,141 1,591
Other liabilities 26 3 1 1 34 7 72
$ 428 $ 516 $ 88 $ 87 $ 305 $ 2,445 $ 3,869
At December 31, 2015:
2016 2017 2018 2019 2020 2021 and thereafter
Total
contractual
cash flows
Trade and other payables1 $ 232 $ - $ - $ - $ - $ - $ 232
Loans and borrowings2 242 15 413 7 7 1,445 2,129
Interest payments on
loans and borrowings 115 111 99 78 78 1,184 1,665
Other liabilities 27 1 1 1 1 7 38
$ 616 $ 127 $ 513 $ 86 $ 86 $ 2,636 $ 4,064
1 Excluding accrued interest on loans and borrowings of $24 million (2015 – $27 million).
2 Excluding deferred debt issue costs of $11 million (2015 – $12 million).
The Company's undiscounted cash flow requirements and contractual maturities in the next twelve months of $428 million
(2015 – $616 million) are expected to be funded from operating cash flows, interest and principal payments related to the
unsecured long-term receivable from Capital Power, proceeds from the sale of a portion of available-for-sale investment in
Capital Power, commercial paper issuance and the Company's credit facilities. In addition, the Company may issue
medium-term notes or other instruments to fund its obligations or investments. The key factors in determining whether to
issue medium-term notes are the expected interest rates for medium-term notes, the estimated demand by investors for
EPCOR debt and the general state of debt capital markets.
The Company has long-term loans receivable from Capital Power which effectively match certain of the long-term loans
and borrowings above. The following are the undiscounted maturities of the long-term loans receivable and interest
payments from Capital Power:
At December 31, 2016:
2017 2018 Total
Long-term loans receivable
from Capital Power (note 13) $ 10 $ 174 $ 184
Interest payments on loans
receivable from Capital Power 10 6 16
$ 20 $ 180 $ 200

EPCOR UTILITIES INC. Notes to the Consolidated Financial Statements (Tabular amounts in millions of Canadian dollars unless otherwise indicated) Years ended December 31, 2016 and 2015
46
At December 31, 2015:
2016 2017 2018 Total
Long-term loans receivable
from Capital Power (note 13) $ 139 $ 10 $ 174 $ 323
Interest payments on loans
receivable from Capital Power 16 11 6 33
$ 155 $ 21 $ 180 $ 356
The payments from Capital Power fund a portion of the Company's contractual debt obligations. Should Capital Power be
unable to make its scheduled payments to EPCOR, then the Company will rely more heavily on its credit facilities and its
ability to issue medium-term notes to fund its obligations.
30. Capital management
The Company’s primary objectives when managing capital are to safeguard the Company’s ability to continue as a going
concern, pay dividends to its shareholder in accordance with the Company’s dividend policy, maintain a suitable credit
rating, and to facilitate the acquisition or development of projects in Canada and the U.S. consistent with the Company's
growth strategy. The Company manages its capital structure in a manner consistent with the risk characteristics of the
underlying assets. This overall objective and policy for managing capital remained unchanged in the current year from the
prior year.
The Company manages capital through regular monitoring of cash and currency requirements by preparing short-term
and long-term cash flow forecasts and reviewing monthly financial results. The Company matches the maturity profiles of
financial assets and liabilities to identify financing requirements to help ensure an adequate amount of liquidity.
The Company considers its capital structure to consist of long-term and short-term debt net of cash and cash equivalents
and shareholder’s equity. The following table represents the Company's total capital:
2016 2015
Long-term Loans and borrowing (including current portion) (note 18)1 $ 1,931 $ 2,031
Short-term loans (note 18) - 98
Cash and cash equivalents (note 9) (191) (36)
Net debt 1,740 2,093
Total equity 2,672 2,515
Total capital $ 4,412 $ 4,608
1
Excluding deferred debt issue costs of $11 million (2015 – $12 million).
EPCOR has the following externally imposed financial covenants on its capital as a result of its credit facilities and
outstanding debt:
Maintenance of modified consolidated net tangible assets to consolidated net tangible assets ratio, as defined in the
debt agreements, of not less than 80% (2015 – 85%);
Maintenance of consolidated senior debt to consolidated capitalization ratio, as defined in the debt agreements, of not
more than 75% (2015 – 70%) ;
Maintenance of interest coverage ratio, as defined in the debt agreements, of not less than 1.75 to 1.00 if the
Company’s credit rating falls below investment grade; and
Limitation on external debt issued by subsidiaries.
These capital restrictions are defined in accordance with the respective agreements. For the years ended December 31,
2016 and 2015, the Company complied with all externally imposed capital restrictions.

EPCOR UTILITIES INC. Notes to the Consolidated Financial Statements (Tabular amounts in millions of Canadian dollars unless otherwise indicated) Years ended December 31, 2016 and 2015
47
31. Commitments, contingencies and guarantees
Commitments
The following represent the Company’s commitments not otherwise disclosed in these consolidated financial statements:
At December 31, 2016:
2017 2018 2019 2020 2021
2022 and
thereafter Total
Distribution and Transmission segment projects
1 $ 24 $ 40 $ 13 $ 7 $ 7 $ - $ 91
Water Services segment projects
2 13 - - - - - 13
Water Services power
contracts3 9 6 3 3 3 - 24
Water purchase and transportation of
water agreements4 9 2 - - - 4 15
Billing and customer care services agreement
5 4 4 4 3 3 - 18
Operating leases payable6 15 15 14 13 12 119 188
$ 74 $ 67 $ 34 $ 26 $ 25 $ 123 $ 349
At December 31, 2015:
2016 2017 2018 2019 2020
2021 and
thereafter Total
Water Services segment projects
2 $ 33 $ 21 $ - $ - $ - $ - $ 54
Water Services power contracts
3 8 9 2 - - - 19
Water purchase and transportation of
water agreements4 8 1 - - - 3 12
Billing and customer care services agreement
5 6 4 4 4 3 3 24
Operating leases payable6 14 14 14 13 12 131 198
$ 69 $ 49 $ 20 $ 17 $ 15 $ 137 $ 307
1 The Company has commitments for several Distribution and Transmission projects as directed by the AESO.
2 The Company has commitments for several Water Services projects in Canada through contract agreements.
3 The Company has commitments to purchase power for its Edmonton wastewater treatment plant, water treatment
plants and distribution sites. The agreements expire on or before December 31, 2021. Under the terms of the
agreements, the Company is committed to purchase minimum contracted quantities at a fixed price. There are no
early termination or cancellation clauses in these agreements.
4 Water Arizona maintains agreements with the Central Arizona Water Conservation District for the purchase and
transportation of water. These agreements are for terms of 100 years expiring at the end of 2107. Under the terms of
these agreements, the Company is committed for the amount of water ordered in the fall of each year to be
purchased and transported the following year.
Water New Mexico maintains agreements with the various well owners for the purchase of water. These agreements

EPCOR UTILITIES INC. Notes to the Consolidated Financial Statements (Tabular amounts in millions of Canadian dollars unless otherwise indicated) Years ended December 31, 2016 and 2015
48
are generally for terms of ten years. Under the terms of these agreements, certain minimum purchases are due each
year in order to maintain the agreements until they expire.
5 The Company has entered into an agreement for billing and customer care services for Water Arizona and Water
New Mexico. The contract term is ten years, expiring on August 31, 2021.
6 Represents the Company’s gross future operating leases payable for its head office and other premises.
In 2007, the Company entered into a long-term agreement to lease commercial space in a new office tower in
Edmonton, Canada, primarily for its head office (head office lease). The agreement, which became effective in the
fourth quarter of 2011, has an initial lease term of approximately 20 years, expiring on December 31, 2031, and
provides for three successive five-year renewal options. Under the terms of the lease, the Company’s annual lease
commitments, net of annual payments to be paid to the Company by Capital Power and another company under the
sub-leases receivable discussed below, are as follows:
Minimum
lease payable
January 1, 2017 through December 31, 2022 $ 6
January 1, 2023 through December 31, 2023 7
January 1, 2024 through December 31, 2031 8
The Company has sub-leased a portion of the space under its head office lease to Capital Power under the same
terms and conditions as the Company’s lease with its landlord.
Effective November 1, 2013, the Company also sub-leased a portion of the space under its head office lease to a
third party. The term of the sub-lease to the third party expires on October 31, 2023 with two renewal options of four
years each.
Approximate future payments to the Company under the sub-leases receivable are as follows:
Minimum lease receivable
2016 2015
Within one year $ 5 $ 5
After one year but not more than five years 20 20
More than five years 43 48
$ 68 $ 73
Contingencies
The Company and its subsidiaries are subject to various legal claims that arise in the normal course of business.
Management believes that the aggregate contingent liability of the Company arising from these claims is immaterial and
therefore no provision has been made.
Guarantees
The Company in the normal course of business issues payment guarantees on behalf of its subsidiaries to meet the
conditions of the agreements with third parties. At December 31, 2016, guarantees totaling $429 million (2015 – $408
million) have been issued to various third parties.

EPCOR UTILITIES INC. Notes to the Consolidated Financial Statements (Tabular amounts in millions of Canadian dollars unless otherwise indicated) Years ended December 31, 2016 and 2015
49
32. Segment disclosures
The Company operates in the following reportable business segments, which follow the organization, management and
reporting structure within the Company.
Water Services
Water Services is primarily involved in the treatment, distribution and sale of water and the treatment of wastewater within
Edmonton and other communities throughout Western Canada and the Southwestern U.S. This segment also provides
commercial services including construction, operation and maintenance of water and wastewater treatment plants.
Distribution and Transmission
Distribution and Transmission is involved in the transmission and distribution of electricity within Edmonton. This segment
also provides commercial services including the maintenance and repair of the City-owned street lighting and
transportation support facilities.
Energy Services
Energy Services is primarily involved in the provision of regulated tariff electricity service and default supply electricity
services to residential, small commercial and agricultural customers in Alberta. Energy Services also provides competitive
electricity and natural gas products through Encor.
Corporate
Corporate reflects the costs of the Company’s net unallocated corporate office expenses and financing revenues on the
long-term receivable from Capital Power. Corporate also holds the available-for-sale investment in Capital Power.

EPCOR UTILITIES INC. Notes to the Consolidated Financial Statements (Tabular amounts in millions of Canadian dollars unless otherwise indicated) Years ended December 31, 2016 and 2015
50
Lines of business information
Year ended December 31, 2016
Water
Services
Distribution &
Transmission
Energy
Services Corporate
Intersegment
Elimination Consolidated
External revenues and other income $ 663 $ 457 $ 812 $ 14 $ - $ 1,946
Inter-segment revenue - 177 11 - (188) -
Total revenues and other income 663 634 823 14 (188) 1,946
Energy purchases
and system access fees - 182 707 - (167) 722
Other raw materials
and operating charges 159 49 - 1 (8) 201
Staff costs and
employee benefits expenses 128 85 28 37 (3) 275
Depreciation and amortization 91 80 6 12 - 189
Franchise fees and property taxes 28 71 - - - 99
Other administrative expenses 33 16 27 15 (10) 81
Operating expenses 439 483 768 65 (188) 1,567
Operating income (loss)
before corporate charges 224 151 55 (51) - 379
Corporate income (charges) (30) (29) (10) 69 - -
Operating income 194 122 45 18 - 379
Finance recoveries (expenses) (95) (51) (3) 37 - (112)
Fair value gain on available-for-sale
investment in Capital Power
reclassified from other comprehensive income on
sale of portion of investment - - - 42 - 42
Dividend income from available-for- sale investment in Capital Power - - - 9 - 9
Income tax recovery (expense) (14) - - 5 - (9)
Net income $ 85 $ 71 $ 42 $ 111 $ - $ 309
Capital additions $ 206 $ 281 $ 4 $ 11 $ - $ 502
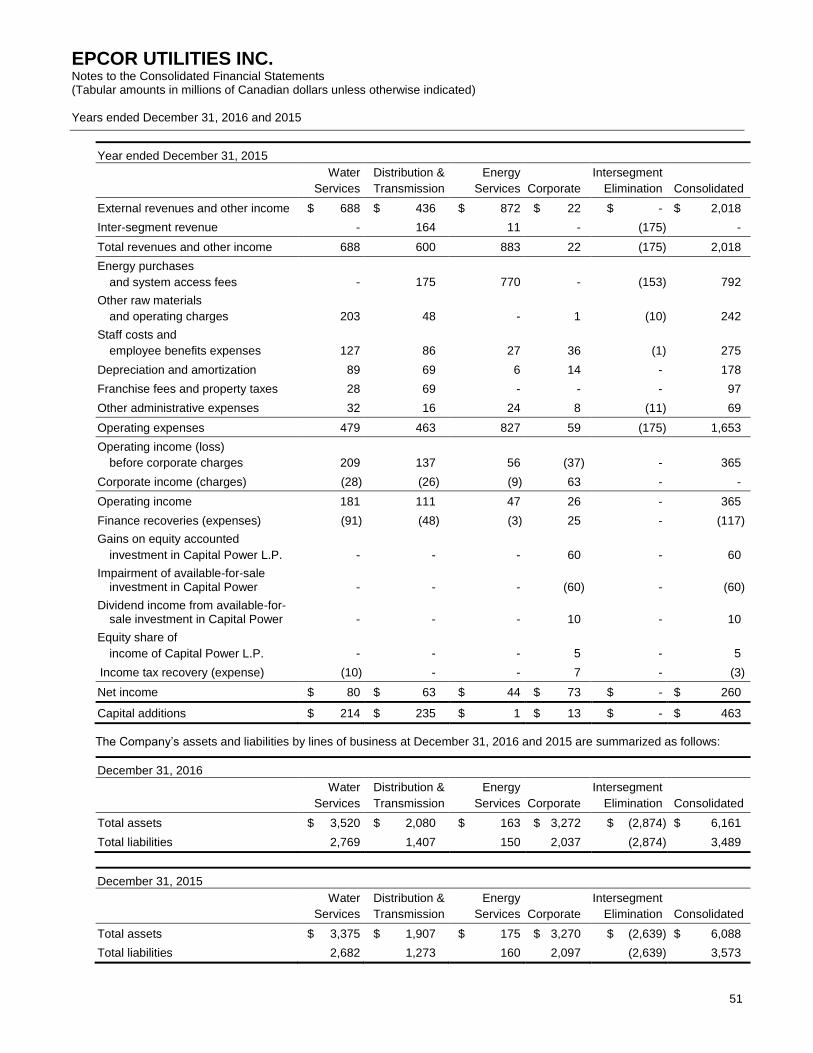
EPCOR UTILITIES INC. Notes to the Consolidated Financial Statements (Tabular amounts in millions of Canadian dollars unless otherwise indicated) Years ended December 31, 2016 and 2015
51
Year ended December 31, 2015
Water
Services
Distribution &
Transmission
Energy
Services Corporate
Intersegment
Elimination Consolidated
External revenues and other income $ 688 $ 436 $ 872 $ 22 $ - $ 2,018
Inter-segment revenue - 164 11 - (175) -
Total revenues and other income 688 600 883 22 (175) 2,018
Energy purchases
and system access fees - 175 770 - (153) 792
Other raw materials
and operating charges 203 48 - 1 (10) 242
Staff costs and
employee benefits expenses 127 86 27 36 (1) 275
Depreciation and amortization 89 69 6 14 - 178
Franchise fees and property taxes 28 69 - - - 97
Other administrative expenses 32 16 24 8 (11) 69
Operating expenses 479 463 827 59 (175) 1,653
Operating income (loss)
before corporate charges 209 137 56 (37) - 365
Corporate income (charges) (28) (26) (9) 63 - -
Operating income 181 111 47 26 - 365
Finance recoveries (expenses) (91) (48) (3) 25 - (117)
Gains on equity accounted
investment in Capital Power L.P. - - - 60 - 60
Impairment of available-for-sale investment in Capital Power - - - (60) - (60)
Dividend income from available-for- sale investment in Capital Power - - - 10 - 10
Equity share of
income of Capital Power L.P. - - - 5 - 5
Income tax recovery (expense) (10) - - 7 - (3)
Net income $ 80 $ 63 $ 44 $ 73 $ - $ 260
Capital additions $ 214 $ 235 $ 1 $ 13 $ - $ 463
The Company’s assets and liabilities by lines of business at December 31, 2016 and 2015 are summarized as follows:
December 31, 2016
Water
Services
Distribution &
Transmission
Energy
Services Corporate
Intersegment
Elimination Consolidated
Total assets $ 3,520 $ 2,080 $ 163 $ 3,272 $ (2,874) $ 6,161
Total liabilities 2,769 1,407 150 2,037 (2,874) 3,489
December 31, 2015
Water
Services
Distribution &
Transmission
Energy
Services Corporate
Intersegment
Elimination Consolidated
Total assets $ 3,375 $ 1,907 $ 175 $ 3,270 $ (2,639) $ 6,088
Total liabilities 2,682 1,273 160 2,097 (2,639) 3,573

EPCOR UTILITIES INC. Notes to the Consolidated Financial Statements (Tabular amounts in millions of Canadian dollars unless otherwise indicated) Years ended December 31, 2016 and 2015
52
Geographic information
Year ended December 31, 2016 Year ended December 31, 2015
Canada U.S.
Inter-
segment
eliminations Total
Canada U.S.
Inter-
segment
eliminations Total
External revenues
and other income $ 1,732 $ 214 $ - $ 1,946
$ 1,825 $ 193 $ - $2,018
Inter-segment
revenues 188 - (188) -
175 - (175) -
Total revenues
and other income $ 1,920 $ 214 $ (188) $ 1,946
$ 2,000 $ 193 $ (175) $2,018
Non-current assets
2016 2015
Canada $ 4,469 $ 4,362
U.S. 1,156 1,055
$ 5,625 $ 5,417
33. Comparative information
The comparative information in these consolidated financial statements have been reclassified, where applicable, to
conform to current year presentation.