epcis-based supply chain visualization tool - eth...
TRANSCRIPT
0
EPCIS-based Supply Chain Visualization Tool Alexander Ilic (ETH Zurich),
Thomas Andersen (ETH Zurich),
Florian Michahelles (ETH Zurich)
Auto-ID Labs White Paper WP-BIZAPP-045
March 2009
Keywords: RFID, EPCIS, rule-based analysis, visualization,
supply chain management
Email: [email protected], [email protected], [email protected]
Internet: www.autoidlabs.org
Bu
sin
es
s P
roc
es
se
s &
Ap
pli
ca
tio
ns
1
Index
Index.......................................................................................................................................... 1
Abstract ..................................................................................................................................... 2
1 Introduction ........................................................................................................................ 2
2 Background and related work............................................................................................. 3
3 Concept.............................................................................................................................. 4
3.1 Standardized input data.............................................................................................. 4
3.2 Rule-based analysis ................................................................................................... 6
3.2.1 Velocity consistency............................................................................................ 6
3.2.2 Dwell-time consistency ....................................................................................... 6
3.2.3 Lifecycle consistency .......................................................................................... 7
3.2.4 Pair-wise shipping/receiving confirmation ........................................................... 7
3.2.5 Transition probability consistency ....................................................................... 7
3.3 Performance metrics .................................................................................................. 8
3.4 Visualization and user interface.................................................................................. 8
3.4.1 Map-based view.................................................................................................. 8
3.4.2 Data selection and filtering.................................................................................. 9
4 Advanced application scenarios ........................................................................................10
4.1 Theft ..........................................................................................................................10
4.2 Counterfeiting ............................................................................................................10
4.3 Inventory shrinkage ...................................................................................................11
5 Implementation..................................................................................................................11
6 Conclusions and future work .............................................................................................13
References ...............................................................................................................................14

2
Abstract
The EPCIS specification allows for sharing item-level event data between business partners in a standardized way. As EPCIS event data represents measured points of actual business processes, business intelligence methods can be applied in order to detect inefficiencies (such as shipment delays, inventory shrinkage or out-of-stock) in supply chains. In order to deal with the overwhelming number of single events that are generated during operations, we propose a mix of automated analysis techniques and human effort. The Supply Chain Visualizer analyzes EPCIS event data with generic consistency rules and overlays the detected supply chain structure and potential problem areas on a map-based user interface. In this paper we describe the architecture of the tool and propose the concept of EPCIS based consistency rules and performance metrics.
1 Introduction
Today, the term ‘Internet of Things’ is closely connected to the technologies of ubiquitous computing and especially to Radio Identification (RFID). ‘Internet of Things’ stands for the connection of (computer) networks with physical objects and the improvement e.g. of industrial operations and increasing transparency in supply chains. Whereas the term ‘internet’ suggests that it already exists or will be shortly set up, the reality looks quite different because the adoption and diffusion of new technologies take a long time. The success story of VisiCalc [1], the first interactive spreadsheet software, illustrates nicely how new technology can impact and change common work practices. While many competing programs produced outputs that looked like ledger sheets, the dramatic – and largely unexpected – change came from the spreadsheet’s visualization and interactivity. VisiCalc combined the regular structure of the familiar ledger sheet with an underlying structure of interlinked formulas. This was the first time a user – without programming knowledge – could build a complex financial model incrementally, and could explore the model through successive iterations of inputs. This new form of interaction, direct manipulation coupled with immediate feedback, meant a qualitative change in how people worked with the data. In its time, VisiCalc was a radical new idea and it triggered the introduction of desktop computers to millions of offices.
Radio Frequency Identification (RFID) and other pervasive computing technologies may provide a comparable paradigm shift by empowering things, physical items, and goods to share their identity and presence at certain locations with information systems. RFID technology can automatically generate event data that digitally describes how physical entities such as single items or pallets move through supply chain processes across different parties. Recently ratified standards such as the EPCIS specification [2] enable a useful semantic interpretation of such RFID event data across supply chains. As the data reflects the actual business processes, it can be analyzed with data-mining and other techniques to detect and locate inefficiencies (e.g. theft, shipment delays, inventory shrinkage, out-of-stocks, etc.) in the actual physical distribution of goods [3]. Considering the huge number of goods flowing through today’s complex supply chains and the potential impact of item-level tagging, a key issue is certainly the understanding
3
of the supply chain dynamics based on large volumes of EPCIS event data. As business users are typically no data-mining experts, visual representation combined with analysis frameworks should be used to support human reasoning and perception in order to deliver useful knowledge and findings [4]. Accordingly, the key challenge is to reduce the complexity with analysis techniques while still keeping the user in the decision-making loop.
In this context, we have developed the Supply Chain Visualizer, an analysis and visualization tool for EPCIS event data. This paper presents the tool, its underlying concepts, and their applications in detail. In particular, we present a concept for analyzing massive amounts of EPCIS event data with generic consistency rules and a map-based visualization of the data of product flows combined with detection of inconsistencies. By utilizing the semantics of EPCIS data and through selective aggregation, problematic areas in a supply chain can be visualized as ‘hot spots’ to help managers in locating sources of potential business problems. Finally, we support the user in exploring the data by offering various time and categorical filtering capabilities combined with useful performance metrics and activity indices.
The paper is structured as follows. In the following section, we give a short overview on related work in the context of RFID-based data analysis and visualization. Then, we introduce our core concepts in Section 3 and show their applicability to three different business scenarios in Section 4. In Section 5, we provide implementation details of our prototype. In Section 6, we present and discuss our findings from evaluation of a first prototype. Finally, we conclude our paper and suggest directions for future work.
2 Background and related work
The analysis of moving objects is often discussed in the research of geovisual analytics [5]. This field is concerned with the analysis of massive amounts of movement data and their visualization so as to support decision-making for problems with spatial and temporal aspects. While the approaches for analyzing and visualizing data sets are quite advanced, they mostly rely on data with a limited set of semantic attributes (i.e. mostly only location and time). Important challenges often include the extraction of trips and locations [6] from data lacking rich semantics. In contrast, standards such as EPCIS enrich RFID event data by several semantic attributes of the suppy chain domain. Thus, locations and routes can more easily be extracted. Furthermore, the additional semantic information offers an opportunity for developing analysis and visualization methods more specific to the supply chain problem domain.
So far, little attention has been paid to the analysis and visualization of RFID event data in the scholarly literature. In the following, we review relevant work in this field. Shuping and Wright [7] described a 3D visualization technique which illustrates object movements over time. Motivated by the context of the US Department of Defense (DoD), their GeoTime technique was applied to the RFID domain. Their technique drew product flows based on the geographical coordinates and combined this with the time dimension of events, which was used as Z-axis. A user was then able to see irregularities in the patterns of movements. While their approach works well for movements of single items, multiple items in complex topologies and the detection of problems in supply chain context demand for another approach. Cheung et al. [8] developed a tool which is able to extract supply chain topology data from RFID events. A major finding was that displaying supply chains as nodes and lines greatly reduced the complexity of RFID data. Their focus was primarily on dynamic topology changes, whereas we focus on the application of rule-based analysis techniques. With a focus on analysis techniques, Liao and Lin [9] developed a
4
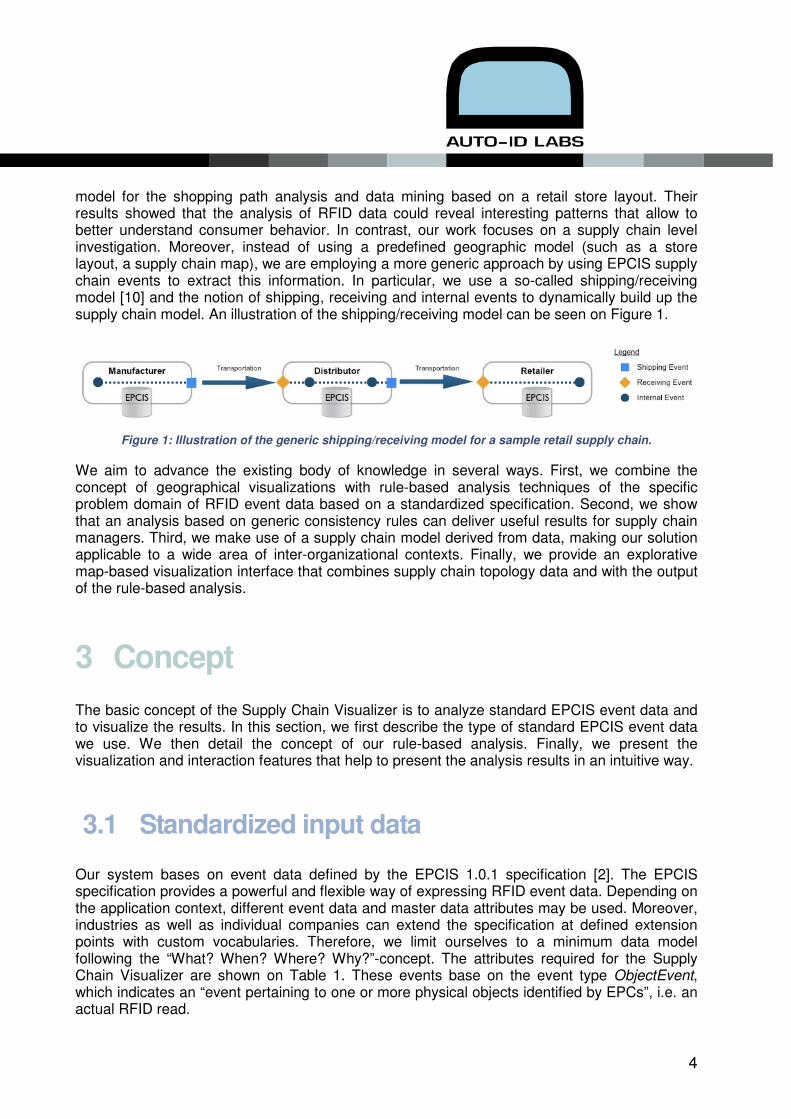
model for the shopping path analysis and data mining based on a retail store layout. Their results showed that the analysis of RFID data could reveal interesting patterns that allow to better understand consumer behavior. In contrast, our work focuses on a supply chain level investigation. Moreover, instead of using a predefined geographic model (such as a store layout, a supply chain map), we are employing a more generic approach by using EPCIS supply chain events to extract this information. In particular, we use a so-called shipping/receiving model [10] and the notion of shipping, receiving and internal events to dynamically build up the supply chain model. An illustration of the shipping/receiving model can be seen on Figure 1.
Figure 1: Illustration of the generic shipping/receiving model for a sample retail supply chain.
We aim to advance the existing body of knowledge in several ways. First, we combine the concept of geographical visualizations with rule-based analysis techniques of the specific problem domain of RFID event data based on a standardized specification. Second, we show that an analysis based on generic consistency rules can deliver useful results for supply chain managers. Third, we make use of a supply chain model derived from data, making our solution applicable to a wide area of inter-organizational contexts. Finally, we provide an explorative map-based visualization interface that combines supply chain topology data and with the output of the rule-based analysis.
3 Concept
The basic concept of the Supply Chain Visualizer is to analyze standard EPCIS event data and to visualize the results. In this section, we first describe the type of standard EPCIS event data we use. We then detail the concept of our rule-based analysis. Finally, we present the visualization and interaction features that help to present the analysis results in an intuitive way.
3.1 Standardized input data
Our system bases on event data defined by the EPCIS 1.0.1 specification [2]. The EPCIS specification provides a powerful and flexible way of expressing RFID event data. Depending on the application context, different event data and master data attributes may be used. Moreover, industries as well as individual companies can extend the specification at defined extension points with custom vocabularies. Therefore, we limit ourselves to a minimum data model following the “What? When? Where? Why?”-concept. The attributes required for the Supply Chain Visualizer are shown on Table 1. These events base on the event type ObjectEvent, which indicates an “event pertaining to one or more physical objects identified by EPCs”, i.e. an actual RFID read.
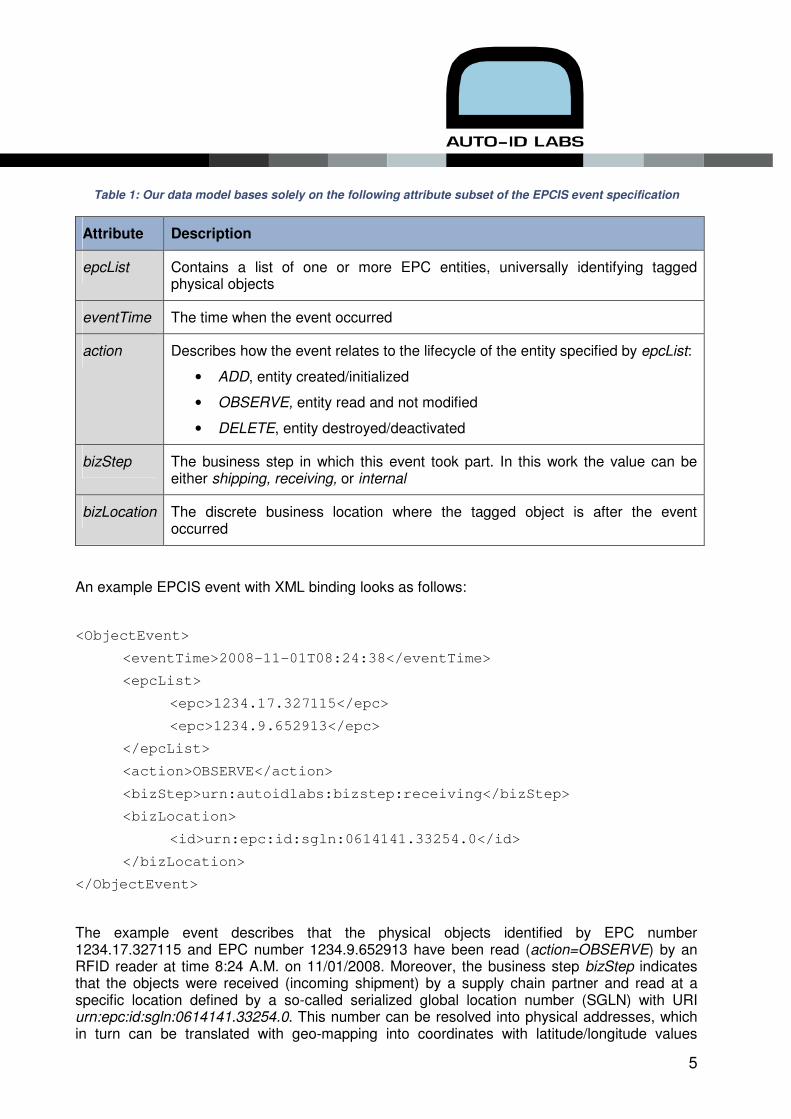
5
Table 1: Our data model bases solely on the following attribute subset of the EPCIS event specification
Attribute Description
epcList Contains a list of one or more EPC entities, universally identifying tagged physical objects
eventTime The time when the event occurred
action Describes how the event relates to the lifecycle of the entity specified by epcList:
• ADD, entity created/initialized
• OBSERVE, entity read and not modified
• DELETE, entity destroyed/deactivated
bizStep The business step in which this event took part. In this work the value can be either shipping, receiving, or internal
bizLocation The discrete business location where the tagged object is after the event occurred
An example EPCIS event with XML binding looks as follows:
<ObjectEvent>
<eventTime>2008-11-01T08:24:38</eventTime>
<epcList>
<epc>1234.17.327115</epc>
<epc>1234.9.652913</epc>
</epcList>
<action>OBSERVE</action>
<bizStep>urn:autoidlabs:bizstep:receiving</bizStep>
<bizLocation>
<id>urn:epc:id:sgln:0614141.33254.0</id>
</bizLocation>
</ObjectEvent>
The example event describes that the physical objects identified by EPC number 1234.17.327115 and EPC number 1234.9.652913 have been read (action=OBSERVE) by an RFID reader at time 8:24 A.M. on 11/01/2008. Moreover, the business step bizStep indicates that the objects were received (incoming shipment) by a supply chain partner and read at a specific location defined by a so-called serialized global location number (SGLN) with URI urn:epc:id:sgln:0614141.33254.0. This number can be resolved into physical addresses, which in turn can be translated with geo-mapping into coordinates with latitude/longitude values
6
needed in the Visualizer for the Google maps API. In order to facilitate the rule-based analysis, we preprocess all incoming event data in the following way. First we split up grouped epcList events into single events and create chronologically ordered linked-lists for each individual item flow identified by the electronic product code (EPC). Second, we calculate time differences (based on eventTime), distances (based on the geo-coordinates translation of bizLocation) and the resulting movement velocities (based on eventTime and bizLocation) for each pair of preceding and following events.
3.2 Rule-based analysis
The core part of our software is the analysis engine. We use the notion of generic analysis rules that are able to detect anomalies by evaluating the preprocessed event chains of individual items. The analysis starts at each root of a product flow and checks each of the currently enabled rules for each time-ordered pair of events denoted as ei and ei+1. Every time a pair of events fails a check, a new inconsistency event is generated within the location of ei. The following rules represent checks for basic supply chain conditions that were elaborated during several discussions with industry experts. As a single inconsistency violation of an individual product may not necessarily proof the existence of a bigger problem, we use aggregation techniques to illustrate ‘hot spots’ based on the frequency of inconsistencies. The configuration file of the Supply Chain Visualizer allows activating or deactivating specific rules to make our tool applicable to a broad set of scenarios. To explain our rules, we use the representation of Event.Fieldname to describe the value of Fieldname of a specific Event.
3.2.1 Velocity consistency
If the event chain represents the flow of a physical item, certain speed constraints apply. The speed consistency check verifies that the velocity (calculated with the eventTime and bizLocation differences of ei and ei+1) is between a minimum velocity vmin and maximum velocity vmax defined in the aforementioned configuration file. The rationale of this rule is that items cannot move faster than the transportation mechanism allows. For example, if the data trace describes that a product was seen at 10 A.M. in Switzerland and an hour later in Japan, then this rule would detect that the maximum threshold vmax is exceeded and thus an inconsistency exists. This inconsistency can be caused e.g. by a cloned tag (indicating a counterfeit product). The default value for vmax is the maximum possible transportation speed of airfreight. If the transportation method for a specific product is known (e.g. truck, ship, plane, etc.), vmax can be configured more accurately to reflect the real-life constraints. The minimum velocity follows a similar rationale.
3.2.2 Dwell-time consistency
In supply chains, goods are often moved as fast as possible towards the point of sale. If, for instance, perishable goods stay too long at a single location, much of the valuable shelf life might be lost. Therefore, the rule of dwell-time consistency checks that the eventTime difference between ei and ei+1 is below a threshold tmax. An inconsistency might be caused e.g. by
7
inefficient stock-rotation processes. Depending on the type of product, maximum product lifetime, or a time-threshold based on a performance agreement, the maximum value tmax must be specified in the configuration file.
3.2.3 Lifecycle consistency
The action field of an EPCIS event describes how an event relates to the lifecycle of the physical entity being described. At the time that a physical object gets a virtual representation through the EPC, an event with action=ADD is generated. Once the tag is deactivated or the physical object is destroyed, an event with action=DELETE is created. In all phases between creation and disposal of object, events with action=OBSERVE are created. The lifecycle consistency rule therefore checks that there are no events before an ADD action event and no events after a DELETE action event. An inconsistency might indicate a counterfeit product or that reader/middleware are improperly configured.
3.2.4 Pair-wise shipping/receiving confirmation
In some industries with strong regulations on traceability, such as food and pharmaceuticals, pair-wise shipping/receiving confirmations are widely used. In some cases, the chain of custody is even more explicitly documented using signed electronic pedigree documents. This rule checks that for every ei+1 with bizStep=receiving there must be a corresponding ei with bizStep=shipping. Moreover, an event ei with bizStep=shipping can only be followed by an event ei+1 with bizStep=internal or bizStep=receiving to detect inconsistencies with duplicate send/receive business steps.
3.2.5 Transition probability consistency
The transition probability check bases on additional reference data, which is pre-calculated during the start of the Supply Chain Visualizer. Depending on the setting in the configuration file, for example the first 10000 events are used as a training set to compute transition probabilities from one supply chain location to another for each product group. During the analysis phase, the transition probabilities are calculated by counting the total product flows and then compared against the transition probabilities of the training set. The consistency rule checks that the difference between the training data-set and the analyzed data-set does not exceed a predefined threshold. In contrast to the previous rules, the threshold check is performed against data groups of supply chain paths rather than against single items. In the default setting, a maximum deviation of 5% from the training set is allowed. An inconsistency indicates e.g. a change in route utilization vis-à-vis the training data-set.
8
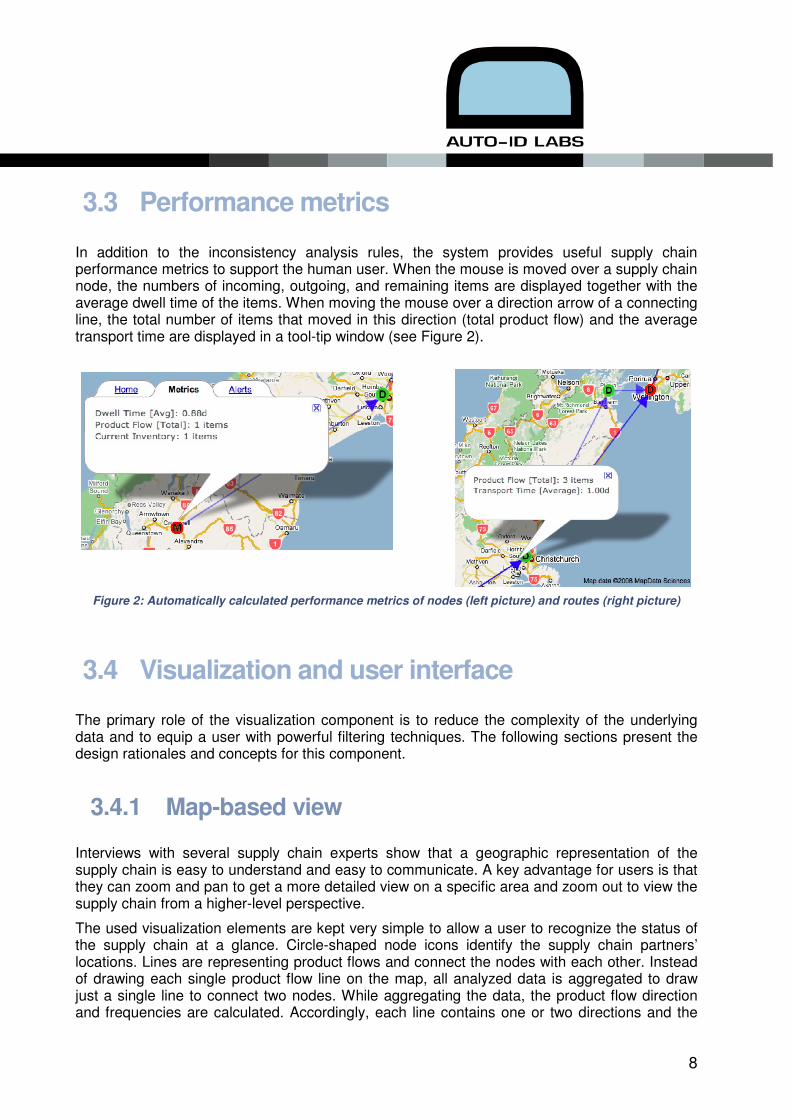
3.3 Performance metrics
In addition to the inconsistency analysis rules, the system provides useful supply chain performance metrics to support the human user. When the mouse is moved over a supply chain node, the numbers of incoming, outgoing, and remaining items are displayed together with the average dwell time of the items. When moving the mouse over a direction arrow of a connecting line, the total number of items that moved in this direction (total product flow) and the average transport time are displayed in a tool-tip window (see Figure 2).
Figure 2: Automatically calculated performance metrics of nodes (left picture) and routes (right picture)
3.4 Visualization and user interface
The primary role of the visualization component is to reduce the complexity of the underlying data and to equip a user with powerful filtering techniques. The following sections present the design rationales and concepts for this component.
3.4.1 Map-based view
Interviews with several supply chain experts show that a geographic representation of the supply chain is easy to understand and easy to communicate. A key advantage for users is that they can zoom and pan to get a more detailed view on a specific area and zoom out to view the supply chain from a higher-level perspective.
The used visualization elements are kept very simple to allow a user to recognize the status of the supply chain at a glance. Circle-shaped node icons identify the supply chain partners’ locations. Lines are representing product flows and connect the nodes with each other. Instead of drawing each single product flow line on the map, all analyzed data is aggregated to draw just a single line to connect two nodes. While aggregating the data, the product flow direction and frequencies are calculated. Accordingly, each line contains one or two directions and the
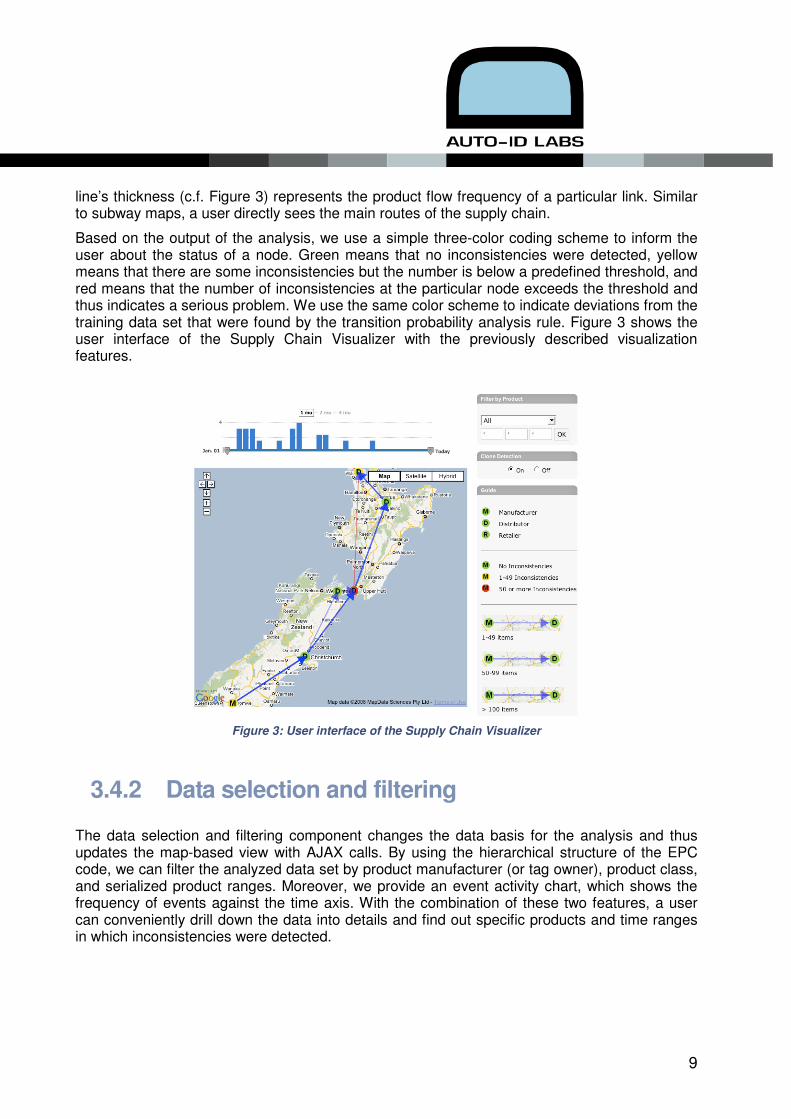
9
line’s thickness (c.f. Figure 3) represents the product flow frequency of a particular link. Similar to subway maps, a user directly sees the main routes of the supply chain.
Based on the output of the analysis, we use a simple three-color coding scheme to inform the user about the status of a node. Green means that no inconsistencies were detected, yellow means that there are some inconsistencies but the number is below a predefined threshold, and red means that the number of inconsistencies at the particular node exceeds the threshold and thus indicates a serious problem. We use the same color scheme to indicate deviations from the training data set that were found by the transition probability analysis rule. Figure 3 shows the user interface of the Supply Chain Visualizer with the previously described visualization features.
Figure 3: User interface of the Supply Chain Visualizer
3.4.2 Data selection and filtering
The data selection and filtering component changes the data basis for the analysis and thus updates the map-based view with AJAX calls. By using the hierarchical structure of the EPC code, we can filter the analyzed data set by product manufacturer (or tag owner), product class, and serialized product ranges. Moreover, we provide an event activity chart, which shows the frequency of events against the time axis. With the combination of these two features, a user can conveniently drill down the data into details and find out specific products and time ranges in which inconsistencies were detected.
10
4 Advanced application scenarios
The following application scenarios illustrate how complex business problems can be tracked down with the Supply Chain Visualizer. Although the following scenarios base on sample data (instead of data from real-life RFID implementations), the selected scenarios were of high priority for our industry partners and were discussed with them in detail. Moreover, these application scenarios have been demonstrated with our prototype at an academic conference [11]. For each scenario, we illustrate a business problem and how the Supply Chain Visualizer can visualize the source of the problem. However, one must be careful to interpret the data as several business problems can reveal themselves with similar evidence. We want to emphasize that with the Supply Chain Visualizer we keep the human in the decision-making loop to interpret the data and to identify the actual source of the problem. Thus, the problem of false alarms is mitigated by helpers such as the filtering techniques, performance metrics, and flexible rule configuration mechanisms.
4.1 Theft
Theft from distribution channels and stores is a major issue in the retail industry. In the US, it is estimated that at least $25 billion are lost each year due to theft [12]. In this context let us consider a scenario where a truck transports goods from a supplier to a retailer. A malicious actor might be able to steal goods from the truck at several occasions. The critical phases are primarily 1) after loading a truck at the supplier, 2) before unloading a truck at the retailer, and 3) during a driving break. As the number of outgoing items at the supplier’s end must match the number of incoming items at the retailer’s end, the Supply Chain Visualizer is able to detect such problems by utilizing the previously described pair-wise shipping/receiving consistency check. For example, if an item gets stolen during transport, the shipping event at the supplier’s end has no corresponding receiving event at the retailer’s end. Single missing items will be detected and a supply chain manager can browse and explore the patterns of such inconsistencies to develop suitable countermeasures.
4.2 Counterfeiting
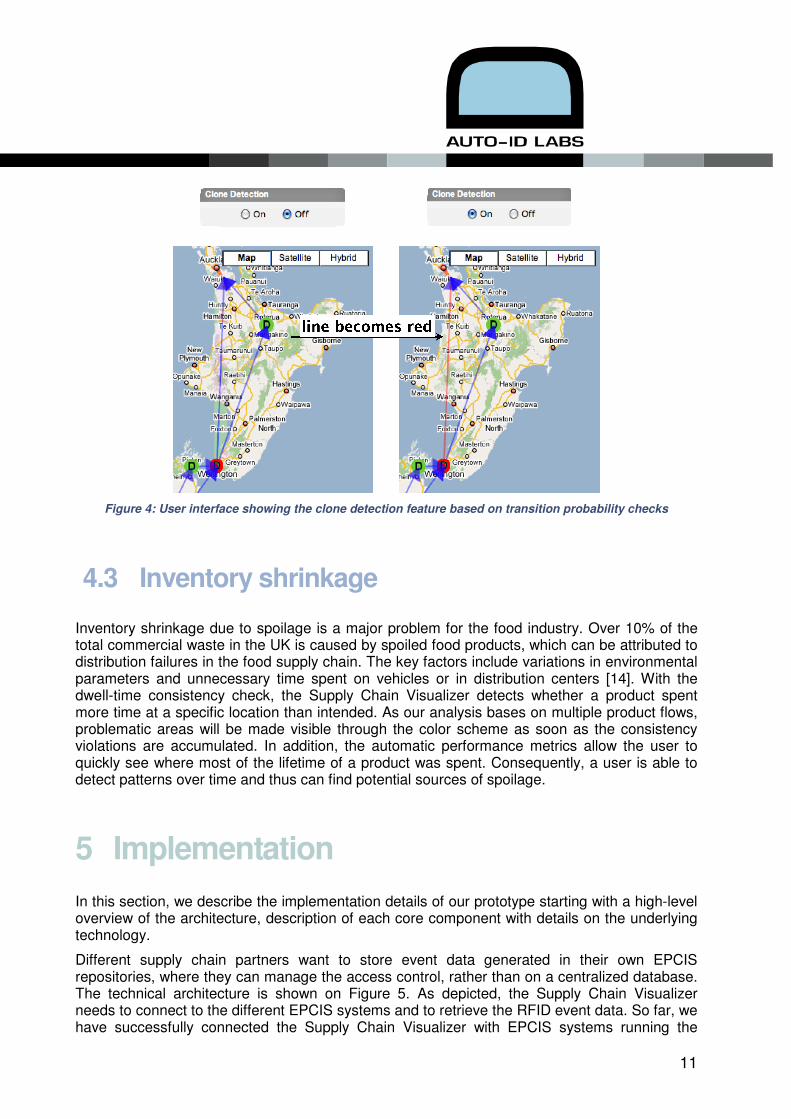
Counterfeiting is a major problem. European customs seize up to hundred million counterfeit and pirated goods every year. Counterfeiting is not just a huge loss of revenue and research and development investments for manufacturers and brand-owners, but also a severe threat to consumer safety. An important problem in this context is the cloning of security features. In the case of RFID, this could mean cloning of the unique product numbers. When fake products with copied identifiers are injected into the licit supply chain, they also produce valid EPCIS events. With the transition probability check, we can determine whether a set of events, having the same identifier, was created by a single product or by two products (genuine and counterfeit). Thus, the Supply Chain Visualizer is able to detect such inconsistencies by highlighting improbable transitions (see Figure 4), effectuating location-based product authentication [13].
11
Figure 4: User interface showing the clone detection feature based on transition probability checks
4.3 Inventory shrinkage
Inventory shrinkage due to spoilage is a major problem for the food industry. Over 10% of the total commercial waste in the UK is caused by spoiled food products, which can be attributed to distribution failures in the food supply chain. The key factors include variations in environmental parameters and unnecessary time spent on vehicles or in distribution centers [14]. With the dwell-time consistency check, the Supply Chain Visualizer detects whether a product spent more time at a specific location than intended. As our analysis bases on multiple product flows, problematic areas will be made visible through the color scheme as soon as the consistency violations are accumulated. In addition, the automatic performance metrics allow the user to quickly see where most of the lifetime of a product was spent. Consequently, a user is able to detect patterns over time and thus can find potential sources of spoilage.
5 Implementation
In this section, we describe the implementation details of our prototype starting with a high-level overview of the architecture, description of each core component with details on the underlying technology.
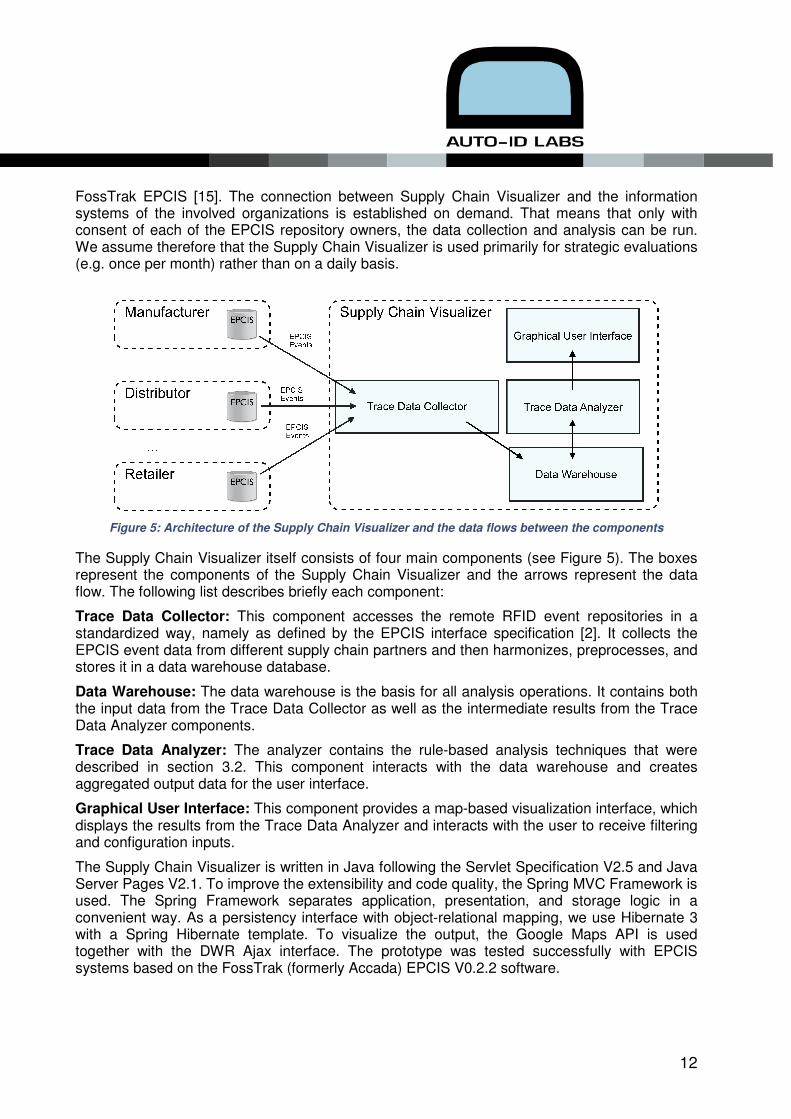
Different supply chain partners want to store event data generated in their own EPCIS repositories, where they can manage the access control, rather than on a centralized database. The technical architecture is shown on Figure 5. As depicted, the Supply Chain Visualizer needs to connect to the different EPCIS systems and to retrieve the RFID event data. So far, we have successfully connected the Supply Chain Visualizer with EPCIS systems running the
12
FossTrak EPCIS [15]. The connection between Supply Chain Visualizer and the information systems of the involved organizations is established on demand. That means that only with consent of each of the EPCIS repository owners, the data collection and analysis can be run. We assume therefore that the Supply Chain Visualizer is used primarily for strategic evaluations (e.g. once per month) rather than on a daily basis.
Figure 5: Architecture of the Supply Chain Visualizer and the data flows between the components
The Supply Chain Visualizer itself consists of four main components (see Figure 5). The boxes represent the components of the Supply Chain Visualizer and the arrows represent the data flow. The following list describes briefly each component:
Trace Data Collector: This component accesses the remote RFID event repositories in a standardized way, namely as defined by the EPCIS interface specification [2]. It collects the EPCIS event data from different supply chain partners and then harmonizes, preprocesses, and stores it in a data warehouse database.
Data Warehouse: The data warehouse is the basis for all analysis operations. It contains both the input data from the Trace Data Collector as well as the intermediate results from the Trace Data Analyzer components.
Trace Data Analyzer: The analyzer contains the rule-based analysis techniques that were described in section 3.2. This component interacts with the data warehouse and creates aggregated output data for the user interface.
Graphical User Interface: This component provides a map-based visualization interface, which displays the results from the Trace Data Analyzer and interacts with the user to receive filtering and configuration inputs.
The Supply Chain Visualizer is written in Java following the Servlet Specification V2.5 and Java Server Pages V2.1. To improve the extensibility and code quality, the Spring MVC Framework is used. The Spring Framework separates application, presentation, and storage logic in a convenient way. As a persistency interface with object-relational mapping, we use Hibernate 3 with a Spring Hibernate template. To visualize the output, the Google Maps API is used together with the DWR Ajax interface. The prototype was tested successfully with EPCIS systems based on the FossTrak (formerly Accada) EPCIS V0.2.2 software.
13
6 Conclusions and future work
In this paper, we have presented a tool that increases the supply chain visibility by analyzing EPCIS event data. Since we do not believe that automated systems could fully replace experience and the human ability to recognize patterns and to understand trends, we focused on an intuitive user interface with data filtering capabilities. The core concepts of our Supply Chain Visualizer are the rule-based analysis techniques and the map-based representation interface. With these features, we are able to visualize the supply chain structure together with performance metrics and to detect problematic hot spots. Our software is available as a first prototype that demonstrates these concepts and bases on the EPCIS event standard.
Our research results open up several opportunities for future research. First, our approach is based on a classical data warehouse analysis approach. While this analysis method was completely sufficient to demonstrate the concepts, RFID enables in principle also a real-time approach. The proposed generic consistency rules could be applied in a real-time analytics system and process streams of RFID data to trigger alerts or notifications as soon as inconsistencies occur. Second, more user guidance and workflow support could be added to the system to provide an executive summary with recommended actions and probable high-level business issues. Third, there is much potential to add extra business value and get better analysis results by considering additional sensor data such as temperature, humidity, light, or shock in the generic consistency rules. Especially in pharmaceutical or food supply chains, this extension of the concept could prove to be useful. Last, external data sources such as enterprise resource planning systems could be connected to the analysis engine to detect differences between physical observations (approximated through the automated identification and tracking with RFID) and for instance expected stock levels based on transactional data of other sources (e.g. EDI, human input, …).
We are also looking forward to exploring the applicability of our tool in different industries. Particularly, once the big players such as Metro and Wal-Mart share their data across the supply chain, it would be interesting to evaluate our tool in a real-world scenario.
14
References
[1] S. Gal, “Footholds for design,” in ACM, 1996, pp.215-231.
[2] EPCglobal, “EPCIS 1.0.1 Specification,” 2007.
[3] H. L. Lee, and O. Ozer, “Unlocking the value of RFID,” Graduate School of Business, Stanford University, working paper, 2005,
[4] J. J. Thomas, and K. A. Cook, “A visual analytics agenda,” Computer Graphics and Applications, IEEE, 26 (1), 2006, pp. 10-13.
[5] G. Andrienko et al., “Geovisual analytics for spatial decision support: Setting the research agenda,” International Journal of Geographical Information Science, 21, 2007, pp. 839-857.
[6] G. Andrienko, N. Andrienko, and S. Wrobel, “Visual analytics tools for analysis of movement data,” SIGKDD Explor. Newsl., 9(2), 2007, ACM, pp. 38-46.
[7] D. Shuping, and W. Wright, “Geotime visualization of RFID supply chain data,” RFID Journal, March, 2005,
[8] C. M. Cheung et al., “An RFID Enabled Topology Visualization System for Supply Chain Management,” Annual Journal of IIE, 26, 2006, pp. 61-70.
[9] I.-E. Liao, and W.-C. Lin, “Shopping Path Analysis and Transaction Mining Based on RFID Technology,” 1st Annual RFID Eurasia, 2007.
[10] D. McFarlane, and Y. Sheffi, “The Impact of Automatic Identification on Supply Chain Operations,” International Journal of Logistics Management, 14(1), 2003, pp. 1-17.
[11] A. Ilic et al., “Analyzing Product Flows with the Supply Chain Visualizer,” Demo at Internet of Things Conference 2008, Zurich, 2008,
[12] R. Koh et al., “Prediction, Detection, and Proof: An Integrated Auto-ID Solution to Retail Theft,” Auto-ID Labs White Paper Series, MIT-AUTOID-WH022, 2003.
[13] M. Lehtonen, F. Michahelles, and E. Fleisch, “Probabilistic Approach for Location-Based Authentication,” 1st International Workshop on Security for Spontaneous Interaction at UbiComp'07, Innsbruck, Austria, 2007.
[14] A. Osvald, and L. Z. Stirn, “A vehicle routing algorithm for the distribution of fresh vegetables and similar perishable food,” Journal of Food Engineering, 85(2), 2008, pp. 285-295.
[15] C. Floerkemeier, C. Roduner, and M. Lampe, “RFID Application Development with the Accada Middleware Platform,” IEEE Systems Journal, 1(2), 2007.