epa remedial project manager: jane dolan deputy … · 2018-05-28 · episode will provide current...
TRANSCRIPT

(^JUJ^AUVC-
SDMSDocID 451884
QUALITY ASSURANCE PLAN ADDENDUM ^ ^lt^y
CHESHIRE GROUNDWATER CONTAMINATION SUPERFUND SITE
US EPA REGION I
EPA Remedial Project Managers Signature -JeH ixu miy
EPA Remedial Project Manager Jane Dolan
Deputy Program Quality Assurance Officers Signature
Deputy Program Quality Assurance Officer Meg Himmel
ARCS Lead Chemists Signature i^iffshy ^ p V ^
ARCS Lead Chemist Dr Brian Tucker
MlaquoampE Project Manager Martha Zirbel
Amended By Bruce Livingston
gtlaquo
W
QUALITY ASSURANCE PLAN ADDENDUM
v CHESHIRE GROUNDWATER CONTAMINATION SUPERFUND SITE
US EPA REGION I
EPA Remedial Project Managers Signature
EPA Remedial Project Manager Jane Dolan
Deputy Program Quality Assurance Officers Signature
Deputy Program Quality Assurance Officer Meg Himmel
ARCS Lead Chemists Signature S^^^ J 2 Kff^^
ARCS Lead Chemist Dr Brian Tucker
MampE Project Manager Martha Zirbel
Amended By Bruce Livingston
This Quality Assurance Plan (QAP) Addendum is an update to the original QAP for this ^
project which was filed on September 30 1994 Only those portions of the original QAP
that required updating are presented in this Addendum Unless updated with this document
all quality control procedures will be conducted in accordance with the original September
1994 QAP for this project
1 Project Name Cheshire Groundwater Contamination Superfund Site - Groundwater Sampling
2 Project Requested By EPA Region I
3 Date QAP Amendment FUed 112795
4 Date of Project Field Initiation 120495
5 EPA Remedial Project Manager Jane Dolan
6 Deputy Quality Assistance Officer Meg Himmel
7 Project Description
A Objective and Scope The objective of this sampling effort is to obtain updated analytical data to determine groundwater quality in the vicinity of the Cheshire Groundwater Contamination Superfund Site Three existing overburden monitoring wells and one abandoned residential well (Fusco well) that were sampled in November 1994 will be sampled again as part of this field effort Two additional overburden and three bedrock wells recently installed by the US Geological Survey will also be sampled All groundwater samples will be analyzed for low concentration volatile organics through the DAS program and for full inorganics through the CLP RAS system Based on previous analytical results from the site purge water generated during well sampling will be discharged to the ground surface away from each well
B Data UseData Quality Objectives The data acquired during this sampling episode will provide current information about the nature and extent of contamination by volatile organic compounds (VOCs) inorganic elements and cyanide
The VOC data generated through the DAS program will be analytical level V data while the CLP RAS full inorganic data will be analytical level IV The analytical data packages will consist of all documentation required to conduct a
^ ^ r f j M -
Tier III data validation however only Tier I validation (evidence audit) will be conducted The data generated during this field investigation will be used by EPA personnel to conduct a risk assessment for the site
1
c Monitoring Parameters and Sample Frequency of Collection A total of nine wells will be sampled and analyzed using both RAS CLP and DAS methodologies Full inorganics including the twenty three target analyte list (TAL) metals and cyanide will be analyzed using RAS procedures through the CLP system Low concentration VOCs will be analyzed using MampEs EPA approved DAS specification which is based on EPA Method 5242
In addition to the laboratory analytical procedures pH temperature conductivity turbidity and depth to groundwater will be measured at each well during purging and following sample collection
D Parameter Table
Number Analytical of Method Sample Container Field QC
Parameter Samples Matrix Reference Preservation Holding Time Samples
DAS - VOCs 9 GW 5242 2x40 ml VOA vial 14 days V HCI t opHlt2 Ice
RAS - Full Inorganics
TAL Metals 9 GW TTM030 1 liter Plastic 6 months 4 (except HN03 topHlt2
Vaa Mercury)
Mercury 9 GW ILM030 1 liter Plastic 28 days 4 HN03topHlt2
Cyanide 9 GW ILM030 1 liter Plastic 14 days A NaOHtopHgt10
Field Measurements
pH 9 GW 1501 Disposable Plastic Cup Field Analyze None
Temperature 9 GW 1701 Disposable Plastic Cup Field Analyze None
Conductivity 9 GW 1201 Disposable Plastic Cup Field Analyze None
Turbidity 9 GW 1801 Disposable Plastic Cup Field Analyze None
1) Low concentration VOCs will be analyzed using the MampE DAS specification based on EPA Method 5242 A copy of the DAS Specification is provided at the end of this QAP Addendum
2) QC saniples for VOCs include one MSMSD pair (2) one field duplicate two trip blanks one equipment blank and one performance evaluation (PE) sample
3) QC samples for inorganics include one matrix spike one equipment blank one field duplicate and one PE sample
4) Methods for Chemical Analysis of Water and Wastes US EPA March 1983 f ^
Schedule of Tasks and Products
Samples are anticipated to be collected the week of December 4 1995 Following the completion of the field work MampE will prepare a draft trip memo detailing the work completed The field measurements and procedures conducted along with any deviations from the approved project plans will be provided in the draft trip memo The final trip memo will address any comments on the draft and will include all of the field and laboratory analytical data The results wUl be tabulated to facilitate evaluation
Project Organization and Responsibility
Sampling Operations Bruce Livingston Sampling QC Bruce Livingston Laboratory Analysis RASDAS Laboratories Laboratory QC RASDAS Laboratories Data Quality Review RASDAS LaboratoriesMetcalf amp Eddy Performance Auditing None Systems Auditing None MampE Deputy QA Officer Meg Himmel MampE Project Manager Martha Zirbel
10 Laboratory and Field Data Quality RequirementsAssessments W
Estimated Estimated Parameter Matrix Detection Limit Accuracy Precision
VOCs GW 1-5 ngV 80-120 lt30 RPD
TAL Metals GW 2-100 MgL 80-120 lt30 RPD
Cyanide GW 10 MgL 75-125 lt30 RPD
pff GW NA 005 units plusmn01 units
Temperature^ GW NA 005degC plusmn01degC
Conductivity GW NA lOMmhocm plusmn10
Turbidity GW NA plusmn10 plusmn20
1) The detection limits presented are achievable for the referenced methods Due to interferences requiring dilutions these detection limits may not always be met
2) The detection limits for the majority of VOCs are 1-5 MgL Tetra hydrofuran and 14-Dioxane have detection limits of 50 MgL
3) The field measurements accuracy and precision are based on the equipment manufacturer specifications and MampE field experience
10AB No changes
11 No changes except that VOCs will be analyzed through DAS
12 13 14 15A No changes
15B Data Reduction and Reporting Data reduction and reporting will be conducted by the RAS and DAS laboratories
After receiving the data packages MampE will conduct Tier I (evidence audit only) validation The data will be reported in a spreadsheet format
16 Data Validation Tier I data validation will be conducted However all documentation necessary to conduct a Tier III data validation will be provided to meet the project data quality objectives
17 18 19 No changes
20 Reports to EPA Following the completion of groundwater sampling MampE will prepare a draft trip memo identifying the work completed and presenting the field analytical data The draft trip memo will be completed within two weeks of the conclusion of sampling Laboratory data should arrive at MampE five weeks after the conclusion of sampling The fmal trip memo will include a tabulation of all of the laboratory analytical data The final trip memo will be completed within three weeks of receipt of laboratory analytical data by MampE
Attaclunents to Original QAP No changes
ANALYTICAL SPECIFICATION FOR
METHOD 5242
SCOPE
This specification is for the analysis of groundwater surface water or other aqueous matrices for low concentration volatile organic compounds water using EPA Method 5242 The additional analytes added to the list of 5242 compounds are acetone 2-butanone 2-hexanone 4-methyl-2-pentanone carbon disulfide tetrahydrofuran and 14-dioxane The complete list of target compounds is presented in Attachment A In addition to the target compounds up to ten tentatively identified compounds must also be reported
Method 5242 requires the laboratory to perform a method detection limit (MDL) smdy prior to sample analysis to determine the theoretical lowest statistically valid detection limit This study must follow the requirements described in 40 CFR Part 136 Appendix B using at least seven replicate analyses of the lowest calibration concentration The study must meet the detection limits described in Section 6 The continuing calibration must be conducted on an eight hour basis no other time span is acceptable The laboratory performing the work will be subject to audit by Metcalf amp Eddy at the discretion of the Metcalf amp Eddy lead chemist
PURPOSE
The data derived from these analyses will be used to further delineate groundwater contamination to determine if treatment has met human health and ecological risk objectives to determine the quality of data generated by PRP consultants and possibly for other applications
This method is intended for trace analysis of volatiles in waters that are only slightly impacted by pollution and is not intended for use in analysis of industrial effluent landfill leachate or any moderately to highly contaminated surface waters contaminated groundwater or treatability study influents If samples are collected from areas with historical data concentration ranges will be provided to the laboratory in the work order If the samples are found to effervesce during addition of acid for sample preservation the samples will not be preserved and the laboratory will be notified concerning the absence of preservative
DEFINITION OF WORK
Surface water groundwatier or other aqueous matrices are to be analyzed by Method 5242 with the modifications presented within The modifications are described in Section 7 Analytical Procedures
c Performance evaluation samples (PEs) will be provided with up to one in each sample delivery group to be analyzed along with the field samples No more than twenty samples will be submitted in a sample delivery group Field samples will include blind trip bottle and equipment blanks as well as blind duplicates
SCHEDULE
Samples will be shipped at most one day after collection Saturday delivery may be required An overnight delivery service will be used Contacts for shipping will be provided in each work order Data delivery inquiries may be made to Dr Brian Tucker Metcalf amp Eddy Inc Wakefield MA 01880 (617) 246-5200 extension 6433
Holding Time
Analyses are required to be performed within fourteen (14) days of sample collection for preserved samples and seven (7) days for unpreserved samples Sample preservation will be noted on the chain of custodies When samples are not preserved due to effervescence this will be indicated on the chain of custody
Delivery of Data
Data is required to be delivered to MampE within thirty-five (35) days of laboratory receipt of the last sample per sample delivery group of ten (10) samples or less The data must be delivered to Dr Brian Tucker Metcalf amp Eddy with the mailing address 30 Harvard Mill Square PO Box 4071 Wakefield MA 01880-5371
ANALYTICAL REFERENCES
EPA Method 5242 Methods for the Determination of Organic Compounds in Drinking Water EPA-6004-88039 December 1988 This method is provided in Attachment C
SAMPLE PRESERVATION AND DETECTION LIMITS ^ bull bull i t a i ^
Parameter
All analytes listed in Table 1 of EPA Method 5242
Acetone
2-Butanone
2-Hexanone
4-Methyl-2-pentanone
Carbon disulfide
Tetrahydrofuran
14-Dioxane
ANALYTICAL PROCEDURE
Detection Limit
lt 1 ugL
lt 5 ugL
lt 5 ugL
lt 5 ugL
lt 5 ugL
lt 1 ugL
lt 50 ugL
lt 50 ugL
Preservation
pH lt2 with HCI at 4degC
EPA Method 5242 Measurement of Purgeable Organic Compounds in Water by Capillary Column Gas ChromatographyMass Spectrometry from Methods for the Determination of Organic Compounds in Drinking Water EPA-6(X)4-88039 December 1988 modified as instructed in the following paragraphs
A The following compounds must be included for analysis in all applicable aspects of the method
Compound
Acetone 2-Butanone 2-Hexanone 4-Methyl-2-pentanone Carbon disulfide Tetrahydrofuran 14-Dioxane
CAS Number
67-64-1 78-93-3 591-78-6 108-10-1 75-15-0 109-99-9 123-9-1
Primary Ion
43 72 43 43 76 42 88
Secondarv lon(s)
58 57 57 58 78
7172 58
c B A Matrix Spike and Matrix Spike Duplicate must be analyzed for each sample
delivery group or twenty (20) field samples whichever is more frequent The spike solution must contain the following compounds Vinyl chloride 12-Dichloroethane Carbon tetrachloride 12-Dichloropropane Trichloroethene 112-Trichloroethane Benzene cis-13-Dichloropropene Bromoform Tetrachloroethene 12-Dibromomethane and 14-Dichlorobenzene with 250 ng25 ml of each The solution must also contain 2-Hexanone at a concentration of 625 ng25 ml
C M O and P xylenes must be reported as a total The dichlorobenzene isomers and cistrans 12-dichloroethene isomers must be resolved and reported as separate isomers
D For l2-dichloroethane-d4 mz 67 can be used as the quantitation ion instead of mz 65 However the same quantitation ion must be used throughout the analytical sequence beginning with the MDL
E- One laboratory fortified blank (LFB) containing all analytes at a concentration of 1 Mg1 5Mgl for ketones and 50 Mg1 for tetrahydrofuran and 14-dioxane must be analyzed daily prior to sample analysis The parent solution must be from a source other than the initial calibration standard and continuing calibration standard All surrogates and intemal standards in the LFB must meet the recovery criteria presented in Section 8
F Up to ten nontarget nonintemal standard nonsurtogate organic compounds of the greatest apparent concentration must be tentatively identified via a forward search of the NIST Mass Spectral Library Compounds with a total ion area greater than 40 percent of the total ion area of the nearest intemal standard are required to be library searched Once the best library matches are obtained a mass spectral interpretation specialist must assign an identification if possible If a specific compound cannot be identified a group or class of compound such as C7 alkane or methyl ethyl benzene isomer may be reported Tentatively identified compounds (TICs) are to be quantitated using total ion areas using the nearest eluting intemal standard and assuming a response factor of one Do not report TICs if the concentration is less than 20 (igL
QUALITY CONTROL REQUIREMENTS
The following are the audits required frequency of audits QC limits and required corrective actions
Audits
GCMS Tuning
Intemal Standards
Surrogate Recovery
Initial Calibration
Frequency
Every (8) hours
All samples stds blanks QC samples
All samples cal stds blks QC samples
Initially and when continuing calibration criteria not met
Limits
Table 3 5242 (See 9a)
RT shifts lt 30 seconds Quant Ion area -50 to -1-100 from latest 8 hr std
12-dichoroshyethane-d4 83-143 12-dichloroshybenzene-d4 80shy120 Both surrogates must be in criteria in all samples cal stds blks QC samples
RSD lt 30 RRF gt 005 Ketones 12 dibromoshy3-chloropropane RSD lt30 RFgt002
Cortecfive Action
Remne the GCMS Proper tuning must be verified prior to analysis of stds blanks or samples
Inspect for instmment malfunction Correct problem remn all affected samples blanks QC samples
Remn all samples stds blks or ( C samples with any one surtogate outside criteria Holding tunes must be met If surtogates still out submit both analyses
Determine problem must meet criteria prior to analysis of blanks and samples Contact the MampE lead chemist
r - Audits Frequency
Cont Calibration Every 8 hours
Lab Fortified Blank Daily prior to sample analysis
Method Blank Prior to each 8 hour shift
Matrix spike Every 20 samples or Matrix spike dup every SDG
Limits
RRF - Same as initial cal Percent Dlt30
Percent recovery must be 60-140 for all compounds 5 compounds can exceed 140 if not detected in field samples None less than 60 recovery
Target analytes lt 1 Mg1 lt 5 Mg1 for acetone 2-butanone 4-methyl 2shypentanone 2-hexanone THF and 14-dioxane lt 50 MgL
80-120 recovery 13 RPD Maximum (See 7b)
Corrective Action
Reanalyze CC std if still out initial calibrafion must be perfomied CC criteria must be met prior to blank and sample analysis
Reanalyze to meet 60-140 Remn all samples affected LFB criteria must be met prior to sample analysis on a daily basis
Must be met prior to sample analysis
Reanalyze MSMSD once if criteria still not met submit both analyses
9 ANALYTICAL DELIVERABLES
A The data package deliverables must resemble as closely as possible the Routine Analytical Services (RAS) Organic SOW OLM019 or the latest revision data package The fonhs provided in the RAS Organic SOW OLM019 or the latest revision must be utilized where appropriate The data qualifiers utilized in the RAS Organic SOW OLM019 or the latest revision must be applied to the data provided
A narrative must be provided describing the procedure performed by the laboratory the volume of sample purged and any deviations from the method Problems encountered during analysis problem resolution and any factors which may affect the validity of the data must be addressed This specification signed and dated chain of custody documentation sample tags shipping airbills and telephone logs must be included The data package must be paginated and good copy quality is required
The raw data must be provided for all blanks spikes standards PE samples and field samples and must include
bull reconstmcted total ion chromatograms
bull instmment quantitation reports containing the following information laboratory sample identification number MampE sample number date and time of analysis RT or scan number of identified Method 5242 or additional compound ion used for quantitation with measured area analyte concentration copy of area table from data system GCMS instmment ID lab file ID column trap composition and operating conditions
bull raw and enhanced spectra for all positive results with standard reference spectra for comparison must be provided
The surtogate results must be provided in tabular format on a modified RAS Form II All standards blanks samples and QC samples which were analyzed must be reported on the form The results must be flagged according to the RAS SOW procedures
The matrix spike and matrix spike duplicate sample results for all non-spiked compounds must be tabulated on RAS Form I modified to include all compounds analyzed for in the Region I Modified Method 5242 The concentration added percent recoveries and relative percent differences must be reported on a modified RAS Form III for the spiked compounds The results must be flagged according to the procedures presented in Section 8 of this specification Raw data must be included Mass spectra for the spiked compounds are not required
The method blanks and associated samples must be summarized on RAS Form IV
^^ ^
^
lt-^
bull The mning results must be in tabular format reported on RAS Form V The instmment normalized mass listing and the mass spectmm must be
provided
bull The initial calibration results must also be reported in tabular format on a modified RAS Form VI The relative response factors and the percent relative standard deviation must be calculated for all analytes and surtogates The concentration and source of the standards analyzed must be provided Raw data must be included for all standards analyzed The spectra for all compounds in the initial calibration standards do not have to be included
bull The 10 ugL continuing calibration standard must be reported in a tabular format on modified RAS Form VII The raw data must be included The percent differences and daily response factors must be reported for all analytes and surtogates A RAS Form VII must be provided if the initial calibration standard curve 10 ppb standard was used for quantitation of samples The spectmm for each compound in the continuing calibration standard does not have to be included
bull The Laboratory Fortified Blank (LFB) must be reported in tabular format on a RAS Form I modified to include all compounds presented
in Attachment A Raw data must be included excluding the spectra of all spike analytes The percent recoveries must be calculated and spike
concentrations simimarized on the modified RAS Form I The source of the spike and the acceptable recovery limits must also be reported
bull Provide the intemal standards results on a modified RAS Form VIII The retention time and area counts of the quantification ion for the intemal standards in all blanks samples and QC samples must be reported on this form
bull An example calculation must be provided for positive results and detection limit values reported
bull Provide copies of records (telecons) of communication with field personnel the work order designated project chemist or the MampE lead chemist
bull For TICs provide the spectrum of the TIC and the tiiree best matches obtained from the library search A RAS Form I-TIC must be included for each sample even if no TICs are reported
B Complete Sample Delivery Group File (CSF) Audit
Due to the litigative nature of each Superfund site Region I EPA requires that all analytical data quality control data and tabulated raw or supporting data be delivered with each sample delivery group (SDG) With each sample delivery group an EPA Region 1 Complete SDG File Completeness Evidence Audit must be completed The CSF Completeness Evidence Audit Forms are included in Attachment B and must accompany each sample delivery group (data package) The laboratory through these audit forms must demonstrate that all sample data raw data calibration data and any other data requirements of this specification are included by the laboratory in the data package
The forms included in Attachment B are for all types of data packages For this specification the laboratory will use the forms supplied to the best of their ability where deliverable items are applicable
10 EXCEPTIONS
If QC requirements or action limits are exceeded or if analytical samples are destroyed or lost or if matrix interference is suspected contact
Dr Brian Tucker Metcalf amp Eddy Inc (617) 246-5200 ext 6433
ATTACHMENT A
Fluorobenzene - Internal Standard
Dichlorodifluoromethane Chloromethane Vinyl Chloride Bromomethane Chloroethane Trichlorofluoromethane 11-Dichloroethene Acetone Carbon Disulfide Methylene Chloride trans-12-Dichloroethene 11-Dichloroethane 22-Dichloropropane 2-Butanone cis-12-Dichloroethene Chloroform Bromochloromethane 111 -Trichloroethane
gtw 11-Dichloropropene Carbon Tetrachloride Benzene 12-Dichloroethane Trichloroethene 12-Dicliloropropane Bromodichloromethane Dibromomethane 4-Methyl-2-Pentanone trans-13-Dichloropropene Toluene cis-13-Dichloropropene 112-Trichloroethane 2-Hexanone Tetrachloroethene 13-Dichloropropane Tetrahydrofuran 14-Dioxane l2-Dichloroethane-d4 (surtogate)
10
s Chlorobenzene-d5 - Intemal Standard
Dibromochloromethane Bromoform Isopropylbenzene 12-Dibromoethane Chlorobenzene Ethylbenzene 1112-Tetrachloroethane 1122-Tetrachloroethane Total Xylenes Styrene Bromobenzene N-Propylbenzene 123 -Trichloropropane 2-Chlorotoluene 135-Trimethy Ibenzene 4-Chlorotoluene Tert-Butylbenzene 124-Trimethylbenzene Sec-Butylbenzene 4-Isopropyltoluene 13-Dichlorobenzene 14-Dichlorobenzene N-Butylbenzene 12-Dichlorobenzene 12-Dibromo-3-Chloropropane 124-Trichlorobenzene Hexachlorobutadiene Naphthalene 123 -Trichlorobenzene 12-Dichlorobenzene-d4 (surrogate)
11
r - ATTACHMENT B
CSF AUDIT FORMS
bull s laquo raquo ^
12
~ ^
ORGANICS COHPLETE SDG FILE (CS7) INVENTORY SHEET (Cont)
SDG NOS TO FOLLOW CASE NO SDC NO SAS NO
PACE NOs CHECK FROM TO LAB EPA
Mlaeallanaotia Pata
Original preparaclon and analysis forms or copies of praparatlon and analysis logbook pages
Internal saaple and saaple extract transfer chain-of-custody records
Screening records All instrument output including strip charts
from screening activities (describe or list)
8 EPA ShlPDlniyRaeelvtng Doetments
Airbills (No of shipments ) Chain-of-Custody Records Sample Tags Sample Log-In Sheet (Lab amp DCl) Miscellaneous ShippingReceiving Records
(describe or list) --i9 ssjg
^ ^ - bullbullbullbullgtbullbullraquobullbullbull
9 Intemal Lab Sample Transfer Records and Tracking Sheets (describe or list)
10 Other Records (describe or list)
Telephone Conmunication Log
11 Conments
ompleted by (CLP Lab) (Signature) (Printed NameTitle) (Dace)
bull bulldi ted by EPA) ( S i g n a t u r e ) ( P r i n t e d N a m e T i d e ) (Dace)
FORM D C - 2 - 4
0LM017 791
ORGANICS COMPLETE SDC FILE (CSF) INVENTORY SHEET (Cont) V
CASE NO SDG NO SDG NOS TO FOLLOW SAS NO
PAGE NOs CHECK FROM TO LAB EPA
6 Pesticides (cont) b Saaple Data
TCL Results - Organic Analysis Data Sheet (Fora I PEST)
Chromatograms (Primary Column) Chromatograms from second GC column confirmation GC Integration report or data system printout
Manual work sheets For pestieldesAroelors confirmed by GCMS copies of rav spectra and copies of background-subtracted mass spectra of target corapowids (saaples amp standards)
c Standards Data Initial Calibration of Single Component Analytes (Fora VI PEST-1 and PEST-2)
Initial Calibration of Miilticoaponent Analytes (Fora VI PEST-3)
Analyte Resolution Sumaary (Fora VI FEST-4) _^ Calibration Verification Sunoary (Fora VII PEST-1)
x-v Callbratioti Verification Suaaary (Fora VII PEST-2) i^^ Analytical Sequence (Fora VIII PEST)
Florlsll Cartridge Cheek (Fora IX PEST-1) Pesticide 6PC Calibration (Fora DC PEST-2) Pesticide Identification Sumaary for Single Component
Analytes (Form X PEST-1) Pesticide Identification Summary for Multicomponent
Analytes (Fora X PEST-2) Chroaatograos and data systea printouts
A printout of retention tiaes and corresponding peak areas or peak heights
Pesticide CPC calibration data shy UV detector traces
d Raw QC Data Blank Data Matrix SpikeMatrix Spike Duplicate Data
FORM DC-2-3 OLH017 791
ORGANICS COMPLETE SDC FILE (CSF) INVENTORY SHEET (Cone)
CASE NO
bull
SDG NO SAS NO
SDG NOS TO FOLLOW
PAGE NOs CHECK FROl TO LAB EPA
Semivolatiles Data a QC Sumaary
bull Surrogate Percent Recovery Sunmary (Fora II SV) MSMSD Summary (Form III SV) Method Blank Summary (Form IV SV)GCMS Instrument Perforaance Check (Fora V SV)
Intemal Standard Area and RT Summary (Fora VIII SV)
~
b Sample Data TCL Results (Fora I SV-l SV2) Tentatively Identified Coapounds (Fora I SV-TIC) Reconstrticted total ion chromatograas (RIG)
for eaeh saaple For each sample Raw spectra and background-subtracted mass spectra o f target compounds
Quantitation reports Mass spectra of TICs vith three best library matches GPC chromatograms (if GPC perfomed)
c Standards Data (All Instruments) Initial Calibration Data (Fora VI SV-l SV-2) RICs and Quan Reports for all Standards Continuing Calibration Data (Fora VII SV-l SV-2) RICs and Quantitation Reports for all Standards Seaivolatlle GPC Calibration Data-UV detector traces
d Raw QC Data DFTPF Blank DataMatrix SpikeMatrix Spike Duplicate Data
~ ~
Pesticides
a QC Summary Surrogate Percent Recovery Summary (Form II PEST) MSMSD Duplicate Summary (Form III PEST) Method Blank Summary (Form IV PEST)
v FORM DC-2-2
0LN017 791
ORGANICS COMPLETE SDG FILE (CSF) INVENTORY SHEET c LABORATORY NAME CITYSTATE
CASE NO SDG NO SDG NOS TO FOLLOW SAS NO
CONTRACT NO SOV MO
All documents delivered in the complete SOG file must be original documents vhere possible (REFERENCE EXHIBIT B SECTION II and SECTION III)
PAGE NOs CHECK FROM TO LAB EPA
1 Inventorr Sheet (Fora DC-2) (Do not nuaber) 2 SDC Case Narrative 3 SDQ Cover SheetTraffic Report 4 Volatiles Data
a QC Summary Systea Monitoring Coapound Summary (Fora II VOA)
Matrix SpikeMatrix Spike Duplicate Summary (Fora III VOA)
Method Blank Summary (Fora IV VOA) GCMS Instrument Performance Cheek (Fora V VOA)
Intemal Standard Area and RT Summary r(Form VIII VOA) NlaquoWlaquo
b Sampla Data TCL Results bull (Fora I VOA) Tentatively Identified Compounds (Fora I VOA-TIC)
Reconstructed total ion chrooatograas (RICgt for each saaple
For each saaple Raw spectra and background-subtracted mass spectra of target coapounds identified
Quantitation reports Mass spectra of all reported TICs with three best library matches
c Standarda Data (All Instruments) Initial Calibration Data (Fona VI VOA) RICs and Quan Reports for all Standards Continuing Calibration Data (Fora VII VOA) RICs and Quantitation Reports for all Standards
d Rav QC Data BFB Blank Data Matrix SpikeMatrix Spike Duplicate Daca
FORM DC-2-I
OLM017 7
ATTACHMENT C
EPA METHOD 5242
13 c
METWO 5242 NEASUREMEMT OF PURGEABLE ORGANIC COHPOUNDS IN UATER BY CAPILLARY COLUWl GAS CHROHATOGRAPHYHASS SPECTROMaRY
Revision 30
A Alford-Stevens J W Eichelberger laquo L Budde - Method 524 Revision 10 (1983)
R U Slater Jr - Method 5242 Revision 20 (1986)
J W Elchelberger U L Budde - Method 5242 Revision 30 (1989)
ENVIRONMENTAL MONITORING SYSTEMS LABORATORY OFFICE OF RESEARCH ANO DEVELOPNENT
US ENVIRONNENTAL PROTECTION AGENCY CINCINNATI OHIO 45268
285 V
METHOO 5242 MEASUREMENT OF PURGEABLE ORGANIC COMPOUNDS IN UATER BY CAPILLARY COLUWl GAS CHROHATOGRAPHYNASS SPECTROHHRY
Revision 30
A Alford-Stevens J W Elchelberger H L Budde - Method 524 Revision 10 (1983)
R W Slater Jr - Method 5242 Revision 20 (1986)
J W Elchelberger U L Budde - Method 5242 Revision 30 (1989)
ENVIRONMENTAL MONITORING SYSTEMS LABORATORY OFFICE OF RESEARCH ANO DEVELOPNENT US ENVIRONNENTAL PROTECTION AGENCY
CINCINNATI OHIO 45268
285
NETHOO S242
MEASUREMENT OF PURGEABLE ORGANIC COMPOUNDS IN UATER BY CAPILLARY COLUMN GAS CHROMATOGRAPHYMASS SPECTROMETRY
1 SCOPE AND APPLICATION
11 This is a general purpose method for the identification and simultaneous measurement of purgeable volatile organic compounds in finished drinking water raw source water or drinking water in any treatment stage (1-2) The method is applicable to a wide range of organic compounds including the four trihalomethane disinfection by-products that have sufficiently high volatility and low water solubility to be efficiently removed from water samples with purge and trap procedures The following compounds can be determined by this method
pylt r^Vi ^ V O Compound
BenzeneBromobenzeneBromochloromethaneBromodichloromethaneBromoformBromomethanen-Butyl benzenesec-Butyl benzenetert-ButylbenzeneCarbon tetrachlorideChlorobenzeneChloroethaneChloroformChloromethane2-Chlorotoluene4-ChlorotolueneDibromochloromethanel2-Dibromo-3-chloropropane12-DibromoethaneDibromomethane12-Dichlorobenzene13-Dichlorobenzene14-DichlorobenzeneDichlorodifluoromethane11-Dichloroethane12-Dichloroethane11-Dichloroethenecis-12-Dichloroethenetrans-12-Dichloroethene12-Dichloropropane13-Dichloropropane
Chemical Abstract Service Registry Number
71-43-2 108-86-1
74-97-5 75-27-4
75-25-2 74-83-9
104-51-8 135-98-8 98-06-6
56-23-5 108-90-7 75-00-3
67-66-3 74-87-3 95-49-8 106-43-4
124-48-1 96-12-8
106-93-4 74-95-3
95-50-1 541-73-1 106-46-7
75-71-8 75-34-3 107-06-2 75-35-4
156-59-4 156-60-5
78-87-5 142-28-9
286
22-Oichloropropane11-01chioropropenec1s-l3-D1chloropropenetrans-13-OichloropropeneEthylbenzeneHexachlorobutadieneIsopropylbenzene4-TsopropyltolueneMethylene chlorideNaphthalenen-PropylbenzeneStyrene1112-Tetrachloroethane1122-TetrachloroethaneTetrachloroetheneToluene123-Trlchlorobenzene124-Trichlorobenzene111-Trichloroethane112-TrichloroethaneTrichloroetheneTrichlorofluoromethane123-Trichloropropane124-Trimethylbenzene135-TrimethylbenzeneVinyl chlorideo-Xylenem-Xylenep-Xylene
590-20-7 563-58-6
10061-01-5 10061-02-6
100-41-4 87-68-3
98-82-8 99-87-6 75-09-2
91-20-3 103-65-1
100-42-5 630-^0-6 79-34-5
127-18-4 108-88-3
87-61-6 120-82-1
71-55-6 79-00-5
79-01-6 75-69-4 96-18-4 95-63-6 108-67-8
75-01-4 95-47-6 108-38-3 laquo 106-42-3
12 Method detection limits (MDLs) (3) are compound and Instrument dependent and vary fron approximately 002-035 i i g l The applicable concentration range of this method is primarily column dependent and is approximately 002 to 200 M9i- for the wide-bore thick-film columns Narrow-bore thin-film columns may have a capacity which limits the range to about 002 to 20 MgL Analytes that are Inefficiently purged from water will not be detected when present at low concentrations but they can be measured with acceptable accuracy and precision when present in sufficient amounts
13 Analytes that are not separated chromatographically but which have different mass spectra and non-interfering quantitation ions can be identified and measured in the same calibration mixture or water sample (Sect 1162) Analytes which have very similar mass spectra cannot be individually Identified and measured in the same calibration mixture or water sample unless they have different retention times (Sect1163) Coeluting compounds with very similarmass spectra typically many structural Isomers must be reported as an isomeric group or pair Two of the three Isomeric xylenes and two of the three dichlorobenzenes are examples of structural isomers that may not be resolved on the capillary column and if not must be reported as isomeric pairs
287
2 SUWARY OF HETHQD
21 Volatile organic compounds and surrogates with low water solubility are extracted (purged) from the sample matrix by bubbling an Inert gas through the aqueous sample Purged sample components are trapped in a tube containing suitable sorbent materials When purging is complete the sorbent tube is heated and backflushed with helium to desorb the trapped sample components into a capillary gas chromatography (GC) column interfaced to a mass spectrometer (HS) The column is temperashyture programmed to separate the method analytes which are then detected with the HS Compounds eluting from the GC column are identified by comparing their measured mass spectra and retention times to reference spectra and retention times in a data base Reference spectra and retention times for analytes are obtained by the measurement of calibration standards under the same conditions used for samples The concentration of each identified component Is measured by relating the MS response of the quantitation ion produced by that compound to the HS response of the quantitation ion produced by a compound that Is used as an internal standard Surrogate analytes whose concentrations are known in every sample are measured with the same internal standard calibration procedure
3 DEFINITIONS
31 Internal standard shy- A pure analyte(s) added to a solution in known amount(s) and used to measure the relative responses of other method analytes and surrogates that are components of the same solution The internal standard must be an analyte that Is not a sample component
32 Surrogate analyte shy- A pure analyte(s) which Is extremely unlikely tobe found in any sample and which is added to a sample aliquot in knownamount(s) before extraction and Is measured with the same procedures used to measure other sample components The purpose of a surrogate analyte is to monitor method performance with each sample
^ ^
33 Laboratory duplicates (LDl and L02) -- Two sample aliquots taken in the analytical laboratory and analyzed separately with identical proceshydures Analyses of LDl and L02 give a measure of the precision associated with laboratory procedures but not with sample collection preservation or storage procedures
34 Field duplicates (FOI and FD2) -- Two separate samples collected at the same time and place under identical circumstances and treated exactly the same throughout field and laboratory procedures Analyses of FDl and FD2 give a measure of the precision associated with sample collection preservation and storage as well as with laboratory procedures
35 Laboratory reagent blank (LRB) -- An aliquot of reagent water that is treated exactly as a sample including exposure to all glassware equipment solvents reagents internal standards and surrogates that are used with other samples The LRB Is used to determine if method
288
c
analytes or other interferences are present In the laboratory environshyment the reagents or the apparatus
v
36 Field reagent blank (FRB) -- Reagent water placed in a sample container in the laboratory and treated as a sample in all respects including exposure to sampling site conditions storage preservation and all analytical procedures The purpose of the FRB is to determine if method analytes or other interferences are present In the field environment
37 Laboratory performance check solution (LPC) -- A solution of one or more compounds (analytes surrogates internal standard or other test compounds) used to evaluate the performance of the Instmment system with respect to a defined set of method criteria
38 Laboratory fortified blank (LFB) mdash An aliquot of reagent water to which known quantities of the method analytes are added In the laboratory The LFB Is analyzed exactly like a sample and its purpose Is to determine whether the methodology is in control and whether the laboratory is capable of making accurate and precise measurements at the required method detection limit
39 Laboratory fortified sample matrix (LFM) -- An aliquot of an environshymental sample to which known quantities of the method analytes are added in the laboratory The LFM is analyzed exactly like a sample and its purpose is to determine whether the sample matrix contributes bias to the analytical results The background concentrations of the analytes in the sample matrix must be determined in a separate aliquot and the measured values In the LFM corrected for background concentrashytions
310 Stock standard solution -- A concentrated solution containing a single certified standard that is a method analyte or a concentrated solution of a single analyte prepared In the laboratory with an assayed reference compound Stock standard solutions are used to prepare primary dilution standards
bullj
311 Primary dilution standard solution -- A solution of several analytes prepared in the laboratory from stock standard solutions and diluted as needed to prepare calibration solutions and other needed analyte solutions
312 Calibration standard (CAL) -- a solution prepared from the primary dilution statidard solution and stock standard Solutions of the Internal standards ^d-surrogate analytes The CAL solutions are used to calibrate th^Instrument response with respect to analyte concentrashytion
313 Quality control sam0U (QCS) -- a sample matrix containing method analytes or a solution of method analytes In a water miscible solvent which is used to fortifytreagent water or environmental samples The QCS is obtained from a source external to the laboratory and is used
289
to check laboratory performance with externally prepared test materials
4 INTERFERENCES
41 During analysis major contaminant sources are volatile materials in the laboratory and impurities in the inert purging gas and in the sorbent trap The use of non-polytetrafluoroethylene (PTFE) plastic tubing non-PTFE thread sealants or flow controllers with rubber components in the purging device should be avoided since such materials out-gas organic compounds which will be concentrated in the trap during the purge operation Analyses of laboratory reagent blanks provide Information about the presence of contaminants When potential Interfering peaks are noted In laboratory reagent blanks the analyst should change the purge gas source and regenerate the molecular sieve purge gas filter Subtracting blank values from sample results Is not permitted
42 Interfering contamination may occur when a sample containing low concentrations of volatile organic compounds is analyzed immediately after a sample containing relatively high concentrations of volatile organic compounds A preventive technique Is between-sample rinsing of the purging apparatus and sample syringes with two portions of reagent water After analysis of a sample containing high concentrations of volatile organic compounds one or more laboratory reagent blanks should be analyzed to check for cross contamination
43 Special precautions must be taken to determine methylene chloride The analytical end sample storage area should be Isolated from allatmospheric sources of methylene chloride otherwise random backgroundlevels will result Since methylene chloride will permeate through PTFE tubing all gas chromatography carrier gas lines and purge gas plumbing should be constructed of stainless steel or copper tubing Laboratory workers clothing should be cleaned frequently since clothing previously exposed to methylene chloride fumes during common liquidliquid extraction procedures can contribute to sample contaminashytion
^ ^
5 SAFETY
51 The toxicity or carcinogenicity of chemicals used in this method has not been precisely defined each chemical should be treated as a potential health hazard and exposure to these chemicals should be minimized Each laboratory Is responsible for maintaining awareness of OSHA regulations regarding safe handling of chemicals used in this method Additional references to laboratory safety are available (4-6) for the Information of the analyst
52 The following method analytes have been tentatively classified as known or suspected human or mammalian carcinogens benzene carbon tetrachloride 14-dichlorobenzene l2-4ichlorethane^ hexachloroshybutadiene 1122-tetrachloroethane 112-trlchloroethane chloroshy
290 ^
form 12-dibromoethanetetrachloroethene trichloroethene and vinyl ^ chloride Pure standard materials and stock standard solutions of V these compounds should be handled in a hood A NIOSHMESA approved
toxic gas respirator should be worn when the analyst handles high concentrations of these toxic compounds
6 APPARATUS AND EQUIPMENT
61 SAMPLE CONTAINERS -- 60-mL to 120-mL screw cap vials (Pierce 19832 or equivalent) each equipped with a PTFE-faced silicone septum (Pierce 12718 or equivalent) Prior to use wash vials and septa with detergent and rinse with tap and distilled water Allow the vials and septa to air dry at room temperature place In a 105degC oven for 1 hr then remove and allow to cool In an area known to be free of organics
62 PURGE AND TRAP SYSTEM -- The purge and trap system consists of three separate pieces of equipment purging device trap and desorber Systems are commercially available from several sources that meet all of the following specifications
621 The all glass purging device (Figure 1) should be designed to accept 25-mL samples with a water column at least 5 cm deep A smaller (5-mL) purging device is recommended If the GCMS system has adequate sensitivity to obtain the method detection limits required Gaseous volumes above the sample must be kept to a minimum (lt 15 mL) to eliminate dead volume effects A glass frit should be Installed at the base of the sample chamber so Cl the purge gas passes through the water column as finely divided bubbles with a diameter of lt 3 mm at the origin Needle spargers may be used however the purge gas must be introduced at a point about 5 mm from the base of the water column
622 The trap (Figure 2) must be at least 25 cm long and have an inside diameter of at least 0105 in Starting from the inlet the trap should contain 10 cm of methyl silicone coated packing and the following amounts of adsorbents 13 of 26-dlphenylene oxide polymer 13 of silica gel and 13 of coconut charcoal If it is not necessary to determine dichlorodifluoromethane the charcoal can be eliminated and the polymer increased to fill 23 of the trap Before Initial use the trap should be conditioned overnight at 180degC by backflushing with an inert gas flow of at least 20 mLmin Vent the trap effluent to the room not to the analytical column Prior to daily use the trap should be conditioned for 10 min at 180degC with backflushing The trap may be vented to the analytical column during dally conditioning however the column must be run through the temperature program prior to analysis of samples
623 The use of the methyl silicone coated packing is recommended but not mandatory The packing serves a dual purpose of protecting the Tenax adsorbant from aerosols and also of
291
insuring that the Tenax is fully enclosed within the heated zone of the trap thus eliminating potential cold spots Alternatively sllanized glass wool may be used as a spacer at the trap inlet
624 The desorber (Figure 2) must be capable of rapidly heating the trap to 180degC either prior to or at the beginning of the flow of desorption gas The polymer section of the trap should not be heated higher than 200degC or the life expectancy of the trap will decrease Trap failure is characterized by a pressure drop in excess of 3 pounds per square Inch across the trap during purging or by poor bromoform sensitivities The desorber design Illustrated in Fig 2 meets these criteria
63 GAS CHROMATOGRAPHYMASS SPECTROMETERDATA SYSTEM (6CMSDS)
631 The GC must be capable of temperature programming and should be equipped with variable-constant differential flow controllers so that the column flow rate will remain constant throughout desorption and temperature program operation The column oven must be cooled to lO C therefore a subambient oven controller Is required If syringe injections of BFB will be used a splitsplitless injection port is required bull
632 Capillary Gas Chromatography Columns Any gas chromatography V column that meets the perfonnance specifications of this method
may be used Separations of the calibration mixture must be equivalent or better than those described In this method Three useful columns have been identified
6321 Column 1 -- 60 m x 075 mm ID VOCOL (Supelco Inc) glass wide-bore capillary with a 15 im film thickness
Column 2 -- 30 m X 053 mm ID DB-624 (JampW Scientific Inc) fused silica capillary with a 3 im film thickshyness
Column 3 - 30 m X 032 mm ID DB-5 (JampU Scientific Inc) fused silica capillary with a 1 fun film thickshyness
633 Interfaces between the GC and HS The interface used depends on the column selected and the gas flow rate
6331 The wide-bore columns 1 and 2 have the capacity to accept the standard gas flows from the trap during thermal desorption and chromatography can begin with the onset of thermal desorption Depending on the pumping capacity of the MS an additional interface between the end of the column and the MS may be required An open split interface (7) an all-glass Jet separator or a cryogenic (Sect 6332) device
292
^
^
c
are acceptable interfaces Any Interface can be used If the performance specifications described in this method can be achieved The end of the transfer line after the interface or the end of the analytical column if no interface is used should be placed within a few mm of the MS ion source
6332 The narrow bore column 3 cannot accept the thermal desorption gas flow and a cryogenic interface is required This interface (Tekmar Model 1000 or equivalent) condenses the desorbed sample components at liquid nitrogen temperature and allows the helium gas to pass through to an exit The condensed components are frozen in a narrow band on an uncoated fused silica precolumn When all components have been desorbed from the trap the interface Is rapidly heated under a stream of carrier gas to transfer the analytes to the analytical column The end of the analytical column should be placed with a few mm of the HS ion source A potential problem with this interface is blockage of the interface by frozen water from the trap This condition will result in a major loss in sensitivity and chromatographic resolution
634 The mass spectrometer must be capable of electron ionization at a nominal electron energy of 70 eV The spectrometer must be capable of scanning from 35 to 260 amu with a complete scan cycle time (including scan overhead) of 2 sec or less (Scan cycle time bullgt Total HS data acquisition time in seconds divided by number of scans in the chromatogram) The spectrometer must produce a mass spectrum that meets all criteria In Table 3 when 25 ng or less of 4-bromofluorobenzene (BFB) is introduced into the GC An average spectrum across the BFB GC peak may be used to test instrument performance
635 An Interfaced data system is required to acquire store reduce and output mass spectral data The computer software should have the capability of processing stored GCMS data by recognizshying a GC peak within any given retention time window comparing the mass spectra from the GC peak with spectral data in a user-created data base and generating a list of tentatively identified compounds with their retention times and scan
UKJsnxabers The software must allow Integration of the ion abundance of any specific Ion between specified time or scan number limits The software should also allow calculation of response factors as defined in Sect 926 (or construction of a second or third order regression calibration curve) calculashytion of response factor statistics (mean and standard deviashytion) and calculation of concentrations of analytes using either the calibration curve or the equation in Sect 12
293
64 SYRINGE ANO SYRINGE VALVES
641 Two S-mL or 25-mL glass hypodermic syringes with Luer-Lok tip (depending on sample volume used)
642 Three 2-way syringe valves with Luer ends
643 One ZS- j i l micro syringe with a 2 in x 0006 in ID 22deg bevel needle (Hamilton I702N or equivalent)
644 Micro syringes - 10 100 n l
645 Syringes - 05 10 and 5-mL gas tight with shut-off valve
65 MISCELLANEOUS
651 Standard solution storage containers -- 15-mL bottles with PTFE-11ned screw caps
7 REAGENTS AND CONSUMABLE MATERIALS
71 TRAP PACKING MATERIALS
711 26-Diphenylene oxide polymer 6080 mesh chromatographic grade (Tenax GC or equivalent)
712 Methyl silicone packing (optional) -- OV-1 (3X) on Chromoshysorb W 6080 mesh or equivalent
713 Silica gel -- 3560 mesh Davison grade IS or equivalent 5 714 Coconut charcoal -- Prepare from Barnebey Cheney CA-580-26
lot IM-2649 by crushing through 26 mesh screen
72 REAGENTS
721 MethanoljengtiiOefflonstrated to be free of analytes
722 Reagent water -- Prepare reagent water by passing tap water through a filter bed containing about 05 kg of activated carbon by using a water purification system or by boiling distilled water for IS min followed by a 1-h purge with inert gas while the water temperature is held at 90degC Store in clean narrow-mouth bottles with PTFE-llned septa and screw caps
723 Hydrochloric acid (1+1) -- Carefully add measured volume of cone HCI to equal volume of reagent water
724 Vinyl chloride -- Certified mixtures of vinyl chloride in nitrogen and pure vinyl chloride are available from several
294
-^
y fH- y_
sources (for example Matheson Ideal Gas Products and Scott Gases)
725 Ascorbic acid -- ACS reagent grade granular
73 STOCK STANDARD SOLUTIONS -- These solutions may be purchased as certified solutions or prepared from pure standard materials using the following procedures One of these solutions is required for every analyte of concern every surrogate and the internal standard A useful working concentration is about 1-5 mgmL
731 Place about 98 mL of methanol into a 10-mL ground-glass stoppered volumetric flask Allow the flask to stand unstoppered for about 10 min or until all alcohol-wetted surfaces have dried and weigh to the nearest 01 mg
732 If the analyte Is a liquid at room temperature use a 100-iL syringe and Immediately add two or more drops of reference standard to the flask Be sure that the reference standard falls directly into the alcohol without contacting the neck of the flask If the analyte Is a gas at room temperature fill a 5-mL valved gas-tight syringe with the standard to the 50-mL mark lower the needle to 5 mm above the methanol meniscus and slowly inject the standard Into the neck area of the flask The gas will rapidly dissolve in the methanol
733 Reweigh dilute to volume stopper then mix by inverting the flask several times Calculate the concentration In
n q l i l from the net gain in weight When compound purity is certified at 96X or greater the weight can be used without
correction to calculate the concentration of the stock standard 734 Store stock standard solutions in 15-mL bottles equipped
with PTFE-llned screw caps Methanol solutions prepared from liquid analytes are stable for at least 4 weeks when stored at 4degC Methanol solutions prepared from gaseous analytes are not stable for more than 1 week when stored at lt0degC at room temperature they must be discarded after 1 day
74 PRIMARY DILUTION STANDARDS - Use stock standard solutions to prepare primary dilution standard solutions that contain all the analytes of concern and the surrogates (but not the Internal standard) In methanol The prlm^ifdilution standards should be prepared at concentrations that can be easily diluted to prepare aqueous calibrashytion solutions that will bracket the working concentration range Store the primary dilution standard solutions with minimal headspace and check frequently for signs of deterioration or evaporation especially Just before preparing calibration solutions Storage times described for stock standard solutions in Sect 744 also apply to primary dilution standard solutions
295
75 FORTIFICATION SOLUTIONS FOR INTERNAL STANDARD AND SURROGATES
751 A solution containing the Internal standard and the surrogates is required to prepare laboratory reagent blanks (also used as a laboratory performance check solution) and to fortify each sample Prepare a fortification solution containing fluoroshybenzene (internal standard) 12- dichlorobenzene-d4 (surrogate) and BFB (surrogate) in methanol at concentrations of 5 xgmL of each A 5-ML aliquot of this solution added to a 25-mL water sample volume gives concentrations of 1 f t q l of each A S-^L aliquot of this solution added to a 5-mL water sample volume gives a concentration of 5 M Q A of each) Additional Internal standrds and surrogate analytes are optional
752 A solution of the Internal standard alone Is required to prepare calibration standards and laboratory fortified blanks The internal standard should be In methanol at a concentration of 5 MgmL
76 PREPARATION OF LABORATORY REAGENT BLANK shy- Fill a 25-mL (or 5-mL) syringe with reagent water and adjust to the mark (no air bubbles) Inject 10 n l of the fortification solution containing the internal standard and surrogates through the Luer Lok valve Into the reagent water Transfer the LRB to the purging device See Sect 1112
77 PREPARATION OF LABORATORY FORTIFIED BLANK shy Prepare this exactly like a calibration standard (Sect 78) This Is a calibration standard that is treated as a sample
78 PREPARATION OF CALIBRATION STANDARDS i i l0^^
- X 0
781
3
The number of calibration solutions (CALs) needed depends on the calibration range desired A minimum of three CAL solutions is required to calibrate a range of a factor of 20 In concentrashytion For a factor of 50 use at least four standards and for a factor of 100 at least five standards One calibration
1-So 5
standard should contain each analyte of concern and each surrogate at a concentration of 2-10 times the method detection limit (Tables 4-6) for that compound The other CAL standards should contain each analyte of concern and each surrogate at concentrations that define the range of the method Every CAL solution contains the Intemal standard at the same concentrashytion (5 M9L suggested for a 5-mL sample 1 i i g l for a 25-mL sample)
782 To prepare a calibration standard add an appropriate volume of a primary dilution standard (containing analytes and surrogates) to an aliquot of reagent water In a volumetric flask Use a microsyringe and rapidly inject the methanol solutions into the expanded area of the filled volumetric flask Remove the needle as quickly as possible after injection Mix by Inverting the
296 ^ m ^
^^flask three times only Discard the contents contained in the
neck of the flask Aqueous standards are not stable In a volumetric flask and should be discarded after 1 hr unless transferred to a sample bottle and sealed immediately
8 SAMPLE COLLECTION PRESERVATION AND STORAGE
81 SAMPLE COLLECTION DECHLORINATION AND PRESERVATION
811 Collect all samples In duplicate If samples contain residual chlorine and measurements of the concentrations of disinfection by-products (trihalomethanes etc) at the time of sample collection are desired add about 25 mg of ascorbic acid to the sample bottle before filling Fill sample bottles to overflowshying but take care not to flush out the rapidly dissolving ascorbic acid No air bubbles should pass through the sample as the bottle is filled or be trapped in the sample when the bottle is sealed Adjust the pH of the duplicate samples to lt2 by carefully adding one drop of 11 HCI for each 20 mL of sample volume Seal the sample bottles PFTE-face down and shake vigorously f o r 1 min
812 When sampling from a water tap open the tap and allow the system to flush until the water temperature has stabilized (usually about 10 min) Adjust the flow to about 500 mLmin and collect duplicate samples from the flowing stream
bull - shy
bdquo ^ 813 When sampling from an open body of water fill a 1-quart wide-mouth bottle or l-11ter beaker with sample from a representative area and carefully fill duplicate sample bottles from the 1-quart container
814 The samples must be chilled to 4degC on the day of collection and maintained at that temperature until analysis Field samples that will not be received at the laboratory on the day of collection must be packaged for shipment with sufficient ice to ensure that they will be at 4degC on arrival at the laboratory
82 SAMPLE STORAGE
821 Store samples at 4degC until analysis The sample storage area must be free of organic solvent vapors
822 Analyze all samples within 14 days of collection Samples not analyzed within this period must be discarded and replaced
83 FIELD REAGENT BLANKS
831 Duplicate field reagent blanks must be handled along with each sample set which is composed of the samples collected from the same general sample site at approximately the same time At the laboratory fill field blank sample bottles with reagent
V 297
water seal and ship to the sampling site along with empty sample bottles and back to tht laboratory with filled sample bottles Wherever a set of samples Is shipped and stored it is accompanied by appropriate blanks
832 Use the same procedures used for samples to add ascorbic acid and HCI to blanks (Sect 811)
9 CALIBRATION
91 Demonstration and documentation of acceptable initial calibration is required before any samples are analyzed and Is required intermittently throughout sample analysis as dictated by results of continuing calibration checks After Initial calibration Is successful a continuing calibration check Is required at the beginning of each 8 hr period during which analyses are performed Additional periodic calibration checks are good laboratory practice
92 Initial calibration
921 Calibrate the mass and abundance scales of the MS with calibrashytion compounds and procedures prescribed by the manufacturer with any modifications necessary to meet the requirements in Sect 922
922 Introduce Into the GC (either by purging a laboratory reagent blank o r making a syringe Injection) 25 ng of BFB and acquire mass spectra for ivz 35-260 at 70 eV (nominal) Use the purging procedure andor GC conditions given In Sect Hi If thespectrum does not meet all criteria In Table 2raquo the MS must be retuned and adjusted to meet all criteria before proceeding with calibration An average spectrum across the GC peak may be used to evaluate the performance of the system
923 Purge a medium CAL solution for example 10-20 |tgL using the procedure given In Sect 11
924 Performance criteria for the medium calibration Examine the stored GCMS data with the data system software Figure 3 shows an acceptable total ion chromatogram
9241 GC performance Good column performance will produce symmetrical peaks with minimum tailing for most compounds If peaks are broad or sensitivity poor see Sect 936 for some possible remedial actions
9242 MS sensitivity The GCMSOS peak Identification software should be able to recognize a GC peak in the appropriate retention time window for each of the compounds In calibration solution and make correct tentative Identifications If fewer than 99 of the
^ ^
298
compounds are recognized system maintenance is laquo-lt- required See Sect 936
925 If all performance criteria are met purge an aliquot of each of the other CAL solutions using the same GCMS conditions
926 Calculate a response factor (RF) for each analyte surrogate and isomer pair for each CAL solution using the internal standard fluorobenzene Table 1 contains suggested quantitation ions for all compounds This calculation Is supported in acceptable GCMS data system software (Sect 634) and many other software programs RF is a unitless number but units used to express quantities of analyte and Internal standard must be equivalent
R F (Ax)(Qis) (AisXQx)
where Ax - integrated abundance of the quantitation ion of the analyte
A^s - Integrated abundance of the quantitation ion of the Intemal standard
Qx quantity of analyte purged In ng or concentration units
Q^s laquo quantity of internal standard purged in ng or concentration units
W YQ 9261 For each analyte and surrogate calculate the mean RF -gt-^ from the analyses of the CAL solutions Calculate the ^ lty poundgtS0 standard deviation (SD) and the relative standard
^ 70o deviation (RSD) from each mean RSD - 100 (SDM) If the RSD of any analyte or surrogate mean RF exceeds 20 either analyze additional aliquots of appropriate CAL solutions to obtain an acceptable RSD of RFs over the entire concentration range or take action to improve GCMS performance See Sect 927
o gti(^ ^ ^ 927 As an alternative to calculating mean response factors and eS ^ ^ applying the RSD test use the GCMS data system software or
C^^ other available software to generate a second or third order regression calibration curve
93 Continuing calibration check Verify the MS tune and initial calibrashytion at the beginning of each 8-hr work shift during which analyses are performci using the following procedure
931 Introduce into the GC (either by purging alaboratory reagent blank or making a syringe injection) 25 ng of BFB and acquire a mass spectrum that includes data for mz 35-260 If the spectrum does not meet all criteria (Table 2 ) the MS must be
- 299
932
933
934
p 935^ J
JL- ^O^ Vgtbull V Qgt^^
f v ^ ^C^C
936
retuned and adjusted to meet all criteria before proceeding with the continuing calibration check
Purge a medium concentration CAL solution and analyze with the same conditions used during the initial calibration
Demonstrate acceptable performance for the criteria shown in Sect 924
Determine that the absolute areas of the quantitation ions of the internal standard and surrogates havenot decreased by more than 30 from the areas measured In the most recent continuing calibration check o r by more than 50 from the areas measured during Initial calibration If these areas have decreased by more than these amounts adjustments must be made to restore system sensitivity These adjustments may require cleaning of the HS ion source or other maintenance as Indicated In Sect 936 and recalibration Control charts are useful aids in documenting system sensitivity changes
Calculate the RF for each analyte and surrogate from the data measured In the continuing calibration check The RF for each analyte and surrogate must be within 30 of the mean value measured In the initial calibration Alternatively If a second
or third order regression Is used the point from the continuing calibration check for each analyte and surrogate must fall
within the analysts Judgement on the curve from the initial calibration If these conditions do not exist remedial action must be taken which may require re-Initial calibration gtlaquo
Some possible remedial actions Major maintenance such as cleaning an Ion source cleaning quadrupole rods etc require returning to the initial calibration step
9361 Check and adjust GC andor MS operating conditions check the NS resolution and calibrate the mass scale
9362 Clean or replace the splitless injection liner silanize a new injection liner
9363 Flush the GC column with solvent according to manushyfacturers instructions
9364 Break off a short portion (about 1 meter) of the column from the end near the Injector o replace GC column This action will cause a change In retention times
9365 Prepare fresh CAL solutions and repeat the initial calibration step
9366 Clean the MS ion source and rods (if a quadrupole)
300
9367 Replace any components that allow analytes to come into contact with hot metal surfaces
9368 Replace the MS electron multiplier or any other faulty components
94 Optional calibration for vinyl chloride using a certified gaseous mixture of vinyl chloride in nitrogen can be accomplished by the following steps
941 Fill the purging device with 250 mL (or 5-mL) of reagent water or aqueous calibration standard
942 Start to purge the aqueous mixture Inject a known volume (between 100 and 2000 M L ) of the calibration gas (at room temperature) directly into the purging device with a gas tight syringe Slowly Inject the gaseous sample through a septum seal at the top of the purging device at 2000 Mtm1n If the injection of the standard is made through the aqueous sample inlet port flush the dead volume with several mL of room air or carrier gas Inject the gaseous standard before 5 min of the 11-min purge time have elapsed
943 Determine the aqueous equivalent concentration of vinyl chloride standard In i t q l Injected with the equation
S - 0102 (C)(V)
where S - Aqueous equivalent concentration of vinyl chloride standard in MgL
C - Concentration of gaseous standard in ppm (vv) V - Volume of standard injected In milliliters
10 QUALITY CONTROL
101 Quality control (QC) requirements are the initial demonstration of laboratory capability followed by regular analyses of laboratory reagent blanks field reagent blanks and laboratory fortified blanks The laboratory must maintain records to document the quality of the data generated Additional quality control practices are recommended
102 Initial demonstration of low system background Before any samples are analyzed It must be demonstrated that a laboratory reagent blank (LRB) Is reasonably free of contamination that would prevent the determination of any analyte of concern Sources of background contamination are glassware purge gas sorbants and equipment Background contamination must be reduced to an acceptable level before proceeding with the next section In general background from method analytes should be below the method detection limit
301
103 Initial demonstration of laboratory accuracy and precision Analyze five to seven replicates of a laboratory fortified blank containing each analyte of concem at a concentration In the range of 02-5 M9L (see regulations and maximum contaminant levels for guidance on appropriate concentrations)
1031 Prepare each replicate by adding an appropriate aliquot of a quality control sample to reagent water If a quality control sample containing the method analytes is not available a primary dilution standard made from a source of reagents different than those used to prepare the calibration standards may be used Also add the appropriate amounts of internal standard and surrogates If they are being used Analyze each replicate according to the procedures described In Section 11 and on a schedule that results In the analyses of all replicates over a period of several days
1032 Calculate the measured concentration of each analyte in each replicate the mean concentration of each analyte in all replicates and mean accuracy (as mean percentage of true value) for each analyte and the precision (as relative standard deviation RSD) of the measurements for each analyte Calculate the HDL of each analyte using the procedures described in Sect^ 132 (2)
10^33 For each analyte and surrogate the mean accuracy expressed as a percentage of the true value should be 80-120 and the RSD should be lt20 Some analytes particularly the early eluting gases and late eluting higher molecular weight gt-lt compounds are measured wjth less accampracy and precision than ^ other analytes The method detection limits must be sufficient to detect analytes at the required levels If these criteria are not met for an analyte take remedial action and repeat the measurements for that analyte to demonstrate acceptable performance before samples are analyzed
1034 Develop and maintain a system of control charts to plot the precision and accuracy of analyte and surrogate measurements as a function of time Charting of surrogate recoveries is an especially valuable activity since these are present in eyery sample and the analytical results will form a signishyficant record of data quality
104 Monitor the Integrated areas of the quantitation ions of the Internal standards and surrogates In continuing calibration checks These should remain reasonably constant over time A drift of more than 50 in any area Is indicative of a loss In sensitivity and the problem must be found and corrected These Integrated areas should also be reasonably constant In laboratory fortified blanks and samples
302
bullIf-J
105 Laboratory reagent blanks Uith each batch of samples processed as a group within a work shift analyze a laboratory reagent blank to determine the background system contamination A FRB (Sect 107) may be used in place of a LRB
106 With each batch of samples processed as a group within a work shift analyze a single laboratory fortified blank (LFB) containing each analyte of concern at a concentration as determined in 103 If more than 20 samples are included in a batch analyze one LFB for every 20 samples Use the procedures described in 1033 to evaluate the accuracy of the measurements and to estimate whether the method detection limits can be obtained If acceptable accuracy and method detection limits cannot be achieved the problem must be located and corrected before further samples are analyzed Add these results to the on-going control charts to document data quality
107 With each set of field samples a field reagent blank (FRB) should be analyzed The results of these analyses will help define contaminashytion resulting from field sampling and transportation activities If the FRB shows unacceptable contamination a LRB must be measured to define the source of the impurities
108 At least quarterly replicates of laboratory fortified blanks should be analyzed to determine the precision of the laboratory measureshyments Add these results to the on-going control charts to document data quality
109 At least quarterly analyze a quality control sample (QCS) from an external source If measured analyte concentrations are not of acceptable accuracy check the entire analytical procedure to locate and correct the problem source
1010 Sample matrix effects have not been observed when this method is used with distilled water reagent water drinking water and ground water Therefore analysis of a laboratory fortified sample matrix (LFM) is not required It is recommended that sample matrix effects be evaluated at least quarterly using the QCS described in 109
1011 Numerous other quality control measures are incorporated into other parts of this procedure and serve to alert the analyst to potential problems
11 PROCEDURE
111 SAMPLE INTRODUCTION AND PURGING
1111 This method is designed for a 25-mL sample volume but a smaller (5 mL) sample volume is recommended if the GCMS system has adequate sensitivity to achieve the required method detection limits Adjust the purge gas (nitrogen or helium) flow rate to 40 mLmin Attach the trap inlet to the
303
purging device and open the syringe valve on the purging device t
1112 Remove the plungers from two 25-mL (or 5-mL depending onsample size) syringes and attach aclosed syringe valve toeach Warm the sample to room temperatureopen the sample bottle and carefully pour the sample into one of the syringe barrels to Just short of overflowing Replace the syringe plunger invert the syringe and compress the sample Open the syringe valve and vent any residual air while adjusting the sample volume to 250-mL (or 5-mL) For samples and blanks add 5-ML of the fortification solution containing the Internal standard and the surrogates to the sample through the syringe valve For calibration standards and laboratory fortified blanks add S-ML of the fortification solution containing the Internal standard only Close the valve Fill the second syringe In an Identical manner from the same sample bottle Reserve this second syringe for a reanalysis if necessary
^ ^
1113 Attach the sample syringe valve to the syringe valve on the purging device Be sure that the trap is cooler than 25degC then open the sample syringe valve and inject the sample into the purging chamber Close both valves and initiate purging Purge the sample for 110 min at ambient temperature
112 SAMPLE DESORPTION
1121 Non-cryogenic Interface shy- After the 11-min purge place the purge and trap systen^jn the desorb mode and preheat the trapto IBO C without a flow of desorption gas Then simultanshyeously start the flow of desorption gas at 15-mLm1n for about 4 min begin the temperature program of the gas chromatograph and start data acquisition
^ ^
1122 Cryogenic Interface shy- After the 11-min purge place the purge and trap system In the desorb mode make sure the cryogenic Interface Is a -150lt C or lower and rapidly heat the trap to 180degC while backflushing with an Inert gas at 4 mLmin for about 5 min At the end of the 5 min desorpshytion cycle rapidly heat the cryogenic trap to 250degC and simultaneously begin the temperature program of the gas chromatograph and start data acquisition
1123 Uhlle the trapped components are being Introduced Into the gas chromatograph (or cryogenic Interface) empty the purging device using the sample syringe and wash the chamber with two 25-mL flushes of reagent water After the purging device has been emptied leave syringe valve open to allow the purge gas to vent through the sample Introduction needle
304
^
113
^ 1 1 bull
114
115
116
GAS CHROMATOGRAPHYMASS SPECTROMETRY - Acquire and store data over the mass range 35-260 with a total cycle time (Including scan overhead tine) of 2 sec or less Cycle time must be adjusted to measure five or more spectra during the elution of each GC peak Several alternative temperature programs can be used
1131 Single ramp linear temperature program for wide bore columns 1 and 2 with a Jet separator Adjust the helium carrier gas flow rate to about 15 mLmin The column temperature is reduced lO^C and held for 5 min from the beginning of desorption then programmed to 160degC at 6degCmin and held until all components have eluted
1132 Multi-ramp linear temperature program for wide bore column 2 with the open split Interface Adjust the helium carrier gas flow rate to about 46 mLmin The column temperature is reduced lO C and held for 6 min from the beginning of desorption then heated to 70OC at IQOmin heated to 120OC at 50niin heated to 180deg at 8degmin and held at 180deg until all compounds have eluted
1133 Single ramp linear temperature program for narrow bore column 3 with a cryogenic interface Adjust the helium carrier gas flow rate to about 4 mLmin The column temperature is reduced 10degC and held for 5 min from the beginning of vaporization from the cryogenic trap programmed at 6degCmin for 10 min then IS^Cmin for 5 min to 145ltgtC and held until all components have eluted
TRAP RECONDITIONING -- After desorbing the sample for 4 min recondition the trap by returning the purge and trap system to the purge mode Uait 15 sec then close the syringe valve on the purging device to begin gas flow through the trap Maintain the trap temperature at 180degC After approximately 7 min turn off the trap heater and open the syringe valve to stop the gas flow through the trap Uhen the trap Is cool the next sample can be analyzed
TERMINATION OF DATA ACQUISITION -- When all the sample components have eluted from the GC terminate MS data acquisition Use appropriate data output software to display full range mass spectra and appropriate plots of ion abundance as a function of time If any ion abundance exceeds the system working range dilute the sample aliquot In the second syringe with reagent water and analyze the diluted aliquot
IDENTIFICATION OF ANALYTES -- Identify a sample component by comparison of Its mass spectrum (after background subtraction) to a reference spectrum In the user-created data base The GC retention time of the sample component should be within three standard deviations of the mean retention time of the compound in the calibration mixture
305
1161 In general all Ions that are present above 10 relative abundance In the mass spectrum of the standard should be present in the mass spectrum of the sample component and should agree within absolute 20 For example if an ion has a relative abundance of 30 In the standard spectrum its abundance in the sample spectrum should be in the range of 10 to 50 Some ions particularly the molecular ion are of special importance and should be evaluated even if they are below 10 relative abundance
1162 Identification requires expert Judgement when sample components are not resolved chromatographically and produce mass spectra containing Ions contributed by more than one analyte Uhen GC peaks obviously represent more than one sample component (Ie broadened peak with shoulder(s) or valley between two or more maxima) appropriate analyte spectra and background spectra can be selected by examining plots of characteristic Ions for tentatively identified components Uhen analytes coelute (Ie only one GC peak is apparent) the identification criteria can be met but each analyte spectrum will contain extraneous ions contributed by the coeluting compound Because purgeable^organic compounds are relatively small molecules and producV comparatively simple mass spectra this Is not a significant problem for most method analytes
1163 Structural Isomers that produce very similar mass spectra can be explicitly Identified only if they have sufficiently different GC retention times Acceptable resolution is achieved If the height of the valley between two peaks is less than 25 of the average height of the two peaks Otherwise structural Isomers are Identified as Isomeric pairs Two of the three Isomeric xylenes and two of the three dichlorobenzenes are examples of structural Isomers that may not be resolved on the capillary columns If unresolved these groups of isomers must be reported as isomeric pairs
1164 Methylene chloride and other background components appear in variable quantities In laboratory and field reagent blanks and generally cannot be accurately measured Subtraction of the concentration In the blank from the concentration in the sample Is not acceptable because the concentration of the background In the blank Is highly variable
12 CALCULATIONS
121 Complete chromatographic resolution Is not necessary for accurate and precise measurements of analyte concentrations If unique Ions with adequate Intensities are available for quantitation
306
Ci
--N
1211 Calculate analyte and surrogate concentrations
Ax)(Qis) 1000 Cx
(Ais) RP V where Cx - concentration of analyte or surrogate in MQL in
the water sample Ax - Integrated abundance of the quantitation ion
of the analyte in the sample As bull integrated abundance of the quantitation ion
of the internal standard in the sample Qis - total quantity (in micrograms) of internal
standard added to the water sample V gt original water sample volume In mL RF - mean response factor of analyte from the
initial calibration
1212 Alternatively use the GCMS system software or other available proven software to compute the concentrations of the analytes and surrogates from the second or third order regression curves
1213 Calculations should utilize all available digits of precisshyion but final reported concentrations should be rounded to an appropriate number of significant figures (one digit of uncertainty) Experience indicates that three significant figures may be used for concentrations above 99 M9Lgt two significant figures for concentrations between 1- 99 M9L and one significant figure for lower concentrations
1214 Calculate the total trihalomethane concentration by summing the four individual trihalomethane concentrations In M9t-shy
13 ACCURACY AND PRECISION
131 Single laboratory accuracy and precision data were obtained for the method analytes using laboratory fortified blanks with analytes at concentrations between 1 and 5 MgLgt four sets of results were obtained using the three columns specified (Sect 632) and the open split cryogenic and jet separator interfaces (Sect 633) These data are shown in Tables 4-6
132 Uith these data method detection limits were calculated using the formula (2)
MDL - S t(niialpha - 099)
where
^(n-ll-alpha bull 099) Students t value for the 99 confidence level with n-1 degrees of freedom
307
n - number of replicates
S - the standard deviation of the replicate analyses ^J
14 REFERENCES
1 A Alford-Stevens JU Elchelberger UL Budde Purgeable Organic Compounds in Uater by Gas ChromatographyMass Spectrometry Method 524 Environmental Monitoring and Support Laboratory US Environmental Protection Agency Cincinnati Ohio February 1983
2 Madding C Volatile Organic Compounds in Uater by Purge and Trap Capillary Column GCMS Proceedings of the Uater Quality Technology Conference American Uater Works Association Denver CO December 1984
3 Glaser JA OL Foerst GD McKee SA Quave and UL Budde Trace Analyses for Uastewaters Environ Sci Technol 15 1426 1981
4 Carcinogens-Uorking with Carcinogens Department of Health Education and Uelfare Public Health Service Center for Disease Control National Institute for Occupational Safety and Health Publication No 77-206 August 1977
5 OSHA Safety and Health Standards General Industry (29CFR1910) Occupational Safety and Health Administration OSHA 2206 (Revised January 1976)
6 Safety in Academic Chemistry Laboratories American Chemical Society Publication Committee on Chemical Safety 3rd Edition 1979
7 Arrendale RF RF Severson and OT Chortyk Open Split Interface for Capillary Gas ChromatographyMass Spectrometry Anal Chem 1984 5g 1533
8 Flesch JJ PS Fair The Analysis of Cyanogen Chloride in Drinking Water Proceedings of Uater Quality Technology Conference American Water Works Association St Louis MO November 14-16 1988
308 ^
c
TABLE 1 MOLECULAR UEIGHTS ANO QUANTITATION IONS FOR NETHOO ANALYTES
Comoound
Internal standard
Fluorobenzene
Surrogate
4-Bromof1uorobenzene l2-Dichlorobenzene-d4
Taraet Analvtes
Benzene Bromobenzene Bromochloromethane Bromodichloromethane Bromoform Bromomethane n-Butylbenzene sec-Butyl benzene tert-Butylbenzene Carbon tetrachloride Chlorobenzene Chloroethane Chloroform Chloromethane 2-Chlorotoluene 4-Chlorotoluene Di bromochloromethane l2-Dibromo-3-Chloropropane 12-Dibromoethane Dibromomethane 12-Dichlorobenzene 13-Dichlorobenzene 14-Dichlorobenzene Di chiorodi f1uoromethane 11-Dichloroethane 12-Dichloroethane 11-Dichloroethene cis-12-Dichloroethene trans-12-Dichloroethene 12-Dichloropropane 13-Dichlpropropane 22-Dichloropropane 11-Dichloropropene
MW
96
174 150
78 156 128 162 250 94 134 134 134 152 112 64 118 50 126 126 206 234 186 172 146 146 146 120 98 98 96 96 96 112 112 112 110
Primary Quantitation
Ion
96
95 152
78 156 128 83 173 94 91 105 119 117 112 64 83 50 91 91 129 75 107 93 146 146 146 85 63 62 96 96 96 63 76 77 75
Secondary Quantitation
Ions
77
174176 115150
77 77158 49130 85127 175252
96 134 134 91 119
77114 66 85 52 126 126 127
155157 109188 95174 111148 111148 111148
87 6583
98 6163 6198 6198 112 78 97
11077
309
0 TABLE 1 (continued)
Primary Secondary Quantitation Quantitation
Comoound HW Ion Ions
cis-13-dichloropropene 110 75 110 trans-13-dichloropropene 110 75 110 Ethylbenzene 106 91 106 Hexachlorobutadiene 258 225 260 Isopropylbenzene 120 105 120 4-Isopropyltoluene 134 119 13491 Methylene chloride 84 84 8649 Naphthalene 128 128 n-Propyl benzene 120 91 120 Styrene 104 104 78 1112-Tetrachloroethane 166 131 133119 1122-Tetrachloroethane 166 83 13185 Tetrachloroethene 164 166 168129 Toluene 92 92 91 123-Trichlorobenzene 180 180 182 124-Trichlorobenzene 180 180 182 111-Trichloroethane 132 97 9961 112-Trichloroethane 132 83 9785 Trichloroethene 130 95 130132 Tri chiorof1uoromethane 136 101 103 123-Trichloropropane 146 75 77 124-Trimethylbenzene 120 105 120 135-Trimethylbenzene 120 105 120 Vinyl Chloride 62 62 64
bull
0-Xylene 106 106 91 m-Xylene 106 106 91 p-Xylene 106 106 91
^Monoisotopic molecular weight calculated from the atomic masses of the isotopes with the smallest masses
310
TABLE 2 CHROMATOGRAPHIC RETENTION TINES FOR NETHOD ANALYTES ON THREE COLUMNS UITH FOUR SETS OF CONDITIONS
Retention K^^ (minrsec) Compound
Internal standard
Fluorobenzene
Surrocates
4-Bromofluorobenzenel2-Dichlorobenzene-d4
Target Analvtes
Benzene Bromobenzene Bromochloromethane Bromodichloromethane Bromoform Bromomethane n-Butyl benzene shysec-Butyl benzene tert-Butylbenzene Carbon Tetrachloride Chlorobenzene Chloroethane Chloroform Chloromethane 2-Chlorotoluene 4-Chlorotoluene Cyanogen chloride Di bromochloromethane l2-Dibromo-3-Chloropropane 12-Dibromoethane Dibromomethane 12-Dichlorobenzene 13-Di chiorobenzene 14-Dichlorobenzene Dichlorodifluoromethane 11-Dichloroethane 12-Dichloroethane 11-Dichloroethene cis-12-Dichloroethene trans-12-Dichloroethene 12-Dichloropropane 13-Dichloropropane 22-Dichloropropane 11-Dichloropropene
Column 1deg Column 2deg Column 1 ^
849 627
1838 1543 2216 1908
814 540 1857 1552 644 423
1035 829 1756 1453 201 058
2213 1929 2047 1805 2017 1734 737 516
1546 1301 205 101 624 448 138 044
1920 1625 1930 1643
1423 1151 2432 2105 1444 1150 1039 756 2231 1910 2113 1808 2133 1823
133 042 451 256 824 550 253 134 611 354 359 222
1005 740 1402 1119 601 348 749 517
1406
2338 2725
1330 2400 1222 1548
- 2246 448
2732 260B 2536 1310 2040
1236 324
2432 2446
1912
1924 1526 2726 2622 2636 308
1048 1338 750
1156 954
1512 1842 1152 1306
Column 3^
803
725 1625 538 920
1542 117
1757 1728 1719 725
1420 127 533 058
1644 1649 103
1248 1802 1336 905
1747 1728 1738 053 402 700 220 504 332 856
1229 519 710
311
TABLE 2 (continued)
Retention K^^ (min sec) Compound Column 1^ Column 2deg Column 2^ Column ^^ cis-13-dichloropropenetrans-13-dichloropropeneEthylbenzeneHexachlorobutadiene
1559 2659
1323 2341
1754 1642
2100 3204
1444 1914
Isopropylbenzene4-IsopropyltolueneMethylene ChlorideNaphthalenen-Propyl benzeneStyrene1112-Tetrachloroethane
1804 2112 336
2710 1904
1719 1556
1528 1831 204 2331 1625 1436 1320
2318 2630 916 3212 2420 2224 2052
1625 1738 240 1904 1649 1547 1444
1122-Tetrachloroethane 1843 1621 2404 1547 Tetrachloroethene 1344 1109 1836 1312 Toluene 1226 1000 1724 1131 123-Trichlorobenzene 2747 2411 3258 1914 124-Trichlorobenzene 2633 2305 3130 1850 111-Trichloroethane 716 450 1250 646 112-Trichloroethane 1325 1103 1818 1159 Trichloroethene 935 716 1448 901 Trichlorofluoromethane 216 111 612 146 123-Trichloropropane124-Trimethylbenzene135-TrimethylbenzeneVinyl chlorideo-Xylenem-Xylenep-Xylene
1901 2020 1928
143 1707 1610 1607
1614 1742 1654 047 1431 1341 1341
2408 3130 2450 356 2216 2122 2118
1616 1719 1659 102 1547 1518 1518
^Columns 1-3 are those given In Sect 6321 retention times were measured from the beginning of thermal desorption from the trap (columns 1-2) or from the beginning of thermal release from the cryogenic interface (column 3) degGC conditions given in Sect 1131 ^GC conditions given in Sect 1132 OGC conditions given in Sect 1133
-A
312
TABLE 3 ION ABUNDANCE CRITERIA FOR 4-BRaMOFLUOROBENZENE (BFB)
Mass fMzl
50 75 95 96 173 174 175 176 177
Relative Abundance Criteria
15 to 40 of mass 95 30 to 80 of mass 95 Base Peak 100 Relative Abundance 5 to 9 of mass 95 lt 2 of mass 174 gt 50 of mass 95 5 to 9 of mass 174 gt 95 but lt 101 of mass 174 5 to 9 of mass 176
313
TABLE 4 ACCURACY ANO PRECISION DATA FRON 16-31 OHERMINATIONS OF THE NETHOO ANALYTES IN REAfiENT HATER USING VIDE BORE CAPILUWY COLUNI 1gt
Compound
Benzene Bromobenzene Bromochloromethane Bromodi chioromethane Bromoform Bromomethane n-ButyIbenzene sec-Butyl benzene tert-Butylbenzene Carbon tetrachloride Chlorobenzene Chloroethane Chloroform Chloromethane 2-Chlorotoluene 4-Chlorotoluene 01bromochloromethane l2-Dibromo-3-chloropropane 12-Dibromoethane Dibromomethane 12-Oichlorobenzene 13-Dichlorobenzene 14-Dichlorobenzene Di chiorodi f1uoromethane 11-Dichloroethane 12-Dichloroethane 11-Dichloroethene cis-12 Dichloroethene trans-12-Oichloroethene 12-Dichloropropane 13-Dichloropropane 22-Dichloropropane 11-Dichloropropene cis-l2-Dichloropropene trans-12-Di chioropropene Ethylbenzene Hexachlorobutadiene Isopropylbenzene 4-Isopropyltoluene Methylene chloride Naphthalene n-Propyl benzene Styrene
True Cone Range fUQL)
01-10 01-10 05-10 01-10 05-10 05-10 05-10 05-10 05-10 05-10 01-10 05-10 05-10 05-10 01-10 01-10 01-10 05-10 05-10 05-10 01-10 05-10 02-20 05-10 05-10 01-10 01-10 05-10 01-10 01-10 01-10 05-10 05-10
01-10 05-10 05-10 01-10 01-10 01-100 01-10 01-100
Mean Accuracy
( of True Value)
97 100 90 95 101 95 100 100 102 84 98 89 90 93 90 99 92 83 102 100 93 99 103 90 96 95 94 101 93 97 96 86 98
99 100 101 99 95 104 100 102
Rel Std Dev ()
57 55 64 61 63 82 76 76 73 88 59 90 61 89 62 83 70 199 39 56 62 69 64 77 53 54 67 67 56 61 60 169 89
86 68 76 67 53 82 58 72
Method Det Limit (ual)
004 003 004 008 012 011 011 013 014 021 004 010 003 013 004 006 005 026 006 024 003 012 003 010 004 006 012 012 006 004 004 035 010
006 011 015 012 003 004 004 004
314
TABLE 4 (Continued)
True Mean Rel Method Cone Accuracy Std Oet Range ( of True Dev Limit
Compound fuoLl Valuel IX) (uoLl
1112-Tetrachl oroethane 05-10 90 68 005 1122-Tetrachloroethane 01-10 91 63 004 Tetrachloroethene 05-10 89 68 014 Toluene 05-10 102 80 011 123-Trichlorobenzene 05-10 109 86 003 124-Trichlorobenzene 05-10 108 83 004 111-Trichloroethane 05-10 98 81 008 112-Trichloroethane 05-10 104 73 010 Trichloroethene 05-10 90 73 019 Tri chiorof1uoromethane 05-10 89 81 008 123-Trichloropropane 05-10 108 144 032 124-Trimethyl benzene 05-10 99 81 013 135-Triraethylbenzene 05-10 92 74 005 Vinyl chloride 05-10 98 67 017 o-Xylene 01-31 103 72 011 m-Xylenc 01-10 97 65 005 p-Xylene 05-10 104 77 013
k ^Data obtained by Robert U Slater using column 1 with a Jet separator-interface and a quadrupole mass spectrometer (Sect 1131) with analytes divided among three solutions
315
TABLE 5 ACCURACY ANO PRECISION DATA FRON SEVEN DETERMINATIONS OF THE NETHOO ANALYTES IN REAGENT UATER USING THE CRYOGENIC TRAPPING OPTION AND A NARROW BORE CAPILLARY COLUNN 3
Comoound
Benzene Bromobenzene Bromochloromethane Bromodichloromethane Bromoform Bromomethane n-Butylbenzene sec-Butylbenzene tert-Butylbenzene Carbon tetrachloride Chlorobenzene Chloroethane Chloroform Chloromethane 2-Chlorotoluene 4-Chlorotoluene Cyanogen chloride^ Di bromochloromethane 12-Di bromo-3-chloropropane 12-Dibromoethane Dibromomethane 12-Oichlorobenzene 13-01chiorobenzene 14-Dichlorobenzene Dichlorodi f1uoromethane 11-01chioroethane 12-Dichloroethane 11-Dichloroethene cis-12 Dichloroethene trans-12-Dichloroethene 12-Dichloropropane 13-Dichloropropane 22-Dichloropropane 11-Dichloropropene cis-l3-01chloropropene trans-13-Dlchloropropene Ethylbenzene Hexachlorobutadiene Isopropylbenzene 4-Isopropytoluene Methylene chloride Naphthalene
True Cone fuaL)
01 05 05 OI 01 01 05 05 05 01 01 01 01 01 01 01
01 01 01 01 01 01 01 01 01 01 01 01 01 01 01 01 01
01 01 05 05 05 01
Mean Accuracy ( of True Valuel
99 97 97 100 99 99 94 90 90 92 91 100 95 99 99 96 92 99 92 97 93 97 99 93 99 98 100 95 100 98 96 99 99 98
99 100 98 87 97 98
Rel Std Dev ()
62 74 58 46 54 71 60 71 25 68 58 58 32 47 46 70 106 56 100 56 69 35 60 57 88 62 63 90 37 72 60 58 49 74
52 67 64rr 130 130 72
Method Dect Limit
(UQL)
003 011 007 003 020 006 003 012 033 008 003 002 002 005 005 005 030 007 005 002 003 005 005 004 011 003 002 005 006 003 002 004 005 002
003 004 010 026 009 004
316
TABLE 5 (Continued)
Comoound
n-Propylbenzene Styrene 1112-Tetrach1oroethane 1122-Tetrachloroethane Tetrachloroethene Toluene 123-Trichlorobenzene 124-Trichlorobenzene il1-Trichloroethane 112-Trichloroethane Trichloroethene Trichlorofluoromethane 123-Trichloropropane 124-Tri methyl benzene 135-Trimethylbenzene Vinyl chloride o-Xylene m-Xylene p-Xylene
True Cone
(ual)
01 01 01 05 01 01 01 01 01 01 01 01 01 01 01 01 01 01 01
Mean Accuracy ( of True Valuel
99 96 100 100 96 100 98 91 100 98 96 97 96 96 99 96 94 94 97
Rel Std Dev 1)
66 190 47 120 50 59 89 160 40 49 20 46 65 65 42 02 75 46 61
Method Dect Limit
lUQl)
006 006 004 020 005 008 004 020 004 003 002 007 003 004 002 004 006 003 006
^Data obtained by Caroline A Madding using column 3 with a cryogenic interface and a quadrupole mass spectrometer (Sect 1133)
Reference 8
317
TABLE 6 ACCURACY AND PRECISION DATA FRON SEVEN OCTERMINATIONS OF THE MrrHOO ANALYTES IN REAGENT UATER USING UIDE BORE CAPILLARY COLUNN 2
CQmPound NJLL 0
Mean Accuracy ( of True
Value 2 uoL Concl
RSD )
Mean Accuracy ( of True
Value 02 OTL Cone)
RSD )
Internal Standard
Fluorobenzene 1
Surrogates
4-Bromofluorobenzene l2-Dichlorobenzene-d4
2 3
98 97
18 32
96 95
13 17
Target Analvtes
Benzene Bromobenzene Bromochloromethane Bromod i chioromethane Bromoform Bromomethane n-Butylbenzene sec-Butylbenzene tert-Butylbenzene Carbon tetrachloride Chlorobenzene Chloroethane^ Chloroform Chloromethane 2-Chlorotoluene 4-Chlorotoluene Di bromochloromethane l2-Dibromo-3-chloropropane 12-DibromoethaneC Dibromomethane 12-Dichlorobenzene 13-Dichlorobenzene 14-Dichlorobenzene Di chiorodi f1uoromethane 11-Oichloroethane 12-Dichloroethane 11-Oichloroethene cis-12-Dichloroethene trans-12-Dichloroethene
37 38 4 5 6 7 39 40 41 8 42
9 10 43 44 11
|C
13 45 46 47 14 15 16 17 18 19
97 102 99 96 89 55 89 102 101 84 104
97 110 91 89 95
99 93 100 98 38 97 102 90 100 92
44 30 52 18 24 27 48 35 45 32 31
20 50 24 20 27
21 27 40 41 25 23 38 22 34 21
113 101 102 100 90 52 87 100 100 92 103
95 d 108 108 100
95 94 87 94 d 85 100 87 89 85
18 19 29 18 22 67 23 28 29 26 16
21
31 44 30
22 51 23 28
36 21 3 8 29 23
6
318
TABLE 6 (Continued)
f v
Mean Accuracy Mean Accuracy ( of True ( of True
Value RSD Value RSD CQmpQund NQ 2 uoL Concl ) 02 ugL Concl fl
12-Dichloropropane 20 102 22 103 29 13-Dichloropropane 21 92 37 93 32 22-Dichloropropane^ 11-Dichloropropene^ cis-13-Dichloropropene^ trans-13-Dichloropropene 25 96 17 99 21 Ethylbenzene 48 96 91 100 40 Hexachlorobutadiene 26 91 53 88 24 Isopropylbenzene 49 103 32 101 21 4-Isopropyltoluene 50 95 36 95 31 Methylene chloride 27 e e Naphthalene 51 93 76 78 83 n-Propylbenzene 52 102 49 97 21 Styrene 1112-Tetrachloroethane 1122-Tetrachloroethane Tetrachloroethene
53 28 29 30
95 99 101 97
44 27 46 45
104 95 84 92
31 38 36 33
Toluene 54 105 28 126 17 123-Trichlorobenzene 55 90 57 78 29 124-Trichlorobenzene 111-Trichloroethane 112-Trichloroethane Trichloroethene
56 31 32 33
92 94 107 99
52 39 34 29
83 94 109 106
59 25 28 25
Tri chiorof1uoromethane 34 81 46 48 13 123-Trichloropropane 124-Trimethylbenzene 135-Trimethylbenzene Vinyl chloride o-Xylene m-Xylene p-Xylene
35 57 58 36 59 60 61
97 93 88 104 97 f 98
39 31 24 35 18
23
91 106 97 115 98 f 103
28 22 32 14 17
14
^Data obtained by James U Elchelberger using column 2 with the open split interface and an ion trap mass spectrometer (Sect 1132) with all method analytes In the same reagent water solution
^Designation in Figures 1 and 2 ^Not measured authentic standards were not available ^Not found at 02 MgL |Not measured methylene chloride was In the laboratory reagent blank ^m-xylene coelutes with and cannot be distinguished from its isomer p-xylene No 61
319
OPTIONAL FOAM TRA
X IN 0 0 EXIT
10MM GUASS FRIT MEDIUM JPOROSin
EXIT IN 00
14MU 0 D
WLETXIN 00
SAMPLE INLET
2WAY SYRINGE VALVE bull17CM 20 GAUGE SYRINGE NEEDLE
MM 0 0 RUBBER S9TUH
^10MM 0 D 116 IN 00 ftmdashINLET ]1STAINLpoundSS STEEL
X IN o D
i n MOLECULAR SIEVE PURGE GASRLTEX
PURGE GAS I FLOW CONTROL
FIGURE 1 PURGING DEVICE
320
c
PACXIN6 PROCEDURE CONSTRUCTION
COMPRESSION GLASS g n i 7AioOT RTTING NUT WOOL I w RESISTANCE
WIRE WRAPPED AND FERRULES ACTIVATED I J ^i (DOUBLE LAYER)
THERMOCOUPLE
CHARCOAL77CM^ SOLID
I CONTROLLER SeiSOR
15CM JGRADE 1 5 - Q ^ NIC BATUREl
NTROL 7^FOOT D
[PYROMETER RESISTANCE WIRE WRAPPED TUBING 25CM TBVAX 77 Of l^^ SOLID 0105 IN ID
(SINGLE LAYER) 0125 IN 00 3X0V-1 8CM-H STAINLESS STEa ICM GLASS WOOL
TRAP INLET
FIGURE 2 TRAP PACKINGS ANO CONSTRUCTION TO INCLUDE DESORB CAPABILITY
321
FIGURE 3 NORMALIZED TOTAL ION CURRENT CHROMATOGRAM FROM A VOLATILE COMPOUND CALIBRATION MIXTURE CONTAINING 25 na (5 MgL) OF MOST COMPOUNDS THE COMPOUND IDENTIFICATION NUMBERS ARE GIVEN IN TABLE 6
109
ro ro
TOTshy
JO
m322
7 4 A
280 (42
Y
m 1082
400 1322
30
t l
1A^^^Al^ l l y^ l^
(00 2902
AJ VJ LI ^ laquolaquo Li L^l r i i raquo r f Il raquo r r I raquo raquo raquo
Mj f II II I-j II I I r j II I I II 11 II I II I IIll 1111 II raquol
m m m im 2322 2(42 391)2 3322
u o o
lt ^
FIGURE A AMPLIFIED FIRST EIGHT MINUTES OF A TOTAL ION CURRENT CHROMATOGRAM FROM A VOLATILE COMPOUND CALIBRATION MIXTURE CONTAINING 25 ng (5 wgL) OF EACH COMPONENT THE COMPOUND IDENTIFICATION NUMBERS ARE GIVEN IN TABLE 6
mi
lOT-CO ro
_ i _ - I M I I I I I I I 11111 I bull I I I I I I I
50 m ISO 200 250 142 322 502 (42 822
^
lt-^
bull The mning results must be in tabular format reported on RAS Form V The instmment normalized mass listing and the mass spectmm must be
provided
bull The initial calibration results must also be reported in tabular format on a modified RAS Form VI The relative response factors and the percent relative standard deviation must be calculated for all analytes and surtogates The concentration and source of the standards analyzed must be provided Raw data must be included for all standards analyzed The spectra for all compounds in the initial calibration standards do not have to be included
bull The 10 ugL continuing calibration standard must be reported in a tabular format on modified RAS Form VII The raw data must be included The percent differences and daily response factors must be reported for all analytes and surtogates A RAS Form VII must be provided if the initial calibration standard curve 10 ppb standard was used for quantitation of samples The spectmm for each compound in the continuing calibration standard does not have to be included
bull The Laboratory Fortified Blank (LFB) must be reported in tabular format on a RAS Form I modified to include all compounds presented
in Attachment A Raw data must be included excluding the spectra of all spike analytes The percent recoveries must be calculated and spike
concentrations simimarized on the modified RAS Form I The source of the spike and the acceptable recovery limits must also be reported
bull Provide the intemal standards results on a modified RAS Form VIII The retention time and area counts of the quantification ion for the intemal standards in all blanks samples and QC samples must be reported on this form
bull An example calculation must be provided for positive results and detection limit values reported
bull Provide copies of records (telecons) of communication with field personnel the work order designated project chemist or the MampE lead chemist
bull For TICs provide the spectrum of the TIC and the tiiree best matches obtained from the library search A RAS Form I-TIC must be included for each sample even if no TICs are reported
B Complete Sample Delivery Group File (CSF) Audit
Due to the litigative nature of each Superfund site Region I EPA requires that all analytical data quality control data and tabulated raw or supporting data be delivered with each sample delivery group (SDG) With each sample delivery group an EPA Region 1 Complete SDG File Completeness Evidence Audit must be completed The CSF Completeness Evidence Audit Forms are included in Attachment B and must accompany each sample delivery group (data package) The laboratory through these audit forms must demonstrate that all sample data raw data calibration data and any other data requirements of this specification are included by the laboratory in the data package
The forms included in Attachment B are for all types of data packages For this specification the laboratory will use the forms supplied to the best of their ability where deliverable items are applicable
10 EXCEPTIONS
If QC requirements or action limits are exceeded or if analytical samples are destroyed or lost or if matrix interference is suspected contact
Dr Brian Tucker Metcalf amp Eddy Inc (617) 246-5200 ext 6433
ATTACHMENT A
Fluorobenzene - Internal Standard
Dichlorodifluoromethane Chloromethane Vinyl Chloride Bromomethane Chloroethane Trichlorofluoromethane 11-Dichloroethene Acetone Carbon Disulfide Methylene Chloride trans-12-Dichloroethene 11-Dichloroethane 22-Dichloropropane 2-Butanone cis-12-Dichloroethene Chloroform Bromochloromethane 111 -Trichloroethane
gtw 11-Dichloropropene Carbon Tetrachloride Benzene 12-Dichloroethane Trichloroethene 12-Dicliloropropane Bromodichloromethane Dibromomethane 4-Methyl-2-Pentanone trans-13-Dichloropropene Toluene cis-13-Dichloropropene 112-Trichloroethane 2-Hexanone Tetrachloroethene 13-Dichloropropane Tetrahydrofuran 14-Dioxane l2-Dichloroethane-d4 (surtogate)
10
s Chlorobenzene-d5 - Intemal Standard
Dibromochloromethane Bromoform Isopropylbenzene 12-Dibromoethane Chlorobenzene Ethylbenzene 1112-Tetrachloroethane 1122-Tetrachloroethane Total Xylenes Styrene Bromobenzene N-Propylbenzene 123 -Trichloropropane 2-Chlorotoluene 135-Trimethy Ibenzene 4-Chlorotoluene Tert-Butylbenzene 124-Trimethylbenzene Sec-Butylbenzene 4-Isopropyltoluene 13-Dichlorobenzene 14-Dichlorobenzene N-Butylbenzene 12-Dichlorobenzene 12-Dibromo-3-Chloropropane 124-Trichlorobenzene Hexachlorobutadiene Naphthalene 123 -Trichlorobenzene 12-Dichlorobenzene-d4 (surrogate)
11
r - ATTACHMENT B
CSF AUDIT FORMS
bull s laquo raquo ^
12
~ ^
ORGANICS COHPLETE SDG FILE (CS7) INVENTORY SHEET (Cont)
SDG NOS TO FOLLOW CASE NO SDC NO SAS NO
PACE NOs CHECK FROM TO LAB EPA
Mlaeallanaotia Pata
Original preparaclon and analysis forms or copies of praparatlon and analysis logbook pages
Internal saaple and saaple extract transfer chain-of-custody records
Screening records All instrument output including strip charts
from screening activities (describe or list)
8 EPA ShlPDlniyRaeelvtng Doetments
Airbills (No of shipments ) Chain-of-Custody Records Sample Tags Sample Log-In Sheet (Lab amp DCl) Miscellaneous ShippingReceiving Records
(describe or list) --i9 ssjg
^ ^ - bullbullbullbullgtbullbullraquobullbullbull
9 Intemal Lab Sample Transfer Records and Tracking Sheets (describe or list)
10 Other Records (describe or list)
Telephone Conmunication Log
11 Conments
ompleted by (CLP Lab) (Signature) (Printed NameTitle) (Dace)
bull bulldi ted by EPA) ( S i g n a t u r e ) ( P r i n t e d N a m e T i d e ) (Dace)
FORM D C - 2 - 4
0LM017 791
ORGANICS COMPLETE SDC FILE (CSF) INVENTORY SHEET (Cont) V
CASE NO SDG NO SDG NOS TO FOLLOW SAS NO
PAGE NOs CHECK FROM TO LAB EPA
6 Pesticides (cont) b Saaple Data
TCL Results - Organic Analysis Data Sheet (Fora I PEST)
Chromatograms (Primary Column) Chromatograms from second GC column confirmation GC Integration report or data system printout
Manual work sheets For pestieldesAroelors confirmed by GCMS copies of rav spectra and copies of background-subtracted mass spectra of target corapowids (saaples amp standards)
c Standards Data Initial Calibration of Single Component Analytes (Fora VI PEST-1 and PEST-2)
Initial Calibration of Miilticoaponent Analytes (Fora VI PEST-3)
Analyte Resolution Sumaary (Fora VI FEST-4) _^ Calibration Verification Sunoary (Fora VII PEST-1)
x-v Callbratioti Verification Suaaary (Fora VII PEST-2) i^^ Analytical Sequence (Fora VIII PEST)
Florlsll Cartridge Cheek (Fora IX PEST-1) Pesticide 6PC Calibration (Fora DC PEST-2) Pesticide Identification Sumaary for Single Component
Analytes (Form X PEST-1) Pesticide Identification Summary for Multicomponent
Analytes (Fora X PEST-2) Chroaatograos and data systea printouts
A printout of retention tiaes and corresponding peak areas or peak heights
Pesticide CPC calibration data shy UV detector traces
d Raw QC Data Blank Data Matrix SpikeMatrix Spike Duplicate Data
FORM DC-2-3 OLH017 791
ORGANICS COMPLETE SDC FILE (CSF) INVENTORY SHEET (Cone)
CASE NO
bull
SDG NO SAS NO
SDG NOS TO FOLLOW
PAGE NOs CHECK FROl TO LAB EPA
Semivolatiles Data a QC Sumaary
bull Surrogate Percent Recovery Sunmary (Fora II SV) MSMSD Summary (Form III SV) Method Blank Summary (Form IV SV)GCMS Instrument Perforaance Check (Fora V SV)
Intemal Standard Area and RT Summary (Fora VIII SV)
~
b Sample Data TCL Results (Fora I SV-l SV2) Tentatively Identified Coapounds (Fora I SV-TIC) Reconstrticted total ion chromatograas (RIG)
for eaeh saaple For each sample Raw spectra and background-subtracted mass spectra o f target compounds
Quantitation reports Mass spectra of TICs vith three best library matches GPC chromatograms (if GPC perfomed)
c Standards Data (All Instruments) Initial Calibration Data (Fora VI SV-l SV-2) RICs and Quan Reports for all Standards Continuing Calibration Data (Fora VII SV-l SV-2) RICs and Quantitation Reports for all Standards Seaivolatlle GPC Calibration Data-UV detector traces
d Raw QC Data DFTPF Blank DataMatrix SpikeMatrix Spike Duplicate Data
~ ~
Pesticides
a QC Summary Surrogate Percent Recovery Summary (Form II PEST) MSMSD Duplicate Summary (Form III PEST) Method Blank Summary (Form IV PEST)
v FORM DC-2-2
0LN017 791
ORGANICS COMPLETE SDG FILE (CSF) INVENTORY SHEET c LABORATORY NAME CITYSTATE
CASE NO SDG NO SDG NOS TO FOLLOW SAS NO
CONTRACT NO SOV MO
All documents delivered in the complete SOG file must be original documents vhere possible (REFERENCE EXHIBIT B SECTION II and SECTION III)
PAGE NOs CHECK FROM TO LAB EPA
1 Inventorr Sheet (Fora DC-2) (Do not nuaber) 2 SDC Case Narrative 3 SDQ Cover SheetTraffic Report 4 Volatiles Data
a QC Summary Systea Monitoring Coapound Summary (Fora II VOA)
Matrix SpikeMatrix Spike Duplicate Summary (Fora III VOA)
Method Blank Summary (Fora IV VOA) GCMS Instrument Performance Cheek (Fora V VOA)
Intemal Standard Area and RT Summary r(Form VIII VOA) NlaquoWlaquo
b Sampla Data TCL Results bull (Fora I VOA) Tentatively Identified Compounds (Fora I VOA-TIC)
Reconstructed total ion chrooatograas (RICgt for each saaple
For each saaple Raw spectra and background-subtracted mass spectra of target coapounds identified
Quantitation reports Mass spectra of all reported TICs with three best library matches
c Standarda Data (All Instruments) Initial Calibration Data (Fona VI VOA) RICs and Quan Reports for all Standards Continuing Calibration Data (Fora VII VOA) RICs and Quantitation Reports for all Standards
d Rav QC Data BFB Blank Data Matrix SpikeMatrix Spike Duplicate Daca
FORM DC-2-I
OLM017 7
ATTACHMENT C
EPA METHOD 5242
13 c
METWO 5242 NEASUREMEMT OF PURGEABLE ORGANIC COHPOUNDS IN UATER BY CAPILLARY COLUWl GAS CHROHATOGRAPHYHASS SPECTROMaRY
Revision 30
A Alford-Stevens J W Eichelberger laquo L Budde - Method 524 Revision 10 (1983)
R U Slater Jr - Method 5242 Revision 20 (1986)
J W Elchelberger U L Budde - Method 5242 Revision 30 (1989)
ENVIRONMENTAL MONITORING SYSTEMS LABORATORY OFFICE OF RESEARCH ANO DEVELOPNENT
US ENVIRONNENTAL PROTECTION AGENCY CINCINNATI OHIO 45268
285 V
METHOO 5242 MEASUREMENT OF PURGEABLE ORGANIC COMPOUNDS IN UATER BY CAPILLARY COLUWl GAS CHROHATOGRAPHYNASS SPECTROHHRY
Revision 30
A Alford-Stevens J W Elchelberger H L Budde - Method 524 Revision 10 (1983)
R W Slater Jr - Method 5242 Revision 20 (1986)
J W Elchelberger U L Budde - Method 5242 Revision 30 (1989)
ENVIRONMENTAL MONITORING SYSTEMS LABORATORY OFFICE OF RESEARCH ANO DEVELOPNENT US ENVIRONNENTAL PROTECTION AGENCY
CINCINNATI OHIO 45268
285
NETHOO S242
MEASUREMENT OF PURGEABLE ORGANIC COMPOUNDS IN UATER BY CAPILLARY COLUMN GAS CHROMATOGRAPHYMASS SPECTROMETRY
1 SCOPE AND APPLICATION
11 This is a general purpose method for the identification and simultaneous measurement of purgeable volatile organic compounds in finished drinking water raw source water or drinking water in any treatment stage (1-2) The method is applicable to a wide range of organic compounds including the four trihalomethane disinfection by-products that have sufficiently high volatility and low water solubility to be efficiently removed from water samples with purge and trap procedures The following compounds can be determined by this method
pylt r^Vi ^ V O Compound
BenzeneBromobenzeneBromochloromethaneBromodichloromethaneBromoformBromomethanen-Butyl benzenesec-Butyl benzenetert-ButylbenzeneCarbon tetrachlorideChlorobenzeneChloroethaneChloroformChloromethane2-Chlorotoluene4-ChlorotolueneDibromochloromethanel2-Dibromo-3-chloropropane12-DibromoethaneDibromomethane12-Dichlorobenzene13-Dichlorobenzene14-DichlorobenzeneDichlorodifluoromethane11-Dichloroethane12-Dichloroethane11-Dichloroethenecis-12-Dichloroethenetrans-12-Dichloroethene12-Dichloropropane13-Dichloropropane
Chemical Abstract Service Registry Number
71-43-2 108-86-1
74-97-5 75-27-4
75-25-2 74-83-9
104-51-8 135-98-8 98-06-6
56-23-5 108-90-7 75-00-3
67-66-3 74-87-3 95-49-8 106-43-4
124-48-1 96-12-8
106-93-4 74-95-3
95-50-1 541-73-1 106-46-7
75-71-8 75-34-3 107-06-2 75-35-4
156-59-4 156-60-5
78-87-5 142-28-9
286
22-Oichloropropane11-01chioropropenec1s-l3-D1chloropropenetrans-13-OichloropropeneEthylbenzeneHexachlorobutadieneIsopropylbenzene4-TsopropyltolueneMethylene chlorideNaphthalenen-PropylbenzeneStyrene1112-Tetrachloroethane1122-TetrachloroethaneTetrachloroetheneToluene123-Trlchlorobenzene124-Trichlorobenzene111-Trichloroethane112-TrichloroethaneTrichloroetheneTrichlorofluoromethane123-Trichloropropane124-Trimethylbenzene135-TrimethylbenzeneVinyl chlorideo-Xylenem-Xylenep-Xylene
590-20-7 563-58-6
10061-01-5 10061-02-6
100-41-4 87-68-3
98-82-8 99-87-6 75-09-2
91-20-3 103-65-1
100-42-5 630-^0-6 79-34-5
127-18-4 108-88-3
87-61-6 120-82-1
71-55-6 79-00-5
79-01-6 75-69-4 96-18-4 95-63-6 108-67-8
75-01-4 95-47-6 108-38-3 laquo 106-42-3
12 Method detection limits (MDLs) (3) are compound and Instrument dependent and vary fron approximately 002-035 i i g l The applicable concentration range of this method is primarily column dependent and is approximately 002 to 200 M9i- for the wide-bore thick-film columns Narrow-bore thin-film columns may have a capacity which limits the range to about 002 to 20 MgL Analytes that are Inefficiently purged from water will not be detected when present at low concentrations but they can be measured with acceptable accuracy and precision when present in sufficient amounts
13 Analytes that are not separated chromatographically but which have different mass spectra and non-interfering quantitation ions can be identified and measured in the same calibration mixture or water sample (Sect 1162) Analytes which have very similar mass spectra cannot be individually Identified and measured in the same calibration mixture or water sample unless they have different retention times (Sect1163) Coeluting compounds with very similarmass spectra typically many structural Isomers must be reported as an isomeric group or pair Two of the three Isomeric xylenes and two of the three dichlorobenzenes are examples of structural isomers that may not be resolved on the capillary column and if not must be reported as isomeric pairs
287
2 SUWARY OF HETHQD
21 Volatile organic compounds and surrogates with low water solubility are extracted (purged) from the sample matrix by bubbling an Inert gas through the aqueous sample Purged sample components are trapped in a tube containing suitable sorbent materials When purging is complete the sorbent tube is heated and backflushed with helium to desorb the trapped sample components into a capillary gas chromatography (GC) column interfaced to a mass spectrometer (HS) The column is temperashyture programmed to separate the method analytes which are then detected with the HS Compounds eluting from the GC column are identified by comparing their measured mass spectra and retention times to reference spectra and retention times in a data base Reference spectra and retention times for analytes are obtained by the measurement of calibration standards under the same conditions used for samples The concentration of each identified component Is measured by relating the MS response of the quantitation ion produced by that compound to the HS response of the quantitation ion produced by a compound that Is used as an internal standard Surrogate analytes whose concentrations are known in every sample are measured with the same internal standard calibration procedure
3 DEFINITIONS
31 Internal standard shy- A pure analyte(s) added to a solution in known amount(s) and used to measure the relative responses of other method analytes and surrogates that are components of the same solution The internal standard must be an analyte that Is not a sample component
32 Surrogate analyte shy- A pure analyte(s) which Is extremely unlikely tobe found in any sample and which is added to a sample aliquot in knownamount(s) before extraction and Is measured with the same procedures used to measure other sample components The purpose of a surrogate analyte is to monitor method performance with each sample
^ ^
33 Laboratory duplicates (LDl and L02) -- Two sample aliquots taken in the analytical laboratory and analyzed separately with identical proceshydures Analyses of LDl and L02 give a measure of the precision associated with laboratory procedures but not with sample collection preservation or storage procedures
34 Field duplicates (FOI and FD2) -- Two separate samples collected at the same time and place under identical circumstances and treated exactly the same throughout field and laboratory procedures Analyses of FDl and FD2 give a measure of the precision associated with sample collection preservation and storage as well as with laboratory procedures
35 Laboratory reagent blank (LRB) -- An aliquot of reagent water that is treated exactly as a sample including exposure to all glassware equipment solvents reagents internal standards and surrogates that are used with other samples The LRB Is used to determine if method
288
c
analytes or other interferences are present In the laboratory environshyment the reagents or the apparatus
v
36 Field reagent blank (FRB) -- Reagent water placed in a sample container in the laboratory and treated as a sample in all respects including exposure to sampling site conditions storage preservation and all analytical procedures The purpose of the FRB is to determine if method analytes or other interferences are present In the field environment
37 Laboratory performance check solution (LPC) -- A solution of one or more compounds (analytes surrogates internal standard or other test compounds) used to evaluate the performance of the Instmment system with respect to a defined set of method criteria
38 Laboratory fortified blank (LFB) mdash An aliquot of reagent water to which known quantities of the method analytes are added In the laboratory The LFB Is analyzed exactly like a sample and its purpose Is to determine whether the methodology is in control and whether the laboratory is capable of making accurate and precise measurements at the required method detection limit
39 Laboratory fortified sample matrix (LFM) -- An aliquot of an environshymental sample to which known quantities of the method analytes are added in the laboratory The LFM is analyzed exactly like a sample and its purpose is to determine whether the sample matrix contributes bias to the analytical results The background concentrations of the analytes in the sample matrix must be determined in a separate aliquot and the measured values In the LFM corrected for background concentrashytions
310 Stock standard solution -- A concentrated solution containing a single certified standard that is a method analyte or a concentrated solution of a single analyte prepared In the laboratory with an assayed reference compound Stock standard solutions are used to prepare primary dilution standards
bullj
311 Primary dilution standard solution -- A solution of several analytes prepared in the laboratory from stock standard solutions and diluted as needed to prepare calibration solutions and other needed analyte solutions
312 Calibration standard (CAL) -- a solution prepared from the primary dilution statidard solution and stock standard Solutions of the Internal standards ^d-surrogate analytes The CAL solutions are used to calibrate th^Instrument response with respect to analyte concentrashytion
313 Quality control sam0U (QCS) -- a sample matrix containing method analytes or a solution of method analytes In a water miscible solvent which is used to fortifytreagent water or environmental samples The QCS is obtained from a source external to the laboratory and is used
289
to check laboratory performance with externally prepared test materials
4 INTERFERENCES
41 During analysis major contaminant sources are volatile materials in the laboratory and impurities in the inert purging gas and in the sorbent trap The use of non-polytetrafluoroethylene (PTFE) plastic tubing non-PTFE thread sealants or flow controllers with rubber components in the purging device should be avoided since such materials out-gas organic compounds which will be concentrated in the trap during the purge operation Analyses of laboratory reagent blanks provide Information about the presence of contaminants When potential Interfering peaks are noted In laboratory reagent blanks the analyst should change the purge gas source and regenerate the molecular sieve purge gas filter Subtracting blank values from sample results Is not permitted
42 Interfering contamination may occur when a sample containing low concentrations of volatile organic compounds is analyzed immediately after a sample containing relatively high concentrations of volatile organic compounds A preventive technique Is between-sample rinsing of the purging apparatus and sample syringes with two portions of reagent water After analysis of a sample containing high concentrations of volatile organic compounds one or more laboratory reagent blanks should be analyzed to check for cross contamination
43 Special precautions must be taken to determine methylene chloride The analytical end sample storage area should be Isolated from allatmospheric sources of methylene chloride otherwise random backgroundlevels will result Since methylene chloride will permeate through PTFE tubing all gas chromatography carrier gas lines and purge gas plumbing should be constructed of stainless steel or copper tubing Laboratory workers clothing should be cleaned frequently since clothing previously exposed to methylene chloride fumes during common liquidliquid extraction procedures can contribute to sample contaminashytion
^ ^
5 SAFETY
51 The toxicity or carcinogenicity of chemicals used in this method has not been precisely defined each chemical should be treated as a potential health hazard and exposure to these chemicals should be minimized Each laboratory Is responsible for maintaining awareness of OSHA regulations regarding safe handling of chemicals used in this method Additional references to laboratory safety are available (4-6) for the Information of the analyst
52 The following method analytes have been tentatively classified as known or suspected human or mammalian carcinogens benzene carbon tetrachloride 14-dichlorobenzene l2-4ichlorethane^ hexachloroshybutadiene 1122-tetrachloroethane 112-trlchloroethane chloroshy
290 ^
form 12-dibromoethanetetrachloroethene trichloroethene and vinyl ^ chloride Pure standard materials and stock standard solutions of V these compounds should be handled in a hood A NIOSHMESA approved
toxic gas respirator should be worn when the analyst handles high concentrations of these toxic compounds
6 APPARATUS AND EQUIPMENT
61 SAMPLE CONTAINERS -- 60-mL to 120-mL screw cap vials (Pierce 19832 or equivalent) each equipped with a PTFE-faced silicone septum (Pierce 12718 or equivalent) Prior to use wash vials and septa with detergent and rinse with tap and distilled water Allow the vials and septa to air dry at room temperature place In a 105degC oven for 1 hr then remove and allow to cool In an area known to be free of organics
62 PURGE AND TRAP SYSTEM -- The purge and trap system consists of three separate pieces of equipment purging device trap and desorber Systems are commercially available from several sources that meet all of the following specifications
621 The all glass purging device (Figure 1) should be designed to accept 25-mL samples with a water column at least 5 cm deep A smaller (5-mL) purging device is recommended If the GCMS system has adequate sensitivity to obtain the method detection limits required Gaseous volumes above the sample must be kept to a minimum (lt 15 mL) to eliminate dead volume effects A glass frit should be Installed at the base of the sample chamber so Cl the purge gas passes through the water column as finely divided bubbles with a diameter of lt 3 mm at the origin Needle spargers may be used however the purge gas must be introduced at a point about 5 mm from the base of the water column
622 The trap (Figure 2) must be at least 25 cm long and have an inside diameter of at least 0105 in Starting from the inlet the trap should contain 10 cm of methyl silicone coated packing and the following amounts of adsorbents 13 of 26-dlphenylene oxide polymer 13 of silica gel and 13 of coconut charcoal If it is not necessary to determine dichlorodifluoromethane the charcoal can be eliminated and the polymer increased to fill 23 of the trap Before Initial use the trap should be conditioned overnight at 180degC by backflushing with an inert gas flow of at least 20 mLmin Vent the trap effluent to the room not to the analytical column Prior to daily use the trap should be conditioned for 10 min at 180degC with backflushing The trap may be vented to the analytical column during dally conditioning however the column must be run through the temperature program prior to analysis of samples
623 The use of the methyl silicone coated packing is recommended but not mandatory The packing serves a dual purpose of protecting the Tenax adsorbant from aerosols and also of
291
insuring that the Tenax is fully enclosed within the heated zone of the trap thus eliminating potential cold spots Alternatively sllanized glass wool may be used as a spacer at the trap inlet
624 The desorber (Figure 2) must be capable of rapidly heating the trap to 180degC either prior to or at the beginning of the flow of desorption gas The polymer section of the trap should not be heated higher than 200degC or the life expectancy of the trap will decrease Trap failure is characterized by a pressure drop in excess of 3 pounds per square Inch across the trap during purging or by poor bromoform sensitivities The desorber design Illustrated in Fig 2 meets these criteria
63 GAS CHROMATOGRAPHYMASS SPECTROMETERDATA SYSTEM (6CMSDS)
631 The GC must be capable of temperature programming and should be equipped with variable-constant differential flow controllers so that the column flow rate will remain constant throughout desorption and temperature program operation The column oven must be cooled to lO C therefore a subambient oven controller Is required If syringe injections of BFB will be used a splitsplitless injection port is required bull
632 Capillary Gas Chromatography Columns Any gas chromatography V column that meets the perfonnance specifications of this method
may be used Separations of the calibration mixture must be equivalent or better than those described In this method Three useful columns have been identified
6321 Column 1 -- 60 m x 075 mm ID VOCOL (Supelco Inc) glass wide-bore capillary with a 15 im film thickness
Column 2 -- 30 m X 053 mm ID DB-624 (JampW Scientific Inc) fused silica capillary with a 3 im film thickshyness
Column 3 - 30 m X 032 mm ID DB-5 (JampU Scientific Inc) fused silica capillary with a 1 fun film thickshyness
633 Interfaces between the GC and HS The interface used depends on the column selected and the gas flow rate
6331 The wide-bore columns 1 and 2 have the capacity to accept the standard gas flows from the trap during thermal desorption and chromatography can begin with the onset of thermal desorption Depending on the pumping capacity of the MS an additional interface between the end of the column and the MS may be required An open split interface (7) an all-glass Jet separator or a cryogenic (Sect 6332) device
292
^
^
c
are acceptable interfaces Any Interface can be used If the performance specifications described in this method can be achieved The end of the transfer line after the interface or the end of the analytical column if no interface is used should be placed within a few mm of the MS ion source
6332 The narrow bore column 3 cannot accept the thermal desorption gas flow and a cryogenic interface is required This interface (Tekmar Model 1000 or equivalent) condenses the desorbed sample components at liquid nitrogen temperature and allows the helium gas to pass through to an exit The condensed components are frozen in a narrow band on an uncoated fused silica precolumn When all components have been desorbed from the trap the interface Is rapidly heated under a stream of carrier gas to transfer the analytes to the analytical column The end of the analytical column should be placed with a few mm of the HS ion source A potential problem with this interface is blockage of the interface by frozen water from the trap This condition will result in a major loss in sensitivity and chromatographic resolution
634 The mass spectrometer must be capable of electron ionization at a nominal electron energy of 70 eV The spectrometer must be capable of scanning from 35 to 260 amu with a complete scan cycle time (including scan overhead) of 2 sec or less (Scan cycle time bullgt Total HS data acquisition time in seconds divided by number of scans in the chromatogram) The spectrometer must produce a mass spectrum that meets all criteria In Table 3 when 25 ng or less of 4-bromofluorobenzene (BFB) is introduced into the GC An average spectrum across the BFB GC peak may be used to test instrument performance
635 An Interfaced data system is required to acquire store reduce and output mass spectral data The computer software should have the capability of processing stored GCMS data by recognizshying a GC peak within any given retention time window comparing the mass spectra from the GC peak with spectral data in a user-created data base and generating a list of tentatively identified compounds with their retention times and scan
UKJsnxabers The software must allow Integration of the ion abundance of any specific Ion between specified time or scan number limits The software should also allow calculation of response factors as defined in Sect 926 (or construction of a second or third order regression calibration curve) calculashytion of response factor statistics (mean and standard deviashytion) and calculation of concentrations of analytes using either the calibration curve or the equation in Sect 12
293
64 SYRINGE ANO SYRINGE VALVES
641 Two S-mL or 25-mL glass hypodermic syringes with Luer-Lok tip (depending on sample volume used)
642 Three 2-way syringe valves with Luer ends
643 One ZS- j i l micro syringe with a 2 in x 0006 in ID 22deg bevel needle (Hamilton I702N or equivalent)
644 Micro syringes - 10 100 n l
645 Syringes - 05 10 and 5-mL gas tight with shut-off valve
65 MISCELLANEOUS
651 Standard solution storage containers -- 15-mL bottles with PTFE-11ned screw caps
7 REAGENTS AND CONSUMABLE MATERIALS
71 TRAP PACKING MATERIALS
711 26-Diphenylene oxide polymer 6080 mesh chromatographic grade (Tenax GC or equivalent)
712 Methyl silicone packing (optional) -- OV-1 (3X) on Chromoshysorb W 6080 mesh or equivalent
713 Silica gel -- 3560 mesh Davison grade IS or equivalent 5 714 Coconut charcoal -- Prepare from Barnebey Cheney CA-580-26
lot IM-2649 by crushing through 26 mesh screen
72 REAGENTS
721 MethanoljengtiiOefflonstrated to be free of analytes
722 Reagent water -- Prepare reagent water by passing tap water through a filter bed containing about 05 kg of activated carbon by using a water purification system or by boiling distilled water for IS min followed by a 1-h purge with inert gas while the water temperature is held at 90degC Store in clean narrow-mouth bottles with PTFE-llned septa and screw caps
723 Hydrochloric acid (1+1) -- Carefully add measured volume of cone HCI to equal volume of reagent water
724 Vinyl chloride -- Certified mixtures of vinyl chloride in nitrogen and pure vinyl chloride are available from several
294
-^
y fH- y_
sources (for example Matheson Ideal Gas Products and Scott Gases)
725 Ascorbic acid -- ACS reagent grade granular
73 STOCK STANDARD SOLUTIONS -- These solutions may be purchased as certified solutions or prepared from pure standard materials using the following procedures One of these solutions is required for every analyte of concern every surrogate and the internal standard A useful working concentration is about 1-5 mgmL
731 Place about 98 mL of methanol into a 10-mL ground-glass stoppered volumetric flask Allow the flask to stand unstoppered for about 10 min or until all alcohol-wetted surfaces have dried and weigh to the nearest 01 mg
732 If the analyte Is a liquid at room temperature use a 100-iL syringe and Immediately add two or more drops of reference standard to the flask Be sure that the reference standard falls directly into the alcohol without contacting the neck of the flask If the analyte Is a gas at room temperature fill a 5-mL valved gas-tight syringe with the standard to the 50-mL mark lower the needle to 5 mm above the methanol meniscus and slowly inject the standard Into the neck area of the flask The gas will rapidly dissolve in the methanol
733 Reweigh dilute to volume stopper then mix by inverting the flask several times Calculate the concentration In
n q l i l from the net gain in weight When compound purity is certified at 96X or greater the weight can be used without
correction to calculate the concentration of the stock standard 734 Store stock standard solutions in 15-mL bottles equipped
with PTFE-llned screw caps Methanol solutions prepared from liquid analytes are stable for at least 4 weeks when stored at 4degC Methanol solutions prepared from gaseous analytes are not stable for more than 1 week when stored at lt0degC at room temperature they must be discarded after 1 day
74 PRIMARY DILUTION STANDARDS - Use stock standard solutions to prepare primary dilution standard solutions that contain all the analytes of concern and the surrogates (but not the Internal standard) In methanol The prlm^ifdilution standards should be prepared at concentrations that can be easily diluted to prepare aqueous calibrashytion solutions that will bracket the working concentration range Store the primary dilution standard solutions with minimal headspace and check frequently for signs of deterioration or evaporation especially Just before preparing calibration solutions Storage times described for stock standard solutions in Sect 744 also apply to primary dilution standard solutions
295
75 FORTIFICATION SOLUTIONS FOR INTERNAL STANDARD AND SURROGATES
751 A solution containing the Internal standard and the surrogates is required to prepare laboratory reagent blanks (also used as a laboratory performance check solution) and to fortify each sample Prepare a fortification solution containing fluoroshybenzene (internal standard) 12- dichlorobenzene-d4 (surrogate) and BFB (surrogate) in methanol at concentrations of 5 xgmL of each A 5-ML aliquot of this solution added to a 25-mL water sample volume gives concentrations of 1 f t q l of each A S-^L aliquot of this solution added to a 5-mL water sample volume gives a concentration of 5 M Q A of each) Additional Internal standrds and surrogate analytes are optional
752 A solution of the Internal standard alone Is required to prepare calibration standards and laboratory fortified blanks The internal standard should be In methanol at a concentration of 5 MgmL
76 PREPARATION OF LABORATORY REAGENT BLANK shy- Fill a 25-mL (or 5-mL) syringe with reagent water and adjust to the mark (no air bubbles) Inject 10 n l of the fortification solution containing the internal standard and surrogates through the Luer Lok valve Into the reagent water Transfer the LRB to the purging device See Sect 1112
77 PREPARATION OF LABORATORY FORTIFIED BLANK shy Prepare this exactly like a calibration standard (Sect 78) This Is a calibration standard that is treated as a sample
78 PREPARATION OF CALIBRATION STANDARDS i i l0^^
- X 0
781
3
The number of calibration solutions (CALs) needed depends on the calibration range desired A minimum of three CAL solutions is required to calibrate a range of a factor of 20 In concentrashytion For a factor of 50 use at least four standards and for a factor of 100 at least five standards One calibration
1-So 5
standard should contain each analyte of concern and each surrogate at a concentration of 2-10 times the method detection limit (Tables 4-6) for that compound The other CAL standards should contain each analyte of concern and each surrogate at concentrations that define the range of the method Every CAL solution contains the Intemal standard at the same concentrashytion (5 M9L suggested for a 5-mL sample 1 i i g l for a 25-mL sample)
782 To prepare a calibration standard add an appropriate volume of a primary dilution standard (containing analytes and surrogates) to an aliquot of reagent water In a volumetric flask Use a microsyringe and rapidly inject the methanol solutions into the expanded area of the filled volumetric flask Remove the needle as quickly as possible after injection Mix by Inverting the
296 ^ m ^
^^flask three times only Discard the contents contained in the
neck of the flask Aqueous standards are not stable In a volumetric flask and should be discarded after 1 hr unless transferred to a sample bottle and sealed immediately
8 SAMPLE COLLECTION PRESERVATION AND STORAGE
81 SAMPLE COLLECTION DECHLORINATION AND PRESERVATION
811 Collect all samples In duplicate If samples contain residual chlorine and measurements of the concentrations of disinfection by-products (trihalomethanes etc) at the time of sample collection are desired add about 25 mg of ascorbic acid to the sample bottle before filling Fill sample bottles to overflowshying but take care not to flush out the rapidly dissolving ascorbic acid No air bubbles should pass through the sample as the bottle is filled or be trapped in the sample when the bottle is sealed Adjust the pH of the duplicate samples to lt2 by carefully adding one drop of 11 HCI for each 20 mL of sample volume Seal the sample bottles PFTE-face down and shake vigorously f o r 1 min
812 When sampling from a water tap open the tap and allow the system to flush until the water temperature has stabilized (usually about 10 min) Adjust the flow to about 500 mLmin and collect duplicate samples from the flowing stream
bull - shy
bdquo ^ 813 When sampling from an open body of water fill a 1-quart wide-mouth bottle or l-11ter beaker with sample from a representative area and carefully fill duplicate sample bottles from the 1-quart container
814 The samples must be chilled to 4degC on the day of collection and maintained at that temperature until analysis Field samples that will not be received at the laboratory on the day of collection must be packaged for shipment with sufficient ice to ensure that they will be at 4degC on arrival at the laboratory
82 SAMPLE STORAGE
821 Store samples at 4degC until analysis The sample storage area must be free of organic solvent vapors
822 Analyze all samples within 14 days of collection Samples not analyzed within this period must be discarded and replaced
83 FIELD REAGENT BLANKS
831 Duplicate field reagent blanks must be handled along with each sample set which is composed of the samples collected from the same general sample site at approximately the same time At the laboratory fill field blank sample bottles with reagent
V 297
water seal and ship to the sampling site along with empty sample bottles and back to tht laboratory with filled sample bottles Wherever a set of samples Is shipped and stored it is accompanied by appropriate blanks
832 Use the same procedures used for samples to add ascorbic acid and HCI to blanks (Sect 811)
9 CALIBRATION
91 Demonstration and documentation of acceptable initial calibration is required before any samples are analyzed and Is required intermittently throughout sample analysis as dictated by results of continuing calibration checks After Initial calibration Is successful a continuing calibration check Is required at the beginning of each 8 hr period during which analyses are performed Additional periodic calibration checks are good laboratory practice
92 Initial calibration
921 Calibrate the mass and abundance scales of the MS with calibrashytion compounds and procedures prescribed by the manufacturer with any modifications necessary to meet the requirements in Sect 922
922 Introduce Into the GC (either by purging a laboratory reagent blank o r making a syringe Injection) 25 ng of BFB and acquire mass spectra for ivz 35-260 at 70 eV (nominal) Use the purging procedure andor GC conditions given In Sect Hi If thespectrum does not meet all criteria In Table 2raquo the MS must be retuned and adjusted to meet all criteria before proceeding with calibration An average spectrum across the GC peak may be used to evaluate the performance of the system
923 Purge a medium CAL solution for example 10-20 |tgL using the procedure given In Sect 11
924 Performance criteria for the medium calibration Examine the stored GCMS data with the data system software Figure 3 shows an acceptable total ion chromatogram
9241 GC performance Good column performance will produce symmetrical peaks with minimum tailing for most compounds If peaks are broad or sensitivity poor see Sect 936 for some possible remedial actions
9242 MS sensitivity The GCMSOS peak Identification software should be able to recognize a GC peak in the appropriate retention time window for each of the compounds In calibration solution and make correct tentative Identifications If fewer than 99 of the
^ ^
298
compounds are recognized system maintenance is laquo-lt- required See Sect 936
925 If all performance criteria are met purge an aliquot of each of the other CAL solutions using the same GCMS conditions
926 Calculate a response factor (RF) for each analyte surrogate and isomer pair for each CAL solution using the internal standard fluorobenzene Table 1 contains suggested quantitation ions for all compounds This calculation Is supported in acceptable GCMS data system software (Sect 634) and many other software programs RF is a unitless number but units used to express quantities of analyte and Internal standard must be equivalent
R F (Ax)(Qis) (AisXQx)
where Ax - integrated abundance of the quantitation ion of the analyte
A^s - Integrated abundance of the quantitation ion of the Intemal standard
Qx quantity of analyte purged In ng or concentration units
Q^s laquo quantity of internal standard purged in ng or concentration units
W YQ 9261 For each analyte and surrogate calculate the mean RF -gt-^ from the analyses of the CAL solutions Calculate the ^ lty poundgtS0 standard deviation (SD) and the relative standard
^ 70o deviation (RSD) from each mean RSD - 100 (SDM) If the RSD of any analyte or surrogate mean RF exceeds 20 either analyze additional aliquots of appropriate CAL solutions to obtain an acceptable RSD of RFs over the entire concentration range or take action to improve GCMS performance See Sect 927
o gti(^ ^ ^ 927 As an alternative to calculating mean response factors and eS ^ ^ applying the RSD test use the GCMS data system software or
C^^ other available software to generate a second or third order regression calibration curve
93 Continuing calibration check Verify the MS tune and initial calibrashytion at the beginning of each 8-hr work shift during which analyses are performci using the following procedure
931 Introduce into the GC (either by purging alaboratory reagent blank or making a syringe injection) 25 ng of BFB and acquire a mass spectrum that includes data for mz 35-260 If the spectrum does not meet all criteria (Table 2 ) the MS must be
- 299
932
933
934
p 935^ J
JL- ^O^ Vgtbull V Qgt^^
f v ^ ^C^C
936
retuned and adjusted to meet all criteria before proceeding with the continuing calibration check
Purge a medium concentration CAL solution and analyze with the same conditions used during the initial calibration
Demonstrate acceptable performance for the criteria shown in Sect 924
Determine that the absolute areas of the quantitation ions of the internal standard and surrogates havenot decreased by more than 30 from the areas measured In the most recent continuing calibration check o r by more than 50 from the areas measured during Initial calibration If these areas have decreased by more than these amounts adjustments must be made to restore system sensitivity These adjustments may require cleaning of the HS ion source or other maintenance as Indicated In Sect 936 and recalibration Control charts are useful aids in documenting system sensitivity changes
Calculate the RF for each analyte and surrogate from the data measured In the continuing calibration check The RF for each analyte and surrogate must be within 30 of the mean value measured In the initial calibration Alternatively If a second
or third order regression Is used the point from the continuing calibration check for each analyte and surrogate must fall
within the analysts Judgement on the curve from the initial calibration If these conditions do not exist remedial action must be taken which may require re-Initial calibration gtlaquo
Some possible remedial actions Major maintenance such as cleaning an Ion source cleaning quadrupole rods etc require returning to the initial calibration step
9361 Check and adjust GC andor MS operating conditions check the NS resolution and calibrate the mass scale
9362 Clean or replace the splitless injection liner silanize a new injection liner
9363 Flush the GC column with solvent according to manushyfacturers instructions
9364 Break off a short portion (about 1 meter) of the column from the end near the Injector o replace GC column This action will cause a change In retention times
9365 Prepare fresh CAL solutions and repeat the initial calibration step
9366 Clean the MS ion source and rods (if a quadrupole)
300
9367 Replace any components that allow analytes to come into contact with hot metal surfaces
9368 Replace the MS electron multiplier or any other faulty components
94 Optional calibration for vinyl chloride using a certified gaseous mixture of vinyl chloride in nitrogen can be accomplished by the following steps
941 Fill the purging device with 250 mL (or 5-mL) of reagent water or aqueous calibration standard
942 Start to purge the aqueous mixture Inject a known volume (between 100 and 2000 M L ) of the calibration gas (at room temperature) directly into the purging device with a gas tight syringe Slowly Inject the gaseous sample through a septum seal at the top of the purging device at 2000 Mtm1n If the injection of the standard is made through the aqueous sample inlet port flush the dead volume with several mL of room air or carrier gas Inject the gaseous standard before 5 min of the 11-min purge time have elapsed
943 Determine the aqueous equivalent concentration of vinyl chloride standard In i t q l Injected with the equation
S - 0102 (C)(V)
where S - Aqueous equivalent concentration of vinyl chloride standard in MgL
C - Concentration of gaseous standard in ppm (vv) V - Volume of standard injected In milliliters
10 QUALITY CONTROL
101 Quality control (QC) requirements are the initial demonstration of laboratory capability followed by regular analyses of laboratory reagent blanks field reagent blanks and laboratory fortified blanks The laboratory must maintain records to document the quality of the data generated Additional quality control practices are recommended
102 Initial demonstration of low system background Before any samples are analyzed It must be demonstrated that a laboratory reagent blank (LRB) Is reasonably free of contamination that would prevent the determination of any analyte of concern Sources of background contamination are glassware purge gas sorbants and equipment Background contamination must be reduced to an acceptable level before proceeding with the next section In general background from method analytes should be below the method detection limit
301
103 Initial demonstration of laboratory accuracy and precision Analyze five to seven replicates of a laboratory fortified blank containing each analyte of concem at a concentration In the range of 02-5 M9L (see regulations and maximum contaminant levels for guidance on appropriate concentrations)
1031 Prepare each replicate by adding an appropriate aliquot of a quality control sample to reagent water If a quality control sample containing the method analytes is not available a primary dilution standard made from a source of reagents different than those used to prepare the calibration standards may be used Also add the appropriate amounts of internal standard and surrogates If they are being used Analyze each replicate according to the procedures described In Section 11 and on a schedule that results In the analyses of all replicates over a period of several days
1032 Calculate the measured concentration of each analyte in each replicate the mean concentration of each analyte in all replicates and mean accuracy (as mean percentage of true value) for each analyte and the precision (as relative standard deviation RSD) of the measurements for each analyte Calculate the HDL of each analyte using the procedures described in Sect^ 132 (2)
10^33 For each analyte and surrogate the mean accuracy expressed as a percentage of the true value should be 80-120 and the RSD should be lt20 Some analytes particularly the early eluting gases and late eluting higher molecular weight gt-lt compounds are measured wjth less accampracy and precision than ^ other analytes The method detection limits must be sufficient to detect analytes at the required levels If these criteria are not met for an analyte take remedial action and repeat the measurements for that analyte to demonstrate acceptable performance before samples are analyzed
1034 Develop and maintain a system of control charts to plot the precision and accuracy of analyte and surrogate measurements as a function of time Charting of surrogate recoveries is an especially valuable activity since these are present in eyery sample and the analytical results will form a signishyficant record of data quality
104 Monitor the Integrated areas of the quantitation ions of the Internal standards and surrogates In continuing calibration checks These should remain reasonably constant over time A drift of more than 50 in any area Is indicative of a loss In sensitivity and the problem must be found and corrected These Integrated areas should also be reasonably constant In laboratory fortified blanks and samples
302
bullIf-J
105 Laboratory reagent blanks Uith each batch of samples processed as a group within a work shift analyze a laboratory reagent blank to determine the background system contamination A FRB (Sect 107) may be used in place of a LRB
106 With each batch of samples processed as a group within a work shift analyze a single laboratory fortified blank (LFB) containing each analyte of concern at a concentration as determined in 103 If more than 20 samples are included in a batch analyze one LFB for every 20 samples Use the procedures described in 1033 to evaluate the accuracy of the measurements and to estimate whether the method detection limits can be obtained If acceptable accuracy and method detection limits cannot be achieved the problem must be located and corrected before further samples are analyzed Add these results to the on-going control charts to document data quality
107 With each set of field samples a field reagent blank (FRB) should be analyzed The results of these analyses will help define contaminashytion resulting from field sampling and transportation activities If the FRB shows unacceptable contamination a LRB must be measured to define the source of the impurities
108 At least quarterly replicates of laboratory fortified blanks should be analyzed to determine the precision of the laboratory measureshyments Add these results to the on-going control charts to document data quality
109 At least quarterly analyze a quality control sample (QCS) from an external source If measured analyte concentrations are not of acceptable accuracy check the entire analytical procedure to locate and correct the problem source
1010 Sample matrix effects have not been observed when this method is used with distilled water reagent water drinking water and ground water Therefore analysis of a laboratory fortified sample matrix (LFM) is not required It is recommended that sample matrix effects be evaluated at least quarterly using the QCS described in 109
1011 Numerous other quality control measures are incorporated into other parts of this procedure and serve to alert the analyst to potential problems
11 PROCEDURE
111 SAMPLE INTRODUCTION AND PURGING
1111 This method is designed for a 25-mL sample volume but a smaller (5 mL) sample volume is recommended if the GCMS system has adequate sensitivity to achieve the required method detection limits Adjust the purge gas (nitrogen or helium) flow rate to 40 mLmin Attach the trap inlet to the
303
purging device and open the syringe valve on the purging device t
1112 Remove the plungers from two 25-mL (or 5-mL depending onsample size) syringes and attach aclosed syringe valve toeach Warm the sample to room temperatureopen the sample bottle and carefully pour the sample into one of the syringe barrels to Just short of overflowing Replace the syringe plunger invert the syringe and compress the sample Open the syringe valve and vent any residual air while adjusting the sample volume to 250-mL (or 5-mL) For samples and blanks add 5-ML of the fortification solution containing the Internal standard and the surrogates to the sample through the syringe valve For calibration standards and laboratory fortified blanks add S-ML of the fortification solution containing the Internal standard only Close the valve Fill the second syringe In an Identical manner from the same sample bottle Reserve this second syringe for a reanalysis if necessary
^ ^
1113 Attach the sample syringe valve to the syringe valve on the purging device Be sure that the trap is cooler than 25degC then open the sample syringe valve and inject the sample into the purging chamber Close both valves and initiate purging Purge the sample for 110 min at ambient temperature
112 SAMPLE DESORPTION
1121 Non-cryogenic Interface shy- After the 11-min purge place the purge and trap systen^jn the desorb mode and preheat the trapto IBO C without a flow of desorption gas Then simultanshyeously start the flow of desorption gas at 15-mLm1n for about 4 min begin the temperature program of the gas chromatograph and start data acquisition
^ ^
1122 Cryogenic Interface shy- After the 11-min purge place the purge and trap system In the desorb mode make sure the cryogenic Interface Is a -150lt C or lower and rapidly heat the trap to 180degC while backflushing with an Inert gas at 4 mLmin for about 5 min At the end of the 5 min desorpshytion cycle rapidly heat the cryogenic trap to 250degC and simultaneously begin the temperature program of the gas chromatograph and start data acquisition
1123 Uhlle the trapped components are being Introduced Into the gas chromatograph (or cryogenic Interface) empty the purging device using the sample syringe and wash the chamber with two 25-mL flushes of reagent water After the purging device has been emptied leave syringe valve open to allow the purge gas to vent through the sample Introduction needle
304
^
113
^ 1 1 bull
114
115
116
GAS CHROMATOGRAPHYMASS SPECTROMETRY - Acquire and store data over the mass range 35-260 with a total cycle time (Including scan overhead tine) of 2 sec or less Cycle time must be adjusted to measure five or more spectra during the elution of each GC peak Several alternative temperature programs can be used
1131 Single ramp linear temperature program for wide bore columns 1 and 2 with a Jet separator Adjust the helium carrier gas flow rate to about 15 mLmin The column temperature is reduced lO^C and held for 5 min from the beginning of desorption then programmed to 160degC at 6degCmin and held until all components have eluted
1132 Multi-ramp linear temperature program for wide bore column 2 with the open split Interface Adjust the helium carrier gas flow rate to about 46 mLmin The column temperature is reduced lO C and held for 6 min from the beginning of desorption then heated to 70OC at IQOmin heated to 120OC at 50niin heated to 180deg at 8degmin and held at 180deg until all compounds have eluted
1133 Single ramp linear temperature program for narrow bore column 3 with a cryogenic interface Adjust the helium carrier gas flow rate to about 4 mLmin The column temperature is reduced 10degC and held for 5 min from the beginning of vaporization from the cryogenic trap programmed at 6degCmin for 10 min then IS^Cmin for 5 min to 145ltgtC and held until all components have eluted
TRAP RECONDITIONING -- After desorbing the sample for 4 min recondition the trap by returning the purge and trap system to the purge mode Uait 15 sec then close the syringe valve on the purging device to begin gas flow through the trap Maintain the trap temperature at 180degC After approximately 7 min turn off the trap heater and open the syringe valve to stop the gas flow through the trap Uhen the trap Is cool the next sample can be analyzed
TERMINATION OF DATA ACQUISITION -- When all the sample components have eluted from the GC terminate MS data acquisition Use appropriate data output software to display full range mass spectra and appropriate plots of ion abundance as a function of time If any ion abundance exceeds the system working range dilute the sample aliquot In the second syringe with reagent water and analyze the diluted aliquot
IDENTIFICATION OF ANALYTES -- Identify a sample component by comparison of Its mass spectrum (after background subtraction) to a reference spectrum In the user-created data base The GC retention time of the sample component should be within three standard deviations of the mean retention time of the compound in the calibration mixture
305
1161 In general all Ions that are present above 10 relative abundance In the mass spectrum of the standard should be present in the mass spectrum of the sample component and should agree within absolute 20 For example if an ion has a relative abundance of 30 In the standard spectrum its abundance in the sample spectrum should be in the range of 10 to 50 Some ions particularly the molecular ion are of special importance and should be evaluated even if they are below 10 relative abundance
1162 Identification requires expert Judgement when sample components are not resolved chromatographically and produce mass spectra containing Ions contributed by more than one analyte Uhen GC peaks obviously represent more than one sample component (Ie broadened peak with shoulder(s) or valley between two or more maxima) appropriate analyte spectra and background spectra can be selected by examining plots of characteristic Ions for tentatively identified components Uhen analytes coelute (Ie only one GC peak is apparent) the identification criteria can be met but each analyte spectrum will contain extraneous ions contributed by the coeluting compound Because purgeable^organic compounds are relatively small molecules and producV comparatively simple mass spectra this Is not a significant problem for most method analytes
1163 Structural Isomers that produce very similar mass spectra can be explicitly Identified only if they have sufficiently different GC retention times Acceptable resolution is achieved If the height of the valley between two peaks is less than 25 of the average height of the two peaks Otherwise structural Isomers are Identified as Isomeric pairs Two of the three Isomeric xylenes and two of the three dichlorobenzenes are examples of structural Isomers that may not be resolved on the capillary columns If unresolved these groups of isomers must be reported as isomeric pairs
1164 Methylene chloride and other background components appear in variable quantities In laboratory and field reagent blanks and generally cannot be accurately measured Subtraction of the concentration In the blank from the concentration in the sample Is not acceptable because the concentration of the background In the blank Is highly variable
12 CALCULATIONS
121 Complete chromatographic resolution Is not necessary for accurate and precise measurements of analyte concentrations If unique Ions with adequate Intensities are available for quantitation
306
Ci
--N
1211 Calculate analyte and surrogate concentrations
Ax)(Qis) 1000 Cx
(Ais) RP V where Cx - concentration of analyte or surrogate in MQL in
the water sample Ax - Integrated abundance of the quantitation ion
of the analyte in the sample As bull integrated abundance of the quantitation ion
of the internal standard in the sample Qis - total quantity (in micrograms) of internal
standard added to the water sample V gt original water sample volume In mL RF - mean response factor of analyte from the
initial calibration
1212 Alternatively use the GCMS system software or other available proven software to compute the concentrations of the analytes and surrogates from the second or third order regression curves
1213 Calculations should utilize all available digits of precisshyion but final reported concentrations should be rounded to an appropriate number of significant figures (one digit of uncertainty) Experience indicates that three significant figures may be used for concentrations above 99 M9Lgt two significant figures for concentrations between 1- 99 M9L and one significant figure for lower concentrations
1214 Calculate the total trihalomethane concentration by summing the four individual trihalomethane concentrations In M9t-shy
13 ACCURACY AND PRECISION
131 Single laboratory accuracy and precision data were obtained for the method analytes using laboratory fortified blanks with analytes at concentrations between 1 and 5 MgLgt four sets of results were obtained using the three columns specified (Sect 632) and the open split cryogenic and jet separator interfaces (Sect 633) These data are shown in Tables 4-6
132 Uith these data method detection limits were calculated using the formula (2)
MDL - S t(niialpha - 099)
where
^(n-ll-alpha bull 099) Students t value for the 99 confidence level with n-1 degrees of freedom
307
n - number of replicates
S - the standard deviation of the replicate analyses ^J
14 REFERENCES
1 A Alford-Stevens JU Elchelberger UL Budde Purgeable Organic Compounds in Uater by Gas ChromatographyMass Spectrometry Method 524 Environmental Monitoring and Support Laboratory US Environmental Protection Agency Cincinnati Ohio February 1983
2 Madding C Volatile Organic Compounds in Uater by Purge and Trap Capillary Column GCMS Proceedings of the Uater Quality Technology Conference American Uater Works Association Denver CO December 1984
3 Glaser JA OL Foerst GD McKee SA Quave and UL Budde Trace Analyses for Uastewaters Environ Sci Technol 15 1426 1981
4 Carcinogens-Uorking with Carcinogens Department of Health Education and Uelfare Public Health Service Center for Disease Control National Institute for Occupational Safety and Health Publication No 77-206 August 1977
5 OSHA Safety and Health Standards General Industry (29CFR1910) Occupational Safety and Health Administration OSHA 2206 (Revised January 1976)
6 Safety in Academic Chemistry Laboratories American Chemical Society Publication Committee on Chemical Safety 3rd Edition 1979
7 Arrendale RF RF Severson and OT Chortyk Open Split Interface for Capillary Gas ChromatographyMass Spectrometry Anal Chem 1984 5g 1533
8 Flesch JJ PS Fair The Analysis of Cyanogen Chloride in Drinking Water Proceedings of Uater Quality Technology Conference American Water Works Association St Louis MO November 14-16 1988
308 ^
c
TABLE 1 MOLECULAR UEIGHTS ANO QUANTITATION IONS FOR NETHOO ANALYTES
Comoound
Internal standard
Fluorobenzene
Surrogate
4-Bromof1uorobenzene l2-Dichlorobenzene-d4
Taraet Analvtes
Benzene Bromobenzene Bromochloromethane Bromodichloromethane Bromoform Bromomethane n-Butylbenzene sec-Butyl benzene tert-Butylbenzene Carbon tetrachloride Chlorobenzene Chloroethane Chloroform Chloromethane 2-Chlorotoluene 4-Chlorotoluene Di bromochloromethane l2-Dibromo-3-Chloropropane 12-Dibromoethane Dibromomethane 12-Dichlorobenzene 13-Dichlorobenzene 14-Dichlorobenzene Di chiorodi f1uoromethane 11-Dichloroethane 12-Dichloroethane 11-Dichloroethene cis-12-Dichloroethene trans-12-Dichloroethene 12-Dichloropropane 13-Dichlpropropane 22-Dichloropropane 11-Dichloropropene
MW
96
174 150
78 156 128 162 250 94 134 134 134 152 112 64 118 50 126 126 206 234 186 172 146 146 146 120 98 98 96 96 96 112 112 112 110
Primary Quantitation
Ion
96
95 152
78 156 128 83 173 94 91 105 119 117 112 64 83 50 91 91 129 75 107 93 146 146 146 85 63 62 96 96 96 63 76 77 75
Secondary Quantitation
Ions
77
174176 115150
77 77158 49130 85127 175252
96 134 134 91 119
77114 66 85 52 126 126 127
155157 109188 95174 111148 111148 111148
87 6583
98 6163 6198 6198 112 78 97
11077
309
0 TABLE 1 (continued)
Primary Secondary Quantitation Quantitation
Comoound HW Ion Ions
cis-13-dichloropropene 110 75 110 trans-13-dichloropropene 110 75 110 Ethylbenzene 106 91 106 Hexachlorobutadiene 258 225 260 Isopropylbenzene 120 105 120 4-Isopropyltoluene 134 119 13491 Methylene chloride 84 84 8649 Naphthalene 128 128 n-Propyl benzene 120 91 120 Styrene 104 104 78 1112-Tetrachloroethane 166 131 133119 1122-Tetrachloroethane 166 83 13185 Tetrachloroethene 164 166 168129 Toluene 92 92 91 123-Trichlorobenzene 180 180 182 124-Trichlorobenzene 180 180 182 111-Trichloroethane 132 97 9961 112-Trichloroethane 132 83 9785 Trichloroethene 130 95 130132 Tri chiorof1uoromethane 136 101 103 123-Trichloropropane 146 75 77 124-Trimethylbenzene 120 105 120 135-Trimethylbenzene 120 105 120 Vinyl Chloride 62 62 64
bull
0-Xylene 106 106 91 m-Xylene 106 106 91 p-Xylene 106 106 91
^Monoisotopic molecular weight calculated from the atomic masses of the isotopes with the smallest masses
310
TABLE 2 CHROMATOGRAPHIC RETENTION TINES FOR NETHOD ANALYTES ON THREE COLUMNS UITH FOUR SETS OF CONDITIONS
Retention K^^ (minrsec) Compound
Internal standard
Fluorobenzene
Surrocates
4-Bromofluorobenzenel2-Dichlorobenzene-d4
Target Analvtes
Benzene Bromobenzene Bromochloromethane Bromodichloromethane Bromoform Bromomethane n-Butyl benzene shysec-Butyl benzene tert-Butylbenzene Carbon Tetrachloride Chlorobenzene Chloroethane Chloroform Chloromethane 2-Chlorotoluene 4-Chlorotoluene Cyanogen chloride Di bromochloromethane l2-Dibromo-3-Chloropropane 12-Dibromoethane Dibromomethane 12-Dichlorobenzene 13-Di chiorobenzene 14-Dichlorobenzene Dichlorodifluoromethane 11-Dichloroethane 12-Dichloroethane 11-Dichloroethene cis-12-Dichloroethene trans-12-Dichloroethene 12-Dichloropropane 13-Dichloropropane 22-Dichloropropane 11-Dichloropropene
Column 1deg Column 2deg Column 1 ^
849 627
1838 1543 2216 1908
814 540 1857 1552 644 423
1035 829 1756 1453 201 058
2213 1929 2047 1805 2017 1734 737 516
1546 1301 205 101 624 448 138 044
1920 1625 1930 1643
1423 1151 2432 2105 1444 1150 1039 756 2231 1910 2113 1808 2133 1823
133 042 451 256 824 550 253 134 611 354 359 222
1005 740 1402 1119 601 348 749 517
1406
2338 2725
1330 2400 1222 1548
- 2246 448
2732 260B 2536 1310 2040
1236 324
2432 2446
1912
1924 1526 2726 2622 2636 308
1048 1338 750
1156 954
1512 1842 1152 1306
Column 3^
803
725 1625 538 920
1542 117
1757 1728 1719 725
1420 127 533 058
1644 1649 103
1248 1802 1336 905
1747 1728 1738 053 402 700 220 504 332 856
1229 519 710
311
TABLE 2 (continued)
Retention K^^ (min sec) Compound Column 1^ Column 2deg Column 2^ Column ^^ cis-13-dichloropropenetrans-13-dichloropropeneEthylbenzeneHexachlorobutadiene
1559 2659
1323 2341
1754 1642
2100 3204
1444 1914
Isopropylbenzene4-IsopropyltolueneMethylene ChlorideNaphthalenen-Propyl benzeneStyrene1112-Tetrachloroethane
1804 2112 336
2710 1904
1719 1556
1528 1831 204 2331 1625 1436 1320
2318 2630 916 3212 2420 2224 2052
1625 1738 240 1904 1649 1547 1444
1122-Tetrachloroethane 1843 1621 2404 1547 Tetrachloroethene 1344 1109 1836 1312 Toluene 1226 1000 1724 1131 123-Trichlorobenzene 2747 2411 3258 1914 124-Trichlorobenzene 2633 2305 3130 1850 111-Trichloroethane 716 450 1250 646 112-Trichloroethane 1325 1103 1818 1159 Trichloroethene 935 716 1448 901 Trichlorofluoromethane 216 111 612 146 123-Trichloropropane124-Trimethylbenzene135-TrimethylbenzeneVinyl chlorideo-Xylenem-Xylenep-Xylene
1901 2020 1928
143 1707 1610 1607
1614 1742 1654 047 1431 1341 1341
2408 3130 2450 356 2216 2122 2118
1616 1719 1659 102 1547 1518 1518
^Columns 1-3 are those given In Sect 6321 retention times were measured from the beginning of thermal desorption from the trap (columns 1-2) or from the beginning of thermal release from the cryogenic interface (column 3) degGC conditions given in Sect 1131 ^GC conditions given in Sect 1132 OGC conditions given in Sect 1133
-A
312
TABLE 3 ION ABUNDANCE CRITERIA FOR 4-BRaMOFLUOROBENZENE (BFB)
Mass fMzl
50 75 95 96 173 174 175 176 177
Relative Abundance Criteria
15 to 40 of mass 95 30 to 80 of mass 95 Base Peak 100 Relative Abundance 5 to 9 of mass 95 lt 2 of mass 174 gt 50 of mass 95 5 to 9 of mass 174 gt 95 but lt 101 of mass 174 5 to 9 of mass 176
313
TABLE 4 ACCURACY ANO PRECISION DATA FRON 16-31 OHERMINATIONS OF THE NETHOO ANALYTES IN REAfiENT HATER USING VIDE BORE CAPILUWY COLUNI 1gt
Compound
Benzene Bromobenzene Bromochloromethane Bromodi chioromethane Bromoform Bromomethane n-ButyIbenzene sec-Butyl benzene tert-Butylbenzene Carbon tetrachloride Chlorobenzene Chloroethane Chloroform Chloromethane 2-Chlorotoluene 4-Chlorotoluene 01bromochloromethane l2-Dibromo-3-chloropropane 12-Dibromoethane Dibromomethane 12-Oichlorobenzene 13-Dichlorobenzene 14-Dichlorobenzene Di chiorodi f1uoromethane 11-Dichloroethane 12-Dichloroethane 11-Dichloroethene cis-12 Dichloroethene trans-12-Oichloroethene 12-Dichloropropane 13-Dichloropropane 22-Dichloropropane 11-Dichloropropene cis-l2-Dichloropropene trans-12-Di chioropropene Ethylbenzene Hexachlorobutadiene Isopropylbenzene 4-Isopropyltoluene Methylene chloride Naphthalene n-Propyl benzene Styrene
True Cone Range fUQL)
01-10 01-10 05-10 01-10 05-10 05-10 05-10 05-10 05-10 05-10 01-10 05-10 05-10 05-10 01-10 01-10 01-10 05-10 05-10 05-10 01-10 05-10 02-20 05-10 05-10 01-10 01-10 05-10 01-10 01-10 01-10 05-10 05-10
01-10 05-10 05-10 01-10 01-10 01-100 01-10 01-100
Mean Accuracy
( of True Value)
97 100 90 95 101 95 100 100 102 84 98 89 90 93 90 99 92 83 102 100 93 99 103 90 96 95 94 101 93 97 96 86 98
99 100 101 99 95 104 100 102
Rel Std Dev ()
57 55 64 61 63 82 76 76 73 88 59 90 61 89 62 83 70 199 39 56 62 69 64 77 53 54 67 67 56 61 60 169 89
86 68 76 67 53 82 58 72
Method Det Limit (ual)
004 003 004 008 012 011 011 013 014 021 004 010 003 013 004 006 005 026 006 024 003 012 003 010 004 006 012 012 006 004 004 035 010
006 011 015 012 003 004 004 004
314
TABLE 4 (Continued)
True Mean Rel Method Cone Accuracy Std Oet Range ( of True Dev Limit
Compound fuoLl Valuel IX) (uoLl
1112-Tetrachl oroethane 05-10 90 68 005 1122-Tetrachloroethane 01-10 91 63 004 Tetrachloroethene 05-10 89 68 014 Toluene 05-10 102 80 011 123-Trichlorobenzene 05-10 109 86 003 124-Trichlorobenzene 05-10 108 83 004 111-Trichloroethane 05-10 98 81 008 112-Trichloroethane 05-10 104 73 010 Trichloroethene 05-10 90 73 019 Tri chiorof1uoromethane 05-10 89 81 008 123-Trichloropropane 05-10 108 144 032 124-Trimethyl benzene 05-10 99 81 013 135-Triraethylbenzene 05-10 92 74 005 Vinyl chloride 05-10 98 67 017 o-Xylene 01-31 103 72 011 m-Xylenc 01-10 97 65 005 p-Xylene 05-10 104 77 013
k ^Data obtained by Robert U Slater using column 1 with a Jet separator-interface and a quadrupole mass spectrometer (Sect 1131) with analytes divided among three solutions
315
TABLE 5 ACCURACY ANO PRECISION DATA FRON SEVEN DETERMINATIONS OF THE NETHOO ANALYTES IN REAGENT UATER USING THE CRYOGENIC TRAPPING OPTION AND A NARROW BORE CAPILLARY COLUNN 3
Comoound
Benzene Bromobenzene Bromochloromethane Bromodichloromethane Bromoform Bromomethane n-Butylbenzene sec-Butylbenzene tert-Butylbenzene Carbon tetrachloride Chlorobenzene Chloroethane Chloroform Chloromethane 2-Chlorotoluene 4-Chlorotoluene Cyanogen chloride^ Di bromochloromethane 12-Di bromo-3-chloropropane 12-Dibromoethane Dibromomethane 12-Oichlorobenzene 13-01chiorobenzene 14-Dichlorobenzene Dichlorodi f1uoromethane 11-01chioroethane 12-Dichloroethane 11-Dichloroethene cis-12 Dichloroethene trans-12-Dichloroethene 12-Dichloropropane 13-Dichloropropane 22-Dichloropropane 11-Dichloropropene cis-l3-01chloropropene trans-13-Dlchloropropene Ethylbenzene Hexachlorobutadiene Isopropylbenzene 4-Isopropytoluene Methylene chloride Naphthalene
True Cone fuaL)
01 05 05 OI 01 01 05 05 05 01 01 01 01 01 01 01
01 01 01 01 01 01 01 01 01 01 01 01 01 01 01 01 01
01 01 05 05 05 01
Mean Accuracy ( of True Valuel
99 97 97 100 99 99 94 90 90 92 91 100 95 99 99 96 92 99 92 97 93 97 99 93 99 98 100 95 100 98 96 99 99 98
99 100 98 87 97 98
Rel Std Dev ()
62 74 58 46 54 71 60 71 25 68 58 58 32 47 46 70 106 56 100 56 69 35 60 57 88 62 63 90 37 72 60 58 49 74
52 67 64rr 130 130 72
Method Dect Limit
(UQL)
003 011 007 003 020 006 003 012 033 008 003 002 002 005 005 005 030 007 005 002 003 005 005 004 011 003 002 005 006 003 002 004 005 002
003 004 010 026 009 004
316
TABLE 5 (Continued)
Comoound
n-Propylbenzene Styrene 1112-Tetrach1oroethane 1122-Tetrachloroethane Tetrachloroethene Toluene 123-Trichlorobenzene 124-Trichlorobenzene il1-Trichloroethane 112-Trichloroethane Trichloroethene Trichlorofluoromethane 123-Trichloropropane 124-Tri methyl benzene 135-Trimethylbenzene Vinyl chloride o-Xylene m-Xylene p-Xylene
True Cone
(ual)
01 01 01 05 01 01 01 01 01 01 01 01 01 01 01 01 01 01 01
Mean Accuracy ( of True Valuel
99 96 100 100 96 100 98 91 100 98 96 97 96 96 99 96 94 94 97
Rel Std Dev 1)
66 190 47 120 50 59 89 160 40 49 20 46 65 65 42 02 75 46 61
Method Dect Limit
lUQl)
006 006 004 020 005 008 004 020 004 003 002 007 003 004 002 004 006 003 006
^Data obtained by Caroline A Madding using column 3 with a cryogenic interface and a quadrupole mass spectrometer (Sect 1133)
Reference 8
317
TABLE 6 ACCURACY AND PRECISION DATA FRON SEVEN OCTERMINATIONS OF THE MrrHOO ANALYTES IN REAGENT UATER USING UIDE BORE CAPILLARY COLUNN 2
CQmPound NJLL 0
Mean Accuracy ( of True
Value 2 uoL Concl
RSD )
Mean Accuracy ( of True
Value 02 OTL Cone)
RSD )
Internal Standard
Fluorobenzene 1
Surrogates
4-Bromofluorobenzene l2-Dichlorobenzene-d4
2 3
98 97
18 32
96 95
13 17
Target Analvtes
Benzene Bromobenzene Bromochloromethane Bromod i chioromethane Bromoform Bromomethane n-Butylbenzene sec-Butylbenzene tert-Butylbenzene Carbon tetrachloride Chlorobenzene Chloroethane^ Chloroform Chloromethane 2-Chlorotoluene 4-Chlorotoluene Di bromochloromethane l2-Dibromo-3-chloropropane 12-DibromoethaneC Dibromomethane 12-Dichlorobenzene 13-Dichlorobenzene 14-Dichlorobenzene Di chiorodi f1uoromethane 11-Oichloroethane 12-Dichloroethane 11-Oichloroethene cis-12-Dichloroethene trans-12-Dichloroethene
37 38 4 5 6 7 39 40 41 8 42
9 10 43 44 11
|C
13 45 46 47 14 15 16 17 18 19
97 102 99 96 89 55 89 102 101 84 104
97 110 91 89 95
99 93 100 98 38 97 102 90 100 92
44 30 52 18 24 27 48 35 45 32 31
20 50 24 20 27
21 27 40 41 25 23 38 22 34 21
113 101 102 100 90 52 87 100 100 92 103
95 d 108 108 100
95 94 87 94 d 85 100 87 89 85
18 19 29 18 22 67 23 28 29 26 16
21
31 44 30
22 51 23 28
36 21 3 8 29 23
6
318
TABLE 6 (Continued)
f v
Mean Accuracy Mean Accuracy ( of True ( of True
Value RSD Value RSD CQmpQund NQ 2 uoL Concl ) 02 ugL Concl fl
12-Dichloropropane 20 102 22 103 29 13-Dichloropropane 21 92 37 93 32 22-Dichloropropane^ 11-Dichloropropene^ cis-13-Dichloropropene^ trans-13-Dichloropropene 25 96 17 99 21 Ethylbenzene 48 96 91 100 40 Hexachlorobutadiene 26 91 53 88 24 Isopropylbenzene 49 103 32 101 21 4-Isopropyltoluene 50 95 36 95 31 Methylene chloride 27 e e Naphthalene 51 93 76 78 83 n-Propylbenzene 52 102 49 97 21 Styrene 1112-Tetrachloroethane 1122-Tetrachloroethane Tetrachloroethene
53 28 29 30
95 99 101 97
44 27 46 45
104 95 84 92
31 38 36 33
Toluene 54 105 28 126 17 123-Trichlorobenzene 55 90 57 78 29 124-Trichlorobenzene 111-Trichloroethane 112-Trichloroethane Trichloroethene
56 31 32 33
92 94 107 99
52 39 34 29
83 94 109 106
59 25 28 25
Tri chiorof1uoromethane 34 81 46 48 13 123-Trichloropropane 124-Trimethylbenzene 135-Trimethylbenzene Vinyl chloride o-Xylene m-Xylene p-Xylene
35 57 58 36 59 60 61
97 93 88 104 97 f 98
39 31 24 35 18
23
91 106 97 115 98 f 103
28 22 32 14 17
14
^Data obtained by James U Elchelberger using column 2 with the open split interface and an ion trap mass spectrometer (Sect 1132) with all method analytes In the same reagent water solution
^Designation in Figures 1 and 2 ^Not measured authentic standards were not available ^Not found at 02 MgL |Not measured methylene chloride was In the laboratory reagent blank ^m-xylene coelutes with and cannot be distinguished from its isomer p-xylene No 61
319
OPTIONAL FOAM TRA
X IN 0 0 EXIT
10MM GUASS FRIT MEDIUM JPOROSin
EXIT IN 00
14MU 0 D
WLETXIN 00
SAMPLE INLET
2WAY SYRINGE VALVE bull17CM 20 GAUGE SYRINGE NEEDLE
MM 0 0 RUBBER S9TUH
^10MM 0 D 116 IN 00 ftmdashINLET ]1STAINLpoundSS STEEL
X IN o D
i n MOLECULAR SIEVE PURGE GASRLTEX
PURGE GAS I FLOW CONTROL
FIGURE 1 PURGING DEVICE
320
c
PACXIN6 PROCEDURE CONSTRUCTION
COMPRESSION GLASS g n i 7AioOT RTTING NUT WOOL I w RESISTANCE
WIRE WRAPPED AND FERRULES ACTIVATED I J ^i (DOUBLE LAYER)
THERMOCOUPLE
CHARCOAL77CM^ SOLID
I CONTROLLER SeiSOR
15CM JGRADE 1 5 - Q ^ NIC BATUREl
NTROL 7^FOOT D
[PYROMETER RESISTANCE WIRE WRAPPED TUBING 25CM TBVAX 77 Of l^^ SOLID 0105 IN ID
(SINGLE LAYER) 0125 IN 00 3X0V-1 8CM-H STAINLESS STEa ICM GLASS WOOL
TRAP INLET
FIGURE 2 TRAP PACKINGS ANO CONSTRUCTION TO INCLUDE DESORB CAPABILITY
321
FIGURE 3 NORMALIZED TOTAL ION CURRENT CHROMATOGRAM FROM A VOLATILE COMPOUND CALIBRATION MIXTURE CONTAINING 25 na (5 MgL) OF MOST COMPOUNDS THE COMPOUND IDENTIFICATION NUMBERS ARE GIVEN IN TABLE 6
109
ro ro
TOTshy
JO
m322
7 4 A
280 (42
Y
m 1082
400 1322
30
t l
1A^^^Al^ l l y^ l^
(00 2902
AJ VJ LI ^ laquolaquo Li L^l r i i raquo r f Il raquo r r I raquo raquo raquo
Mj f II II I-j II I I r j II I I II 11 II I II I IIll 1111 II raquol
m m m im 2322 2(42 391)2 3322
u o o
lt ^
FIGURE A AMPLIFIED FIRST EIGHT MINUTES OF A TOTAL ION CURRENT CHROMATOGRAM FROM A VOLATILE COMPOUND CALIBRATION MIXTURE CONTAINING 25 ng (5 wgL) OF EACH COMPONENT THE COMPOUND IDENTIFICATION NUMBERS ARE GIVEN IN TABLE 6
mi
lOT-CO ro
_ i _ - I M I I I I I I I 11111 I bull I I I I I I I
50 m ISO 200 250 142 322 502 (42 822
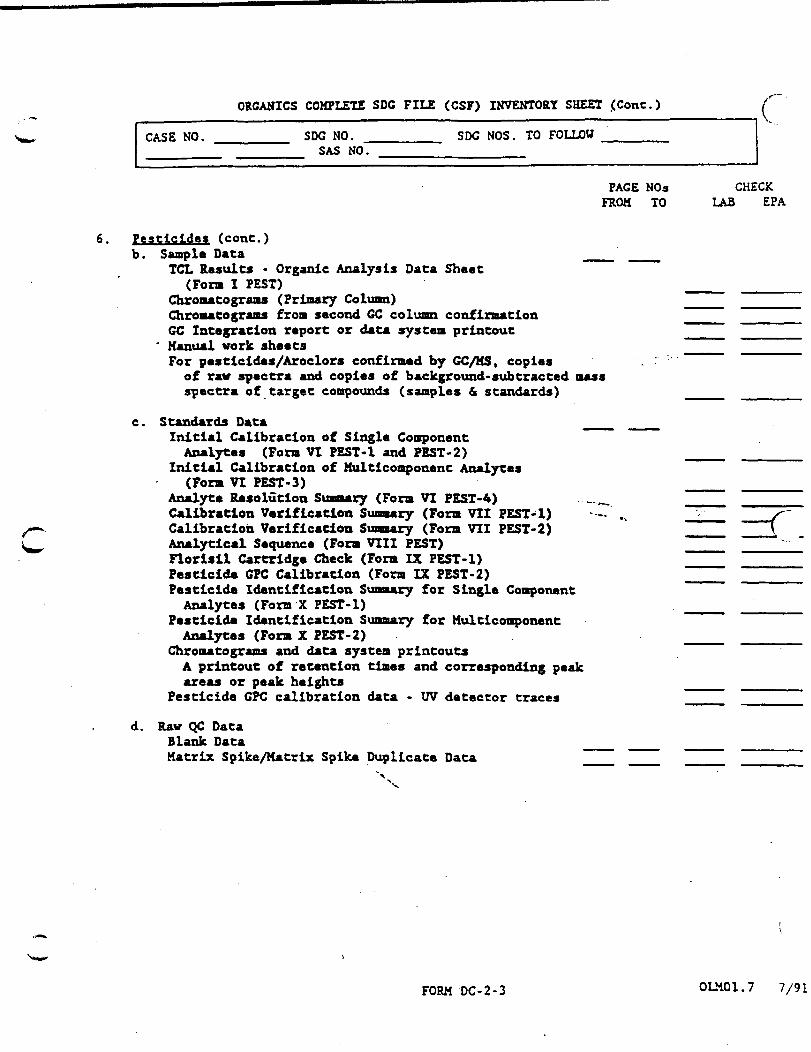
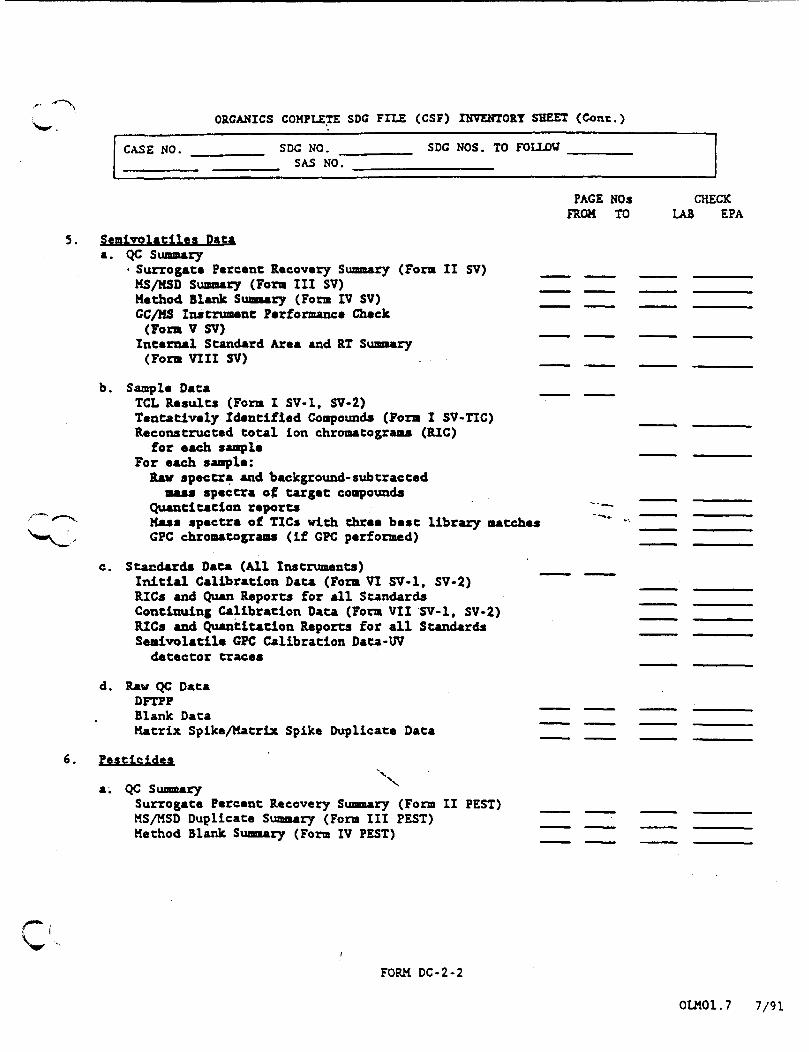
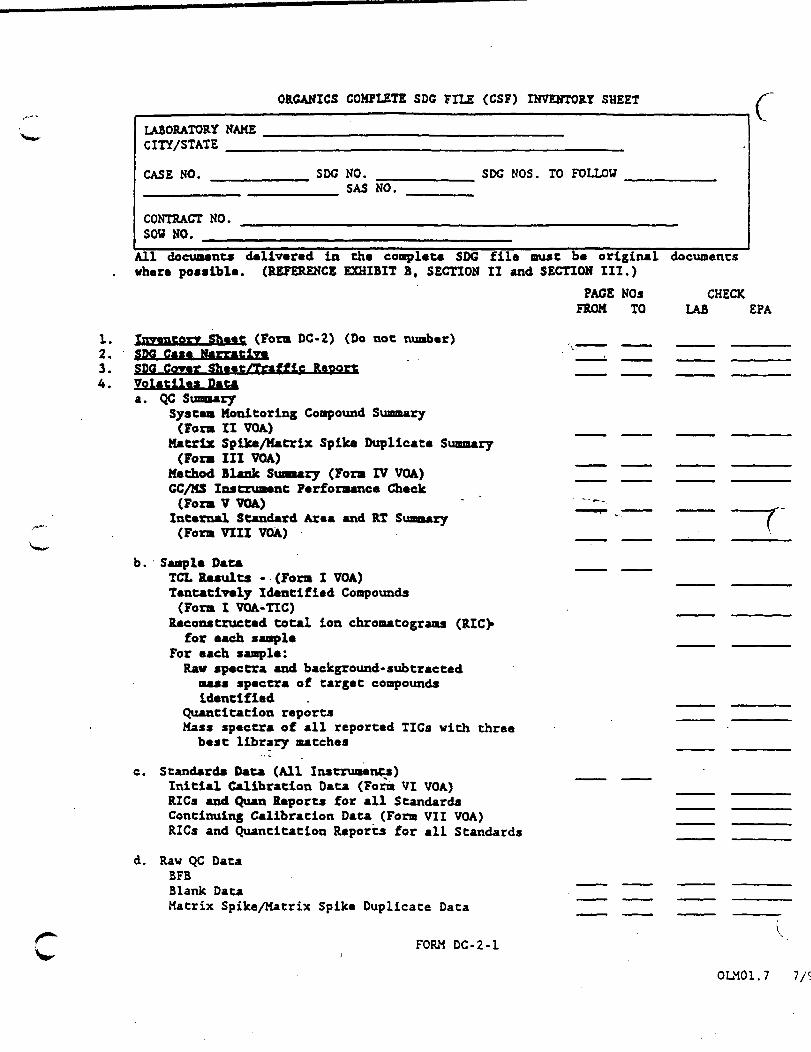
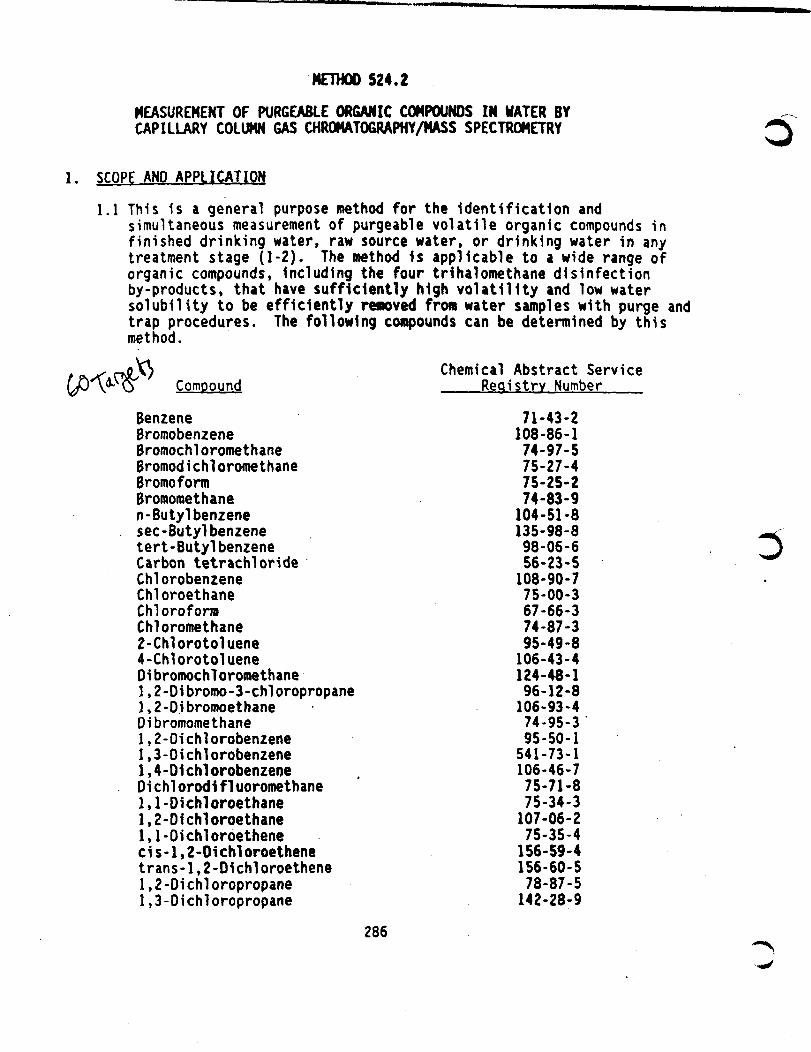
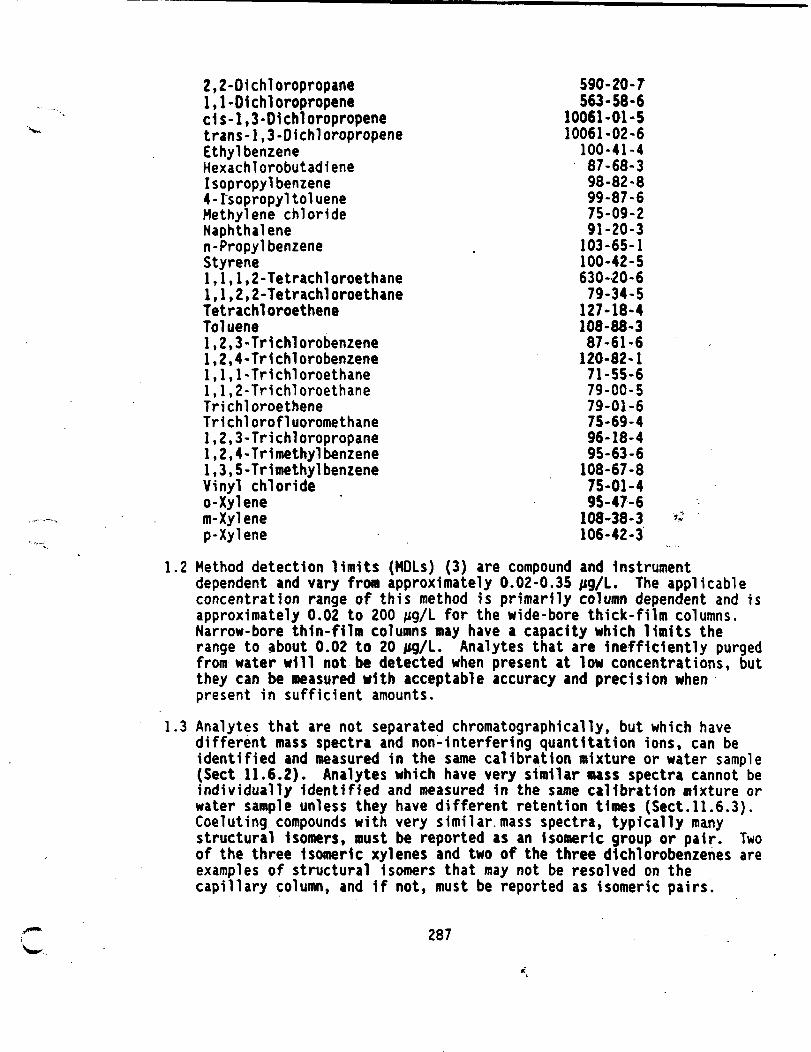
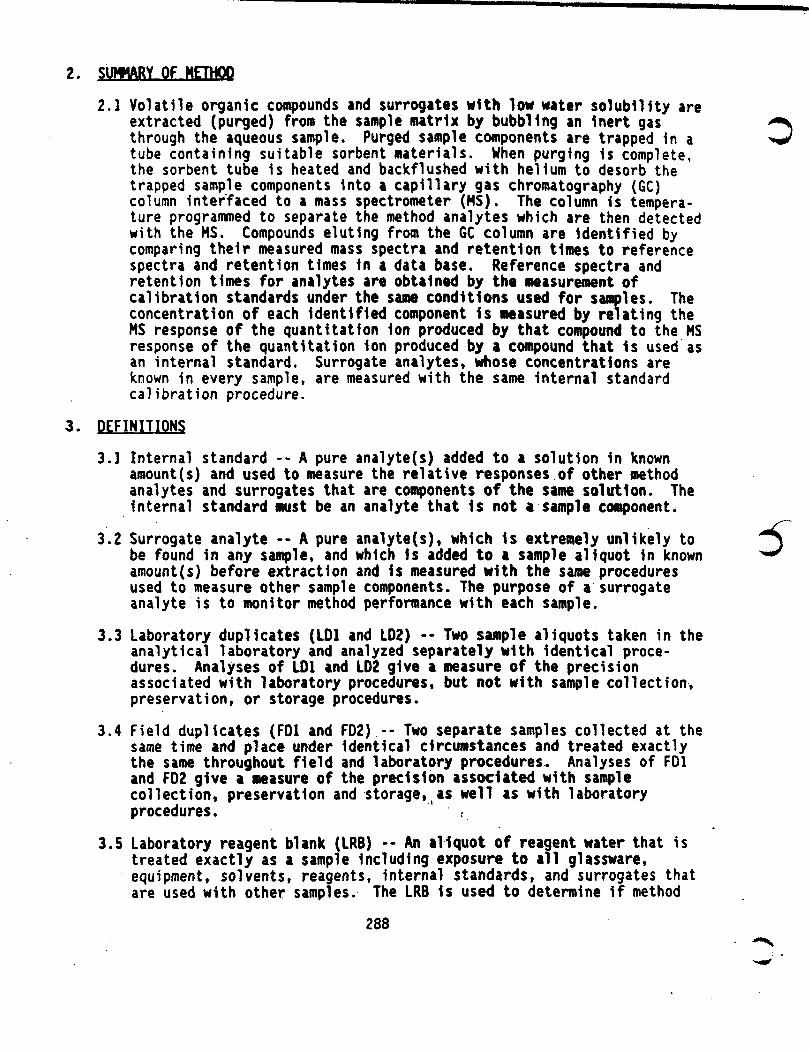
c
analytes or other interferences are present In the laboratory environshyment the reagents or the apparatus
v
36 Field reagent blank (FRB) -- Reagent water placed in a sample container in the laboratory and treated as a sample in all respects including exposure to sampling site conditions storage preservation and all analytical procedures The purpose of the FRB is to determine if method analytes or other interferences are present In the field environment
37 Laboratory performance check solution (LPC) -- A solution of one or more compounds (analytes surrogates internal standard or other test compounds) used to evaluate the performance of the Instmment system with respect to a defined set of method criteria
38 Laboratory fortified blank (LFB) mdash An aliquot of reagent water to which known quantities of the method analytes are added In the laboratory The LFB Is analyzed exactly like a sample and its purpose Is to determine whether the methodology is in control and whether the laboratory is capable of making accurate and precise measurements at the required method detection limit
39 Laboratory fortified sample matrix (LFM) -- An aliquot of an environshymental sample to which known quantities of the method analytes are added in the laboratory The LFM is analyzed exactly like a sample and its purpose is to determine whether the sample matrix contributes bias to the analytical results The background concentrations of the analytes in the sample matrix must be determined in a separate aliquot and the measured values In the LFM corrected for background concentrashytions
310 Stock standard solution -- A concentrated solution containing a single certified standard that is a method analyte or a concentrated solution of a single analyte prepared In the laboratory with an assayed reference compound Stock standard solutions are used to prepare primary dilution standards
bullj
311 Primary dilution standard solution -- A solution of several analytes prepared in the laboratory from stock standard solutions and diluted as needed to prepare calibration solutions and other needed analyte solutions
312 Calibration standard (CAL) -- a solution prepared from the primary dilution statidard solution and stock standard Solutions of the Internal standards ^d-surrogate analytes The CAL solutions are used to calibrate th^Instrument response with respect to analyte concentrashytion
313 Quality control sam0U (QCS) -- a sample matrix containing method analytes or a solution of method analytes In a water miscible solvent which is used to fortifytreagent water or environmental samples The QCS is obtained from a source external to the laboratory and is used
289
to check laboratory performance with externally prepared test materials
4 INTERFERENCES
41 During analysis major contaminant sources are volatile materials in the laboratory and impurities in the inert purging gas and in the sorbent trap The use of non-polytetrafluoroethylene (PTFE) plastic tubing non-PTFE thread sealants or flow controllers with rubber components in the purging device should be avoided since such materials out-gas organic compounds which will be concentrated in the trap during the purge operation Analyses of laboratory reagent blanks provide Information about the presence of contaminants When potential Interfering peaks are noted In laboratory reagent blanks the analyst should change the purge gas source and regenerate the molecular sieve purge gas filter Subtracting blank values from sample results Is not permitted
42 Interfering contamination may occur when a sample containing low concentrations of volatile organic compounds is analyzed immediately after a sample containing relatively high concentrations of volatile organic compounds A preventive technique Is between-sample rinsing of the purging apparatus and sample syringes with two portions of reagent water After analysis of a sample containing high concentrations of volatile organic compounds one or more laboratory reagent blanks should be analyzed to check for cross contamination
43 Special precautions must be taken to determine methylene chloride The analytical end sample storage area should be Isolated from allatmospheric sources of methylene chloride otherwise random backgroundlevels will result Since methylene chloride will permeate through PTFE tubing all gas chromatography carrier gas lines and purge gas plumbing should be constructed of stainless steel or copper tubing Laboratory workers clothing should be cleaned frequently since clothing previously exposed to methylene chloride fumes during common liquidliquid extraction procedures can contribute to sample contaminashytion
^ ^
5 SAFETY
51 The toxicity or carcinogenicity of chemicals used in this method has not been precisely defined each chemical should be treated as a potential health hazard and exposure to these chemicals should be minimized Each laboratory Is responsible for maintaining awareness of OSHA regulations regarding safe handling of chemicals used in this method Additional references to laboratory safety are available (4-6) for the Information of the analyst
52 The following method analytes have been tentatively classified as known or suspected human or mammalian carcinogens benzene carbon tetrachloride 14-dichlorobenzene l2-4ichlorethane^ hexachloroshybutadiene 1122-tetrachloroethane 112-trlchloroethane chloroshy
290 ^
form 12-dibromoethanetetrachloroethene trichloroethene and vinyl ^ chloride Pure standard materials and stock standard solutions of V these compounds should be handled in a hood A NIOSHMESA approved
toxic gas respirator should be worn when the analyst handles high concentrations of these toxic compounds
6 APPARATUS AND EQUIPMENT
61 SAMPLE CONTAINERS -- 60-mL to 120-mL screw cap vials (Pierce 19832 or equivalent) each equipped with a PTFE-faced silicone septum (Pierce 12718 or equivalent) Prior to use wash vials and septa with detergent and rinse with tap and distilled water Allow the vials and septa to air dry at room temperature place In a 105degC oven for 1 hr then remove and allow to cool In an area known to be free of organics
62 PURGE AND TRAP SYSTEM -- The purge and trap system consists of three separate pieces of equipment purging device trap and desorber Systems are commercially available from several sources that meet all of the following specifications
621 The all glass purging device (Figure 1) should be designed to accept 25-mL samples with a water column at least 5 cm deep A smaller (5-mL) purging device is recommended If the GCMS system has adequate sensitivity to obtain the method detection limits required Gaseous volumes above the sample must be kept to a minimum (lt 15 mL) to eliminate dead volume effects A glass frit should be Installed at the base of the sample chamber so Cl the purge gas passes through the water column as finely divided bubbles with a diameter of lt 3 mm at the origin Needle spargers may be used however the purge gas must be introduced at a point about 5 mm from the base of the water column
622 The trap (Figure 2) must be at least 25 cm long and have an inside diameter of at least 0105 in Starting from the inlet the trap should contain 10 cm of methyl silicone coated packing and the following amounts of adsorbents 13 of 26-dlphenylene oxide polymer 13 of silica gel and 13 of coconut charcoal If it is not necessary to determine dichlorodifluoromethane the charcoal can be eliminated and the polymer increased to fill 23 of the trap Before Initial use the trap should be conditioned overnight at 180degC by backflushing with an inert gas flow of at least 20 mLmin Vent the trap effluent to the room not to the analytical column Prior to daily use the trap should be conditioned for 10 min at 180degC with backflushing The trap may be vented to the analytical column during dally conditioning however the column must be run through the temperature program prior to analysis of samples
623 The use of the methyl silicone coated packing is recommended but not mandatory The packing serves a dual purpose of protecting the Tenax adsorbant from aerosols and also of
291
insuring that the Tenax is fully enclosed within the heated zone of the trap thus eliminating potential cold spots Alternatively sllanized glass wool may be used as a spacer at the trap inlet
624 The desorber (Figure 2) must be capable of rapidly heating the trap to 180degC either prior to or at the beginning of the flow of desorption gas The polymer section of the trap should not be heated higher than 200degC or the life expectancy of the trap will decrease Trap failure is characterized by a pressure drop in excess of 3 pounds per square Inch across the trap during purging or by poor bromoform sensitivities The desorber design Illustrated in Fig 2 meets these criteria
63 GAS CHROMATOGRAPHYMASS SPECTROMETERDATA SYSTEM (6CMSDS)
631 The GC must be capable of temperature programming and should be equipped with variable-constant differential flow controllers so that the column flow rate will remain constant throughout desorption and temperature program operation The column oven must be cooled to lO C therefore a subambient oven controller Is required If syringe injections of BFB will be used a splitsplitless injection port is required bull
632 Capillary Gas Chromatography Columns Any gas chromatography V column that meets the perfonnance specifications of this method
may be used Separations of the calibration mixture must be equivalent or better than those described In this method Three useful columns have been identified
6321 Column 1 -- 60 m x 075 mm ID VOCOL (Supelco Inc) glass wide-bore capillary with a 15 im film thickness
Column 2 -- 30 m X 053 mm ID DB-624 (JampW Scientific Inc) fused silica capillary with a 3 im film thickshyness
Column 3 - 30 m X 032 mm ID DB-5 (JampU Scientific Inc) fused silica capillary with a 1 fun film thickshyness
633 Interfaces between the GC and HS The interface used depends on the column selected and the gas flow rate
6331 The wide-bore columns 1 and 2 have the capacity to accept the standard gas flows from the trap during thermal desorption and chromatography can begin with the onset of thermal desorption Depending on the pumping capacity of the MS an additional interface between the end of the column and the MS may be required An open split interface (7) an all-glass Jet separator or a cryogenic (Sect 6332) device
292
^
^
c
are acceptable interfaces Any Interface can be used If the performance specifications described in this method can be achieved The end of the transfer line after the interface or the end of the analytical column if no interface is used should be placed within a few mm of the MS ion source
6332 The narrow bore column 3 cannot accept the thermal desorption gas flow and a cryogenic interface is required This interface (Tekmar Model 1000 or equivalent) condenses the desorbed sample components at liquid nitrogen temperature and allows the helium gas to pass through to an exit The condensed components are frozen in a narrow band on an uncoated fused silica precolumn When all components have been desorbed from the trap the interface Is rapidly heated under a stream of carrier gas to transfer the analytes to the analytical column The end of the analytical column should be placed with a few mm of the HS ion source A potential problem with this interface is blockage of the interface by frozen water from the trap This condition will result in a major loss in sensitivity and chromatographic resolution
634 The mass spectrometer must be capable of electron ionization at a nominal electron energy of 70 eV The spectrometer must be capable of scanning from 35 to 260 amu with a complete scan cycle time (including scan overhead) of 2 sec or less (Scan cycle time bullgt Total HS data acquisition time in seconds divided by number of scans in the chromatogram) The spectrometer must produce a mass spectrum that meets all criteria In Table 3 when 25 ng or less of 4-bromofluorobenzene (BFB) is introduced into the GC An average spectrum across the BFB GC peak may be used to test instrument performance
635 An Interfaced data system is required to acquire store reduce and output mass spectral data The computer software should have the capability of processing stored GCMS data by recognizshying a GC peak within any given retention time window comparing the mass spectra from the GC peak with spectral data in a user-created data base and generating a list of tentatively identified compounds with their retention times and scan
UKJsnxabers The software must allow Integration of the ion abundance of any specific Ion between specified time or scan number limits The software should also allow calculation of response factors as defined in Sect 926 (or construction of a second or third order regression calibration curve) calculashytion of response factor statistics (mean and standard deviashytion) and calculation of concentrations of analytes using either the calibration curve or the equation in Sect 12
293
64 SYRINGE ANO SYRINGE VALVES
641 Two S-mL or 25-mL glass hypodermic syringes with Luer-Lok tip (depending on sample volume used)
642 Three 2-way syringe valves with Luer ends
643 One ZS- j i l micro syringe with a 2 in x 0006 in ID 22deg bevel needle (Hamilton I702N or equivalent)
644 Micro syringes - 10 100 n l
645 Syringes - 05 10 and 5-mL gas tight with shut-off valve
65 MISCELLANEOUS
651 Standard solution storage containers -- 15-mL bottles with PTFE-11ned screw caps
7 REAGENTS AND CONSUMABLE MATERIALS
71 TRAP PACKING MATERIALS
711 26-Diphenylene oxide polymer 6080 mesh chromatographic grade (Tenax GC or equivalent)
712 Methyl silicone packing (optional) -- OV-1 (3X) on Chromoshysorb W 6080 mesh or equivalent
713 Silica gel -- 3560 mesh Davison grade IS or equivalent 5 714 Coconut charcoal -- Prepare from Barnebey Cheney CA-580-26
lot IM-2649 by crushing through 26 mesh screen
72 REAGENTS
721 MethanoljengtiiOefflonstrated to be free of analytes
722 Reagent water -- Prepare reagent water by passing tap water through a filter bed containing about 05 kg of activated carbon by using a water purification system or by boiling distilled water for IS min followed by a 1-h purge with inert gas while the water temperature is held at 90degC Store in clean narrow-mouth bottles with PTFE-llned septa and screw caps
723 Hydrochloric acid (1+1) -- Carefully add measured volume of cone HCI to equal volume of reagent water
724 Vinyl chloride -- Certified mixtures of vinyl chloride in nitrogen and pure vinyl chloride are available from several
294
-^
y fH- y_
sources (for example Matheson Ideal Gas Products and Scott Gases)
725 Ascorbic acid -- ACS reagent grade granular
73 STOCK STANDARD SOLUTIONS -- These solutions may be purchased as certified solutions or prepared from pure standard materials using the following procedures One of these solutions is required for every analyte of concern every surrogate and the internal standard A useful working concentration is about 1-5 mgmL
731 Place about 98 mL of methanol into a 10-mL ground-glass stoppered volumetric flask Allow the flask to stand unstoppered for about 10 min or until all alcohol-wetted surfaces have dried and weigh to the nearest 01 mg
732 If the analyte Is a liquid at room temperature use a 100-iL syringe and Immediately add two or more drops of reference standard to the flask Be sure that the reference standard falls directly into the alcohol without contacting the neck of the flask If the analyte Is a gas at room temperature fill a 5-mL valved gas-tight syringe with the standard to the 50-mL mark lower the needle to 5 mm above the methanol meniscus and slowly inject the standard Into the neck area of the flask The gas will rapidly dissolve in the methanol
733 Reweigh dilute to volume stopper then mix by inverting the flask several times Calculate the concentration In
n q l i l from the net gain in weight When compound purity is certified at 96X or greater the weight can be used without
correction to calculate the concentration of the stock standard 734 Store stock standard solutions in 15-mL bottles equipped
with PTFE-llned screw caps Methanol solutions prepared from liquid analytes are stable for at least 4 weeks when stored at 4degC Methanol solutions prepared from gaseous analytes are not stable for more than 1 week when stored at lt0degC at room temperature they must be discarded after 1 day
74 PRIMARY DILUTION STANDARDS - Use stock standard solutions to prepare primary dilution standard solutions that contain all the analytes of concern and the surrogates (but not the Internal standard) In methanol The prlm^ifdilution standards should be prepared at concentrations that can be easily diluted to prepare aqueous calibrashytion solutions that will bracket the working concentration range Store the primary dilution standard solutions with minimal headspace and check frequently for signs of deterioration or evaporation especially Just before preparing calibration solutions Storage times described for stock standard solutions in Sect 744 also apply to primary dilution standard solutions
295
75 FORTIFICATION SOLUTIONS FOR INTERNAL STANDARD AND SURROGATES
751 A solution containing the Internal standard and the surrogates is required to prepare laboratory reagent blanks (also used as a laboratory performance check solution) and to fortify each sample Prepare a fortification solution containing fluoroshybenzene (internal standard) 12- dichlorobenzene-d4 (surrogate) and BFB (surrogate) in methanol at concentrations of 5 xgmL of each A 5-ML aliquot of this solution added to a 25-mL water sample volume gives concentrations of 1 f t q l of each A S-^L aliquot of this solution added to a 5-mL water sample volume gives a concentration of 5 M Q A of each) Additional Internal standrds and surrogate analytes are optional
752 A solution of the Internal standard alone Is required to prepare calibration standards and laboratory fortified blanks The internal standard should be In methanol at a concentration of 5 MgmL
76 PREPARATION OF LABORATORY REAGENT BLANK shy- Fill a 25-mL (or 5-mL) syringe with reagent water and adjust to the mark (no air bubbles) Inject 10 n l of the fortification solution containing the internal standard and surrogates through the Luer Lok valve Into the reagent water Transfer the LRB to the purging device See Sect 1112
77 PREPARATION OF LABORATORY FORTIFIED BLANK shy Prepare this exactly like a calibration standard (Sect 78) This Is a calibration standard that is treated as a sample
78 PREPARATION OF CALIBRATION STANDARDS i i l0^^
- X 0
781
3
The number of calibration solutions (CALs) needed depends on the calibration range desired A minimum of three CAL solutions is required to calibrate a range of a factor of 20 In concentrashytion For a factor of 50 use at least four standards and for a factor of 100 at least five standards One calibration
1-So 5
standard should contain each analyte of concern and each surrogate at a concentration of 2-10 times the method detection limit (Tables 4-6) for that compound The other CAL standards should contain each analyte of concern and each surrogate at concentrations that define the range of the method Every CAL solution contains the Intemal standard at the same concentrashytion (5 M9L suggested for a 5-mL sample 1 i i g l for a 25-mL sample)
782 To prepare a calibration standard add an appropriate volume of a primary dilution standard (containing analytes and surrogates) to an aliquot of reagent water In a volumetric flask Use a microsyringe and rapidly inject the methanol solutions into the expanded area of the filled volumetric flask Remove the needle as quickly as possible after injection Mix by Inverting the
296 ^ m ^
^^flask three times only Discard the contents contained in the
neck of the flask Aqueous standards are not stable In a volumetric flask and should be discarded after 1 hr unless transferred to a sample bottle and sealed immediately
8 SAMPLE COLLECTION PRESERVATION AND STORAGE
81 SAMPLE COLLECTION DECHLORINATION AND PRESERVATION
811 Collect all samples In duplicate If samples contain residual chlorine and measurements of the concentrations of disinfection by-products (trihalomethanes etc) at the time of sample collection are desired add about 25 mg of ascorbic acid to the sample bottle before filling Fill sample bottles to overflowshying but take care not to flush out the rapidly dissolving ascorbic acid No air bubbles should pass through the sample as the bottle is filled or be trapped in the sample when the bottle is sealed Adjust the pH of the duplicate samples to lt2 by carefully adding one drop of 11 HCI for each 20 mL of sample volume Seal the sample bottles PFTE-face down and shake vigorously f o r 1 min
812 When sampling from a water tap open the tap and allow the system to flush until the water temperature has stabilized (usually about 10 min) Adjust the flow to about 500 mLmin and collect duplicate samples from the flowing stream
bull - shy
bdquo ^ 813 When sampling from an open body of water fill a 1-quart wide-mouth bottle or l-11ter beaker with sample from a representative area and carefully fill duplicate sample bottles from the 1-quart container
814 The samples must be chilled to 4degC on the day of collection and maintained at that temperature until analysis Field samples that will not be received at the laboratory on the day of collection must be packaged for shipment with sufficient ice to ensure that they will be at 4degC on arrival at the laboratory
82 SAMPLE STORAGE
821 Store samples at 4degC until analysis The sample storage area must be free of organic solvent vapors
822 Analyze all samples within 14 days of collection Samples not analyzed within this period must be discarded and replaced
83 FIELD REAGENT BLANKS
831 Duplicate field reagent blanks must be handled along with each sample set which is composed of the samples collected from the same general sample site at approximately the same time At the laboratory fill field blank sample bottles with reagent
V 297
water seal and ship to the sampling site along with empty sample bottles and back to tht laboratory with filled sample bottles Wherever a set of samples Is shipped and stored it is accompanied by appropriate blanks
832 Use the same procedures used for samples to add ascorbic acid and HCI to blanks (Sect 811)
9 CALIBRATION
91 Demonstration and documentation of acceptable initial calibration is required before any samples are analyzed and Is required intermittently throughout sample analysis as dictated by results of continuing calibration checks After Initial calibration Is successful a continuing calibration check Is required at the beginning of each 8 hr period during which analyses are performed Additional periodic calibration checks are good laboratory practice
92 Initial calibration
921 Calibrate the mass and abundance scales of the MS with calibrashytion compounds and procedures prescribed by the manufacturer with any modifications necessary to meet the requirements in Sect 922
922 Introduce Into the GC (either by purging a laboratory reagent blank o r making a syringe Injection) 25 ng of BFB and acquire mass spectra for ivz 35-260 at 70 eV (nominal) Use the purging procedure andor GC conditions given In Sect Hi If thespectrum does not meet all criteria In Table 2raquo the MS must be retuned and adjusted to meet all criteria before proceeding with calibration An average spectrum across the GC peak may be used to evaluate the performance of the system
923 Purge a medium CAL solution for example 10-20 |tgL using the procedure given In Sect 11
924 Performance criteria for the medium calibration Examine the stored GCMS data with the data system software Figure 3 shows an acceptable total ion chromatogram
9241 GC performance Good column performance will produce symmetrical peaks with minimum tailing for most compounds If peaks are broad or sensitivity poor see Sect 936 for some possible remedial actions
9242 MS sensitivity The GCMSOS peak Identification software should be able to recognize a GC peak in the appropriate retention time window for each of the compounds In calibration solution and make correct tentative Identifications If fewer than 99 of the
^ ^
298
compounds are recognized system maintenance is laquo-lt- required See Sect 936
925 If all performance criteria are met purge an aliquot of each of the other CAL solutions using the same GCMS conditions
926 Calculate a response factor (RF) for each analyte surrogate and isomer pair for each CAL solution using the internal standard fluorobenzene Table 1 contains suggested quantitation ions for all compounds This calculation Is supported in acceptable GCMS data system software (Sect 634) and many other software programs RF is a unitless number but units used to express quantities of analyte and Internal standard must be equivalent
R F (Ax)(Qis) (AisXQx)
where Ax - integrated abundance of the quantitation ion of the analyte
A^s - Integrated abundance of the quantitation ion of the Intemal standard
Qx quantity of analyte purged In ng or concentration units
Q^s laquo quantity of internal standard purged in ng or concentration units
W YQ 9261 For each analyte and surrogate calculate the mean RF -gt-^ from the analyses of the CAL solutions Calculate the ^ lty poundgtS0 standard deviation (SD) and the relative standard
^ 70o deviation (RSD) from each mean RSD - 100 (SDM) If the RSD of any analyte or surrogate mean RF exceeds 20 either analyze additional aliquots of appropriate CAL solutions to obtain an acceptable RSD of RFs over the entire concentration range or take action to improve GCMS performance See Sect 927
o gti(^ ^ ^ 927 As an alternative to calculating mean response factors and eS ^ ^ applying the RSD test use the GCMS data system software or
C^^ other available software to generate a second or third order regression calibration curve
93 Continuing calibration check Verify the MS tune and initial calibrashytion at the beginning of each 8-hr work shift during which analyses are performci using the following procedure
931 Introduce into the GC (either by purging alaboratory reagent blank or making a syringe injection) 25 ng of BFB and acquire a mass spectrum that includes data for mz 35-260 If the spectrum does not meet all criteria (Table 2 ) the MS must be
- 299
932
933
934
p 935^ J
JL- ^O^ Vgtbull V Qgt^^
f v ^ ^C^C
936
retuned and adjusted to meet all criteria before proceeding with the continuing calibration check
Purge a medium concentration CAL solution and analyze with the same conditions used during the initial calibration
Demonstrate acceptable performance for the criteria shown in Sect 924
Determine that the absolute areas of the quantitation ions of the internal standard and surrogates havenot decreased by more than 30 from the areas measured In the most recent continuing calibration check o r by more than 50 from the areas measured during Initial calibration If these areas have decreased by more than these amounts adjustments must be made to restore system sensitivity These adjustments may require cleaning of the HS ion source or other maintenance as Indicated In Sect 936 and recalibration Control charts are useful aids in documenting system sensitivity changes
Calculate the RF for each analyte and surrogate from the data measured In the continuing calibration check The RF for each analyte and surrogate must be within 30 of the mean value measured In the initial calibration Alternatively If a second
or third order regression Is used the point from the continuing calibration check for each analyte and surrogate must fall
within the analysts Judgement on the curve from the initial calibration If these conditions do not exist remedial action must be taken which may require re-Initial calibration gtlaquo
Some possible remedial actions Major maintenance such as cleaning an Ion source cleaning quadrupole rods etc require returning to the initial calibration step
9361 Check and adjust GC andor MS operating conditions check the NS resolution and calibrate the mass scale
9362 Clean or replace the splitless injection liner silanize a new injection liner
9363 Flush the GC column with solvent according to manushyfacturers instructions
9364 Break off a short portion (about 1 meter) of the column from the end near the Injector o replace GC column This action will cause a change In retention times
9365 Prepare fresh CAL solutions and repeat the initial calibration step
9366 Clean the MS ion source and rods (if a quadrupole)
300
9367 Replace any components that allow analytes to come into contact with hot metal surfaces
9368 Replace the MS electron multiplier or any other faulty components
94 Optional calibration for vinyl chloride using a certified gaseous mixture of vinyl chloride in nitrogen can be accomplished by the following steps
941 Fill the purging device with 250 mL (or 5-mL) of reagent water or aqueous calibration standard
942 Start to purge the aqueous mixture Inject a known volume (between 100 and 2000 M L ) of the calibration gas (at room temperature) directly into the purging device with a gas tight syringe Slowly Inject the gaseous sample through a septum seal at the top of the purging device at 2000 Mtm1n If the injection of the standard is made through the aqueous sample inlet port flush the dead volume with several mL of room air or carrier gas Inject the gaseous standard before 5 min of the 11-min purge time have elapsed
943 Determine the aqueous equivalent concentration of vinyl chloride standard In i t q l Injected with the equation
S - 0102 (C)(V)
where S - Aqueous equivalent concentration of vinyl chloride standard in MgL
C - Concentration of gaseous standard in ppm (vv) V - Volume of standard injected In milliliters
10 QUALITY CONTROL
101 Quality control (QC) requirements are the initial demonstration of laboratory capability followed by regular analyses of laboratory reagent blanks field reagent blanks and laboratory fortified blanks The laboratory must maintain records to document the quality of the data generated Additional quality control practices are recommended
102 Initial demonstration of low system background Before any samples are analyzed It must be demonstrated that a laboratory reagent blank (LRB) Is reasonably free of contamination that would prevent the determination of any analyte of concern Sources of background contamination are glassware purge gas sorbants and equipment Background contamination must be reduced to an acceptable level before proceeding with the next section In general background from method analytes should be below the method detection limit
301
103 Initial demonstration of laboratory accuracy and precision Analyze five to seven replicates of a laboratory fortified blank containing each analyte of concem at a concentration In the range of 02-5 M9L (see regulations and maximum contaminant levels for guidance on appropriate concentrations)
1031 Prepare each replicate by adding an appropriate aliquot of a quality control sample to reagent water If a quality control sample containing the method analytes is not available a primary dilution standard made from a source of reagents different than those used to prepare the calibration standards may be used Also add the appropriate amounts of internal standard and surrogates If they are being used Analyze each replicate according to the procedures described In Section 11 and on a schedule that results In the analyses of all replicates over a period of several days
1032 Calculate the measured concentration of each analyte in each replicate the mean concentration of each analyte in all replicates and mean accuracy (as mean percentage of true value) for each analyte and the precision (as relative standard deviation RSD) of the measurements for each analyte Calculate the HDL of each analyte using the procedures described in Sect^ 132 (2)
10^33 For each analyte and surrogate the mean accuracy expressed as a percentage of the true value should be 80-120 and the RSD should be lt20 Some analytes particularly the early eluting gases and late eluting higher molecular weight gt-lt compounds are measured wjth less accampracy and precision than ^ other analytes The method detection limits must be sufficient to detect analytes at the required levels If these criteria are not met for an analyte take remedial action and repeat the measurements for that analyte to demonstrate acceptable performance before samples are analyzed
1034 Develop and maintain a system of control charts to plot the precision and accuracy of analyte and surrogate measurements as a function of time Charting of surrogate recoveries is an especially valuable activity since these are present in eyery sample and the analytical results will form a signishyficant record of data quality
104 Monitor the Integrated areas of the quantitation ions of the Internal standards and surrogates In continuing calibration checks These should remain reasonably constant over time A drift of more than 50 in any area Is indicative of a loss In sensitivity and the problem must be found and corrected These Integrated areas should also be reasonably constant In laboratory fortified blanks and samples
302
bullIf-J
105 Laboratory reagent blanks Uith each batch of samples processed as a group within a work shift analyze a laboratory reagent blank to determine the background system contamination A FRB (Sect 107) may be used in place of a LRB
106 With each batch of samples processed as a group within a work shift analyze a single laboratory fortified blank (LFB) containing each analyte of concern at a concentration as determined in 103 If more than 20 samples are included in a batch analyze one LFB for every 20 samples Use the procedures described in 1033 to evaluate the accuracy of the measurements and to estimate whether the method detection limits can be obtained If acceptable accuracy and method detection limits cannot be achieved the problem must be located and corrected before further samples are analyzed Add these results to the on-going control charts to document data quality
107 With each set of field samples a field reagent blank (FRB) should be analyzed The results of these analyses will help define contaminashytion resulting from field sampling and transportation activities If the FRB shows unacceptable contamination a LRB must be measured to define the source of the impurities
108 At least quarterly replicates of laboratory fortified blanks should be analyzed to determine the precision of the laboratory measureshyments Add these results to the on-going control charts to document data quality
109 At least quarterly analyze a quality control sample (QCS) from an external source If measured analyte concentrations are not of acceptable accuracy check the entire analytical procedure to locate and correct the problem source
1010 Sample matrix effects have not been observed when this method is used with distilled water reagent water drinking water and ground water Therefore analysis of a laboratory fortified sample matrix (LFM) is not required It is recommended that sample matrix effects be evaluated at least quarterly using the QCS described in 109
1011 Numerous other quality control measures are incorporated into other parts of this procedure and serve to alert the analyst to potential problems
11 PROCEDURE
111 SAMPLE INTRODUCTION AND PURGING
1111 This method is designed for a 25-mL sample volume but a smaller (5 mL) sample volume is recommended if the GCMS system has adequate sensitivity to achieve the required method detection limits Adjust the purge gas (nitrogen or helium) flow rate to 40 mLmin Attach the trap inlet to the
303
purging device and open the syringe valve on the purging device t
1112 Remove the plungers from two 25-mL (or 5-mL depending onsample size) syringes and attach aclosed syringe valve toeach Warm the sample to room temperatureopen the sample bottle and carefully pour the sample into one of the syringe barrels to Just short of overflowing Replace the syringe plunger invert the syringe and compress the sample Open the syringe valve and vent any residual air while adjusting the sample volume to 250-mL (or 5-mL) For samples and blanks add 5-ML of the fortification solution containing the Internal standard and the surrogates to the sample through the syringe valve For calibration standards and laboratory fortified blanks add S-ML of the fortification solution containing the Internal standard only Close the valve Fill the second syringe In an Identical manner from the same sample bottle Reserve this second syringe for a reanalysis if necessary
^ ^
1113 Attach the sample syringe valve to the syringe valve on the purging device Be sure that the trap is cooler than 25degC then open the sample syringe valve and inject the sample into the purging chamber Close both valves and initiate purging Purge the sample for 110 min at ambient temperature
112 SAMPLE DESORPTION
1121 Non-cryogenic Interface shy- After the 11-min purge place the purge and trap systen^jn the desorb mode and preheat the trapto IBO C without a flow of desorption gas Then simultanshyeously start the flow of desorption gas at 15-mLm1n for about 4 min begin the temperature program of the gas chromatograph and start data acquisition
^ ^
1122 Cryogenic Interface shy- After the 11-min purge place the purge and trap system In the desorb mode make sure the cryogenic Interface Is a -150lt C or lower and rapidly heat the trap to 180degC while backflushing with an Inert gas at 4 mLmin for about 5 min At the end of the 5 min desorpshytion cycle rapidly heat the cryogenic trap to 250degC and simultaneously begin the temperature program of the gas chromatograph and start data acquisition
1123 Uhlle the trapped components are being Introduced Into the gas chromatograph (or cryogenic Interface) empty the purging device using the sample syringe and wash the chamber with two 25-mL flushes of reagent water After the purging device has been emptied leave syringe valve open to allow the purge gas to vent through the sample Introduction needle
304
^
113
^ 1 1 bull
114
115
116
GAS CHROMATOGRAPHYMASS SPECTROMETRY - Acquire and store data over the mass range 35-260 with a total cycle time (Including scan overhead tine) of 2 sec or less Cycle time must be adjusted to measure five or more spectra during the elution of each GC peak Several alternative temperature programs can be used
1131 Single ramp linear temperature program for wide bore columns 1 and 2 with a Jet separator Adjust the helium carrier gas flow rate to about 15 mLmin The column temperature is reduced lO^C and held for 5 min from the beginning of desorption then programmed to 160degC at 6degCmin and held until all components have eluted
1132 Multi-ramp linear temperature program for wide bore column 2 with the open split Interface Adjust the helium carrier gas flow rate to about 46 mLmin The column temperature is reduced lO C and held for 6 min from the beginning of desorption then heated to 70OC at IQOmin heated to 120OC at 50niin heated to 180deg at 8degmin and held at 180deg until all compounds have eluted
1133 Single ramp linear temperature program for narrow bore column 3 with a cryogenic interface Adjust the helium carrier gas flow rate to about 4 mLmin The column temperature is reduced 10degC and held for 5 min from the beginning of vaporization from the cryogenic trap programmed at 6degCmin for 10 min then IS^Cmin for 5 min to 145ltgtC and held until all components have eluted
TRAP RECONDITIONING -- After desorbing the sample for 4 min recondition the trap by returning the purge and trap system to the purge mode Uait 15 sec then close the syringe valve on the purging device to begin gas flow through the trap Maintain the trap temperature at 180degC After approximately 7 min turn off the trap heater and open the syringe valve to stop the gas flow through the trap Uhen the trap Is cool the next sample can be analyzed
TERMINATION OF DATA ACQUISITION -- When all the sample components have eluted from the GC terminate MS data acquisition Use appropriate data output software to display full range mass spectra and appropriate plots of ion abundance as a function of time If any ion abundance exceeds the system working range dilute the sample aliquot In the second syringe with reagent water and analyze the diluted aliquot
IDENTIFICATION OF ANALYTES -- Identify a sample component by comparison of Its mass spectrum (after background subtraction) to a reference spectrum In the user-created data base The GC retention time of the sample component should be within three standard deviations of the mean retention time of the compound in the calibration mixture
305
1161 In general all Ions that are present above 10 relative abundance In the mass spectrum of the standard should be present in the mass spectrum of the sample component and should agree within absolute 20 For example if an ion has a relative abundance of 30 In the standard spectrum its abundance in the sample spectrum should be in the range of 10 to 50 Some ions particularly the molecular ion are of special importance and should be evaluated even if they are below 10 relative abundance
1162 Identification requires expert Judgement when sample components are not resolved chromatographically and produce mass spectra containing Ions contributed by more than one analyte Uhen GC peaks obviously represent more than one sample component (Ie broadened peak with shoulder(s) or valley between two or more maxima) appropriate analyte spectra and background spectra can be selected by examining plots of characteristic Ions for tentatively identified components Uhen analytes coelute (Ie only one GC peak is apparent) the identification criteria can be met but each analyte spectrum will contain extraneous ions contributed by the coeluting compound Because purgeable^organic compounds are relatively small molecules and producV comparatively simple mass spectra this Is not a significant problem for most method analytes
1163 Structural Isomers that produce very similar mass spectra can be explicitly Identified only if they have sufficiently different GC retention times Acceptable resolution is achieved If the height of the valley between two peaks is less than 25 of the average height of the two peaks Otherwise structural Isomers are Identified as Isomeric pairs Two of the three Isomeric xylenes and two of the three dichlorobenzenes are examples of structural Isomers that may not be resolved on the capillary columns If unresolved these groups of isomers must be reported as isomeric pairs
1164 Methylene chloride and other background components appear in variable quantities In laboratory and field reagent blanks and generally cannot be accurately measured Subtraction of the concentration In the blank from the concentration in the sample Is not acceptable because the concentration of the background In the blank Is highly variable
12 CALCULATIONS
121 Complete chromatographic resolution Is not necessary for accurate and precise measurements of analyte concentrations If unique Ions with adequate Intensities are available for quantitation
306
Ci
--N
1211 Calculate analyte and surrogate concentrations
Ax)(Qis) 1000 Cx
(Ais) RP V where Cx - concentration of analyte or surrogate in MQL in
the water sample Ax - Integrated abundance of the quantitation ion
of the analyte in the sample As bull integrated abundance of the quantitation ion
of the internal standard in the sample Qis - total quantity (in micrograms) of internal
standard added to the water sample V gt original water sample volume In mL RF - mean response factor of analyte from the
initial calibration
1212 Alternatively use the GCMS system software or other available proven software to compute the concentrations of the analytes and surrogates from the second or third order regression curves
1213 Calculations should utilize all available digits of precisshyion but final reported concentrations should be rounded to an appropriate number of significant figures (one digit of uncertainty) Experience indicates that three significant figures may be used for concentrations above 99 M9Lgt two significant figures for concentrations between 1- 99 M9L and one significant figure for lower concentrations
1214 Calculate the total trihalomethane concentration by summing the four individual trihalomethane concentrations In M9t-shy
13 ACCURACY AND PRECISION
131 Single laboratory accuracy and precision data were obtained for the method analytes using laboratory fortified blanks with analytes at concentrations between 1 and 5 MgLgt four sets of results were obtained using the three columns specified (Sect 632) and the open split cryogenic and jet separator interfaces (Sect 633) These data are shown in Tables 4-6
132 Uith these data method detection limits were calculated using the formula (2)
MDL - S t(niialpha - 099)
where
^(n-ll-alpha bull 099) Students t value for the 99 confidence level with n-1 degrees of freedom
307
n - number of replicates
S - the standard deviation of the replicate analyses ^J
14 REFERENCES
1 A Alford-Stevens JU Elchelberger UL Budde Purgeable Organic Compounds in Uater by Gas ChromatographyMass Spectrometry Method 524 Environmental Monitoring and Support Laboratory US Environmental Protection Agency Cincinnati Ohio February 1983
2 Madding C Volatile Organic Compounds in Uater by Purge and Trap Capillary Column GCMS Proceedings of the Uater Quality Technology Conference American Uater Works Association Denver CO December 1984
3 Glaser JA OL Foerst GD McKee SA Quave and UL Budde Trace Analyses for Uastewaters Environ Sci Technol 15 1426 1981
4 Carcinogens-Uorking with Carcinogens Department of Health Education and Uelfare Public Health Service Center for Disease Control National Institute for Occupational Safety and Health Publication No 77-206 August 1977
5 OSHA Safety and Health Standards General Industry (29CFR1910) Occupational Safety and Health Administration OSHA 2206 (Revised January 1976)
6 Safety in Academic Chemistry Laboratories American Chemical Society Publication Committee on Chemical Safety 3rd Edition 1979
7 Arrendale RF RF Severson and OT Chortyk Open Split Interface for Capillary Gas ChromatographyMass Spectrometry Anal Chem 1984 5g 1533
8 Flesch JJ PS Fair The Analysis of Cyanogen Chloride in Drinking Water Proceedings of Uater Quality Technology Conference American Water Works Association St Louis MO November 14-16 1988
308 ^
c
TABLE 1 MOLECULAR UEIGHTS ANO QUANTITATION IONS FOR NETHOO ANALYTES
Comoound
Internal standard
Fluorobenzene
Surrogate
4-Bromof1uorobenzene l2-Dichlorobenzene-d4
Taraet Analvtes
Benzene Bromobenzene Bromochloromethane Bromodichloromethane Bromoform Bromomethane n-Butylbenzene sec-Butyl benzene tert-Butylbenzene Carbon tetrachloride Chlorobenzene Chloroethane Chloroform Chloromethane 2-Chlorotoluene 4-Chlorotoluene Di bromochloromethane l2-Dibromo-3-Chloropropane 12-Dibromoethane Dibromomethane 12-Dichlorobenzene 13-Dichlorobenzene 14-Dichlorobenzene Di chiorodi f1uoromethane 11-Dichloroethane 12-Dichloroethane 11-Dichloroethene cis-12-Dichloroethene trans-12-Dichloroethene 12-Dichloropropane 13-Dichlpropropane 22-Dichloropropane 11-Dichloropropene
MW
96
174 150
78 156 128 162 250 94 134 134 134 152 112 64 118 50 126 126 206 234 186 172 146 146 146 120 98 98 96 96 96 112 112 112 110
Primary Quantitation
Ion
96
95 152
78 156 128 83 173 94 91 105 119 117 112 64 83 50 91 91 129 75 107 93 146 146 146 85 63 62 96 96 96 63 76 77 75
Secondary Quantitation
Ions
77
174176 115150
77 77158 49130 85127 175252
96 134 134 91 119
77114 66 85 52 126 126 127
155157 109188 95174 111148 111148 111148
87 6583
98 6163 6198 6198 112 78 97
11077
309
0 TABLE 1 (continued)
Primary Secondary Quantitation Quantitation
Comoound HW Ion Ions
cis-13-dichloropropene 110 75 110 trans-13-dichloropropene 110 75 110 Ethylbenzene 106 91 106 Hexachlorobutadiene 258 225 260 Isopropylbenzene 120 105 120 4-Isopropyltoluene 134 119 13491 Methylene chloride 84 84 8649 Naphthalene 128 128 n-Propyl benzene 120 91 120 Styrene 104 104 78 1112-Tetrachloroethane 166 131 133119 1122-Tetrachloroethane 166 83 13185 Tetrachloroethene 164 166 168129 Toluene 92 92 91 123-Trichlorobenzene 180 180 182 124-Trichlorobenzene 180 180 182 111-Trichloroethane 132 97 9961 112-Trichloroethane 132 83 9785 Trichloroethene 130 95 130132 Tri chiorof1uoromethane 136 101 103 123-Trichloropropane 146 75 77 124-Trimethylbenzene 120 105 120 135-Trimethylbenzene 120 105 120 Vinyl Chloride 62 62 64
bull
0-Xylene 106 106 91 m-Xylene 106 106 91 p-Xylene 106 106 91
^Monoisotopic molecular weight calculated from the atomic masses of the isotopes with the smallest masses
310
TABLE 2 CHROMATOGRAPHIC RETENTION TINES FOR NETHOD ANALYTES ON THREE COLUMNS UITH FOUR SETS OF CONDITIONS
Retention K^^ (minrsec) Compound
Internal standard
Fluorobenzene
Surrocates
4-Bromofluorobenzenel2-Dichlorobenzene-d4
Target Analvtes
Benzene Bromobenzene Bromochloromethane Bromodichloromethane Bromoform Bromomethane n-Butyl benzene shysec-Butyl benzene tert-Butylbenzene Carbon Tetrachloride Chlorobenzene Chloroethane Chloroform Chloromethane 2-Chlorotoluene 4-Chlorotoluene Cyanogen chloride Di bromochloromethane l2-Dibromo-3-Chloropropane 12-Dibromoethane Dibromomethane 12-Dichlorobenzene 13-Di chiorobenzene 14-Dichlorobenzene Dichlorodifluoromethane 11-Dichloroethane 12-Dichloroethane 11-Dichloroethene cis-12-Dichloroethene trans-12-Dichloroethene 12-Dichloropropane 13-Dichloropropane 22-Dichloropropane 11-Dichloropropene
Column 1deg Column 2deg Column 1 ^
849 627
1838 1543 2216 1908
814 540 1857 1552 644 423
1035 829 1756 1453 201 058
2213 1929 2047 1805 2017 1734 737 516
1546 1301 205 101 624 448 138 044
1920 1625 1930 1643
1423 1151 2432 2105 1444 1150 1039 756 2231 1910 2113 1808 2133 1823
133 042 451 256 824 550 253 134 611 354 359 222
1005 740 1402 1119 601 348 749 517
1406
2338 2725
1330 2400 1222 1548
- 2246 448
2732 260B 2536 1310 2040
1236 324
2432 2446
1912
1924 1526 2726 2622 2636 308
1048 1338 750
1156 954
1512 1842 1152 1306
Column 3^
803
725 1625 538 920
1542 117
1757 1728 1719 725
1420 127 533 058
1644 1649 103
1248 1802 1336 905
1747 1728 1738 053 402 700 220 504 332 856
1229 519 710
311
TABLE 2 (continued)
Retention K^^ (min sec) Compound Column 1^ Column 2deg Column 2^ Column ^^ cis-13-dichloropropenetrans-13-dichloropropeneEthylbenzeneHexachlorobutadiene
1559 2659
1323 2341
1754 1642
2100 3204
1444 1914
Isopropylbenzene4-IsopropyltolueneMethylene ChlorideNaphthalenen-Propyl benzeneStyrene1112-Tetrachloroethane
1804 2112 336
2710 1904
1719 1556
1528 1831 204 2331 1625 1436 1320
2318 2630 916 3212 2420 2224 2052
1625 1738 240 1904 1649 1547 1444
1122-Tetrachloroethane 1843 1621 2404 1547 Tetrachloroethene 1344 1109 1836 1312 Toluene 1226 1000 1724 1131 123-Trichlorobenzene 2747 2411 3258 1914 124-Trichlorobenzene 2633 2305 3130 1850 111-Trichloroethane 716 450 1250 646 112-Trichloroethane 1325 1103 1818 1159 Trichloroethene 935 716 1448 901 Trichlorofluoromethane 216 111 612 146 123-Trichloropropane124-Trimethylbenzene135-TrimethylbenzeneVinyl chlorideo-Xylenem-Xylenep-Xylene
1901 2020 1928
143 1707 1610 1607
1614 1742 1654 047 1431 1341 1341
2408 3130 2450 356 2216 2122 2118
1616 1719 1659 102 1547 1518 1518
^Columns 1-3 are those given In Sect 6321 retention times were measured from the beginning of thermal desorption from the trap (columns 1-2) or from the beginning of thermal release from the cryogenic interface (column 3) degGC conditions given in Sect 1131 ^GC conditions given in Sect 1132 OGC conditions given in Sect 1133
-A
312
TABLE 3 ION ABUNDANCE CRITERIA FOR 4-BRaMOFLUOROBENZENE (BFB)
Mass fMzl
50 75 95 96 173 174 175 176 177
Relative Abundance Criteria
15 to 40 of mass 95 30 to 80 of mass 95 Base Peak 100 Relative Abundance 5 to 9 of mass 95 lt 2 of mass 174 gt 50 of mass 95 5 to 9 of mass 174 gt 95 but lt 101 of mass 174 5 to 9 of mass 176
313
TABLE 4 ACCURACY ANO PRECISION DATA FRON 16-31 OHERMINATIONS OF THE NETHOO ANALYTES IN REAfiENT HATER USING VIDE BORE CAPILUWY COLUNI 1gt
Compound
Benzene Bromobenzene Bromochloromethane Bromodi chioromethane Bromoform Bromomethane n-ButyIbenzene sec-Butyl benzene tert-Butylbenzene Carbon tetrachloride Chlorobenzene Chloroethane Chloroform Chloromethane 2-Chlorotoluene 4-Chlorotoluene 01bromochloromethane l2-Dibromo-3-chloropropane 12-Dibromoethane Dibromomethane 12-Oichlorobenzene 13-Dichlorobenzene 14-Dichlorobenzene Di chiorodi f1uoromethane 11-Dichloroethane 12-Dichloroethane 11-Dichloroethene cis-12 Dichloroethene trans-12-Oichloroethene 12-Dichloropropane 13-Dichloropropane 22-Dichloropropane 11-Dichloropropene cis-l2-Dichloropropene trans-12-Di chioropropene Ethylbenzene Hexachlorobutadiene Isopropylbenzene 4-Isopropyltoluene Methylene chloride Naphthalene n-Propyl benzene Styrene
True Cone Range fUQL)
01-10 01-10 05-10 01-10 05-10 05-10 05-10 05-10 05-10 05-10 01-10 05-10 05-10 05-10 01-10 01-10 01-10 05-10 05-10 05-10 01-10 05-10 02-20 05-10 05-10 01-10 01-10 05-10 01-10 01-10 01-10 05-10 05-10
01-10 05-10 05-10 01-10 01-10 01-100 01-10 01-100
Mean Accuracy
( of True Value)
97 100 90 95 101 95 100 100 102 84 98 89 90 93 90 99 92 83 102 100 93 99 103 90 96 95 94 101 93 97 96 86 98
99 100 101 99 95 104 100 102
Rel Std Dev ()
57 55 64 61 63 82 76 76 73 88 59 90 61 89 62 83 70 199 39 56 62 69 64 77 53 54 67 67 56 61 60 169 89
86 68 76 67 53 82 58 72
Method Det Limit (ual)
004 003 004 008 012 011 011 013 014 021 004 010 003 013 004 006 005 026 006 024 003 012 003 010 004 006 012 012 006 004 004 035 010
006 011 015 012 003 004 004 004
314
TABLE 4 (Continued)
True Mean Rel Method Cone Accuracy Std Oet Range ( of True Dev Limit
Compound fuoLl Valuel IX) (uoLl
1112-Tetrachl oroethane 05-10 90 68 005 1122-Tetrachloroethane 01-10 91 63 004 Tetrachloroethene 05-10 89 68 014 Toluene 05-10 102 80 011 123-Trichlorobenzene 05-10 109 86 003 124-Trichlorobenzene 05-10 108 83 004 111-Trichloroethane 05-10 98 81 008 112-Trichloroethane 05-10 104 73 010 Trichloroethene 05-10 90 73 019 Tri chiorof1uoromethane 05-10 89 81 008 123-Trichloropropane 05-10 108 144 032 124-Trimethyl benzene 05-10 99 81 013 135-Triraethylbenzene 05-10 92 74 005 Vinyl chloride 05-10 98 67 017 o-Xylene 01-31 103 72 011 m-Xylenc 01-10 97 65 005 p-Xylene 05-10 104 77 013
k ^Data obtained by Robert U Slater using column 1 with a Jet separator-interface and a quadrupole mass spectrometer (Sect 1131) with analytes divided among three solutions
315
TABLE 5 ACCURACY ANO PRECISION DATA FRON SEVEN DETERMINATIONS OF THE NETHOO ANALYTES IN REAGENT UATER USING THE CRYOGENIC TRAPPING OPTION AND A NARROW BORE CAPILLARY COLUNN 3
Comoound
Benzene Bromobenzene Bromochloromethane Bromodichloromethane Bromoform Bromomethane n-Butylbenzene sec-Butylbenzene tert-Butylbenzene Carbon tetrachloride Chlorobenzene Chloroethane Chloroform Chloromethane 2-Chlorotoluene 4-Chlorotoluene Cyanogen chloride^ Di bromochloromethane 12-Di bromo-3-chloropropane 12-Dibromoethane Dibromomethane 12-Oichlorobenzene 13-01chiorobenzene 14-Dichlorobenzene Dichlorodi f1uoromethane 11-01chioroethane 12-Dichloroethane 11-Dichloroethene cis-12 Dichloroethene trans-12-Dichloroethene 12-Dichloropropane 13-Dichloropropane 22-Dichloropropane 11-Dichloropropene cis-l3-01chloropropene trans-13-Dlchloropropene Ethylbenzene Hexachlorobutadiene Isopropylbenzene 4-Isopropytoluene Methylene chloride Naphthalene
True Cone fuaL)
01 05 05 OI 01 01 05 05 05 01 01 01 01 01 01 01
01 01 01 01 01 01 01 01 01 01 01 01 01 01 01 01 01
01 01 05 05 05 01
Mean Accuracy ( of True Valuel
99 97 97 100 99 99 94 90 90 92 91 100 95 99 99 96 92 99 92 97 93 97 99 93 99 98 100 95 100 98 96 99 99 98
99 100 98 87 97 98
Rel Std Dev ()
62 74 58 46 54 71 60 71 25 68 58 58 32 47 46 70 106 56 100 56 69 35 60 57 88 62 63 90 37 72 60 58 49 74
52 67 64rr 130 130 72
Method Dect Limit
(UQL)
003 011 007 003 020 006 003 012 033 008 003 002 002 005 005 005 030 007 005 002 003 005 005 004 011 003 002 005 006 003 002 004 005 002
003 004 010 026 009 004
316
TABLE 5 (Continued)
Comoound
n-Propylbenzene Styrene 1112-Tetrach1oroethane 1122-Tetrachloroethane Tetrachloroethene Toluene 123-Trichlorobenzene 124-Trichlorobenzene il1-Trichloroethane 112-Trichloroethane Trichloroethene Trichlorofluoromethane 123-Trichloropropane 124-Tri methyl benzene 135-Trimethylbenzene Vinyl chloride o-Xylene m-Xylene p-Xylene
True Cone
(ual)
01 01 01 05 01 01 01 01 01 01 01 01 01 01 01 01 01 01 01
Mean Accuracy ( of True Valuel
99 96 100 100 96 100 98 91 100 98 96 97 96 96 99 96 94 94 97
Rel Std Dev 1)
66 190 47 120 50 59 89 160 40 49 20 46 65 65 42 02 75 46 61
Method Dect Limit
lUQl)
006 006 004 020 005 008 004 020 004 003 002 007 003 004 002 004 006 003 006
^Data obtained by Caroline A Madding using column 3 with a cryogenic interface and a quadrupole mass spectrometer (Sect 1133)
Reference 8
317
TABLE 6 ACCURACY AND PRECISION DATA FRON SEVEN OCTERMINATIONS OF THE MrrHOO ANALYTES IN REAGENT UATER USING UIDE BORE CAPILLARY COLUNN 2
CQmPound NJLL 0
Mean Accuracy ( of True
Value 2 uoL Concl
RSD )
Mean Accuracy ( of True
Value 02 OTL Cone)
RSD )
Internal Standard
Fluorobenzene 1
Surrogates
4-Bromofluorobenzene l2-Dichlorobenzene-d4
2 3
98 97
18 32
96 95
13 17
Target Analvtes
Benzene Bromobenzene Bromochloromethane Bromod i chioromethane Bromoform Bromomethane n-Butylbenzene sec-Butylbenzene tert-Butylbenzene Carbon tetrachloride Chlorobenzene Chloroethane^ Chloroform Chloromethane 2-Chlorotoluene 4-Chlorotoluene Di bromochloromethane l2-Dibromo-3-chloropropane 12-DibromoethaneC Dibromomethane 12-Dichlorobenzene 13-Dichlorobenzene 14-Dichlorobenzene Di chiorodi f1uoromethane 11-Oichloroethane 12-Dichloroethane 11-Oichloroethene cis-12-Dichloroethene trans-12-Dichloroethene
37 38 4 5 6 7 39 40 41 8 42
9 10 43 44 11
|C
13 45 46 47 14 15 16 17 18 19
97 102 99 96 89 55 89 102 101 84 104
97 110 91 89 95
99 93 100 98 38 97 102 90 100 92
44 30 52 18 24 27 48 35 45 32 31
20 50 24 20 27
21 27 40 41 25 23 38 22 34 21
113 101 102 100 90 52 87 100 100 92 103
95 d 108 108 100
95 94 87 94 d 85 100 87 89 85
18 19 29 18 22 67 23 28 29 26 16
21
31 44 30
22 51 23 28
36 21 3 8 29 23
6
318
TABLE 6 (Continued)
f v
Mean Accuracy Mean Accuracy ( of True ( of True
Value RSD Value RSD CQmpQund NQ 2 uoL Concl ) 02 ugL Concl fl
12-Dichloropropane 20 102 22 103 29 13-Dichloropropane 21 92 37 93 32 22-Dichloropropane^ 11-Dichloropropene^ cis-13-Dichloropropene^ trans-13-Dichloropropene 25 96 17 99 21 Ethylbenzene 48 96 91 100 40 Hexachlorobutadiene 26 91 53 88 24 Isopropylbenzene 49 103 32 101 21 4-Isopropyltoluene 50 95 36 95 31 Methylene chloride 27 e e Naphthalene 51 93 76 78 83 n-Propylbenzene 52 102 49 97 21 Styrene 1112-Tetrachloroethane 1122-Tetrachloroethane Tetrachloroethene
53 28 29 30
95 99 101 97
44 27 46 45
104 95 84 92
31 38 36 33
Toluene 54 105 28 126 17 123-Trichlorobenzene 55 90 57 78 29 124-Trichlorobenzene 111-Trichloroethane 112-Trichloroethane Trichloroethene
56 31 32 33
92 94 107 99
52 39 34 29
83 94 109 106
59 25 28 25
Tri chiorof1uoromethane 34 81 46 48 13 123-Trichloropropane 124-Trimethylbenzene 135-Trimethylbenzene Vinyl chloride o-Xylene m-Xylene p-Xylene
35 57 58 36 59 60 61
97 93 88 104 97 f 98
39 31 24 35 18
23
91 106 97 115 98 f 103
28 22 32 14 17
14
^Data obtained by James U Elchelberger using column 2 with the open split interface and an ion trap mass spectrometer (Sect 1132) with all method analytes In the same reagent water solution
^Designation in Figures 1 and 2 ^Not measured authentic standards were not available ^Not found at 02 MgL |Not measured methylene chloride was In the laboratory reagent blank ^m-xylene coelutes with and cannot be distinguished from its isomer p-xylene No 61
319
OPTIONAL FOAM TRA
X IN 0 0 EXIT
10MM GUASS FRIT MEDIUM JPOROSin
EXIT IN 00
14MU 0 D
WLETXIN 00
SAMPLE INLET
2WAY SYRINGE VALVE bull17CM 20 GAUGE SYRINGE NEEDLE
MM 0 0 RUBBER S9TUH
^10MM 0 D 116 IN 00 ftmdashINLET ]1STAINLpoundSS STEEL
X IN o D
i n MOLECULAR SIEVE PURGE GASRLTEX
PURGE GAS I FLOW CONTROL
FIGURE 1 PURGING DEVICE
320
c
PACXIN6 PROCEDURE CONSTRUCTION
COMPRESSION GLASS g n i 7AioOT RTTING NUT WOOL I w RESISTANCE
WIRE WRAPPED AND FERRULES ACTIVATED I J ^i (DOUBLE LAYER)
THERMOCOUPLE
CHARCOAL77CM^ SOLID
I CONTROLLER SeiSOR
15CM JGRADE 1 5 - Q ^ NIC BATUREl
NTROL 7^FOOT D
[PYROMETER RESISTANCE WIRE WRAPPED TUBING 25CM TBVAX 77 Of l^^ SOLID 0105 IN ID
(SINGLE LAYER) 0125 IN 00 3X0V-1 8CM-H STAINLESS STEa ICM GLASS WOOL
TRAP INLET
FIGURE 2 TRAP PACKINGS ANO CONSTRUCTION TO INCLUDE DESORB CAPABILITY
321
FIGURE 3 NORMALIZED TOTAL ION CURRENT CHROMATOGRAM FROM A VOLATILE COMPOUND CALIBRATION MIXTURE CONTAINING 25 na (5 MgL) OF MOST COMPOUNDS THE COMPOUND IDENTIFICATION NUMBERS ARE GIVEN IN TABLE 6
109
ro ro
TOTshy
JO
m322
7 4 A
280 (42
Y
m 1082
400 1322
30
t l
1A^^^Al^ l l y^ l^
(00 2902
AJ VJ LI ^ laquolaquo Li L^l r i i raquo r f Il raquo r r I raquo raquo raquo
Mj f II II I-j II I I r j II I I II 11 II I II I IIll 1111 II raquol
m m m im 2322 2(42 391)2 3322
u o o
lt ^
FIGURE A AMPLIFIED FIRST EIGHT MINUTES OF A TOTAL ION CURRENT CHROMATOGRAM FROM A VOLATILE COMPOUND CALIBRATION MIXTURE CONTAINING 25 ng (5 wgL) OF EACH COMPONENT THE COMPOUND IDENTIFICATION NUMBERS ARE GIVEN IN TABLE 6
mi
lOT-CO ro
_ i _ - I M I I I I I I I 11111 I bull I I I I I I I
50 m ISO 200 250 142 322 502 (42 822
c
are acceptable interfaces Any Interface can be used If the performance specifications described in this method can be achieved The end of the transfer line after the interface or the end of the analytical column if no interface is used should be placed within a few mm of the MS ion source
6332 The narrow bore column 3 cannot accept the thermal desorption gas flow and a cryogenic interface is required This interface (Tekmar Model 1000 or equivalent) condenses the desorbed sample components at liquid nitrogen temperature and allows the helium gas to pass through to an exit The condensed components are frozen in a narrow band on an uncoated fused silica precolumn When all components have been desorbed from the trap the interface Is rapidly heated under a stream of carrier gas to transfer the analytes to the analytical column The end of the analytical column should be placed with a few mm of the HS ion source A potential problem with this interface is blockage of the interface by frozen water from the trap This condition will result in a major loss in sensitivity and chromatographic resolution
634 The mass spectrometer must be capable of electron ionization at a nominal electron energy of 70 eV The spectrometer must be capable of scanning from 35 to 260 amu with a complete scan cycle time (including scan overhead) of 2 sec or less (Scan cycle time bullgt Total HS data acquisition time in seconds divided by number of scans in the chromatogram) The spectrometer must produce a mass spectrum that meets all criteria In Table 3 when 25 ng or less of 4-bromofluorobenzene (BFB) is introduced into the GC An average spectrum across the BFB GC peak may be used to test instrument performance
635 An Interfaced data system is required to acquire store reduce and output mass spectral data The computer software should have the capability of processing stored GCMS data by recognizshying a GC peak within any given retention time window comparing the mass spectra from the GC peak with spectral data in a user-created data base and generating a list of tentatively identified compounds with their retention times and scan
UKJsnxabers The software must allow Integration of the ion abundance of any specific Ion between specified time or scan number limits The software should also allow calculation of response factors as defined in Sect 926 (or construction of a second or third order regression calibration curve) calculashytion of response factor statistics (mean and standard deviashytion) and calculation of concentrations of analytes using either the calibration curve or the equation in Sect 12
293
64 SYRINGE ANO SYRINGE VALVES
641 Two S-mL or 25-mL glass hypodermic syringes with Luer-Lok tip (depending on sample volume used)
642 Three 2-way syringe valves with Luer ends
643 One ZS- j i l micro syringe with a 2 in x 0006 in ID 22deg bevel needle (Hamilton I702N or equivalent)
644 Micro syringes - 10 100 n l
645 Syringes - 05 10 and 5-mL gas tight with shut-off valve
65 MISCELLANEOUS
651 Standard solution storage containers -- 15-mL bottles with PTFE-11ned screw caps
7 REAGENTS AND CONSUMABLE MATERIALS
71 TRAP PACKING MATERIALS
711 26-Diphenylene oxide polymer 6080 mesh chromatographic grade (Tenax GC or equivalent)
712 Methyl silicone packing (optional) -- OV-1 (3X) on Chromoshysorb W 6080 mesh or equivalent
713 Silica gel -- 3560 mesh Davison grade IS or equivalent 5 714 Coconut charcoal -- Prepare from Barnebey Cheney CA-580-26
lot IM-2649 by crushing through 26 mesh screen
72 REAGENTS
721 MethanoljengtiiOefflonstrated to be free of analytes
722 Reagent water -- Prepare reagent water by passing tap water through a filter bed containing about 05 kg of activated carbon by using a water purification system or by boiling distilled water for IS min followed by a 1-h purge with inert gas while the water temperature is held at 90degC Store in clean narrow-mouth bottles with PTFE-llned septa and screw caps
723 Hydrochloric acid (1+1) -- Carefully add measured volume of cone HCI to equal volume of reagent water
724 Vinyl chloride -- Certified mixtures of vinyl chloride in nitrogen and pure vinyl chloride are available from several
294
-^
y fH- y_
sources (for example Matheson Ideal Gas Products and Scott Gases)
725 Ascorbic acid -- ACS reagent grade granular
73 STOCK STANDARD SOLUTIONS -- These solutions may be purchased as certified solutions or prepared from pure standard materials using the following procedures One of these solutions is required for every analyte of concern every surrogate and the internal standard A useful working concentration is about 1-5 mgmL
731 Place about 98 mL of methanol into a 10-mL ground-glass stoppered volumetric flask Allow the flask to stand unstoppered for about 10 min or until all alcohol-wetted surfaces have dried and weigh to the nearest 01 mg
732 If the analyte Is a liquid at room temperature use a 100-iL syringe and Immediately add two or more drops of reference standard to the flask Be sure that the reference standard falls directly into the alcohol without contacting the neck of the flask If the analyte Is a gas at room temperature fill a 5-mL valved gas-tight syringe with the standard to the 50-mL mark lower the needle to 5 mm above the methanol meniscus and slowly inject the standard Into the neck area of the flask The gas will rapidly dissolve in the methanol
733 Reweigh dilute to volume stopper then mix by inverting the flask several times Calculate the concentration In
n q l i l from the net gain in weight When compound purity is certified at 96X or greater the weight can be used without
correction to calculate the concentration of the stock standard 734 Store stock standard solutions in 15-mL bottles equipped
with PTFE-llned screw caps Methanol solutions prepared from liquid analytes are stable for at least 4 weeks when stored at 4degC Methanol solutions prepared from gaseous analytes are not stable for more than 1 week when stored at lt0degC at room temperature they must be discarded after 1 day
74 PRIMARY DILUTION STANDARDS - Use stock standard solutions to prepare primary dilution standard solutions that contain all the analytes of concern and the surrogates (but not the Internal standard) In methanol The prlm^ifdilution standards should be prepared at concentrations that can be easily diluted to prepare aqueous calibrashytion solutions that will bracket the working concentration range Store the primary dilution standard solutions with minimal headspace and check frequently for signs of deterioration or evaporation especially Just before preparing calibration solutions Storage times described for stock standard solutions in Sect 744 also apply to primary dilution standard solutions
295
75 FORTIFICATION SOLUTIONS FOR INTERNAL STANDARD AND SURROGATES
751 A solution containing the Internal standard and the surrogates is required to prepare laboratory reagent blanks (also used as a laboratory performance check solution) and to fortify each sample Prepare a fortification solution containing fluoroshybenzene (internal standard) 12- dichlorobenzene-d4 (surrogate) and BFB (surrogate) in methanol at concentrations of 5 xgmL of each A 5-ML aliquot of this solution added to a 25-mL water sample volume gives concentrations of 1 f t q l of each A S-^L aliquot of this solution added to a 5-mL water sample volume gives a concentration of 5 M Q A of each) Additional Internal standrds and surrogate analytes are optional
752 A solution of the Internal standard alone Is required to prepare calibration standards and laboratory fortified blanks The internal standard should be In methanol at a concentration of 5 MgmL
76 PREPARATION OF LABORATORY REAGENT BLANK shy- Fill a 25-mL (or 5-mL) syringe with reagent water and adjust to the mark (no air bubbles) Inject 10 n l of the fortification solution containing the internal standard and surrogates through the Luer Lok valve Into the reagent water Transfer the LRB to the purging device See Sect 1112
77 PREPARATION OF LABORATORY FORTIFIED BLANK shy Prepare this exactly like a calibration standard (Sect 78) This Is a calibration standard that is treated as a sample
78 PREPARATION OF CALIBRATION STANDARDS i i l0^^
- X 0
781
3
The number of calibration solutions (CALs) needed depends on the calibration range desired A minimum of three CAL solutions is required to calibrate a range of a factor of 20 In concentrashytion For a factor of 50 use at least four standards and for a factor of 100 at least five standards One calibration
1-So 5
standard should contain each analyte of concern and each surrogate at a concentration of 2-10 times the method detection limit (Tables 4-6) for that compound The other CAL standards should contain each analyte of concern and each surrogate at concentrations that define the range of the method Every CAL solution contains the Intemal standard at the same concentrashytion (5 M9L suggested for a 5-mL sample 1 i i g l for a 25-mL sample)
782 To prepare a calibration standard add an appropriate volume of a primary dilution standard (containing analytes and surrogates) to an aliquot of reagent water In a volumetric flask Use a microsyringe and rapidly inject the methanol solutions into the expanded area of the filled volumetric flask Remove the needle as quickly as possible after injection Mix by Inverting the
296 ^ m ^
^^flask three times only Discard the contents contained in the
neck of the flask Aqueous standards are not stable In a volumetric flask and should be discarded after 1 hr unless transferred to a sample bottle and sealed immediately
8 SAMPLE COLLECTION PRESERVATION AND STORAGE
81 SAMPLE COLLECTION DECHLORINATION AND PRESERVATION
811 Collect all samples In duplicate If samples contain residual chlorine and measurements of the concentrations of disinfection by-products (trihalomethanes etc) at the time of sample collection are desired add about 25 mg of ascorbic acid to the sample bottle before filling Fill sample bottles to overflowshying but take care not to flush out the rapidly dissolving ascorbic acid No air bubbles should pass through the sample as the bottle is filled or be trapped in the sample when the bottle is sealed Adjust the pH of the duplicate samples to lt2 by carefully adding one drop of 11 HCI for each 20 mL of sample volume Seal the sample bottles PFTE-face down and shake vigorously f o r 1 min
812 When sampling from a water tap open the tap and allow the system to flush until the water temperature has stabilized (usually about 10 min) Adjust the flow to about 500 mLmin and collect duplicate samples from the flowing stream
bull - shy
bdquo ^ 813 When sampling from an open body of water fill a 1-quart wide-mouth bottle or l-11ter beaker with sample from a representative area and carefully fill duplicate sample bottles from the 1-quart container
814 The samples must be chilled to 4degC on the day of collection and maintained at that temperature until analysis Field samples that will not be received at the laboratory on the day of collection must be packaged for shipment with sufficient ice to ensure that they will be at 4degC on arrival at the laboratory
82 SAMPLE STORAGE
821 Store samples at 4degC until analysis The sample storage area must be free of organic solvent vapors
822 Analyze all samples within 14 days of collection Samples not analyzed within this period must be discarded and replaced
83 FIELD REAGENT BLANKS
831 Duplicate field reagent blanks must be handled along with each sample set which is composed of the samples collected from the same general sample site at approximately the same time At the laboratory fill field blank sample bottles with reagent
V 297
water seal and ship to the sampling site along with empty sample bottles and back to tht laboratory with filled sample bottles Wherever a set of samples Is shipped and stored it is accompanied by appropriate blanks
832 Use the same procedures used for samples to add ascorbic acid and HCI to blanks (Sect 811)
9 CALIBRATION
91 Demonstration and documentation of acceptable initial calibration is required before any samples are analyzed and Is required intermittently throughout sample analysis as dictated by results of continuing calibration checks After Initial calibration Is successful a continuing calibration check Is required at the beginning of each 8 hr period during which analyses are performed Additional periodic calibration checks are good laboratory practice
92 Initial calibration
921 Calibrate the mass and abundance scales of the MS with calibrashytion compounds and procedures prescribed by the manufacturer with any modifications necessary to meet the requirements in Sect 922
922 Introduce Into the GC (either by purging a laboratory reagent blank o r making a syringe Injection) 25 ng of BFB and acquire mass spectra for ivz 35-260 at 70 eV (nominal) Use the purging procedure andor GC conditions given In Sect Hi If thespectrum does not meet all criteria In Table 2raquo the MS must be retuned and adjusted to meet all criteria before proceeding with calibration An average spectrum across the GC peak may be used to evaluate the performance of the system
923 Purge a medium CAL solution for example 10-20 |tgL using the procedure given In Sect 11
924 Performance criteria for the medium calibration Examine the stored GCMS data with the data system software Figure 3 shows an acceptable total ion chromatogram
9241 GC performance Good column performance will produce symmetrical peaks with minimum tailing for most compounds If peaks are broad or sensitivity poor see Sect 936 for some possible remedial actions
9242 MS sensitivity The GCMSOS peak Identification software should be able to recognize a GC peak in the appropriate retention time window for each of the compounds In calibration solution and make correct tentative Identifications If fewer than 99 of the
^ ^
298
compounds are recognized system maintenance is laquo-lt- required See Sect 936
925 If all performance criteria are met purge an aliquot of each of the other CAL solutions using the same GCMS conditions
926 Calculate a response factor (RF) for each analyte surrogate and isomer pair for each CAL solution using the internal standard fluorobenzene Table 1 contains suggested quantitation ions for all compounds This calculation Is supported in acceptable GCMS data system software (Sect 634) and many other software programs RF is a unitless number but units used to express quantities of analyte and Internal standard must be equivalent
R F (Ax)(Qis) (AisXQx)
where Ax - integrated abundance of the quantitation ion of the analyte
A^s - Integrated abundance of the quantitation ion of the Intemal standard
Qx quantity of analyte purged In ng or concentration units
Q^s laquo quantity of internal standard purged in ng or concentration units
W YQ 9261 For each analyte and surrogate calculate the mean RF -gt-^ from the analyses of the CAL solutions Calculate the ^ lty poundgtS0 standard deviation (SD) and the relative standard
^ 70o deviation (RSD) from each mean RSD - 100 (SDM) If the RSD of any analyte or surrogate mean RF exceeds 20 either analyze additional aliquots of appropriate CAL solutions to obtain an acceptable RSD of RFs over the entire concentration range or take action to improve GCMS performance See Sect 927
o gti(^ ^ ^ 927 As an alternative to calculating mean response factors and eS ^ ^ applying the RSD test use the GCMS data system software or
C^^ other available software to generate a second or third order regression calibration curve
93 Continuing calibration check Verify the MS tune and initial calibrashytion at the beginning of each 8-hr work shift during which analyses are performci using the following procedure
931 Introduce into the GC (either by purging alaboratory reagent blank or making a syringe injection) 25 ng of BFB and acquire a mass spectrum that includes data for mz 35-260 If the spectrum does not meet all criteria (Table 2 ) the MS must be
- 299
932
933
934
p 935^ J
JL- ^O^ Vgtbull V Qgt^^
f v ^ ^C^C
936
retuned and adjusted to meet all criteria before proceeding with the continuing calibration check
Purge a medium concentration CAL solution and analyze with the same conditions used during the initial calibration
Demonstrate acceptable performance for the criteria shown in Sect 924
Determine that the absolute areas of the quantitation ions of the internal standard and surrogates havenot decreased by more than 30 from the areas measured In the most recent continuing calibration check o r by more than 50 from the areas measured during Initial calibration If these areas have decreased by more than these amounts adjustments must be made to restore system sensitivity These adjustments may require cleaning of the HS ion source or other maintenance as Indicated In Sect 936 and recalibration Control charts are useful aids in documenting system sensitivity changes
Calculate the RF for each analyte and surrogate from the data measured In the continuing calibration check The RF for each analyte and surrogate must be within 30 of the mean value measured In the initial calibration Alternatively If a second
or third order regression Is used the point from the continuing calibration check for each analyte and surrogate must fall
within the analysts Judgement on the curve from the initial calibration If these conditions do not exist remedial action must be taken which may require re-Initial calibration gtlaquo
Some possible remedial actions Major maintenance such as cleaning an Ion source cleaning quadrupole rods etc require returning to the initial calibration step
9361 Check and adjust GC andor MS operating conditions check the NS resolution and calibrate the mass scale
9362 Clean or replace the splitless injection liner silanize a new injection liner
9363 Flush the GC column with solvent according to manushyfacturers instructions
9364 Break off a short portion (about 1 meter) of the column from the end near the Injector o replace GC column This action will cause a change In retention times
9365 Prepare fresh CAL solutions and repeat the initial calibration step
9366 Clean the MS ion source and rods (if a quadrupole)
300
9367 Replace any components that allow analytes to come into contact with hot metal surfaces
9368 Replace the MS electron multiplier or any other faulty components
94 Optional calibration for vinyl chloride using a certified gaseous mixture of vinyl chloride in nitrogen can be accomplished by the following steps
941 Fill the purging device with 250 mL (or 5-mL) of reagent water or aqueous calibration standard
942 Start to purge the aqueous mixture Inject a known volume (between 100 and 2000 M L ) of the calibration gas (at room temperature) directly into the purging device with a gas tight syringe Slowly Inject the gaseous sample through a septum seal at the top of the purging device at 2000 Mtm1n If the injection of the standard is made through the aqueous sample inlet port flush the dead volume with several mL of room air or carrier gas Inject the gaseous standard before 5 min of the 11-min purge time have elapsed
943 Determine the aqueous equivalent concentration of vinyl chloride standard In i t q l Injected with the equation
S - 0102 (C)(V)
where S - Aqueous equivalent concentration of vinyl chloride standard in MgL
C - Concentration of gaseous standard in ppm (vv) V - Volume of standard injected In milliliters
10 QUALITY CONTROL
101 Quality control (QC) requirements are the initial demonstration of laboratory capability followed by regular analyses of laboratory reagent blanks field reagent blanks and laboratory fortified blanks The laboratory must maintain records to document the quality of the data generated Additional quality control practices are recommended
102 Initial demonstration of low system background Before any samples are analyzed It must be demonstrated that a laboratory reagent blank (LRB) Is reasonably free of contamination that would prevent the determination of any analyte of concern Sources of background contamination are glassware purge gas sorbants and equipment Background contamination must be reduced to an acceptable level before proceeding with the next section In general background from method analytes should be below the method detection limit
301
103 Initial demonstration of laboratory accuracy and precision Analyze five to seven replicates of a laboratory fortified blank containing each analyte of concem at a concentration In the range of 02-5 M9L (see regulations and maximum contaminant levels for guidance on appropriate concentrations)
1031 Prepare each replicate by adding an appropriate aliquot of a quality control sample to reagent water If a quality control sample containing the method analytes is not available a primary dilution standard made from a source of reagents different than those used to prepare the calibration standards may be used Also add the appropriate amounts of internal standard and surrogates If they are being used Analyze each replicate according to the procedures described In Section 11 and on a schedule that results In the analyses of all replicates over a period of several days
1032 Calculate the measured concentration of each analyte in each replicate the mean concentration of each analyte in all replicates and mean accuracy (as mean percentage of true value) for each analyte and the precision (as relative standard deviation RSD) of the measurements for each analyte Calculate the HDL of each analyte using the procedures described in Sect^ 132 (2)
10^33 For each analyte and surrogate the mean accuracy expressed as a percentage of the true value should be 80-120 and the RSD should be lt20 Some analytes particularly the early eluting gases and late eluting higher molecular weight gt-lt compounds are measured wjth less accampracy and precision than ^ other analytes The method detection limits must be sufficient to detect analytes at the required levels If these criteria are not met for an analyte take remedial action and repeat the measurements for that analyte to demonstrate acceptable performance before samples are analyzed
1034 Develop and maintain a system of control charts to plot the precision and accuracy of analyte and surrogate measurements as a function of time Charting of surrogate recoveries is an especially valuable activity since these are present in eyery sample and the analytical results will form a signishyficant record of data quality
104 Monitor the Integrated areas of the quantitation ions of the Internal standards and surrogates In continuing calibration checks These should remain reasonably constant over time A drift of more than 50 in any area Is indicative of a loss In sensitivity and the problem must be found and corrected These Integrated areas should also be reasonably constant In laboratory fortified blanks and samples
302
bullIf-J
105 Laboratory reagent blanks Uith each batch of samples processed as a group within a work shift analyze a laboratory reagent blank to determine the background system contamination A FRB (Sect 107) may be used in place of a LRB
106 With each batch of samples processed as a group within a work shift analyze a single laboratory fortified blank (LFB) containing each analyte of concern at a concentration as determined in 103 If more than 20 samples are included in a batch analyze one LFB for every 20 samples Use the procedures described in 1033 to evaluate the accuracy of the measurements and to estimate whether the method detection limits can be obtained If acceptable accuracy and method detection limits cannot be achieved the problem must be located and corrected before further samples are analyzed Add these results to the on-going control charts to document data quality
107 With each set of field samples a field reagent blank (FRB) should be analyzed The results of these analyses will help define contaminashytion resulting from field sampling and transportation activities If the FRB shows unacceptable contamination a LRB must be measured to define the source of the impurities
108 At least quarterly replicates of laboratory fortified blanks should be analyzed to determine the precision of the laboratory measureshyments Add these results to the on-going control charts to document data quality
109 At least quarterly analyze a quality control sample (QCS) from an external source If measured analyte concentrations are not of acceptable accuracy check the entire analytical procedure to locate and correct the problem source
1010 Sample matrix effects have not been observed when this method is used with distilled water reagent water drinking water and ground water Therefore analysis of a laboratory fortified sample matrix (LFM) is not required It is recommended that sample matrix effects be evaluated at least quarterly using the QCS described in 109
1011 Numerous other quality control measures are incorporated into other parts of this procedure and serve to alert the analyst to potential problems
11 PROCEDURE
111 SAMPLE INTRODUCTION AND PURGING
1111 This method is designed for a 25-mL sample volume but a smaller (5 mL) sample volume is recommended if the GCMS system has adequate sensitivity to achieve the required method detection limits Adjust the purge gas (nitrogen or helium) flow rate to 40 mLmin Attach the trap inlet to the
303
purging device and open the syringe valve on the purging device t
1112 Remove the plungers from two 25-mL (or 5-mL depending onsample size) syringes and attach aclosed syringe valve toeach Warm the sample to room temperatureopen the sample bottle and carefully pour the sample into one of the syringe barrels to Just short of overflowing Replace the syringe plunger invert the syringe and compress the sample Open the syringe valve and vent any residual air while adjusting the sample volume to 250-mL (or 5-mL) For samples and blanks add 5-ML of the fortification solution containing the Internal standard and the surrogates to the sample through the syringe valve For calibration standards and laboratory fortified blanks add S-ML of the fortification solution containing the Internal standard only Close the valve Fill the second syringe In an Identical manner from the same sample bottle Reserve this second syringe for a reanalysis if necessary
^ ^
1113 Attach the sample syringe valve to the syringe valve on the purging device Be sure that the trap is cooler than 25degC then open the sample syringe valve and inject the sample into the purging chamber Close both valves and initiate purging Purge the sample for 110 min at ambient temperature
112 SAMPLE DESORPTION
1121 Non-cryogenic Interface shy- After the 11-min purge place the purge and trap systen^jn the desorb mode and preheat the trapto IBO C without a flow of desorption gas Then simultanshyeously start the flow of desorption gas at 15-mLm1n for about 4 min begin the temperature program of the gas chromatograph and start data acquisition
^ ^
1122 Cryogenic Interface shy- After the 11-min purge place the purge and trap system In the desorb mode make sure the cryogenic Interface Is a -150lt C or lower and rapidly heat the trap to 180degC while backflushing with an Inert gas at 4 mLmin for about 5 min At the end of the 5 min desorpshytion cycle rapidly heat the cryogenic trap to 250degC and simultaneously begin the temperature program of the gas chromatograph and start data acquisition
1123 Uhlle the trapped components are being Introduced Into the gas chromatograph (or cryogenic Interface) empty the purging device using the sample syringe and wash the chamber with two 25-mL flushes of reagent water After the purging device has been emptied leave syringe valve open to allow the purge gas to vent through the sample Introduction needle
304
^
113
^ 1 1 bull
114
115
116
GAS CHROMATOGRAPHYMASS SPECTROMETRY - Acquire and store data over the mass range 35-260 with a total cycle time (Including scan overhead tine) of 2 sec or less Cycle time must be adjusted to measure five or more spectra during the elution of each GC peak Several alternative temperature programs can be used
1131 Single ramp linear temperature program for wide bore columns 1 and 2 with a Jet separator Adjust the helium carrier gas flow rate to about 15 mLmin The column temperature is reduced lO^C and held for 5 min from the beginning of desorption then programmed to 160degC at 6degCmin and held until all components have eluted
1132 Multi-ramp linear temperature program for wide bore column 2 with the open split Interface Adjust the helium carrier gas flow rate to about 46 mLmin The column temperature is reduced lO C and held for 6 min from the beginning of desorption then heated to 70OC at IQOmin heated to 120OC at 50niin heated to 180deg at 8degmin and held at 180deg until all compounds have eluted
1133 Single ramp linear temperature program for narrow bore column 3 with a cryogenic interface Adjust the helium carrier gas flow rate to about 4 mLmin The column temperature is reduced 10degC and held for 5 min from the beginning of vaporization from the cryogenic trap programmed at 6degCmin for 10 min then IS^Cmin for 5 min to 145ltgtC and held until all components have eluted
TRAP RECONDITIONING -- After desorbing the sample for 4 min recondition the trap by returning the purge and trap system to the purge mode Uait 15 sec then close the syringe valve on the purging device to begin gas flow through the trap Maintain the trap temperature at 180degC After approximately 7 min turn off the trap heater and open the syringe valve to stop the gas flow through the trap Uhen the trap Is cool the next sample can be analyzed
TERMINATION OF DATA ACQUISITION -- When all the sample components have eluted from the GC terminate MS data acquisition Use appropriate data output software to display full range mass spectra and appropriate plots of ion abundance as a function of time If any ion abundance exceeds the system working range dilute the sample aliquot In the second syringe with reagent water and analyze the diluted aliquot
IDENTIFICATION OF ANALYTES -- Identify a sample component by comparison of Its mass spectrum (after background subtraction) to a reference spectrum In the user-created data base The GC retention time of the sample component should be within three standard deviations of the mean retention time of the compound in the calibration mixture
305
1161 In general all Ions that are present above 10 relative abundance In the mass spectrum of the standard should be present in the mass spectrum of the sample component and should agree within absolute 20 For example if an ion has a relative abundance of 30 In the standard spectrum its abundance in the sample spectrum should be in the range of 10 to 50 Some ions particularly the molecular ion are of special importance and should be evaluated even if they are below 10 relative abundance
1162 Identification requires expert Judgement when sample components are not resolved chromatographically and produce mass spectra containing Ions contributed by more than one analyte Uhen GC peaks obviously represent more than one sample component (Ie broadened peak with shoulder(s) or valley between two or more maxima) appropriate analyte spectra and background spectra can be selected by examining plots of characteristic Ions for tentatively identified components Uhen analytes coelute (Ie only one GC peak is apparent) the identification criteria can be met but each analyte spectrum will contain extraneous ions contributed by the coeluting compound Because purgeable^organic compounds are relatively small molecules and producV comparatively simple mass spectra this Is not a significant problem for most method analytes
1163 Structural Isomers that produce very similar mass spectra can be explicitly Identified only if they have sufficiently different GC retention times Acceptable resolution is achieved If the height of the valley between two peaks is less than 25 of the average height of the two peaks Otherwise structural Isomers are Identified as Isomeric pairs Two of the three Isomeric xylenes and two of the three dichlorobenzenes are examples of structural Isomers that may not be resolved on the capillary columns If unresolved these groups of isomers must be reported as isomeric pairs
1164 Methylene chloride and other background components appear in variable quantities In laboratory and field reagent blanks and generally cannot be accurately measured Subtraction of the concentration In the blank from the concentration in the sample Is not acceptable because the concentration of the background In the blank Is highly variable
12 CALCULATIONS
121 Complete chromatographic resolution Is not necessary for accurate and precise measurements of analyte concentrations If unique Ions with adequate Intensities are available for quantitation
306
Ci
--N
1211 Calculate analyte and surrogate concentrations
Ax)(Qis) 1000 Cx
(Ais) RP V where Cx - concentration of analyte or surrogate in MQL in
the water sample Ax - Integrated abundance of the quantitation ion
of the analyte in the sample As bull integrated abundance of the quantitation ion
of the internal standard in the sample Qis - total quantity (in micrograms) of internal
standard added to the water sample V gt original water sample volume In mL RF - mean response factor of analyte from the
initial calibration
1212 Alternatively use the GCMS system software or other available proven software to compute the concentrations of the analytes and surrogates from the second or third order regression curves
1213 Calculations should utilize all available digits of precisshyion but final reported concentrations should be rounded to an appropriate number of significant figures (one digit of uncertainty) Experience indicates that three significant figures may be used for concentrations above 99 M9Lgt two significant figures for concentrations between 1- 99 M9L and one significant figure for lower concentrations
1214 Calculate the total trihalomethane concentration by summing the four individual trihalomethane concentrations In M9t-shy
13 ACCURACY AND PRECISION
131 Single laboratory accuracy and precision data were obtained for the method analytes using laboratory fortified blanks with analytes at concentrations between 1 and 5 MgLgt four sets of results were obtained using the three columns specified (Sect 632) and the open split cryogenic and jet separator interfaces (Sect 633) These data are shown in Tables 4-6
132 Uith these data method detection limits were calculated using the formula (2)
MDL - S t(niialpha - 099)
where
^(n-ll-alpha bull 099) Students t value for the 99 confidence level with n-1 degrees of freedom
307
n - number of replicates
S - the standard deviation of the replicate analyses ^J
14 REFERENCES
1 A Alford-Stevens JU Elchelberger UL Budde Purgeable Organic Compounds in Uater by Gas ChromatographyMass Spectrometry Method 524 Environmental Monitoring and Support Laboratory US Environmental Protection Agency Cincinnati Ohio February 1983
2 Madding C Volatile Organic Compounds in Uater by Purge and Trap Capillary Column GCMS Proceedings of the Uater Quality Technology Conference American Uater Works Association Denver CO December 1984
3 Glaser JA OL Foerst GD McKee SA Quave and UL Budde Trace Analyses for Uastewaters Environ Sci Technol 15 1426 1981
4 Carcinogens-Uorking with Carcinogens Department of Health Education and Uelfare Public Health Service Center for Disease Control National Institute for Occupational Safety and Health Publication No 77-206 August 1977
5 OSHA Safety and Health Standards General Industry (29CFR1910) Occupational Safety and Health Administration OSHA 2206 (Revised January 1976)
6 Safety in Academic Chemistry Laboratories American Chemical Society Publication Committee on Chemical Safety 3rd Edition 1979
7 Arrendale RF RF Severson and OT Chortyk Open Split Interface for Capillary Gas ChromatographyMass Spectrometry Anal Chem 1984 5g 1533
8 Flesch JJ PS Fair The Analysis of Cyanogen Chloride in Drinking Water Proceedings of Uater Quality Technology Conference American Water Works Association St Louis MO November 14-16 1988
308 ^
c
TABLE 1 MOLECULAR UEIGHTS ANO QUANTITATION IONS FOR NETHOO ANALYTES
Comoound
Internal standard
Fluorobenzene
Surrogate
4-Bromof1uorobenzene l2-Dichlorobenzene-d4
Taraet Analvtes
Benzene Bromobenzene Bromochloromethane Bromodichloromethane Bromoform Bromomethane n-Butylbenzene sec-Butyl benzene tert-Butylbenzene Carbon tetrachloride Chlorobenzene Chloroethane Chloroform Chloromethane 2-Chlorotoluene 4-Chlorotoluene Di bromochloromethane l2-Dibromo-3-Chloropropane 12-Dibromoethane Dibromomethane 12-Dichlorobenzene 13-Dichlorobenzene 14-Dichlorobenzene Di chiorodi f1uoromethane 11-Dichloroethane 12-Dichloroethane 11-Dichloroethene cis-12-Dichloroethene trans-12-Dichloroethene 12-Dichloropropane 13-Dichlpropropane 22-Dichloropropane 11-Dichloropropene
MW
96
174 150
78 156 128 162 250 94 134 134 134 152 112 64 118 50 126 126 206 234 186 172 146 146 146 120 98 98 96 96 96 112 112 112 110
Primary Quantitation
Ion
96
95 152
78 156 128 83 173 94 91 105 119 117 112 64 83 50 91 91 129 75 107 93 146 146 146 85 63 62 96 96 96 63 76 77 75
Secondary Quantitation
Ions
77
174176 115150
77 77158 49130 85127 175252
96 134 134 91 119
77114 66 85 52 126 126 127
155157 109188 95174 111148 111148 111148
87 6583
98 6163 6198 6198 112 78 97
11077
309
0 TABLE 1 (continued)
Primary Secondary Quantitation Quantitation
Comoound HW Ion Ions
cis-13-dichloropropene 110 75 110 trans-13-dichloropropene 110 75 110 Ethylbenzene 106 91 106 Hexachlorobutadiene 258 225 260 Isopropylbenzene 120 105 120 4-Isopropyltoluene 134 119 13491 Methylene chloride 84 84 8649 Naphthalene 128 128 n-Propyl benzene 120 91 120 Styrene 104 104 78 1112-Tetrachloroethane 166 131 133119 1122-Tetrachloroethane 166 83 13185 Tetrachloroethene 164 166 168129 Toluene 92 92 91 123-Trichlorobenzene 180 180 182 124-Trichlorobenzene 180 180 182 111-Trichloroethane 132 97 9961 112-Trichloroethane 132 83 9785 Trichloroethene 130 95 130132 Tri chiorof1uoromethane 136 101 103 123-Trichloropropane 146 75 77 124-Trimethylbenzene 120 105 120 135-Trimethylbenzene 120 105 120 Vinyl Chloride 62 62 64
bull
0-Xylene 106 106 91 m-Xylene 106 106 91 p-Xylene 106 106 91
^Monoisotopic molecular weight calculated from the atomic masses of the isotopes with the smallest masses
310
TABLE 2 CHROMATOGRAPHIC RETENTION TINES FOR NETHOD ANALYTES ON THREE COLUMNS UITH FOUR SETS OF CONDITIONS
Retention K^^ (minrsec) Compound
Internal standard
Fluorobenzene
Surrocates
4-Bromofluorobenzenel2-Dichlorobenzene-d4
Target Analvtes
Benzene Bromobenzene Bromochloromethane Bromodichloromethane Bromoform Bromomethane n-Butyl benzene shysec-Butyl benzene tert-Butylbenzene Carbon Tetrachloride Chlorobenzene Chloroethane Chloroform Chloromethane 2-Chlorotoluene 4-Chlorotoluene Cyanogen chloride Di bromochloromethane l2-Dibromo-3-Chloropropane 12-Dibromoethane Dibromomethane 12-Dichlorobenzene 13-Di chiorobenzene 14-Dichlorobenzene Dichlorodifluoromethane 11-Dichloroethane 12-Dichloroethane 11-Dichloroethene cis-12-Dichloroethene trans-12-Dichloroethene 12-Dichloropropane 13-Dichloropropane 22-Dichloropropane 11-Dichloropropene
Column 1deg Column 2deg Column 1 ^
849 627
1838 1543 2216 1908
814 540 1857 1552 644 423
1035 829 1756 1453 201 058
2213 1929 2047 1805 2017 1734 737 516
1546 1301 205 101 624 448 138 044
1920 1625 1930 1643
1423 1151 2432 2105 1444 1150 1039 756 2231 1910 2113 1808 2133 1823
133 042 451 256 824 550 253 134 611 354 359 222
1005 740 1402 1119 601 348 749 517
1406
2338 2725
1330 2400 1222 1548
- 2246 448
2732 260B 2536 1310 2040
1236 324
2432 2446
1912
1924 1526 2726 2622 2636 308
1048 1338 750
1156 954
1512 1842 1152 1306
Column 3^
803
725 1625 538 920
1542 117
1757 1728 1719 725
1420 127 533 058
1644 1649 103
1248 1802 1336 905
1747 1728 1738 053 402 700 220 504 332 856
1229 519 710
311
TABLE 2 (continued)
Retention K^^ (min sec) Compound Column 1^ Column 2deg Column 2^ Column ^^ cis-13-dichloropropenetrans-13-dichloropropeneEthylbenzeneHexachlorobutadiene
1559 2659
1323 2341
1754 1642
2100 3204
1444 1914
Isopropylbenzene4-IsopropyltolueneMethylene ChlorideNaphthalenen-Propyl benzeneStyrene1112-Tetrachloroethane
1804 2112 336
2710 1904
1719 1556
1528 1831 204 2331 1625 1436 1320
2318 2630 916 3212 2420 2224 2052
1625 1738 240 1904 1649 1547 1444
1122-Tetrachloroethane 1843 1621 2404 1547 Tetrachloroethene 1344 1109 1836 1312 Toluene 1226 1000 1724 1131 123-Trichlorobenzene 2747 2411 3258 1914 124-Trichlorobenzene 2633 2305 3130 1850 111-Trichloroethane 716 450 1250 646 112-Trichloroethane 1325 1103 1818 1159 Trichloroethene 935 716 1448 901 Trichlorofluoromethane 216 111 612 146 123-Trichloropropane124-Trimethylbenzene135-TrimethylbenzeneVinyl chlorideo-Xylenem-Xylenep-Xylene
1901 2020 1928
143 1707 1610 1607
1614 1742 1654 047 1431 1341 1341
2408 3130 2450 356 2216 2122 2118
1616 1719 1659 102 1547 1518 1518
^Columns 1-3 are those given In Sect 6321 retention times were measured from the beginning of thermal desorption from the trap (columns 1-2) or from the beginning of thermal release from the cryogenic interface (column 3) degGC conditions given in Sect 1131 ^GC conditions given in Sect 1132 OGC conditions given in Sect 1133
-A
312
TABLE 3 ION ABUNDANCE CRITERIA FOR 4-BRaMOFLUOROBENZENE (BFB)
Mass fMzl
50 75 95 96 173 174 175 176 177
Relative Abundance Criteria
15 to 40 of mass 95 30 to 80 of mass 95 Base Peak 100 Relative Abundance 5 to 9 of mass 95 lt 2 of mass 174 gt 50 of mass 95 5 to 9 of mass 174 gt 95 but lt 101 of mass 174 5 to 9 of mass 176
313
TABLE 4 ACCURACY ANO PRECISION DATA FRON 16-31 OHERMINATIONS OF THE NETHOO ANALYTES IN REAfiENT HATER USING VIDE BORE CAPILUWY COLUNI 1gt
Compound
Benzene Bromobenzene Bromochloromethane Bromodi chioromethane Bromoform Bromomethane n-ButyIbenzene sec-Butyl benzene tert-Butylbenzene Carbon tetrachloride Chlorobenzene Chloroethane Chloroform Chloromethane 2-Chlorotoluene 4-Chlorotoluene 01bromochloromethane l2-Dibromo-3-chloropropane 12-Dibromoethane Dibromomethane 12-Oichlorobenzene 13-Dichlorobenzene 14-Dichlorobenzene Di chiorodi f1uoromethane 11-Dichloroethane 12-Dichloroethane 11-Dichloroethene cis-12 Dichloroethene trans-12-Oichloroethene 12-Dichloropropane 13-Dichloropropane 22-Dichloropropane 11-Dichloropropene cis-l2-Dichloropropene trans-12-Di chioropropene Ethylbenzene Hexachlorobutadiene Isopropylbenzene 4-Isopropyltoluene Methylene chloride Naphthalene n-Propyl benzene Styrene
True Cone Range fUQL)
01-10 01-10 05-10 01-10 05-10 05-10 05-10 05-10 05-10 05-10 01-10 05-10 05-10 05-10 01-10 01-10 01-10 05-10 05-10 05-10 01-10 05-10 02-20 05-10 05-10 01-10 01-10 05-10 01-10 01-10 01-10 05-10 05-10
01-10 05-10 05-10 01-10 01-10 01-100 01-10 01-100
Mean Accuracy
( of True Value)
97 100 90 95 101 95 100 100 102 84 98 89 90 93 90 99 92 83 102 100 93 99 103 90 96 95 94 101 93 97 96 86 98
99 100 101 99 95 104 100 102
Rel Std Dev ()
57 55 64 61 63 82 76 76 73 88 59 90 61 89 62 83 70 199 39 56 62 69 64 77 53 54 67 67 56 61 60 169 89
86 68 76 67 53 82 58 72
Method Det Limit (ual)
004 003 004 008 012 011 011 013 014 021 004 010 003 013 004 006 005 026 006 024 003 012 003 010 004 006 012 012 006 004 004 035 010
006 011 015 012 003 004 004 004
314
TABLE 4 (Continued)
True Mean Rel Method Cone Accuracy Std Oet Range ( of True Dev Limit
Compound fuoLl Valuel IX) (uoLl
1112-Tetrachl oroethane 05-10 90 68 005 1122-Tetrachloroethane 01-10 91 63 004 Tetrachloroethene 05-10 89 68 014 Toluene 05-10 102 80 011 123-Trichlorobenzene 05-10 109 86 003 124-Trichlorobenzene 05-10 108 83 004 111-Trichloroethane 05-10 98 81 008 112-Trichloroethane 05-10 104 73 010 Trichloroethene 05-10 90 73 019 Tri chiorof1uoromethane 05-10 89 81 008 123-Trichloropropane 05-10 108 144 032 124-Trimethyl benzene 05-10 99 81 013 135-Triraethylbenzene 05-10 92 74 005 Vinyl chloride 05-10 98 67 017 o-Xylene 01-31 103 72 011 m-Xylenc 01-10 97 65 005 p-Xylene 05-10 104 77 013
k ^Data obtained by Robert U Slater using column 1 with a Jet separator-interface and a quadrupole mass spectrometer (Sect 1131) with analytes divided among three solutions
315
TABLE 5 ACCURACY ANO PRECISION DATA FRON SEVEN DETERMINATIONS OF THE NETHOO ANALYTES IN REAGENT UATER USING THE CRYOGENIC TRAPPING OPTION AND A NARROW BORE CAPILLARY COLUNN 3
Comoound
Benzene Bromobenzene Bromochloromethane Bromodichloromethane Bromoform Bromomethane n-Butylbenzene sec-Butylbenzene tert-Butylbenzene Carbon tetrachloride Chlorobenzene Chloroethane Chloroform Chloromethane 2-Chlorotoluene 4-Chlorotoluene Cyanogen chloride^ Di bromochloromethane 12-Di bromo-3-chloropropane 12-Dibromoethane Dibromomethane 12-Oichlorobenzene 13-01chiorobenzene 14-Dichlorobenzene Dichlorodi f1uoromethane 11-01chioroethane 12-Dichloroethane 11-Dichloroethene cis-12 Dichloroethene trans-12-Dichloroethene 12-Dichloropropane 13-Dichloropropane 22-Dichloropropane 11-Dichloropropene cis-l3-01chloropropene trans-13-Dlchloropropene Ethylbenzene Hexachlorobutadiene Isopropylbenzene 4-Isopropytoluene Methylene chloride Naphthalene
True Cone fuaL)
01 05 05 OI 01 01 05 05 05 01 01 01 01 01 01 01
01 01 01 01 01 01 01 01 01 01 01 01 01 01 01 01 01
01 01 05 05 05 01
Mean Accuracy ( of True Valuel
99 97 97 100 99 99 94 90 90 92 91 100 95 99 99 96 92 99 92 97 93 97 99 93 99 98 100 95 100 98 96 99 99 98
99 100 98 87 97 98
Rel Std Dev ()
62 74 58 46 54 71 60 71 25 68 58 58 32 47 46 70 106 56 100 56 69 35 60 57 88 62 63 90 37 72 60 58 49 74
52 67 64rr 130 130 72
Method Dect Limit
(UQL)
003 011 007 003 020 006 003 012 033 008 003 002 002 005 005 005 030 007 005 002 003 005 005 004 011 003 002 005 006 003 002 004 005 002
003 004 010 026 009 004
316
TABLE 5 (Continued)
Comoound
n-Propylbenzene Styrene 1112-Tetrach1oroethane 1122-Tetrachloroethane Tetrachloroethene Toluene 123-Trichlorobenzene 124-Trichlorobenzene il1-Trichloroethane 112-Trichloroethane Trichloroethene Trichlorofluoromethane 123-Trichloropropane 124-Tri methyl benzene 135-Trimethylbenzene Vinyl chloride o-Xylene m-Xylene p-Xylene
True Cone
(ual)
01 01 01 05 01 01 01 01 01 01 01 01 01 01 01 01 01 01 01
Mean Accuracy ( of True Valuel
99 96 100 100 96 100 98 91 100 98 96 97 96 96 99 96 94 94 97
Rel Std Dev 1)
66 190 47 120 50 59 89 160 40 49 20 46 65 65 42 02 75 46 61
Method Dect Limit
lUQl)
006 006 004 020 005 008 004 020 004 003 002 007 003 004 002 004 006 003 006
^Data obtained by Caroline A Madding using column 3 with a cryogenic interface and a quadrupole mass spectrometer (Sect 1133)
Reference 8
317
TABLE 6 ACCURACY AND PRECISION DATA FRON SEVEN OCTERMINATIONS OF THE MrrHOO ANALYTES IN REAGENT UATER USING UIDE BORE CAPILLARY COLUNN 2
CQmPound NJLL 0
Mean Accuracy ( of True
Value 2 uoL Concl
RSD )
Mean Accuracy ( of True
Value 02 OTL Cone)
RSD )
Internal Standard
Fluorobenzene 1
Surrogates
4-Bromofluorobenzene l2-Dichlorobenzene-d4
2 3
98 97
18 32
96 95
13 17
Target Analvtes
Benzene Bromobenzene Bromochloromethane Bromod i chioromethane Bromoform Bromomethane n-Butylbenzene sec-Butylbenzene tert-Butylbenzene Carbon tetrachloride Chlorobenzene Chloroethane^ Chloroform Chloromethane 2-Chlorotoluene 4-Chlorotoluene Di bromochloromethane l2-Dibromo-3-chloropropane 12-DibromoethaneC Dibromomethane 12-Dichlorobenzene 13-Dichlorobenzene 14-Dichlorobenzene Di chiorodi f1uoromethane 11-Oichloroethane 12-Dichloroethane 11-Oichloroethene cis-12-Dichloroethene trans-12-Dichloroethene
37 38 4 5 6 7 39 40 41 8 42
9 10 43 44 11
|C
13 45 46 47 14 15 16 17 18 19
97 102 99 96 89 55 89 102 101 84 104
97 110 91 89 95
99 93 100 98 38 97 102 90 100 92
44 30 52 18 24 27 48 35 45 32 31
20 50 24 20 27
21 27 40 41 25 23 38 22 34 21
113 101 102 100 90 52 87 100 100 92 103
95 d 108 108 100
95 94 87 94 d 85 100 87 89 85
18 19 29 18 22 67 23 28 29 26 16
21
31 44 30
22 51 23 28
36 21 3 8 29 23
6
318
TABLE 6 (Continued)
f v
Mean Accuracy Mean Accuracy ( of True ( of True
Value RSD Value RSD CQmpQund NQ 2 uoL Concl ) 02 ugL Concl fl
12-Dichloropropane 20 102 22 103 29 13-Dichloropropane 21 92 37 93 32 22-Dichloropropane^ 11-Dichloropropene^ cis-13-Dichloropropene^ trans-13-Dichloropropene 25 96 17 99 21 Ethylbenzene 48 96 91 100 40 Hexachlorobutadiene 26 91 53 88 24 Isopropylbenzene 49 103 32 101 21 4-Isopropyltoluene 50 95 36 95 31 Methylene chloride 27 e e Naphthalene 51 93 76 78 83 n-Propylbenzene 52 102 49 97 21 Styrene 1112-Tetrachloroethane 1122-Tetrachloroethane Tetrachloroethene
53 28 29 30
95 99 101 97
44 27 46 45
104 95 84 92
31 38 36 33
Toluene 54 105 28 126 17 123-Trichlorobenzene 55 90 57 78 29 124-Trichlorobenzene 111-Trichloroethane 112-Trichloroethane Trichloroethene
56 31 32 33
92 94 107 99
52 39 34 29
83 94 109 106
59 25 28 25
Tri chiorof1uoromethane 34 81 46 48 13 123-Trichloropropane 124-Trimethylbenzene 135-Trimethylbenzene Vinyl chloride o-Xylene m-Xylene p-Xylene
35 57 58 36 59 60 61
97 93 88 104 97 f 98
39 31 24 35 18
23
91 106 97 115 98 f 103
28 22 32 14 17
14
^Data obtained by James U Elchelberger using column 2 with the open split interface and an ion trap mass spectrometer (Sect 1132) with all method analytes In the same reagent water solution
^Designation in Figures 1 and 2 ^Not measured authentic standards were not available ^Not found at 02 MgL |Not measured methylene chloride was In the laboratory reagent blank ^m-xylene coelutes with and cannot be distinguished from its isomer p-xylene No 61
319
OPTIONAL FOAM TRA
X IN 0 0 EXIT
10MM GUASS FRIT MEDIUM JPOROSin
EXIT IN 00
14MU 0 D
WLETXIN 00
SAMPLE INLET
2WAY SYRINGE VALVE bull17CM 20 GAUGE SYRINGE NEEDLE
MM 0 0 RUBBER S9TUH
^10MM 0 D 116 IN 00 ftmdashINLET ]1STAINLpoundSS STEEL
X IN o D
i n MOLECULAR SIEVE PURGE GASRLTEX
PURGE GAS I FLOW CONTROL
FIGURE 1 PURGING DEVICE
320
c
PACXIN6 PROCEDURE CONSTRUCTION
COMPRESSION GLASS g n i 7AioOT RTTING NUT WOOL I w RESISTANCE
WIRE WRAPPED AND FERRULES ACTIVATED I J ^i (DOUBLE LAYER)
THERMOCOUPLE
CHARCOAL77CM^ SOLID
I CONTROLLER SeiSOR
15CM JGRADE 1 5 - Q ^ NIC BATUREl
NTROL 7^FOOT D
[PYROMETER RESISTANCE WIRE WRAPPED TUBING 25CM TBVAX 77 Of l^^ SOLID 0105 IN ID
(SINGLE LAYER) 0125 IN 00 3X0V-1 8CM-H STAINLESS STEa ICM GLASS WOOL
TRAP INLET
FIGURE 2 TRAP PACKINGS ANO CONSTRUCTION TO INCLUDE DESORB CAPABILITY
321
FIGURE 3 NORMALIZED TOTAL ION CURRENT CHROMATOGRAM FROM A VOLATILE COMPOUND CALIBRATION MIXTURE CONTAINING 25 na (5 MgL) OF MOST COMPOUNDS THE COMPOUND IDENTIFICATION NUMBERS ARE GIVEN IN TABLE 6
109
ro ro
TOTshy
JO
m322
7 4 A
280 (42
Y
m 1082
400 1322
30
t l
1A^^^Al^ l l y^ l^
(00 2902
AJ VJ LI ^ laquolaquo Li L^l r i i raquo r f Il raquo r r I raquo raquo raquo
Mj f II II I-j II I I r j II I I II 11 II I II I IIll 1111 II raquol
m m m im 2322 2(42 391)2 3322
u o o
lt ^
FIGURE A AMPLIFIED FIRST EIGHT MINUTES OF A TOTAL ION CURRENT CHROMATOGRAM FROM A VOLATILE COMPOUND CALIBRATION MIXTURE CONTAINING 25 ng (5 wgL) OF EACH COMPONENT THE COMPOUND IDENTIFICATION NUMBERS ARE GIVEN IN TABLE 6
mi
lOT-CO ro
_ i _ - I M I I I I I I I 11111 I bull I I I I I I I
50 m ISO 200 250 142 322 502 (42 822
c
TABLE 1 MOLECULAR UEIGHTS ANO QUANTITATION IONS FOR NETHOO ANALYTES
Comoound
Internal standard
Fluorobenzene
Surrogate
4-Bromof1uorobenzene l2-Dichlorobenzene-d4
Taraet Analvtes
Benzene Bromobenzene Bromochloromethane Bromodichloromethane Bromoform Bromomethane n-Butylbenzene sec-Butyl benzene tert-Butylbenzene Carbon tetrachloride Chlorobenzene Chloroethane Chloroform Chloromethane 2-Chlorotoluene 4-Chlorotoluene Di bromochloromethane l2-Dibromo-3-Chloropropane 12-Dibromoethane Dibromomethane 12-Dichlorobenzene 13-Dichlorobenzene 14-Dichlorobenzene Di chiorodi f1uoromethane 11-Dichloroethane 12-Dichloroethane 11-Dichloroethene cis-12-Dichloroethene trans-12-Dichloroethene 12-Dichloropropane 13-Dichlpropropane 22-Dichloropropane 11-Dichloropropene
MW
96
174 150
78 156 128 162 250 94 134 134 134 152 112 64 118 50 126 126 206 234 186 172 146 146 146 120 98 98 96 96 96 112 112 112 110
Primary Quantitation
Ion
96
95 152
78 156 128 83 173 94 91 105 119 117 112 64 83 50 91 91 129 75 107 93 146 146 146 85 63 62 96 96 96 63 76 77 75
Secondary Quantitation
Ions
77
174176 115150
77 77158 49130 85127 175252
96 134 134 91 119
77114 66 85 52 126 126 127
155157 109188 95174 111148 111148 111148
87 6583
98 6163 6198 6198 112 78 97
11077
309
0 TABLE 1 (continued)
Primary Secondary Quantitation Quantitation
Comoound HW Ion Ions
cis-13-dichloropropene 110 75 110 trans-13-dichloropropene 110 75 110 Ethylbenzene 106 91 106 Hexachlorobutadiene 258 225 260 Isopropylbenzene 120 105 120 4-Isopropyltoluene 134 119 13491 Methylene chloride 84 84 8649 Naphthalene 128 128 n-Propyl benzene 120 91 120 Styrene 104 104 78 1112-Tetrachloroethane 166 131 133119 1122-Tetrachloroethane 166 83 13185 Tetrachloroethene 164 166 168129 Toluene 92 92 91 123-Trichlorobenzene 180 180 182 124-Trichlorobenzene 180 180 182 111-Trichloroethane 132 97 9961 112-Trichloroethane 132 83 9785 Trichloroethene 130 95 130132 Tri chiorof1uoromethane 136 101 103 123-Trichloropropane 146 75 77 124-Trimethylbenzene 120 105 120 135-Trimethylbenzene 120 105 120 Vinyl Chloride 62 62 64
bull
0-Xylene 106 106 91 m-Xylene 106 106 91 p-Xylene 106 106 91
^Monoisotopic molecular weight calculated from the atomic masses of the isotopes with the smallest masses
310
TABLE 2 CHROMATOGRAPHIC RETENTION TINES FOR NETHOD ANALYTES ON THREE COLUMNS UITH FOUR SETS OF CONDITIONS
Retention K^^ (minrsec) Compound
Internal standard
Fluorobenzene
Surrocates
4-Bromofluorobenzenel2-Dichlorobenzene-d4
Target Analvtes
Benzene Bromobenzene Bromochloromethane Bromodichloromethane Bromoform Bromomethane n-Butyl benzene shysec-Butyl benzene tert-Butylbenzene Carbon Tetrachloride Chlorobenzene Chloroethane Chloroform Chloromethane 2-Chlorotoluene 4-Chlorotoluene Cyanogen chloride Di bromochloromethane l2-Dibromo-3-Chloropropane 12-Dibromoethane Dibromomethane 12-Dichlorobenzene 13-Di chiorobenzene 14-Dichlorobenzene Dichlorodifluoromethane 11-Dichloroethane 12-Dichloroethane 11-Dichloroethene cis-12-Dichloroethene trans-12-Dichloroethene 12-Dichloropropane 13-Dichloropropane 22-Dichloropropane 11-Dichloropropene
Column 1deg Column 2deg Column 1 ^
849 627
1838 1543 2216 1908
814 540 1857 1552 644 423
1035 829 1756 1453 201 058
2213 1929 2047 1805 2017 1734 737 516
1546 1301 205 101 624 448 138 044
1920 1625 1930 1643
1423 1151 2432 2105 1444 1150 1039 756 2231 1910 2113 1808 2133 1823
133 042 451 256 824 550 253 134 611 354 359 222
1005 740 1402 1119 601 348 749 517
1406
2338 2725
1330 2400 1222 1548
- 2246 448
2732 260B 2536 1310 2040
1236 324
2432 2446
1912
1924 1526 2726 2622 2636 308
1048 1338 750
1156 954
1512 1842 1152 1306
Column 3^
803
725 1625 538 920
1542 117
1757 1728 1719 725
1420 127 533 058
1644 1649 103
1248 1802 1336 905
1747 1728 1738 053 402 700 220 504 332 856
1229 519 710
311
TABLE 2 (continued)
Retention K^^ (min sec) Compound Column 1^ Column 2deg Column 2^ Column ^^ cis-13-dichloropropenetrans-13-dichloropropeneEthylbenzeneHexachlorobutadiene
1559 2659
1323 2341
1754 1642
2100 3204
1444 1914
Isopropylbenzene4-IsopropyltolueneMethylene ChlorideNaphthalenen-Propyl benzeneStyrene1112-Tetrachloroethane
1804 2112 336
2710 1904
1719 1556
1528 1831 204 2331 1625 1436 1320
2318 2630 916 3212 2420 2224 2052
1625 1738 240 1904 1649 1547 1444
1122-Tetrachloroethane 1843 1621 2404 1547 Tetrachloroethene 1344 1109 1836 1312 Toluene 1226 1000 1724 1131 123-Trichlorobenzene 2747 2411 3258 1914 124-Trichlorobenzene 2633 2305 3130 1850 111-Trichloroethane 716 450 1250 646 112-Trichloroethane 1325 1103 1818 1159 Trichloroethene 935 716 1448 901 Trichlorofluoromethane 216 111 612 146 123-Trichloropropane124-Trimethylbenzene135-TrimethylbenzeneVinyl chlorideo-Xylenem-Xylenep-Xylene
1901 2020 1928
143 1707 1610 1607
1614 1742 1654 047 1431 1341 1341
2408 3130 2450 356 2216 2122 2118
1616 1719 1659 102 1547 1518 1518
^Columns 1-3 are those given In Sect 6321 retention times were measured from the beginning of thermal desorption from the trap (columns 1-2) or from the beginning of thermal release from the cryogenic interface (column 3) degGC conditions given in Sect 1131 ^GC conditions given in Sect 1132 OGC conditions given in Sect 1133
-A
312
TABLE 3 ION ABUNDANCE CRITERIA FOR 4-BRaMOFLUOROBENZENE (BFB)
Mass fMzl
50 75 95 96 173 174 175 176 177
Relative Abundance Criteria
15 to 40 of mass 95 30 to 80 of mass 95 Base Peak 100 Relative Abundance 5 to 9 of mass 95 lt 2 of mass 174 gt 50 of mass 95 5 to 9 of mass 174 gt 95 but lt 101 of mass 174 5 to 9 of mass 176
313
TABLE 4 ACCURACY ANO PRECISION DATA FRON 16-31 OHERMINATIONS OF THE NETHOO ANALYTES IN REAfiENT HATER USING VIDE BORE CAPILUWY COLUNI 1gt
Compound
Benzene Bromobenzene Bromochloromethane Bromodi chioromethane Bromoform Bromomethane n-ButyIbenzene sec-Butyl benzene tert-Butylbenzene Carbon tetrachloride Chlorobenzene Chloroethane Chloroform Chloromethane 2-Chlorotoluene 4-Chlorotoluene 01bromochloromethane l2-Dibromo-3-chloropropane 12-Dibromoethane Dibromomethane 12-Oichlorobenzene 13-Dichlorobenzene 14-Dichlorobenzene Di chiorodi f1uoromethane 11-Dichloroethane 12-Dichloroethane 11-Dichloroethene cis-12 Dichloroethene trans-12-Oichloroethene 12-Dichloropropane 13-Dichloropropane 22-Dichloropropane 11-Dichloropropene cis-l2-Dichloropropene trans-12-Di chioropropene Ethylbenzene Hexachlorobutadiene Isopropylbenzene 4-Isopropyltoluene Methylene chloride Naphthalene n-Propyl benzene Styrene
True Cone Range fUQL)
01-10 01-10 05-10 01-10 05-10 05-10 05-10 05-10 05-10 05-10 01-10 05-10 05-10 05-10 01-10 01-10 01-10 05-10 05-10 05-10 01-10 05-10 02-20 05-10 05-10 01-10 01-10 05-10 01-10 01-10 01-10 05-10 05-10
01-10 05-10 05-10 01-10 01-10 01-100 01-10 01-100
Mean Accuracy
( of True Value)
97 100 90 95 101 95 100 100 102 84 98 89 90 93 90 99 92 83 102 100 93 99 103 90 96 95 94 101 93 97 96 86 98
99 100 101 99 95 104 100 102
Rel Std Dev ()
57 55 64 61 63 82 76 76 73 88 59 90 61 89 62 83 70 199 39 56 62 69 64 77 53 54 67 67 56 61 60 169 89
86 68 76 67 53 82 58 72
Method Det Limit (ual)
004 003 004 008 012 011 011 013 014 021 004 010 003 013 004 006 005 026 006 024 003 012 003 010 004 006 012 012 006 004 004 035 010
006 011 015 012 003 004 004 004
314
TABLE 4 (Continued)
True Mean Rel Method Cone Accuracy Std Oet Range ( of True Dev Limit
Compound fuoLl Valuel IX) (uoLl
1112-Tetrachl oroethane 05-10 90 68 005 1122-Tetrachloroethane 01-10 91 63 004 Tetrachloroethene 05-10 89 68 014 Toluene 05-10 102 80 011 123-Trichlorobenzene 05-10 109 86 003 124-Trichlorobenzene 05-10 108 83 004 111-Trichloroethane 05-10 98 81 008 112-Trichloroethane 05-10 104 73 010 Trichloroethene 05-10 90 73 019 Tri chiorof1uoromethane 05-10 89 81 008 123-Trichloropropane 05-10 108 144 032 124-Trimethyl benzene 05-10 99 81 013 135-Triraethylbenzene 05-10 92 74 005 Vinyl chloride 05-10 98 67 017 o-Xylene 01-31 103 72 011 m-Xylenc 01-10 97 65 005 p-Xylene 05-10 104 77 013
k ^Data obtained by Robert U Slater using column 1 with a Jet separator-interface and a quadrupole mass spectrometer (Sect 1131) with analytes divided among three solutions
315
TABLE 5 ACCURACY ANO PRECISION DATA FRON SEVEN DETERMINATIONS OF THE NETHOO ANALYTES IN REAGENT UATER USING THE CRYOGENIC TRAPPING OPTION AND A NARROW BORE CAPILLARY COLUNN 3
Comoound
Benzene Bromobenzene Bromochloromethane Bromodichloromethane Bromoform Bromomethane n-Butylbenzene sec-Butylbenzene tert-Butylbenzene Carbon tetrachloride Chlorobenzene Chloroethane Chloroform Chloromethane 2-Chlorotoluene 4-Chlorotoluene Cyanogen chloride^ Di bromochloromethane 12-Di bromo-3-chloropropane 12-Dibromoethane Dibromomethane 12-Oichlorobenzene 13-01chiorobenzene 14-Dichlorobenzene Dichlorodi f1uoromethane 11-01chioroethane 12-Dichloroethane 11-Dichloroethene cis-12 Dichloroethene trans-12-Dichloroethene 12-Dichloropropane 13-Dichloropropane 22-Dichloropropane 11-Dichloropropene cis-l3-01chloropropene trans-13-Dlchloropropene Ethylbenzene Hexachlorobutadiene Isopropylbenzene 4-Isopropytoluene Methylene chloride Naphthalene
True Cone fuaL)
01 05 05 OI 01 01 05 05 05 01 01 01 01 01 01 01
01 01 01 01 01 01 01 01 01 01 01 01 01 01 01 01 01
01 01 05 05 05 01
Mean Accuracy ( of True Valuel
99 97 97 100 99 99 94 90 90 92 91 100 95 99 99 96 92 99 92 97 93 97 99 93 99 98 100 95 100 98 96 99 99 98
99 100 98 87 97 98
Rel Std Dev ()
62 74 58 46 54 71 60 71 25 68 58 58 32 47 46 70 106 56 100 56 69 35 60 57 88 62 63 90 37 72 60 58 49 74
52 67 64rr 130 130 72
Method Dect Limit
(UQL)
003 011 007 003 020 006 003 012 033 008 003 002 002 005 005 005 030 007 005 002 003 005 005 004 011 003 002 005 006 003 002 004 005 002
003 004 010 026 009 004
316
TABLE 5 (Continued)
Comoound
n-Propylbenzene Styrene 1112-Tetrach1oroethane 1122-Tetrachloroethane Tetrachloroethene Toluene 123-Trichlorobenzene 124-Trichlorobenzene il1-Trichloroethane 112-Trichloroethane Trichloroethene Trichlorofluoromethane 123-Trichloropropane 124-Tri methyl benzene 135-Trimethylbenzene Vinyl chloride o-Xylene m-Xylene p-Xylene
True Cone
(ual)
01 01 01 05 01 01 01 01 01 01 01 01 01 01 01 01 01 01 01
Mean Accuracy ( of True Valuel
99 96 100 100 96 100 98 91 100 98 96 97 96 96 99 96 94 94 97
Rel Std Dev 1)
66 190 47 120 50 59 89 160 40 49 20 46 65 65 42 02 75 46 61
Method Dect Limit
lUQl)
006 006 004 020 005 008 004 020 004 003 002 007 003 004 002 004 006 003 006
^Data obtained by Caroline A Madding using column 3 with a cryogenic interface and a quadrupole mass spectrometer (Sect 1133)
Reference 8
317
TABLE 6 ACCURACY AND PRECISION DATA FRON SEVEN OCTERMINATIONS OF THE MrrHOO ANALYTES IN REAGENT UATER USING UIDE BORE CAPILLARY COLUNN 2
CQmPound NJLL 0
Mean Accuracy ( of True
Value 2 uoL Concl
RSD )
Mean Accuracy ( of True
Value 02 OTL Cone)
RSD )
Internal Standard
Fluorobenzene 1
Surrogates
4-Bromofluorobenzene l2-Dichlorobenzene-d4
2 3
98 97
18 32
96 95
13 17
Target Analvtes
Benzene Bromobenzene Bromochloromethane Bromod i chioromethane Bromoform Bromomethane n-Butylbenzene sec-Butylbenzene tert-Butylbenzene Carbon tetrachloride Chlorobenzene Chloroethane^ Chloroform Chloromethane 2-Chlorotoluene 4-Chlorotoluene Di bromochloromethane l2-Dibromo-3-chloropropane 12-DibromoethaneC Dibromomethane 12-Dichlorobenzene 13-Dichlorobenzene 14-Dichlorobenzene Di chiorodi f1uoromethane 11-Oichloroethane 12-Dichloroethane 11-Oichloroethene cis-12-Dichloroethene trans-12-Dichloroethene
37 38 4 5 6 7 39 40 41 8 42
9 10 43 44 11
|C
13 45 46 47 14 15 16 17 18 19
97 102 99 96 89 55 89 102 101 84 104
97 110 91 89 95
99 93 100 98 38 97 102 90 100 92
44 30 52 18 24 27 48 35 45 32 31
20 50 24 20 27
21 27 40 41 25 23 38 22 34 21
113 101 102 100 90 52 87 100 100 92 103
95 d 108 108 100
95 94 87 94 d 85 100 87 89 85
18 19 29 18 22 67 23 28 29 26 16
21
31 44 30
22 51 23 28
36 21 3 8 29 23
6
318
TABLE 6 (Continued)
f v
Mean Accuracy Mean Accuracy ( of True ( of True
Value RSD Value RSD CQmpQund NQ 2 uoL Concl ) 02 ugL Concl fl
12-Dichloropropane 20 102 22 103 29 13-Dichloropropane 21 92 37 93 32 22-Dichloropropane^ 11-Dichloropropene^ cis-13-Dichloropropene^ trans-13-Dichloropropene 25 96 17 99 21 Ethylbenzene 48 96 91 100 40 Hexachlorobutadiene 26 91 53 88 24 Isopropylbenzene 49 103 32 101 21 4-Isopropyltoluene 50 95 36 95 31 Methylene chloride 27 e e Naphthalene 51 93 76 78 83 n-Propylbenzene 52 102 49 97 21 Styrene 1112-Tetrachloroethane 1122-Tetrachloroethane Tetrachloroethene
53 28 29 30
95 99 101 97
44 27 46 45
104 95 84 92
31 38 36 33
Toluene 54 105 28 126 17 123-Trichlorobenzene 55 90 57 78 29 124-Trichlorobenzene 111-Trichloroethane 112-Trichloroethane Trichloroethene
56 31 32 33
92 94 107 99
52 39 34 29
83 94 109 106
59 25 28 25
Tri chiorof1uoromethane 34 81 46 48 13 123-Trichloropropane 124-Trimethylbenzene 135-Trimethylbenzene Vinyl chloride o-Xylene m-Xylene p-Xylene
35 57 58 36 59 60 61
97 93 88 104 97 f 98
39 31 24 35 18
23
91 106 97 115 98 f 103
28 22 32 14 17
14
^Data obtained by James U Elchelberger using column 2 with the open split interface and an ion trap mass spectrometer (Sect 1132) with all method analytes In the same reagent water solution
^Designation in Figures 1 and 2 ^Not measured authentic standards were not available ^Not found at 02 MgL |Not measured methylene chloride was In the laboratory reagent blank ^m-xylene coelutes with and cannot be distinguished from its isomer p-xylene No 61
319
OPTIONAL FOAM TRA
X IN 0 0 EXIT
10MM GUASS FRIT MEDIUM JPOROSin
EXIT IN 00
14MU 0 D
WLETXIN 00
SAMPLE INLET
2WAY SYRINGE VALVE bull17CM 20 GAUGE SYRINGE NEEDLE
MM 0 0 RUBBER S9TUH
^10MM 0 D 116 IN 00 ftmdashINLET ]1STAINLpoundSS STEEL
X IN o D
i n MOLECULAR SIEVE PURGE GASRLTEX
PURGE GAS I FLOW CONTROL
FIGURE 1 PURGING DEVICE
320
c
PACXIN6 PROCEDURE CONSTRUCTION
COMPRESSION GLASS g n i 7AioOT RTTING NUT WOOL I w RESISTANCE
WIRE WRAPPED AND FERRULES ACTIVATED I J ^i (DOUBLE LAYER)
THERMOCOUPLE
CHARCOAL77CM^ SOLID
I CONTROLLER SeiSOR
15CM JGRADE 1 5 - Q ^ NIC BATUREl
NTROL 7^FOOT D
[PYROMETER RESISTANCE WIRE WRAPPED TUBING 25CM TBVAX 77 Of l^^ SOLID 0105 IN ID
(SINGLE LAYER) 0125 IN 00 3X0V-1 8CM-H STAINLESS STEa ICM GLASS WOOL
TRAP INLET
FIGURE 2 TRAP PACKINGS ANO CONSTRUCTION TO INCLUDE DESORB CAPABILITY
321
FIGURE 3 NORMALIZED TOTAL ION CURRENT CHROMATOGRAM FROM A VOLATILE COMPOUND CALIBRATION MIXTURE CONTAINING 25 na (5 MgL) OF MOST COMPOUNDS THE COMPOUND IDENTIFICATION NUMBERS ARE GIVEN IN TABLE 6
109
ro ro
TOTshy
JO
m322
7 4 A
280 (42
Y
m 1082
400 1322
30
t l
1A^^^Al^ l l y^ l^
(00 2902
AJ VJ LI ^ laquolaquo Li L^l r i i raquo r f Il raquo r r I raquo raquo raquo
Mj f II II I-j II I I r j II I I II 11 II I II I IIll 1111 II raquol
m m m im 2322 2(42 391)2 3322
u o o
lt ^
FIGURE A AMPLIFIED FIRST EIGHT MINUTES OF A TOTAL ION CURRENT CHROMATOGRAM FROM A VOLATILE COMPOUND CALIBRATION MIXTURE CONTAINING 25 ng (5 wgL) OF EACH COMPONENT THE COMPOUND IDENTIFICATION NUMBERS ARE GIVEN IN TABLE 6
mi
lOT-CO ro
_ i _ - I M I I I I I I I 11111 I bull I I I I I I I
50 m ISO 200 250 142 322 502 (42 822
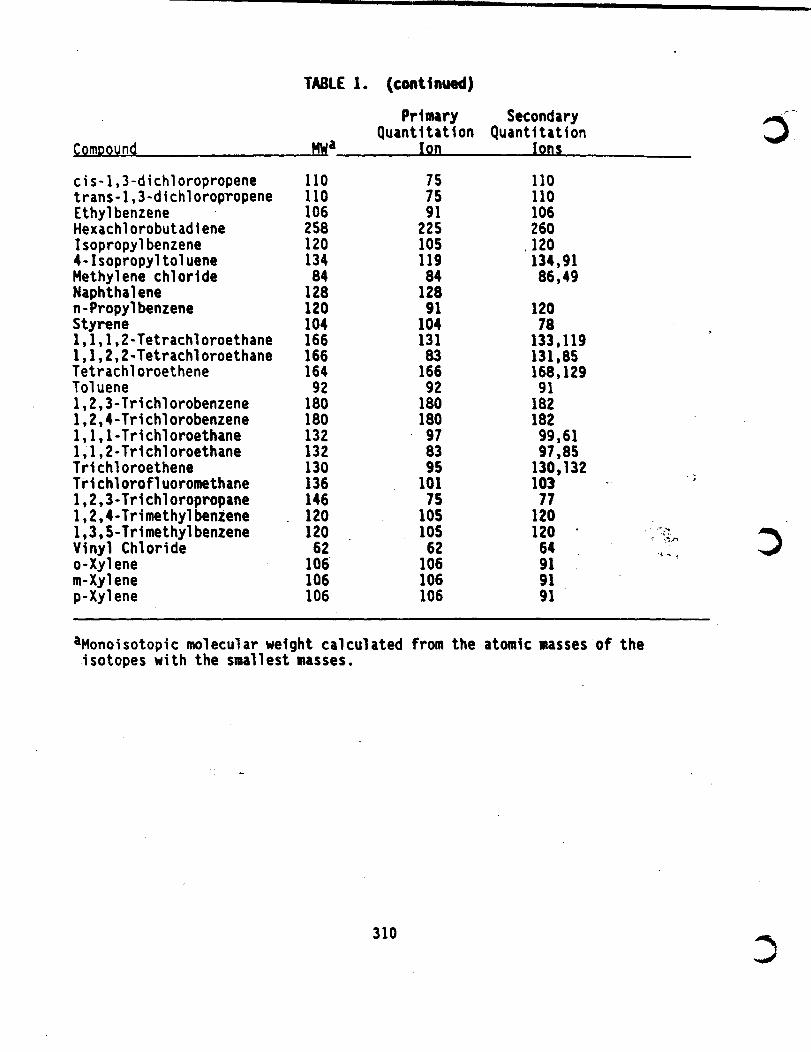
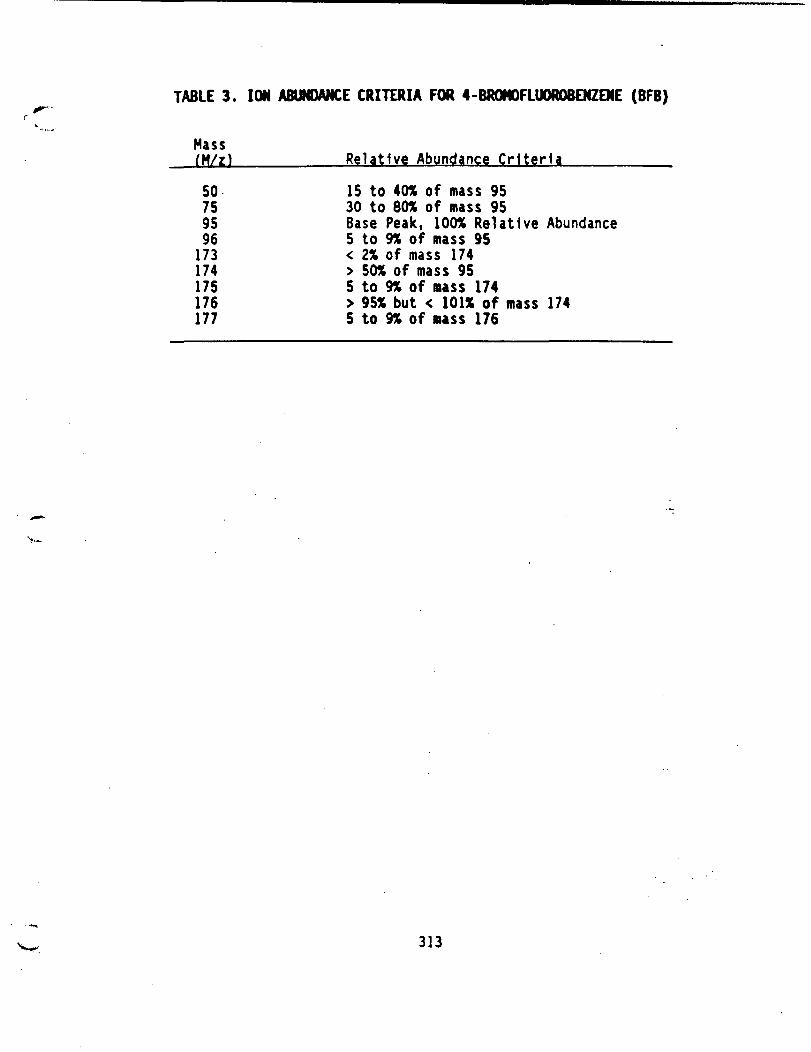
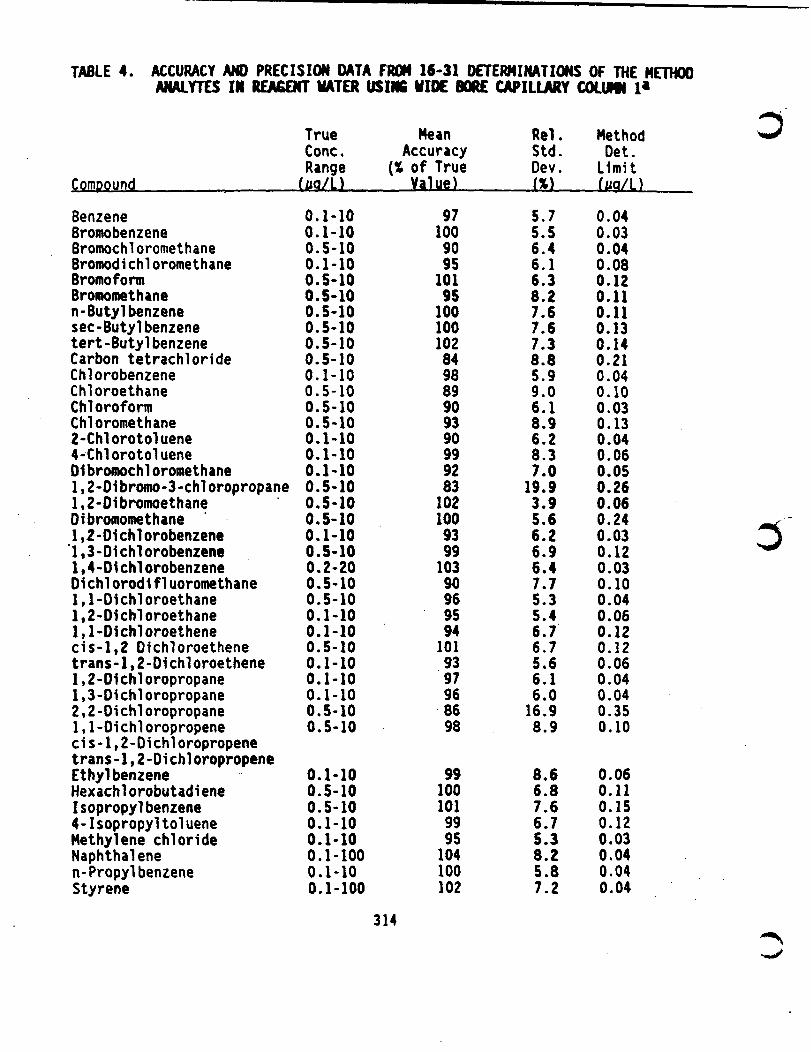
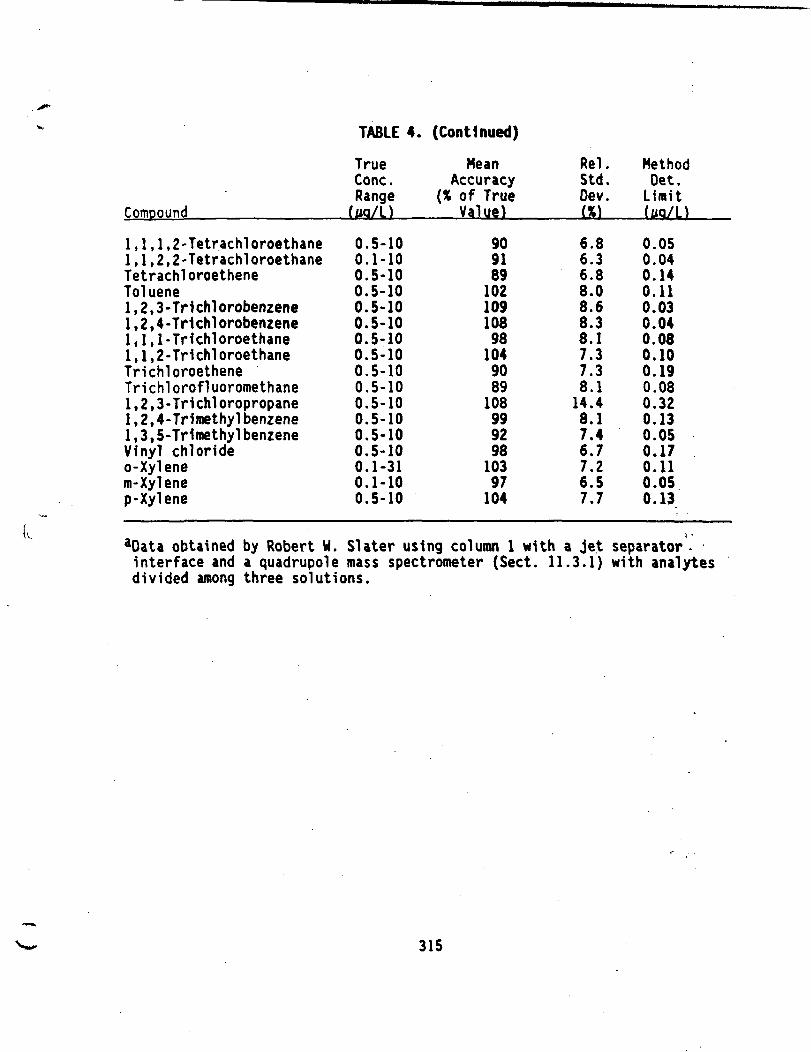
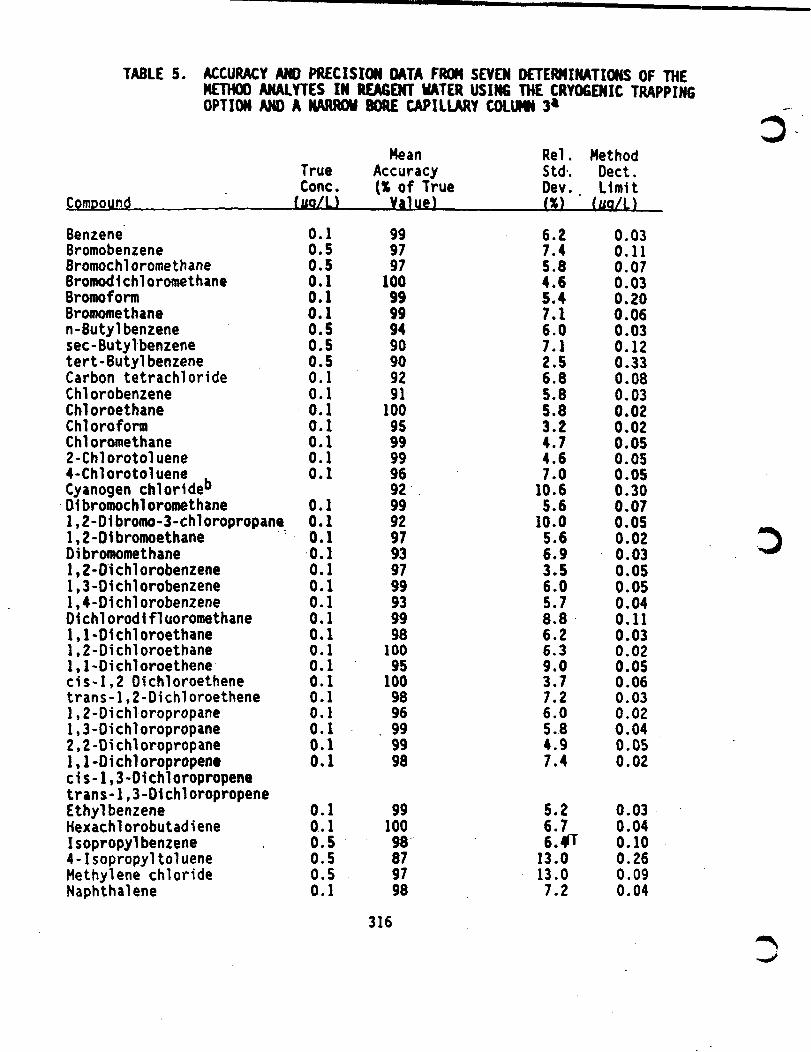
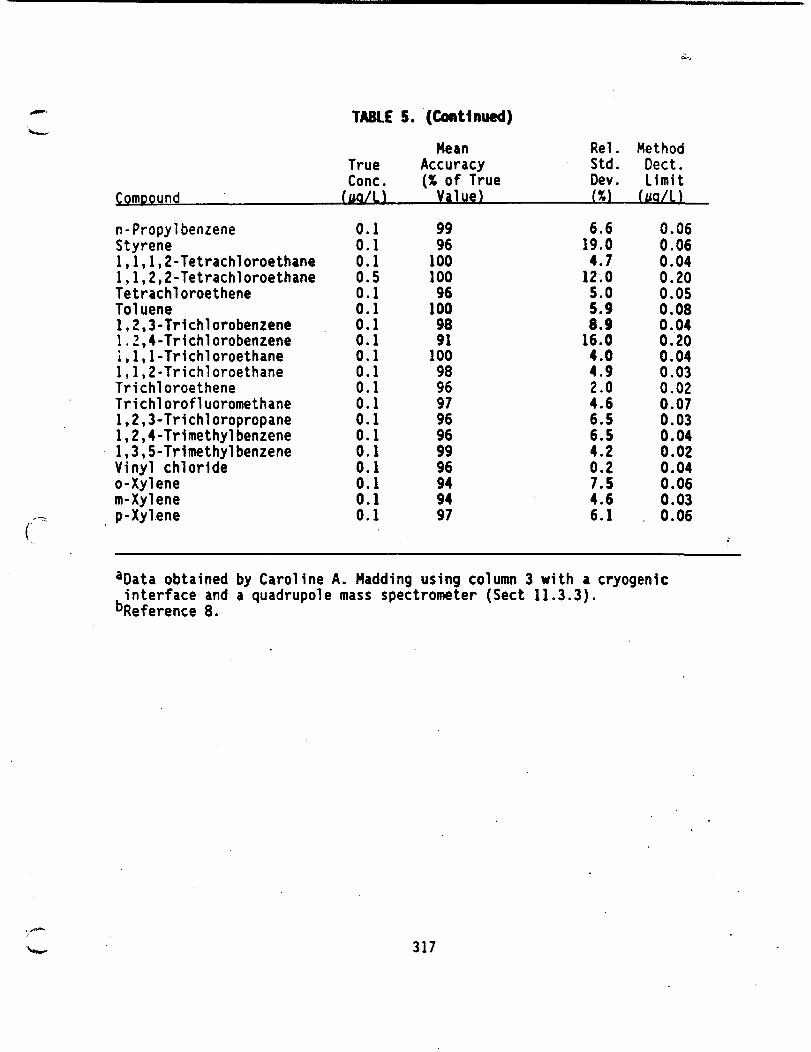
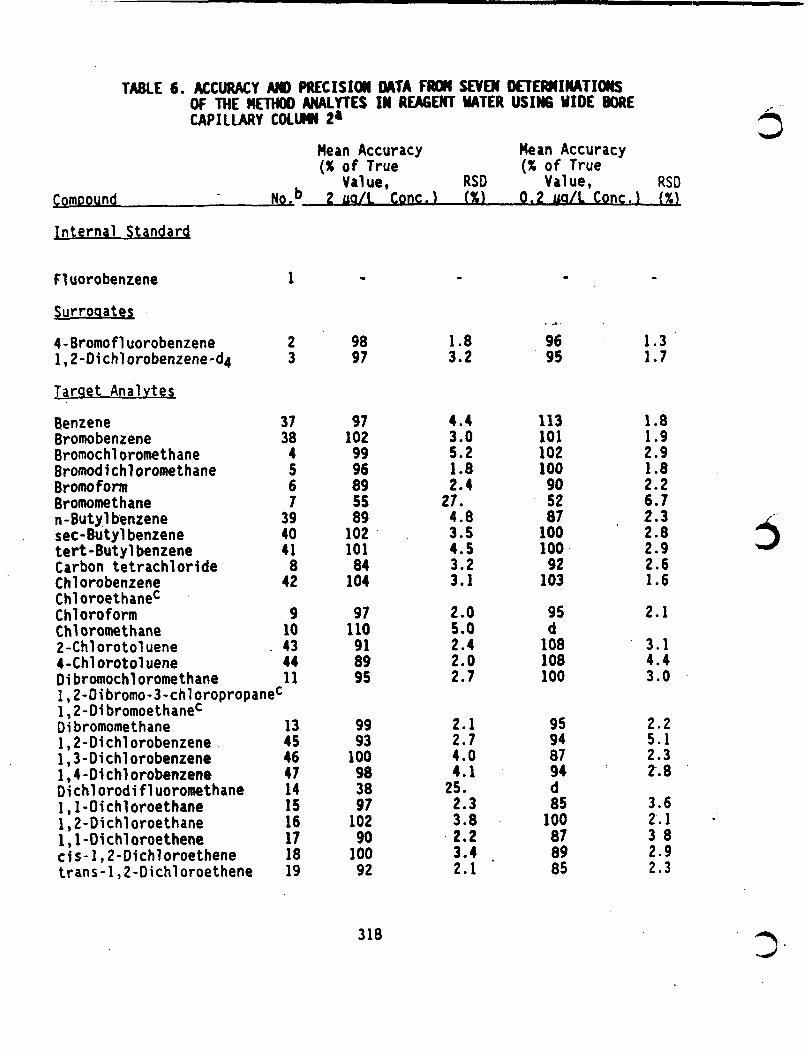
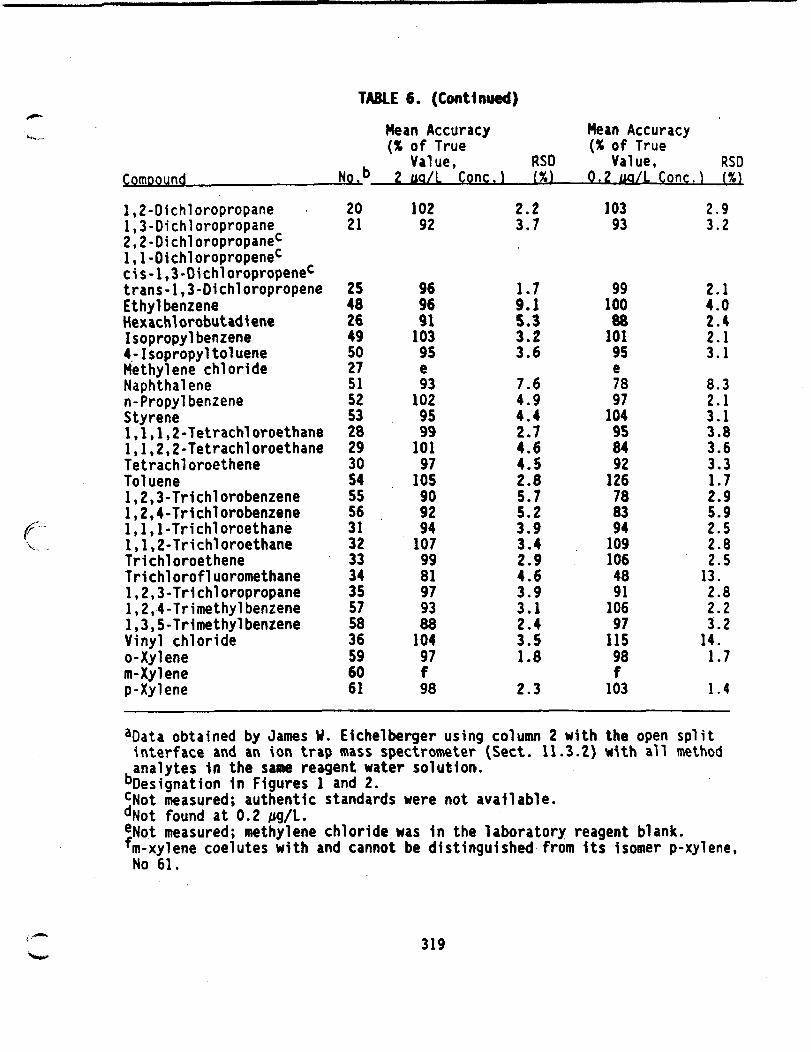
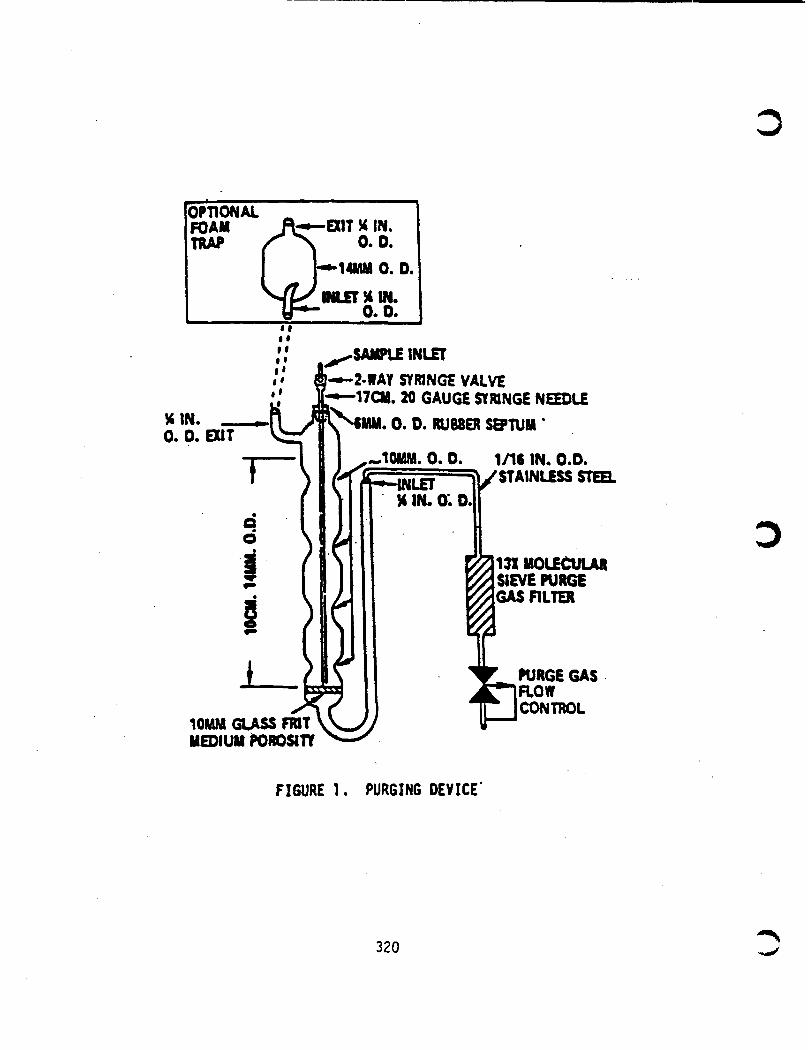
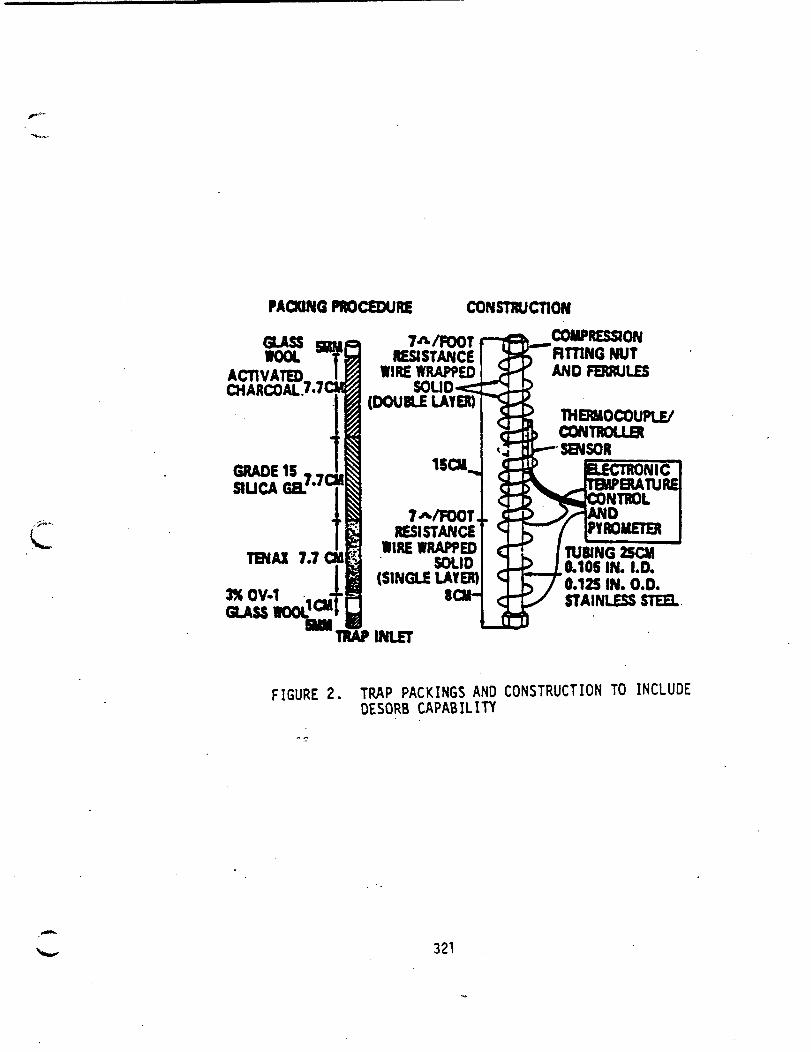
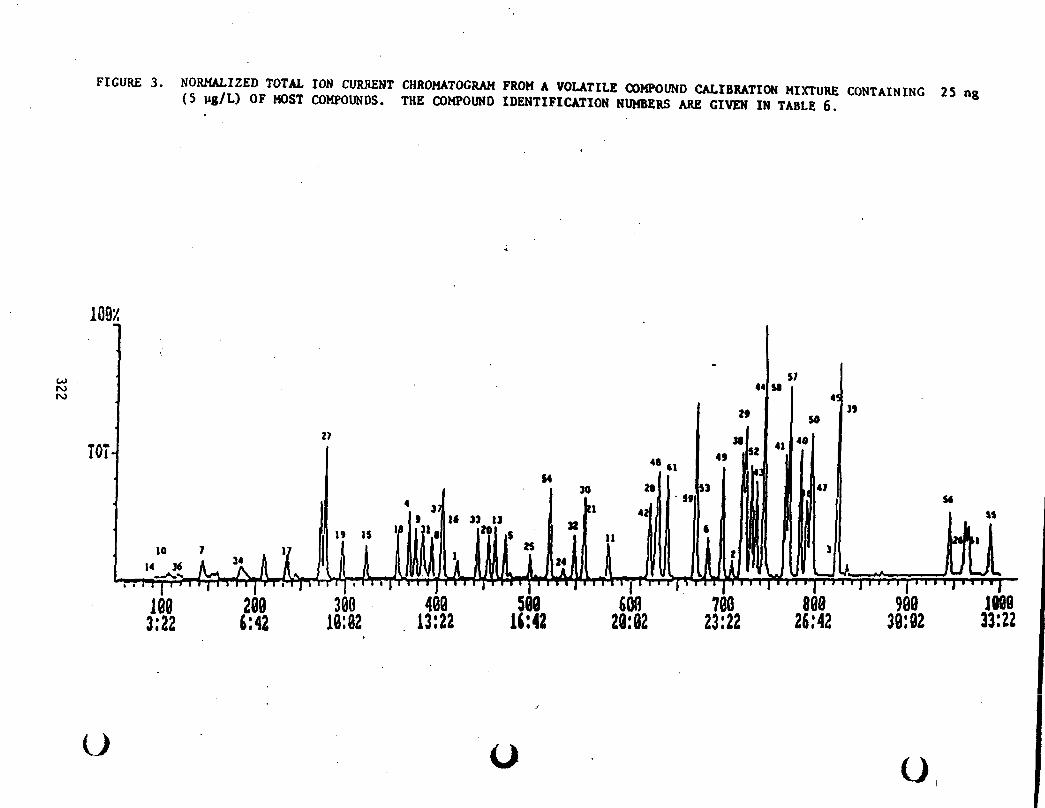
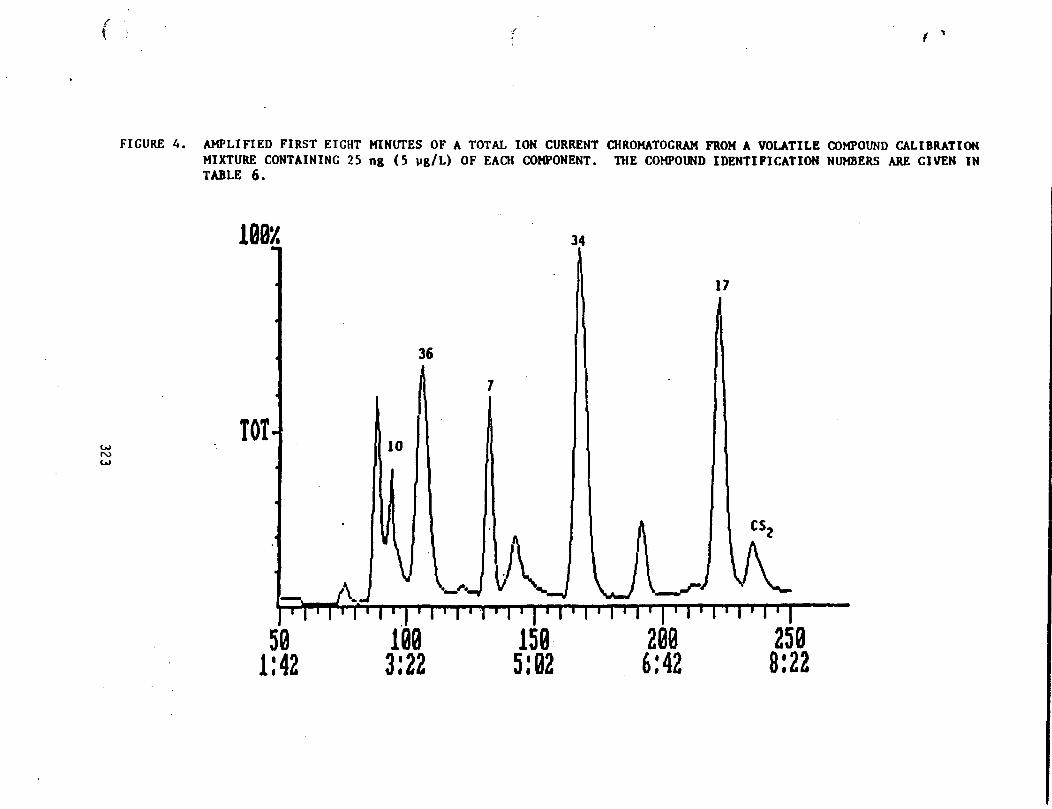