eowc white papers book - county of peterborough · 2017-10-05 · hite paper rio and is int ting...
TRANSCRIPT

0
Ratepayer Affordability
One of a Series of White Papers
on the
Financial Sustainability of Local Governments in Eastern Ontario
Produced by
The Eastern Ontario Wardens Caucus
December, 2013
Prepared by
Kathryn WoodNatural Capital Resources Inc.


1
Table of Contents
1. Executive Summary.............................................................................................. 2
2. Introduction......................................................................................................... 6
3. Region has Lower Average and Median Personal Earnings................................... 8
4. Region has Lower Average and Median Household Incomes than Ontario.......... 11
5. Lower Reliance on Employment Income in Rural Eastern Ontario....................... 14
6. Modest Growth in Population, Households Projected for Region....................... 16
7. Higher Proportion of Elderly Persons in Rural Eastern Ontario........................... 19
8. High Levels of Home Ownership in Rural Eastern Ontario................................... 21
9. Value of Owned Dwellings is Significantly Lower in Rural Eastern Ontario......... 22
10. Higher Percentage of Rural Eastern Ontario Homes in Need of Major Repair...... 23
11. Skewed Assessment Puts Heavy Burden On Residential Ratepayers................... 25
12. Median Shelter Costs Generally Lower ............................................................... 28
13. Rural Eastern Ontario Workforce Has Longer, More Expensive Commute .......... 29
14. Rural Eastern Ontario Residents Less Likely to Have Post Secondary Education... 32
15. Taking Action on Ratepayer Affordability............................................................ 36

1. Exec
This WOntaoperaOntaseekitaxesincom
SinceagreeOntaeconocentrWhitratep
WhatOntaas weRuralpay fgettinservicpatte
Lower shareprovincial av
More dependaverage (12.3
Core labour f
Lower share~10% less th
Higher shareas high as Ot
Lower sheltecommutes (~
cutive Sum
White Paperrio and is intating costs ario Wardensng a betters – especiallymes.
e many of thements madrio to the promic profileres such as Oe Paper compayers’ econ
t emerges frrio ratepayeell as differel Eastern Onor their ownng back andces or suppoerns, in relat
of income coverage (75%)
dent on gove3%)
force (25 64 y
of workforcean provincial
e of workforcettawa (5.5%) o
er costs by $3~$325/month
mmary
r examines ttended as aand revenues’ Caucus inunderstandiy annual tax
e costs of lode by the Prorovincial aveof a typical
Ottawa and Tmpares Ruralomic circum
rom these reers that is vent from thetario are lesn living costsforth to woorting investion to Ontar
A TypicAveraless tLarge(medOne
oming from em
ernment trans
years) is 55%
e age populataverage (57%
e age populator Toronto (5
30/month foh higher cost f
he economicompanions, and munic2013. By coning of the deincreases th
cal governmovince of Onerage on moratepayer inToronto musl Eastern Onmstances are
egional and cry differentprovince asss well off, ms, meet the erk – often intment in murio as a who
cal Residenage personalthan provinciaer share of eadian); ~$2,200in five (~18%
2
mployment e
sfers: 15.4% o
of total popu
ion with colle%)
tion with trad5.2%)
r owned homfor transporta
c circumstanreport to twcipal infrastrnsidering “raegree to whihat go beyon
ment are dettario, this Wre than a don Rural Eastest manage intario to thosto Rural Eas
comparativefrom majora whole. On
meaning theyexpenses ofn another municipal infrale, have pers
nt of Ruralearnings: $38al averagearners in lowe0 lower than) is a senior c
earnings: ~67%
of income; hig
ulation; equa
ege or univers
des certificate
mes, but longeation)
nces of residwo other Whructure, proatepayer affch ratepayend the annua
ermined byWhite Paper cozen variableern Ontario.n a similar ecse two citiesstern Ontari
e analyses isurban centrn virtually evy have fewereducating thunicipality, pstructure. Itsisted throu
l Eastern O8,317; ~ $4,0
er earnings brprovincial mecitizen
%; nearly 10%
gher than pro
l to provincia
sity education
e/diploma: ~1
er more expe
dents of Rurahite Papers oduced by thfordability”,ers can affordal increases
policy deciscompares Rues that makeAnd becausconomic envs to see howo.
a profile ofres at the revery variabler resources their familiespaying for viis also cleargh the reces
Ontario:00/year ($33
rackets: $28,2edian earning
% less than
ovincial
l average
n: ~47%;
11.0%; twice
nsive
al Easternon municipale Easternthe EOWC isd to pay highin their
ions andural Easterne up these major urbvironment, t
w similar
Rural Eastergion’s peripe, ratepayersto draw up ts or themselvtal municipar that thesession.
0/month)
241gs
l
sher
banthis
rnhery,s’ intoves,al
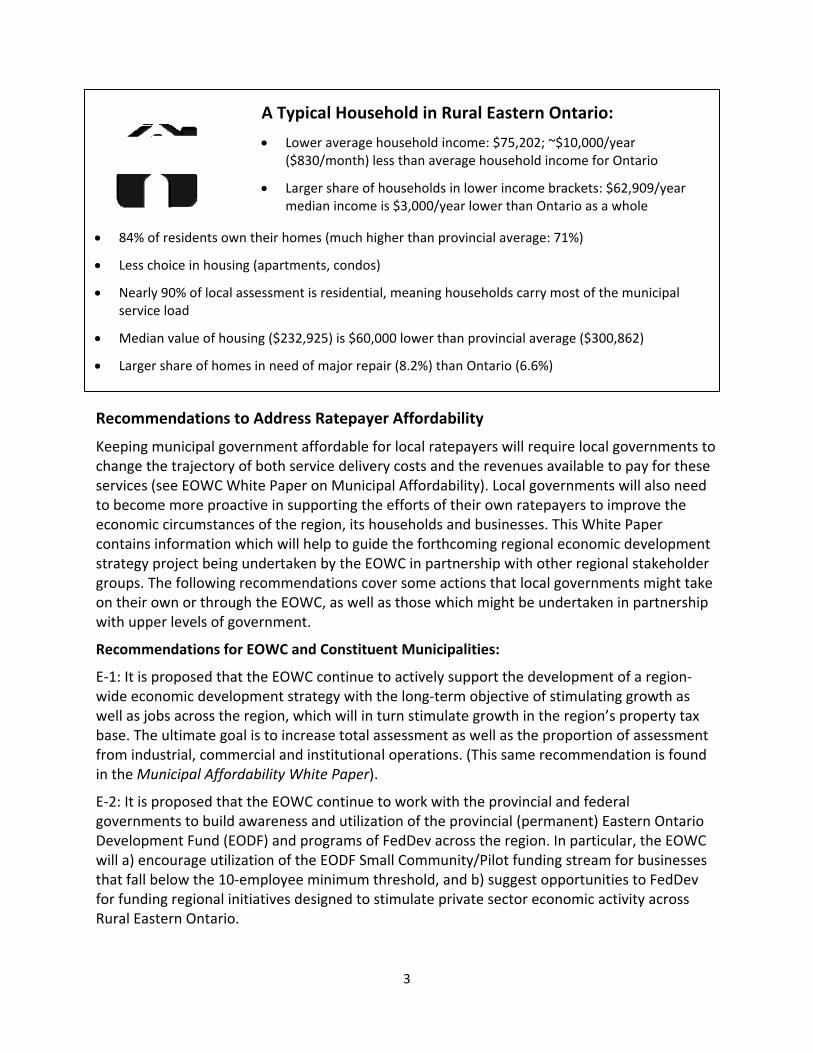
84% o
Less c
Nearlyservic
Media
Large
Recomm
Keepingchange tservices (to becomeconomicontainsstrategygroups. Ton their owith upp
Recomm
E 1: It is pwide ecowell as jobase. Thefrom indin theMu
E 2: It is pgovernmDevelopmwill a) enthat fall bfor fundiRural Eas
of residents o
choice in hous
y 90% of locace load
an value of ho
r share of hom
mendations
municipal gohe trajectory(see EOWC Wme more proc circumstaninformationproject beinThe followinown or throper levels of g
mendations f
proposed thonomic deveobs across the ultimate goustrial, comunicipal Affo
proposed thments to buildment Fund (ncourage utibelow the 10ng regionalstern Ontario
wn their hom
sing (apartme
al assessment
ousing ($232,
mes in need o
s to Addres
overnment ay of both seWhite Paperoactive in supnces of the rn which willng undertakeg recommenugh the EOWgovernment
for EOWC an
hat the EOWelopment strhe region, woal is to incrmercial andordability Wh
hat the EOWd awarenessEODF) and plization of th0 employeeinitiatives deo.
A Typ
Low($8
Largme
mes (much hig
ents, condos)
is residentia
,925) is $60,0
of major repa
s Ratepaye
affordable forvice deliverr on Municippporting theregion, its hohelp to guiden by the EOndations covWC, as well at.
nd Constitue
C continue trategy with thich will in trease total ainstitutionahite Paper).
C continue ts and utilizatprograms ofhe EODF Smaminimum thesigned to st
pical House
wer average h30/month) le
ger share of hdian income
3
gher than pro
l, meaning ho
000 lower tha
air (8.2%) tha
er Affordab
or local ratery costs andpal Affordabe efforts of touseholds ane the forthcOWC in partnver some actas those whi
ent Municipa
to actively suthe long termturn stimulatssessment al operations
to work withtion of the pFedDev acroall Communhreshold, antimulate priv
ehold in Ru
household incess than avera
households inis $3,000/yea
ovincial avera
ouseholds car
n provincial a
n Ontario (6.6
ility
payers will rthe revenueility). Local gheir own ratnd businesseoming regionership withtions that loich might be
alities:
upport the dm objectivete growth inas well as thes. (This same
h the provincprovincial (peoss the regioity/Pilot funnd b) suggestvate sector e
ural Easter
come: $75,20age househol
n lower incomar lower than
ge: 71%)
rry most of th
average ($300
6%)
require locales available tgovernmenttepayers to ies. This Whitonal economother regiocal governme undertaken
developmenof stimulatinn the region’e proportione recommen
cial and fedeermanent) Eon. In particunding streamt opportuniteconomic ac
rn Ontario
02; ~$10,000/ld income for
me brackets: $Ontario as a
he municipal
0,862)
governmento pay for ths will also neimprove thete Paper
mic developmnal stakeho
ments mightn in partners
t of a regionng growth ass property tn of assessmndation is fou
eralEastern Ontaular, the EOW
m for businesties to FedDectivity across
:
/yearr Ontario
$62,909/yearwhole
nts toheseeede
mentldertakeship
nsax
mentund
arioWCssesevs
r
4
E 3: It is proposed that the EOWC continue to encourage EORN to investigate and provideleadership to deployment of new, internet based technologies by small and medium sizedbusinesses including but not limited to agriculture, forestry, manufacturing and fabrication,construction, information communications technology (ICT), transportation & logistics, healthcare, education, and tourism. Increased utilization of the regional broadband network forbusiness purposes is expected to expand markets, increase private sector economic activity,create jobs, and ultimately, increase non residential assessment.
E 4: It is proposed that the EOWC actively support the development of an integrated regionaltransportation and (non traditional) transit system in Rural Eastern Ontario to increase accessto markets in and outside the region, as well as improving cost effectiveness of workforcecommutes in and out of the region. Enabling the workforce to get back and forth to work in acost effective way is expected to increase employment and related earnings.
E 5: It is proposed that the EOWC actively support the development of in region and distanceeducation and training opportunities to enhance the education and skill levels of the region’spopulation and workforce, thereby enhancing the ability of local residents to find employmentand increase earnings.
E 6: It is proposed that the EOWC advocate for reinstatement of the federal Home RenovationTax Credit – especially for energy efficiency, and the continuation and extension of theprovincial Home Renovation Tax Credit for seniors and family members living with them. It isfurther recommended that these tax credits be focused on low income owner occupiedhouseholds.
E 7: It is proposed that the EOWC actively support the development of a regional youthretention and re attraction strategy through which to increase the overall size of the labourforce in Rural Eastern Ontario and contribute to succession planning for local enterprises.
E 8: It is proposed that the EOWC advocate for additional financial support for affordablehousing initiatives that would reduce the need for residents to move to urban areas for thesetypes of accommodations.
Recommendations for the Province of Ontario:
U 1: It is proposed that the Province of Ontario provide Eastern Ontario municipalities thathave significant Crown lands or other lands with assessment constraints (e.g. managed forests,farmland, aggregate sites etc.) in their jurisdictions with compensation reflecting theseproperty based limitations. The compensation could be a Payment in Lieu or an annual share ofrevenues accruing to the Province from these lands (e.g. royalties from stumpage fees). Thiscompensation would be in recognition of the service provided by municipalities in building andmaintaining roads and bridges, and providing emergency services for these tax exempt lands.[This same recommendation is found in theMunicipal Affordability White Paper]

5
U 2: It is proposed that the EOWC continue to work cooperatively with provincial and federalauthorities to obtain an agreement related to the Algonquin land claim. Once an agreement isin place, it is proposed that the EOWC work collaboratively within the Algonquin Nation toidentify and pursue opportunities for economic development benefiting the Algonquins and theregion as a whole. [This same recommendation is found in theMunicipal Affordability WhitePaper].
U 3: It is proposed that the EOWC encourage and support the Province of Ontario in itscontinued efforts to contain the growth in program and service delivery costs, including thosethat are mandated to municipal government (examples: policing costs). It is further proposedthat the EOWC encourage the Province to engage municipalities and the EOWC in processeswhich will affect services mandated to municipal government.
U 4: It is proposed that the EOWC work with AMO and the Province of Ontario to develop astrategy which would allow and encourage local governments to introduce non tax basedrevenue generating measures to make their municipalities more financially sustainable. Thefirst priority could be an examination of ways to leverage existing municipal assets to providenew revenue streams (examples: outstanding POA monies; per ton charge for aggregates).[This same recommendation is found in theMunicipal Affordability White Paper].
U 5: It is proposed that the Province of Ontario broaden its commitment to work withmunicipalities on renewable energy development to include determination of appropriateproperty tax rates for all types of renewable energy, not just wind turbine towers. This is anessential companion to the proposed changes to the Feed in Tariff (FIT Program) which areintended to engage municipalities and Aboriginal communities in location and siting decisions,and providing new energy related economic development and revenue opportunities formunicipalities and public sector entities. [This same recommendation is found in theMunicipalAffordability White Paper].
U 6: It is proposed that the EOWC work with AMO and the Province of Ontario to determine ifthere are alternative, cost effective ways to deliver services at the local level, and seekopportunities for pilot programs through which these alternatives might be tested on a costshared basis in Rural Eastern Ontario. [This same recommendation is found in theMunicipalAffordability White Paper].
6
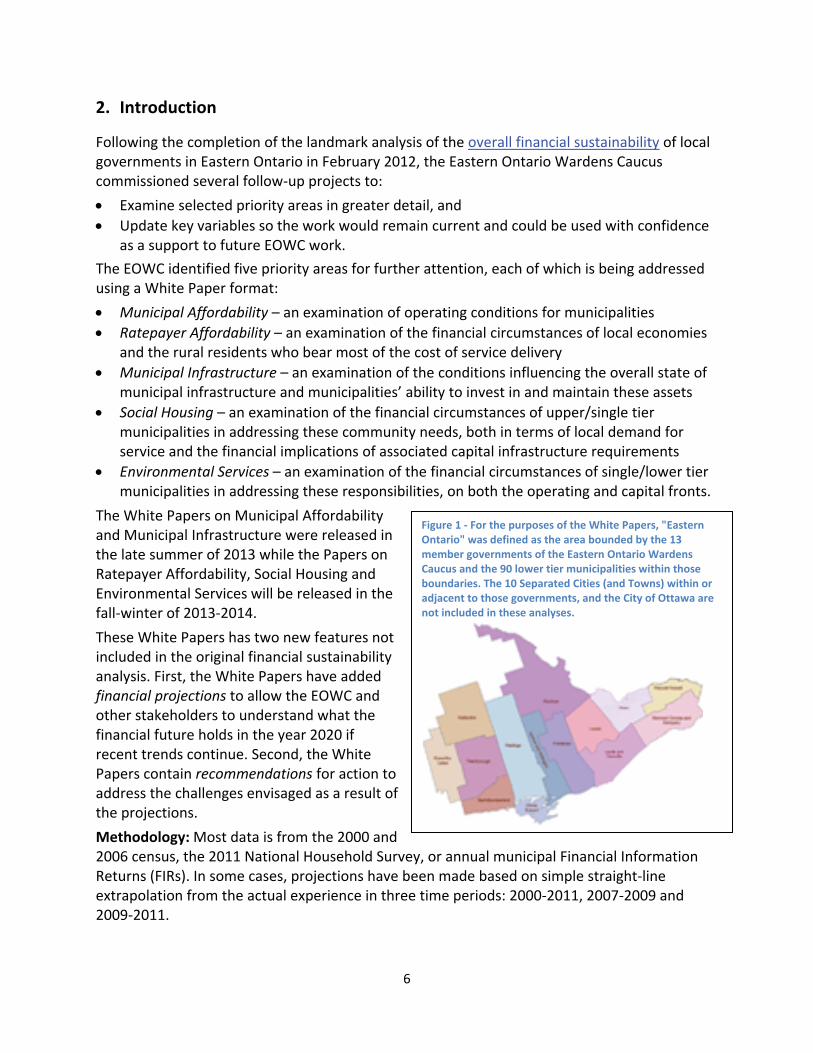
Figure 1 For the purposes of the White Papers, "EasternOntario" was defined as the area bounded by the 13member governments of the Eastern Ontario WardensCaucus and the 90 lower tier municipalities within thoseboundaries. The 10 Separated Cities (and Towns) within oradjacent to those governments, and the City of Ottawa arenot included in these analyses.
2. Introduction
Following the completion of the landmark analysis of the overall financial sustainability of localgovernments in Eastern Ontario in February 2012, the Eastern Ontario Wardens Caucuscommissioned several follow up projects to:
Examine selected priority areas in greater detail, andUpdate key variables so the work would remain current and could be used with confidenceas a support to future EOWC work.
The EOWC identified five priority areas for further attention, each of which is being addressedusing a White Paper format:
Municipal Affordability – an examination of operating conditions for municipalitiesRatepayer Affordability – an examination of the financial circumstances of local economiesand the rural residents who bear most of the cost of service deliveryMunicipal Infrastructure – an examination of the conditions influencing the overall state ofmunicipal infrastructure and municipalities’ ability to invest in and maintain these assetsSocial Housing – an examination of the financial circumstances of upper/single tiermunicipalities in addressing these community needs, both in terms of local demand forservice and the financial implications of associated capital infrastructure requirementsEnvironmental Services – an examination of the financial circumstances of single/lower tiermunicipalities in addressing these responsibilities, on both the operating and capital fronts.
The White Papers on Municipal Affordabilityand Municipal Infrastructure were released inthe late summer of 2013 while the Papers onRatepayer Affordability, Social Housing andEnvironmental Services will be released in thefall winter of 2013 2014.
These White Papers has two new features notincluded in the original financial sustainabilityanalysis. First, the White Papers have addedfinancial projections to allow the EOWC andother stakeholders to understand what thefinancial future holds in the year 2020 ifrecent trends continue. Second, the WhitePapers contain recommendations for action toaddress the challenges envisaged as a result ofthe projections.
Methodology:Most data is from the 2000 and2006 census, the 2011 National Household Survey, or annual municipal Financial InformationReturns (FIRs). In some cases, projections have been made based on simple straight lineextrapolation from the actual experience in three time periods: 2000 2011, 2007 2009 and2009 2011.

7
Notes about Data Sources
Note 1: Assessing changes over time for many of the variables of interest for Rural EasternOntario residents is no longer possible due to methodological changes in the way StatisticsCanada collects and publishes these data1. In particular, the change from the traditional census(used up to 2006) to the National Household Survey (NHS, used for the first time in 2011)reflects a change from a comprehensive survey to a sampling approach which affects thecomparability of the data from these two sources. Secondly, the change in methodology hasresulted in sparse data – and therefore suppressed/unpublished data – from more than 20 ofthe 103 single, upper and lower tier municipalities in Rural Eastern Ontario. It is not clear whatbiasing effects there may be from this phenomenon. As a result, this report includes 2006census and 2011 NHS data separately and compares each to the Ontario average for that sametimeframe, rather than examining how a variable may have changed over time. This isparticularly disappointing since a key question the EOWC wished to answer was how RuralEastern Ontario had fared through the recession starting in 2008. The change in methodologylimits our ability to address this question.
Note 2: Financial data such as earnings and total income are drawn from the previous tax year.In other words, earnings reported in the 2006 census are based on the 2005 tax year. Similarly,the 2011 National Household Survey reports data based on the 2010 tax year. Other data suchas household composition or employment status reflects the current year (e.g. 2006 or 2011).In this report, we will refer only to the census or NHS year. The reader is reminded that in somecases, the data is actually from the preceding year.
1 When income data from the 2011 National Household Survey was released in September of 2013, Statistics Canada notedthat “Low income estimates from the 2011 National Household Survey (NHS) compared with previous censuses showmarkedly different trends than those derived from other surveys and administrative data such as the Survey of Labour andIncome Dynamics or the T1 Family File. Data to support quality estimates of low income trends require a stable methodologyover time that has similar response patterns. With the new methodology of the NHS, estimates of low income are notcomparable with the census based estimates produced in the past.” Source: http://www.statcan.gc.ca/dailyquotidien/130911/dq130911a eng.htm

8
3. Rural Eastern Ontario has Lower Average and Median Personal Earnings thanOntario
NHS 2011: As measured by the National Household Survey (2010 tax year), the average pretax personal earnings of residents of all counties in Rural Eastern Ontario ($38,317) were,on average, nearly $4,000/year less than for the Province as a whole ($42,264). Thisamounts to more than $330/month. On a county by county basis, the difference in earningsranged from $1,100/year to $11,000/year lower than the Ontario average (see graph onfollowing page). The difference in earnings is even more pronounced in comparisons toeither Toronto ($44,517) or Ottawa ($49,826).
The financial resources from which wage earners pay their municipal property taxes aretherefore less in Rural Eastern Ontario than for the province as a whole and less than inmajor urban centres.
A similar phenomenon is in evidence for median2 personal earnings: the regional median forRural Eastern Ontario is $28,241, which is more than $2,200 a year lower than for theprovince as a whole ($30,526) and far lower than Ottawa ($39,530). Rural Eastern Ontario’smedian personal earnings are slightly higher than Toronto ($27,371).
This means a larger share of resident earners are paying their property taxes from a smallerpaycheque than for wage earners across the province as a whole.
Census 2006: Before the recession, median personal earnings were roughly $7,000 a yearlower in Rural Eastern Ontario ($22,683) than the provincial average ($29,335). The region’smedian personal earnings were also considerably lower than in Ottawa ($34,908) orToronto ($28,675).
Note that due to methodological changes between 2006 and 2011, comparisons betweenthose two periods are inappropriate. Only comparisons within the same period areappropriate and even these should be taken as general indications of patterns rather thanprecise results.
These data suggest that regardless of time period, members of the labour force in Rural EasternOntario have lower personal earnings than their counterparts in many other parts of Ontarioparticularly the City of Ottawa. This pattern appears to have persisted through the recession.These data suggest that the rural labour force still remains challenged to find (or do not qualifyfor) jobs with associated higher rates of pay. Further, the data suggest that the rural labourforce would not have as much disposable income with which to pay rent or a mortgage for ahome – or property taxes.
2 Median earnings represent the point below which the annual earnings of 50% of individuals earning employment income inthat community fall. For the purpose of calculating a regional median, a weighted average was calculated based on the numberof earners in each county times the relevant median earnings; these county data were added with the total being divided bythe total number of earners in the rural region.

9
Figure 2 Average Personal Earnings (2011 NHS) Rural Eastern Ontario compared to Ontario, Ottawa and Toronto
Figure 3 Average Personal Earnings and Median Personal Earnings for 2010 Tax Year, by County and compared to Ontario,Ottawa and Toronto

10
Figure 4 Median Personal Earnings (2005 Tax Year) – Rural Eastern Ontario compared to Ontario, Ottawa and Toronto

11
4. Rural Eastern Ontario Has Lower Average and Median Household Incomesthan Ontario
NHS 2011: As measured by the National Household Survey (2010 tax year), the average pretax household income in Rural Eastern Ontario ($75,202) was roughly $10,000 a year lowerthan for the Province as a whole ($85,772). This amounts to more than $830/month. Thedifference in income is even more pronounced in comparison to either Toronto ($87,038) orOttawa ($96,815). On a county by county, basis, the difference in earnings ranged from$4,000/year lower to $18,000/year lower than the Ontario average.
On average, the financial resources from which households pay their municipal propertytaxes are therefore less in Rural Eastern Ontario than for the province as a whole and lessthan in Ottawa.
A similar phenomenon is in evidence for median household income: the regional3 median4
household income for Rural Eastern Ontario is $62,909, which is more than $3,000 lowerthan for the province as a whole ($66,358) and far lower than Ottawa ($79,634). RuralEastern Ontario’s median household income appears to be slightly higher than that ofToronto ($58,381).
This means a larger share of resident earners are paying their property taxes from a smallerhousehold income stream than across the province as a whole.
Census 2006: In the 2006 census, median household incomes (2005 tax year) were roughly$7,000 a year less in Rural Eastern Ontario than across Ontario as a whole: $53,261compared to $60,455. Median household income in Rural Eastern Ontario is alsoconsiderably lower than in Ottawa ($69,743) but just above that of Toronto ($52,833).
These data suggest that members of the labour force in Rural Eastern Ontario still have lowerhousehold incomes than their counterparts in the rest of Ontario, including Ottawa andToronto. These data suggest that the rural labour force still remains challenged to find (or donot qualify for) jobs with associated higher rates of pay. Further, the data suggest that the rurallabour force would not have as much disposable income with which to pay rent or a mortgagefor a home – or property taxes.
3 For the purpose of calculating a regional median, a weighted average was calculated based on the number of households ineach county times the relevant median household income; these county data were added with the total being divided by thetotal number of households in the rural region.4 Median earnings represent the point below which the annual earnings of 50% of individuals earning employment income inthat community fall.

12
Figure 5 Average Household Income, Median Household Income for Rural Eastern Ontario, (2010 tax year) by County,compared to Ontario, Ottawa and Toronto
Figure 6 Average Household Income (2010 Tax Year) Rural Eastern Ontario compared to Ontario, Ottawa and Toronto

13
Figure 7 Median Household Income 2006 Census (2005 tax year) – Rural Eastern Ontario compared to Ontario, Ottawa andToronto

14
5. Lower Reliance on Employment Income in Rural Eastern Ontario
2011 NHS: Rural Eastern Ontario drew roughly 67.3%5 of total income from earnings –much lower than Ontario as a whole (74.8%). The difference is roughly 7% lower reliancethan across the province. In Ottawa, residents drew even more of their income fromearnings (76.2%). Toronto’s ability to draw income from earnings (76.1%) was slightly abovethe provincial rate. On a county by county basis, the percentage of income from earningsvaried from a low of 55.4% to a high of 75.3%. Twelve of the 13 EOWC membercommunities are below the provincial average on this measure.
At the same time, Rural Eastern Ontario’s reliance on government transfers6 (15.4%) ishigher than for any of the province as a whole (12.3%), Ottawa (8.6%) or Toronto (11.5%).All EOWC members are at or above the provincial average (greater reliance) on thismeasure.
Figure 8 Reliance on Earnings and Government Transfers as Source of Income Rural Eastern Ontario compared toOntario, Ottawa and Toronto
5 This is a weighted average of the percentages of income from earnings from each county with weighting by therelative number of persons 15 years and over with income and the percentage of income from earnings6 This form of income includes CPP/QPP, OAS pensions and GIS, Employment Insurance benefits, child benefits andother sources of government income. It does not include investment income or income from retirement pensions,superannuation or annuities.

15
2006 Census: Based on 2005 tax year data, Rural Eastern Ontario drew roughly 70.1% oftotal income from earnings – much lower than Ontario as a whole (77.4%). This is 7% lowerreliance than across the province. In Ottawa, residents drew even more of their incomefrom earnings (77.7%). Toronto’s ability to draw income from earnings was identical to theprovince as a whole (77.4%). On a county by county basis, the percentage of income fromearnings varied from a low of 58.2% to a high of 77.8%.
This suggests that rural residents were more reliant on other forms of income – governmenttransfers for example – than are their urban counterparts.
In fact, Rural Eastern Ontario’s reliance on government transfers (12.8%) was higher thanfor any of the province as a whole (12.3%), Ottawa (7.3%) or Toronto (9.2%). Every countyin Rural Eastern Ontario was more reliant on government transfers than the province as awhole.
Figure 9 Reliance on Earnings or Government Transfers as Source of Income Rural Eastern Ontario compared toOntario, Ottawa and Toronto (2005 Tax Year)
16
6. Modest Growth in Population, Households Projected for Rural EasternOntario
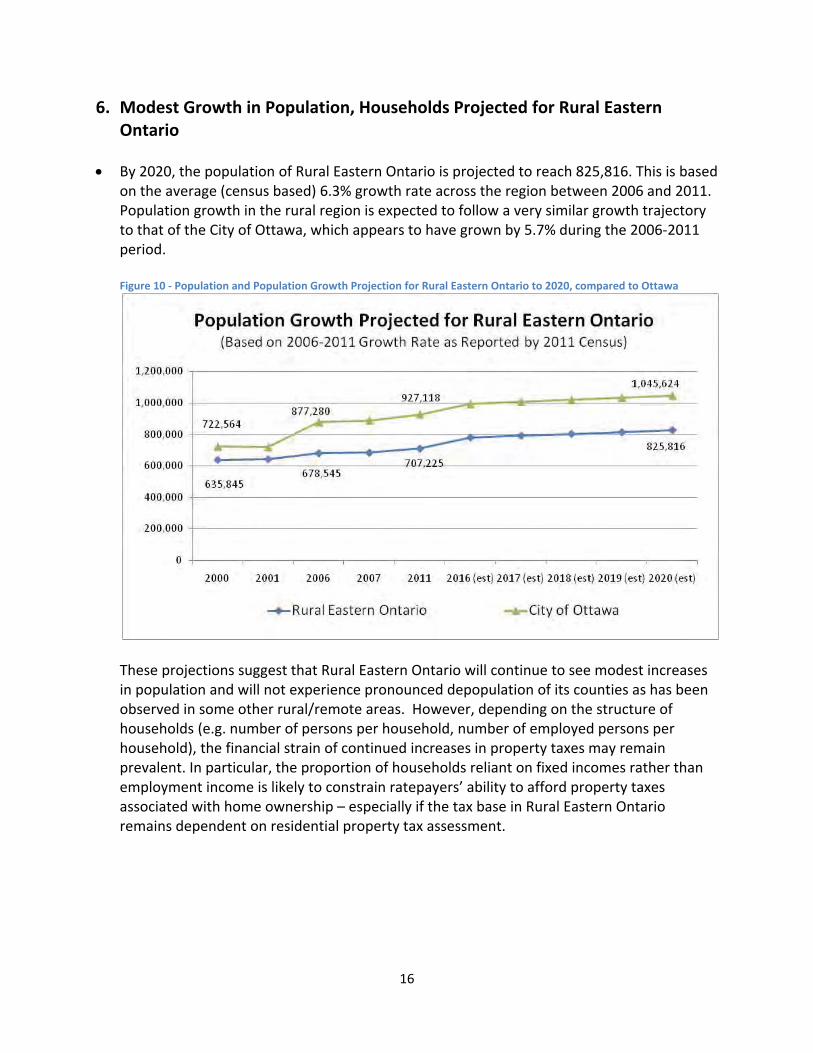
By 2020, the population of Rural Eastern Ontario is projected to reach 825,816. This is basedon the average (census based) 6.3% growth rate across the region between 2006 and 2011.Population growth in the rural region is expected to follow a very similar growth trajectoryto that of the City of Ottawa, which appears to have grown by 5.7% during the 2006 2011period.
Figure 10 Population and Population Growth Projection for Rural Eastern Ontario to 2020, compared to Ottawa
These projections suggest that Rural Eastern Ontario will continue to see modest increasesin population and will not experience pronounced depopulation of its counties as has beenobserved in some other rural/remote areas. However, depending on the structure ofhouseholds (e.g. number of persons per household, number of employed persons perhousehold), the financial strain of continued increases in property taxes may remainprevalent. In particular, the proportion of households reliant on fixed incomes rather thanemployment income is likely to constrain ratepayers’ ability to afford property taxesassociated with home ownership – especially if the tax base in Rural Eastern Ontarioremains dependent on residential property tax assessment.

17
Figure 11 Projected Growth in Households in Rural Eastern Ontario, compared to City of Ottawa
Number of Households Growing More Slowly than Population, Increases Property TaxBurden
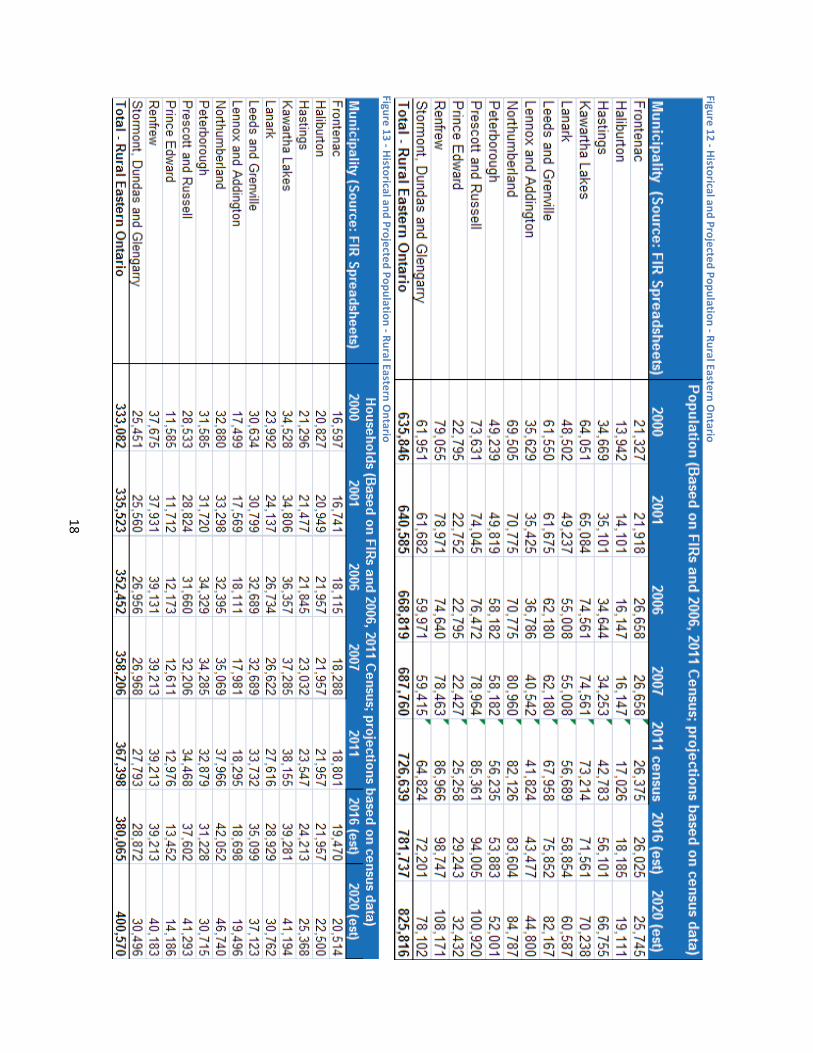
Note that the growth rate in households in Rural Eastern Ontario from 2006 to 2011 was4.2% – roughly two thirds of the rate of population increase (6.3%) (See table on followingpage). With municipal services funded very heavily from residential property taxassessment, property owners in Rural Eastern Ontario will carry an increasingly largeburden for municipal services and infrastructure maintenance. There simply isn’t sufficientcommercial, industrial or institutional tax assessment to shoulder the increasing costs ofservice delivery.
18
Figure12
Historicaland
ProjectedPopulation
RuralEasternOntario
Figure13
Historicaland
ProjectedPopulation
RuralEasternOntario

19
7. Higher Proportion of Elderly Persons in Rural Eastern Ontario
Between the 2006 and 2011 census, the proportion of citizens aged 65 and over in RuralEastern Ontario has risen by more than a full percentage point, increasing from 16.9% to18.1%. Rural Eastern Ontario has a significantly higher percentage of its citizens aged 65and older than the province as a whole (18.1% for the rural areas compared to 14.6% forOntario). The percentage for the City of Ottawa is considerably lower at 13.2%.
The proportion of elderly persons is slightly higher in the separated cities and towns: 17.8%climbing to 18.8% of the total population in 2011, but the rate of increase is less than in therural areas (1.0% compared to 1.2%). The City of Ottawa has seen a more modest increasein elderly population – from 12.4 to 13.2% (a change of 0.8%). In the same period, thepercentage of elderly persons across the Province of Ontario rose from 13.6 to 14.6% – arate which matched that of the separated cities.
When considered in combination with relatively lower incomes in rural areas (see precedingsection), the data suggest that seniors may have particular difficulty in paying higherproperty taxes, which are based on the value of an illiquid asset (their home) rather thantheir incomes.
Since elderly persons are less likely to be in the labour force, this suggests that there wouldbe a higher proportion of residents in Rural Eastern Ontario that would be on fixed incomes(e.g. pensions) and they may find it more difficult to cover the costs of maintaining theirhomes.
If the number of persons 65 plus grows through to 2020 at the same rate as it did in the2006 2011 census period, Rural Eastern Ontario will have close to 170,000 seniors by 2020(20% of the entire population). In absolute number, this would be a larger elderlypopulation than in the City of Ottawa (projected to be 149,284). This is because theprojected growth rate of the region’s senior population is higher in Rural Eastern Ontariothan the projected growth in the general population (13.3% in 5 years compared to 6.3% in2006 2011).

20
Figure 14 Number of Persons Aged 65 and Older in Rural Eastern Ontario (2006, 2011 Census), compared to Ottawa
Figure 15 Persons Aged 65 and Older, by Sub Region, 2011 Census, 2006 Census, Compared to Provincial Average
Figure 16 Age Distribution by Sub Region Source: 2006 Census
21
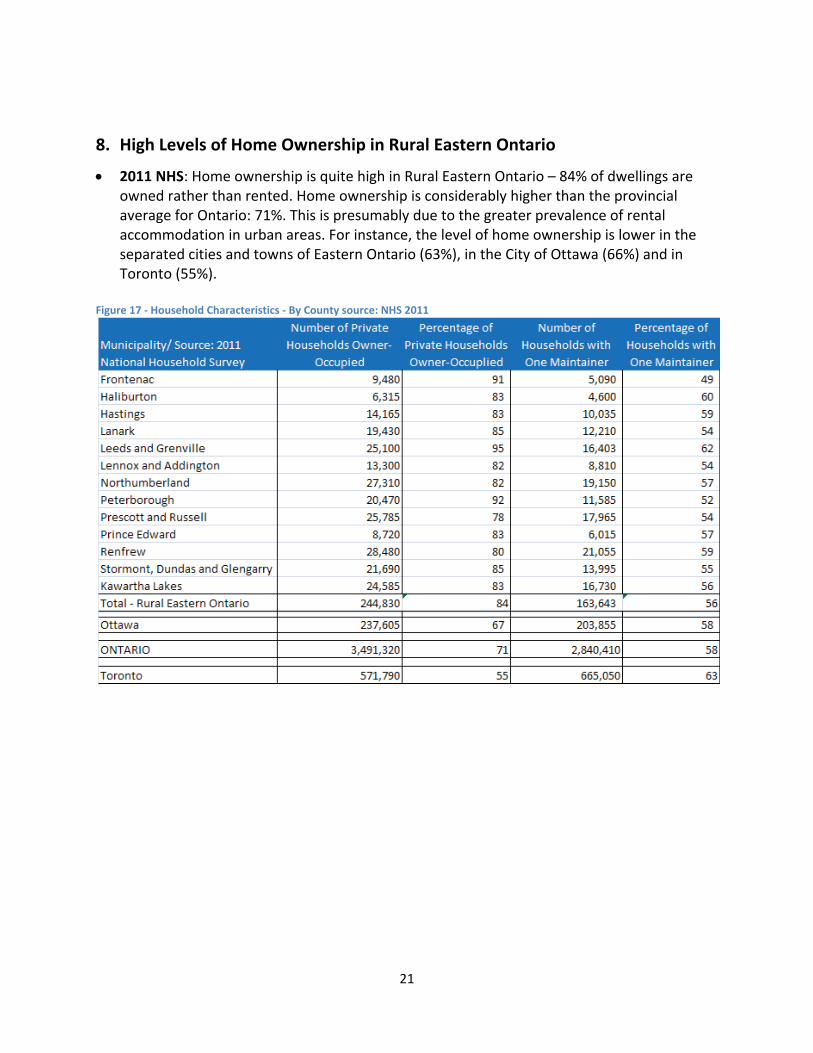
8. High Levels of Home Ownership in Rural Eastern Ontario
2011 NHS: Home ownership is quite high in Rural Eastern Ontario – 84% of dwellings areowned rather than rented. Home ownership is considerably higher than the provincialaverage for Ontario: 71%. This is presumably due to the greater prevalence of rentalaccommodation in urban areas. For instance, the level of home ownership is lower in theseparated cities and towns of Eastern Ontario (63%), in the City of Ottawa (66%) and inToronto (55%).
Figure 17 Household Characteristics By County source: NHS 2011

22
9. Value of Owned Dwellings is Significantly Lower in Rural Eastern Ontario
2011 NHS: On a county by county basis, the median value of dwellings in 2011 was lower inall cases than the provincial median value ($300,862), with the rural values ranging from$194,690 to $250,841. The regional median value for private dwellings across the entirerural landscape of Eastern Ontario is estimated to be $232,925 – more than $60,000 lessthan for Ontario as a whole ($300,862). For Ottawa, the median value is considerablyhigher ($349,151) and for Toronto, higher still ($401,400). All counties in Rural EasternOntario have a lower median value of dwellings than the provincial average.
These data do not automatically mean that rural residents will have an easier or moredifficult time affording their property taxes; municipal governments set their tax rates togenerate the revenue needed to cover their service provision costs. Rents and mortgagepayments may be slightly lower if the purchase price of a home is lower – depending onavailable down payments and interest rates. A subsequent section of this report provides amore comprehensive view of the cost of living in rural communities.
Figure 18 Median Value of Dwellings, By County compared to Ontario, Ottawa and Toronto. Source: 2011 NationalHousehold Survey
2006 Census: The average value of owned dwellings in Rural Eastern Ontario, whencalculated on a weighted average basis, was $216,173, considerably lower than for Ontarioas a whole ($297,479), Ottawa ($292,718) or Toronto ($413,574).
23
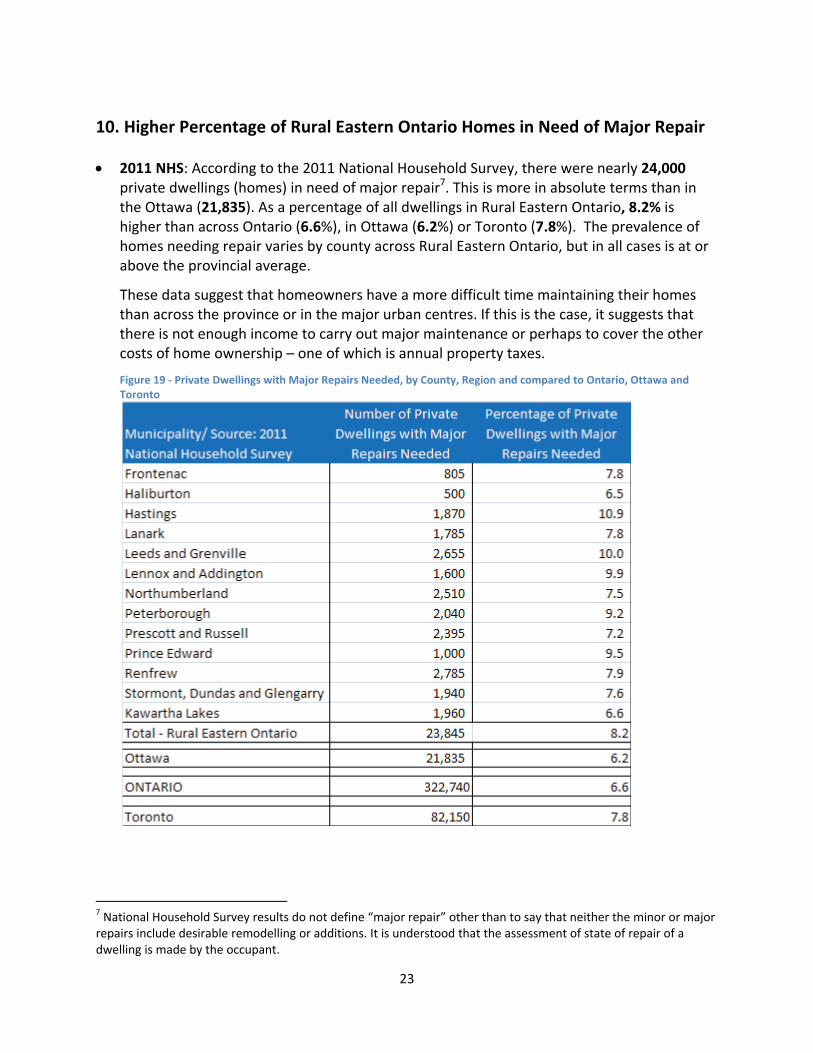
10. Higher Percentage of Rural Eastern Ontario Homes in Need of Major Repair
2011 NHS: According to the 2011 National Household Survey, there were nearly 24,000private dwellings (homes) in need of major repair7. This is more in absolute terms than inthe Ottawa (21,835). As a percentage of all dwellings in Rural Eastern Ontario, 8.2% ishigher than across Ontario (6.6%), in Ottawa (6.2%) or Toronto (7.8%). The prevalence ofhomes needing repair varies by county across Rural Eastern Ontario, but in all cases is at orabove the provincial average.
These data suggest that homeowners have a more difficult time maintaining their homesthan across the province or in the major urban centres. If this is the case, it suggests thatthere is not enough income to carry out major maintenance or perhaps to cover the othercosts of home ownership – one of which is annual property taxes.
Figure 19 Private Dwellings with Major Repairs Needed, by County, Region and compared to Ontario, Ottawa andToronto
7 National Household Survey results do not define “major repair” other than to say that neither the minor or majorrepairs include desirable remodelling or additions. It is understood that the assessment of state of repair of adwelling is made by the occupant.

24
2006 Census: The same pattern of homes in need of major repair was evident in 2006. Ofthe 277,435 private dwellings “occupied by usual residents” in Rural Eastern Ontario, 11.4%(roughly 31,500 dwellings) were described as “requiring major repair” in the 2006 Census.This percentage was considerably higher than the percentage across the province (6.6%), inOttawa (6.3%) or in Toronto (7.8%). These data suggest that even before the recession,homeowners in Rural Eastern Ontario were having greater difficulty maintaining theirhomes than across the province or in the major urban centres.
It is not clear that the need for repair is related to the age of housing stock. In fact, the datasuggests that the need for major repairs is not the result of old stock but is more likelyrelated to lower overall incomes.
Compared to the province as a whole or its urban counterparts, Rural Eastern Ontario doesnot have especially old housing: 60% of Rural Eastern Ontario’s housing stock (2006:166,465 dwellings) were constructed before 1986 (and is now more than 25 years old).Across Ontario, the percentage was 69%. In Ottawa, the percentage of older housing was67%; in Toronto, older stock is 81% of the total.
Figure 20 Percentage of Private Dwellings Constructed Before 1986 (2006 Census) Rural Eastern Ontario compared toOntario, Ottawa and Toronto

25
11. Skewed Assessment Base Puts Pressure on Residential Ratepayers
The reliance of local governments in Rural Eastern Ontario on residential assessment(rather than a strong presence of commercial, institutional and industrial assessment) hasbecome more prominent over the 2002 2011 period, rising from 85.8% to 89.1% of totalassessment (increased reliance of 3.3%). (These data are based on FIRs provided byindividual municipalities.)
In the same period, reliance on residential assessment in the separated cities and townsrose slightly from 78.0 to 78.3%. The City of Ottawa saw decreased reliance on residentialassessment, dropping from 78.4% to 77.2%. In other words, across virtually all of EasternOntario – other than Ottawa, reliance on residential assessment increased over the pastdecade.
Figure 18 Percentage of Rural Eastern Ontario Tax Base That is Residential
11.1 Regional Reliance on Residential Assessment Projected to Increase to 2020
If the reliance trend in Rural Eastern Ontario in the 2007 2011 period continues through to2020 (increasing by 0.3% a year), these municipalities will see 91.5% of their assessment beingresidential by the end of the decade. This means that an even larger share of the cost fordelivering local services will be borne by residential property owners or tenants in apartments.
By 2020, non residential assessment in Rural Eastern Ontario is projected to drop to 8.5% oftotal assessment, down from 14.2% in 2002. This would be roughly a third of the proportion ofthe separated cities and towns in Rural Eastern Ontario. Non residential assessment is expectedto virtually identical in 2020 as it was in 2011 ($8.85 billion).

26
Figure 19 Percentage of Total Assessment that is Residential
11.2 Rural Eastern Ontario More Reliant on Residential Assessment than Province as a Whole
Comparing Rural Eastern Ontario’s reliance on residential assessment to Ontario as a wholerequires use of MPAC data rather than FIRs. MPAC data for Tax Year 2012 (2011 Roll)8 wasused to compare the source of assessments on a region to province basis.
MPAC data show that:Commercial and industrial assessments combined are just 6.3% of the Rural EasternOntario’ assessment base (compared to 16% for the province as a whole).Farmland and managed forest account for 5.2% of the Rural Eastern Ontario assessmentbase (but are not fully taxable). The provincial average is 2.3%.Rural Eastern Ontario is heavily reliant on residential assessment (84.2%).
The comparative data from MPAC for Rural Eastern Ontario and the Province of Ontarioshows that across the province, 75% of total assessment is residential. Rural Eastern Ontariocan therefore be considered to be roughly 10% more reliant on residential assessmentthan the provincial average.
8 The percentage of total assessment from residential assessment is different when using 2011 FIR data as compared to 2012MPAC data. There appears to be some variation in how municipalities show assessment for particular classes in their FIRs,reflecting the proportion of certain lands that are not fully taxable. MPAC assessment data is understood to be based on theproperty valuations not taxable status.

27
Figure 20 – Distribution of Assessment by Type – Rural Eastern Ontario: Source – MPAC Data
Type of Assessment % 2011 for2012 Tax Year
Assessment($Billions)
Commercial 5.1 $ 4.72Shopping Centres and Parking Lots 0.2 $0.208Exempt 3.7 $ 3.48Farm 4.8 $ 4.45Industrial 0.9 $0.804Managed Forest 0.3 $0.234Pipeline, Railway and Utilities 0.9 $0.818Multi Residential 0.8 $0.759Residential 83.4 $ 77.9Total – All Types 100 $ 93.4

28
12. Median Shelter Costs in Rural Eastern Ontario Generally Lower
2011 NHS: The median shelter cost9 for owned dwelling across Rural Eastern Ontario10 is$865 a month, roughly $330/month less than across Ontario as a whole ($1,163/month).This is likely due to the lower value of homes in the rural areas which would reducefinancing requirements. On a county by county basis, there is considerable variability acrossthe region – from a low of $615/month to $1,110/month.
Figure 21 Median Shelter Costs, by County, compared to Ontario, Ottawa and Toronto. Source: 2011 NationalHousehold Survey
2006 Census: In 2006, the median monthly payment for owner occupied dwellings (typicallya mortgage) was $717 in Rural Eastern Ontario, considerably less than in the City of Ottawa:$1,151.
The median monthly payment for rented dwellings was $636 in Rural Eastern Ontario,considerably less than in the City of Ottawa ($849).
9 Shelter costs for owner occupied households include, where applicable, the mortgage payment, the costs ofelectricity, heat, water and other municipal services, property taxes and condominium fees. The Canadian averageshelter cost in 2011 for owned premises was $1,141.10 The regional median shelter cost for owned dwellings was calculated by using a weighted average of the sheltercosts for each county, with the weighting factor being the number of owner occupied private households.

29
13. Rural Eastern Ontario Workforce Has Longer, More Expensive Commute
2011 NHS: According to the 2011 National Household Survey, the median commuting timeto work for residents of Rural Eastern Ontario ranges from 16 minutes to 30 minutesdepending on location. These results cluster around the provincial average (21 minutes).When a regional median commutingtime is calculated, the regionalaverage tracks both the provincialaverage and the median commute forOttawa quite closely.
However, all jurisdictions in RuralEastern Ontario have longer mediancommuting times than their nearesturban counterparts (see examples inchart below) and do not have accessto public transit for most, if not all, oftheir commuting distance. In otherwords, rural residents are likely to becommuting longer and at greater costthan their urban counterparts.
Typically rural workers use their onlyavailable means of transportationthe automobile and are incurringadditional costs to do so. There issome reason to think the voluntaryNHS underestimates commuting time,distance and associated costs for ruralworkers. Low response rates in many rural municipalities – especially those further fromurban centres – leads to data suppression and under representation of workers in many ofthe smallest, most rural municipalities.
Jurisdiction Median Commuting TimeRural Area (minutes)
Median Commuting TimeUrban Area (minutes)
Frontenac 25.8 – South Frontenac40.1 – Frontenac Islands
15.5 Kingston
Hastings 25.1 – Tyendinaga25.5 – Centre Hastings25.6 – Stirling Rawdon and Tweed
15.1 – Belleville15.8 – Quinte West
Lanark 21.9 – Lanark 12.5 – Smiths FallsLeeds and Grenville 23.2 – Leeds and Grenville 10.7 – Brockville
15.6 GananoquePeterborough 16.7 Peterborough 15.1 – Peterborough (City)Renfrew 16.4 – Renfrew County 10.8 PembrokeStormont, Dundas andGlengarry
18.7 – Stormont, Dundas andGlengarry
10.8 Cornwall
Figure 22 Median commuting time Rural Eastern Ontariocompared to Ontario, Ottawa and Toronto
30
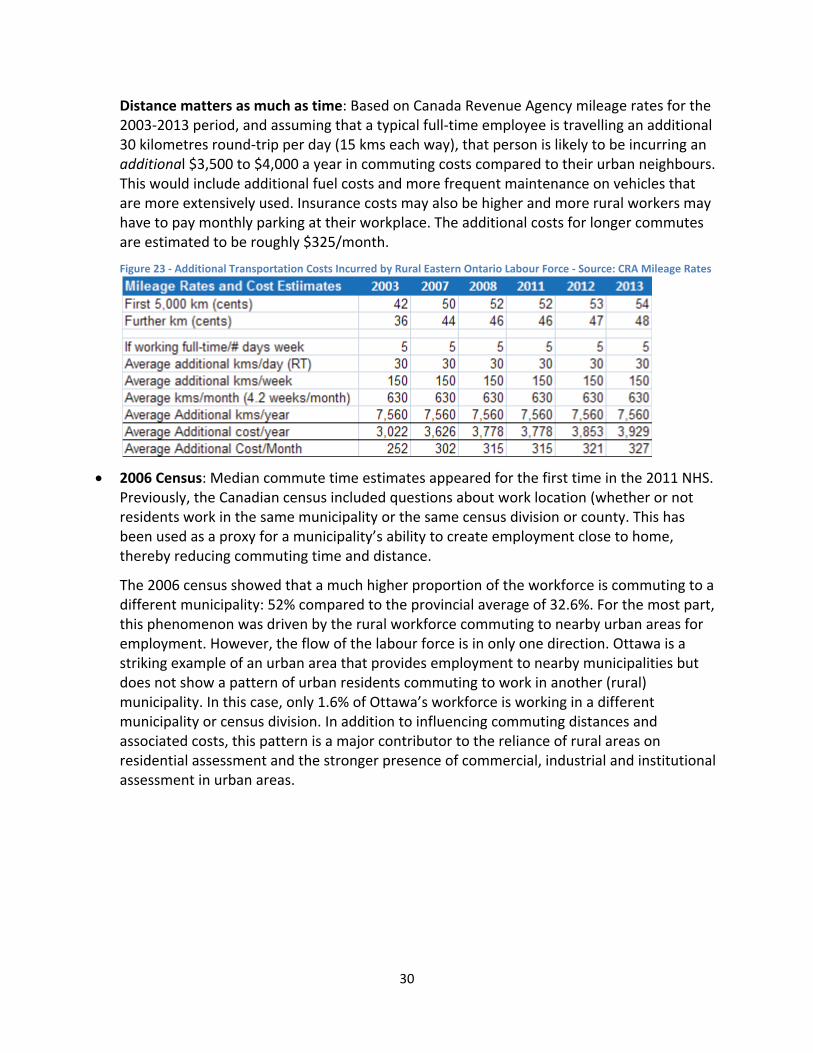
Distance matters as much as time: Based on Canada Revenue Agency mileage rates for the2003 2013 period, and assuming that a typical full time employee is travelling an additional30 kilometres round trip per day (15 kms each way), that person is likely to be incurring anadditional $3,500 to $4,000 a year in commuting costs compared to their urban neighbours.This would include additional fuel costs and more frequent maintenance on vehicles thatare more extensively used. Insurance costs may also be higher and more rural workers mayhave to pay monthly parking at their workplace. The additional costs for longer commutesare estimated to be roughly $325/month.
Figure 23 Additional Transportation Costs Incurred by Rural Eastern Ontario Labour Force Source: CRA Mileage Rates
2006 Census: Median commute time estimates appeared for the first time in the 2011 NHS.Previously, the Canadian census included questions about work location (whether or notresidents work in the same municipality or the same census division or county. This hasbeen used as a proxy for a municipality’s ability to create employment close to home,thereby reducing commuting time and distance.
The 2006 census showed that a much higher proportion of the workforce is commuting to adifferent municipality: 52% compared to the provincial average of 32.6%. For the most part,this phenomenon was driven by the rural workforce commuting to nearby urban areas foremployment. However, the flow of the labour force is in only one direction. Ottawa is astriking example of an urban area that provides employment to nearby municipalities butdoes not show a pattern of urban residents commuting to work in another (rural)municipality. In this case, only 1.6% of Ottawa’s workforce is working in a differentmunicipality or census division. In addition to influencing commuting distances andassociated costs, this pattern is a major contributor to the reliance of rural areas onresidential assessment and the stronger presence of commercial, industrial and institutionalassessment in urban areas.

FigureOntario
24 – Percentageo and Ottawa; S
e of Labour ForcSource: 2006 Ce
ce Working Outsnsus
31
side Home Munnicipality, by Subb Region and Coounty, Compared to

32
14.RuralEasternOntario
ResidentsLess
Likelyto
Have
PostSecondary
Education
NHS2011:RuralEastern
Ontario’s
totalcoreworkforce
agedpopulation
(2564
years)was
388,830in2011.Ifaccurate,itw
ouldsuggestthatthe
agingpopulation
combined
with
outmigration
ofyouthand
tosom
eextent,m
igrationofsom
emem
bersofthe
labourforce
toWestern
Canada,isconstraining
labourforce
growth:the
corelabour
forcenow
accountsfor
55%oftotal
population.In2006,the
percentagewas
57%.H
owever,given
that22of93
municipalities
within
the13
ruralcounty/singletier
regionhad
datasuppression
appliedto
theirresults
dueto
lowresponse
rates,itisnotclear
if thereisawaning
representationofthe
corelabour
forceinRuralEastern
Ontario.W
hatisclear
isthateducations
levelsare
lower
overallinRuralEastern
Ontario
thanthey
areineither
Ontario
asawhole
orineither
Ottaw
aor
Toronto.
RuralEasternOntario
hasasm
allerproportion
ofitscore
labourforce
inpossession
ofcollegeor
universityeducation
(46.6%)
thanthe
provinceas
awhole
(57.0%)or
eitherofO
ttawa(69.2%
)orToronto
(63.7%).
RuralEasternOntario
ismore
likelyto
haveaskilled
tradeseducated
workforce
(11.0%)than
theprovince
asawhole
(7.8%)or
hasdouble
thestrength
ofthistype
ofworkforce
ofeitherofO
ttawa(5.5%
)orToronto
(5.2%).In
fact,RuralEasternOntario
hasalargerabsolute
number
ofthesetypes
ofworkers
(roughly42,000)than
Ottaw
a(27,000).
RuralEasternOntario
isless
likelyto
haveauniversity
educatedworkforce
(16.0%)than
theprovince
asawhole
(28.9%)or
eitherofO
ttawa(42.8%
)orToronto
(40.3%)
Figure25
EducationalAttainm
entRuralEastern
Ontario
compared
toOntario,O
ttawaand
Toronto
Thesedata
suggestthatwithoutsignificantattention
toeducation
andtraining
forthe
rurallabourforce,itw
illbedifficultfor
RuralEasternOntario
toclose
theearnings
andincom
esgap
describedearlier
inthis
White
Paper.Further,thelow
erlevels
ofearnings
andincom
es,combined
with
additionaltransportationcosts
fortravelling
toexisting
postsecondary
educationclasses
inperson,suggestthatruralresidents
areless
likelyto
beable
toafford
traditionalformsofhigher
education.

33
Figure
26Ru
ralEastern
Ontariocompa
redto
Ontario,O
ttaw
aan
dTo
ronto
ByCo
unty
Source:201
1Nationa
lHou
seho
ldSurvey
2006
Census:B
ased
on2006
census
data,residen
tsof
RuralEastern
Ontariohave
lower
overalllevelsof
educationalattainm
ent
(perhaps
inpartdu
eto
theslightlyolde
rpo
pulatio
nwho
may
noth
avehadtheop
portun
ityforpo
stsecond
aryed
ucation).A
t38.3%,the
prop
ortio
nof
ruralresiden
tswith
either
college
orun
iversity
educationwas
slightlylessthan
reside
ntsof
the
separatedcitie
sandtowns
(41.6%
)and
wellund
erthat
oftheCity
ofOttaw
a(65.7%
).
Whe
ntrades
educationisadde
din,ruralreside
ntsstilllagged
theircoun
terpartsintheseparatedcitie
sandtowns
(48.9%
comparedto
51.8%)w
iththeCity
ofOttaw
ahaving
avery
high
rate
ofanyof
thesetype
sof
education:
71.6%.
Reside
ntsof
RuralEastern
Ontarioweremorelikelythan
thoseof
theCity
ofOttaw
ato
have
acollege
certificate
ordiplom
a(21.1%
);reside
ntsof
separatedcitie
sandtowns
werethemostlikelyto
have
thistype
ofed
ucation(24.4%
).
Comparedto
theprovince
asawho
le,R
uralEasternOntarioreside
ntsweremorelikelyto
have
acollege
certificate
ordiplom
athan
theprovince
asawho
le(23.5%
comparedto
22.0%)b
utlesslikelyto
have
anyform
ofun
iversity
education(com
bine
d14.8%comparedto
31.7%).

34
Thesevariations
ineducationalattainm
entmay
bedue,atleastin
part,tothe
slightlyolder
populationinthe
ruralareas(see
earliersectionofthis
report)orto
theexodus
ofyoungpeople
fromtheir
homecom
munities
when
theydecide
toseek
furthereducation
(forthe
mostpart,post
secondaryeducation
institutionsare
locatedincities
andtow
ns).Regardlessofthe
reason(s),low
erlevels
ofeducationare
likelyto
limitruralresidents’ability
tosecure
relativelyhigh
payingem
ployment.This
employm
entlim
itationmay
thereforereduce
thepopulation’s
annualincomes
andtherefore
theirability
topay
propertytaxes
sufficienttopay
forvitalpublic
services(see
earliersectionofthis
report).
Figure27
EducationalAttainm
entbySub
RegionRuralEastern
Ontario
compared
toOntario,O
ttawaand
TorontoSource:2006
Census

FFigure
28Ed
ucationna
lAttainm
ent
ByCCo
unty,Sou
rce:20066
Census
35

36
15. Taking Action on Ratepayer Affordability
Keeping municipal government affordable for local ratepayers will require local governments tochange the trajectory of both service delivery costs and the revenues available to pay for theseservices (see EOWCWhite Paper on Municipal Affordability). Local governments will also needto become more proactive in supporting the efforts of their own ratepayers to improve theeconomic circumstances of the region, its households and businesses. This White Papercontains information which will help to guide the forthcoming regional economic developmentstrategy project being undertaken by the EOWC in partnership with other regional stakeholdergroups. The following recommendations cover some actions that local governments might takeon their own or through the EOWC, as well as those which might be undertaken in partnershipwith upper levels of government.
Recommendations for EOWC and Constituent Municipalities:
E 1: It is proposed that the EOWC continue to actively support the development of a regionwide economic development strategy with the long term objective of stimulating growth aswell as jobs across the region, which will in turn stimulate growth in the region’s property taxbase. The ultimate goal is to increase total assessment as well as the proportion of assessmentfrom industrial, commercial and institutional operations. (This same recommendation is foundin theMunicipal Affordability White Paper).
E 2: It is proposed that the EOWC continue to work with the provincial and federalgovernments to build awareness and utilization of the provincial (permanent) Eastern OntarioDevelopment Fund (EODF) and programs of FedDev across the region. In particular, the EOWCwill a) encourage utilization of the EODF Small Community/Pilot funding stream for businessesthat fall below the 10 employee minimum threshold, and b) suggest opportunities to FedDevfor funding regional initiatives designed to stimulate private sector economic activity acrossRural Eastern Ontario.
E 3: It is proposed that the EOWC continue to encourage EORN to investigate and provideleadership to deployment of new, internet based technologies by small and medium sizedbusinesses including but not limited to agriculture, forestry, manufacturing and fabrication,construction, information communications technology (ICT), transportation & logistics, healthcare, education, and tourism. Increased utilization of the regional broadband network forbusiness purposes is expected to expand markets, increase private sector economic activity,create jobs, and ultimately, increase non residential assessment.
E 4: It is proposed that the EOWC actively support the development of an integrated regionaltransportation and (non traditional) transit system in Rural Eastern Ontario to increase accessto markets in and outside the region, as well as improving cost effectiveness of workforcecommutes in and out of the region. Enabling the workforce to get back and forth to work in acost effective way is expected to increase employment and related earnings.

37
E 5: It is proposed that the EOWC actively support the development of in region and distanceeducation and training opportunities to enhance the education and skill levels of the region’spopulation and workforce, thereby enhancing the ability of local residents to find employmentand increase earnings.
E 6: It is proposed that the EOWC advocate for reinstatement of the federal Home RenovationTax Credit – especially for energy efficiency, and the continuation and extension of theprovincial Home Renovation Tax Credit for seniors and family members living with them. It isfurther recommended that these tax credits be focused on low income owner occupiedhouseholds.
E 7: It is proposed that the EOWC actively support the development of a regional youthretention and re attraction strategy through which to increase the overall size of the labourforce in Rural Eastern Ontario and contribute to succession planning for local enterprises.
E 8: It is proposed that the EOWC advocate for additional financial support for affordablehousing initiatives that would reduce the need for residents to move to urban areas for thesetypes of accommodations.
Recommendations for the Province of Ontario:
U 1: It is proposed that the Province of Ontario provide Eastern Ontario municipalities thathave significant Crown lands or other lands with assessment constraints (e.g. managed forests,farmland, aggregate sites etc.) in their jurisdictions with compensation reflecting theseproperty based limitations. The compensation could be a Payment in Lieu or an annual share ofrevenues accruing to the Province from these lands (e.g. royalties from stumpage fees). Thiscompensation would be in recognition of the service provided by municipalities in building andmaintaining roads and bridges, and providing emergency services for these tax exempt lands.[This same recommendation is found in theMunicipal Affordability White Paper]
U 2: It is proposed that the EOWC continue to work cooperatively with provincial and federalauthorities to obtain an agreement related to the Algonquin land claim. Once an agreement isin place, it is proposed that the EOWC work collaboratively within the Algonquin Nation toidentify and pursue opportunities for economic development benefiting the Algonquins and theregion as a whole. [This same recommendation is found in theMunicipal Affordability WhitePaper].
U 3: It is proposed that the EOWC encourage and support the Province of Ontario in itscontinued efforts to contain the growth in program and service delivery costs, including thosethat are mandated to municipal government (examples: policing costs). It is further proposedthat the EOWC encourage the Province to engage municipalities and the EOWC in processeswhich will affect services mandated to municipal government.

38
U 4: It is proposed that the EOWC work with AMO and the Province of Ontario to develop astrategy which would allow and encourage local governments to introduce non tax basedrevenue generating measures to make their municipalities more financially sustainable. Thefirst priority could be an examination of ways to leverage existing municipal assets to providenew revenue streams (examples: outstanding POA monies; per ton charge for aggregates).[This same recommendation is found in theMunicipal Affordability White Paper].
U 5: It is proposed that the Province of Ontario broaden its commitment to work withmunicipalities on renewable energy development to include determination of appropriateproperty tax rates for all types of renewable energy, not just wind turbine towers. This is anessential companion to the proposed changes to the Feed in Tariff (FIT Program) which areintended to engage municipalities and Aboriginal communities in location and siting decisions,and providing new energy related economic development and revenue opportunities formunicipalities and public sector entities. [This same recommendation is found in theMunicipalAffordability White Paper].
U 6: It is proposed that the EOWC work with AMO and the Province of Ontario to determine ifthere are alternative, cost effective ways to deliver services at the local level, and seekopportunities for pilot programs through which these alternatives might be tested on a costshared basis in Rural Eastern Ontario. [This same recommendation is found in theMunicipalAffordability White Paper].