eosc252 exercise 8 - university of british columbia · eosc252 exercise 8 capstone exercise 1....
TRANSCRIPT

EOSC252 Exercise 8 Capstone Exercise
1. Learning goals for this exercise
• Compare the geophysical properties of your lab sample to those of a similar rock measured with well logging instruments.
• Use two sets of values to predict abilities to differentiate between the two rock types using borehole measurements.
• Identify parameters needed for estimating useful properties of this oil/gas reservoir.
2. Background
This exercise involves using all the parameters you have measured for your sample to predict geophysical responses and make recommendations about whether measurement methods will provide useful geological information. Parameters for your sample that you have measured or calculated include porosity, φ, resistivity ρ as a function of water saturation, the n exponent in Archie’s law, density d, wet & dry velocities and elastic moduli, Vp, Vs, κ, and μ. Models you have used include relations for density as a function of water saturation, resistivity as a function of porosity and water saturation, and velocity in terms of elastic moduli. You have also used some other models to estimate maximum or minimum bounds on values. Finally, you have learned about (but not experienced in the lab) surface phenomena and flow in capillaries, and dielectric properties which affect EM signals differently depending on their frequency. Many of these physical properties and models will be relevant in this exercise.
The figure below shows two adjacent boreholes in an oil and gas reservoir. Your boss wants to determine which physical property will most easily distinguish between these two situations.
Figure 1. Simple sketch, not to scale, of geology in the two boreholes. Well log data were recorded within the left borehole. We will see that the sandstone (SSlog) contains water, oil & gas. The borehole to the right penetrated a squency in which your lab sandstone (SSlab) is interposed between the shale zone and sandstone.
Many parameters for your sample (SSlab) were measured in the lab, and corresponding properties for the in-situ sandstone (SSlog) will be obtained from the well logs. A few parameters will need to be calculated, for example, resistivity of your sandstone when it was saturated with formation water.
SandstoneSSlog
Shale951 m
981 m
borehole
SandstoneSSlog
SandstoneSSlab
Shale
borehole

3. Procedure 1. In the lab, the instructor will introduce the well logs, and maybe show full length examples.
2. Practice using resistivity well logs (we will not worry about data in the left hand panel) .
a. This hole was drilled to what depth? __________________
b. Total number measurement types plotted on this log: ___________________
c. Resistivity is plotted using a scale going from a minimum of ________to a maximum of
____________, in units of _________________
d. The smallest value of resistivity actually recorded on this log is ______________
e. The maximum value of resistivity actually recorded is ______________
f. The portion in the SSlog sandstone which appears to have two values of low resistivity
is from __________m. to __________m. depth. This is the “water zone”.
g. The widest separation between these two resistivities is ______________ in units of _______ (The LLA measurement involves a small volume close to the borehole. The ILM and ILD measurements involve “medium” and “deep” (ie large) volumes of the formation adjacent to the borehole, respectively. The LLA is more resistive because drilling mud has invaded a few centimeters into the rock, replacing the more conductive brine which normally occupies the pore space at this location.)
h. If the gas zone is the zone of greatest resistivity, what is the depth range for gas in this
sandstone formation? ___________ m. to ___________ m.
i. What feature of the lots did you use to decide on top and bottom depths of this zone?
____________________________________________________________________
3. Practice using porosity well logs.
a. Based on depth in Figure 1, what is the gamma ray (GR) data doing at the shale-sand interface? __________________________________. (This shows that shale is slightly more “radioactive” than sandstone, which is very useful for distinguishing between shales and sandstones in these types of geological sequences.)
b. Little pip-marks on the left edge of the column containing depth values are 1 minute
markers. How fast is this set of instruments travelling up the borehole?
______________ m. per hour.
c. Porosity is plotted using a scale going from a minimum of ________to a maximum of
____________, in units of _____________ (This may seem a bit odd – ask why).
d. For most of the sandstone zone, what is an average separation between the density
(CDL) and neutron (CNS) log porosity values? ____________ (again – ask why).
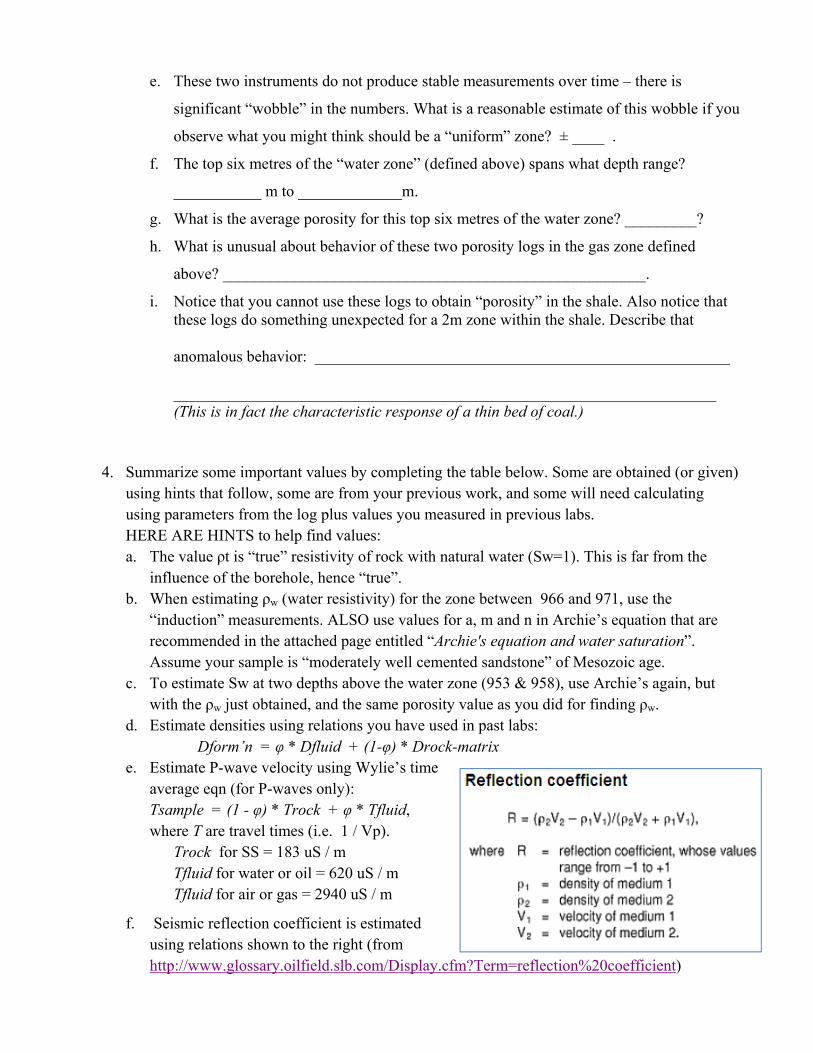
e. These two instruments do not produce stable measurements over time – there is
significant “wobble” in the numbers. What is a reasonable estimate of this wobble if you
observe what you might think should be a “uniform” zone? ± ____ .
f. The top six metres of the “water zone” (defined above) spans what depth range?
___________ m to _____________m.
g. What is the average porosity for this top six metres of the water zone? _________?
h. What is unusual about behavior of these two porosity logs in the gas zone defined
above? _____________________________________________________.
i. Notice that you cannot use these logs to obtain “porosity” in the shale. Also notice that these logs do something unexpected for a 2m zone within the shale. Describe that anomalous behavior: ____________________________________________________ ____________________________________________________________________ (This is in fact the characteristic response of a thin bed of coal.)
4. Summarize some important values by completing the table below. Some are obtained (or given) using hints that follow, some are from your previous work, and some will need calculating using parameters from the log plus values you measured in previous labs. HERE ARE HINTS to help find values: a. The value ρt is “true” resistivity of rock with natural water (Sw=1). This is far from the
influence of the borehole, hence “true”. b. When estimating ρw (water resistivity) for the zone between 966 and 971, use the
“induction” measurements. ALSO use values for a, m and n in Archie’s equation that are recommended in the attached page entitled “Archie's equation and water saturation”. Assume your sample is “moderately well cemented sandstone” of Mesozoic age.
c. To estimate Sw at two depths above the water zone (953 & 958), use Archie’s again, but with the ρw just obtained, and the same porosity value as you did for finding ρw.
d. Estimate densities using relations you have used in past labs: Dform’n = φ * Dfluid + (1-φ) * Drock-matrix
e. Estimate P-wave velocity using Wylie’s time average eqn (for P-waves only): Tsample = (1 - φ) * Trock + φ * Tfluid, where T are travel times (i.e. 1 / Vp).
Trock for SS = 183 uS / m Tfluid for water or oil = 620 uS / m Tfluid for air or gas = 2940 uS / m
f. Seismic reflection coefficient is estimated using relations shown to the right (from http://www.glossary.oilfield.slb.com/Display.cfm?Term=reflection%20coefficient)

Table of values. PLEASE SHOW CALCULATIONS ON THE BACK OF THIS SHEET. # parameter SSlog SSlab 1 porosity φ
between 966m and 971m
2 ρt, (Sw=1). (HINT a) between 966m and 971m
3 ρw (well water) (HINT b) between 966m and 971m
As per SSlog
4 ρt at 953m
5 ρt at 958m
6 Sw at 953m (HINT c) Not applicable
7 Sw at 958m
Not applicable
8 rock matrix (grain) density 2680 kg/m3 Not applicable
9 fluid density 1000 kg/m3 Not applicable
10 Density of shale 2550 kg/m3 Not applicable
11 formation density (oil or saturated) (HINT d)
12 formation density (Gas saturated)
13 Vp oil or water saturated (HINT e)
14 Vp gas saturated
15 Vs water saturated
Not possible with data available
16 Shale P-velocity 4350 m/s Not applicable
17 Seismic refl’n coefficient R: shale to SSlog (oil saturated) (HINT f)
Not applicable
18 Seismic refl’n coefficient R: SSlog to SSlab (oil or saturated)
19 Seismic refl’n coefficient R: SSlog (gas) to SSlog(oil)
Not applicable

Any calculations needed for completing the Table of Values.
5. As mentioned above, your project manager wants answers to the following questions. Answer very briefly on a separate sheet or by attaching a printout of typed responses, with numbers (mainly from the table above) or simple sentences to “prove” your point.
a) Will density measurements detect a difference between SSlog and SSlab if the measurement sensitivity is ±100 kg/m3?
b) Will we detect the difference between fully water saturated SSlog and SSlab formations using a resistivity log?
c) Will we detect the difference between oil or gas saturated SSlog and SSlab formations using a resistivity log?
d) Will we see seismic reflections off the shale-SSlog boundary? ( |R| must be > 0.05).
e) Will we see seismic reflections off a SSlab-SSlog boundary? ( |R| must be > 0.05).
f) Will we see seismic reflections off the oil-gas boundary in the SSlog formation?
g) Will GPR operating at a frequency of 0.5 GHz (5.0 x 10⁸ Hertz) yield information from up to 0.25m from the borehole’s edge within the water saturated zone? You will need to make use of
the concept of skin depth, introduced in lectures. Skin depth for EM signals is where,
assuming materials are non-magnetic, μ is the permeability of free space (4π×10−7). Skin depth δ is the depth at which signals have been reduced (i.e. energy has been absorbed) until amplitude is 1/e of the original amplitude at the surface. Assume your instrument is unlikely to detect echoes from features that are deeper than roughly 2 skin depth distances into the formation
h) Same question, but within the oil saturated zone?
i) PREAMBLE: “Shallow” and “deep” resistivities in the water zone are separated because drilling fluid (mud) has been squeezed into the formation by the weight of the mud in the drill hole, and resistivity of mud is higher than resistivity of formation water. The mud is necessary to lubricate the drilling bit, carry cuttings away, and keep borehole pressures greater than formation pressures. THE QUESTIONS:
i. The project manager wants to estimate how far mud will have penetrated the formation in the several hours between drilling through the formation and making the measurements. What mud and formation parameters would be needed to estimate the rock formation’s permeability AND the distance mud has imbibed during that time? No calculations, just a list of needed parameters (you will need to check notes from the first units of the course).
ii. Propose a laboratory experiment to actually measure permeability of your SSlab sample? Just outline in a few sentences what you would do and what you would plan to measure. We don’t need the details of how to actually make the measurements.

The borehole environment
The deep open-hole logging environment
What are the affects of drilling on the formations being studied? Here are a few brief comments to introduce issues about the borehole environment that affectinterpretation of well log data. See the figure below for terminology.
The drilling process requires that a carefully designed mud be circulated down the drilling string (pipes that drive the bit), out of holes in the drilling bit and back up the"annulus" or the space between the drilling pipe and borehole wall. The mud can be based on an oil, or water, or air, and it is needed for several reasons:
Chips cut by the bit must be carried away.1.The bit must be lubricated.2.The hydraulic potential within the hole must be greater than formation pressures to prevent blowouts. Therefore, the mud usually includes barite (a heavymineral). However, pressures in formation are not always predictable, hence occasional blowouts.
3.
Because the mud (which is composed of a fluid with several minerals dissolved or in suspension) is heavy, the pressure in the borehole usually will be greater than theformation pressure at any given depth. When this is the case, the liquid portion of mud (mud filtrate) is squeezed into permeable formations. This is called "invasion."The solid components of the mud (mud cake) will then be left behind as a coating on the borehole wall. When thick enough, this coating or mud cake is impermeable andstops further invasion.
The mud usually has a different salinity from that of natural waters in the formation. When this is the case, a spontanious potential can be measured. See the page onpassive tools.
The diagram shows parameters that affect measurements. They are all important at some point in the interpretation exercise, and in fact, invasion can help determinesuch parameters as oil movability.
Adapted from the Tucker Wireline Services Chart book, "General" chapter, borehole environment page.
Another effect of continuously circulating mud through the borehole is that clays and shales tend to sluff off in flowing mud, causing cavities in the borehole's walls, andoccasional blockages.
Above the water table
When working above the water table (relevant for geotechnical boreholes), variations in rock type, weather cycles and geological setting dominate resulting measuredgeophysical parameters. Note that physical properties change rapidly near the water table. Also, changes in weathering and mineralogy associated with short and longterm changes in water table elevation must be considered, especially for electrical induction and nuclear measurements. Finally, some measurements (especiallyresistivity logs that require current to flow) require conductive fluid, and hence, are not usable above the water table.
F. Jones, UBC Earth and Ocean Sciences, 06/06/2007 15:18:31

Archie's equation and water saturation
G.E. Archie's work relating permeability to porosity resulted in empirical relationships between resistivities, fluid types and porosity. In undisturbedformations, Archie's (empirical) law states that the ratio of formation resistivity to connate water resistivity (Ro/Rw) is constant. That is F = Ro/Rw (eqn 1)where:
F is called the formation factor,Ro is bulk resistivity if pore space is filled 100% with brine (connate water),Rw is resistivity of the connate water itself. This relation applies best for clean (clay free) rocks of constant porosity when Rw < 1 Ohm-m, at25C.
This is useful, except that Ro is not really measurable in the field. But the relation can be made useful because Archie also found that this resistivityratio (i.e. F) changes consistently as porosity changes.
Formation factor and porosity are usually related via F = a/ m (eqn 2)
where is porosity, expressed as a percent (a value between 0 and 1).
a is a constant between 0.6 and 1.5. It is often left at 1.m is the cementation exponent and is usually 1.5-1.8 in sandstones and 2.0 inlimestones, dolomites and tight consolidated sandstones.One example of a particular version is F = 0.62/ 2.15 ( the so-called "Humble
relation," suitable for many granular rocks).The table to the right contains commonly used values for Archie's equationparameters.
An alternative relation is:F = 1/ (1.87+0.019/ ) (The Shell relation, best used for low-porosity
carbonates)
Finally, water saturation (SW) and formation resistivity were also found to be related. Watersaturation is the percentage of the pore space filled with water, which is, of course, importantwhen evaluating a potential hydrocarbon reservoir. Sw = 1 means all fluids are water, andSw = 0.1 means 10% of fluids are water, implying 90% are non-conductive or oil/gas. The
relation is SW = (R0/RT)1/n (eqn 3) where
n is a saturation exponent, usually close to 2.0. (n is not porosity in this relation)Ro = rock resistivity with 100% brine for fluidRT = true resistivity (with hydrocarbons and water in pore space).
Now the Archie equation relating quantities of interest to measurable quantities can be derived based upon eqns 1, 2, and 3:Sw = (FRW/RT)1/n (eqn 4)
This relation is commonly used for oil/gas reservoir characterization. Three parameters must be measured: (i) porosity, (ii) resistivity of the
undisturbed formation, and (iii) resistivity of connate water. Symbols are , Rt and Rw, respectively. Rw can be obtained from:
Water catalogues of the area you're working in;Laboratory analysis of samples extracted from the formation rocks;Obtainable from the spontaneous potential or SP log;"Apparent" water resistivity from Rt = F*Rwa when Sw = 1, e.g. in "clean water sands;"By relating invaded & uninvaded resistivity in clean zones;From resistivity-porosity crossplots;From Rwa-SP crossplots.
Rt is true resistivity of undisturbed formation. Of course, drilling disturbs the formation, so choosing the right tool and interpreting various resistivitiesis important. Methods must account for borehole environment, invasion, effects of adjacent beds, and technical aspects of tools themselves.
In the oil/gas context, porosity, , is obtained from the porosity well logging tools, or possibly from resistivity, where Sw is known to be 100%.
Porosity logging tools are also used in hydrogeology and engineering situations, though this is not routine as in the oil/gas industry.
F. Jones, UBC Earth and Ocean Sciences, 03/22/2010 13:53:28F. Jones, UBC Earth and Ocean Sciences, 06/06/2007 15:18:44© UBC Earth and Ocean Sciences, F. Jones. Monday, November 29, 2004 11:54:46© UBC Earthand Ocean Sciences, F. Jones. Wednesday, November 24, 2004 20:11:26
Using Archie's equation 1 of 1
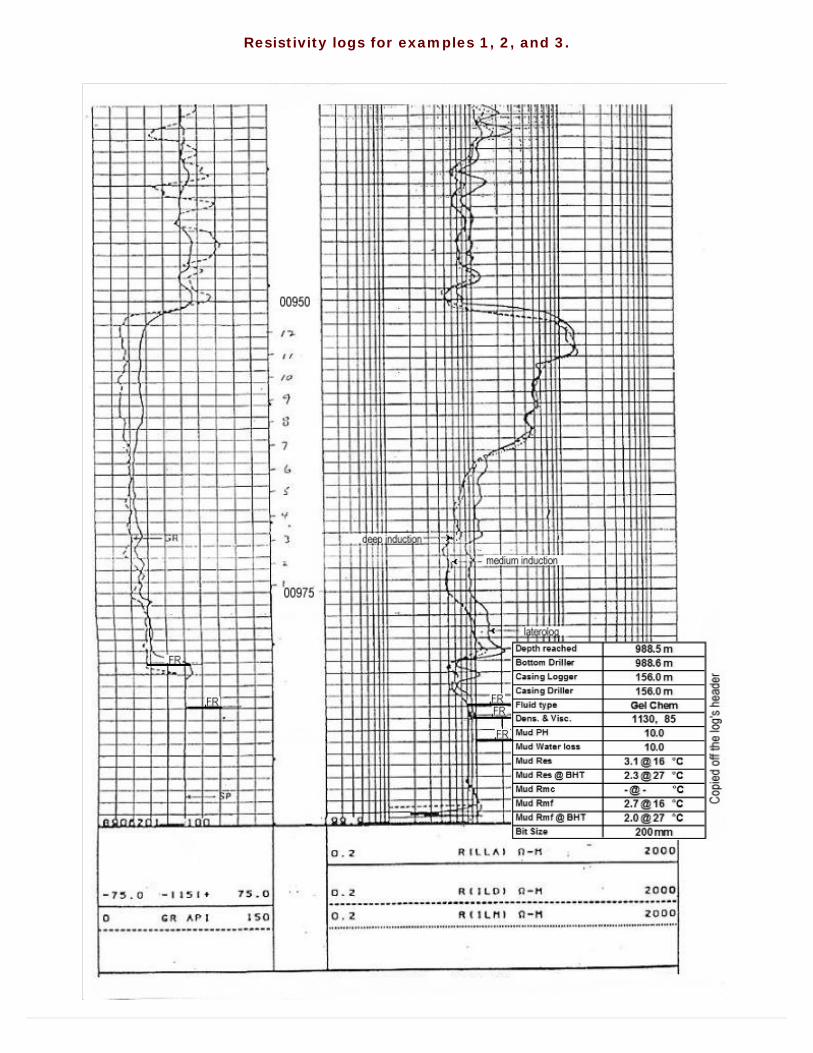
Resistivity logs for examples 1, 2, and 3.

Porosity logs for examples 1, 2, and 3.