e.on’s european distribution business – powering the …€¦ · · 2018-05-12e.on’s...
TRANSCRIPT

E.ON’s European distribution business –Powering the energy system transformation
30 January 2014

Agenda
2
Back-up
E.ON’s European distribution business
Sweden
Germany

Business overview
Well diversified portfolio of regulated network assets
Map of E.ON’s distribution networks
Gas networks
Power networks
Regional Unit
Network length(‘000 km)
Market share(in %)
Power Gas Power Gas
Germany 352 59 19 14
Sweden 134 2 24 60
Hungary 84 18 50 20
Romania 79 20 17 49
Czech R. 65 4 27 6
Slovakia 37 - 40 -
Spain 32 - 5 -
Growth platform Turkey
Enerjisa owns three distribution companies in Turkey (Ayedas, Baskent, Toroslar)
Combined network length: ~200,000km
~9m customers
S D
Overview
3

European downstream businessOther units
Distribution in E.ON group context
European regional units with several activities: Distribution: ~17m network customers Sales: ~24m customers Distributed energy, heat and innovative energy
solutions
Distribution~72%
Position within group context
Expected 2013Group EBITDA €9.2 to 9.3bn
Distributed energy& others
Sales~17%
Expected 2013 Distribution EBITDA by region
~€3.2 to 3.4bn
Germany
Sweden
CEE
Southern Europe
Germany and Sweden biggest contributors CEE countries taken together also with sizeable
contribution
Distribution businesses are one of the key pillars of E.ON’s group earnings
~11%
S D
Overview
4

Business environment and strategic priorities
Business environment
Contribute to fair regulatory frameworks
Improving regulatory environment in most countries, further enhancements necessary
Growing public perception of networks as decisive enabler for energy system transformation
Increasing investment needs
Increasing deployment of smart technologies
Continuously deliver and improve top performance
Deliver top performance as basis for good relations with customers and regulators
Strive to be #1 in the constant competition with any DSO in our markets
Maintain disciplined investment approach while keeping balance with long-term network needs
Enhance our leading capabilities by deploying smart grid technologies
Distribution is as performance driven as any other business
Ensure sustainable conditions for new replacement, enhancement, expansion and smart technology investments
Ensure appropriate returns for existing assets and operations
5
S D
Overview

6
Networks are enablers for new energy systems
Pay-off from knowledge exchange
E.ON’s expected total capexfor renewables integration
Cross-regional synergies: smart metering
400
300
200
100
02016E2015E2014E2013E2012A
Today‘s 30GW of connected renewables capacity in E.ON networks to double by 2025
in € millions Regionalunit
Number of smart meters
(in millions)
Roll-outperiod
1.0 2006-09
0.7 2010-14
8.3 2012-21
0.2 2014-24
1.4 2014-22
1.2 2015-24
6.6 2016-21
1.5 2023-29
20.9
S D
Overview

7
Distribution capex plan
Energy system transformation as organic growth opportunity
Roughly 50% of expected total distribution capex is allocated to grow the networks
Total capex needs are expected to rise further beyond 2016
0.0
0.5
1.0
1.5
2014E 2015E 2016E
Regulatory depreciation Capex
Expected distribution capex vs.regulatory depreciation
Expected distribution capex by category
Ø p.a. 2014–16: €1.5bn
Capex above regulatory depreciation for the coming years growth of regulatory asset base
Significant and growing share of total E.ON group capex
Tota
l
Cus
tom
erco
nnec
tions
Oth
er m
anda
tory
inve
stm
ents
Inte
grat
ion
of
rene
wab
les
Smar
t met
ers
Mai
nten
ance
&re
plac
emen
t
S D
Overview

Contribution to group portfolio
Key pillar of E.ON’s portfolio beyond financials
Free cash flow generationEa
rnin
gs p
rosp
ects
+--
+
NetworksE&P
Fossil
Rus-sia
ECR*
Sales
Hydro
Nuclear
EGC*
DE*
BrazilTurkey
Bubble sizes representsEBITDA contribution
* ECR = E.ON Climate & Renewables; DE = Distributed energy;EGC = E.ON Global Commodities
E.ON’s mid-term portfolio targetPro forma distribution EBITDA*
0
1
2
3
4
2012A 2013E 2014E
Significant part of total group EBITDA even after revenue cut and disposals in Germany
Germany Other EU Countries€bn
* Excluding the earnings contribution of disposed companies
S D
Overview
8

Agenda
9
Back-up
E.ON’s European distribution business
Sweden
Germany

10
Energy market overview
Stable and attractive power market with high green ambitions
Market characteristics
Stable power demand ~150TWh
Sound economic development:1.2 % GDP growth in 2012
High country rating
Stable political climate:broad dialogue on energy policy
High political ambition level regarding green agenda and energy system transformation
Active dialogue:broad stakeholder involvement
Strong belief in power of markets and regulation of natural monopolies
Stab
leA
ttrac
tive
Market specifics
S D
Power with central role in energy mix –also heating, e.g. heat pumps
Integrated Nordic wholesale market
Hydro and Nuclear based power production system – hydro as balancing power
Market-based renewable certificates system together with Norway
Strong belief in energy system transformation and smart grids
Focus on energy efficiency and renewables expansion
Strong interconnection to and with the continent
Overview

11
Business overview
Leading player in Swedish power and gas distribution
Network area – GasNetwork area – Power
Key data 2013
Network length 134,400 km
Market share (based on network length)
~24%
Electricity supplied 43.7 TWh
Customers ~ 1,000,000
FTE ~570
~160
0 km
Key data 2013
Network length 1,855 km
Market share (based on network length)
~60%
Electricity supplied 7.3 TWh
Customers ~ 25,000
FTE ~100
S D
Overview

12
Business model distribution
Strong focus on top efficiency and quality
Business model – Cornerstones
Customer orientation
Contracting/outsourcing
Regulatory Approach
Performance culture
Business model – Guiding principles
Distinct customer focus and efficiency as our core identity
Lean process development and automation
Live a performance culture, follow a business minded attitude
Create market and competitive pressure on all operations driving both cost and quality improvement
Utilize market competition in particular within technical services
High level of outsourcing and contracting
Continuous benchmarking
S D
Overview

13
Regulation – General basics
More than just a calculation of allowed revenues
Principles of regulation model Elements of regulation model
Tariffs
1st period regulation period 2012 - 2015
2nd period regulation period 2016 - 2019
Quality of supply: requirements on the supply to fulfill good quality criteria (>11 outages per customer and year not accepted)
Outage fee: major penalty scheme (customer compensation) for long outages (>12h)
Functional demands: outage >24h not allowed according to Swedish law
Tariff: level and overall development
Connection obligation: “cost based principle”
Risk & Vulnerability: balance based on society’s demands
Trust & Dialogue: Return on sustainable level
”Delivery” of investment plan
AND Ex-ante revenue cap regulation with 4 years
regulatory periods
S D
Overview

14
Regulation – Building blocks of allowed revenues
RAB derived from replacement value of all assets in operation
RAB(Regulated asset base)
Capexallowance
Opexallowance
Qualitybonus/penalty
Based on replacement value (RV) of all physically existing assets irrespective of actual age of assets ( RAB = 84% of RV)
New investments are included in RAB latest six months after completion Yearly indexation of RAB by building cost index (av. 2007-2011= 3.6%)
Calculated as annuity based on RAB and regulatory WACC of 5.2% (pre-tax, real) for the period 2012-2015
Depreciation period 40 years
Based on average of actual costs of the years 2006-2009 Yearly adjustment by
Distribution specific cost inflation index (av. 2007-2011= 3.9% ) General efficiency factor of 1%
Up to +/-3% of yearly total costs (excluding pass-through items like transmission charges and network losses)
Quality targets are based on actual quality performance of the years 2006-2009 Penalties for outages >12h
S D
Note: certain legal proceedings on the regulatory model not yet concluded
Overview

20102009200820072006
10
8
6
4
2
020152014201320122011
15
Regulation – Development of allowed revenues
Moderate growth of allowed revenues over the long-term
translates into yearlyrevenue caps (in nominal terms)
Revenue cap for the period 2012-2015 (accumulated):38.2bn SEK (in 2010 money)*
ForecastActual
* Decided revenue cap by the regulator, October 2011, adjusted by the corrections in the model made by regulator, November 2012
bn SEK
S D
Note: certain legal proceedings on the regulatory model not yet concluded
Overview

0 2 4 6 8 10 12 14 16 18 20 22 24 26 28 30 32 34 36 38 40
250
200
150
100
50
0
16
Performance – Quality
Significant quality improvements for our customersbut still some way to go
Network quality
0
50
100
150
200
2006 2007 2008 2009 2010 2011 2012 2013 2014 2015
Gudrun 2005 Sven 2013/12/05Hilde 2013/11/16Simone 2013/10/28
Per 2007
Customers (‘000) without power after hurricane/storms per day
Overall SAIDI* development (in minutes)
Specific Nordic challenges: strong storms/hurricanes and very widespread distribution networks
Large & highly successful investment program “Krafttag” for “weather-securing” the networks
Effective crisis management improving from storm to storm
* SAIDI = System Average Interruption Duration Index
S D
Overview

2005 2006 2007 2008 2009 2010 2011 2012
60
80
100
40
17
Performance – Efficiency
Industry-leading efficiency performance
Efficiency vs. peers
MSEK
Regulatory benchmarking of local grids – Opex / CSV*
* CSV = Composite Scale Variable = [network length (‘000km)] 0.5 x [customer number (m)] 0.25 x [electricity distributed (TWh)] 0.25The CSV is an attempt to measure the network output or the supply task. Opex / CSV is opex in relation to a (comparable) network output or supply task
** “Industry”-figures are excluding Fortum, Vattenfall, and E.ON
E.ON
Vattenfall
Fortum
Industry**
Effective contractor management
Leverage technical services market via tender process for regional contracts every third year
Strong cost and performance culture based on continuous benchmarking of quality and efficiency
Effective, condition based maintenance strategy resulting in superior asset management
S D
Overview

18
Enabler of energy system transformation I
Renewables network connections provide a business opportunity
Renewables network connections DSO compensation for network connections
0
50
100
150
200
250
300
350
400
0
400
800
1.200
1.600
2.000
2.400
2.800
2016
2015
2014
2013
2012
2011
2010
2009
2008
2007
2006
2005
2004
2003
2002
New connections per year(Left hand axis)
Connections in total(Right hand axis)
Substation 400/130
Internal grid
Substation 130/30
Grid Internal grid Wind farmMW
Continued growth of wind connections expected
Some uncertainty for the time beyond 2015 due to new renewables certificate system
Provide customers with attractive offers to build the assets leveraging E.ON’s strong expertise and purchasing power
Costs for internal grid and connection to be borne by customer – no “socialization” via network tariffs
Value can be created by superior project delivery (time and budget)
Distribution investment to be completely included in RAB
S D
Overview

19
Enabler of energy system transformation II
Increasing automation and optimization of existing systems
Overview: use of smart technologies Case study: dynamic line rating
Active management of capacities Maximize capacity utilization of existing assets Demand side management tools and processes Outage and interruption management, e.g. smart
meter confirmed outages
Increasing automation and monitoring Condition based/pro-active maintenance concepts Increasing automated metering points throughout
the grid even on low voltage level IT and data management of increasing importance
and with essential role in further improving effectiveness
Additional services, e.g. control center services to wind park operators
”Donut” metering device
Weather stations
Starting point: stressed power grid on Öland, network congestions 1-3% of time
New 48MW offshore wind farm in Kårehamn to stress the situation even further
Traditional approach: ”invest in copper” Smart solution: dynamic line rating allowing better
utilization of existing capacities Investments of 2 MSEK in system & tools vs.
300 MSEK in a new line
Location overview
S D
Overview

20
Business outlook
Market consolidation offers development opportunities
Opportunities in market consolidation Case study: Kramfors
Highly fragmented distribution market with~165 distribution companies with strongly differing potential to handle current and future challenges
Necessary consolidation offers E.ON opportunities for further synergetic acquisitions(small- to mid-scale)
Efficiency gains resulting from consolidation are a targeted result of the regulation model
Swedish distribution companies by size(in replacement value in MSEK)
~175 regulatory network areas
E.ON regulatory network areas*
Other regulatory network areas
* E.ON has 4 regulatory network areas
Kramfors network area
Excellent geographical fit: an ”island” within E.ON’s distribution network (5000 customers, 90 GWh)
Key value driver: decrease operational cost through synergies with existing business - no additional staff needed
Synergies almost as high as previous EBITDA of Kramfors Energiverk AB
Investment ~110 MSEK, IRR ~14%
S D
Overview

21
Financial outlook
Stable earnings outlook and well targeted investments
Investments in power distribution Earnings in power distribution
0
1
2
3
4
2005 2006 2007 2008 2009 2010 2011 2012 2013 20140
1
2
3
4
5
2005 2006 2007 2008 2009 2010 2011 2012 2013 2014
in bn SEK in bn SEK
Remarkably robust results over the years driven by superior performance, efficiency gains, and quality levels
Broadly stable EBITDA for 2014 expected
Figures from 2007 to 2009 reflect investment program Kraftag
Broadly stable capex level for 2014; post 2016 generally increasing capex level expected
Investments targeted to optimize network quality
S D
ActualsExpected
ActualsExpected
Overview

22
Key takeaways
• Sweden delivers robust earnings resulting from outstanding performance
• Top performance is the key driver to balance out all stakeholder interests
• The energy transition is challenging but presents a growth opportunity
• Further growth potential through efficiency driven market consolidation
S D
Overview

Agenda
23
Back-up
E.ON’s European distribution business
Sweden
Germany

24
Germany – Business overview
Major player in the German distribution grid landscape
Network overview Key figures
S D
Shareholder structure
E.ON grids Market share
Gridcustomers
PG
6.9m0.8m
~16%~5%
Installed RES P 26GW ~37%
Grid lengthPG
352,000km59,000km
~19%~14%
P GPower segment Gas segment
ConcessionsPG
3,8001,900
~28%~32%
31%
69% 67%33%
69%31%
E.ON Municipalities
100%
Overview

Distribution in Regional Unit Germany context
Distribution is the main earnings contributor
25
S D
Overview
2012 results (in Euro)
~€1.1 billion
~€40.3 billion
~€2.8 billion
~20,850
CAPEX
Sales
EBITDA
Employees
E.ON Germany
~€0.9 billion
~€12.7 billion
~€1.8 billion
~13,218
thereof Distribution
* Unaudited values** Target staffing 2015 incl. network and customer service
~€2.9 billionOperating Cash Flow ~€1.8 billion
~€0.7 billion
~€10.5 billion
~€1.4 billion
~9,380**
thereof going concern*
~€1.5 billion

26
Concessions – E.ON as partner of municipalities
Concession business is small scale – high effort but risk diversification
Expiring concessions (power & gas) per year Concessions – Our business backbone
201720162015201420132012201120102009
350
200
100
150
50
300
250
02018
€m450
400
of allowed revenues Renewal of concessions at least every 20 years
Many areas have become highly competitive
Of all currently expiring concessions more than 90% renewed
Positioning ourselves as preferred regional partner via superior costumer service and operational excellence
Loosing an expiring concession triggers a forced disposal of assets
S D
Overview

27
Regulation – General basics
Current regulatory system provides a stable and reliable status
Process steps of regulatory system
Cost Audit+
Benchmarking
Gridexpansion
Revenue cap incentive regulation Cost audit and benchmarking once per
regulatory period (5 years) Total costs of historic base year basis for benchmarking &
revenue cap Efficiency level determines revenue path of regulatory period
DSO applies yearly for grid expansion Increases revenue cap within a regulatory period
Based on energy consumption Differ for different network areas within Germany
Yearly adjustment of revenue cap by Consumer Price Index (CPI) General efficiency factor of 1.5% Individual efficiency factor from benchmarking
Yearly revenue cap
Network tariff
every 5 years
yearly application & adjustment
yearly adjustment
yearly adjustment
S D
Overview

28
Regulation – Regulatory schedule
Strong incentives for performance
2009 2010 2011 2012 2013 2014 2015 2016 2017 2018 2019
2nd regulatory period
Cost base for revenue cap
Bas
e ye
ar
Revenue cap (individual efficiency = 100%)
* For gas distribution: first regulatory period ended 2012. Therefore the base year for the second period was 2010. The second period for gas lasts from beginning of 2013 to the end of 2017
Bas
e ye
arCost Audit+Benchmark
3rd1st regulatory period
Cost Audit+Benchmark
Cost of base year 2011 are basis for allowed revenues from 2014 onwards
Regulatory cost audit and benchmarking took place from mid 2012 to end 2013
Replacement investments in the years 2012 to 2016 are reflected in allowed revenues partly from 2019 onwards
Benefits from performance measures effective in the years 2012 to 2018 can be kept until 2019
Power distribution* Comments
S D
Overview

Regulation – Cost base
Calculation of cost base follows an equity-based approach
Composition of cost base
AllowedOPEX
AllowedDepreciation
+
+
Cost base =
expense based (P&L) imputed calculations of capital costs
AllowedReturn on equity
29
S D
Overview
Cost structure of efficient system operator Including actual cost of debt
Based on Regulated Asset Base with regulatory asset lifetimes of 30 to 45 years
Equity financed part of the Regulated Asset Baseup to a maximum equity level of 40% multiplied with 9.05% (nominal)
30
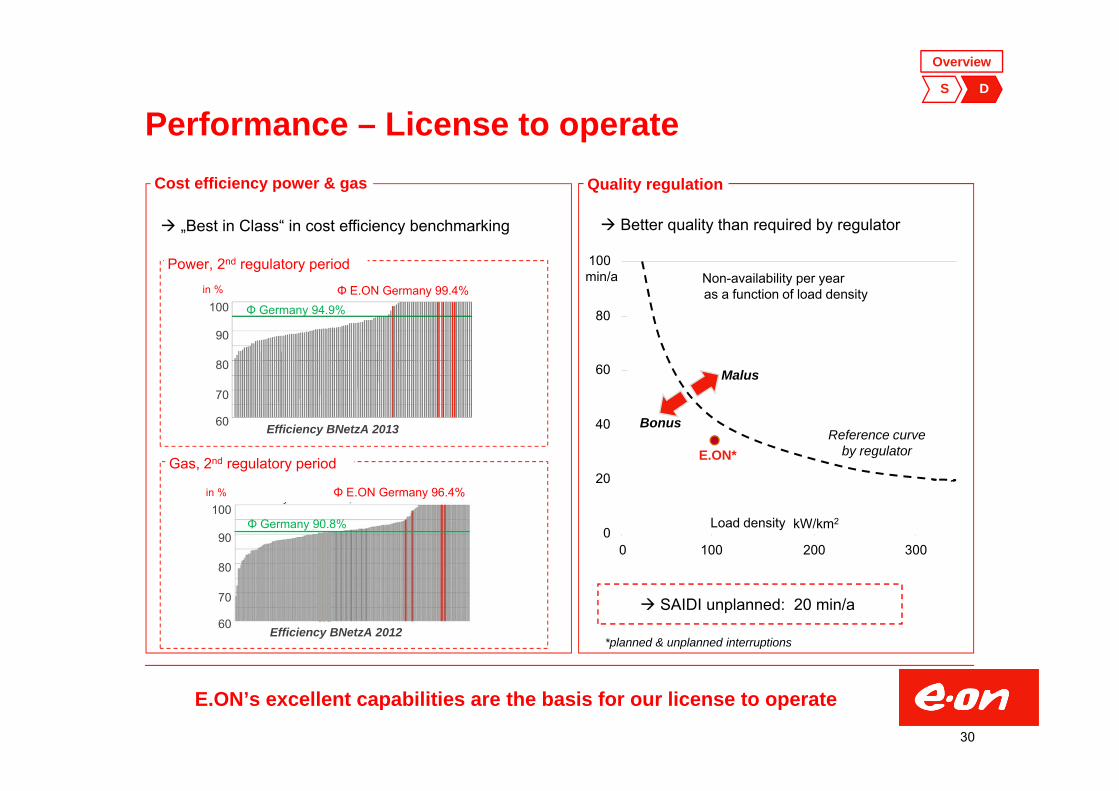
Performance – License to operate
E.ON’s excellent capabilities are the basis for our license to operate
Cost efficiency power & gas Quality regulation
Φ E.ON Germany 99.4%
Efficiency BNetzA 2013
in %
100
90
80
70
60
Efficiency BNetzA 2012
in %
100
90
80
70
60
Φ Germany 94.9%
Φ Germany 90.8%
Power, 2nd regulatory period
Gas, 2nd regulatory period
kW/km20
20
40
60
min/a100
0 100 200 300
Reference curveby regulator
Load density
80
Non-availability per yearas a function of load density
Malus
Bonus
E.ON*
„Best in Class“ in cost efficiency benchmarking Better quality than required by regulator
Φ E.ON Germany 96.4%
S D
Overview
SAIDI unplanned: 20 min/a
*planned & unplanned interruptions

31
Performance – Earnings drivers
Stable CAPEX returns and opportunity for extra margin from outperformance
Building blocks of EBITDA
Higher efficiency than required from
benchmarking
Allowed profit according
to cost audit
Additional remuneration
for grid expansion
Other earnings(e.g. third party business,
participations, aperiodic effects)
~59%
~12%
~12%
~17%
S D
Overview

32
Energiewende* – E.ON networks as “enabler”
Situation for E.ON DSOs quite unique in Germany
Example E.DIS: RES installed capacity Key challenges
160
4,000
02013
7000
2011
4,900
2009
3,800
20072003
1,110
1999 2005
8,000
2,100
3,2002,700
2001
in MW
100%(max. load)
Today’s RES capacity is threetimes the amount of peak load
Distribution grid originally designed to distribute power up to maximum load
RES installed capacity exceeds maximum load in a region nearly factor 3
Now, expansion of the distribution grid required as well as increased deployment of smart technologies
* German energy system transformation
S D
Overview

33
Energiewende – E.ON as innovation pioneer
Innovative technologies significantly reduce additional investment needs
Examples of application of smart technologies
Controllable mid-voltage/low-voltage-secondary sub-stationEnables an increased in-feed of renewables in low voltage networks by dynamic voltage regulation
Dynamic line rating (high-voltage)Increase of line capacities by taking account of varying weather conditions
High temperature linesIncreased capacity of conductors by using temperature-resistant materials
Intelligent in-feed management (EisMan)Intelligent curtailment of renewable generation in case of grid congestion allows integration of all RES requesting connection to the grid
S D
Overview

34
Political perception of DSO role in Energiewende
DSO importance for Energiewende understoodSignificant progress towards a fair regulatory regime
Rising awareness for situation of DSOs
“DSOs are the backbone of the ‚Energiewende‘ on the ground because the roll-out of renewables results in an increasing decentralization of the energy system.”
Government’s coalition agreement from December 2013
“[…] that current instruments of the incentive regulation […] will not meet the future demands of the accelerated ‚Energiewende‘ .”
“Against this background the Upper House asks the government to implement a new mechanism within current regulations with regard to the consideration of investment cost as soon as possible.”
‚Motion for a resolution‘ of the Upper House of the German parliament in July 2013
S D
Overview

35
Financial outlookCAPEX Earnings Outlook
Increasing network investments for RES integration due to “Energiewende”
Smart meter roll-out starting in 2016
1.0
1.5
2.0
2013E*0.0
2016E2015E2014E
0.5
Replacement / OthersCustomer connectionsRES integration
Expected cash-effective investments (€bn)
Temporary decrease in earnings starting with the 2nd regulation period power in 2014
Moderate and stable EBITDA increase from 2014
2.0
1.5
1.0
0.5
0.02014E2013E* 2016E2015E
Expected EBITDA (€bn)
S D
* Expected pro-forma cash-effective investments excluding the investments of thedisposed companies
* Expected pro-forma EBITDA excluding the contributions from the disposed companies
Overview
Moderate increase after regulatory reset

36
Key takeaways
• Distribution: high-performing business with attractive earnings and moderate risks
• E.ON networks in Germany are “best-in-class"
• The Energiewende is a growth opportunity for us
S D
Overview

Backup Overview Sweden Germany Other EU Countries Czech Republic Hungary Slovakia Romania Spain
IR team and calendar
37

38
Overview RAB and regulatory periodsRegulated asset base 2013/2014 (€bn)1 Regulatory periods
Most important countries Germany and Swedenwith overlapping regulatory periods in power
Germany ~10
Sweden ~9.1
Spain ~0.82
Hungary ~1.5
Czech Republic ~1.2
Romania ~0.7
Slovakia ~0.63
1. For Germany RAB is for 2014. Exchange rates as of 27 Jan 20142. Implicit pro forma RAB retroactively determined. Actual system is based on indexed regulatory revenue allowance3. RAB for 100% of ZSE (E.ON-share 49%)
In general, RABs between different regulatory regimes are not directly comparable due to significant methodical differences
In Sweden for example, RAB is based on replacement value of all physically existing assets irrespective of the actual age of the assets
Power Gas
Germany 2014-2018 2013-2017
Sweden 2012-2015 2013-2016
Spain 2013-2016 Not relevant
Hungary 2013-2016 2010-20164
Czech Republic 2010-2014 2010-2014
Romania 2013-2017 2013-2017
Slovakia 2012-2016 Not relevant
4. Period was extended until 2016 or until further regulatory change
Ove
rvie
w

39
Regulation – Building blocks of allowed revenues
Allowed revenues are an important but only one element within regulatory model
* Decided cap by the regulator, October 2011, adjusted by the corrections in the model made by regulator, November 2012
RAB(Regulated asset base)
RAB based on replacement value
(RV) of all physically existing
assets irrespective of actual age of
assets.New investments
are included in RAB, latest six
months after site taken in operation.Yearly indexation of asset base by
building cost index (av. 2007-2011, 3.6%)
RAB = 84% of RV
Capex allowance
Opex allowance
Pass-through items
Quality bonus/penalty
Allowed Capexcalculated as
annuity based on: regulatory WACC of 5.2% (pre-tax,
real) for the period 2012-2015 and
depreciation periods
of 40 years respective 10
years
Opex allowancebased on actual costs 2006-09: yearly adjusted by cost index
factor and general efficiency
factor of 1%
(Historical cost index factor average
2007-2011, 3,9%)
Pass-throughof non-
controllable costslike transmission
tariffs andnetwork losses
Quality bonus/penalty
derived from targets based on
actual perfor-mance 2006-09of up to +/-3% of
total cost excluding pass-through items
Penalty for outage > 12h
Under-/over-recoveryof allowed
revenues to be adjusted infollowing
regulatory periodMax +/- 5%
Revenue cap38 234 MSEK*
in cost level2010
based on official decision
letter of regulator for the
period 2012-2015
Lagged recoveries
Allowed revenues
+/-3%
Schematic illustration (power)
Note: certain legal proceedings on the regulatory model not yet concluded
Swed
en

Regulation – Building blocks of allowed revenues
Allowed revenues consist of quite a high number of elements
Schematic illustration for 2014 (power & gas)R
egul
ated
ass
etba
se*
Old
ass
ets:
cur
rent
cos
tsN
ew a
sset
s: h
isto
ric c
osts
Deb
t bas
e(re
late
d to
act
ual c
apita
l st
ruct
ure,
min
imum
60%
)
Reg
ulat
ed E
quity
bas
e(re
late
d to
regu
lato
ry c
apita
l st
ruct
ure,
max
imum
40%
)
Ret
urn
on E
quity
**O
ld a
sset
s: 7
.14%
N
ew a
sset
s: 9
.05%
Ret
urn
on e
xc. E
quity
~4
% fo
r equ
ityin
exc
ess
of 4
0%
Trad
e ta
x al
low
ance
Dep
reci
atio
n al
low
ance
(bas
ed o
n us
ually
40
year
s re
gula
tory
ass
et li
ves)
Ope
ratin
g co
sts
allo
wan
ce(b
ased
on
actu
al c
osts
of
hist
oric
bas
e ye
ar)
Add
ition
al re
venu
es(n
etw
ork
expa
nsio
n, q
ualit
y bo
nus/
pena
lty…
)
Lagg
ed re
cove
ries
(net
ting
of a
ctua
l vs.
al
low
ed re
venu
es)
CapitalCosts
Opex
Tota
l allo
wed
cos
t bas
e (T
otex
)
Totex indexed toCPI and subject to general and individual efficiency targets
Pass
-thro
ugh
item
s(c
harg
es o
f hig
her g
rid
leve
ls, p
ensi
ons,
etc
…)
Allo
wed
reve
nues
* Old assets are those capitalized before 01/01/2006. New assets are those capitalized after 01/01/2006. Old assets are indexed up to 40% with asset-specific indices todetermine the current costs
** Return on Equity is post trade tax and pre corporation tax
~€0.6bn power~€0.2bn gas of allowedcapital costs
~€2.7bn power~€0.3bn gas
~€3.9bn power~€0.54bn gas
~€7.4bn power~€2.6bn gas
~€0.6bn power~€0.04bn gas of otherrevenues
40%
Cap
40
Ger
man
y

Regulation – How it works in detailGerman regulation formula
Formula enshrined in law
41
EOt = KAdnb,t + (KAvnb,0 + (1- Vt) · KAb,0) · (VPIt / VPI0 – PFt) · EFt + Qt + (VKt – VK0) + St
EOt
KAdnb,t
KAvnb,0
Vt
KAb,0
Permanently non-controllable costs for the year t
Revenue Capfor the year t
Currently non-controllable costs from cost audit & benchmarkingControllable costsfrom cost audit & benchmarkingAllocation factorfor the year t
VPIt
PFt
Qt
VKt
VK0
EFt
Productivity factorfor the year t
Consumer inflation indexfor the year t
RES growth factor for the year tQuality elementfor the year tVolatile costsfor the year t
VPI0 Consumer inflation indexfor the base year
Volatile costsfrom cost audit & benchmarking
St Regulatory account settlementfor the year t
Duration of regulatory period 5 years t ranges from 1 to 5
Ger
man
y

Regulation – FormulaGerman regulation formula decomposed
Multiple levers to be managed
42
EOt = KAdnb,t + (KAvnb,0 + (1- Vt) · KAb,0) · (VPIt / VPI0 – PFt) · EFt + Qt + (VKt – VK0) + St
Revenue cap
* ARegV (Anreizregulierungsverordnung) = Ordinance for incentive regulation
1 2 3 4 5 6
Cost base1 Expansionfactor3
CPI and generalefficiency
adjustment2x
=
x
Quality bonus/penalty4
Settlement ofregulatoryaccount
6Volatile costs
(mainly networklosses)
5+ ++
Ger
man
y

Regulation – Breakdown of TOTEXGerman regulation formula decomposed
Cost reductions by DSO higher than required from benchmarkingresults in additional margin until start of new regulatory period
43
KAdnb,t
KAvnb,0
KAb,0
Permanently non controllable cost (§11 II ARegV)* Yearly adjustment based on actuals/planned values Example: expenses for upstream systems etc.
Currently non controllable costs (§11 III ARegV) “efficient costs” Yearly adjustment only for inflation and general efficiency
Controllable costs (§11 IV ARegV) “inefficient costs” Revenue cap is reduced during regulatory period step by step
according to allocation factor
Vt Allocation factor (§16 I ARegV) Determines the reduction of the revenue cap First year V1 = 0.2, increases by 0.2 each year Last year V5 = 1, means controllable costs = 0
EOt = KAdnb,t + (KAvnb,0 + (1- Vt) · KAb,0) · (VPIt / VPI0 – PFt) · EFt + Qt + (VKt – VK0) + St
“TOTEX”
Cost Audit+Benchmarking
* ARegV: Anreizregulierungsverordnung = ordinance for incentive regulation
Ger
man
y

Regulation – Breakdown of TOTEXGerman regulation formula decomposed
44
Permanently non-controllable cost Example: 20.- EUR (due to definition)
Currently non-controllable costs Example: 90% * 100.- EUR = 90.- EUR
Controllable costs Example: 10% * 100,- EUR = 10,- EUR Year 1: (1-0.2) * 10.- = 8.- EUR Year 2: (1-0.4) * 10.- = 6.- EUR etc. Year 5: (1-1) * 10.- = 0.- EUR
Example:TOTEX 120.- EUREfficiency level 90%
EOt = KAdnb,t + (KAvnb,0 + (1- Vt) · KAb,0) · (VPIt / VPI0 – PFt) · EFt + Qt + (VKt – VK0) + St
KAdnb,t
KAvnb,0
KAb,0
“TOTEX”
Regulatory timeline of 5 years to eliminate “inefficient costs”
Ger
man
y

Regulation – Inflation and general efficiencyGerman regulation formula decomposed
Allowed revenues are protected against general inflation
EOt = KAdnb,t + (KAvnb,0 + (1- Vt) · KAb,0) · (VPIt / VPI0 – PFt) · EFt + Qt + (VKt – VK0) + St
VPIt / VPI0
PFt Productivity factor (§9 ARegV) The general sectoral productivity factor reflects efficiency improvements
of the grid business in general Explicitly defined for the first (1.25% per year) and second (1.5% per year)
regulatory period of the incentive regulation For further regulatory periods will determine the factor according to
scientific methods Example: PF1=1.5%, PF2=3.02%, PF3=4.57% etc.
Adjustment for inflation (§8 ARegV)* Customer Inflation Index (CPI) used as published by the Federal Statistical
Office in Germany The term reflects the relation of the CPI of the next to last year before the
year of the relevant revenue cap and the CPI of the base year Example Power: For the first year of the regulatory period (2014) the CPI of
2012 is set into relation to the CPI of 2011 (base year)
* ARegV: Anreizregulierungsverordnung = ordinance for incentive regulation
Ger
man
y
45

Regulation – Network expansionGerman regulation formula decomposed
Important element to support renewables-related network growth
46
EOt = KAdnb,t + (KAvnb,0 + (1- Vt) · KAb,0) · (VPIt / VPI0 – PFt) · EFt + Qt + (VKt – VK0) + St
EFt RES growth factor (§10 ARegV)* Regulatory instrument for remuneration of investments due to
changes of the supply tasks during the regulatory period Once a year DSO can apply for RES growth factor if structural
parameters have changed in the past (time lag between 0.5 and 1.5 years)
Structural parameters: Supplied network area Number of connection points Peak load
Revenue cap increases as a lump sum based on structural parameters; no link to investment volume
* ARegV: Anreizregulierungsverordnung = ordinance for incentive regulation
Ger
man
y

Regulation – Quality and regulatory accountGerman regulation formula decomposed
Limited experience with quality regulation so far
47
EOt = KAdnb,t + (KAvnb,0 + (1- Vt) · KAb,0) · (VPIt / VPI0 – PFt) · EFt + Qt + (VKt – VK0) + St
Qt Quality element (§19 ARegV)* Introduction in 2012 aiming at the retention of optimal quality of supply in Germany Quality regulation applies for medium and low voltage Bonus/Malus-System System average interruption duration index (SAIDI) as the only parameter for the
reference curve, depending on the load density Effect of deviation from reference curve: 0,18 € / Customer / min / year Upper & lower limit for revenue cap adjustments: -2 to +4% of controllable costs
VKt – VK0 Volatile costs (§11 V ARegV) Primarily costs due to grid losses
St Regulatory account (§5 ARegV) Differences between allowed revenues and actual revenues (positive or negative) are
“booked” to the regulatory account In the last year of the regulatory period the balance of the regulatory account is
determined and then settled over the next regulatory period
* ARegV: Anreizregulierungsverordnung = ordinance for incentive regulation
Ger
man
y

48
From sales to allowed revenues
Enormous administrative challenge
German distribution – Composition of sales* (€bn)
~11.9 ~6.5
~4.8
~0.6
Sales RESsurcharge
Allowedrevenues
Other
* Pro forma sales 2013 = Expected sales excluding the contributions from the disposed companies (3 regional utility companies)
DSOs are legally obliged to purchase all power produced by the renewables generators connected to their network
More than 50% of sales results from the TSO’s full compensation for the power from renewables generators
Ger
man
y

Price regulation power – Key cost factorsPrice regulation power - Overview
Method: revenue cap Regulation period: 2010-2014 (3rd) Next regulation period: 2015-2019 (4th) Next photo year: 2012/13 (note that this
based on past photo years, the laws do not provide an explicit photo year
Regulatory formula for initial year: Rbase = OPEX + D + (RAB x RR)
Regulatory formula for adjustment: Rt = OPEX x (1 + PI – X)t+ D+(RAB x RR)
Radjusted = Rt x k + Rt-1 x (1 - k) ± Z+ KF+Q
Bas
ics
Cap
form
ula
Regulated return on RAB (pre-tax): 6.7% Revaluation for old assets at 3% (starting
2015) until revaluated CZ GAAP values met (not yet confirmed for new regulatory period) – currently at risk
Depreciation period for lines is 40 years
General efficiency factor: 2.0 % Individual efficiency factor: 0 for 3rd
regulation period Inflation factor for OPEX is 70% business
service price index + 30% (CPI+1%)
CA
PE
X
Overview CZ power – Price regulation of distribution
OP
EX
Quality factor applied since 2013 Customer contributions (BKZ) add to the RAB, 80% of the BKZ release is deducted from network fees
Price regulation power – Other important factors
Cze
ch R
epub
lic
49

Price regulation gas – Key cost factorsPrice regulation gas - Overview
Method: revenue cap Regulation period: 2010-2014 (3rd) Next regulation period: 2015-2019 (4th) Next photo year: 2012/13 (note that this
based on past photo years, the laws do not provide an explicit photo year
Regulatory formula for initial year: Rbase = OPEX + D + (RAB x RR)
Regulatory formula for adjustment: Rt = OPEX x (1 + PI – X)t+ D+(RAB x RR)
Bas
ics
Cap
form
ula
Regulated return on RAB (pre-tax): 7.1% Revaluation for old assets at 3% (starting
2015) until revaluated CZ GAAP values met (not yet confirmed for new regulatory period) – currently at risk
Depreciation period for lines is 40 years
General efficiency factor: 2.0 % Individual efficiency factor: 0 for 3rd
regulation period Inflation factor for OPEX is 70% business
service price index + 30% (CPI+1%)
CA
PE
X
Overview CZ gas – Price regulation of distribution
OP
EX
Quality factor currently not applied
Price regulation gas – Other important factors
Cze
ch R
epub
lic
50

Price regulation power – Key cost factorsPrice regulation power - Overview
Method: modified price cap with real quantity acceptation with year-2 Q
Regulation period: 2013-2016 Next regulation period: 2017-2020 Photo year: 2011
Regulatory formula for initial year: Rbase = OPEX + D + (RAB x RR) + NL
Regulatory formula for adjustment: No indexation in 2013-2016 period(Formula for 2009-2012 period was:Rt = Rbase x (1 + CPI – X + Q)t
Note: R is divided by volume on voltage level as price is set)
Bas
ics
Cap
form
ula
Regulated return on RAB (pre-tax): 6.23% Regulatory asset value determined at unit
prices multiplied with quantities and weighted by HU GAAP net to gross book value
Depreciation period for lines is 37 years, but depreciation below 0 is possible
General efficiency factor:No indexation in 2013-2016 period
CA
PE
X
Overview HU power – Price regulation of distribution
OP
EX
Unplanned SAIDI, SAIFI and an outage rate min. level defined. 3-fold sanctions possible if non compliant in 3-years average.
Price regulation power – Other important factors
Hun
gary
51

Price regulation gas – Key cost factorsPrice regulation gas - Overview
Method: price cap Regulation period: 2010-2013 period is
extended till 2016 or until further regulatory change
Next regulation period: unknown
Regulatory formula for initial year: Rbase = OPEX + D + (RAB x RR)
Network Loss is no more an eligible cost for gas DSOs
Regulatory formula for adjustment: Rt = Rbase x (1 + CPI*H-5%, if CPI*H>5%)H: correction factor for estimating fault
Note: R is divided by volume as price is set
Bas
ics
Cap
form
ula
Regulated return on RAB (pre-tax): different for USP and competitive market. WACC USP: 0%; competitive: 8.29%
Revaluation for all assets at currently 5.5% based on construction indexes
Depreciation period for lines is 40 years
No efficiency factor Indexation if acknowledged inflation
exceeds 5% (+0,25% in 12/13 gas year)
CA
PE
X
Overview HU gas – Price regulation of distribution
OP
EX
Quality regulation on outages: complex index (of consumers affected and length of outage), index on outage length, and index on the number of outages.
Price regulation gas – Other important factors
Hun
gary
52

Price regulation power – Key cost factorsPrice regulation power - Overview
Method: price cap Regulation period: 2012-2016 Next regulation period: 2017+ Next photo year: 2015
Regulatory formula for initial year: Rbase = OPEX + D + (RAB x RR) Regulatory formula for adjustment:
Rt= OPEXbase x (1+PI-X)t + Dbase + ∆D + RABbase x RR x Q – F*
Note: R is divided by volume as price is set
Bas
ics
Cap
form
ula
Regulated return on RAB (pre-tax): revaluated annually (6,04% for 2012 and 2013, 6,03% for 2014)
RAB: depreciated asset base based on external value appraisal of 2005 YE assets and investments & depreciation since 2006 at the start of the regulatory period (time lag)
Depreciation period for lines is 30 (LV) - 35 years (MV, HV)
General efficiency factor: 3.5% Inflation factor for OPEX is core inflation,
however escalation index (1+core inflation – X) can not be below 1,0
CA
PE
X
Overview SK power – Price regulation of distribution
OP
EX
Automatic compensations for violated quality standards towards customers applied from 1 January 2014 (i.e. customers are compensated automatically by DSOs / Suppliers without any request for the compensations)
Price regulation power – Other important factors
F – revenues from connection, illegal consumption, exceeding the reserved capacity; to be applied from 2014
(based on 2012 actual revenues)
Slov
akia
53

Price regulation power – Key cost factorsPrice regulation power - Overview
Method: price cap Regulation period: 2008-2012 (2nd) Next regulation period: 2014-2018 (3rd)
(2013 transitory year) Photo year: 2011/2012
Regulatory formula for initial year: Rbase = OPEX + D + (RAB x RR)
Regulatory formula for adjustment: Rt = Rbase x (1 + PI – X + Q)t
Note: R is divided by volume as price is set
Bas
ics
Cap
form
ula
Regulated return on RAB (pre-tax): 8.5% RAB: depreciated asset base based
revaluated with inflation until reaching 95% of revaluated local GAAP
Depreciation period for lines is 12 years for cables and 32 years for overhead lines
General efficiency factor: 1.5% Inflation factor is CPI 9.5% grid losses recognized in 2012 & 13
CA
PE
X
Overview RO power – Price regulation of distribution
OP
EX
Quality factor not active up to now
Price regulation power – Other important factors
Rom
ania
54

Price regulation gas – Key cost factorsPrice regulation gas - Overview
Method: price cap Regulation period: 2008-2012 (2nd) Next regulation period: 2013-2017 (3rd) Photo year: 2011/2012
Regulatory formula for initial year: Rbase = OPEX + D + (RAB x RR) + DV
Regulatory formula for adjustment: Rt = Rt-1 x (1+PI-X) x GF+Q+(Vt-V0)+∆INVNote: R is divided by volume as price is set, Adjustment formula obsolete
Bas
ics
Cap
form
ula
Regulated return on RAB (pre-tax): 8.6% RAB: depreciated asset base based
revaluated with inflation Depreciation period for pipes is 30 (steel)-
40 years (PE)
General efficiency factor: 1% Inflation factor is CPI 4% grid losses recognized in 2012
CA
PE
X
Overview RO gas – Price regulation of distribution
OP
EX
Quality factor not active up to now
Price regulation gas – Other important factors
Rom
ania
55

Overview ES – Price regulation of power distribution
Regulation power – Key cost factorsRegulation power - Overview
Method: revenue cap Transition framework: 2013 & 2014 based on
historical remuneration 2013 Remuneration specific calculation:
Until 07/2013: 2012 remuneration + investment recognition (year n-2)
From 07/2013: Adjustment with new financial rate.
2014: 2012 Investments recognition No asset based-RAB defined.
Next regulatory framework (not approved - under consultation process): 2015-2019
Asset based RAB to be defined for each DSO. Photo year: 2013
Remuneration annual review (transition):Rt = D + (RAB x RR) + OPEX * (1+PIt-1) + Qt-1
Others: remuneration for distribution commercial management activities and specific bonuses.
Bas
ics
2013 & 2014 Transition period Financial remuneration rate ’13
Until 07/13: 7.98% From 07/13: 5.5%
Financial remuneration rate’14: 6.5% Depreciation : 40 years for grid assets.
Annual investments (year n-2) recognition process. Specific investments get 100% remuneration. Customer payments % adjust receivable capex.
Next regulatory framework CAPEX factors to be defined
2013 & 2014 Transition period Transitory period OPEX calculated as percentage
of real O&M vs. total remuneration. 2013 OPEX for new investments: 6.5 % 2014 OPEX for new investments not published.
Next regulatory framework OPEX factors to be definedC
APE
XO
PEX
Q: Grid losses and Quality Bonus previous system (under review): Grid losses vs. individual losses target at a loss-energy price and added to remuneration. ±2% remuneration cap Quality target set and used as reference. Incentive may turn in a bonus or penalty up to ±3% of global income.
RES Investments: DSO is obliged to attend RES investments requests, however RES investments are paid to the DSO by RES producers. Percentage of network financed by RES producers is to be included to define a gross RAB and a net RAB.
Cap
For
mul
a
Regulation Power – Other important factors
Energy Reform launched in July’13 in order to tackle the tariff deficit issue in Spain and review system regulated costs. 2013 & 2014 transition regulatory scenario approved. New Regulatory scenario expected to be approved in Jan-Feb’14
Spai
n
56

Dr. Marc SpiekerHead of IR T+49 2 11-45 79-3 45
[email protected] BlankenhornRegions/Sales, SRI, Retail, T +49 2 11-45 79-4 81Facts & Figures [email protected]
François PoulletGeneration, Gas T +49 2 11-45 79-3 32
Marc KoebernickRenewables, Trading T +49 2 11-45 79-2 39
Dr. Stephan SchönefußPolitics & Regulation, Regions/Distribution T +49 2 11-45 79-48 08
Carmen SchneiderTechnology & Innovation, Roadshow planning & management, T +49 2 11-45 79-3 45Shareholder ID & Targeting [email protected]
E.ON Investor Relations Contact
57

E.ON IR - Reporting calendar & important links
Date Event
March 12, 2014 Annual Report 2013
April 30, 2014 2014 Annual Shareholders Meeting
May 13, 2014 Interim Report I: January – March 2014
August 13, 2014 Interim Report II: January – June 2014
November 12, 2014 Interim Report III: January – September 2014
Content Link
Capital Market Story http://www.eon.com/en/investors/stocks/capital-market-story.html
Other Presentations http://www.eon.com/en/investors/events/analyst-and-investor-conferences.html
Annual Reports http://www.eon.com/en/about-us/publications/annual-report.html
Interim Reports http://www.eon.com/en/about-us/publications/interim-report.html
Facts & Figures http://www.eon.com/en/about-us/publications/facts-and-figures.html
Creditor Relations http://www.eon.com/en/investors/bonds/presentations.html
Important links
Reporting calendar
58

This presentation may contain forward-looking statements based on current assumptions and forecasts madeby E.ON Group management and other information currently available to E.ON. Various known and unknownrisks, uncertainties and other factors could lead to material differences between the actual future results,financial situation, development or performance of the company and the estimates given here. E.ON SE doesnot intend, and does not assume any liability whatsoever, to update these forward-looking statements or toconform them to future events or developments.
Disclaimer
59