eog_final1-2
TRANSCRIPT

1
University of Oregon Investment Group
April 10th, 2015 IME
Tyler Boadway [email protected]
Investment Thesis
Based off of key industry metrics and quantitative factors, EOG is unable to produce crude oil, liquid natural gas and natural gas as efficiently as its peers.
EOG’s management has laid out that they are positioning the company for an energy recovery, management has not discussed any immediate plans to generate returns for investors.
With proven reserves in key low cost oil and gas plays exponentially
decreasing, EOG is relying on an oil price recovery to stay profitable. If this recovery does not happen in the near future EOG will be in trouble.
EOG’s stock price has depreciated the least out of all of its competitors
since the energy crisis started. This may indicate limited upside once energy prices rebound.
EOG Resources, Inc.
Ticker: EOG
Current Price: $91.22
Recommendation: Underperform
Price Target: $74.51
Key Statistics52 Week Price Range $81.23 - $118.89
50-Day Moving Average $90.50
Estimated Beta 1.44
Dividend Yield 0.70%
Market Capitalization $50.85B
3-Year Revenue CAGR 15.57%
Trading StatisticsDiluted Shares Outstanding 559.37M
Average Volume (3-Month) 5.15M
Institutional Ownership 93.30%
Insider Ownership 0.46%
EV/EBITDA (LTM) 5.8x
Margins and RatiosGross Margin (LTM) 51.23%
EBITDA Margin (LTM) 29.07%
Net Margin (LTM) 16.17%
Debt to Enterprise Value .11x
Five-Year Stock Chart One-Year Stock Chart
0
50,000,000
100,000,000
150,000,000
200,000,000
250,000,000
300,000,000
350,000,000
400,000,000
$0.00
$20.00
$40.00
$60.00
$80.00
$100.00
$120.00
$140.00
Mar-10 Sep-10 Mar-11 Sep-11 Mar-12 Sep-12 Mar-13 Sep-13 Mar-14 Sep-14
Volume Adjusted Close 50-Day Avg 200-Day Avg

UOIG 2
Date of Presentation University of Oregon Investment Group April 10th, 2015
April 10th, 2015
Business Overview
EOG Resources Inc. is an energy company that explores, develops, produces, processes and markets crude oil, crude oil equivalent, liquid natural gas and natural gas. These fossil fuels are extracted from deep in the ground and are hundreds of thousands years old. EOG Resources is considered one of the largest and most influential independent oil and gas companies in the world. Independent energy companies are similar to integrated energy companies such as Chevron and Shell but are different in the fact that they do not operate in all three energy production segments. These three production segments are upstream (exploration and production), midstream (marketing and storage) and downstream (refining). Downstream production is sometimes split into two operations, these are refining and final sale. EOG operates an upstream exploration and production segment as well as a midstream energy marketing segment.
A majority of EOG’s business comes from domestic shale oil and gas plays. EOG extracts a vast majority of its oil and gas from drilling activities in the Eagle Ford, Permian Basin, Bakken, Barnett and Rocky Mountain areas. In addition to these domestic oil and gas plays EOG also operates internationally in Canada, Trinidad and Tobago, the United Kingdom and China. Last year EOG sold off a majority of its tar sands operations in Canada for $400 million and now only maintains a small presence there. As of December 31st, 2014 EOG held proven reserves that totaled 2,497 MMBoe, of this 1140 MMBbl were crude oil and condensate, 467 MMBbl were natural gas liquids and 890 MMBoe (5343 BcF) were natural gas reserves. This ratio of oil to natural gas is changing as over 79% of EOG’s new discoveries last year were deemed to be crude oil and condensates.
EOG strives to generate capital by controlling operating expenses while maximizing oil recoveries. In addition the company focuses on using cost-effective advances in technology to find and develop low cost reserves. In the company’s upstream production segment EOG tries to remain on the cutting edge of technology by employing a large team of geologists and geophysicists. Once they locate a reserve and it is deemed profitable, EOG drills on the site using hydraulic fracking and other extraction techniques. After the energy is extracted it is stored and transported using their midstream segment’s infrastructure before it is marketed and sent to third party downstream refiners. In addition, EOG handles the transport and marketing of energy from third party companies that do not have a midstream segment. A majority of their marketing takes place in Cushing, Oklahoma and Saint James, Louisiana. EOG has a very diverse clientele where not one downstream customer accounted for more than five percent of their total sales volume.
EOG prices a majority of their natural resources according to the futures prices of WTI Crude and NYMEX Natural Gas. They sell their liquid natural gas on the free market since it is not a traded commodity. This being said, liquid natural gas’ price is heavily correlated with the price of normal natural gas. EOG has practically no control over the price at which their resources are sold which creates unique risks and opportunities for them. They attempt to offset some of this risk by entering into futures contracts on their crude oil and gas production. EOG was incorporated in 1999 after splitting off from Enron where it was formally known as Enron Oil and Gas Company. EOG is currently based in Houston, Texas where it employs over 3,000 foreign and national employees. In addition
Bbl Barrel = 42 U.S. gallons of oil$/Boe USD / barrel of oil equivalent$/Mcf USD / thousand cubic feet of natural gas $/Bbl USD / barrel of oilMBbls Thousand barrels of oilMMBbls Million barrels of oilMBbld Thousand barrels per dayMMBbld Million barrels per dayBcfe Billion cubic feet equivalent (6 Mcf : 1 Bbl)Mcf Thousand cubic feet of nautral gasBcf Billion cubic feet of natural gasMMcfd Million cubic feet per dayMboed Thousand barrels of oil equivalent per day
Useful Terms
Figure 1: Useful Oil and Gas Terms
Source: UOIG Spreads
Figure 2: Location of EOG’s Operations
Source: EOG Investor Relations
Figure 3: Fracking Technique
Source: Google Images

UOIG 3
Date of Presentation University of Oregon Investment Group April 10th, 2015
April 10th, 2015
Industry Overview The worldwide oil and gas industry has seen explosive growth over the past several years. Energy production and extraction takes place on almost every continent and almost every region of the world. Technology and extraction techniques vary greatly by geographic location and regulatory climate. There are some producers who boil tar sands in the plains of Alberta to extract oil and others in Saudi Arabia that practically sip petrochemicals out of the ground with nothing more than a straw. In the United States and around the world a majority of the current oil producers use techniques that are designed to speed up the extraction process while increasing the Estimated Ultimate Recovery (EUR) of a well.
EOG Resources and their main competitors primarily use an extraction technique called hydraulic fracturing to extract oil, natural gas and liquid natural gas out of the ground. This process involves drilling deep into a shale formation and pumping a high-pressure mixture of water, sand and chemicals into this geological formation. The goal is to crack the shale with the water and the chemical mixture, after this is completed the sand is deposited in the shale creating gaps and fissures that allows the natural gas and oil to escape. The natural gas is then captured at the wellhead on the ground level. After the initial, “frack” which only lasts a couple of days a well is able to supply oil or gas for roughly 30 to 40 years with little to no maintenance.
The oil and gas industry three main segments. These three main segments are upstream, midstream and downstream. EOG is an independent oil and gas producer, which means that they do not participate in production of oil and gas from start to finish. EOG has a midstream and upstream segment but not a downstream segment. They are not fully, “integrated” because they do not operate a downstream segment that refines and purifies their product. On the flip side, companies that refine oil and gas but do not extract it are also considered independent energy companies. Major integrated companies are mega-caps such as Exxon-Mobil, BP and Chevron. Upstream companies are involved in the exploration and extraction of petrochemicals. Midstream companies transport and market the natural resource to refiners. Downstream companies refine and sell the finished product to individual consumers. All of these producers are reliant are constantly having to update their current technology to stay competitive.
Another important technique that upstream oil producers use to reduce the volatility of the futures market is to hedge their future energy production. EOG currently has 47 MBbld of oil hedged for the second quarter at a price of $91.22, 10 MBbld of oil hedged at $89.98 for the third and fourth quarters and 182,000 MMBtu of Natural Gas hedged at $4.51 for the second through fourth quarters. Although this only accounts for a fraction of their estimated 596.2 MBoed, this hedging allows EOG to escape to some of the risk associated with exploring for and producing oil.
Regulation EOG and its domestic competitors are all subject to the same types of regulation that are designed to protect the environment while still allowing oil companies to profit. The most notable regulations that EOG is subject to are the following:
Clean Water Act - This law is meant to prevent surface water from being contaminated from oil and gas extraction.
Upstream Downstream
Exploration
Production
Transportation
Refining
Consumption
Figure 6: Oil Production Visualized
Source: UOIG Spreads
Figure 4: Future Upstream Revenue ($mm)
320
330
340
350
360
2016 2017 2018 2019 2020 2021
Future Industry Revenue ($mm)
Source: IBIS World
120130140150160
2015 2016 2017 2018 2019 2020
Future U.S. Oil and Gas Production Index
Figure 5: Future Upstream Production Index
Source: IBIS World

UOIG 4
Date of Presentation University of Oregon Investment Group April 10th, 2015
April 10th, 2015
Clear Air Act - This regulation requires EOG to report emissions from their operations. They also must obtain air permits at their drill sites.
Comprehensive Environmental Response, Compensation and Liability Act - This law taxes upstream producers and the revenue it set aside in a trust to clean up abandoned drill sites.
Emergency Planning and Community Right to Know Act – This law mandates EOG to contact local communities to give notice that they are drilling in the area.
Endangered Species Act – This law is meant to protect endangered wildlife. It requires the company to check with local conservationists to be sure they are not destroying an endangered animal’s habitat.
Oil Pollution Act of 1990 – This act affects both the upstream and midstream portions of EOG’s business. It mandates that oil producers clean up any oil spills to minimize environmental damage.
Resources Conservation and Recovery Act – This law mandates EOG to dispose of hazardous waste properly as to not affect human health.
Safe Drinking Water Act – This act is similar to the clean water act but protects ground water and aquafers as well as surface water.
Macro factors As an exploration and production energy corporation, EOG Resources is extremely sensitive to macroeconomic factors. Unlike many other industries the oil and gas industry has virtually no control over the price of their product. The recent collapse of energy prices has undoubtedly affected this segment of the market causing investors to question whether energy will continue to plummet or rebound. Even with the recent collapse of energy prices, oil and natural gas are still considered essential components to the global economy. Without these energy sources global commerce would be at a standstill. Both domestically and internationally energy consumption is correlated with economic prosperity and growth.
Since EOG resources produces the vast majority of their oil and natural gasses domestically, the company is reliant on the price of West Texas Intermediate (WTI) crude as well as NYMEX natural gas. Both of these classes of commodities have been trading at a discount since their record peaks in June of 2014. There are several reasons why energy is currently trading around levels that have not been seen since the 2008 recession. With oil at $110 a barrel it became extremely attractive to extract oil from shale and oil sands. These were considered, “unconventional” ways to extract oil due to difficulty and high exploration and input costs. This increase in production paired with a reduction in Middle Eastern conflicts caused there to be a large surplus of oil. Paired with decreased international oil subsidies and recessions in Russia, Germany and Japan oil prices started to drop. Finally, OPEC, the world’s largest energy cartel is continuing to allow oil prices to drop, they are doing this to push competitors out of the market. Many are predicting oil to rebound to around $60 a barrel by the end of the year, this is a far cry from the $110 we saw last year but would allow domestic shale producers to continue producing oil at a profit. In addition if Iran is able to start exporting their oil reserves this could dampen a price rebound and prices will continue to be depressed.
Figure 7: EPA Sets U.S. Regulations
Source: Google Images
020406080
100120
2009 2010 2011 2012 2013 2014 2015
Historic Price of Crude
Figure 8: WTI Historic Price of Crude ($)
Source: IBIS World
0
20
40
60
80
100
2015 2016 2017 2018 2019 2020 2021
Future Price of Crude
Figure 9: WTI Projected Price of Crude ($)
Source: IBIS World

UOIG 5
Date of Presentation University of Oregon Investment Group April 10th, 2015
April 10th, 2015
Competition EOG Resources experiences competition from other independent oil and gas companies as well as integrated oil and gas companies. They mainly compete with these companies for mineral rights, licenses, facilities, equipment and materials needed to explore for, produce and market oil, gas and liquid natural gas. Many of EOG’s competitors also have competitive advantages due to substantially more financial and government resources. Examples of competitors with substantially more financial resources include Exxon and BP. Competitors that possess greater government support are international competitors that are backed by their states, Saudi Aramco and Russia’s Gazprom. Domestic exploration and production competitors include Anadarko Petroleum, Occidental Petroleum, Noble energy, Devon energy and Pioneer Natural Resources. These companies compete with EOG in key markets such as the Eagle Ford Shale, Bakken Shale and Delaware Basin. EOG’s ability to develop low cost acreage is a key strategy the company uses to set itself apart from the competition. Companies that indirectly compete with EOG resources to a lesser extent are alternative energy sources. Examples of these competitors are SolarCity and Vestas.
Strategic Positioning EOG Resources has operations in the United States, Canada, Trinidad, China and the United Kingdom. 47% of their net proven reserves were oil, 19% were LNG and 34% were natural gas. Over 90% of their net proven reserves were located in the United States in key regions such as the Eagle Ford Shale, Bakken Shale, Rocky Mountain, Permian Basin and Barnett Shale. The Eagle Ford Shale is located in Southern Texas and continues to provide EOG with millions of barrels of oil equivalent worth of energy. EOG is the largest producer in the Eagle Ford area controlling 561,000 of the 624,000 total acres that exist there. This oilfield is considered the centerpiece of EOG’s oil and gas portfolio and has provided EOG with over 200 million barrels worth of oil. EOG is able to keep production costs down in this area by sourcing its own frack sand and taking advantage of its midstream transportation routes. Also located in Texas, the Permian Basin provides EOG with both crude oil and liquid natural gas. The company holds over 420,000 acres in this region with only a small amount of this total acreage developed. This region produces roughly 33,000 barrels of oil and NGL per day. Management outlined that they expect to continue exploiting this low cost play by adding 95 new wells in 2015. The Rocky Mountain and Bakken area of North Dakota both provide an abundance of natural gas and natural gas liquids. EOG is using this region to test the effects of spacing wells closer or further apart. They believe that by placing wells close together they will be able to pressurize multiple sides of the shale creating faster and more efficient fracks. They plan on producing 72 MBoed next year from this region. The 306,000 acre Barnett Shale in Texas produces natural gas. The company is testing different rock formations in the area to discover if the Vicksburg and Frio trends will yield in natural gas or natural gas liquids. For its domestic midstream segment EOG has contracts to deliver 56.5 MBbld of crude old in 2015 and 59.4 MBbld in 2016 to various refineries. They also have an unloading facility in Cushing, Oklahoma which is capable of handling 72 unit trainloads of oil and gas. In addition to this facility in Oklahoma EOG’s facility in Saint James, Louisiana has the capacity to handle 120MBbld of oil at a time. These two trading hubs make up a majority of the companies midstream business domestically.
Figure 12: Midstream Oil Unloading Terminal
Source: Google Images
0
200
400
XOM CVX ADR OXY EOG APC
Integrated Oil vs Independent Oil
Figure 10: Integrated Oil vs. Independent Oil Market Cap ($mm)
Source: UOIG Spreads
Oil47%
LNG19%
Gas34%
Proven Reserves by Type Figure 11: 2015 Proven Reserves
Source: UOIG Spreads
UOIG 6
Date of Presentation University of Oregon Investment Group April 10th, 2015
April 10th, 2015
Internationally, the company has reduced its presence by scaling back its Canadian operations and selling $400 million worth of production assets. Besides Canada, EOG has subsidiaries in Trinidad. These operations include an 80% working interest in an offshore exploration company, an 80% interest in the Pelican Field, a 50% working interest in the exploration of a government controlled offshore area. Also in Trinidad, they hold minority interests in two anhydrous ammonia operations. In China, rights for a natural gas field were acquired from ConocoPhillips, this operation is small and yields roughly 8.5 MMcfd of natural gas. Finally, in the United Kingdom, EOG operates a small operation yielding less than 0.1 MMcfd of natural gas. EOG is expected to exploit all of these oil and gas fields once energy prices bounce back. The management believes that they are positioning themselves to succeed after prices bounce back by operating in these domestic and foreign areas. Business Growth Strategies Due to the downswing in oil and natural gas prices, EOG’s management has stated that they will deviate away from their traditional growth strategies of drilling anywhere and everywhere. They will continue to drill for oil and natural gas, but they will be smarter and more efficient. Management has stated that in order to be successful in this bearish energy market they will need to exploit low cost plays. In addition they will utilize efficient low-cost technology that will enable them to generate maximum returns. They are confident in their ability to do this and believe this will position them for success when energy prices rebound. For fiscal year 2015 management outlined that they will extract around 298 MBblds of crude oil, around 84 MBblds of liquid natural gas and roughly 215 MBoeds of natural gas. A majority of this production will come from low cost plays in the Eagle Ford, Delaware Basin and Barnett Shale plays. After downsizing their operations in Canada and cutting production internationally EOG will look to expand domestically. They have plans to develop 80,000 acres of low cost acreage in the Delaware Basin. They believe that they can produce low cost wells at an average cost of $5.5 million per well by adopting new horizontal and vertical technologies and by spacing their wells closer together. At $5.5 million per well this would be a significant cost reduction. Average well costs in 2014 were $9.4 million and in 2013 a normal producing well cost the company around $10 million. They also believe that by placing these new wells closer together and by adopting new fracking techniques that production will be faster and more economical. These closely placed wells will pressurize the same area at multiple points which will force the natural resource out faster. In addition, these new wells will be built on low cost acreage acquired at low prices. They will also continue to produce natural gas liquids as the price for these liquids is expected to grow at a faster rate than traditional natural gas. In the Rocky Mountain area they are expected to increase production of liquids by at least 18%. Although management stated that they will not start any new upstream projects until oil is above $60 a barrel they will still continue to stake at future oil and gas plays. EOG is also continuing to increase the percentage of natural resources they extract from the Eagle Ford, Bakken, Permian and Barnett energy plays. In 2013 63% of their total production came from these areas and last year 69% of their total production came from these areas. They are doing this to decrease midstream transportation costs and because these regions are the most economical to produce in. EOG will all continue to grow organically unless an attractive low cost acquisition makes sense. They are also a potential buyout target with rumors that Statoil and Chevron are considering adding to their upstream and midstream portfolio.
Figure 15: Statoil could potentially buy EOG
Source: Google Images
1030910 835
560
0
500
1000
1500
2011 2012 2013 2014
Average Well Spacing (ft)
Figure 14: Average Well Spacing (feet)
Source: EOG Investor Relations
Figure 13: Acreage by Region Owned (‘000)
5864
338 124 59 1310
1000200030004000500060007000
UnitedStates
Canada Trinidad UnitedKingdom
China
Total Acreage by Area of Operation
Source: UOIG Spreads

UOIG 7
Date of Presentation University of Oregon Investment Group April 10th, 2015
April 10th, 2015
Management and Employee Relations William Thomas – Age 62 – Chairman of the Board and CEO
Mr. Thomas was elected chairman of the board and CEO in January 2014. Prior to this position he worked as the manager of the Fort Worth, Texas as well as the executive vice president of production. Mr. Thomas has been with the company since 1979. His entire career has been devoted to the oil and gas industry. In addition, he is a Texas native having attended Texas A&M University. His current compensation in $906,731 in addition to stock options.
Gary Thomas – Age 65 – COO
Mr. Thomas has been the chief operating officer of the company since September 2011. Before this position he was the executive vice president of North American operations for EOG Resources. Mr. Thomas has been with the company for almost 40 years having joined the predecessor of EOG before it was acquired by Enron. His current compensation is $704,385 plus stock options.
Timothy Driggers – Age 53 – CFO
Mr. Driggers was appointed to chief financial officer in 2007. Before being the CFO of EOG, Mr. Driggers worked as the controller. Mr. Driggers worked at Arthur Andersen as a senior director prior to EOG and received his Bachelor’s Degree from the University of South Alabama. His base salary is $458,077 and in addition he receives stock options.
Management Guidance In EOG’s fiscal year 2014 conference call management stressed the importance of cutting costs until the price of oil rebounds. They outlined several strategies for the year to accomplish this task. First, they are going to reduce new rigs by 50% in the coming year as this will help to drive down development and exploration costs. Next, they are going to add low cost acreage by purchasing mineral rights while the price of oil is down. Management also highlighted that even though they are able to generate a better return on $65 oil today than on $95 oil two years ago they will wait to grow production until oil is at least $60 a barrel. Since they are cash flow neutral at $65 a barrel management wants to wait for at least a $10 increase to ramps up production. Similar to what my NAV projects, management stated that if oil prices remain low and they do not continue to explore for more resources their reserves and production would decrease dramatically. The general theme of this call was that management wants to put the company in the best position to succeed after energy prices rebound.
Portfolio Strategy
EOG Resources is held in both the Tall Firs portfolio as well as the Svigals portfolio. Along with EOG there are three other independent oil companies we hold that are involved in upstream energy production (APC) (NE) (PXD). There is one integrated oil company we own that is involved in upstream production that we hold. (TSO). EOG was originally pitched on April 8th, 2011 by Cameron
Management Guidance ProjectionOil 270.7-304.9 298.5LNG 68-88 84.3Gas 201.6-213.8 213.4
Figure 17: Management 2015 Production Guidance vs. UOIG Projection (MMBoe)
Source: UOIG Spreads
Figure 16: FY ’14 Compensation
Source: UOIG Spreads
William Thomas 10,548,457.00$ Gary Thomas 8,562,261.00$ Timothy Driggers 3,499,005.00$
Total Management Compensation
50
55
60
65
70
75
2015 2016 2017 2018 2019 2020 2021 2022 2023 2024
WTI Price per Barrel ($)
Figure 18: Management is Expecting Oil to Perform Better than the Current Futures Curve ($)
Source: UOIG Spreads
UOIG 8
Date of Presentation University of Oregon Investment Group April 10th, 2015
April 10th, 2015
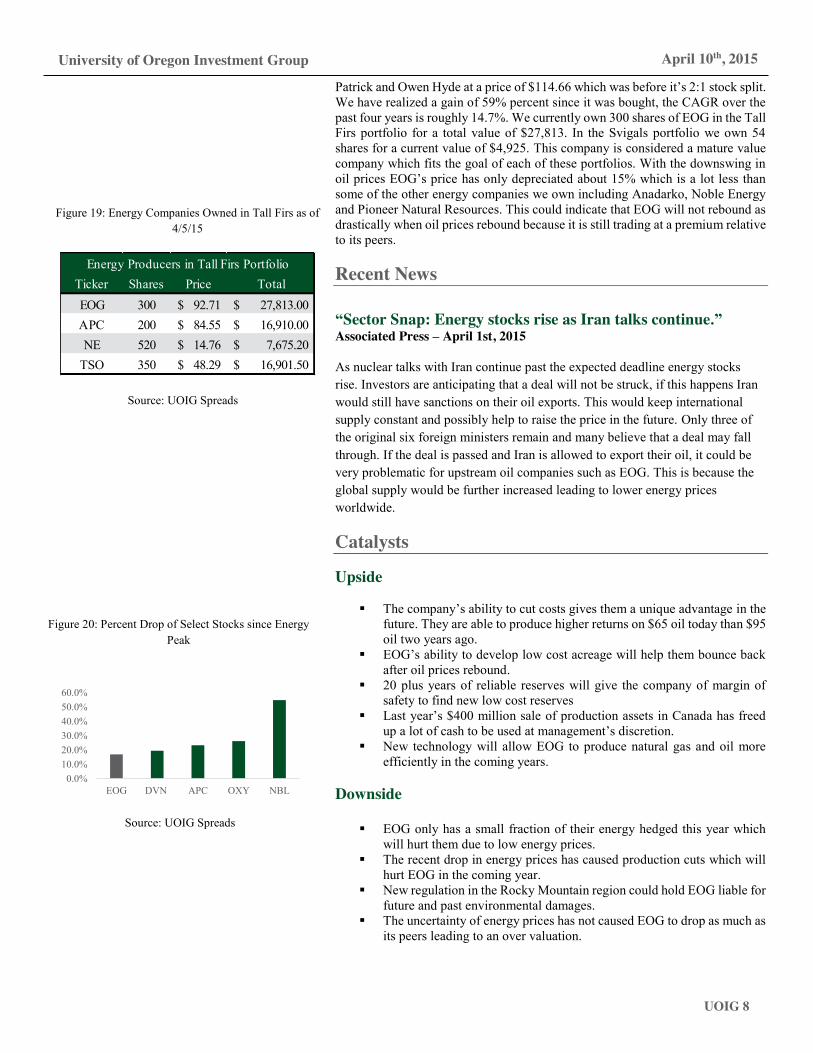
Patrick and Owen Hyde at a price of $114.66 which was before it’s 2:1 stock split. We have realized a gain of 59% percent since it was bought, the CAGR over the past four years is roughly 14.7%. We currently own 300 shares of EOG in the Tall Firs portfolio for a total value of $27,813. In the Svigals portfolio we own 54 shares for a current value of $4,925. This company is considered a mature value company which fits the goal of each of these portfolios. With the downswing in oil prices EOG’s price has only depreciated about 15% which is a lot less than some of the other energy companies we own including Anadarko, Noble Energy and Pioneer Natural Resources. This could indicate that EOG will not rebound as drastically when oil prices rebound because it is still trading at a premium relative to its peers.
Recent News
“Sector Snap: Energy stocks rise as Iran talks continue.” Associated Press – April 1st, 2015
As nuclear talks with Iran continue past the expected deadline energy stocks rise. Investors are anticipating that a deal will not be struck, if this happens Iran would still have sanctions on their oil exports. This would keep international supply constant and possibly help to raise the price in the future. Only three of the original six foreign ministers remain and many believe that a deal may fall through. If the deal is passed and Iran is allowed to export their oil, it could be very problematic for upstream oil companies such as EOG. This is because the global supply would be further increased leading to lower energy prices worldwide.
Catalysts
Upside
The company’s ability to cut costs gives them a unique advantage in the future. They are able to produce higher returns on $65 oil today than $95 oil two years ago.
EOG’s ability to develop low cost acreage will help them bounce back after oil prices rebound.
20 plus years of reliable reserves will give the company of margin of safety to find new low cost reserves
Last year’s $400 million sale of production assets in Canada has freed up a lot of cash to be used at management’s discretion.
New technology will allow EOG to produce natural gas and oil more efficiently in the coming years.
Downside
EOG only has a small fraction of their energy hedged this year which will hurt them due to low energy prices.
The recent drop in energy prices has caused production cuts which will hurt EOG in the coming year.
New regulation in the Rocky Mountain region could hold EOG liable for future and past environmental damages.
The uncertainty of energy prices has not caused EOG to drop as much as its peers leading to an over valuation.
Ticker Shares Price TotalEOG 300 92.71$ 27,813.00$ APC 200 84.55$ 16,910.00$ NE 520 14.76$ 7,675.20$
TSO 350 48.29$ 16,901.50$
Energy Producers in Tall Firs Portfolio
Figure 19: Energy Companies Owned in Tall Firs as of 4/5/15
Source: UOIG Spreads
Figure 20: Percent Drop of Select Stocks since Energy Peak
0.0%10.0%20.0%30.0%40.0%50.0%60.0%
EOG DVN APC OXY NBL
Percent Drop Since Peak
Source: UOIG Spreads

UOIG 9
Date of Presentation University of Oregon Investment Group April 10th, 2015
April 10th, 2015
If the recent talks in Iran allow them to export oil, both oil prices and EOG will be hurt.
Comparable Analysis
Comparable companies were chosen based on a combination of market capitalization, beta, debt to equity ratio, similarity of business plans and growth rates. All of these companies are based in the United States and operate in generally the same region as EOG resources. They also all have upstream as well as midstream operations. In addition all of these comparable companies are based in the United States and experience very similar risk factors as EOG Resources. When performing a comparable analysis for companies that engage in upstream oil production there are two specific industry multiples that are of extra importance. The first industry multiple used is enterprise value over daily production, which is measured in thousands of oil equivalent per day this was weighted 35%. The second industry specific multiple is enterprise value over EBITDAX, EBITDAX being EBITDA with exploration expense incorporated this was also weighted at 35%. These multiples allow one to compare the efficiency of upstream oil suppliers from a valuation standpoint. Enterprise value over EBITDA was also used, but weighted less than EV/EBITDA and EV/Daily Production to value the midstream segment of the business, this metric was weighted 30%. Since I did not perform a DCF analysis all of EOG’s growth rates and future projections were pulled off FactSet. These numbers were also double checked against management projections. In addition, EOG management guidance was in-line with FactSet projections.
Occidental Petroleum Corporation (OXY) – 30% “Occidental Petroleum Corporation engages in the acquisition, exploration, and development of oil and gas properties in the United States and internationally. The company operates in three segments: Oil and Gas; Chemical; and Midstream, Marketing and Other. The Oil and Gas segment explores for, develops, and produces oil and condensate, natural gas liquids (NGLs), and natural gas. Its domestic oil and gas operations are located in Colorado, New Mexico, North Dakota, and Texas; and international oil and gas operations are located in Bahrain, Bolivia, Colombia, Iraq, Libya, Oman, Qatar, the United Arab Emirates, and Yemen. The company was founded in 1920 and is headquartered in Houston, Texas.” – Yahoo Finance
Occidental Petroleum is one of EOG Resource’s major competitors that is also based in Houston, Texas. Occidental Petroleum was one of my most heavily weighted comparable companies for several reasons. To start, OXY’s revenue, EBITDA and EPS growth rates are almost identical to EOG’s growth rates, take 2016 revenue growth for example, EOG is growing at 15.70% while OXY is growing at 15.80%. In addition, both companies operate domestically and internationally with a vast majority of production coming from domestic markets. These two companies both operate in Texas, Colorado and North Dakota extracting the same types of resources using similar technologies. In addition to their upstream segment both of these companies operate a midstream-marketing segment that accounts for a significant portion of revenue. Finally, these two companies have a similar beta, similar market cap and similar D/E levels.
Figure 23: Occidental Petroleum
Source: Google Images
Country MMBbldSaudi Arabia 7334
Iran 2367UAE 2359
Kuwait 2176Iraq 1713
Qatar 1071
Major Middle Eastern Oil Producers
Figure 21: Impact on Supply if Iran is allowed to Export Oil
Source: OPEC
EV/EBITDA 75.36 30.00%EV/EBITDAX 74.43 35.00%EV/Daily Production 77.93 35.00%Price Target $75.93Current Price 91.22Overvalued (16.76%)
Forward Comparable Analysis
Figure 22: Comparable Analysis
Source: UOIG Spreads

UOIG 10
Date of Presentation University of Oregon Investment Group April 10th, 2015
April 10th, 2015
Anadarko Petroleum Corporation (APC) – 30% “Anadarko Petroleum Corporation engages in the exploration, development, production, and marketing of oil and gas properties. It operates through three segments: Oil and Gas Exploration and Production; Midstream; and Marketing. The Oil and Gas Exploration and Production segment explores for and produces natural gas, oil, condensate, and natural gas liquids (NGLs). The Midstream segment provides gathering, processing, treating, and transportation services to Anadarko and third-party oil, natural-gas, and NGLs producers, as well as owns and operates gathering, processing, treating, and transportation systems in the United States. The Marketing segment markets oil, natural gas, and NGLs. Anadarko Petroleum Corporation was founded in 1959 and is headquartered in The Woodlands, Texas.” – Yahoo Finance
Anadarko Petroleum is another Houston area based competitor that operates in the same market as EOG Resources. Anadarko, like EOG Resources is an upstream and midstream producer of petroleum, liquid natural gas and natural gas. This company was heavily weighted at 30% due to its fundamental similarities to EOG Resources. In addition to a similar beta, market cap and D/E Ratio were also very comparable. Since APC operates in the same space as EOG, revenue, EBITDA and EPS growth rates were similar as well. Anadarko also has a large majority of their production coming from domestic plays that are shared with EOG Resources. In shared key markets such as Texas and North Dakota there are stories of APC and EOG bidding for the mineral rights of the exact same acreage. With the exception of Anadarko’s more extensive offshore drilling operations, these two companies also have very similar extraction techniques and are subject to almost identical risk factors. In addition this company is held in the UOIG equity portfolios.
Noble Energy, Inc. (NBL) – 20%
“Noble Energy, Inc., an independent energy company, engages in the acquisition, exploration, and production of crude oil, natural gas, and natural gas liquids worldwide. Its principal projects are located in onshore DJ Basin and Marcellus Shale, the United States; the deep-water Gulf of Mexico; offshore West Africa; and offshore Eastern Mediterranean. As of December 31, 2014, the company had approximately 1,404 million barrels oil equivalent of total proved reserves. Noble Energy, Inc. was founded in 1932 and is headquartered in Houston, Texas.” – Yahoo Finance
Similar to EOG Resources, Noble Energy engages in both upstream and midstream energy production. However, this company operates on both land and performs sea drilling in the Gulf of Mexico and off the coast of Africa. This company has almost the exact same beta as EOG Resources, is a large cap stock and has relatively similar growth rates. After spinning off a portion of their offshore rigs last year Noble Energy is now very comparable to EOG Resources. It has similar exposure in key markets in Texas and is subject to many of the same risks as EOG Resources. They also own a 34% stake in a midstream production company, which gives them exposure in upstream and midstream markets. I choose to weight Noble at 20% because of these similar risks. I did not weight it more than 20% because of their involvement with sea drilling and growth rates that are not quite as in-line compared to some other comps
Devon Energy Corporation (DVN) – 10%
“Devon Energy Corporation, an independent energy company, primarily engages in the exploration, development, and production of oil, natural gas, and
Source: Google Images
Figure 25: Noble Energy
Figure 24: Anadarko Petroleum
Source: Google Images

UOIG 11
Date of Presentation University of Oregon Investment Group April 10th, 2015
April 10th, 2015
natural gas liquids (NGLs) in the United States and Canada. It holds interests in various properties located in Anadarko Basin, Barnett Shale, Eagle Ford, Mississippian-Woodford Trend, Permian Basin, and Rockies in the United States, as well as in the Jackfish and Pike heavy oil projects located in Alberta, Canada. As of December 31, 2014, the company had 689 MMBoe of proved undeveloped reserves. It operates approximately 19,000 wells. The company also offers marketing and midstream services. Devon Energy Corporation was founded in 1971 and is headquartered in Oklahoma City, Oklahoma.” – Yahoo Finance
Devon Energy operates in the same area as EOG Resources acting as an upstream and midstream producer of oil, natural gas, liquid natural gas and bitumen, which is a component in asphalt. They have a risk profile that is similar to EOG Resources and operate in the same geographical area. They have a similar beta and area large cap company. Their growth rates are slightly less dramatic than EOG’s growth rates. This leads me to believe that they will not be quite as negatively impacted by the downswing in energy prices as EOG resources. They are also able to produce some energy products for as little as $5.25 per BOE, which is significantly less than EOG Resources. For these reasons I chose to weight DVN at only 10%
Pioneer Natural Resources (PXD) – 10%
“Pioneer Natural Resources Company engages in the exploration and production of oil and gas in the United States. The company produces and sells oil, natural gas liquids (NGLs), and gas. It has operations primarily in the Permian Basin in West Texas, the Eagle Ford Shale play in South Texas, the Raton field in southeastern Colorado, and the West Panhandle field in the Texas Panhandle. As of December 31, 2014, the company had proved undeveloped reserves and proved developed reserves of approximately 89 MMBbls of oil, 42 MMBbls of NGLs, and 317 billion cubic feet of gas; and owned interests in 6 gas processing plants and 8 treating facilities. The company was founded in 1997 and is headquartered in Irving, Texas.” – Yahoo Finance
Pioneer Natural Resources is a Texas based upstream oil company that recently gained exposure in the midstream oil production market through a joint venture with Reliance Industries, Ltd. They have similar exposure as EOG in plays such as the Eagle Ford Shale and in South Texas. They have a slightly higher beta than EOG and market cap is half that of EOG. Their growth rates are slightly less dramatic than EOG Resources, which leads me to believe that they have slightly different risks and opportunities compared to EOG. This could be to their minority stakes in a couple downstream processing plants. Due to these factors I felt as if this company deserved a 10% weighting. In addition this company is held in the UOIG equity portfolios.
Net Asset Valuation
EOG Resources is an upstream oil producer which presents a unique opportunity when it comes to valuing this company. Capital expenditures are a huge part of EOG’s revenue and therefore a discounted cash flow analysis is not appropriate for this company. When valuing EOG I used a net asset valuation model or a NAV for short, this model is a great way to value the current and future cash flows of an upstream oil company that has so much capital expenditures. Unlike a DCF, a NAV does not assume that a company will grow into perpetuity. Instead a NAV models the cash flow of an oil company assuming it does not discover any new resources and uses up all of its current proven reserves. This eliminates the need to project exploration cost and future reserves discovered. After future cash flows
Source: Google Images
Figure 27: Pioneer Natural Resources
Source: Google Images
Figure 26: Devon Energy

UOIG 12
Date of Presentation University of Oregon Investment Group April 10th, 2015
April 10th, 2015
are calculated they are discounted back to present value using the weighted average cost of capital. This then gives you the total present value of a company similar to a DCF.
Production Model
Predicting the future production proved to be a challenge. In order to effectively do this I had to take a couple of factors into account. I broke energy produced into the type of energy it was measured in MMBoed. This meant that every barrel produced was accounted for and placed in either the oil, liquid natural gas or natural gas category. I then broke each of these categories into the region where it was produced. Next, I looked on the company’s financial statements to figure out how much of each energy type was in unproduced and still in the ground, this was listed as net proven reserves. Management then gave guidance for the amount of energy that is expected to be produced in 2015, I took these numbers and figured out 2015’s total production. After this first year I assumed that they would no longer be exploring and therefore no longer be finding anymore reserves. Since oil, liquid natural gas and natural gas follow an exponential depletion curve known as the, “Hubbert Curve” I determined that EOG’s production outputs would follow an exponential decay. EOG did not provide specific rates of decline but I did find an upstream producer that operates in the same geographic area that did give exact rates. This company, Ultra Petroleum provided decline rates for the next 40 years. EOG’s management has stated that by using their current technology they believe an average well will use up 30% of proven reserves in the first 5 years that it is online, and take around 40 years to run out of reserves. Since Ultra Petroleum’s decline rates were slightly faster than this I flattened their decline curve and tailored it to fit EOG’s specific circumstance of using 30% of the reserves in the first five years. At the end of 40 years my model show EOG running out of their reserves.
After calculating the total oil, liquid natural gas and gas produced for the next 40 years in MMBoe, I then determined the future revenue of their upstream segment. I did this by multiplying production by a combination of the current futures curve and an arbitrary futures curve. I used the current futures curve as a worst-case scenario to project EOG’s future revenue and an arbitrary curve as a better case scenario. I did this because the current futures curve projects oil to be trading at less than $70 a barrel in 2024, I believe this is low and I think it will be trading at around $105 a barrel in 2024. Since future energy prices are so crucial to this company’s valuation I thought it was appropriate to do this. I did weight the price of the current futures oil curve at 60% and my arbitrary one at 40% since the current curve may paint a slightly more accurate picture for the next couple years. Also, since liquid natural gas does not trade as a commodity I determined that it would be correlated to natural gas.
Expenses and Cash Flows
After determining the total revenue I then had to calculate the total expense of developing and producing these current reserves. I only took into account production expense and development expense, not exploration expense because as stated earlier, a NAV assumes that no future reserves are discovered. I averaged the past three year’s production costs to determine the average barrel of oil equivalent cost $6.06 to produce. I assumed this same cost would continue into the future. To develop the future reserves in the ground management stated that it would cost $2,040 million dollars. I spread this over the next ten years due to deferred production and historical guidance on time required to develop a producing well. After subtracting the total expenses from total revenue I ended up with pretax cash flows. I then assumed EOG’s current tax rate of 33% would
0
0.2
0.4
0.6
2010 2011 2012 2013 2014
Natural Gas as a % of Liquid Natural Gas
Figure 30: LNG to Natural Gas Correlation
Source: UOIG Spreads
Figure 29: EOG Decline Curve
Source: EOG Investor Relations
Figure 28: PV of Cash Flows using current futures curve and arbitrary futures curve
Source: UOIG Spreads
PV of Cash Flows PV WeightCurrent Futures Curve 19,637.91$ 60%Projected Futures Curve 26,680.98$ 40%Weighted Average PV 22,455.14$

UOIG 13
Date of Presentation University of Oregon Investment Group April 10th, 2015
April 10th, 2015
continue for the next 40 years and arrived at an after-tax cash flow. This was then discounted using the weighted average cost of capital and the total present values of cash flow was added up to get the upstream segment’s present value.
Midstream Enterprise Value
The cash flows projected in my net asset valuation only value the upstream portion of EOG’s business. In order to get a fair valuation of EOG Resources it is also necessary to value the midstream segment as well. Once the midstream portion of the business was valued this valuation was added to the upstream valuation to come up with a total firm value. To get this midstream valuation I found several midstream only independent oil companies with similar EV/Revenue multiples to EOG Resources. I used a companies that operate in the same region as EOG Resources using the same types of midstream technology and took the weighted average of their EV/Revenue multiples. I then multiplied EOG’s projected midstream revenue by the weighted average EV/Revenue multiple to come up with an Enterprise Value of EOG’s midstream segment.
Beta
The Beta for EOG Resources was calculated using the three year daily, five year daily, five year weekly. These were regressed against the S and P 500 and used due to their low standard errors. In addition, the Vasicek and Hamada betas were calculated and used to take debt levels and tax levels of my comparable companies into account.
Recommendation
Based on an equal weighting of my comparable analysis and net asset valuation I believe that EOG Resources is a sell. In all industry metrics used, including EV/EBITDA, EV/EBITDAX and EV/Daily Production EOG is overvalued. In addition EOG’s stock price has depreciated significantly less than its peer as investors are paying for EOG’s strong balance sheet. This will cause a reduction in EOG’s appreciation when energy prices rebound. In addition EOG’s management has repeatedly stated they are positing themselves to succeed when oil prices rebound, they have not laid out any guidelines for generating return in the near future for investors. Also, if energy prices don’t rebound EOG will struggle to remain profitable as they run out of low cost reserves. My final price target is
Figure 31: Beta
Beta SE Weighting1 Year Daily 1.38 0.15 0.00%3 Year Daily 1.54 0.07 20.00%5 Year Daily 1.41 0.04 40.00%3 Year Weekly 1.41 0.15 0.00%5 Year Weekly 1.31 0.09 10.00%Comps - Vasicek 1.46 15.00%ETF - Vasicek 1.40 0.00%Comps - Hamada 1.27 15.00%EOG Resources, Inc. Beta 1.41
Source: UOIG Spreads
Figure 32: Final Valuation
Source: UOIG Spreads
Valuation Method Implied Price WeightingNAV 73.09$ 50%Comparable Analysis 75.93$ 50%
Final Price Target 74.51Current Price 91.22Overvalued 18.32%
Final Valuation

UOIG 14
April 10th, 2015 University of Oregon Investment Group
Appendix 1 – Relative Valuation
Multiple Implied Price WeightEV/Revenue 100.79 0.00%EV/Gross Profit 68.91 0.00%EV/EBIT (366.92) 0.00%EV/EBITDA 75.36 30.00%EV/EBITDAX 74.43 35.00%EV/Daily Production 77.93 35.00%Market Cap/Net Income = P/E 21.23 0.00%Price Target $75.93Current Price 91.22Overvalued (16.76%)
Comparables Analysis EOG OXY APC NBL DVN PXD
($ in millions)EOG Resources,
Inc.
Occidental Petroleum
CorporationAnadarko Petroleum
Noble Energy, Inc.
Devon Energy Corporation
Pioneer Natural Resources
Stock Characteristics Max Min Median Weight Avg. 30.00% 30.00% 20.00% 10.00% 10.00%Current Price $166.88 $48.87 $74.24 $80.05 $91.22 $74.24 $83.86 $48.87 $61.58 $166.88Beta 1.75 1.14 1.44 1.37 1.41 1.14 1.47 1.44 1.24 1.75SizeShort-Term Debt 1,432.00 0.00 0.00 162.00 500.00 - - 94.00 1,432.00 - Long-Term Debt 15,092.00 2,665.00 6,838.00 9,049.10 5,390.00 6,838.00 15,092.00 6,103.00 9,830.00 2,665.00Cash and Cash Equivalent 7,369.00 1,025.00 1,480.00 3,834.50 2,087.21 3,789.00 7,369.00 1,183.00 1,480.00 1,025.00Non-Controlling Interest - - - - - - - - - - Preferred Stock - - - - - - - - - - Diluted Basic Shares 770.61 149.07 411.10 515.22 559.37 770.61 511.64 372.63 411.10 149.07Market Capitalization 57,207.37 17,876.04 25,315.54 38,533.77 50,344.38 57,207.37 42,592.21 17,876.04 25,315.54 24,871.31Enterprise Value 60,256.37 22,890.04 35,097.54 43,910.37 54,147.17 60,256.37 50,315.21 22,890.04 35,097.54 26,511.31Growth Expectations % Revenue Growth 2015E (10.80%) (37.30%) (20.80%) (24.98%) (31.40%) (20.80%) (37.30%) (23.60%) (17.50%) (10.80%)% Revenue Growth 2016E 23.90% 2.40% 15.80% 17.11% 15.70% 15.80% 23.90% 18.60% 2.40% 12.40%% EBITDA Growth 2015E (24.90%) (52.90%) (29.40%) (42.81%) (47.20%) (52.50%) (52.90%) (29.40%) (24.90%) (28.20%)% EBITDA Growth 2016E 39.10% (2.40%) 13.40% 24.63% 34.10% 30.60% 39.10% 13.40% (2.40%) 12.80%% EPS Growth 2015E (59.70%) (133.80%) (80.00%) (93.15%) (93.50%) (76.00%) (133.80%) (81.20%) (59.70%) (80.00%)% EPS Growth 2016E 536.10% -11.40% 85.95% 66.14% 536.10% 135.30% N/A 95.00% (11.40%) 76.90%Profitability MarginsGross Margin 73.06% 42.03% 62.96% 58.38% 0.42 0.51 0.63 0.63 0.43 0.73EBIT Margin 13.86% (.31%) 10.23% 7.89% 0.04 0.10 0.00 0.13 0.10 0.14EBITDA Margin 66.32% 32.84% 49.89% 49.12% 0.38 0.40 0.50 0.66 0.33 0.56Net Margin 8.70% (6.43%) 4.88% 2.62% 0.03 0.09 -0.06 0.05 0.05 0.05Credit MetricsInterest Expense - - - - - - - - - - Debt/EV 0.32 0.10 0.27 0.22 0.11 0.11 0.30 0.27 0.32 0.10Leverage Ratio 2.94 1.12 2.12 2.06 1.25 1.12 2.94 2.40 2.12 1.47Interest Coverage Ratio - - - - - - - - - - Operating ResultsRevenue $16,152.00 $3,211.00 $10,272.00 $10,406.10 $12,374.00 $15,362.00 $10,272.00 $3,898.00 $16,152.00 $3,211.00Gross Profit $7,822.00 $2,346.00 $6,479.00 $5,708.60 $5,201.00 $7,822.00 $6,479.00 $2,454.00 $6,929.00 $2,346.00EBIT $1,652.00 ($32.00) $512.00 $756.10 $455.00 $1,512.00 ($32.00) $512.00 $1,652.00 $445.00EBITDA $6,126.00 $1,813.00 $5,125.00 $4,604.00 $4,694.00 $6,126.00 $5,125.00 $2,585.00 $5,304.00 $1,813.00EBITDAX $6,279.60 $1,931.00 $5,304.00 $5,021.14 $5,225.20 $6,279.60 $6,119.80 $2,889.10 $5,304.00 $1,931.00Net Income $1,336.00 ($661.00) $187.00 $334.50 $376.00 $1,336.00 ($661.00) $187.00 $788.00 $158.00Exploration Expense $994.80 $0.00 $153.60 $417.14 $531.20 $153.60 $994.80 $304.10 $0.00 $118.00Daily Production (Mboe/D) 826.40 203.00 644.70 589.22 596.18 644.70 826.40 309.70 656.50 203.00MultiplesEV/Revenue 8.26x 2.17x 4.9x 4.86x 4.38x 3.92x 4.9x 5.87x 2.17x 8.26xEV/Gross Profit 11.3x 5.07x 7.77x 8.14x 10.41x 7.7x 7.77x 9.33x 5.07x 11.3xEV/EBIT 119.x -1,572.35x 39.85x -442.73x 119.x 39.85x -1572.35x 44.71x 21.25x 59.58xEV/EBITDA 14.62x 6.62x 9.82x 9.79x 11.54x 9.84x 9.82x 8.85x 6.62x 14.62xEV/EBITDAX 15.64x 6.62x 10.09x 10.91x 13.01x 10.09x 12.18x 10.04x 6.62x 15.64xEV/Daily Production 130.6x 53.46x 73.91x 79.49x 90.82x 93.46x 60.88x 73.91x 53.46x 130.6xMarket Cap/Net Income = P/E 157.41x -64.44x 42.82x 31.59x 133.89x 42.82x -64.44x 95.59x 32.13x 157.41x

UOIG 15
April 10th, 2015 University of Oregon Investment Group
Appendix 2 – Production Model
Crude Oil and Condensate Production Model Q1 Q2 Q3 Q4(Volumes in MBbld) 2010A 2011A 2012A 2013A 2014A 03/31/2015E 06/30/2015E 09/30/2015E 12/31/2015E 2015E 2016E 2017E 2018E 2019E 2020E 2021E 2022E 2023E 2024EUnited StatesEagle Ford 4.1 30.2 72.3 122.3 178.0 182.0 183 184 185 183.5 106.0 86.6 75.6 68.3 63.8 60.3 57.4 55.0 52.8Barnett 6.8 15.2 13.0 11.7 9.5 10.0 10.3 10.5 10.8 10.4 6.0 4.9 4.3 3.9 3.6 3.4 3.2 3.1 3.0Other 52.3 56.6 64.0 78.1 94.5 96.5 97.5 98.5 99.5 98.0 56.6 46.2 40.4 36.5 34.1 32.2 30.6 29.4 28.2Total 63.2 102 149.3 212.1 282.0 288.5 290.75 293 295.25 291.9 168.7 137.7 120.3 108.6 101.5 95.9 91.2 87.4 84.0% of Total Production 84.61% 89.95% 94.55% 96.23% 97.61% 98.26% 97.95% 97.63% 97.33% 97.79% 97.79% 97.79% 97.79% 97.79% 97.79% 97.79% 97.79% 97.79% 97.79%Canada 6.7 7.9 7.0 7.0 5.8 4.0 5.0 6.0 7.0 5.5 3.2 2.6 2.3 2.0 1.9 1.8 1.7 1.6 1.6% of Total Production 8.97% 6.97% 4.43% 3.18% 2.01% 1.36% 1.68% 2.00% 2.31% 1.84% 1.84% 1.84% 1.84% 1.84% 1.84% 1.84% 1.84% 1.84% 1.84%Trinadad and Tobago 4.7 3.4 1.5 1.2 1.0 1.0 1.0 1.0 1.0 1.0 0.6 0.5 0.4 0.4 0.3 0.3 0.3 0.3 0.3% of Total Production 6.29% 3.00% 0.95% 0.54% 0.35% 0.34% 0.34% 0.33% 0.33% 0.34% 0.34% 0.34% 0.34% 0.34% 0.34% 0.34% 0.34% 0.34% 0.34%Other International 0.1 0.1 0.1 0.1 0.1 0.1 0.1 0.1 0.1 0.1 0.1 0.0 0.0 0.0 0.0 0.0 0.0 0.0 0.0% of Total Production 0.13% 0.09% 0.06% 0.05% 0.03% 0.03% 0.03% 0.03% 0.03% 0.03% 0.03% 0.03% 0.03% 0.03% 0.03% 0.03% 0.03% 0.03% 0.03%Total Crude Oil and Condensate Production 74.7 113.4 157.9 220.4 288.9 293.6 296.9 300.1 303.4 298.5 172.5 140.8 123.0 111.1 103.8 98.1 93.3 89.4 85.9% Change 35.33% 51.81% 39.24% 39.58% 31.08% 3.31% -42.22% -18.34% -12.69% -9.66% -6.57% -5.52% -4.86% -4.14% -3.94%
Liquid Natural Gas Production Model Q1 Q2 Q3 Q4(Volumes in MBbld) 2010A 2011A 2012A 2013A 2014A 03/31/2015E 06/30/2015E 09/30/2015E 12/31/2015E 2015E 2016E 2017E 2018E 2019E 2020E 2021E 2022E 2023E 2024EUnited StatesEagle Ford 0.2 3.9 11.2 18.6 24.7 25 25.5 26 26.5 25.8 22.3 18.2 15.9 14.4 13.4 12.7 12.1 11.6 11.1Barnett 16.3 22.6 25.8 24.2 25.1 26 26.5 27 27.5 26.8 23.2 18.9 16.5 14.9 13.9 13.2 12.5 12.0 11.5Other 13 15 18.1 21.5 29.9 30.5 31 31.5 32 31.3 27.1 22.1 19.3 17.4 16.3 15.4 14.6 14.0 13.5Total 29.5 41.5 55.1 64.3 79.7 81.5 83 84.5 86 83.8 72.6 59.3 51.7 46.7 43.7 41.3 39.2 37.6 36.1% of Total Production 97.04% 97.88% 98.57% 98.62% 99.25% 99.39% 99.40% 99.41% 99.42% 99.41% 99.41% 99.41% 99.41% 99.41% 99.41% 99.41% 99.41% 99.41% 99.41%Canada 0.9 0.9 0.8 0.9 0.6 0.5 0.5 0.5 0.5 0.5 0.4 0.4 0.3 0.3 0.3 0.2 0.2 0.2 0.2% of Total Production 2.96% 2.12% 1.43% 1.38% 0.75% 0.61% 0.60% 0.59% 0.58% 0.59% 0.59% 0.59% 0.59% 0.59% 0.59% 0.59% 0.59% 0.59% 0.59%Total Liquid Natural Gas Production 30.4 42.4 55.9 65.2 80.3 82.0 83.5 85.0 86.5 84.3 73.0 59.6 52.0 47.0 43.9 41.5 39.5 37.8 36.4% Growth 28.81% 39.47% 31.84% 16.64% 23.16% 4.92% -13.36% -18.34% -12.69% -9.66% -6.57% -5.52% -4.86% -4.14% -3.94%
Natural Gas Production Model Q1 Q2 Q3 Q4(Volumes in MBoed) 2010A 2011A 2012A 2013A 2014A 03/31/2015E 06/30/2015E 09/30/2015E 12/31/2015E 2015E 2016E 2017E 2018E 2019E 2020E 2021E 2022E 2023E 2024EUnited StatesEagle Ford 0.7 3.5 10.8 19.2 27.3 26.7 26.8 27.0 27.2 26.92 17.1 14.0 12.2 11.0 10.3 9.7 9.3 8.9 8.5Barnett 67.3 67.17 61.3 50.8 48.2 46.7 46.8 47.0 47.2 46.92 29.9 24.4 21.3 19.2 18.0 17.0 16.2 15.5 14.9Other 120.8 114.83 100.2 81.3 77.8 74.2 74.3 74.5 74.7 74.42 47.4 38.7 33.8 30.5 28.5 26.9 25.6 24.6 23.6Total 188.8 185.50 172.3 151.3 153.3 147.5 148.0 148.5 149.0 148.3 94.4 77.1 67.3 60.8 56.8 53.7 51.1 49.0 47.0% of Total Production 67.12% 69.48% 68.21% 67.41% 68.00% 69.47% 69.43% 69.45% 69.46% 69.45% 69.45% 69.45% 69.45% 69.45% 69.45% 69.45% 69.45% 69.45% 69.45%Canada 33.3 22 15.8 12.7 10.2 5.0 4.8 4.7 4.5 4.8 3.0 2.5 2.2 1.9 1.8 1.7 1.6 1.6 1.5% of Total Production 11.85% 8.24% 6.27% 5.64% 4.51% 2.35% 2.27% 2.18% 2.10% 2.23% 2.23% 2.23% 2.23% 2.23% 2.23% 2.23% 2.23% 2.23% 2.23%Trinadad and Tobago 56.8 57.3 63.0 59.2 60.5 58.3 58.8 59.2 59.5 59.0 37.5 30.7 26.8 24.2 22.6 21.3 20.3 19.5 18.7% of Total Production 20.20% 21.47% 24.93% 26.35% 26.83% 27.47% 27.60% 27.67% 27.74% 27.62% 27.62% 27.62% 27.62% 27.62% 27.62% 27.62% 27.62% 27.62% 27.62%Other International 2.3 2.2 1.5 1.3 1.5 1.5 1.5 1.5 1.5 1.5 1.0 0.8 0.7 0.6 0.6 0.5 0.5 0.5 0.5% of Total Production 0.83% 0.81% 0.59% 0.59% 0.67% 0.71% 0.70% 0.70% 0.70% 0.70% 0.70% 0.70% 0.70% 0.70% 0.70% 0.70% 0.70% 0.70% 0.70%Total Natural Gas Production 281.3 267.0 252.7 224.5 225.5 212.3 213.2 213.8 214.5 213.46 135.9 111.0 96.9 87.6 81.8 77.3 73.5 70.5 67.7% Growth 2.61% -5.09% -5.37% -11.15% 0.45% -5.34% -36.32% -18.33% -12.69% -9.66% -6.57% -5.52% -4.86% -4.14% -3.94%
Total Production Model Q1 Q2 Q3 Q4(Volumes in MBoed) 2010A 2011A 2012A 2013A 2014A 03/31/2015E 06/30/2015E 09/30/2015E 12/31/2015E 2015E 2016E 2017E 2018E 2019E 2020E 2021E 2022E 2023E 2024ETotal Crude Oil and Condensate Production 74.7 113.4 157.9 220.4 288.9 293.6 296.9 300.1 303.4 298.5 172.5 140.8 123.0 111.1 103.8 98.1 93.3 89.4 85.9% of Total Production 19.33% 26.82% 33.85% 43.21% 48.58% 49.94% 50.02% 50.11% 50.19% 50.06% 45.22% 45.22% 45.22% 45.22% 45.22% 45.22% 45.22% 45.22% 45.22%Total Liquid Natural Gas Production 30.4 42.4 55.9 65.2 80.3 82.0 83.5 85 86.5 84.3 73.0 59.6 52.0 47.0 43.9 41.5 39.5 37.8 36.4% of Total Production 7.87% 10.03% 11.98% 12.78% 13.50% 13.95% 14.07% 14.19% 14.31% 14.13% 19.14% 19.14% 19.14% 19.14% 19.14% 19.14% 19.14% 19.14% 19.14%Total Natural Gas Production 281.3 267.0 252.7 224.5 225.5 212.3 213.2 213.8 214.5 213.5 135.9 111.0 96.9 87.6 81.8 77.3 73.5 70.5 67.7% of Total Production 72.80% 63.15% 54.17% 44.01% 37.92% 36.12% 35.92% 35.70% 35.49% 35.80% 35.64% 35.64% 35.64% 35.64% 35.64% 35.64% 35.64% 35.64% 35.64%Total Production 386.4 422.8 466.5 510.1 594.7 587.9 593.5 598.9 604.4 596.2 381.4 311.5 272.0 245.7 229.5 216.9 206.3 197.8 190.0% Growth 9.50% 9.41% 10.33% 9.35% 16.58% -36.03% -18.34% -12.69% -9.66% -6.57% -5.52% -4.86% -4.14% -3.94%

UOIG 16
April 10th, 2015 University of Oregon Investment Group
Appendix 3 – Production Model (Continued)
Rate Proven Reserves (mmboe) Rate Proven Reserves (mmboe)1 217.6 217.62 (54.80%) 98.4 (36.02%) 139.23 (27.90%) 70.9 (18.34%) 113.74 (19.30%) 57.2 (12.69%) 99.35 (14.70%) 48.8 (9.66%) 89.76 (10.00%) 43.9 (6.57%) 83.87 (8.40%) 40.2 (5.52%) 79.28 (7.40%) 37.3 (4.86%) 75.39 (6.30%) 34.9 (4.14%) 72.210 (6.00%) 32.8 (3.94%) 69.311 (5.20%) 31.1 (3.42%) 67.012 (5.00%) 29.6 (3.29%) 64.813 (4.60%) 28.2 (3.02%) 62.814 (4.20%) 27.0 (2.76%) 61.115 (3.70%) 26.0 (2.43%) 59.616 (3.60%) 25.1 (2.37%) 58.217 (3.40%) 24.2 (2.23%) 56.918 (3.30%) 23.4 (2.17%) 55.619 (3.20%) 22.7 (2.10%) 54.520 (3.20%) 22.0 (2.10%) 53.321 (3.20%) 21.2 (2.10%) 52.222 (3.20%) 20.6 (2.10%) 51.123 (3.10%) 19.9 (2.04%) 50.124 (3.10%) 19.3 (2.04%) 49.125 (3.10%) 18.7 (2.04%) 48.126 (3.10%) 18.1 (2.04%) 47.127 (3.10%) 17.6 (2.04%) 46.128 (3.10%) 17.0 (2.04%) 45.229 (3.10%) 16.5 (2.04%) 44.330 (3.10%) 16.0 (2.04%) 43.431 (3.10%) 15.5 (2.04%) 42.532 (3.10%) 15.0 (2.04%) 41.633 (3.10%) 14.5 (2.04%) 40.834 (3.10%) 14.1 (2.04%) 39.935 (3.10%) 13.7 (2.04%) 39.136 (3.10%) 13.2 (2.04%) 38.337 (3.10%) 12.8 (2.04%) 37.538 (3.10%) 12.4 (2.04%) 36.839 (3.10%) 12.0 (2.04%) 36.040 (3.10%) 11.7 (2.04%) 35.3
UPC Decline Rate EOG Decline RateProduction Decline Rate
PeriodYear
Oil Condensate LNG
Natural Gas Total % Change
2015 1 108.9 30.8 77.9 217.6 - 2016 2 63.0 26.6 49.6 139.2 -36.0%2017 3 51.4 21.8 40.5 113.7 -18.3%2018 4 44.9 19.0 35.4 99.3 -12.7%2019 5 40.5 17.2 32.0 89.7 -9.7%2020 6 37.9 16.0 29.9 83.8 -6.6%2021 7 35.8 15.1 28.2 79.2 -5.5%2022 8 34.1 14.4 26.8 75.3 -4.9%2023 9 32.6 13.8 25.7 72.2 -4.1%2024 10 31.4 13.3 24.7 69.3 -3.9%2025 11 30.3 12.8 23.9 67.0 -3.4%2026 12 29.3 12.4 23.1 64.8 -3.3%2027 13 28.4 12.0 22.4 62.8 -3.0%2028 14 27.6 11.7 21.8 61.1 -2.8%2029 15 26.9 11.4 21.2 59.6 -2.4%2030 16 26.3 11.1 20.7 58.2 -2.4%2031 17 25.7 10.9 20.3 56.9 -2.2%2032 18 25.2 10.6 19.8 55.6 -2.2%2033 19 24.6 10.4 19.4 54.5 -2.1%2034 20 24.1 10.2 19.0 53.3 -2.1%2035 21 23.6 10.0 18.6 52.2 -2.1%2036 22 23.1 9.8 18.2 51.1 -2.1%2037 23 22.6 9.6 17.8 50.1 -2.0%2038 24 22.2 9.4 17.5 49.0 -2.0%2039 25 21.7 9.2 17.1 48.0 -2.0%2040 26 21.3 9.0 16.8 47.1 -2.0%2041 27 20.9 8.8 16.4 46.1 -2.0%2042 28 20.4 8.6 16.1 45.2 -2.0%2043 29 20.0 8.5 15.8 44.3 -2.0%2044 30 19.6 8.3 15.5 43.3 -2.0%2045 31 19.2 8.1 15.1 42.5 -2.0%2046 32 18.8 8.0 14.8 41.6 -2.0%2047 33 18.4 7.8 14.5 40.8 -2.0%2048 34 18.1 7.6 14.2 39.9 -2.0%2049 35 17.7 7.5 13.9 39.1 -2.0%2050 36 17.3 7.3 13.7 38.3 -2.0%2051 37 17.0 7.2 13.4 37.5 -2.0%2052 38 16.6 7.0 13.1 36.8 -2.0%2053 39 16.3 6.9 12.8 36.0 -2.0%2054 40 16.0 6.8 12.6 35.3 -2.0%
1139.7 467.0 890.4 2497.1
Total Production (MMBoe)
Total
0.0
50.0
100.0
150.0
200.0
250.0
1 3 5 7 9 11 13 15 17 19 21 23 25 27 29 31 33 35 37 39
Total Energy Production (MMBoe)
Figure 33: Projected Decline Curve (MMBOE) / (Period)
Source: UOIG Spreads

UOIG 17
April 10th, 2015 University of Oregon Investment Group
Appendix 4 – Net Asset Valuation – Current Futures Curve
YearOil
Condensate LNG Natural GasTotal
Revenue YearAnnural MMBOE
ProducedCost Per
BOE
Total Production
Expense
Total Development
Expense YearPre-Tax Cash
Flows Tax RateAfter-Tax
Cash FlowsPV of Cash
Flows2015 1 5976.4 1920.0 1402.0 9298.3 2015 1 217.6 6.06 1318.7 2040.0 2015 1 5939.6 33.0% 3979.6 3614.32016 2 3921.2 1944.9 1038.4 6904.5 2014A 2016 2 139.2 6.06 843.6 2040.0 2017E 2016 2 4020.9 33.0% 2694.0 2222.22017 3 3325.5 1680.7 896.7 5902.9 2017 3 113.7 6.06 688.9 2040.0 2017 3 3173.9 33.0% 2126.5 1593.12018 4 2970.5 1496.0 797.6 5264.1 2018 4 99.3 6.06 601.5 2040.0 2018 4 2622.5 33.0% 1757.1 1195.52019 5 2739.4 1390.1 738.5 4868.0 2019 5 89.7 6.06 543.4 2040.0 2019 5 2284.6 33.0% 1530.7 945.92020 6 2608.6 1338.8 710.0 4657.5 2020 6 83.8 6.06 507.7 2040.0 2020 6 2109.8 33.0% 1413.5 793.32021 7 2490.7 1314.1 696.1 4500.9 2021 7 79.2 6.06 479.7 2040.0 2021 7 1981.2 33.0% 1327.4 676.62022 8 2378.1 1300.6 688.3 4367.0 2022 8 75.3 6.06 456.3 2040.0 2022 8 1870.7 33.0% 1253.4 580.22023 9 2279.6 1284.8 679.9 4244.2 2023 9 72.2 6.06 437.4 2040.0 2023 9 1766.8 33.0% 1183.8 497.72024 10 2189.7 1267.3 669.7 4126.6 2024 10 69.3 6.06 420.2 2040.0 2024 10 1666.5 33.0% 1116.5 426.42025 11 2114.9 1224.0 646.8 3985.6 2025 11 67.0 6.06 405.8 0 2025 11 3579.8 33.0% 2398.5 831.82026 12 2045.4 1183.7 625.5 3854.6 2026 12 64.8 6.06 392.5 0 2026 12 3462.1 33.0% 2319.6 730.72027 13 1983.5 1147.9 606.6 3738.1 2027 13 62.8 6.06 380.6 0 2027 13 3357.5 33.0% 2249.5 643.52028 14 1928.8 1116.2 589.9 3634.9 2028 14 61.1 6.06 370.1 0 2028 14 3264.8 33.0% 2187.4 568.32029 15 1881.9 1089.1 575.5 3546.5 2029 15 59.6 6.06 361.1 0 2029 15 3185.4 33.0% 2134.2 503.62030 16 1837.3 1063.3 561.9 3462.6 2030 16 58.2 6.06 352.6 0 2030 16 3110.0 33.0% 2083.7 446.62031 17 1796.3 1039.6 549.3 3385.2 2031 17 56.9 6.06 344.7 0 2031 17 3040.5 33.0% 2037.1 396.52032 18 1757.3 1017.0 537.4 3311.8 2032 18 55.6 6.06 337.2 0 2032 18 2974.5 33.0% 1992.9 352.32033 19 1720.4 995.6 526.1 3242.1 2033 19 54.5 6.06 330.1 0 2033 19 2912.0 33.0% 1951.0 313.32034 20 1684.2 974.7 515.0 3173.9 2014A 2034 20 53.3 6.06 323.2 0 2017E 2034 20 2850.7 33.0% 1910.0 278.52035 21 1648.7 954.2 504.2 3107.1 2035 21 52.2 6.06 316.4 0 2035 21 2790.8 33.0% 1869.8 247.62036 22 1614.1 934.1 493.6 3041.8 2036 22 51.1 6.06 309.7 0 2036 22 2732.1 33.0% 1830.5 220.22037 23 1581.2 915.1 483.6 2979.8 2037 23 50.1 6.06 303.4 0 2037 23 2676.4 33.0% 1793.2 195.92038 24 1549.0 896.4 473.7 2919.1 2038 24 49.0 6.06 297.2 0 2038 24 2621.9 33.0% 1756.7 174.32039 25 1517.4 878.2 464.0 2859.6 2039 25 48.0 6.06 291.2 0 2039 25 2568.4 33.0% 1720.9 155.12040 26 1486.5 860.3 454.6 2801.3 2040 26 47.1 6.06 285.2 0 2040 26 2516.1 33.0% 1685.8 138.02041 27 1456.2 842.7 445.3 2744.3 2041 27 46.1 6.06 279.4 0 2041 27 2464.8 33.0% 1651.4 122.82042 28 1426.5 825.6 436.3 2688.4 2042 28 45.2 6.06 273.7 0 2042 28 2414.6 33.0% 1617.8 109.22043 29 1397.5 808.8 427.4 2633.6 2043 29 44.3 6.06 268.2 0 2043 29 2365.4 33.0% 1584.8 97.22044 30 1369.0 792.3 418.7 2579.9 2044 30 43.3 6.06 262.7 0 2044 30 2317.2 33.0% 1552.5 86.52045 31 1341.1 776.1 410.1 2527.3 2045 31 42.5 6.06 257.3 0 2045 31 2270.0 33.0% 1520.9 76.92046 32 1313.8 760.3 401.8 2475.8 2046 32 41.6 6.06 252.1 0 2046 32 2223.7 33.0% 1489.9 68.42047 33 1287.0 744.8 393.6 2425.4 2047 33 40.8 6.06 247.0 0 2047 33 2178.4 33.0% 1459.6 60.92048 34 1260.8 729.6 385.6 2376.0 2048 34 39.9 6.06 241.9 0 2048 34 2134.1 33.0% 1429.8 54.22049 35 1235.1 714.8 377.7 2327.6 2049 35 39.1 6.06 237.0 0 2049 35 2090.6 33.0% 1400.7 48.22050 36 1209.9 700.2 370.0 2280.1 2050 36 38.3 6.06 232.2 0 2050 36 2048.0 33.0% 1372.1 42.92051 37 1185.3 685.9 362.5 2233.7 2051 37 37.5 6.06 227.4 0 2051 37 2006.2 33.0% 1344.2 38.22052 38 1161.1 672.0 355.1 2188.2 2052 38 36.8 6.06 222.8 0 2052 38 1965.4 33.0% 1316.8 33.92053 39 1137.4 658.3 347.9 2143.6 2053 39 36.0 6.06 218.3 0 2053 39 1925.3 33.0% 1290.0 30.22054 40 1114.3 644.9 340.8 2099.9 2054 40 35.3 6.06 213.8 0 2054 40 1886.1 33.0% 1263.7 26.9
76921.4 41583.1 22397.3 140901.8 2497.1 15132.4 20400.0 105369.4 70597.5 19637.9Total
Revenue ($ in Millions) Production and Development Expense ($ in Millions) Cash Flows ($ in Millions)
Total Total

UOIG 18
April 10th, 2015 University of Oregon Investment Group
Appendix 5 – Net Asset Valuation – Projected Futures Curve
YearOil
Condensate LNG Natural GasTotal
Revenue YearAnnural MMBOE
ProducedCost Per
BOE
Total Production
Expense
Total Development
Expense YearPre-Tax Cash
Flows Tax RateAfter-Tax
Cash FlowsPV of Cash
Flows2015 1 7353.7 2060.3 1587.5 11001.5 2015 1 217.6 6.06 1318.7 2040.0 2015 1 7642.8 33.0% 5120.7 4650.72016 2 4721.3 2058.2 1141.2 7920.6 2016 2 139.2 6.06 843.6 2040.0 2016 2 5037.0 33.0% 3374.8 2783.82017 3 4112.5 1762.3 972.5 6847.3 2017 3 113.7 6.06 688.9 2040.0 2017 3 4118.4 33.0% 2759.3 2067.22018 4 3815.2 1610.0 884.5 6309.8 2018 4 99.3 6.06 601.5 2040.0 2018 4 3668.2 33.0% 2457.7 1672.22019 5 3649.4 1518.8 831.0 5999.2 2019 5 89.7 6.06 543.4 2040.0 2019 5 3415.7 33.0% 2288.5 1414.22020 6 3598.9 1475.1 806.3 5880.2 2020 6 83.8 6.06 507.7 2040.0 2020 6 3332.5 33.0% 2232.8 1253.12021 7 3489.7 1450.4 790.0 5730.1 2021 7 79.2 6.06 479.7 2040.0 2021 7 3210.4 33.0% 2151.0 1096.42022 8 3405.1 1433.9 778.4 5617.4 2022 8 75.3 6.06 456.3 2040.0 2022 8 3121.0 33.0% 2091.1 968.12023 9 3345.7 1429.8 771.9 5547.3 2023 9 72.2 6.06 437.4 2040.0 2023 9 3069.9 33.0% 2056.8 864.82024 10 3292.1 1267.3 669.7 5229.0 2024 10 69.3 6.06 420.2 2040.0 2024 10 2768.8 33.0% 1855.1 708.42025 11 3179.6 1224.0 646.8 5050.3 2025 11 67.0 6.06 405.8 0 2025 11 4644.5 33.0% 3111.8 1079.22026 12 3075.1 1183.7 625.5 4884.3 2026 12 64.8 6.06 392.5 0 2026 12 4491.9 33.0% 3009.5 948.02027 13 2982.1 1147.9 606.6 4736.7 2027 13 62.8 6.06 380.6 0 2027 13 4356.0 33.0% 2918.5 834.92028 14 2899.8 1116.2 589.9 4605.9 2028 14 61.1 6.06 370.1 0 2028 14 4235.8 33.0% 2838.0 737.42029 15 2829.3 1089.1 575.5 4493.9 2029 15 59.6 6.06 361.1 0 2029 15 4132.8 33.0% 2769.0 653.42030 16 2762.3 1063.3 561.9 4387.5 2030 16 58.2 6.06 352.6 0 2030 16 4035.0 33.0% 2703.4 579.42031 17 2700.6 1039.6 549.3 4289.5 2031 17 56.9 6.06 344.7 0 2031 17 3944.8 33.0% 2643.0 514.52032 18 2642.0 1017.0 537.4 4196.5 2032 18 55.6 6.06 337.2 0 2032 18 3859.2 33.0% 2585.7 457.12033 19 2586.4 995.6 526.1 4108.2 2033 19 54.5 6.06 330.1 0 2033 19 3778.1 33.0% 2531.3 406.42034 20 2532.0 974.7 515.0 4021.8 2034 20 53.3 6.06 323.2 0 2034 20 3698.6 33.0% 2478.1 361.42035 21 2478.8 954.2 504.2 3937.2 2035 21 52.2 6.06 316.4 0 2035 21 3620.8 33.0% 2425.9 321.32036 22 2426.7 934.1 493.6 3854.4 2036 22 51.1 6.06 309.7 0 2036 22 3544.7 33.0% 2374.9 285.72037 23 2377.2 915.1 483.6 3775.8 2037 23 50.1 6.06 303.4 0 2037 23 3472.4 33.0% 2326.5 254.22038 24 2328.8 896.4 473.7 3698.9 2038 24 49.0 6.06 297.2 0 2038 24 3401.7 33.0% 2279.1 226.12039 25 2281.3 878.2 464.0 3623.5 2039 25 48.0 6.06 291.2 0 2039 25 3332.4 33.0% 2232.7 201.22040 26 2234.8 860.3 454.6 3549.7 2040 26 47.1 6.06 285.2 0 2040 26 3264.5 33.0% 2187.2 179.02041 27 2189.3 842.7 445.3 3477.4 2041 27 46.1 6.06 279.4 0 2041 27 3197.9 33.0% 2142.6 159.32042 28 2144.7 825.6 436.3 3406.5 2042 28 45.2 6.06 273.7 0 2042 28 3132.8 33.0% 2099.0 141.72043 29 2101.0 808.8 427.4 3337.1 2043 29 44.3 6.06 268.2 0 2043 29 3068.9 33.0% 2056.2 126.12044 30 2058.2 792.3 418.7 3269.1 2044 30 43.3 6.06 262.7 0 2044 30 3006.4 33.0% 2014.3 112.22045 31 2016.2 776.1 410.1 3202.5 2045 31 42.5 6.06 257.3 0 2045 31 2945.2 33.0% 1973.3 99.82046 32 1975.2 760.3 401.8 3137.2 2046 32 41.6 6.06 252.1 0 2046 32 2885.1 33.0% 1933.0 88.82047 33 1934.9 744.8 393.6 3073.3 2047 33 40.8 6.06 247.0 0 2047 33 2826.4 33.0% 1893.7 79.02048 34 1895.5 729.6 385.6 3010.7 2048 34 39.9 6.06 241.9 0 2048 34 2768.8 33.0% 1855.1 70.32049 35 1856.9 714.8 377.7 2949.3 2049 35 39.1 6.06 237.0 0 2049 35 2712.4 33.0% 1817.3 62.52050 36 1819.0 700.2 370.0 2889.3 2050 36 38.3 6.06 232.2 0 2050 36 2657.1 33.0% 1780.2 55.62051 37 1782.0 685.9 362.5 2830.4 2051 37 37.5 6.06 227.4 0 2051 37 2602.9 33.0% 1744.0 49.52052 38 1745.7 672.0 355.1 2772.7 2052 38 36.8 6.06 222.8 0 2052 38 2549.9 33.0% 1708.4 44.02053 39 1710.1 658.3 347.9 2716.2 2053 39 36.0 6.06 218.3 0 2053 39 2497.9 33.0% 1673.6 39.22054 40 1675.2 644.9 340.8 2660.9 2054 40 35.3 6.06 213.8 0 2054 40 2447.0 33.0% 1639.5 34.9
110004.2 42711.9 23313.1 176029.1 2497.1 15132.4 20400.0 140496.7 94132.8 26681.0Total Total
Revenue ($ in Millions) Production and Development Expense ($ in Millions)
Total
Cash Flows ($ in Millions)

UOIG 19
April 10th, 2015 University of Oregon Investment Group
Appendix 6 – Net Asset Valuation – Proven Reserves and Futures Curves
Futures Composite Energy Prices Q1 Q2 Q3 Q4($/Boe) 2010A 2011A 2012A 2013A 2014A 03/31/2015E 06/30/2015E 09/30/2015E 12/31/2015E 2015E 2016E 2017E 2018E 2019E 2020E 2021E 2022E 2023ECrude Oil and Condensate 74.29 92.79 97.77 103.20 92.58 51.75 52.95 56.39 58.34 54.86 62.29 64.69 66.18 67.56 68.86 69.59 69.84 69.84 69.84Liquid Natural Gas 41.73 50.41 55.90 65.20 80.30 60.00 60.50 61.75 67.50 62.44 73.00 77.25 78.75 81.00 83.50 86.75 90.25 93.00 95.50LNG as % of Natural Gas 177.0% 219.4% 329.2% 317.7% 344.9% 345.7% 347.0% 347.5% 347.8% 347.0% 348.8% 349.1% 349.3% 350.6% 351.2% 351.6% 351.9% 352.0% 352.5%Natural Gas 23.58 22.98 16.98 20.52 23.28 17.36 17.44 17.77 19.41 17.99 20.93 22.13 22.54 23.11 23.78 24.67 25.64 26.42 27.10
Projected Composite Energy Prices Q1 Q2 Q3 Q4($/Boe) 2010A 2011A 2012A 2013A 2014A 03/31/2015E 06/30/2015E 09/30/2015E 12/31/2015E 2015E 2016E 2017E 2018E 2019E 2020E 2021E 2022E 2023ECrude Oil and Condensate 74.29 92.79 97.77 103.20 92.58 60.00 65.00 70.00 75.00 67.50 75.00 80.00 85.00 90.00 95.00 97.50 100.00 102.50 105.00Liquid Natural Gas 41.73 50.41 55.90 65.20 80.30 64.00 66.00 68.00 70.00 67.00 77.25 81.00 84.75 88.50 92.00 95.75 99.50 103.50 107.50LNG as % of Natural Gas 177.0% 219.4% 329.2% 317.7% 344.9% 345.9% 322.0% 323.8% 325.6% 328.8% 335.9% 337.5% 339.0% 340.4% 340.7% 342.0% 343.1% 345.0% 346.8%Natural Gas 23.58 22.98 16.98 20.52 23.28 18.50 20.50 21.00 21.50 20.38 23.00 24.00 25.00 26.00 27.00 28.00 29.00 30.00 31.00
Crude Oil and Condensate Proven Reserves Q1 Q2 Q3 Q4(Volumes in MMBbl) 2010A 2011A 2012A 2013A 2014A 03/31/2015E 06/30/2015E 09/30/2015E 12/31/2015E 2015E 2016E 2017E 2018E 2019E 2020E 2021E 2022E 2023E 2024EBeginning Proven Reserves 219.5 385.9 517.5 700.8 900.5 1139.7 1113.0 1085.7 1058.1 1139.7 1030.8 967.9 916.4 871.6 831.0 793.1 757.3 723.3 690.6Revisions, Purchases and Sales of Reserves (10.8) (30.0) (14.7) 49.4 25.1 - - - - - - - - - - - - - - Discoveries of New Reserves 204.5 203.0 255.7 230.8 319.6 - - - - - - - - - - - - - - Production 27.3 41.4 57.6 80.4 105.4 26.72 27.31 27.61 27.30 108.94 63.0 51.4 44.9 40.5 37.9 35.8 34.1 32.6 31.4Ending Proven Reserves 385.9 517.5 700.8 900.5 1139.7 1113.0 1085.7 1058.1 1030.8 1030.8 967.9 916.4 871.6 831.0 793.1 757.3 723.3 690.6 659.3
Liquid Natural Gas Proven Reserves Q1 Q2 Q3 Q4(Volumes in MMBbl) 2010A 2011A 2012A 2013A 2014A 03/31/2015E 06/30/2015E 09/30/2015E 12/31/2015E 2015E 2016E 2017E 2018E 2019E 2020E 2021E 2022E 2023E 2024EBeginning Proven Reserves 93.5 151.9 227.8 320.0 377.2 467.1 459.59 451.91 444.09 467.1 436.3 409.7 387.9 368.9 351.7 335.7 320.6 306.2 292.3 Revisions, Purchases and Sales of Reserves 27.3 26.1 41.1 11.8 27.5 - - - - - - - - - - - - - - Discoveries of New Reserves 42.2 65.3 71.6 69.2 91.7 - - - - - - - - - - - - - - Production 11.1 15.5 20.4 23.8 29.3 7.5 7.7 7.8 7.8 30.8 26.6 21.8 19.0 17.2 16.0 15.1 14.4 13.8 13.3Ending Proven Reserves 151.9 227.8 320.0 377.2 467.1 459.6 451.9 444.1 436.3 436.3 409.7 387.9 368.9 351.7 335.7 320.6 306.2 292.3 279.1
Natural Gas Proven Reserves Q1 Q2 Q3 Q4(Volumes in MMBoe) 2010A 2011A 2012A 2013A 2014A 03/31/2015E 06/30/2015E 09/30/2015E 12/31/2015E 2015E 2016E 2017E 2018E 2019E 2020E 2021E 2022E 2023E 2024EBeginning Proven Reserves 1483.0 1411.7 1308.0 789.9 840.8 890.4 871.1 851.5 831.8 890.4 812.5 762.9 722.3 687.0 655.0 625.1 596.9 570.1 544.4 Revisions, Purchases and Sales of Reserves (117.8) (125.2) (505.6) 33.8 24.1 - - - - - - - - - - - - - - Discoveries of New Reserves 149.2 119.0 79.7 99.0 107.8 - - - - - - - - - - - - - - Production 102.7 97.5 92.2 81.9 82.3 19.3 19.6 19.7 19.3 77.9 49.6 40.5 35.4 32.0 29.9 28.2 26.8 25.7 24.7Ending Proven Reserves 1411.7 1308.0 789.9 840.8 890.4 871.1 851.5 831.8 812.5 812.48 762.9 722.3 687.0 655.0 625.1 596.9 570.1 544.4 519.6
2024E- 2054E
2024E- 2054E

UOIG 20
April 10th, 2015 University of Oregon Investment Group
Appendix 7 – Midstream Comparable Analysis
EOG BWP MWE WMB BPLEOG
ResourcesBoardwalk Pipeline
Partners, L.P.MarkWest Energy
Partners, L.P.Williams
Companies, Inc.Buckeye
Partners, L.P.- 30% 30% 30% 10%- 7580 17456 59070 13614
3260 1241 2140 7640 6185- 6.1 8.2 7.7 2.26.8
22230.3
EV/RevenueWeighted Average EV/EBITDAEV of Midstream and Marketing Operations
Midstream and Marketing Comparable Analysis
($mm)
Revenue
Weighting Enterprise Value

UOIG 21
April 10th, 2015 University of Oregon Investment Group
Appendix 8 – NAV Assumptions
Net Asset Valuation Cash Flow Assumptions ConsiderationsTax Rate 33.00% Terminal Growth Rate 3.00%Risk Free Rate 1.87% PV of Free Cash Flows 22,455Beta 1.41 EV of Midstream 22,230Market Risk Premium 6.45% Firm Value 44,685% Equity 89.53% Total Debt 5,890% Debt 10.47% Cash & Cash Equivalents 2,087Cost of Debt 3.82% Market Capitalization 40,883CAPM 10.99% Fully Diluted Shares 559WACC 10.11% Implied Price 73.09Terminal Risk Free Rate 2.66% Current Price 91.22Terminal CAPM 11.78% Overvalued (19.88%)Terminal WACC 10.81%

UOIG 22
April 10th, 2015 University of Oregon Investment Group
Appendix 9 – Sensitivity Analysis
Implied Price Undervalued/(Overvalued)Market Risk Premium Market Risk Premium
73 5.45% 5.95% 6.45% 6.95% 7.45%1.21 81.67 79.27 77.08 75.08 73.251.31 79.51 77.12 74.96 73.00 71.211.41 77.51 75.16 73.03 71.11 69.361.51 75.67 73.35 71.27 69.39 67.691.61 73.98 71.70 69.66 67.82 66.17
Implied Price Undervalued/(Overvalued)Terminal Growth Rate Terminal Growth Rate
73 2.3% 2.3% 3.0% 3.8% 4.5%8.11% 80.58 80.58 80.58 80.58 80.589.11% 76.49 76.49 76.49 76.49 76.49
10.11% 73.03 73.03 73.03 73.03 73.0311.11% 70.08 70.08 70.08 70.08 70.0812.11% 67.53 67.53 67.53 67.53 67.53
Implied Price Undervalued/(Overvalued)Terminal Growth Rate Terminal Growth Rate
73 2.3% 2.3% 3.0% 3.8% 4.5%31.0% 73.01 73.01 73.01 73.01 73.0132.0% 73.02 73.02 73.02 73.02 73.0233.0% 73.03 73.03 73.03 73.03 73.0334.0% 73.05 73.05 73.05 73.05 73.0535.0% 73.06 73.06 73.06 73.06 73.06
Adj
uste
d B
eta
WA
CC
Tax
Rat
e

UOIG 23
April 10th, 2015 University of Oregon Investment Group
Appendix 10 – Sources
BamSec Bloomberg EOG Investor Relations FactSet Google Finance IBIS World OPEC Sec.gov Seeking Alpha Wall Street Journal Yahoo Finance