enzyme-linked immunosorbent assay determination of ... · 3 enzyme-linked immunosorbent assay...
TRANSCRIPT
1
Indirect, Competitive Enzyme-Linked Immunosorbent Assay Determination of Secretory Immunoglobulin A Levels in
Saliva. David Mwangi
East Orange Campus High School 344 Prospect St.
East Orange, NJ 07017. [email protected].
Mentor: Dr Patricia Fitzgerald-Bocarsly University of Medicine and Dentistry of New Jersey
Department of Pathology and Immunology The research was funded by the American Association of Immunologists and
supported by UMDNJ.
2
Table of Contents
Teacher Section: Overview Science Background Learning Objectives Time Requirements Materials and equipment Student Prior Knowledge Student Expectations Lesson Plans
Student section: Rationale Background Secretory IgA Classroom Activity Simple Dilution Lab Secretory IgA Lab
3 4 7 7 9 11 11 11
27 27 28 31 35
3
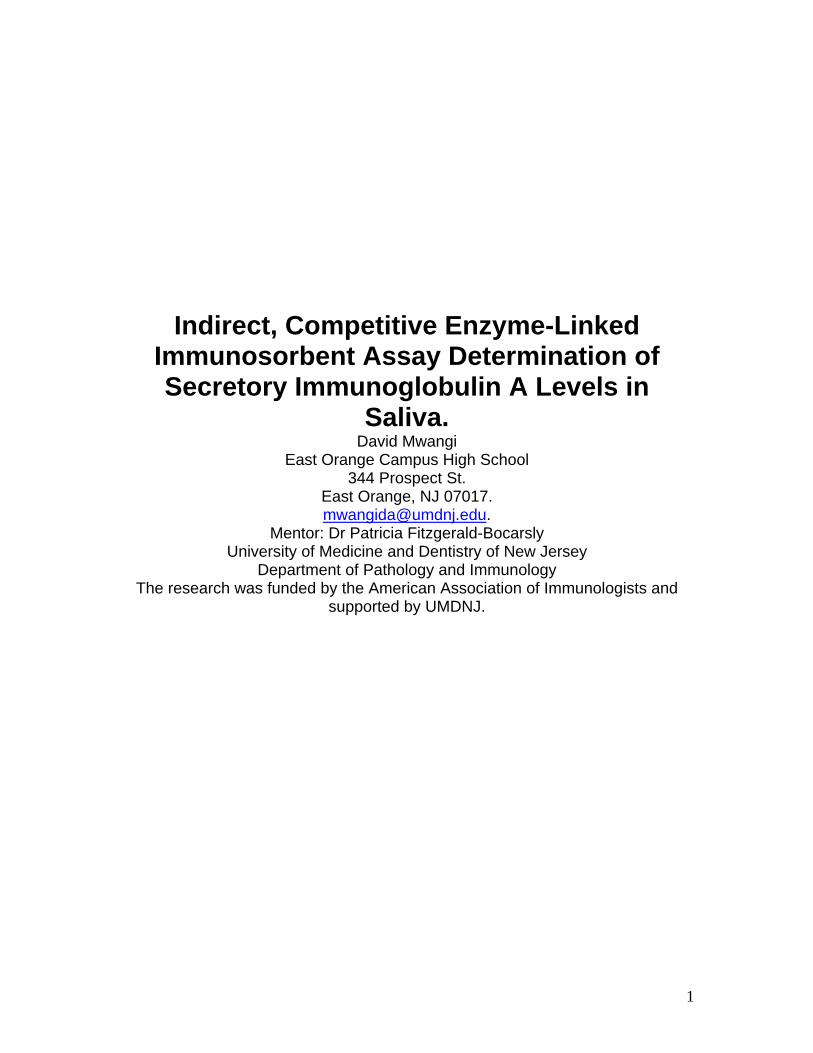
Enzyme-Linked Immunosorbent Assay determination of immunoglobulin A levels in saliva.
Overview Whenever one engages in intensive prolonged exercise, the saliva in the
mouth takes on vastly different characteristics. One key change that saliva undergoes after exercise is a decline in levels of a protective antibody that is produced by the immune system called secretory Immunoglobulin A (IgA). Secretory IgA is an immune marker found in saliva as well as throughout the gastrointestinal tract and in mucus secretions throughout the body. Saliva and mucosal secretions form an important first line of defense against pathogens invading the mouth by providing a mechanical washing effect while IgA prevents viral replication and bacterial attachment to mucosal surfaces. The students will determine the level of IgA in saliva using the indirect competitive ELISA protocol. Students will first assemble a simple spectrophotometer unless the school has a regular spectrophotometer). Then, students will carry out a simple dilution experiment and develop a standard curve that is used to determine the concentration of unknown quantities of samples. Once the dilution and standard curve concepts are clear, an ELISA kit will be used to determine the SIgA level in saliva samples from the students. Students will be exposed to ELISA, a crucial technique in medical and research biology. Part of the ELISA lab may be completed in a standard immunology lab.
The teacher should liaise with the mathematics department to correlate the standard curves construction and accompanying calculations to the math

4
curriculum, especially in schools where there are small learning communities or clusters. Within the biology or health curriculum, this activity will fall under the immune system. The students will learn the role of antibodies in protecting against infections. The students will also learn how to perform the ELISA protocol and appreciate its importance in immunology.
The teacher should contact the local Board of Education to get approval for the use of saliva in a classroom setting.
Science Background Salivary Immunoglobulin A The gastrointestinal and respiratory tracts are two of the most prominent routes of microbe entry into the body. Defense against microbes that enter by these routes is provided by antibodies. There are four kinds (Isotypes) of antibodies: Immunoglobulin A (IgA), Immunoglobulin G (IgG), Immunoglobulin M (IgM), and Immunoglobulin E (IgE). The isotype most responsible for defending the respiratory and gastrointestinal tracts is IgA. Although IgA constitutes only 10-15% of total immunoglobulin in serum, it is the immunoglobulin most abundant in external secretions such as breast milk, saliva, tears, and mucus of the bronchial, genitourinary, and digestive tracts. It is estimated that a normal 70kg adult secretes about 2g of IgA per day, which accounts for 60% to 70% of the total output of antibodies. If our mucosal surfaces were spread out they would cover an area equal to one and one-half tennis courts, so the importance of IgA in protecting our mucosal surfaces cannot be overstated. IgA can exist in four different forms: monomer, dimer, trimer or tetramer. However, the IgA form most common in external secretions, such as saliva, is called secretory IgA, and it is the dimeric form in which two IgA molecules are joined together by the J chain. IgA is made by plasma cells in the mucosal lymphoid tissue and secreted through the epithelium into the lumen of the respiratory tract or gastrointestinal tract. The transportation of IgA across the epithelium into the lumen is mediated by a receptor that is synthesized by mucosal epithelial cells (Fig.4.). After synthesis and secretion by the plasma cells, dimeric IgA binds to the receptor on the mucosal epithelial cells to form a complex. This complex is endocytosed into the epithelial cell and actively transported in vesicles to the luminal surface. Here the receptor is enzymatically cleaved and the IgA molecule, with a portion of the receptor, is released into the intestinal lumen. Once in the lumen, IgA affords protection by mechanisms that include (I) interfering with microbial adherence to mucosal surfaces, (II) inhibiting penetration of antigens across the epithelial surface. Studies have established the role of salivary IgA in limiting respiratory infections. Reported levels of high prevalence of respiratory infections in elite athletes1¨has generated research interest in salivary IgA levels of exercising populations. Certain studies show a decrease in the saliva concentration of IgA in athletes2 that has been proposed as a possible causal factor in the established increased susceptibility of athletes to upper respiratory tract infections (URTI)3. There are studies that show decreased, increased or unchanged levels of IgA
5
after acute exercise. The effects of exercise on s-IgA are therefore still under intense study. IgA deficiency is quite common, with approximately one in every 500 people (some studies show 1 in 700) people presenting a deficiency of IgA. Most of these people appear healthy and may never know that they have selective IgA deficiency. Conversely, there are people with IgA deficiency that have severe illnesses. It is yet unknown why some people with IgA deficiency are very sick while others are not. It is therefore very important that during the ELISA assay student saliva be mixed between pairs of students in case there is an IgA deficiency in the student population. Sampling and collection of saliva is easy and non-invasive. This makes use of saliva acceptable even in non-laboratory settings. Consequently, the technique proposed is applicable in a high school setting. References:
1. Gleeson M., Hall S. T, McDonald W., Flanagan A. J., Clancy R. L. Salivary IgA subclasses and infection risk in elite swimmers. Immunol and cell Biol. 1999. 77: 351-355.
2. Laing S.J., Gwynne D., Blackwell J., Williams M., Walters R., Walsh N.P. Salivary IgA response to prolonged exercise in a hot environment in trained cyclists. Eur. J. Appl. Physiol. 2005. 93: 665-671.
3. Nieman D.C, Nehlesen-Cannarella S.L. The effects of acute and chronic exercise of immunoglobulins. Sports Med 11: 183-201.
4. IgA images on page 1 were obtained from: The science creative quarterly issue 3, 2003 (www.scq.ubc.ca) and bioweb.wku.edu/courses/Biol328/organs2.html
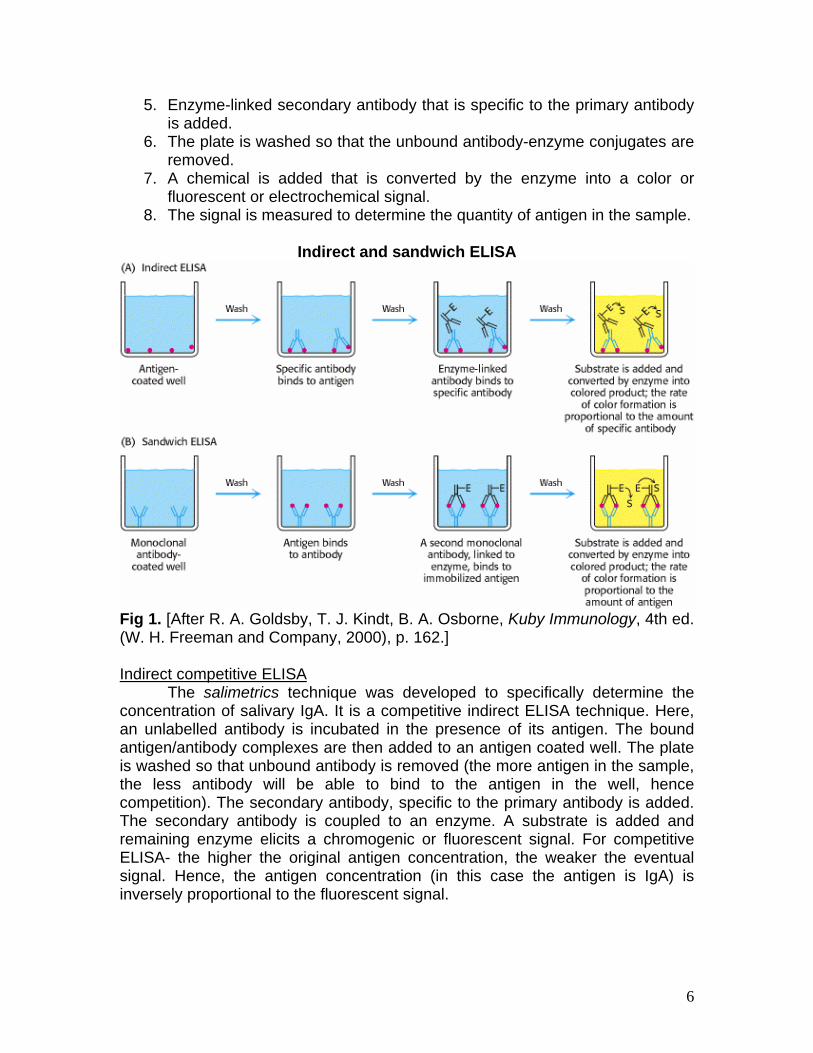
Enzyme-Linked Immunosorbent Assay (ELISA) This is a biochemical technique used in immunology to detect the presence of an antibody or an antigen in a sample. ELISA is used in medicine and in quality control check in many industries. In the simplest form of ELISA, an unknown amount of antigen is bound to a surface, and an antibody specific to the antigen is washed over the surface so that it can bind the antigen. This antibody is linked to an enzyme, and a substance that can be converted into a detectable signal by the enzyme is added in the final step. The quantity of antigen in the sample is determined by the signal intensity. Sandwich ELISA
To quantify salivary IgA, the sandwich ELISA is more widely used. This technique involves the following general steps:
1. Surface on which a known amount of capture antibody is bound. 2. Non-specific binding sites on the surface are blocked. 3. Antigen-containing sample is added onto the plate. 4. Primary antibody that binds specifically to the antigen is added.
6
5. Enzyme-linked secondary antibody that is specific to the primary antibody is added.
6. The plate is washed so that the unbound antibody-enzyme conjugates are removed.
7. A chemical is added that is converted by the enzyme into a color or fluorescent or electrochemical signal.
8. The signal is measured to determine the quantity of antigen in the sample.
Indirect and sandwich ELISA
Fig 1. [After R. A. Goldsby, T. J. Kindt, B. A. Osborne, Kuby Immunology, 4th ed. (W. H. Freeman and Company, 2000), p. 162.] Indirect competitive ELISA
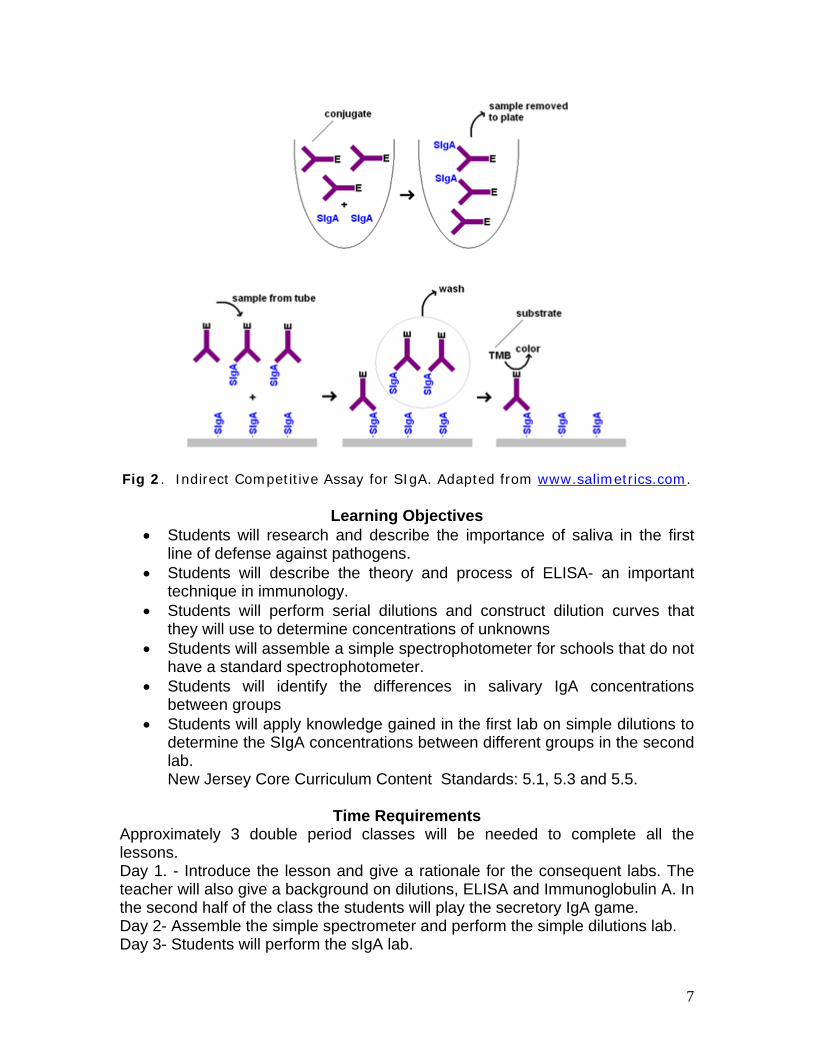
The salimetrics technique was developed to specifically determine the concentration of salivary IgA. It is a competitive indirect ELISA technique. Here, an unlabelled antibody is incubated in the presence of its antigen. The bound antigen/antibody complexes are then added to an antigen coated well. The plate is washed so that unbound antibody is removed (the more antigen in the sample, the less antibody will be able to bind to the antigen in the well, hence competition). The secondary antibody, specific to the primary antibody is added. The secondary antibody is coupled to an enzyme. A substrate is added and remaining enzyme elicits a chromogenic or fluorescent signal. For competitive ELISA- the higher the original antigen concentration, the weaker the eventual signal. Hence, the antigen concentration (in this case the antigen is IgA) is inversely proportional to the fluorescent signal.
7
Fig 2. Indirect Competitive Assay for SIgA. Adapted from www.salimetrics.com.
Learning Objectives Students will research and describe the importance of saliva in the first
line of defense against pathogens. Students will describe the theory and process of ELISA- an important
technique in immunology. Students will perform serial dilutions and construct dilution curves that
they will use to determine concentrations of unknowns Students will assemble a simple spectrophotometer for schools that do not
have a standard spectrophotometer. Students will identify the differences in salivary IgA concentrations
between groups Students will apply knowledge gained in the first lab on simple dilutions to
determine the SIgA concentrations between different groups in the second lab. New Jersey Core Curriculum Content Standards: 5.1, 5.3 and 5.5.
Time Requirements
Approximately 3 double period classes will be needed to complete all the lessons. Day 1. - Introduce the lesson and give a rationale for the consequent labs. The teacher will also give a background on dilutions, ELISA and Immunoglobulin A. In the second half of the class the students will play the secretory IgA game. Day 2- Assemble the simple spectrometer and perform the simple dilutions lab. Day 3- Students will perform the sIgA lab.
8
Advance preparations: SIgA classroom activity
Prepare 50 immune system questions on index cards. On the back of 25 of these questions write the word bacteria and on the other 25 write the word virus.
Make the following cards: On 4 index cards write SIgA On 1 write IgA secretory receptor On 1 index card write enzyme On 1 bacteria And on 1 virus
On each card write what each does. These cards will be taped onto the shirts of respective group members during the activity. Prepare a large chart-size construction paper or cloth to represent the respiratory membrane. This will be taped onto the wall. Prepare a points record chart where each group’s points will be recorded and also taped to the wall.
Dilution lab: Unknowns should be made ahead of time with student input. Examples of how the unknowns can be made:
Collect samples of soft drinks from stores, movie theatres and restaurants- with and without ice. Label each sample clearly. These will serve as the unknowns. This is the unknown source that I used with my students.
Alternatively add 100ml of soft drink and 50g of crushed ice into different containers, take 10ml samples at set time intervals.
Another option is to add differing amounts of ice to set amount of soft drink and heat to melt the ice.
SIgA ELISA lab:
1. The teacher should find an immunology laboratory for steps 7-10 of this lab. A local university or college with an immunology department should have the necessary equipment. This arrangement will need to be made well in advance of starting the lab, preferably at the beginning of the academic year.
2. Students should be able to use a pipette before the lab. 3. Determine the plate layout. The kit I recommend here can hold up to 76
samples. It is best to use one kit per class as the standards are limiting but with good organization, one kit can be used for two or more classes to cut on costs. The cost for one sIgA ELISA kit is about $320 (The kit can be purchased from salimetrics Inc., http://www.salimetrics.com/products).
4. Go over the procedure and complete the labels for the tubes- this can be done with student participation.
5. Explain to the students that each group of two students will calculate their average flow rate.
9
6. The procedure is long, so discuss it with the students prior to the lab. 7. Select students that have mastered lab1 on simple dilutions to serially
dilute the standards as a demonstration to the class. Prior to the lab- go over the procedure with these students.
8. Prepare a chart- one for each class where all the data from the standards and samples will be written. You may use the plate layout as a guide. This table will be taped on the wall and students will write down the values for their IgA concentrations on this table after interpolation from the standard curve.
Materials and Equipments
Secretory IgA class activity 100 index cards with color variety. Two large construction paper or pieces of cloth Red, blue and green markers Tape Simple dilution lab: For a class of 30 with 15 groups Materials:
15 Classic soft drink cans- one can per lab group of two students each. Ice in a Styrofoam container Water – enough for dilutions 15 Graduated cylinders Clean test-tubes- 8 per group Gloves for each student Aprons for each student Soft drink samples from various stores and restaurants
Spectrophotometer parts: This section is for schools without a simple spectrophotometer (See diagram on pg 10.). Each group of two students will assemble one spectrophotometer. Therefore, 15 spectrophotometers needed for a class of 30 students. You may adjust the group sizes based on parts availability.
Package of 5 photocells (can be obtained from electronic store) Digital multimeter (From electronic store) Black foam core board from an art supply store Black tape- duct tape will work fine. Blue filter (whole filter pack) Light source Gloves for each student Safety goggles for each student
10
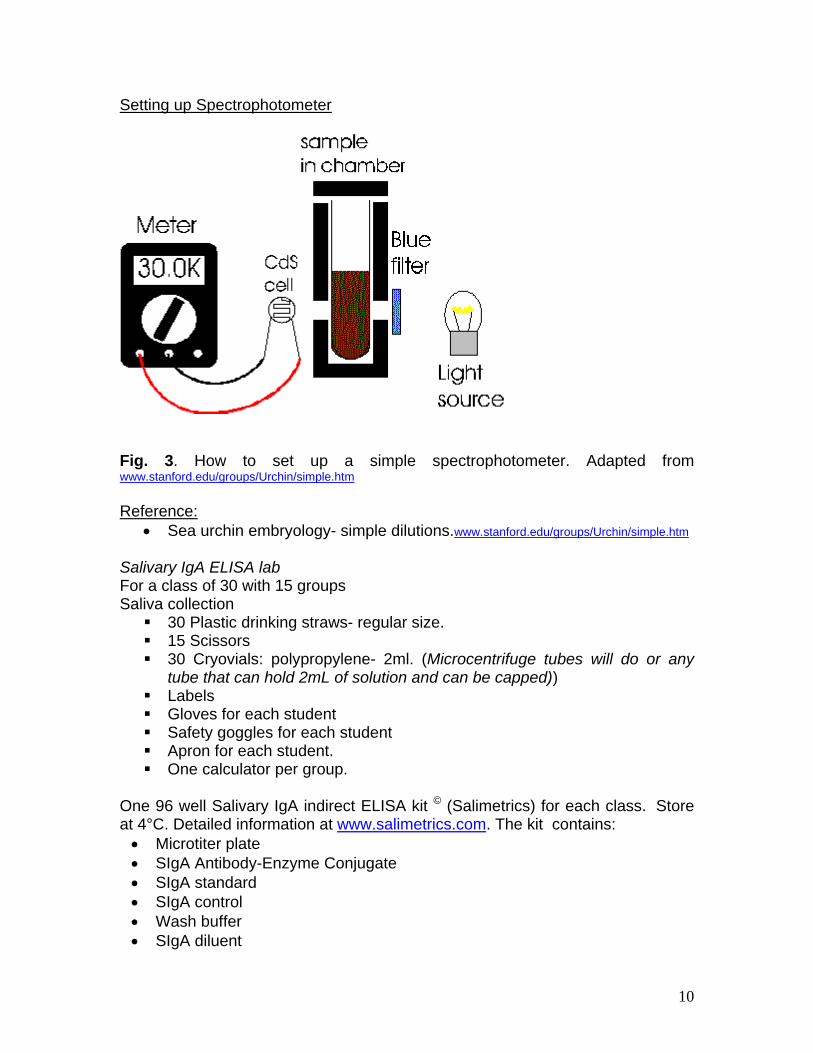
Setting up Spectrophotometer
Fig. 3. How to set up a simple spectrophotometer. Adapted from www.stanford.edu/groups/Urchin/simple.htm Reference:
Sea urchin embryology- simple dilutions.www.stanford.edu/groups/Urchin/simple.htm
Salivary IgA ELISA lab For a class of 30 with 15 groups Saliva collection 30 Plastic drinking straws- regular size. 15 Scissors 30 Cryovials: polypropylene- 2ml. (Microcentrifuge tubes will do or any
tube that can hold 2mL of solution and can be capped)) Labels Gloves for each student Safety goggles for each student Apron for each student. One calculator per group.
One 96 well Salivary IgA indirect ELISA kit © (Salimetrics) for each class. Store at 4°C. Detailed information at www.salimetrics.com. The kit contains: Microtiter plate SIgA Antibody-Enzyme Conjugate SIgA standard SIgA control Wash buffer SIgA diluent
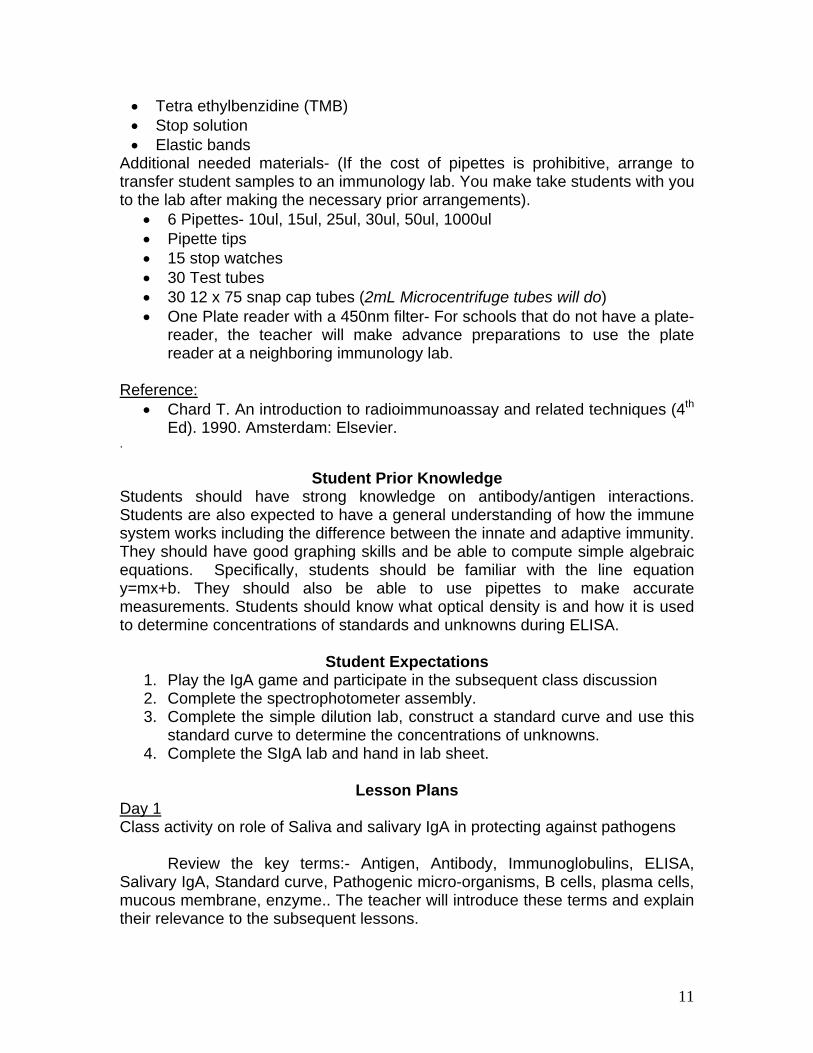
11
Tetra ethylbenzidine (TMB) Stop solution Elastic bands
Additional needed materials- (If the cost of pipettes is prohibitive, arrange to transfer student samples to an immunology lab. You make take students with you to the lab after making the necessary prior arrangements).
6 Pipettes- 10ul, 15ul, 25ul, 30ul, 50ul, 1000ul Pipette tips 15 stop watches 30 Test tubes 30 12 x 75 snap cap tubes (2mL Microcentrifuge tubes will do) One Plate reader with a 450nm filter- For schools that do not have a plate-
reader, the teacher will make advance preparations to use the plate reader at a neighboring immunology lab.
Reference:
Chard T. An introduction to radioimmunoassay and related techniques (4th Ed). 1990. Amsterdam: Elsevier.
.
Student Prior Knowledge Students should have strong knowledge on antibody/antigen interactions. Students are also expected to have a general understanding of how the immune system works including the difference between the innate and adaptive immunity. They should have good graphing skills and be able to compute simple algebraic equations. Specifically, students should be familiar with the line equation y=mx+b. They should also be able to use pipettes to make accurate measurements. Students should know what optical density is and how it is used to determine concentrations of standards and unknowns during ELISA.
Student Expectations 1. Play the IgA game and participate in the subsequent class discussion 2. Complete the spectrophotometer assembly. 3. Complete the simple dilution lab, construct a standard curve and use this
standard curve to determine the concentrations of unknowns. 4. Complete the SIgA lab and hand in lab sheet.
Lesson Plans
Day 1 Class activity on role of Saliva and salivary IgA in protecting against pathogens
Review the key terms:- Antigen, Antibody, Immunoglobulins, ELISA,
Salivary IgA, Standard curve, Pathogenic micro-organisms, B cells, plasma cells, mucous membrane, enzyme.. The teacher will introduce these terms and explain their relevance to the subsequent lessons.
12
1. Make cards to represent saliva, two molecules of SIgA showing a binding site (you will have four students do this as this is a dimeric protein), 1 bacteria (with the same binding site that corresponds to the SIgA), 1 virus, 1 IgA secretory receptor and one enzyme . On the backs of these cards write down what each does. The cards should be color coded to make it easier for students to recognize them. Additionally, the teacher will have prepared 50 questions on immune system and written them on index cards, 25 questions labeled virus and 25 labeled bacteria. Students can be involved in the preparation of these questions.
Sample questions: a) Give two examples of organs that are involved in the immune response. b) What are the two types of T cells? c) Explain the difference in structure between IgA and IgM d) In what parts of the body is IgA found? e) What cell type makes antibodies?
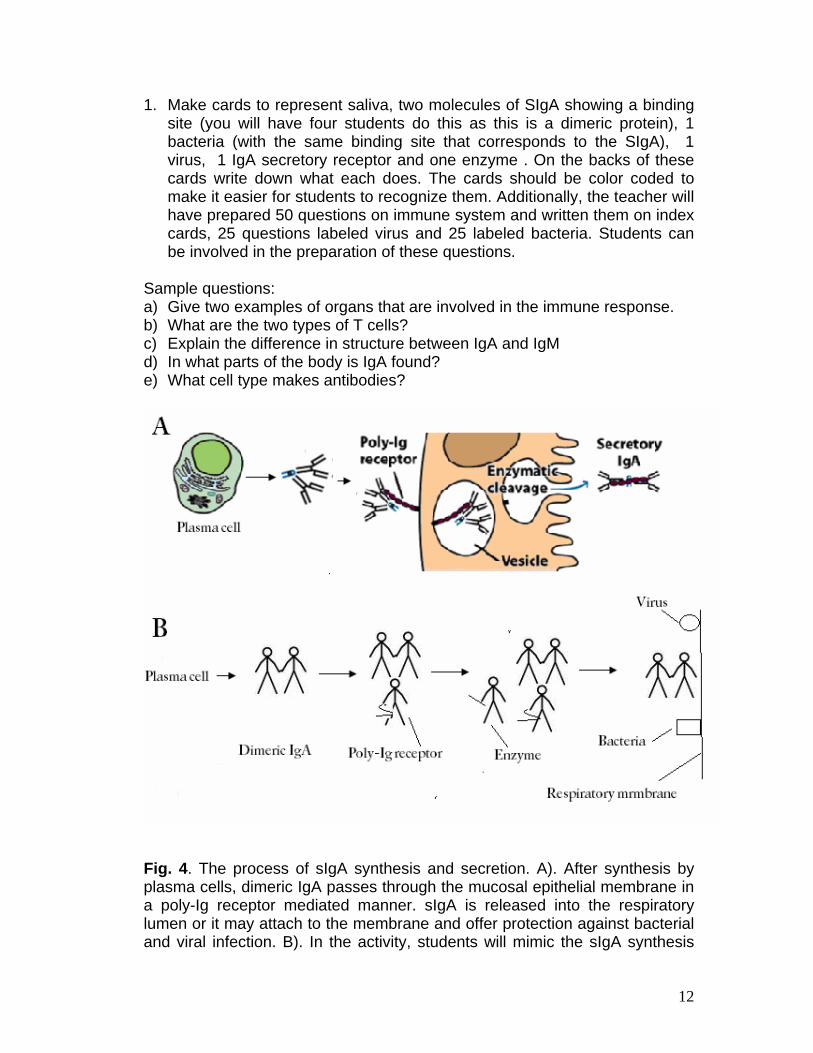
Fig. 4. The process of sIgA synthesis and secretion. A). After synthesis by plasma cells, dimeric IgA passes through the mucosal epithelial membrane in a poly-Ig receptor mediated manner. sIgA is released into the respiratory lumen or it may attach to the membrane and offer protection against bacterial and viral infection. B). In the activity, students will mimic the sIgA synthesis

13
pathway. One group will role play the pathway and answer questions to protect the respiratory membrane while an opposing group will ask the questions and stick bacteria or virus onto the membrane when questions are answered incorrectly. Students will be divided into groups of 6. Each group will take turns as either group A or B. Each member of each group will take a role as one of the following (See fig. 4):
o Bacteria- I adhere to the mucosal surface and cause an infection o Virus- I pass through the mucosa and get into the epithelial cells of
the respiratory surface, multiply and kill the cells. o IgA secretory receptor- I am responsible for transportation of IgA
from the lymphoid tissue where it is made by plasma cells to the lumen of the respiratory tract. I remain attached to the IgA until the enzyme cleaves me off
o First SIgA – I bind to the bacteria and prevent them from binding to mucosal surface
o Second SIgA- I bind the virus and prevent them from getting through the mucosa, multiplying and killing the cells
o Enzyme- I cleave off the SIgA receptor so that the SIgA is released into the respiratory lumen.
2. Have one large piece of cloth or paper to represent the respiratory membrane. This should be taped onto the wall
3. There will be two opposing groups (For larger class sizes, devide students into groups of six)- each consisting of:
a) Two students to represent dimeric sIgA b) 1 student to represent poly-Ig receptor. c) 1 student to represent the enzyme. d) 1 student to represent virus e) 1 student to represent bacteria
4. To start the activity, group B’s SIgA, enzyme and receptor will go outside the classroom door. The two pairs of students (each pair holding hands to represent the dimeric nature of IgA) representing Salivary IgA will then enter the class through the door while attached to the IgA receptor. The enzyme will follow behind. Each student will read their card to the class.
5. Once inside the class, the student representing the enzyme will separate the receptor from the IgA pair. The IgA pair will move to the membrane and stand guard.
6. Group A will then be provided with 10 immune system questions to ask group B.
7. Group B will have 1 minute to answer each question. Every time a wrong answer is given, the card that contains that question is stuck onto the membrane behind the IgA and represents either a virus or bacteria. Six or more stuck cards represent an infection if more than half of them are bacteria or epithelial cell death if more than half are viruses.
14
8. The groups will then take turns until each group has played the game as either group A or B
9. The goal is to go through the activity with less than 6 cards stuck, getting more than 4 questions right.
Classroom Discussion
The following are sample questions to be given to students to use for discussion after the activity: 1. What is the first line of defense that an invading pathogen must cross? 2. How does saliva and its components protect against pathogens? 3. Describe the structure of secretory IgA 4. Where is IgA made? 5. To relate the activity to real life ask students why some individuals would
have more virus and bacteria stick to the mucous membrane while others have less.
6. Describe some diseases associated with low levels of IgA. 7. Please write out in short steps what has happened in the activity. When
you are finished, take turns and describe these steps to a partner.
Assessment: There are many possible modes of assessment for this activity. You may
require that students write an individual essay describing what they acted out in class. The essay could include pictures to help support their work.
Another assessment would be to have the students develop a poster, story, map, rap, song, poem, or representation of choice to indicate their knowledge of the topic. Concept maps may be used as well to describe the process of IgA protection.
Day 2 Simple dilutions Lab (modified from Stanford University-sea urchin embryology) Summary: Starting from a known concentration students will learn to use dilutions to determine the concentration of an unknown. The students will acquire the following skills:
1. Making dilutions 2. Reading the meter on a simple home-made spectrophotometer (as shown
on pg 10) 3. Keeping careful laboratory records 4. Graphing on linear graph paper 5. Determining an unknown from a known concentration
Timing: One 45-50 minute class to build spectrophotometer One 45-50 minute class period for lesson
15
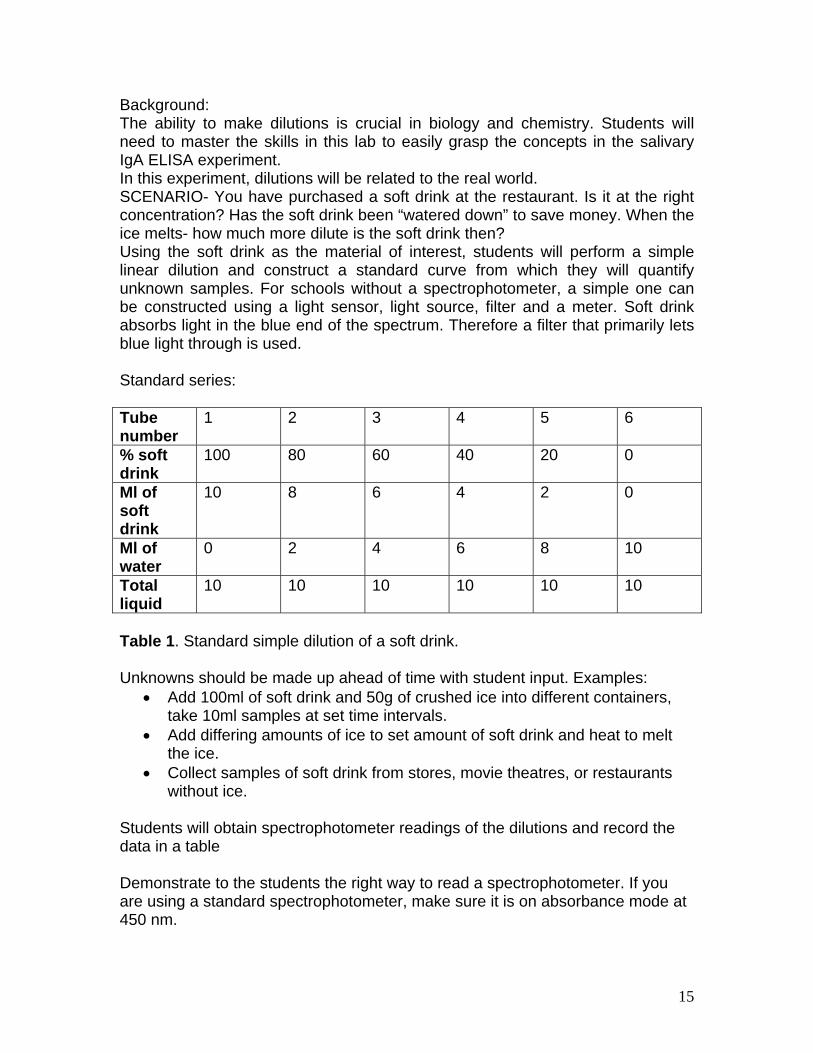
Background: The ability to make dilutions is crucial in biology and chemistry. Students will need to master the skills in this lab to easily grasp the concepts in the salivary IgA ELISA experiment. In this experiment, dilutions will be related to the real world. SCENARIO- You have purchased a soft drink at the restaurant. Is it at the right concentration? Has the soft drink been “watered down” to save money. When the ice melts- how much more dilute is the soft drink then? Using the soft drink as the material of interest, students will perform a simple linear dilution and construct a standard curve from which they will quantify unknown samples. For schools without a spectrophotometer, a simple one can be constructed using a light sensor, light source, filter and a meter. Soft drink absorbs light in the blue end of the spectrum. Therefore a filter that primarily lets blue light through is used. Standard series: Tube number
1 2 3 4 5 6
% soft drink
100 80 60 40 20 0
Ml of soft drink
10 8 6 4 2 0
Ml of water
0 2 4 6 8 10
Total liquid
10 10 10 10 10 10
Table 1. Standard simple dilution of a soft drink. Unknowns should be made up ahead of time with student input. Examples:
Add 100ml of soft drink and 50g of crushed ice into different containers, take 10ml samples at set time intervals.
Add differing amounts of ice to set amount of soft drink and heat to melt the ice.
Collect samples of soft drink from stores, movie theatres, or restaurants without ice.
Students will obtain spectrophotometer readings of the dilutions and record the data in a table Demonstrate to the students the right way to read a spectrophotometer. If you are using a standard spectrophotometer, make sure it is on absorbance mode at 450 nm.

16
Anticipated Results: Plot absorbance readings readings vs. concentration as shown in the example below. Remember that the student standard curves may appear quite different from the one shown here.
soft drinks dilution series
0
1
2
3
4
0 20 40 60 80 100
% soft drink
Fig. 5. Soft drink simple dilution standard curve. Unknowns can be found by reading the K-Ohms or absorbance of the unknown and finding the concentration on the graph. Students should also draw a line and use a two-point substitution to solve for constants in the standard linear equation y=Mx+B Discussion Questions:
1. This lesson did a linear dilution. How would you do a serial dilution based on a factor of 2? 10? (Starting from the same 100% dilution).
2. In a subsequent lesson, secretory IgA standard protein will be diluted in a similar manner. What is the relationship between the K-Ohms readings and concentration?
3. How would you record the results for a solution that changes color with time?
4. How much do you weigh? In grams? (453g / lb) If you took a 1000 milligram vitamin pill (1000milligrams=1gram) how dilute would it be in your body?
5. What would happen if the samples were not mixed well? How would this affect readings?
Assessment: Class participation and laboratory report. On the lab report look for:
Neatness and organization into separate clearly defined sections: Objectives, materials, methods, Results, discussion, conclusion.
Table of data collected Graphs Determination of unknowns and how values were found Answers to the follow-up questions.
17
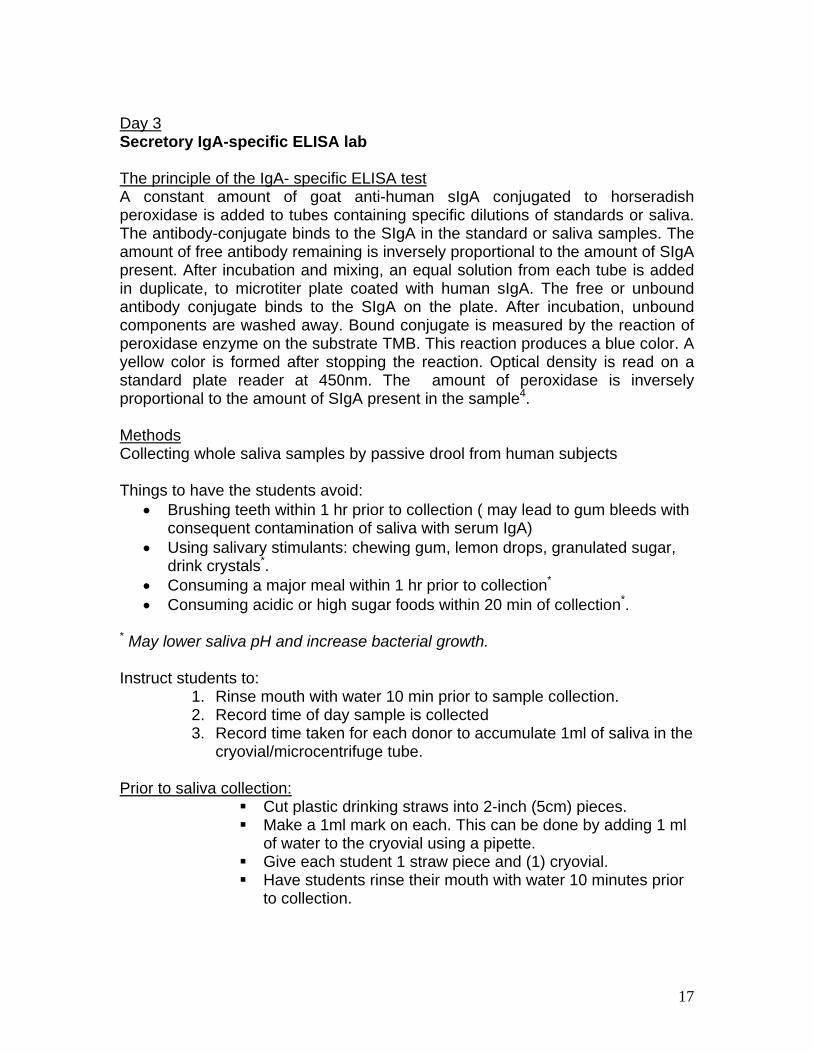
Day 3 Secretory IgA-specific ELISA lab The principle of the IgA- specific ELISA test A constant amount of goat anti-human sIgA conjugated to horseradish peroxidase is added to tubes containing specific dilutions of standards or saliva. The antibody-conjugate binds to the SIgA in the standard or saliva samples. The amount of free antibody remaining is inversely proportional to the amount of SIgA present. After incubation and mixing, an equal solution from each tube is added in duplicate, to microtiter plate coated with human sIgA. The free or unbound antibody conjugate binds to the SIgA on the plate. After incubation, unbound components are washed away. Bound conjugate is measured by the reaction of peroxidase enzyme on the substrate TMB. This reaction produces a blue color. A yellow color is formed after stopping the reaction. Optical density is read on a standard plate reader at 450nm. The amount of peroxidase is inversely proportional to the amount of SIgA present in the sample4. Methods Collecting whole saliva samples by passive drool from human subjects Things to have the students avoid:
Brushing teeth within 1 hr prior to collection ( may lead to gum bleeds with consequent contamination of saliva with serum IgA)
Using salivary stimulants: chewing gum, lemon drops, granulated sugar, drink crystals*.
Consuming a major meal within 1 hr prior to collection* Consuming acidic or high sugar foods within 20 min of collection*.
* May lower saliva pH and increase bacterial growth. Instruct students to:
1. Rinse mouth with water 10 min prior to sample collection. 2. Record time of day sample is collected 3. Record time taken for each donor to accumulate 1ml of saliva in the
cryovial/microcentrifuge tube. Prior to saliva collection:
Cut plastic drinking straws into 2-inch (5cm) pieces. Make a 1ml mark on each. This can be done by adding 1 ml
of water to the cryovial using a pipette. Give each student 1 straw piece and (1) cryovial. Have students rinse their mouth with water 10 minutes prior
to collection.
18
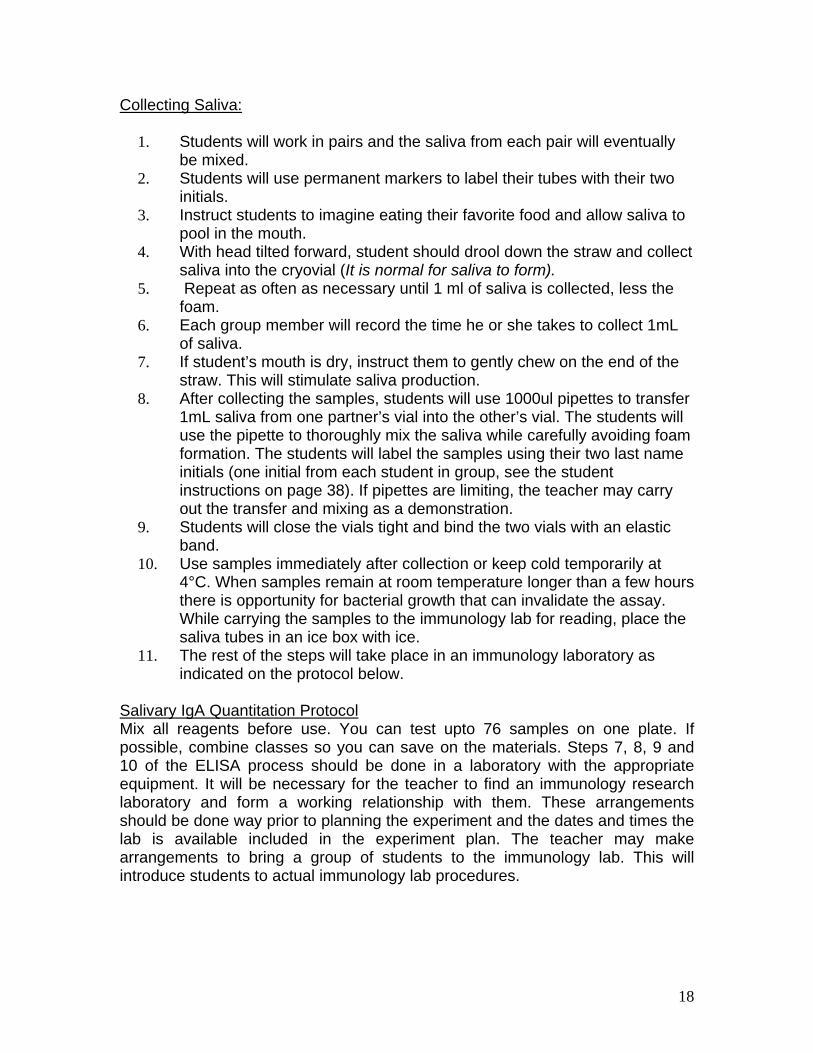
Collecting Saliva: 1. Students will work in pairs and the saliva from each pair will eventually
be mixed. 2. Students will use permanent markers to label their tubes with their two
initials. 3. Instruct students to imagine eating their favorite food and allow saliva to
pool in the mouth. 4. With head tilted forward, student should drool down the straw and collect
saliva into the cryovial (It is normal for saliva to form). 5. Repeat as often as necessary until 1 ml of saliva is collected, less the
foam. 6. Each group member will record the time he or she takes to collect 1mL
of saliva. 7. If student’s mouth is dry, instruct them to gently chew on the end of the
straw. This will stimulate saliva production. 8. After collecting the samples, students will use 1000ul pipettes to transfer
1mL saliva from one partner’s vial into the other’s vial. The students will use the pipette to thoroughly mix the saliva while carefully avoiding foam formation. The students will label the samples using their two last name initials (one initial from each student in group, see the student instructions on page 38). If pipettes are limiting, the teacher may carry out the transfer and mixing as a demonstration.
9. Students will close the vials tight and bind the two vials with an elastic band.
10. Use samples immediately after collection or keep cold temporarily at 4°C. When samples remain at room temperature longer than a few hours there is opportunity for bacterial growth that can invalidate the assay. While carrying the samples to the immunology lab for reading, place the saliva tubes in an ice box with ice.
11. The rest of the steps will take place in an immunology laboratory as indicated on the protocol below.
Salivary IgA Quantitation Protocol Mix all reagents before use. You can test upto 76 samples on one plate. If possible, combine classes so you can save on the materials. Steps 7, 8, 9 and 10 of the ELISA process should be done in a laboratory with the appropriate equipment. It will be necessary for the teacher to find an immunology research laboratory and form a working relationship with them. These arrangements should be done way prior to planning the experiment and the dates and times the lab is available included in the experiment plan. The teacher may make arrangements to bring a group of students to the immunology lab. This will introduce students to actual immunology lab procedures.
19
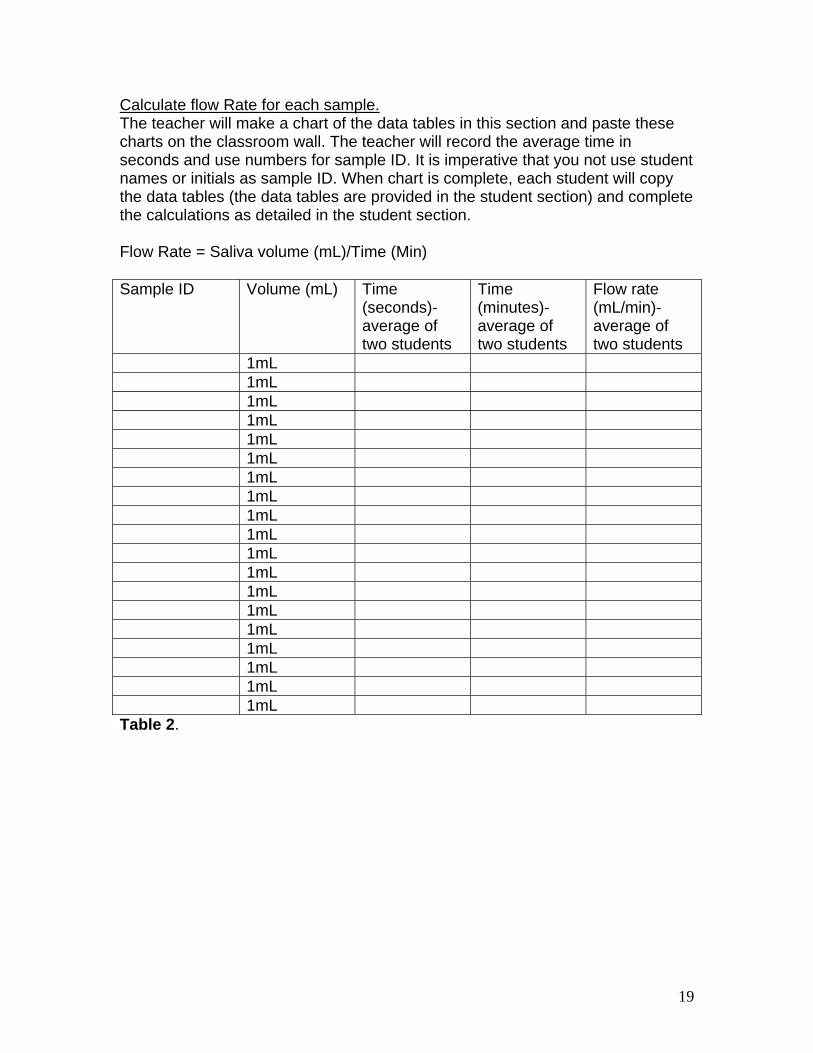
Calculate flow Rate for each sample. The teacher will make a chart of the data tables in this section and paste these charts on the classroom wall. The teacher will record the average time in seconds and use numbers for sample ID. It is imperative that you not use student names or initials as sample ID. When chart is complete, each student will copy the data tables (the data tables are provided in the student section) and complete the calculations as detailed in the student section. Flow Rate = Saliva volume (mL)/Time (Min) Sample ID Volume (mL) Time
(seconds)- average of two students
Time (minutes)- average of two students
Flow rate (mL/min)- average of two students
1mL 1mL 1mL 1mL 1mL 1mL 1mL 1mL 1mL 1mL 1mL 1mL 1mL 1mL 1mL 1mL 1mL 1mL 1mL Table 2.
20
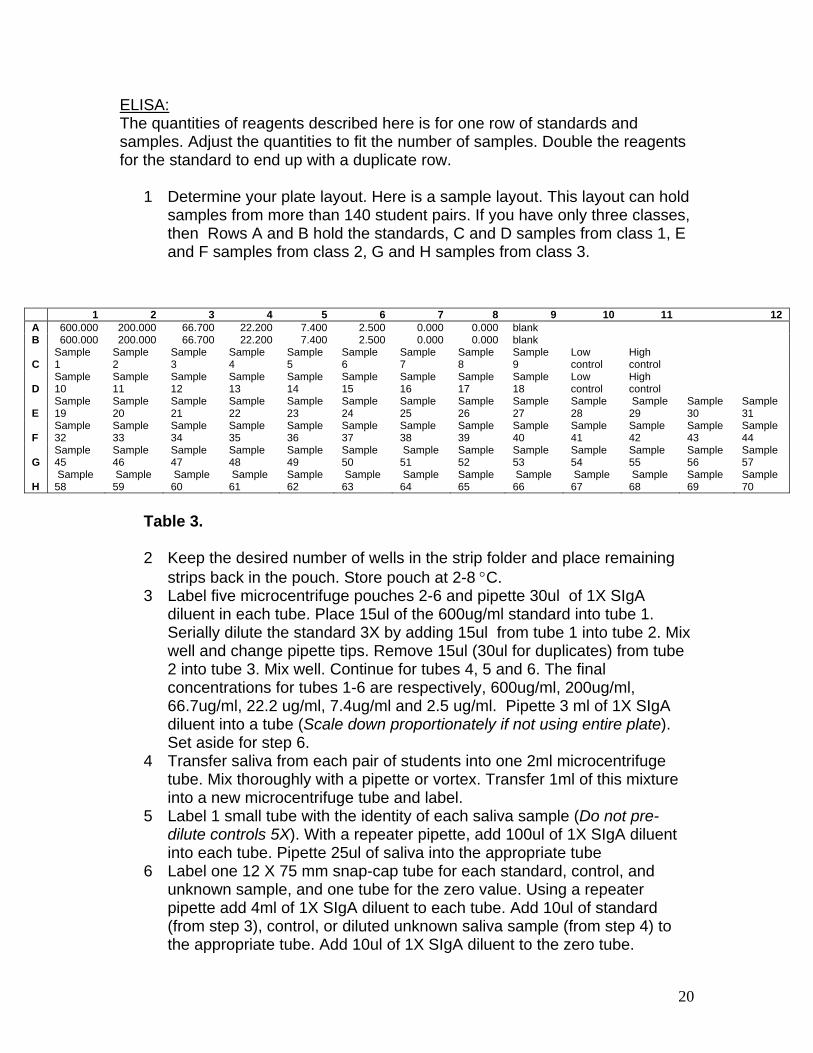
ELISA: The quantities of reagents described here is for one row of standards and samples. Adjust the quantities to fit the number of samples. Double the reagents for the standard to end up with a duplicate row.
1 Determine your plate layout. Here is a sample layout. This layout can hold samples from more than 140 student pairs. If you have only three classes, then Rows A and B hold the standards, C and D samples from class 1, E and F samples from class 2, G and H samples from class 3.
Table 3.
2 Keep the desired number of wells in the strip folder and place remaining
strips back in the pouch. Store pouch at 2-8 C. 3 Label five microcentrifuge pouches 2-6 and pipette 30ul of 1X SIgA
diluent in each tube. Place 15ul of the 600ug/ml standard into tube 1. Serially dilute the standard 3X by adding 15ul from tube 1 into tube 2. Mix well and change pipette tips. Remove 15ul (30ul for duplicates) from tube 2 into tube 3. Mix well. Continue for tubes 4, 5 and 6. The final concentrations for tubes 1-6 are respectively, 600ug/ml, 200ug/ml, 66.7ug/ml, 22.2 ug/ml, 7.4ug/ml and 2.5 ug/ml. Pipette 3 ml of 1X SIgA diluent into a tube (Scale down proportionately if not using entire plate). Set aside for step 6.
4 Transfer saliva from each pair of students into one 2ml microcentrifuge tube. Mix thoroughly with a pipette or vortex. Transfer 1ml of this mixture into a new microcentrifuge tube and label.
5 Label 1 small tube with the identity of each saliva sample (Do not pre-dilute controls 5X). With a repeater pipette, add 100ul of 1X SIgA diluent into each tube. Pipette 25ul of saliva into the appropriate tube
6 Label one 12 X 75 mm snap-cap tube for each standard, control, and unknown sample, and one tube for the zero value. Using a repeater pipette add 4ml of 1X SIgA diluent to each tube. Add 10ul of standard (from step 3), control, or diluted unknown saliva sample (from step 4) to the appropriate tube. Add 10ul of 1X SIgA diluent to the zero tube.
1 2 3 4 5 6 7 8 9 10 11 12 A 600.000 200.000 66.700 22.200 7.400 2.500 0.000 0.000 blank B 600.000 200.000 66.700 22.200 7.400 2.500 0.000 0.000 blank
C Sample 1
Sample 2
Sample 3
Sample 4
Sample 5
Sample 6
Sample 7
Sample 8
Sample 9
Low control
High control
D Sample 10
Sample 11
Sample 12
Sample 13
Sample 14
Sample 15
Sample 16
Sample 17
Sample 18
Low control
High control
E Sample 19
Sample 20
Sample 21
Sample 22
Sample 23
Sample 24
Sample 25
Sample 26
Sample 27
Sample 28
Sample 29
Sample 30
Sample 31
F Sample 32
Sample 33
Sample 34
Sample 35
Sample 36
Sample 37
Sample 38
Sample 39
Sample 40
Sample 41
Sample 42
Sample 43
Sample 44
G Sample 45
Sample 46
Sample 47
Sample 48
Sample 49
Sample 50
Sample 51
Sample 52
Sample 53
Sample 54
Sample 55
Sample 56
Sample 57
H Sample 58
Sample 59
Sample 60
Sample 61
Sample 62
Sample 63
Sample 64
Sample 65
Sample 66
Sample 67
Sample 68
Sample 69
Sample 70
21
7 Dilute the antibody-enzyme conjugate 1:120 by adding 25 ul of the conjugate to the 3ml of 1X SIgA diluent prepared in step 3. Scale down proportionately if not using entire plate). Mix well and pipette 50ul of the diluted antibody-enzyme conjugate to all tubes using a repeater pipette. Gently mix each tube by inversion and incubate for 90 minutes at room temperature.
8 Gently mix each tube by inversion again and add 50ul of solution from step 6 to the microtiter plate according to your template. Add 50ul of 1X SIgA diluent to the NSB wells. Seal plate and incubate at room temperature with continual mixing at 400 rpm for 90 minutes (60-90 minutes is fine).
9 Wash the plate 6 times with 300ul 1X wash buffer in each well. 10 Add 50ul TMB solution to each well with a multichannel pipette. 11 Mix on a plate rotator for 5 minutes at 500rpm (not very necessary) and
incubate the plate in the dark at room temperature for an additional 40 minutes. Though the protocol suggests 40 minutes, I found 2 minutes to be adequate. Incubating for more than 10 minutes led to color change that was too bright for the plate reader available to me (Tecan, GENios model).
12 Add 50ul of stop solution with a multichannel pipette. Mix on a plate rotator for 3 min at 500rpm (or tap to mix). Be sure all wells have turned yellow. Read plate in a plate reader at 450nm. Read plate within 10 minutes of adding stop solution..
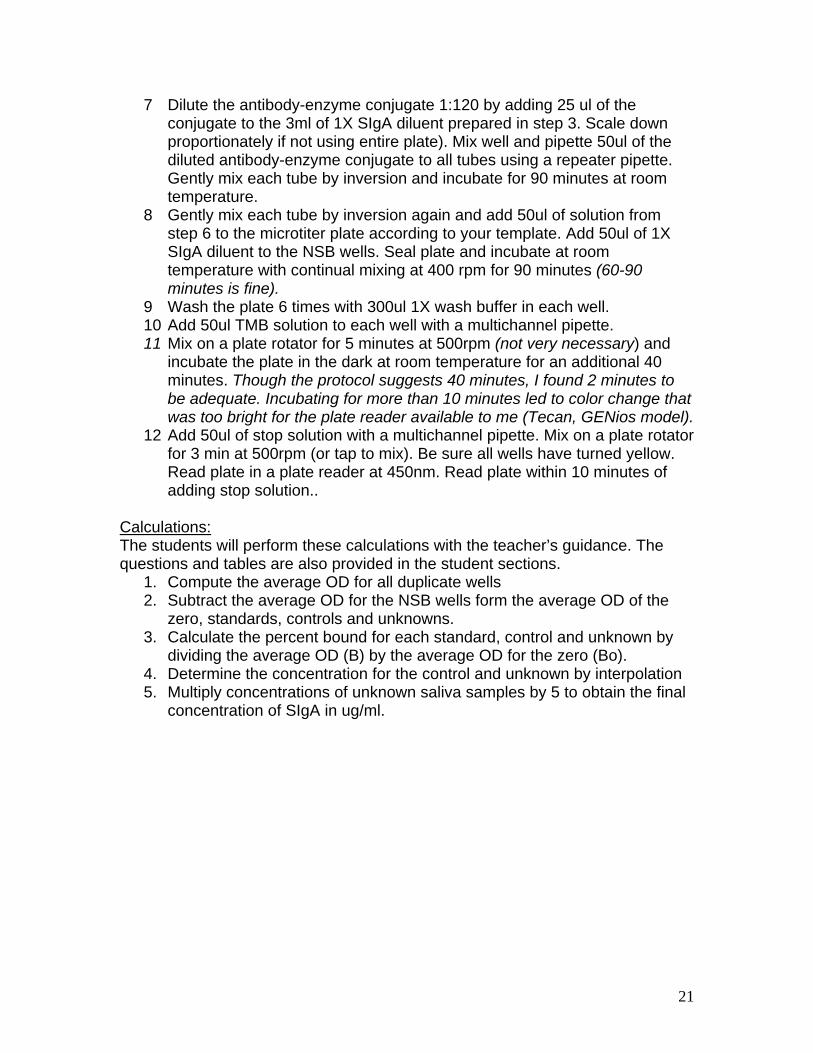
Calculations: The students will perform these calculations with the teacher’s guidance. The questions and tables are also provided in the student sections.
1. Compute the average OD for all duplicate wells 2. Subtract the average OD for the NSB wells form the average OD of the
zero, standards, controls and unknowns. 3. Calculate the percent bound for each standard, control and unknown by
dividing the average OD (B) by the average OD for the zero (Bo). 4. Determine the concentration for the control and unknown by interpolation 5. Multiply concentrations of unknown saliva samples by 5 to obtain the final
concentration of SIgA in ug/ml.
22
Wells Sample ID Average
OD B B/Bo SIgA
(ug/ml) Table 4. Corrected SIgA= absolute SIgA (ug/mL) x flowrate (mL/min) Sample ID Absolute SIgA
(ug/mL) Flow rate (mL/min)
Corrected SIgA (ug/min)
Table 5.
23
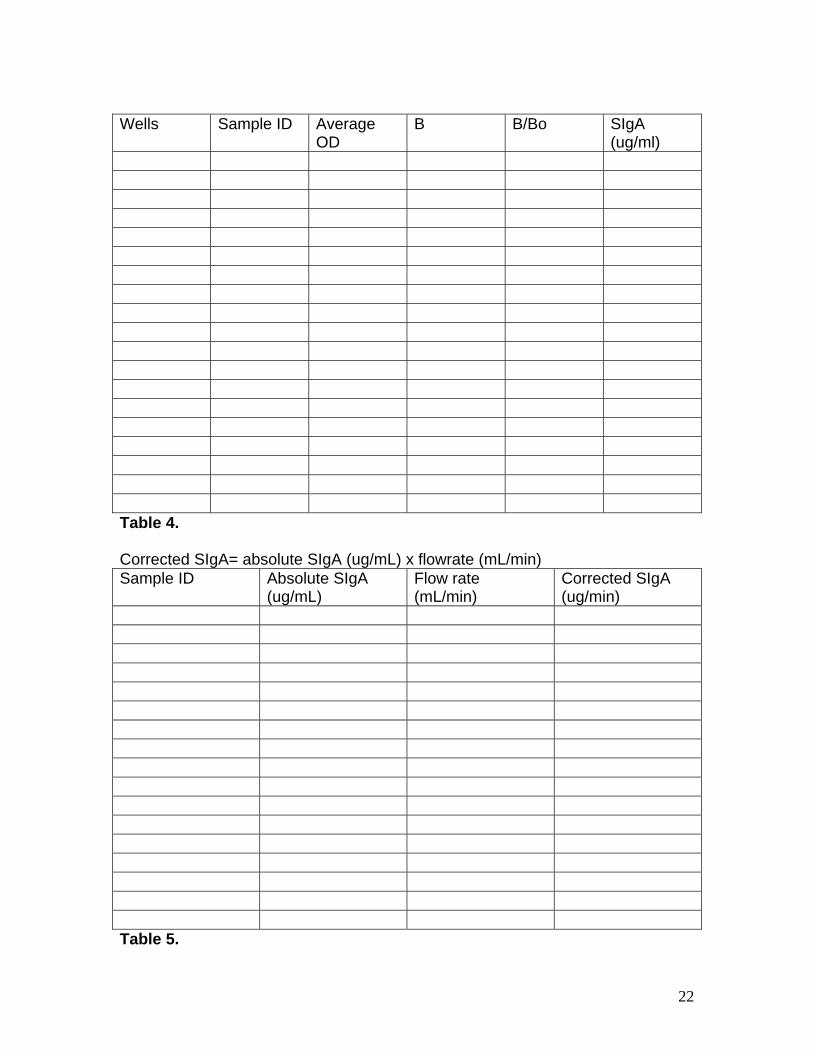
Sample data and results as obtained by this author
Name of Assay: sIgA quantitation ELISA091408 Incubation: 90 min Date performed: 91408 Performed by: David Mwangi Plate layout
1 2 3 4 5 6 7 8 9 10 11
A 600.000 200.000 66.700 22.200 7.400 2.500 0.000 0.000 blank
B 600.000 200.000 66.700 22.200 7.400 2.500 0.000 0.000 blank
C Donor 1 Donor 2 Donor 3
Donor 4
Donor 5
Donor 6
Donor 7
Donor 8
Donor 9
Low control
High control
D Donor 1 Donor 2 Donor 3
Donor 4
Donor 5
Donor 6
Donor 7
Donor 8
Donor 9
Low control
High control
E
F
G
H
Raw data Average of Two Reads
1 2 3 4 5 6 7 8 9 10 11
A 0.1422 0.1695 0.3241 0.442 0.7985 1.276 1.771 2.1249 0.0004 0 0.0004
B 0.121 0.1851 0.2954 0.524 0.933 1.228 1.662 1.4453 0.0004 0 0
C 0.4034 0.4598 0.458 0.414 0.2982 0.635 0.765 0.7481 0.449 0.4282 0.2065
D 0.4199 0.5397 0.4847 0.376 0.323 0.584 0.697 0.5798 0.5705 0.5276 0.2584
E 0.0297 0.0313 0.0271 0.029 0.0326 0.032 0.032 0.0298 0.0289 0.0381 0.0292
F 0.0284 0.0301 0.0275 0.028 0.0262 0.027 0.064 0.0314 0.0406 0.0328 0.0321
G 0.0013 0.0001 0.0013 3E-04 0 0 7E-04 0 0.0002 0.0006 0.0003
H 0.0012 0.0001 0 0 0.0001 0 0 0 0 0 0
Average of duplicates
1 2 3 4 5 6 7 8 9 10 11
A&B 0.1316 0.1773 0.3098 0.483 0.8658 1.252 1.716 1.7851 0.0004 0 0.0002
C&D 0.41165 0.4998 0.4714 0.395 0.3106 0.61 0.731 0.664 0.5098 0.4779 0.23245
Subtract blank to get B value 4E-04 Bo Value
1 2 3 4 5 6 7 8 9 10 11
A&B 0.1312 0.1769 0.3094 0.482 0.8654 1.251 1.716 1.7847 0
C&D 0.41125 0.4994 0.471 0.395 0.3102 0.609 0.73 0.6636 0.5094 0.4775 0.23205
Percent bound= Average OD(B)/Average OD
standards 600 200 66.7 22.2 7.4 2.5 0
B/Bo 0.07667 0.1031 0.1805 0.281 0.5043 0.729 1
Samples Donor 1 Donor 2 Donor 3
Donor 4
Donor 5
Donor 6
Donor 7
Donor 8
Donor 9
Low control
High control
B/Bo 0.23966 0.291 0.2744 0.23 0.1808 0.355 0.426 0.3867 0.2968 0.27826 0.13523

24
25
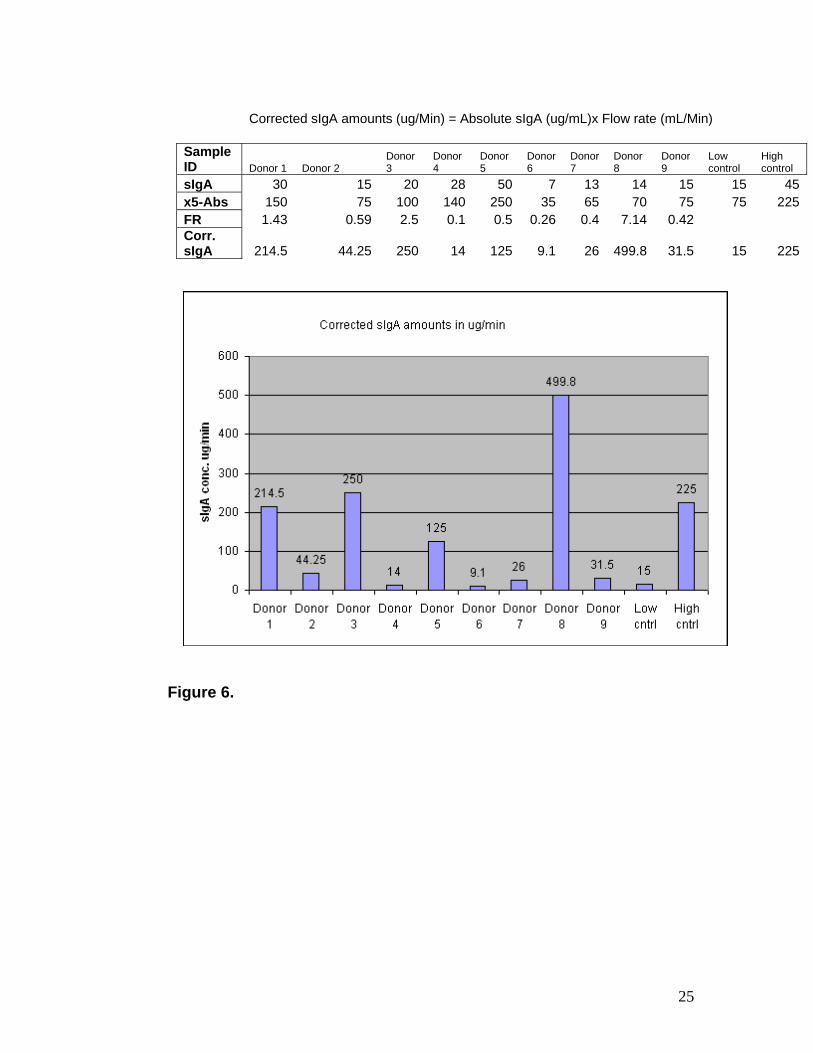
Corrected sIgA amounts (ug/Min) = Absolute sIgA (ug/mL)x Flow rate (mL/Min)
Sample ID Donor 1 Donor 2
Donor 3
Donor 4
Donor 5
Donor 6
Donor 7
Donor 8
Donor 9
Low control
High control
sIgA 30 15 20 28 50 7 13 14 15 15 45 x5-Abs 150 75 100 140 250 35 65 70 75 75 225 FR 1.43 0.59 2.5 0.1 0.5 0.26 0.4 7.14 0.42
Corr. sIgA 214.5 44.25 250 14 125 9.1 26 499.8 31.5 15 225
Figure 6.

26
Student Section

27
Rationale
Why is saliva important in the body’s defense against pathogens? Most people do not associate saliva with the immune system. However,
saliva and mucosal secretions form an important first line of defense against pathogens invading the mouth. Saliva provides a mechanical washing effect to protect the oral mucous membrane, while IgA prevents viral replication and bacterial attachment to the mucosal surfaces. One of the most widely used techniques in immunology is ELISA. In this lab you will determine the quantity of IgA in your own saliva using ELISA. You will first play a game in which you will learn the path taken by IgA from its synthesis to the oral cavity. Then, you will complete two labs. In the first lab, you will become familiar with simple dilutions. You will use this skill in the second lab where you will determine the quantity of IgA in a saliva mixture. You will also complete a lab report and a research paper at the conclusion of this unit.
Background Information
Salivary IgA Salivary IgA is an antibody found in saliva, in the gastrointestinal tract and
in mucus secretions throughout the body. The major function of IgA is to prevent bacteria from binding to the mucous membrane and to prevent viruses from multiplying and killing membrane cells. It is estimated that in a normal adult, IgA constitutes 60%-70% of the total output of antibodies. The IgA form most common in saliva is the dimeric secretory IgA. IgA is made by mature B cells in lymph organs and transported to the oral membrane via a receptor. The IgA is then shed into the oral cavity after the receptor is cleaved by an enzyme. It is here that IgA in saliva affords protection against bacteria and viruses. There is great interest in the scientific community to determine whether increased levels of respiratory infections in athletes is related to IgA levels in saliva. The few studies that have already been completed show conflicting data. The effects of exercise on IgA levels are still under intense study.
Competitive ELISA:
ELISA- Enzyme-linked immunosorbent assay. ELISA is a technique that is
used to determine the level of an antigen (like IgA) in a sample (like saliva). An unknown amount of antigen is affixed to a surface, and then an antibody that can only bind the antigen is added. Once the antibody binds the antigen, excess antibody that is not bound to the antigen is washed off. The antibody is linked to an enzyme. In the final step, a substance is added that the enzyme can convert to a detectable signal. The amount of signal generated is proportional to the amount of antigen initially present in the sample. There are several forms of ELISA but they all follow this general process. In your second lab, you will use the competitive ELISA technique to determine the level of IgA in saliva.
28
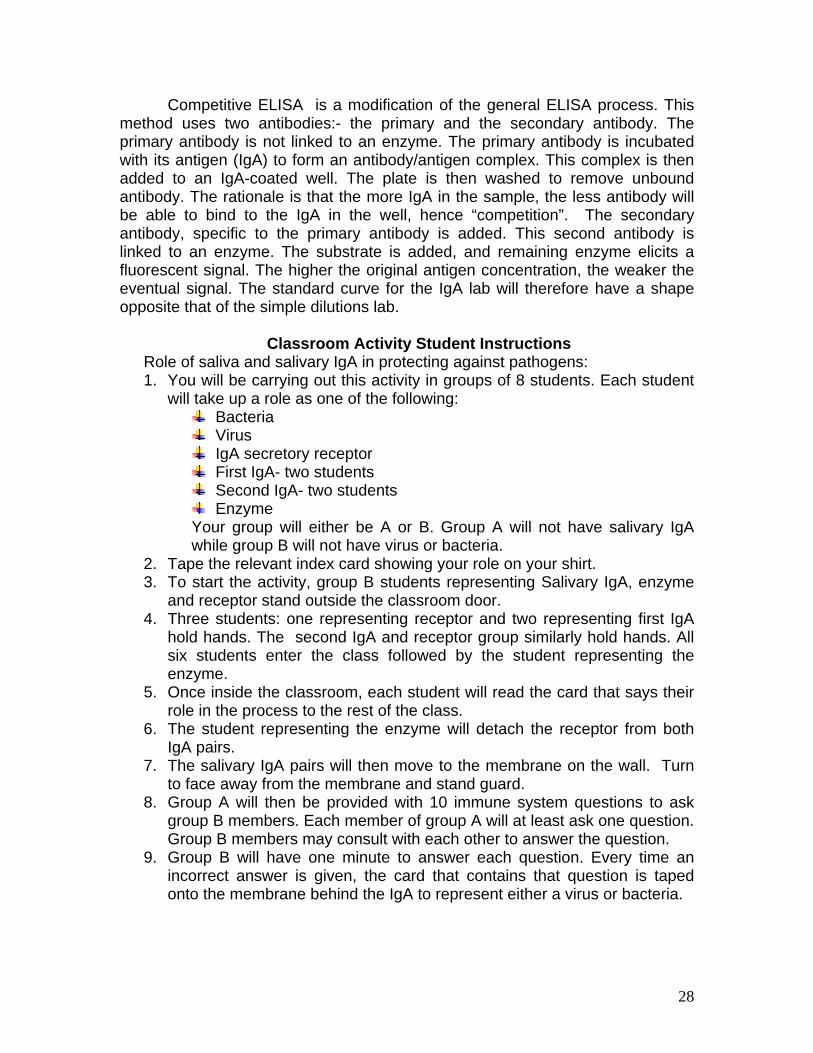
Competitive ELISA is a modification of the general ELISA process. This method uses two antibodies:- the primary and the secondary antibody. The primary antibody is not linked to an enzyme. The primary antibody is incubated with its antigen (IgA) to form an antibody/antigen complex. This complex is then added to an IgA-coated well. The plate is then washed to remove unbound antibody. The rationale is that the more IgA in the sample, the less antibody will be able to bind to the IgA in the well, hence “competition”. The secondary antibody, specific to the primary antibody is added. This second antibody is linked to an enzyme. The substrate is added, and remaining enzyme elicits a fluorescent signal. The higher the original antigen concentration, the weaker the eventual signal. The standard curve for the IgA lab will therefore have a shape opposite that of the simple dilutions lab.
Classroom Activity Student Instructions Role of saliva and salivary IgA in protecting against pathogens: 1. You will be carrying out this activity in groups of 8 students. Each student
will take up a role as one of the following: Bacteria Virus IgA secretory receptor First IgA- two students Second IgA- two students Enzyme
Your group will either be A or B. Group A will not have salivary IgA while group B will not have virus or bacteria.
2. Tape the relevant index card showing your role on your shirt. 3. To start the activity, group B students representing Salivary IgA, enzyme
and receptor stand outside the classroom door. 4. Three students: one representing receptor and two representing first IgA
hold hands. The second IgA and receptor group similarly hold hands. All six students enter the class followed by the student representing the enzyme.
5. Once inside the classroom, each student will read the card that says their role in the process to the rest of the class.
6. The student representing the enzyme will detach the receptor from both IgA pairs.
7. The salivary IgA pairs will then move to the membrane on the wall. Turn to face away from the membrane and stand guard.
8. Group A will then be provided with 10 immune system questions to ask group B members. Each member of group A will at least ask one question. Group B members may consult with each other to answer the question.
9. Group B will have one minute to answer each question. Every time an incorrect answer is given, the card that contains that question is taped onto the membrane behind the IgA to represent either a virus or bacteria.
29
10. At the end of the 10 questions, six or more stuck cards represent an infection if more than half of them are bacteria or epithelial cell death if more than half of the stuck cards are viruses.
11. Group B will now become group A and group A will become group B. The game is then repeated with the same procedure.
12. At the end of the activity, sit in your group. The teacher will provide you with a worksheet that you will discuss and respond to as a group. Write down the responses you agree to on a piece of paper and hand this into the teacher.
Homework:
On construction paper, develop a concept map to describe IgA from synthesis by plasma cells to protection of mucous membrane in the respiratory system.
30
Secretory IgA Classroom Activity
Name Date
1. Describe the role of each of the following in the process of protection
against oral pathogens: I.Plasma cells
II.Salivary IgA
III.IgA receptor
IV.Saliva
V.Mucous membrane
4. What other immune cells not mentioned in the activity help to protect the body against pathogens.
5. Was your group able to protect the membrane? How many bacteria and/or viruses were able to get to the membrane?
6. Draw a concept map to illustrate what happened during the activity from IgA synthesis to protection against bacteria and viruses.

31
Simple Dilutions Lab
Spectrophotometer Assembly
The teacher will demonstrate the assembly procedure in front of the classroom.
To assemble the spectrophotometer, follow the diagram below.
Adapted from www.stanford.edu/groups/Urchin/simple.htm
Directions: 1. You have been provided with a can of soft drink to make your
standards for the standard curve. 2. Place 6 tubes in a test tube rack. Label the tubes as 100, 80, 60, 40,
20 and 0 to represent the percentage of soft drink in each. 3. Use appropriate graduated cylinders to add soft drink and water to
each tube as per the following table. You should end up with 10ml of solution in each tube. 5mL tubes may also be used in which case you will use half of all measurements in the table below.
% soft drink
100 80 60 40 20 0
Ml of soft drink
10 8 6 4 2 0
Ml of water
0 2 4 6 8 10
Total liquid
10 10 10 10 10 10
32
4. You have been provided with labeled samples of soft drink (with and without ice) from different sources as your unknowns.
5. Place 10 ml of each sample in a test tube. Label the test tube with the source of the soft drink.
6. Place each standard or sample in turn in the spectrophotometer sample chamber and take the spectrophotometer readings. Record the readings in the table.
Homework: Complete a lab report. Your report is divided into the following sections:
1. Objectives 2. Materials 3. Methods 4. Results 5. Discussion 6. Conclusion
Your report should be neat, well organized and include all data tables and graphs. It should also include answers to the discussion questions.
33
Simple Dilution lab Name Date
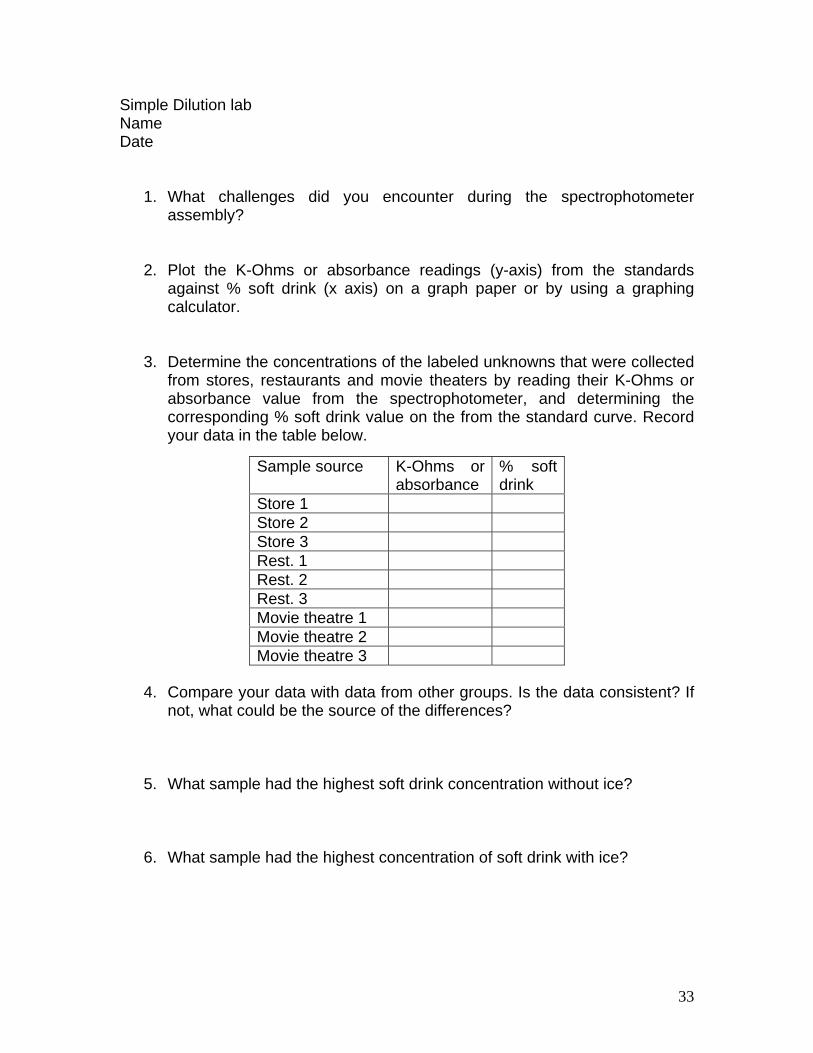
1. What challenges did you encounter during the spectrophotometer assembly?
2. Plot the K-Ohms or absorbance readings (y-axis) from the standards against % soft drink (x axis) on a graph paper or by using a graphing calculator.
3. Determine the concentrations of the labeled unknowns that were collected from stores, restaurants and movie theaters by reading their K-Ohms or absorbance value from the spectrophotometer, and determining the corresponding % soft drink value on the from the standard curve. Record your data in the table below.
4. Compare your data with data from other groups. Is the data consistent? If not, what could be the source of the differences?
5. What sample had the highest soft drink concentration without ice?
6. What sample had the highest concentration of soft drink with ice?
Sample source K-Ohms or absorbance
% soft drink
Store 1 Store 2 Store 3 Rest. 1 Rest. 2 Rest. 3 Movie theatre 1 Movie theatre 2 Movie theatre 3
34
7. Suggest possible reasons why the soft drink concentrations were different between the samples.
8. Assuming the stores, movie theatres and restaurants are all located in one mall, where would you purchase soft drink and why?
9. In this lab, you did a linear dilution. How would you do a serial dilution
based on a factor of 10? (starting from the same 100% dilution)
10. In the next lab, you will use the dilution technique to dilute secretory IgA. What is the relationship between K-Ohms readings and concentration from your graph?
11. How would you record the results for a solution that changes color with time?
12. What would happen if the samples were not mixed well? How would this affect the readings?
35
Secretory IgA Lab sIgA ELISA Instructions: 1. You will work in pairs in this laboratory exercise. 2. Wear goggles, lab apron and gloves during the entire lab. The teacher will
demonstrate the correct way to remove gloves. 3. Rinse mouth with water 10 minutes before saliva collection. 4. In the first table of the lab procedure provided by the teacher, record your
last name initials (one initial from each student) as the sample ID. 5. Place one end of the 5cm straw piece in your mouth and the other end in
the microcentrifuge or whatever tube your teacher provides. 6. Imagine taking your favorite food (yummy!) and allow saliva to pool in the
mouth. 7. With head tilted forward, drool (this is fun!) down the straw and collect
saliva in the microcentrifuge. Note- it is normal for saliva to foam. 8. Repeat until your saliva (minus foam) hits the 1mL mark. 9. Your partner will record the time it takes to collect 1mL. 10. If your mouth is dry, gently chew on the end of the straw to stimulate
saliva production. 11. Label the tubes with the same initials you used for the sample ID. 12. Using a 1000ul pipette, transfer the 1mL saliva into your partners
microcentrifuge tube. Use the pipette to thoroughly mix the saliva. Remove 1mL of this mixture and place it back in the original tube so you have 1mL of the mixture in both tubes.
13. Snap the tubes shut and give them to the teacher. Homework:
1. Complete a lab report for the sIgA ELISA lab. Your report should be neat and organized into the following sections:
Objectives Materials Methods Results Discussion Conclusion Your report should include all data tables and graphs. 2. Write a two page paper on “The effect of flow rate on salivary IgA
quantitation”. In your paper compare the absolute saliva amounts and the corrected saliva amounts. Describe the effect that flow rate correction had on your data. You may use referenced internet sources to help you explain the importance of including the flow rate correction rather than just recording the absolute sIgA concentration. You may find the following website useful: www.salimetrics.com,

36
Secretory IgA lab Name Date
1. With the teachers help, determine the plate layout. Record and keep track of the wells that you use for your sample.
1 2 3 4 5 6 7 8 9 10 11 12
A B C D E F G
H
2. The teacher will provide the sample IDs and time in seconds data
from your saliva collection protocol. Calculate the time in minutes and the flow rate for each unknown sample.
Flow rate=Saliva volume (mL)/Time (Min)
Sample ID Volume (mL) Time (seconds)
Time (minutes)
Flow rate (mL/min)
37
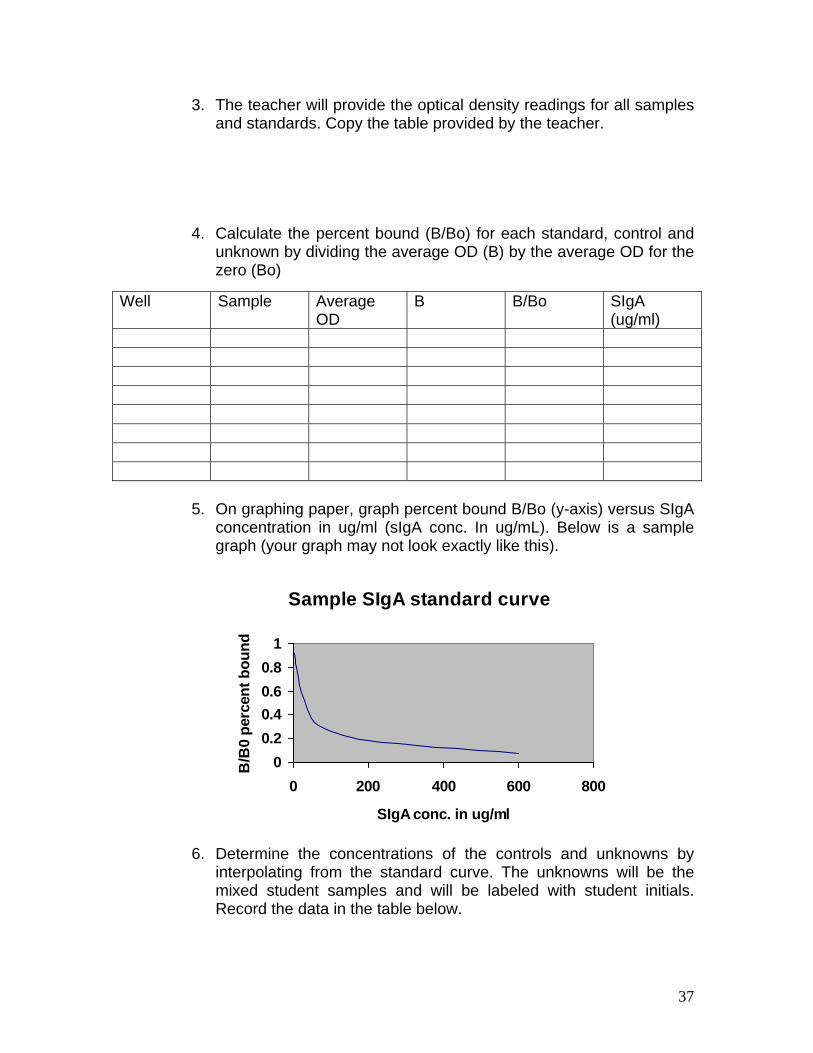
3. The teacher will provide the optical density readings for all samples and standards. Copy the table provided by the teacher.
4. Calculate the percent bound (B/Bo) for each standard, control and unknown by dividing the average OD (B) by the average OD for the zero (Bo)
5. On graphing paper, graph percent bound B/Bo (y-axis) versus SIgA
concentration in ug/ml (sIgA conc. In ug/mL). Below is a sample graph (your graph may not look exactly like this).
Sample SIgA standard curve
0
0.2
0.4
0.6
0.8
1
0 200 400 600 800
SIgA conc. in ug/ml
B/B
0 p
erce
nt
bo
un
d
6. Determine the concentrations of the controls and unknowns by
interpolating from the standard curve. The unknowns will be the mixed student samples and will be labeled with student initials. Record the data in the table below.
Well Sample Average OD
B B/Bo SIgA (ug/ml)
38
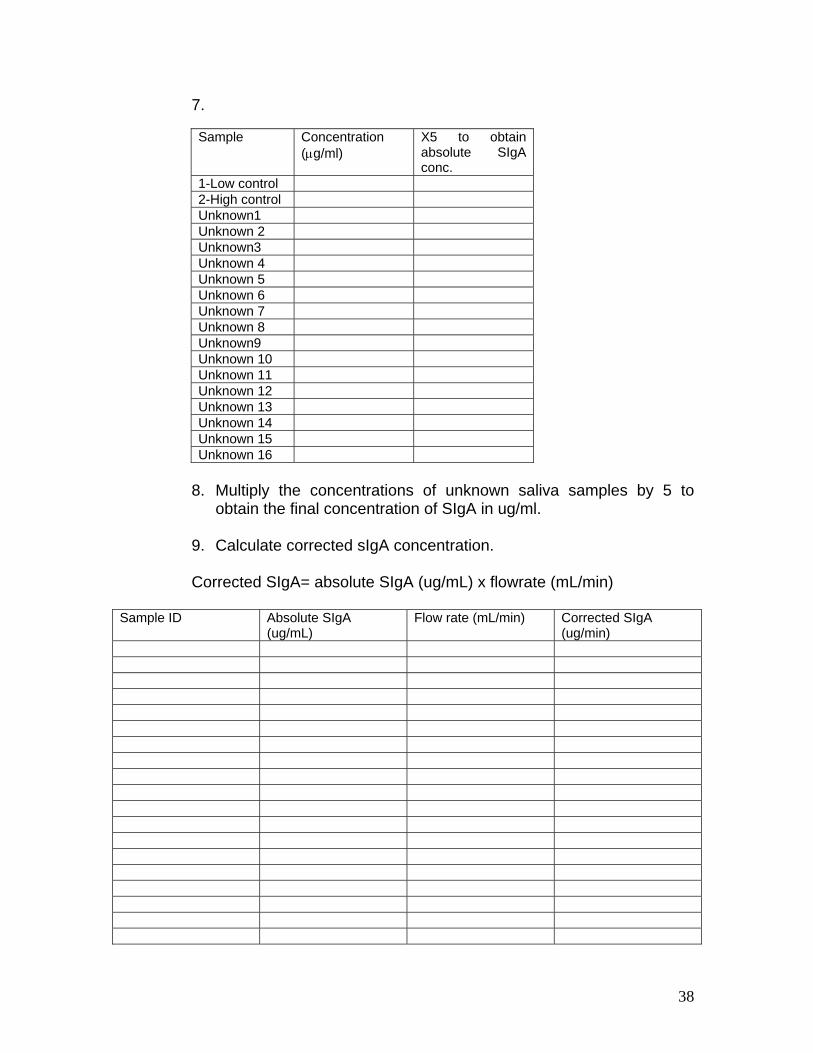
7.
8. Multiply the concentrations of unknown saliva samples by 5 to obtain the final concentration of SIgA in ug/ml.
9. Calculate corrected sIgA concentration. Corrected SIgA= absolute SIgA (ug/mL) x flowrate (mL/min)
Sample ID Absolute SIgA
(ug/mL) Flow rate (mL/min) Corrected SIgA
(ug/min)
Sample Concentration (g/ml)
X5 to obtain absolute SIgA conc.
1-Low control 2-High control Unknown1 Unknown 2 Unknown3 Unknown 4 Unknown 5 Unknown 6 Unknown 7 Unknown 8 Unknown9 Unknown 10 Unknown 11 Unknown 12 Unknown 13 Unknown 14 Unknown 15 Unknown 16
39
10. What is your group’s corrected sIgA concentration? Is it different from the absolute concentration obtained in step 6 above?
11. What factor led to the difference between the two sIgA concentrations?
12. Describe the difference between the standard curve from the simple dilution experiment and the standard curve from salivary IgA ELISA.
13. Are there significant differences between the groups in IgA concentration?