enzyme kinetics ii mbi 527 2013 - university of...
TRANSCRIPT

1
Kunze MEDCH 527 Enzyme Kinetics II
Mechanism-Based Inhibition of P450 Enzymes (2013)
Definition: A mechanism-based enzyme inactivator is a relatively unreactive compound that is converted by an enzyme into a species which, without prior release from the active site binds, covalently to the enzyme rendering it inactive.
Characteristic of MBI and P450 enzymes (criteria to establish an MBI) 1. Enzyme activity falls with time in the presence of the MBI. 2. Rate of inactivation (λ or kobs) is first order with time and a hyperbolic function of MBI concentration, or at least saturable. 3. The inclusion of a normal substrate for the enzyme reduces the rate of inactivation by competing with the MBI for the active site of the enzyme. 4. Inactivation is irreversible (common test: dialysis does not return enzyme activity). 5. A 1:1 stoichiometry of enzyme and adduct (radiolabeled substrates are useful here). 6. A catalytic step is required (O2 and NADPH dependent in the case of P450’s). 7. Inactivation must occur prior to the release of the activated species from the active site. Addition of trapping agents for electrophilic species, such as glutathione, should not attenuate the rate of inactivation. Note that this does not mean that reactive intermediates are not also released to solution. Often they are released and can be trapped with nucleophiles such as glutathione. Various compounds and enzymes that deactivate reaction oxygen species produced by the cycle or that prevent their propagation are also used (deferroxamine, catalase, superoxide dismutase).
FeO
NH
O
CHCl2OH
HOO2N
Choramphenicol
NH
O
ROH
ClCl
NH
O
RO
ClH2N
Arg,P450
NH
O
RO
NH
O
RO
OHN
Arg,P450
H
Inactive acylated enzymeInactive Product
Acyl-chloride
H2O

2
Examples of Mechanism Based Inhibitors of P450 Enzymes
N C S
Phenethylisothocyanate (PEITC)
OH
HOEthinyl estradiol
NH
F
O
O
O
Paroxetine
Cl
ClNH
COOH
Dioclofenac
O
O
H5C2
H3C
C H3
C H3
O
OC H3
HO
H3CO
OH HO N(CH3)2
C H3
OHOCH3H3C
C H3
6
Erythromycin
N
COEtEtOCC H3O O
H
N
N N
N
OH3C
O
H
C H3
O Furafylline
OOOCH3
O
8-Methoxypsoralen
DDCN
C H3
C H3Deprenyl
C CH
H
H
H
C C HH
NH
O
CHCl2OH
HOO2N
Choramphenicol
N
N
OHH
O
O
Secobarbital
Processing of certain types of structural features (eg: acetylene, olefin, alkylamine) in these substrates by P450 enzymes often causes mechanism based inactivation due to the creation of reactive intermediates.

3
Targets for covalent adduction by reactive intermediates are the heme prosthetic group and/or active site amino acids. As we will see later some inactivators produce more than one type of adduct with a single enzyme and it appears that bioactivation may produce more than one type of reactive intermediate.
FeN N
NN
I
I
FeN N
NN
FeN N
NNO
I
FeN N
NNI
MI complexes to heme ironProtein Alkylation
Heme Alkylation
Characterizing enzyme adducts. 1. Heme pyrrole nitrogen alkylation is usually detected by determining if the amount of P450, measured as the ferrous CO complex, is decreased by treatment with the MBI. The alkylated hemes can be removed from the protein and characterized by mass spectrometry and NMR.

4
2. Protein alkylation can be detected in two ways.
• Using radiolabeled MBI and detecting covalently adducts, preferably after separation on gels. • HPLC purification of adducted protein and MW analysis to the intact protein or peptide fragments
produced by proteolysis using mass spectrometry.

5
3. MI complexes have distinct spectral properties and are conveniently measured directly as they are formed in time using a UV-VIS spectrophotometer by difference spectroscopy (λmax at 456 nm).
• MBI’s must be activated, usually by reaction with perferryl oxygen. Thus MBI’s are substrates for the enzyme (hence the old name suicide substrate) and side products of the reaction are often observed. These may or may not be related to the reactive intermediate
I + E [EI] E-I
E + I-OH
KI kinact
kp
[E=O I]
e,O2,e
A portion of the catalytic events produce product(s) (I-OH above) that are released to the medium. The products observed often provide clues as to the nature of the reactive intermediate.
Partition Ratios The ratio of kp/kinact (products other than dead enzyme I-OH above) /(dead enzyme) is called the partition ratio. Partition ratios can vary from less than 1 to 5000 and more
Enzyme adducts exhibit a range of stabilities. Most protein and heme adducts are reasonably stable however some of the adducts may be cleaved under more stringent chemical environments. As we will see later on heme iron adducts such as MI complexes (nitroso-heme iron complexes) are quite stable yet they can be oxidized. This treatment restores enzyme activity. Thus we have to consider that some adduct types are pseudo-irreversible.
E + I [EI] E-I* E + IOHKI kinact koff
-0.006
-0.004
-0.002
0
0.002
0.004
0.006
0.008
0.01
0.012
420 430 440 450 460 470 480 490 500
Wavelength (nm)
Abs
orba
nce
-0.001
0
0.001
0.002
0.003
0.004
0.005
0.006
0.007
0.008
0.009
420 430 440 450 460 470 480 490 500
Wavelength (nm)
Abs
orba
nce

6
Some Examples of What We Know about Mechanism Activation of olefins such as secobarbital, ethylene, octene usually leads to adducts with P450 heme pyrrole nitrogens. Occasionally covalent binding with active site amino acids is observed:
C CH
H
H
H
N
N
OHH
O
O
Secobarbital
C CH
H
H
R
Terminal Olefins
NH2
O
AIA
C CH
H
H
F
• Transfer of oxygen from the heme iron of P450s to terminal olefin pi bonds produces intermediates that react with the pyrrole nitrogens of heme (N-alkylated heme) at the terminal carbon.
• Epoxides are not involved in the inactivation process with respect to heme alkylation. Partition
ratios tend to be high (>100) so heme alkylation is usually a low probability event.
• Epoxides are likely be involved in protein alkylation reactions In the case of secobarbital protein alkylation also occurs presumably due reaction of the epoxide with an active site amino acid. Generally heme alkylation appears to be the major event. Partition ratio? 8.
N
N O
O
O
2B1 hemealkylation
proteinalkylation(I-helix)
epoxide
1 1 16

7
Acetylenes:
OH
HOEthinyl estradiol
N
C H3
C H3Deprenyl
C C HH R C C H
Terminal Acetylenes
Acetylene
Transfer of oxygen from the iron of P450 to acetylenic triple bond is asymmetric leading to reactive intermediates that can form covalent bonds with heme pyrrole nitrogens or nucleophilic active site amino acids.
• Oxygen attack at the terminal carbon produces ketene intermediates that:
• Alkylate amino acid of the P450 protein.
• React with water in the active site or medium to form the carboxylic acid via hydrolysis. • Heme N-alkylation seems to be the result of oxygen attack on the internal acetylenic carbon.
Here we see that slight changes in actetylene structure can affect the dominant alkylation event.
CCH
CCH
2B1
2B1
ProteinAdductAcid
HemeAdductAcid
(I-Helix)+
+
FeO
N N
R C C H
FeN N
RO a b
a bC C O
H
R
:Nu-CYP
C C Nu:CYPR
HH O
H2O
R C H2 COOHN-alkylated hemedead enzyme
Acylated Proteindead enzyme

8
Heteroaromatics and Aromatics Five membered heteroaromatic compounds thiophenes and furans can be activated to reactive intermediates that form adducts with protein. Very often adducts to other proteins in solution are also observed indicating that reactive intermediates are released. The non-specific binding can be suppressed by the addition of nucleophiles such as glutathione. Enzyme inactivation rates are generally not significantly reduced. This turns out to a critical distinction when one is trying to make the argument that inactivation is occurring in the active site of the enzyme.
8-methoxypsoralen
O O OOCH3
Tienilic Acid
S
O
HOOC
O ClCl S
O
HOOC
O ClCl
O
O
HOOC
O ClClS
O
O OOCH3
O
O
Nu:
Nu:
adduct
or?
Cl
ClNH
COOH
Dioclofenac
epoxide?
Quinone Methides (Raloxifene: Chem Res Tox 20 1778-86 (2007).

9
10
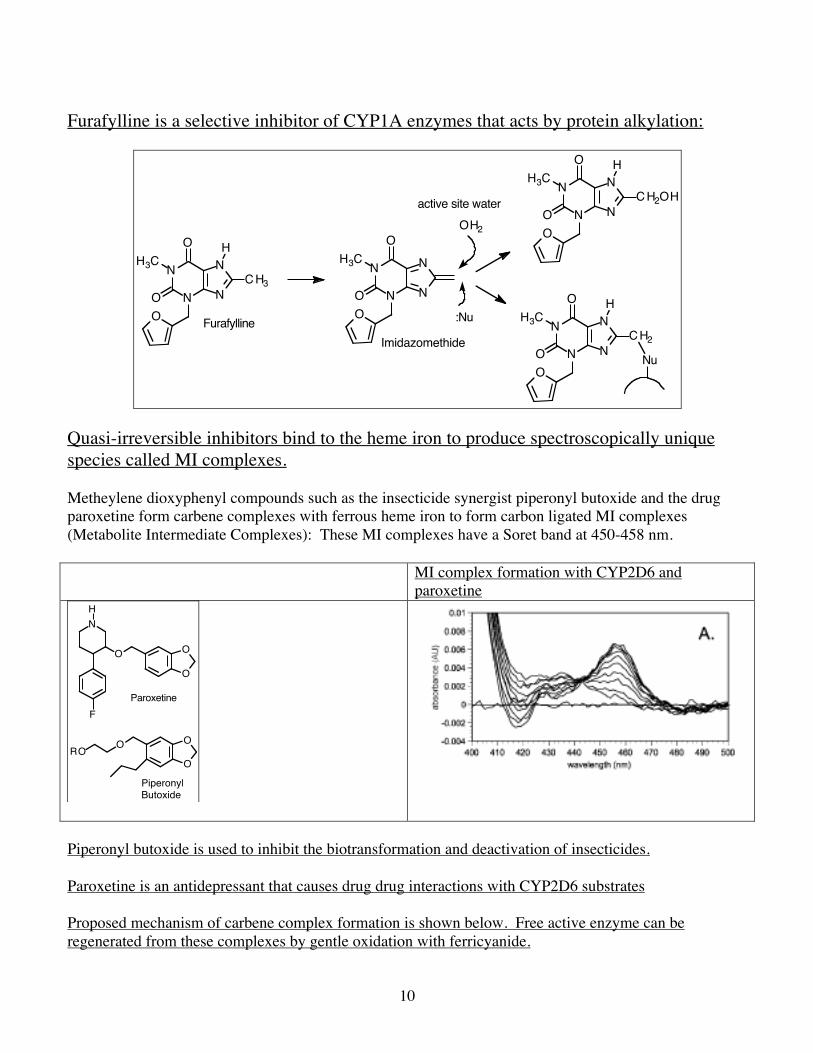
Furafylline is a selective inhibitor of CYP1A enzymes that acts by protein alkylation:
N
N
OH3C
OO
N
N
Imidazomethide
OH2
:Nu
N
N N
N
OH3C
O
H
C H3
O Furafylline
N
N N
N
OH3C
O
H
C H2OH
O
N
N N
N
OH3C
O
H
C H2
ONu
active site water
Quasi-irreversible inhibitors bind to the heme iron to produce spectroscopically unique species called MI complexes. Metheylene dioxyphenyl compounds such as the insecticide synergist piperonyl butoxide and the drug paroxetine form carbene complexes with ferrous heme iron to form carbon ligated MI complexes (Metabolite Intermediate Complexes): These MI complexes have a Soret band at 450-458 nm. MI complex formation with CYP2D6 and
paroxetine
Piperonyl butoxide is used to inhibit the biotransformation and deactivation of insecticides. Paroxetine is an antidepressant that causes drug drug interactions with CYP2D6 substrates Proposed mechanism of carbene complex formation is shown below. Free active enzyme can be regenerated from these complexes by gentle oxidation with ferricyanide.
NH
F
O
O
O
Paroxetine
O
O
ORO
PiperonylButoxide

11
Alkylamines are also processed to MI complexes. The Soret band for these nitroso-ligated hemes also occurs at 455 nm. In man, the CYP3A enzymes are particularly susceptible to formation of MI complexes.
O
O
H5C2H3C
CH3
CH3O
OCH3
HO
H3CO
OH HO N(CH3)2
CH3
OHOCH3H3C
CH3
6
Erythromycin
N-dealkN-dealkR N
R2
R1R N
H
R1R NH2
F3C ON
CH3
H
Fluoxetine
N
NCH3CH3
Imipramine
• A number of drugs in use and NCE’s in combinatorial libraries contain this functionality. As we
know alkyl amines are metabolized to simpler amines via N-dealkylation reactions. Often the half-lives of the metabolites are longer than the parent drugs in vivo.
• Many alkyl amines are processed to stable, catalytically inactive MI complexes.

12
• A classic example is troleandomycin (TAO) that forms an MI complex with CYP3A enzymes in humans and animals.
• Here we note that four oxidations are required to produce the nitroso species that forms the stable MI complex with the ferrous heme of P450. Somewhat surprisingly these complexes can form rather rapidly in microsomes despite the requirement for multiple reactions.
• NADPH and oxygen dependent formation of MI complexes can be observed spectroscopically as a
450-458 nm species in microsomes. MI complexes are reasonably stable. They have been observed in microsomes prepared from animals and liver biopsy specimens from humans treated with TAO and other alkyl amines such as erythromycin, diltiazem, fluoxetine, desipramine, nortryptilline, amphetamine.
Multiple pathways and intermediates have been suggested to be involved in MI complex formation.

13
Characterizing Mechanism-Based Inhibition by the Numbers (Kinetics) Method I Measuring the rate of loss of enzyme activity by determining the amount of active enzyme remaining as a function of time and MBI concentration. • Experimental designs focus on determining the rate of loss of enzyme activity caused by the MBI.
Because MBI must be catalytically activated by the enzyme itself we must use two types of incubations.
• Inactivation incubations that exposes the enzyme to different concentrations of the MBI for various periods of time.
• Activity assays in separate tubes with normal substrates for the enzyme to determine remaining activity.
-NADPH [I]=10
+NADPH [I]=0
+NADPH [I]=10
Preincubation orInactivation Assay(transfer aliquots atvarious times t toactivity assays)
Activity Assay (S→P)containing [S]>>K m and NADPH. Incubate for fixed time after enzyme from inactivation assay is added.
P450
t=0 min t=5 min t=15 min
P450
t=0 min t=5 min t=15 min
P450
t=0 min t=5 min t=15 min
diluteinhibitor
P450
t=0 min t=5 min t=15 min
+NADPH [I]=100
time dimension
[ I ] dimension
Features of the experimental design: Dilute inhibitor into activity assays to prevent any further time dependent inhibition Control for NADPH dependent loss of enzyme activity in the absence of inhibitor Further evidence such as the demonstration of covalent binding to the enzyme is required bu not always obtained.

14
Plots Typically, particularly at the early time points loss of enzyme activity is first order with time. Thus we plot log or ln percent remaining activity as a function of time and calculate the slopes of the lines to obtain values of λ or kobs at each inhibitor concentration.
(S)-Zileuton Parameters for CYP1A2 inactivation using phenacetin in the activity assay: KI= 98 µM; kinact .037 min-1. Enzyme t1/2 is 20 min at saturating concentrations of (S)-Zileuton. Reciprocal plots of λ or kobs vs 1/I produce linear plots from which KI and kinact can be determined from X and Y intercepts (above inset). Method 2: For alkylamine and methylenedioxyphenyl MBI’s we can measure the appearance of inactivated enzyme directly in a spectrophotometer. For instance we can look at the formation of an MI complex formed upon incubation of the macrolide antiobiotic clarithormycin with CYP3A4.

15
Below we see plots for the appearance of MI complex and loss of enzyme activity of with time of exposure of active enzyme to clarithromycin. By either method we can calculate rates of inactivation λ at a given concentration of inhibitor.
• A direct plot of λ as a function of inhibitor concentration is hyperbolic. The maximum rate for
enzyme inactivation at saturating concentrations of the MBI is given as kinact
• The concentration of inhibitor required to produce an inactivation rate (λ) that is one-half that of kinact is the KI. The KI is approximates the reversible affinity of the MBI for the enzyme.
• Units of kinact and λ are reciprocal time min-1, hr-1 etc and enzyme half-life is given as 0.693/λ. • Values of kinact and KI are constants for a given enzyme with a MBI.
kinact
KI [I]
λ
λ [I] = kdeg.[I] =kinact ⋅[ I ][ I ]+ KI
16
A little bit about the kinetics of inactivation helps us get a handle on in vivo relevance and potential problems detecting the phenomenon in vitro: How do we know when inactivation that we might observe is significant? To do this we need to know the concentration of inhibitor available to the enzyme in the liver or other target organ and the endogenous rate of turnover of the P450 enzyme pool of interest (kdeg below).
λ
CYP-I
kdegksyn AminoAcidsCYP
AminoAcids
Enzyme SynthesisNormalEnzyme Degradation
first order rate constantfor enzyme inactivationdue to mech. based inhibitor
Steady State Levelsof Enzyme in Liver
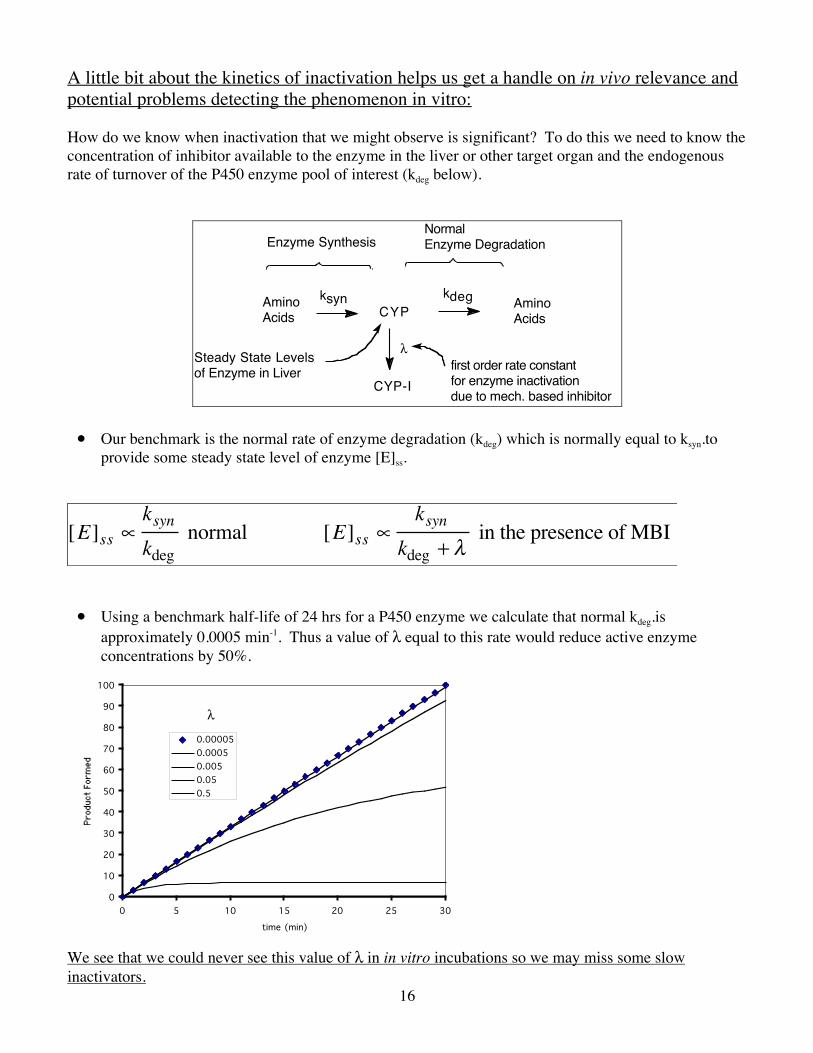
• Our benchmark is the normal rate of enzyme degradation (kdeg) which is normally equal to ksyn.to provide some steady state level of enzyme [E]ss.
[E]ss ∝ksynkdeg
normal [E]ss ∝ksyn
kdeg + λ in the presence of MBI
• Using a benchmark half-life of 24 hrs for a P450 enzyme we calculate that normal kdeg.is approximately 0.0005 min-1. Thus a value of λ equal to this rate would reduce active enzyme concentrations by 50%.
0
10
20
30
40
50
60
70
80
90
100
0 5 10 15 20 25 30time (min)
0.000050.00050.0050.050.5
λ
We see that we could never see this value of λ in in vitro incubations so we may miss some slow inactivators.

17
• Heightened likelihood of drug-drug interactions where pool of active CYP in the liver is irreversibly
depleted.
AminoAcids CYP Amino
Acids
ksyn kdeg
CYP-I
λ
What concentration of the CYP 1A2 inactivator furafylline (KI= 25 µM; kinact = 0.9 min-1) would produce a value of λ equal to .0005 min-1?
I = KI ÷kinactλ
−1⎛ ⎝ ⎜
⎞ ⎠ ⎟ = 25µM ÷
0.90.0005
−1⎛ ⎝ ⎜
⎞ ⎠ ⎟ = 0. 014µM
• Given a peak concentration of furafylline in plasma of 6 µM following a single 100 mg dose and its measured half-life of 50 hr in vivo we can calculate that as much as 15 days would be required before CYP1A2 content would return to 50% of control values!
• Since λ varies with inhibitor concentration, inhibitors with values of kinact greater than 0.0005 min-1
are all suspect. Many inhibitors will not be a problem since λwill be far lower than kinact at physiologically relevant concentrations of the inhibitor.
• A second factor that is important is mass balance. The amount of inhibitor dosed may simply be far
too low to reduce the amount of enzyme contained in the body significantly. The acetylenic contraceptive steroids such as ethinylestradiol falls into this category. An exception to this may be RU486 although no drug interactions have been reported as yet.
(CH3)2N
C C C H3HO
O
KI = 5 µM kinact = 0.089 min -1Mefipristone (RU-486) and CYP3A4
He et al JPET 288 791-797 (1999)
Prediction of In Vivo Effect for Compounds that form MI complexes. Mayhew et al DMD 28 1031-1037 (2000)

18
Demonstrate formation of MI complexes with expressed CYP3A4+(B5) for diltiazem, N-desmethyl diltiazem (MA), fluoxetine and clarythromycin and measure KI and kinact.
Dilute and measure CYP3A activity
Measure accumulation of MI complexI +HLM + NADPH
Inactivation Assay
Vary time and [I]
KI
kinact
Predict the fall in active CYP3A enzyme concentrations when these inhibitors are present at their normal in vivo concentrations. In the case of clarithomycin active enzyme concentrations are predicted to fall to 40% of control.
Clarithromycin: KI= 5.5 µM; kinact = .072 min-1: [I]p in plasma 0.1 µM.
�
AUCAUC'
= Cl'intClint
= [E]'ss[E]ss
=kdeg
kdeg +[I]p ⋅ kinact[I]p + KI
=kdeg
kdeg + λ

19
Major issues for time dependent inactivation (TDI) of P450 enzymes by MBI. 1. Accurate determination of inactivation rate constants (KI and kinact). Not trivial to do well particularly for slow inactivators. How accurate do we have to be? 2. Rapid screening techniques (establishing criteria for acceptance
or rejection of an N. C. E.). Venkatakrishnan et al Xenobiotica 37 1225-1256 (2007)

20
3. Is hepatocyte work necessary? (Transporters, induction vs inhibition, phase II enzymes). Zhao et al DMD 33 853-61 (2005); McGinnity DMD 34 1291-1300 (2006)

21
4. In order to predict the magnitude of the inhibition we have to take into account the fraction of the object drug that is cleared by the inhibited enzyme (fmCYP). This equation used
A λ/kdeg value of 1 based on in vitro data predicts a two fold increase in AUC of the parent drug. Note that the fm of the object drug is not taken into account so the predicted value is an overestimate.
Short Communication
Risk Assessment of Mechanism-Based Inactivationin Drug-Drug Interactions
Received May 6, 2012; accepted June 8, 2012
ABSTRACT:
Drug-drug interactions (DDIs) that occur via mechanism-basedinactivation of cytochrome P450 are of serious concern. Althoughseveral predictive models have been published, early risk assess-ment of MBIs is still challenging. For reversible inhibitors, the DDIrisk categorization using [I]/Ki ([I], the inhibitor concentration; Ki,the inhibition constant) is widely used in drug discovery and de-velopment. Although a simple and reliable methodology such as[I]/Ki categorization for reversible inhibitors would be useful formechanism-based inhibitors (MBIs), comprehensive analysis of ananalogous measure reflecting in vitro potency for inactivation hasnot been reported. The aim of this study was to evaluate whetherthe term !/kdeg (!, first-order inactivation rate at a given MBI
concentration; kdeg, enzyme degradation rate constant) would beuseful in the prediction of the in vivo DDI risk of MBIs. Twenty-oneMBIs with both in vivo area under the curve (AUC) change of markersubstrates and in vitro inactivation parameters were identified in theliterature and analyzed. The results of this analysis show that in vivoDDIs with >2-fold change of object drug AUC can be identified withthe cutoff value of !/kdeg " 1, where unbound steady-state Cmax isused for inhibitor concentration. However, the use of total Cmax led togreat overprediction of DDI risk. The risk assessment using !/kdeg
coupled with unbound Cmax can be useful for the DDI risk evaluationof MBIs in drug discovery and development.
Introduction
Inhibitory drug-drug interactions (DDIs) are of serious concernin drug development because they can lead to restricted use orwithdrawal of drugs from the market (Huang and Lesko, 2004;Wienkers and Heath, 2005). The clinical relevance of mechanism-based inactivators (MBIs) is illustrated by the fact that 24 (19%) ofthe identified 129 cytochrome P450 (P450) inhibitors on the U.S.market and 38% of the known strong inhibitors are MBIs of P450enzymes (Isoherranen et al., 2009). Eight (33%) of the 24 MBIscaused strong interactions in vivo. The Pharmaceutical Researchand Manufacturers of America (PhRMA) recently summarized theindustry practices used in inactivation measurements and recom-mended practical methods for in vitro inactivation assays and forprediction of in vivo DDIs using in vitro data (Grimm et al., 2009).However, as described in the article, although several mathemat-ical models for MBI predictions have been presented, quantitativeprediction of in vivo DDIs is still challenging. For reversibleinhibitors, the DDI risk categorization using [I]/Ki ([I], the inhib-itor concentration; Ki, the inhibition constant) is widely used andaccepted in drug discovery and development. For irreversibleinhibitors, the U.S. Food and Drug Administration (FDA) draftguidance for industry of drug interactions studies (released inFebruary 2012; http://www.fda.gov/downloads/Drugs/Guidance-
ComplianceRegulatoryInformation/Guidances/UCM292362.pdf)recommends calculating an R-value equal to {kinact ! [I]/(KI " [I]) "kdeg}/kdeg to assess the in vivo DDI risk of MBIs. In this equation,[I] is the inactivator concentration calculated from the total (freeand bound) systemic inhibitor concentration, kinact is the maximalinactivation rate, KI is the inactivator concentration when the rateof inactivation reaches half of kinact, and kdeg is the rate constant forenzyme degradation in vivo. If this R-value is #1.1 (or 11 forCYP3A inhibition in the gut), the investigational drug is consid-ered to be a possible P450 inhibitor in vivo and further evaluationis necessary. How well this R-value reflects the magnitude of invivo DDI risk and whether false positives and false negatives arecommon has not been reported.
A recent review showed that 13 (42%) of 31 in vitro MBIs wereneither moderate nor potent inhibitors in vivo (VandenBrink andIsoherranen, 2010). This suggests that drugs classified as in vitroMBIs do not always cause clinically significant DDIs. In anotherreport of subset of MBIs, relatively accurate predictions of in vivoDDIs were reported (Fahmi et al., 2009). The published methodsfor quantitative prediction of in vivo DDIs for MBIs are shown ineqs. 1 and 2:
predictedAUCi
AUC!
CLint
CLint,i!
1
! fmCYP
1 " " $I% # kinact
kdeg # &$I% " KI'#$ " &1 $ fmCYP'
(1)
This work was supported in part by the National Institutes of Health NationalInstitute of General Medical Sciences [Grant P01-GM32165].
Article, publication date, and citation information can be found athttp://dmd.aspetjournals.org.
http://dx.doi.org/10.1124/dmd.112.046649.
ABBREVIATIONS: DDI, drug-drug interaction; MBI, mechanism-based inactivator; P450, cytochrome P450; FDA, U.S. Food and Drug Admin-istration; AUC, area under the curve; CLint, intrinsic clearance; fm, the fraction of total clearance of the drug to which the affected P450 enzymecontributes.
1521-009X/12/4009-1653–1657$25.00DRUG METABOLISM AND DISPOSITION Vol. 40, No. 9Copyright © 2012 by The American Society for Pharmacology and Experimental Therapeutics 46649/3788776DMD 40:1653–1657, 2012
1653
at Univ of W
ashington on February 8, 2013dm
d.aspetjournals.orgD
ownloaded from
the utility of this method. This evaluation methodology is simpleand could be used in drug discovery and development for riskassessment of MBIs without accounting for probe-specific valuessuch as fm and gut metabolism.
Departments of Pharmaceutics(Y.F., N.I.) and Medicinal Chemistry(K.L.K.), School of Pharmacy, University ofWashington, Seattle, Washington
YASUSHI FUJIOKA
KENT L. KUNZE
NINA ISOHERRANEN
Authorship Contributions
Participated in research design: Fujioka, Kunze, and Isoherranen.Performed data analysis: Fujioka, Kunze, and Isoherranen.
Wrote or contributed to the writing of the manuscript: Fujioka, Kunze, andIsoherranen.
References
Albers LJ, Reist C, Helmeste D, Vu R, and Tang SW (1996) Paroxetine shifts imipraminemetabolism. Psychiatry Res 59:189–196.
Alderman J, Preskorn SH, Greenblatt DJ, Harrison W, Penenberg D, Allison J, and Chung M(1997) Desipramine pharmacokinetics when coadministered with paroxetine or sertraline inextensive metabolizers. J Clin Psychopharmacol 17:284–291.
Atkinson A, Kenny JR, and Grime K (2005) Automated assessment of time-dependent inhibitionof human cytochrome P450 enzymes using liquid chromatography-tandem mass spectrometryanalysis. Drug Metab Dispos 33:1637–1647.
Backman JT, Karjalainen MJ, Neuvonen M, Laitila J, and Neuvonen PJ (2006) Rofecoxib is apotent inhibitor of cytochrome P450 1A2: studies with tizanidine and caffeine in healthysubjects. Br J Clin Pharmacol 62:345–357.
Backman JT, Olkkola KT, Aranko K, Himberg JJ, and Neuvonen PJ (1994) Dose of midazolamshould be reduced during diltiazem and verapamil treatments. Br J Clin Pharmacol 37:221–225.
TABLE 1
In vivo and in vitro data used for risk assessment
Inactivator P450 Inactivator Dose Object DrugAUC Change of
Object Drug(Observed)
KI kinact
!/kdegUsing Total
Cmax
!/kdeg UsingUnbound Cmax
Referencesa
"M min!1
Amiodarone 3A4 400 mg, q.d., 4 days Simvastatin acid 1.8 42 0.02 7.8* 0.3* Becquemont et al., 2007; Shoafet al., 2005; Mori et al.,2009
Amprenavir 3A4 1200 mg, b.i.d., 10 days Rifabutin 2.9 0.3 0.73 3268 2876 Polk et al., 2001; Ernest et al.,2005
Cimetidine 2D6 300 mg, q.i.d., 6 days Imipramine 2.7 77 0.03 15 12 Wells et al., 1986; Kosoglou etal., 2000; Madeira et al.,2004
Clarithromycin 3A4 500 mg, b.i.d., 9 days Simvastatin 10 5.5 0.07 133 36 Jacobson, 2004; van Haarst etal., 1998; Mayhew et al.,2000
Clopidogrel 2B6 75 mg, b.i.d., 4 days Bupropion 1.4 1.4 1.9 78 4.7 Turpeinen et al., 2005; Kim etal., 2008; Walsky andObach, 2007
Dasatinib 3A4 100 mg, single Simvastatin 1.2 6.3 0.03 5.8 0.4 Product Labelb; Li et al., 2009Diltiazem 3A4 60 mg, t.i.d., 2 days Buspirone 5.3 3.7 0.07 37.6 11 Lamberg et al., 1998; Shum et
al., 1996; Zhang et al., 2009Erythromycin 3A4 500 mg, t.i.d., 2 days Simvastatin 6.2 11 0.05 57.0 12 Kantola et al., 1998; Olkkola et
al., 1993; McConn et al.,2004
Fluoxetine 3A4 20 mg, q.d., 21days Alprazolam 1.3 5.3 0.02 3.8 0.2 Hall et al., 2003; Harvey andPreskorn, 2001; Mayhew etal., 2000
Isoniazid 3A4 90 mg, b.i.d., 4days Triazolam 1.5 228 0.08 9.7* 9.7* Ochs et al., 1983; Dattani etal., 2004; Wen et al., 2002
Mibefradil 3A4 100 mg, single Midazolam 8.9 2.3 0.40 553 4.0 Veronese et al., 2003; Welkeret al., 1998
Nelfinavir 3A4 1250 mg, b.i.d., 14days Simvastatin 6.1 0.48 0.22 952 77 Hsyu et al., 2001; Fang et al.,2008; Ernest et al., 2005
Paroxetine 2D6 20 mg, q.d., 17days Atomoxetine 7.1 3.6 0.13 25 1.3 Belle et al., 2002; Perloff et al.,2009
Ritonavir 3A4 600 mg, single Saquinavir 112 0.038 0.29 1315 913 Hsu et al., 1998; Luo et al.,2003
Rofecoxib 1A2 25 mg, q.d., 4 days Tizanidine 12 4.8 0.07 44 6.7 Backman et al., 2006;Karjalainen et al., 2006
Saquinavir 3A4 1200 mg, t.i.d., 5 days Midazolam 5.2 0.2 0.31 1223 102 Palkama et al., 1999; Cook etal., 2004; Ernest et al., 2005
Tadalafil 3A4 20 mg, q.d., 14 days Lovastatin 1.12 12 0.21 76* 4.9* Ring et al., 2005; Wrishko etal., 2008
Ticlopidine 2B6 250 mg, b.i.d., 4 days Bupropion 1.6 0.3 0.43 1067* 174* Turpeinen et al., 2005; Lu etal., 2006; Walsky andObach, 2007
Ticlopidine 2C19 200 mg, q.d., 8 days Omeprazole 6.2 9.2 0.25 108 2.7 Ieiri et al., 2005; Lu et al.,2006; Atkinson et al., 2005
Tienilic acid 2C9 250 mg, q.d., 19 days (S)-Warfarin 2.9 12.5 0.13 846 30 O’Reilly, 1982; Dubb et al.,1979; Hutzler et al., 2009
Verapamil 3A4 80 mg, t.i.d., 2 days Simvastatin 4.7 4.6 0.43 195 21 Kantola et al., 1998; Johnson etal., 2001; Wang et al., 2004
Zileuton 1A2 800 mg, b.i.d., 5 days Theophylline 1.9 117 0.04 16 1.2 Granneman et al., 1995; Lu etal., 2003
* The inactivator concentration was calculated with dose normalization.a References for in vivo AUC change, in vivo inactivator concentration (in cases where Cmax was not measured in the DDI study), and in vitro MBI parameters.b http://www.accessdata.fda.gov/drugsatfda_docs/label/2011/021986s009s010lbl.pdf.
1656 FUJIOKA ET AL.
at Univ of W
ashington on February 8, 2013dm
d.aspetjournals.orgD
ownloaded from
predictedAUCi
AUC ! 1 "!!I" # kinact
!I" " KI"
kdeg! 1 " !$"/kdeg (2)
where AUCi/AUC is the fold increase in probe AUC, CLint/CLint,i isthe fold decrease in probe CLint, and $ is the apparent first-orderinactivation rate at a given inhibitor concentration (Mayhew et al.,2000; Grimm et al., 2009). Equation 2 assumes that the probe isentirely cleared by a single, inhibited pathway (fm # 1) in the liver,and it is mathematically equal to the R-value used in the FDA draftguidance for predicting inactivation risk for systemic clearance. Equa-tion 2 can also be written as AUCi/AUC # 1 $ $/kdeg, which issimilar to the AUCi/AUC # 1 $ [I]/Ki used in risk assessment ofreversible inhibitors. The aim of this study was to determine whether the$/kdeg value obtained from in vitro data could be reliably used to identifyDDI risk of in vitro MBIs. The correlation between the magnitude of invivo DDI and the predicted $/kdeg was determined for known in vitroMBIs and the false-positive and false-negative rates were evaluated.
Materials and Methods
Data Collection. The University of Washington Metabolism and TransportDrug Interaction Database (http://www.druginteractioninfo.org) was queried toidentify known P450 mechanism-based inactivators with KI and kinact valuesdetermined using human liver microsomes or recombinant systems, and toretrieve all reported in vivo interactions for the mechanism-based inactivatorsextracted. From the resulting list of in vivo interaction studies, those conductedwith a known marker substrate (FDA Draft Guidance for Industry, 2012) wereselected, and the change in object AUC was recorded. The inhibitor concen-trations measured in the interaction study were used if available. For studiesthat did not measure the plasma concentrations of the inhibitor, literature datausing the same dosing regimen were used to obtain steady-state Cmax values forthe inactivator. If data for the inactivator were not available at the dose levelused in the in vivo interaction studies, the concentrations were dose-normal-ized to obtain predicted Cmax values for the inactivator. The plasma or serumprotein binding data for the inactivators were also collected from the literature.If multiple KI and kinact values for the inactivator were available, the value usedfor analysis was chosen according to the following criteria: 1) the KI and kinact
were tested using the same probe as that used in the in vivo DDI study, and 2)the study with the lowest microsomal protein concentration was used.
Assessment of the Evaluation Methodology to Predict In Vivo DDIRisk. The steady-state inactivator concentrations and in vitro kinact, KI, and kdeg
values were used to compute the $/kdeg values. Both total and unbound Cmax atsteady state were used for inactivator concentrations because total Cmax is used inthe [I]/Ki risk assessment for reversible inhibitors, whereas use of the unboundsystemic Cmax rather than total systemic Cmax or estimated unbound portal Cmax
yielded the most accurate DDI predictions for MBIs in a previous study (Obach etal., 2007). The reported turnover half-life (t1/2) of 36 to 51 h for CYP1A2, 32 h forCYP2B6, 104 h for CYP2C9, 26 h for CYP2C19, 70 h for CYP2D6, and 26 to79 h for CYP3A4 were used to calculate kdeg (1/min) values (Yang et al., 2008).The median values were used for CYP1A2 and CYP3A4. Based on the $/kdeg fromeq. (2), the likelihood that a drug will cause in vivo interactions was classified aslikely ($/kdeg % 1), possible (1 % $/kdeg % 0.1), or remote (0.1 % $/kdeg), thencompared with actual AUC change of object drug.
Results and Discussion
Twenty-one inactivators with complete in vivo and in vitro data wereidentified, and the $/kdeg values were calculated. Because several inhib-itors had multiple DDI studies, a total of 160 in vivo studies wereanalyzed. Figure 1 shows the correlation between predicted risk ($/kdeg)and the in vivo AUC change for all DDI studies analyzed. The analysisusing unbound inhibitor concentrations and all reported in vivo DDIstudies is shown in Fig. 1, A and B. The relationship between greatestobserved in vivo DDI (the maximal in vivo DDI risk) with a giveninhibitor and the predicted $/kdeg with accepted P450 marker probes isshown in Fig. 1, C and D. The in vivo studies and in vitro parameters used
are summarized in Table 1. The DDIs with %2-fold AUC change ofobject drugs could be identified using a $/kdeg cutoff value of 1 andunbound inactivator Cmax (Fig. 1, C and D). The use of total Cmax in the$/kdeg calculation resulted in exaggerated risk prediction and an increasein the number of false positives (Fig. 1E). These results suggest thatunbound Cmax rather than total Cmax would be appropriate for DDI riskassessment with MBIs.
This analysis shows the effect of probe sensitivity in observed DDIrisk. When all 160 in vivo studies were included, 58 (36%) werecategorized into the zone between AUC change &2-fold and $/kdeg %1. This demonstrates an overprediction of the in vivo risk with manysubstrates. Some inactivators distributed between the different zonesfrom low to high DDI risk mainly due to different probes used andvariable probe sensitivity (Fig. 1B). This is not unexpected, because itis known that the fm of object drugs as well as the Fg of CYP3A4substrates are important factors that affect the magnitude of in vivoDDIs. For example, for diltiazem, a 1.5- and 3.8-fold increase in AUCof quinidine (fmCYP3A4 # 0.76) and midazolam (fmCYP3A4 # 0.94)(Brown et al., 2005), respectively, were observed, despite the fact thatdosing regimens in both studies were similar (Backman et al., 1994;Laganiere et al., 1996). For paroxetine, a 1.7- and 5.2-fold increase in AUCof imipramine (fmCYP2D6 # 0.46) and desipramine (fmCYP2D6 # 0.88)(Brown et al., 2005), respectively, were observed (Albers et al., 1996;Alderman et al., 1997). This demonstrates that simple risk analysisdoes not take into account the effect of multiple clearance pathways,genetic polymorphisms, and polytherapy on the magnitude of theDDIs observed in individual patients.
When the in vivo data were analyzed for individual MBIs usingonly the largest observed in vivo interactions (Fig. 1, C and D), theportion of data points falling in the zone between AUC change&2-fold and $/kdeg % 1 was decreased [5 of 21 (24%)] but stillshowed a significant false-positive rate. Using the R-value of 1.1,which is equivalent to a $/kdeg cutoff of %0.1, the false-positive ratewas 38%, demonstrating a significant overprediction of DDI risk evenwhen unbound Cmax was used. The false positives included the twoCYP2B6 MBIs, clopidogrel and ticlopidine. The overprediction withthese two MBIs is likely due to low fm of the probe bupropion byCYP2B6 and the contribution of alternative elimination pathways(reduction to threohydrobupropion and erythrohydrobupropion) (Fau-cette et al., 2000; Reese et al., 2008). Hence, clopidogrel and ticlopi-dine are expected to cause more potent DDIs with a higher fmCYP2B6
substrate. Indeed, ticlopidine was a weaker MBI for CYP2C19 thanCYP2B6 in vitro, but in vivo a 6-fold increase in the AUC ofomeprazole (CYP2C19 probe) was observed. Zileuton, which had a$/kdeg value %1, suggesting a significant DDI risk in vivo, resulted ina weak interaction in vivo (1.92-fold increase in AUC of theophyl-line). In addition to CYP1A2, theophylline is also cleared byCYP3A4, CYP2E1, and renal clearance, suggesting that use of ahigher fm probe such as caffeine would result in a correct riskcategorization. The fact that tadalafil induces CYP3A in vitro (Ring etal., 2005), and most likely in vivo, is a likely reason for overpredictionof CYP3A4 inhibition in vivo. The reasons for the overprediction ofCYP3A4 DDI risk by amiodarone and fluoxetine are unknown.
In conclusion, the results show that the use of $/kdeg with unboundsteady-state Cmax can be useful for identifying high DDI risk com-pounds, but this method is not applicable for accurate quantitativeprediction. The presented approach does not account for probe fm byinhibited pathway, gut extraction of the probe, possible simultaneousinduction, and competitive inhibition by the inhibitor. Therefore, it isless accurate for predicting DDI magnitude than other existing staticmethods (Fahmi et al., 2009) or physiologically based modeling.However, the presented method is expected to provide the highest risk
1654 FUJIOKA ET AL.
at Univ of W
ashington on February 8, 2013dm
d.aspetjournals.orgD
ownloaded from

22
General References:
1. Richard Silverman Mechanism-Based Enzyme Inactivation: Chemistry and Enzymology Volume 1; Chap 1 CRC Press (1988) The classic discourse on MBI kinetics, not P450 based reasonable math approach.
2. Ortiz de Montellano, P Cytochrome P450: Structure Mechanism and Biochemistry 3rd Edition
(Chap 7) (2005). Mechanisms for the biochem types 3. Mahew et al Drug Metabolism and Disposition 28: 1031 (2000). Classical paper on predicting
in vivo effect from in vitro rate constants. 4. Fontana et al Current Drug Metabolism 6 413-454 (2005) The biggest compilation of structures
enzymes and the like. Some mistakes. Tons of references. 5. Zhou et al Clinical Pharmacokinetics 44 279-304 (2005); Therapeutic Drug Monitoring 29
687-710 (2007) Couple of review articles focused on CYP3A enzymes. Reasonable presentation of complexities, lots of nice tables.
6. Galetin et al DMD 34 166-175 (2006). Good paper from B. Houstons lab. Looks at effects of
protein binding, gut metabolism and imputed MBI concentrations on magnitude of interactions. 7. Brown et al Clinical Pharmacokinetics 45 1035-1050 (2006) Another global paper from J.
Houstons lab. 8. Yang et al European J of Pharm Sciences 31 232-241 (2007) Simcyp folks weigh in on
experimental design including IC50 shift studies. Worth a look. 9. Venkatakrishnan et al Xenobiotica 37 1225-1256 (2007) Input on the issue from Obach.
Starts slow with reversible inhibition but Good transistion to MBI and discussion.