envs,geol,phys. 112: global climate ocean and atmosphere variations
Post on 22-Dec-2015
220 views
TRANSCRIPT

Envs,Geol,Phys. 112: Global Climate
Envs,Geol,Phys. 112: Global Climate
Ocean and Atmosphere Variations
Ocean and Atmosphere Variations
Ocean & Atmosphere VariationsOcean & Atmosphere Variations Pacific Ocean
ENSO – El Niño Southern Oscillation PDO – Pacific Decadal Oscillation
Atlantic Ocean NAO – North Atlantic Oscillation AMO – Atlantic Multidecadal Oscillation Atlantic Oscillation Thermohaline Circulation
Pacific Ocean ENSO – El Niño Southern Oscillation PDO – Pacific Decadal Oscillation
Atlantic Ocean NAO – North Atlantic Oscillation AMO – Atlantic Multidecadal Oscillation Atlantic Oscillation Thermohaline Circulation

Variations in the AtmosphereVariations in the Atmosphere Atmospheric Oscillations
El Niño Southern Oscillation (ENSO) (Wed.) Trade winds slacken, warm water sloshes east Rain in Peru, Drought in Oceania, Varies
elsewhere
Pacific Decadal Oscillation (PDO) Latitude of warm pool varies Deflects positions of Jet Streams (storm tracks)
Atmospheric Oscillations El Niño Southern Oscillation (ENSO) (Wed.)
Trade winds slacken, warm water sloshes east Rain in Peru, Drought in Oceania, Varies
elsewhere
Pacific Decadal Oscillation (PDO) Latitude of warm pool varies Deflects positions of Jet Streams (storm tracks)

Regional Current VariationsRegional Current Variations PDO – Pacific Decadal Oscillation
Currently in Positive phase (since April 2001) Fisheries in northeast pacific very productive
PDO – Pacific Decadal Oscillation Currently in Positive phase (since April 2001)
Fisheries in northeast pacific very productive
http://topex-www.jpl.nasa.gov/gallery/videos.html

Variations in the AtmosphereVariations in the Atmosphere Atmospheric Oscillations
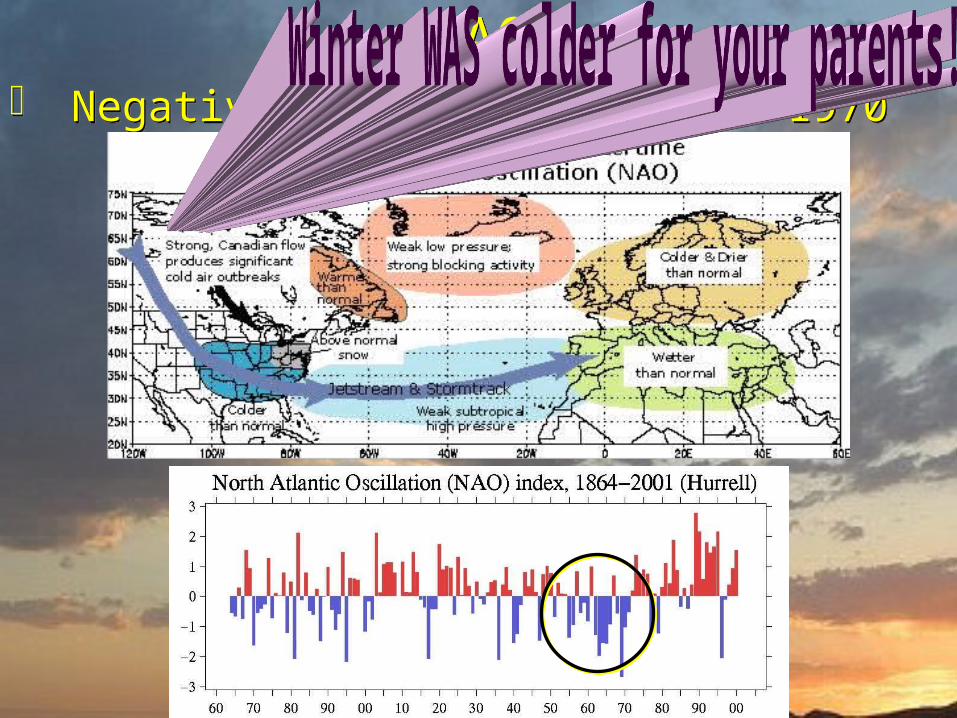
Northern Atlantic Oscillation Strength of westerlies between 40°N and 60°N Driven by Azores/Iceland pressure difference
Positive larger difference Recent positive phase unprecedented in last 500
years Negative smaller difference
Atmospheric Oscillations Northern Atlantic Oscillation
Strength of westerlies between 40°N and 60°N Driven by Azores/Iceland pressure difference
Positive larger difference Recent positive phase unprecedented in last 500
years Negative smaller difference
Positive Positive Negative Negative

Variations in the Atmosphere
Variations in the Atmosphere
NAO Known since 19th Century Positive
strong Gulf Stream warm winter & spring in
Scandinavia & E. US cool along east coast of
Canada & west Greenland
Negative – dry in E. N.Am, wet in S. Europe
NAO Known since 19th Century Positive
strong Gulf Stream warm winter & spring in
Scandinavia & E. US cool along east coast of
Canada & west Greenland
Negative – dry in E. N.Am, wet in S. Europe
Positive: Strong westerlies
Positive: Strong westerlies
Negative: Weak westerlies
Negative: Weak westerlies
CoolCool
Warm
Warm

NAONAO
www.jisao.washington.edu
Mostly positive since mid 1970’s
Mostly positive since mid 1970’s
Mostly negative in ’40’s – ‘60’s
Mostly negative in ’40’s – ‘60’s

Variations in the AtmosphereVariations in the Atmosphere Atmosphere/Ocean Connections
Atlantic Multidecadal Oscillation Greenland icecores show oscillations
80 & 180 year variations in N. Atlantic temperature
Driven by NAO? Positive NAO
strong westerlies across Labrador sea cool ocean strengthens Gulf Stream & Thermohaline Circulation (THC)
Negative NAO weak westerlies across Labrador sea keep ocean warmer
weakens Gulf Stream & THC
Atmosphere/Ocean Connections Atlantic Multidecadal Oscillation
Greenland icecores show oscillations 80 & 180 year variations in N. Atlantic temperature
Driven by NAO? Positive NAO
strong westerlies across Labrador sea cool ocean strengthens Gulf Stream & Thermohaline Circulation (THC)
Negative NAO weak westerlies across Labrador sea keep ocean warmer
weakens Gulf Stream & THC
NAONAO Negative Phase mid 1950’s - 1970 Negative Phase mid 1950’s - 1970

NAONAO Mostly positive since mid-70’s Mostly positive since mid-70’s

Ocean VariationsOcean Variations Atlantic Multidecadal Oscillation
Sea Surface Temperature in North Atlantic
Atlantic Multidecadal Oscillation Sea Surface Temperature in North Atlantic

Atlantic Multidecadal Oscillation Correlates with numbers of major hurricanes
… and southwestern droughts!
Atlantic Multidecadal Oscillation Correlates with numbers of major hurricanes
… and southwestern droughts!
Ocean VariationsOcean Variations
Not perfect correlation …
what else is going on?
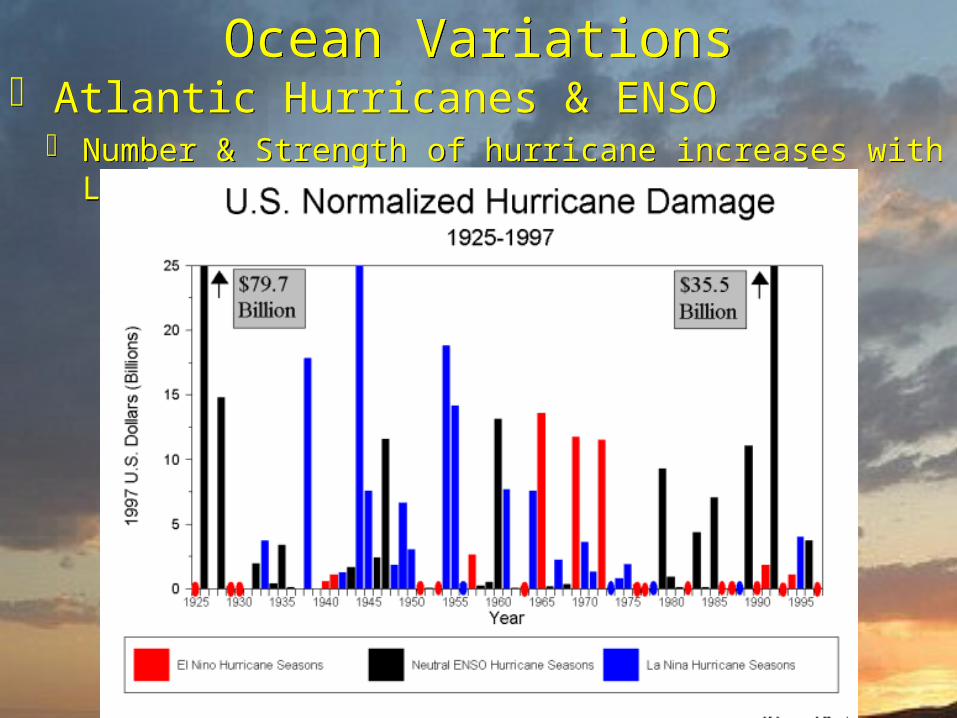
Atlantic Hurricanes & ENSO Number & Strength of hurricane increases with La Niña
Atlantic Hurricanes & ENSO Number & Strength of hurricane increases with La Niña
Ocean VariationsOcean Variations

Variations in the AtmosphereVariations in the Atmosphere Atlantic Oscillation
Relation to NAO? Varies over days
Mostly in positive mode recently
Atlantic Oscillation Relation to NAO? Varies over days
Mostly in positive mode recently
Positive: Strong circumarctic winds trap
cold air near pole
Positive: Strong circumarctic winds trap
cold air near pole
Negative: Weak winds allow polar air to move
south
Negative: Weak winds allow polar air to move
south

THC: Thermohaline CirculationTHC: Thermohaline Circulation Great Conveyor
Belt moving HEAT circuit ~ 2000 years
Great Conveyor Belt moving HEAT circuit ~ 2000 years

Climatic EventsClimatic Events Volcanoes
Put ash (SO2) high in atmosphere
Comet/Meteor Impacts Cause fires & tsunamis Put dust & ash high in atmosphere
Volcanoes Put ash (SO2) high in atmosphere
Comet/Meteor Impacts Cause fires & tsunamis Put dust & ash high in atmosphere

Climatic EventsClimatic Events Volcanoes
Mt. Tambora, 4/5/1815 erupted after 5000 years of dormancy resulted in “year without a summer” in US
Volcanoes Mt. Tambora, 4/5/1815
erupted after 5000 years of dormancy resulted in “year without a summer” in US
In New England the summer of 1816 included … widespread frost at low level sites around New England on the 8-9th July and the damaging frosts on the 22nd August from interior New England right the way south into North Carolina (Ludlum 1989). … This all led to
crop failures and food shortages and helped stimulate a move westwards the following year. In both
Connecticut and parts of New York State frosts after April are rare, but in 1816 frosts were recorded every
month of the year (Lamb 1816, Neil Davids).
In New England the summer of 1816 included … widespread frost at low level sites around New England on the 8-9th July and the damaging frosts on the 22nd August from interior New England right the way south into North Carolina (Ludlum 1989). … This all led to
crop failures and food shortages and helped stimulate a move westwards the following year. In both
Connecticut and parts of New York State frosts after April are rare, but in 1816 frosts were recorded every
month of the year (Lamb 1816, Neil Davids).http://www.dandantheweatherman.com/Bereklauw/
yearnosummer.html

Climatic EventsClimatic Events Mt. Pinatubo, 6/15/1991
10 times bigger than Mt. St. Helens
Mt. Pinatubo, 6/15/1991 10 times bigger than Mt. St. Helens
In 1992 and 1993, the average temperature in the Northern Hemisphere was reduced 0.5 to 0.6°C and
the entire planet was cooled 0.4 to 0.5°C. The maximum reduction in global temperature occurred
in August 1992 with a reduction of 0.73°C. The eruption is believed to have influenced such events as 1993 floods along the Mississippi river and the drought in the Sahel region of Africa. The United
States experienced its third coldest and third wettest summer in 77 years during 1992.

Climatic EventsClimatic Events Lots of Volcanoes
Indonesia
Lots of Volcanoes Indonesia
Krakatau may have
split Sumatra from Java
Krakatau may have
split Sumatra from Java

Climatic EventsClimatic Events Lots of Volcanoes
Aleutian Islands
Lots of Volcanoes Aleutian Islands
Novarupta had largest eruption in 20th Century on
June 6, 1912
Novarupta had largest eruption in 20th Century on
June 6, 1912Novarupta ash 1912Novarupta ash 1912
Redoubt ash 1990Redoubt ash 1990
Spurr ash 1992
Spurr ash 1992
Augustine ash 1976
Augustine ash 1976
http://www.avo.alaska.edu/

Climatic EventsClimatic Events Ring of Fire … Pacific Rim Ring of Fire … Pacific Rim

Climatic EventsClimatic Events
http://www.volcano.si.edu/
reports/usgs/

Variations in the AtmosphereVariations in the Atmosphere
Insolation Variations Solar brightness variations
sunspots & other stellar variations
Earth orbital variations other planets’ gravity vary Earth’s orbit
Solar system environmental variation moves through galactic environment
Insolation Variations Solar brightness variations
sunspots & other stellar variations
Earth orbital variations other planets’ gravity vary Earth’s orbit
Solar system environmental variation moves through galactic environment

Spaceship EarthSpaceship Earth Galactic Environment
Solar system passes through nebulae
Galactic Environment Solar system passes
through nebulae
Sol crosses galactic plane every 33 Myr
Sol crosses galactic plane every 33 Myr
Galactic year ~ 225 million years (Sol is 22)
Galactic year ~ 225 million years (Sol is 22)
Spaceship EarthSpaceship Earth Sun is a variable star
Solar constant ≈ 1370 W/m2 … varies stars evolve, luminosity varies early sun ~ 25% -30% dimmer than today
Sunspot Cycle 11 year number cycle 22 year polarity cycle Earth gets more energy from sun when sunspot
numbers are high.
Sally Baliunas blames Sol for all climate change
Sun is a variable star Solar constant ≈ 1370 W/m2 … varies
stars evolve, luminosity varies early sun ~ 25% -30% dimmer than today
Sunspot Cycle 11 year number cycle 22 year polarity cycle Earth gets more energy from sun when sunspot
numbers are high.
Sally Baliunas blames Sol for all climate change
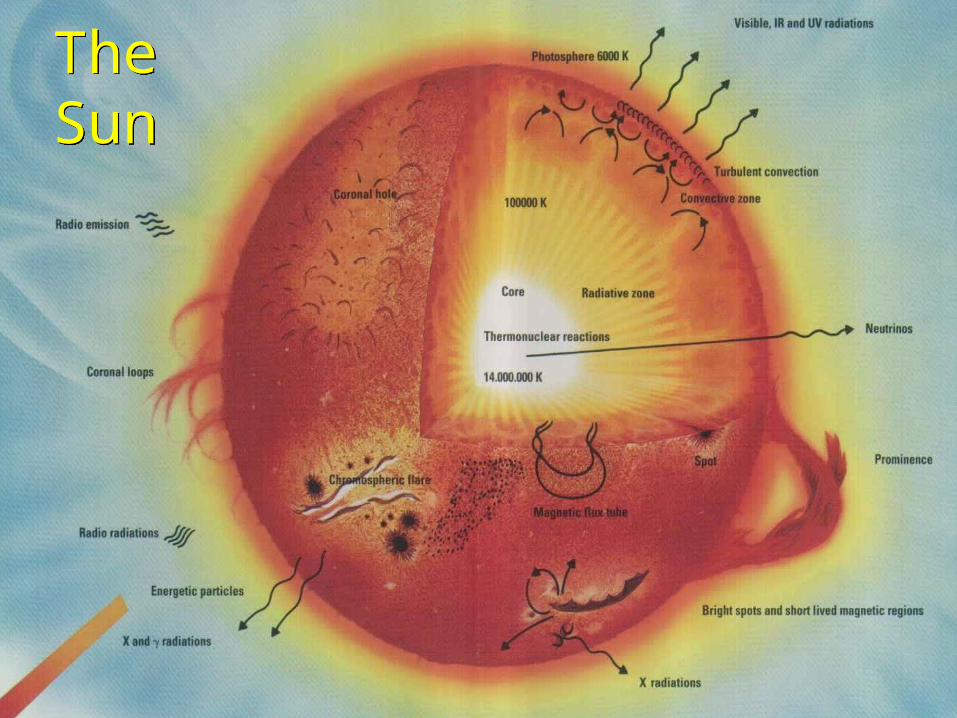
The SunThe Sun

SunspotsSunspots Magnetic
Hernias Sun’s
equator rotates faster than poles
Magnetic Field wraps up, bulges up
Magnetic Hernias Sun’s
equator rotates faster than poles
Magnetic Field wraps up, bulges up

Sol 04/09/04
SunspotsSunspots Observed since 1611 (Johann Fabricius) Discovered
by Johann Fabricius
Observed by Galileo
Observed since 1611 (Johann Fabricius) Discovered
by Johann Fabricius
Observed by Galileo
Sol 04/05/10
www.spaceweather.gov

SunspotsSunspots Number observed since 1611 Number observed since 1611
Regular 11-year cycleRegular 11-year cycle
Maunder MinimumMaunder Minimum

Associated with Little Ice Age Began due to solar cooling Continued due to ice albedo effect
Associated with Little Ice Age Began due to solar cooling Continued due to ice albedo effect
Maunder MinimumMaunder Minimum