environmental subsidies and - european commission
TRANSCRIPT

Guidelines
2015 edition
Environmental subsidies and similar transfers
Exer in vulla faci blamconse euis nibh el utat dip ex elestisim
Rilis augiati siscilit venis nim
Manuals and guidelines
ISSN 1681-4789
2013 editio
n
ISSN 2315-0815


Guidelines
2015 edition
Environmental subsidies andsimilar transfers
Manuals and guidelines
2015 edition

Europe Direct is a service to help you find answers to your questions about the European Union.
Freephone number (*):
00 800 6 7 8 9 10 11 (*) The information given is free, as are most calls (though some operators, phone boxes or hotels
may charge you). More information on the European Union is available on the Internet (http://europa.eu). Luxembourg: Publications Office of the European Union, 2015 ISBN 978-92-79-48269-4 ISSN 2315-0815 doi: 10.2785/907129 Cat. No KS-GQ-15-005-EN-N Theme 8: Environment and energy Collection: Manuals and guidelines © European Union, 2015 Reproduction is authorised provided the source is acknowledged.

Environmental subsidies and similar transfers 3
Preface
Preface To solve environmental problems, profound changes to existing production and consumption patterns are needed. Incentive-based tools, also called market-based instruments can be used by policy makers in a cost effective way to produce appropriate environmental behaviour across all economic sectors. Therefore, economic instruments for pollution control and natural resource management are an increasingly important part of environmental policy tools in the European Union (EU) and there is considerable interest in obtaining more detailed information about their use and effectiveness. These economic instruments include environmental subsidies, taxes, fees, pollution charges, deposit-refund systems, tradable emissions permits, etc.
Governments continuously intervene in the economy through support measures specifically designed for environmental protection and/or to safeguard natural resources e.g. support for investments aimed at pollution treatment and prevention.
These measures are in practice implemented through a large set of policy instruments: subsidies, investments grants, accelerated depreciation mechanisms, loan guarantees, tax exemptions, tax credits, price support for producers and consumers, preferential market access mechanisms, selective exceptions from governmental standards, etc.
Different international (and national) organisations such as the Organisation for Economic Co-operation and Development (OECD), the Statistical Office of the European Union (Eurostat), European Commission Directorate General for Environment, Food and Agriculture Organisation (FAO), World Trade Organisation (WTO) as well as researchers have tried to make some order in this panoply of measures, focusing on a definition of ‘support measure’ which could facilitate the production of consistent (with other statistics) and comparable (among countries) data on both measures for protecting the environment and measures which are potentially damaging the environment.
These guidelines focus on the development of statistics on environmental subsidies and similar transfers which can be readily or easily available from the national accounts.
These guidelines provide a step-by-step procedure for compiling data on environmental subsidies and similar transfers. Its purpose is to facilitate the production of harmonised data and to enable rigorous cross-country comparison of data. Full implementation of the recommendations in these guidelines should help to ensure that data are compiled on a consistent basis in all Member States of the European Statistical System (ESS).
Due to its clear focus on the practical implementation, these guidelines complement international references such as the United Nations System of Environmental-Economic Accounting (SEEA CF 2012(1)). For national compilers the guidelines may serve as a practical compilation guide for statistics on environmental subsidies as well as for the environmental transfers accounted for in the environmental protection expenditure account. Interested data users may also benefit from this publication as a source of background information and clarification.
Anton Steurer
Head of Unit E2
Environmental statistics and accounts; sustainable development
(1) http://unstats.un.org/unsd/envaccounting/seeaRev/SEEA_CF_Final_en.pdf.

Environmental subsidies and similar transfers 4
Acknowledgements
Acknowledgements This document is the result of the work of the Task Force on environmental transfers. Special thanks are due to members of this Task Force and the Working Group on Environmental Expenditure Statistics, who have made this publication possible. Eurostat is particularly grateful to the following members of the Task Force for their valuable contributions to the methodological development process:
Federico Falcitelli, Angelica Tudini, Carolina Ardi, Cesare Costantino (Italy)
Cor Graveland, Sjoerd Schenau, Bram Edens (Netherland)
Danica Bizjak, Metka Pograjc, Matej Mlakar (Slovenia)
Donna Livesey, Matt Jones, James Evans (United Kingdom)
Flintull Annica Eriksson (Denmark)
Eila Saloma (Finland)
Panagiotis Vlachos (Greece)
Fréderic Nauroy, Samuel Balmand, Stéphane Levasseur, Olivier Diel (France)
Håkon Torfinn Karlsen, Kristine Kolshus, Sigrid Hendriks Moe (Norway)
Hanna Brolinson, Maja Cederlund, Nancy Steinbach, Viveka Palm, Sebastian Constantino (Sweden)
Irina Piradashvili, Ursula Lauber, Sarah Kleine (Germany)
Isabel Quintela, Nuno Sérgio Baross (Portugal)
Jeffrey Fritzsche (Canada)
Luís Martin Salvador, Maria Luisa Egido (Spain)
Sacha Baud (Austria)
Anton Steurer and Gerald Weber were responsible for managing this project at Eurostat level. Important contributions were provided by Marina Anda Georgescu (Eurostat), Maria-Jose Lopez and Marco Orsini (ICEDD, Belgium), Gérard Gié (In Numeri, France).

Environmental subsidies and similar transfers 5
Table of contents
Table of contents Preface ................................................................................................................................................. 3
Acknowledgements ............................................................................................................................ 4
Table of contents ................................................................................................................................ 5
Introduction ......................................................................................................................................... 6
Scope and structure of the guidelines .............................................................................................. 9
1. Definitions, categories and links to other modules ............................................................ 10
1.1 Environmental subsidies and similar transfers .............................................................................. 11
1.1.1 Primary purpose operationalisation ................................................................................... 11
1.1.2 Subsidies and similar transfers in the SNA and ESA ........................................................ 13
1.2 Environmental tax abatements .................................................................................................... 15 1.3 Other environmental support measures........................................................................................ 18 1.4 Linkages to other modules of monetary environmental accounts ................................................. 20 1.5 Potentially environmentally damaging subsidies (PEDS) and environmentally harmful subsidies
(EHS) ............................................................................................................................................ 22
2. Classifications ......................................................................................................................... 25
2.1 Classification of environmental subsidies and similar transfers by current and capital transfers .. 25 2.2 Classification of environmental subsidies and similar transfers by environmental domain ........... 26 2.3 Classification of environmental subsidies and similar transfers by payers and beneficiaries........ 27
3. Framework for data collection ............................................................................................... 29
3.1 Basic approach ............................................................................................................................. 29 3.2 Data sources for environmental subsidies and similar transfers ................................................... 30
3.2.1 ESA transmission programme Table 11 ............................................................................ 30
3.2.2 Budget analysis ................................................................................................................. 32
3.3 Compilation methods for environmental subsidies and similar transfers ...................................... 38
4. Framework for reporting ........................................................................................................ 44
5. Use of environmental transfers data .................................................................................... 46
5.1 Demand of environmental subsidies statistics .............................................................................. 46 5.2 Use of data on environmental subsidies and similar transfers ...................................................... 47 5.3 Presenting subsidy data ............................................................................................................... 47
Annex: PEDS ..................................................................................................................................... 52

Environmental subsidies and similar transfers 6
Introduction
Introduction To solve environmental problems caused by current production and consumption patterns, profound changes are needed, some of which involving substantial economic costs and affecting labour and capital markets, as well as consumption behaviour.
Environmental policy aims at inducing such changes. Economic instruments for pollution control and natural resource management are an increasingly important part of environmental policy in EU and OECD countries. The range of economic instruments available includes subsidies and similar transfers, taxes, fees and charges, tradable permits, deposit-refund systems, tax abatements, etc. They provide flexible and cost-effective means for reaching environmental policy objectives. Such instruments are favoured by policy initiatives like the EU 7th Environment Action Program (EAP) (2) – ‘Living well, within the limits of our planet’ the renewed EU Sustainable Development Strategy (3) and the EU 2020 Strategy (4).
From the multitude of economic instruments available, subsidies and similar transfers, tax abatements, etc. are those which grant financial incentives to beneficiaries with the aim to influence their economic behaviour towards improved compatibility with public policy in the fields of environment, economic and social affairs. Such support measures can be beneficial or harmful for the environment.
On one hand, support measures taking the form of e.g. subsidies, investments grants, low or no-interest loans, preferential tax treatment, may constitute incentives for producers and consumers to change their behaviour and to help them complying with imposed environmental standards. These support measures granted for environmental purposes, are in these guidelines referred to as environmental.
However, subsidies and other forms of support measures may also distort prices, affect resource allocation decisions and change the amount of goods or services produced, distributed and consumed in an economy in a way which can be damaging to the environment. For example, subsidies on agricultural products can lead to overuse of pesticides and fertilisers in agriculture and to the overexploitation of the fish stock in fisheries. Fuel tax rebates, subsidies for road transport, and support measures lowering energy prices stimulate the consumption of fossil fuels and can lead to an increase in congestion and air pollution. These cases, where the support measures could have negative effects on the environment are referred to, in these guidelines, as potentially environmentally damaging subsidies (PEDS).
Existing data frameworks
Environmental subsidies and similar transfers are part of environmental accounts which are described in chapter 29 'Satellite accounts and other extensions' of the System of National Accounts (SNA 2008 (5)) and in the European System of Accounts (ESA 2010 (6)). Environmental accounts use the national accounts framework to reflect the impacts of using (or consuming) natural resources, the generation of residuals that pollute air, water, etc., and the specific activities undertaken to prevent or reduce the environmental impacts of human activity.
The United Nations System of Environmental-Economic Accounting (SEEA CF 2012(7)), which implements the provisions of the SNA, makes reference in its section 4.4 titled ‘Accounting for other transactions related to the environment’ to an environmental subsidy or similar transfer as being ‘a transfer that is intended to support activities which protect the environment or reduce the use and extraction of natural resources. It includes those transfers defined by the SNA as subsidies, social benefits to households, investment grants and other current and capital transfers’.
(2) http://ec.europa.eu/environment/newprg/intro.htm.
(3) COM (2009) 400 : http://eur-lex.europa.eu/LexUriServ/LexUriServ.do?uri=COM:2009:0400:FIN:en:PDF.
(4) http://ec.europa.eu/europe2020/index_en.htm.
(5) The latest version of the SNA is the SNA 2008 which has been prepared under the auspices of the Inter-Secretarial Working Group on National Accounts which consists of five organisations: the International Monetary Fund, the Organisation for Economic Cooperation and Development, the United Nations Statistics Division and regional commissions, the World Bank and Eurostat:http://unstats.un.org/unsd/nationalaccount/docs/SNA2008.pdf.
(6) The European equivalent to the SNA 2008 is the ESA 2010 (Regulation (EU) No 549/2013 of the European Parliament and the Council of 21 May 2013: http://eur-lex.europa.eu/LexUriServ/LexUriServ.do?uri=OJ:L:2013:174:0001:0727:EN:PDF).
(7) http://unstats.un.org/unsd/envaccounting/seeaRev/SEEA_CF_Final_en.pdf.

Environmental subsidies and similar transfers 7
Introduction
In Europe, the term ‘environmental subsidies’ has its roots in the European System for the Collection of Economic Data on the Environment (SERIEE, 1994 (8)) whose purpose is to set out the conceptual framework for a monetary description of environmental activities based on the recommendations of the SNA.
‘Environmental subsidies’ are seen in SERIEE (1994), together with environmental taxes, eco-industries, etc., as part of the 'intermediate systems' for the collection and treatment of basic data which are used to calculate environmental expenditure and its financing. Work on updating and integrating the various ‘intermediate systems’ and monetary accounts had been undertaken in Europe in Working Groups and Task Forces; the latest available document at the time of publication of this guidelines is the document ‘'ENV_EXP_WG_2015_1 Integrating the monetary environmental accounts’(9) (March 2015).
Environmental subsidies and similar transfers included in the environmental protection expenditure accounts (EPEA) encompass all types of transfers financing the production or the uses of environmental protection services, including transfers to or from other countries. Environmental transfers in the EPEA and in statistics on environmental subsidies and similar transfers are complementary and use in principle the same data sources from national accounts. EPEA is part of the Regulation (EU) No 691/2011 on European environmental economic accounts, while environmental subsidies and similar transfers are mentioned in article 4 (pilot studies) and article 10 (report and review) as future area for inclusion. Statistics on environmental subsidies and similar transfers include beside the ones accounted in the EPEA, also those transfers linked to the resource management activities (accounted in the resource management expenditure accounts)(10). Statistics on environmental subsidies and similar transfers provide more details than the EPEA as regards the types of transfers and beneficiary industries for both environmental protection and resource management.
The European Commission has been running surveys on state aid since 1997 (11). Although they are not focused exclusively on environmental transfers, they could be a source of information on support measures targeted at promoting environmental protection and natural resource management.
Some countries collect data on environmental subsidies and similar transfers. For example, Sweden has collected data for several years and definitions on what is to be regarded as an environmental transfer has been tested and discussed with data users (12). Denmark has also worked on environmental subsidies and similar transfers in their environmental accounts (13). Norway has conducted some studies (14) on environmentally motivated transfers within the framework of SEEA. In the Netherlands the statistical office has been working on subsidies and similar transfers (15) and plans to produce data also by industry receiving this subsidy. In Germany, the Federal Environmental Agency has been working on PEDS (16).
Legal acts
At European level, statistics related to environmental subsidies and similar transfers are governed by the legislations in the area of environmental accounts and national accounts.
Regulation (EU) No 691/2011 of the European Parliament and of the Council of 6 July 2011 as amended by Regulation (EU) No 538/2014 of the European Parliament and of the Council of 16 April 2014 on European environmental economic accounts provides a framework for the development of various modules of environmental accounts. Presently the Regulation includes the following modules: air emissions accounts, environmentally related taxes by economic activity, economy-wide material flow accounts, environmental protection expenditure accounts, environmental goods and services sector accounts and physical energy flow (8) http://epp.eurostat.ec.europa.eu/cache/ITY_OFFPUB/KS-BE-02-002/EN/KS-BE-02-002-EN.PDF.
(9) https://circabc.europa.eu/d/a/workspace/SpacesStore/52482f36-773d-4eb9-9f69-7c8095134a59/ENV_EXP_WG_2015_1%20Integrating%20the%20monetary%20environmental%20accounts.pdf
(10) The Resource Management Expenditure Account (ReMEA) is a satellite account to the national accounts (NA). ReMEA complements EPEA by describing in a way consistent with the national accounts the transactions related to natural resource management.
(11) http://ec.europa.eu/competition/state_aid/studies_reports/archive/scoreboard_arch.html.
(12) http://www.scb.se/en_/Finding-statistics/Statistics-by-subject-area/Environment/Environmental-accounts-and-sustainable-development/System-of-Environmental--and-Economic-Accounts-/.
(13) Time series 1997-2008 on environmental subsidies are available on their website - http://www.statbank.dk/mreg4t.
(14) http://www.ssb.no/en/nasjonalregnskap-og-konjunkturer/artikler-og-publikasjoner/environmentally-motivated-transfers-in-norway-2007.
(15) See ‘Green growth in the Netherlands, 2012’: http://www.cbs.nl/NR/rdonlyres/2C613080-F668-439C-B12C-98BF361B5ADF/0/2013p44pub.pdf.
(16) http://www.umweltbundesamt.de/publikationen/environmentally-harmful-subsidies-in-germany-0.

Environmental subsidies and similar transfers 8
Introduction
accounts. Data on environmental transfers are needed for the production or the uses of environmental protection services in the module on environmental protection expenditure accounts.
Regulation (EU) No 691/2011 makes reference in article 4 (pilot studies) and article 10 (report and review) to the development of new modules, and among other work areas, to environmentally related transfers (subsidies and similar transfers) as a future area for inclusion.
The delivery of national accounts data on current and capital transfers to Eurostat is regulated by the ESA 2010 national accounts transmission programme (ESA 2010 TP (17)). The transmission programme includes Table 8 — ‘Non financial accounts by sector’ and Table 11 — ‘General government expenditure by function’.
(17) Annex B of Regulation (EU) No 549/2013 of the European Parliament and the Council of 21 May 2013 on the European system of national and
regional accounts in the European Union.

Environmental subsidies and similar transfers 9
Scope and structure of the guidelines
Scope and structure of the guidelines These guidelines describe the concepts and methods for environmental subsidies and similar transfers statistics and propose a framework for data collection. The content of the guidelines will be updated as experience grows in coming years. The guidelines will facilitate the production of harmonised data to enable rigorous cross-country comparisons.
These guidelines are organised in five chapters.
Chapters 1 & 2 cover issues related to:
• definitions and categories of environmental subsidies and similar transfers and the relationship with national accounts and other monetary environmental accounts modules of the SEEA;
• classifications used in presenting data on environmental subsidies and similar transfers.
Chapters 3 to 5 address data compilation for environmental subsidies and similar transfers and regard issues related to:
• sources for data compilation;
• methods for identifying, compiling and classifying environmental subsidies and similar transfers;
• reporting tables;
• suggestions for the presentation and interpretation of the statistics.
The guidelines emphasise collecting data for environmental subsidies and similar transfers which can be readily or easily available from the national accounts. Tax abatements and other type of environmental support measures are described in the guidelines, but no data collection at EU level is envisaged in the short or medium term. Potentially environmentally damaging subsidies (PEDS) are not investigated in detail in these guidelines as no agreed definition nor methodology for data collection has been developed yet.
Due to its practical approach, these guidelines complement international standards such as the SEEA CF 2012. These guidelines also take into account the latest development of other modules of environmental economic accounting in Europe.
The guidelines may serve as a practical compilation guide for national compilers. Interested data users may also find this publication useful as source of background information and clarifications.
Data on environmental subsidies and similar transfers could be used for analyses of the economic impact of environmental policy — and in particular, they could provide a basis for cost/benefit analyses for new environmental policy proposals. Information on environmental subsidies and similar transfers could also help to review policies targeting the development of the market for environmental goods and services.

Environmental subsidies and similar transfers 10
Definitions, categories and links to other modules 1
1. Definitions, categories and links to other modules This chapter presents the definitions and categories used for environmental support measures. It also presents the links with other environmental accounts modules. The definitions of environmental subsidies and similar transfers are based on ESA 2010.
Defining support measures opens all kinds of controversies, many of which have been discussed in literature (18). The range of possible definitions is extensive. International organisations, such as the OECD, FAO and WTO tend to take their own view of subsidies based on their agendas. This makes studies performed by these organisations very difficult to compare (19).
Furthermore studies of environmental support measures differ in the definition of ‘environment’ they adopt. Their use of different definitions for environmental subsidies has resulted in not comparable data since they often include/exclude different kinds of measures based on the purpose of the study.
Regarding the potentially environmentally damaging subsidies (PEDS), which are often referred to also as environmentally harmful, these guidelines do not provide a specific method for data collection but describe the state of the art.
Two groups of support measures relevant for the environment
Two different groups of measures relevant for environmental policy-making can be identified: environmental support measures and PEDS (see figure 1 below).
Figure 1: Support measures relevant for the environment
The environmental support measures comprise:
— environmental subsidies and similar transfers;
— environmental tax abatements and
— other environmental support measures e.g. price support and/or regulatory support mechanisms, payments related to international climate change policies.
The second group of support measures relevant for environmental policy-making, i.e., the PEDS, are subsidies and similar transfers that support activities considered environmentally damaging.
Environmental subsidies and similar transfers and environmental tax abatements play a role in reducing the costs of production or use of environmental products. As they are restricted to national accounts transactions, environmental subsidies and similar transfers can be mapped through national accounts. Instead it is not always possible to map environmental tax abatements and other environmental support measures through national accounts; furthermore some of these measures never appear in budgetary documents although they can have budgetary implications, either through reduced revenues or by creating financial obligations for governments.
(18) See the discussions in for example OECD, Environmentally Harmful Subsidies, 2005 and IEEP, Study supporting the phasing out of environmentally
harmful subsidies, 2012.
(19) The Agreement on Subsidies and Countervailing Measures of the World Trade Organization (WTO) offers the only precise definition of subsidies which has (international) legal standing.
• Environmental subsidies and similar transfers• Environmental tax abatements• Other environmental support measures
Environmental support measures
Potentially environmentally damaging subsidies (PEDs)
e. g. reductions and exemptions related to environmental taxes, transfers going to certain activities or industries which are considered particularly polluting (energy, transport or agriculture)

Environmental subsidies and similar transfers 11
Definitions, categories and links to other modules 1 The statistical framework on environmental subsidies and similar transfers presented in these guidelines focuses on environmental subsidies and similar transfers as a first priority. This group covers support measures identifiable through national accounts, which makes the data collection less demanding and comparable results can be expected across countries. Furthermore these data are also needed and used in other modules of the environmental accounts. Second priority is given to environmental tax abatements since such measures are commonly used in many European countries as a replacement of subsidies. Tax abatements are considered as memorandum items in the statistics of environmental subsidies and similar transfers. All other support measures are given third priority since definitional problems and lack of suitable sources hinder the production of comparable data across European countries. For national purposes, countries could build estimates of such measures; however, the statistical framework does not include them at this stage.
1.1 Environmental subsidies and similar transfers The SEEA Central Framework defines an environmental subsidy or similar transfer as a:
‘current or capital transfer that is intended to support activities which protect the environment or reduce the use and extraction of natural resources’ (SEEA 2012, §4.138)
This definition covers environmental subsidies and similar transfers that are current or capital transfers according to the SNA 2008 (and its European version, the ESA 2010). Tax abatements and other environmental support measures described in section 1.3 are not covered in this definition. The focus is on flows from general government to the other sectors, plus transfers from (and to) the rest of the world (mainly from the institutions of European Union and in the framework of international cooperation). Environmental protection (EP) and resource management (RM) subsidies and similar transfers to compensate any loss of revenue due to EP and RM are also included.
Transfers from other sectors to the general government (fines, donations and legacies, etc.) are out of scope of these guidelines.
Environmental protection includes all activities and actions which have as their primary purpose the prevention, reduction and elimination of pollution as well as any other degradation of the environment. Resource management includes the preservation, maintenance and enhancement of the stock of natural resources and hence safeguarding against depletion.
Activities and actions having a favourable impact on the environment but which serve other goals do not fall under EP or RM.
This definition emphasises the purpose (intention) of a given subsidy or similar transfer for protecting the environment or reducing the use and extraction of natural resources. Experience over the years has shown that several interpretations of the concept of ‘environmental’ and of the determination of the intention may exist. It is useful for compilers to be aware of these interpretations which are described below.
1.1.1 Primary purpose operationalisation
Background
Several criteria exist to determine whether or not a specific activity or action is to be considered as environmental, depending on factors ranging from its primary purpose to its effect, as follows:
— primary purpose in a narrow sense (the real dominant intention or objective of actors);
— primary purpose based on legislation;
— primary purpose based on revealed intentions i.e., policy statements or declarations of respondents – there is a higher risk of bias and instability here;
— technical nature i.e., the objective nature of the activity irrespective of legislation or declarations;
— presumed effect i.e., assumed environmental consequences of an activity or action – this is used e.g. for environmental taxes;

Environmental subsidies and similar transfers 12
Definitions, categories and links to other modules 1 — real effect i.e., the objective proven consequences on the environment of an activity or action –
these are hard to measure.
SEEA CF 2012, §§4.139-4.144 explains that the primary purpose of the subsidy or similar transfer determines whether it is environmental or not: ‘From an analytical perspective, the primary focus is to determine how much expenditure is being allocated towards achieving environmental outcomes. Thus, a subsidy or similar transfer should be treated as environmental when the primary intent or purpose of the government is for resources to be used for either environmental protection or resource management purposes.’
Following the SEEA CF, ‘the determination of primary purpose should not be based on whether the use of the resources by the recipient of the transfer results in positive outcomes for the environment. While it is reasonable to consider that the purpose of the government in making the transfer and the purpose of the recipient are the same, it may not be the case that the expenditure of the transferred resources results in beneficial environmental outcomes even if this was the intent’. For example, investment grants for wind power stations or for bio-fuel production may help to reduce the exploitation of non-renewable fossil energy resources but may have negative side-effect on biodiversity.
Arguably the primary purpose criterion is not a very sound basis for classification. It involves a degree of subjectivity, risks of changing over time and it is not fully comparable across countries. However, the primary purpose has a useful function in protecting statistics from quickly changing policy interests which could result in pressure to include or exclude certain activities.
Practical compilation
In practice there are two ways to operationalise the (primary) purpose criterion to classify a particular subsidy or similar transfer as environmental:
— the legislator’s motive behind the subsidy or similar transfer as given by the title or description in the legislation;
— and the technical nature of the activity supported by a specific subsidy or similar transfer (i.e. if the supported activity is an EP or RM activity and the subsidy and similar transfer is specific to it).
Both should be used to base the decision as to whether a particular subsidy or similar transfer is environmental. The figure below illustrates how this decision is taken in practice:
Figure 2: The primary purpose operationalisation
Legislator’s environmental motive?
Yes No
Technical nature (specific for an environmental activity or product?)
Yes
Environmental subsidy and similar transfer (e.g. subsidies to municipalities for their CO2 emission reducing projects)
Environmental subsidy and similar transfer (e.g. subsidies for energy research)
No Environmental subsidy and similar transfer (e.g. subsidies for sustainable cities)
Not an environmental subsidy of similar transfer (e.g. nuclear energy subsidies)
This means that all subsidies and similar transfers which are granted for EP or RM purposes (e.g. transfers given explicitly for abating pollution) and all specific subsidies and similar transfers which support activities whose technical nature is to protect the environment or manage resources are in scope. General subsidies and similar transfers received by a producer unit are not environmental subsidies and similar transfers even if paid to a producer of EP and RM products (e.g. an employment subsidy received by a producer unit classified in NACE Rev. 2 group 38.2 waste treatment and disposal when this subsidy is not specific for this activity).

Environmental subsidies and similar transfers 13
Definitions, categories and links to other modules 1 In principle, it should be decided for each individual transfer whether its primary purpose is environmental or not. Afterwards the total value of the transfer is accounted for that primary purpose.
In practice, information on government transfers usually comes from budget and other government expenditure data. Generally, these sources do not show individual transactions and more commonly they only provide information by type of government programme, each one of them encompassing a large number of individual transfers. Usually such programmes have multiple (environmental and non-environmental) purposes and hence determining the number and value of individual transfers that have environmental protection or resource management as primary purpose may require additional information.
Such additional information is also needed when the primary purpose criterion is used to classify EP and RM activities by domains (see chapter 2.2). Subsidies and transfers may serve multiple environmental purposes (e.g. subsidies for the production of renewable energy can serve climate protection and the management of energy resources). Splitting multiple-purpose subsidies and transfers is not an easy task and can hinder the comparability of data across time and countries.
In these cases, it may be necessary to estimate the share of a given government programme that corresponds to the value of individual transfers having as their primary purpose environmental protection or resource management.
Chapters 3 to 5 of these guidelines detail sources and methods to identify environmental subsidies and similar transfers and give practical examples of how to use the primary purpose approach. Difficulties that could be encountered during the data compilation process and how to solve them are also presented in these chapters.
1.1.2 Subsidies and similar transfers in the SNA and ESA The international standards for national accounts are the world-level SNA and its European version the ESA. They provide accounting principles and a framework for the systematic and detailed description of a national economy, its components and the relations with other economies. ESA is the main European reference for defining subsidies and other transfers.
Subsidies and transfers as national accounts transactions
According to ESA, a transaction is an economic flow that is an interaction between institutional units by mutual agreement or an action within an institutional unit that it is useful to treat as a transaction.
ESA 2010 transactions (§ 1.66) can be of four main types: transactions in products, distributive transactions, financial transactions and other flows (e.g. acquisitions less disposals of non-produced non-financial assets). Environmental subsidies and similar transfers are distributive transactions.
Distributive transactions (20) describe how the value added generated by production activities is distributed to labour, capital and government and how redistribution of income or wealth and saving is made. Distributive transactions comprise transactions by which the income generated in production is distributed as compensation of employees, as taxes on production and imports, subsidies and other transfers, or as property income to different institutional sectors and the rest of the world.
Among distributive transactions, the category of transfers, in particular from the general government sector, is the focus of environmental subsidies and similar transfers statistics. A transfer can be defined as a transaction in which one institutional unit provides a good, service or asset to another unit without receiving from the latter any good, service or asset in return as a direct counterpart.
This definition covers a large number of transactions between the different institutional sectors of the economy, i.e., not only to corporations but also to households as well as other government units, the rest of the world (for example international organisations or foreign governments) and NPISHs.
National accounts distinguish two types of transfers, as follows (in brackets the national accounts codification):
(20) ESA (2010) § 4.01.

Environmental subsidies and similar transfers 14
Definitions, categories and links to other modules 1 — Current transfers directly affect the level of disposable income and are all transfers that are not
transfers of capital. They consist of subsidies (D3), social contributions and benefits (D6) and other current transfers (D7).
— Capital transfers (D9). They are transfers linked to the acquisition (or disposal) of fixed assets and they can be in cash or in kind. Capital transfers include investment grants (D92) and other capital transfers (D99).
Generic ways of representing subsidies and similar transfers in national accounts
The ESA framework provides two generic ways of representing the national economy (ESA 2010 § 1.06):
— the institutional sector accounts distinguishing corporations, government, households, non-profit organisations serving households (NPISHs) and the rest of the world;
— the input-output framework and the accounts by industries.
The sector accounts (by institutional sector) are a sequence of T-accounts reporting systematically the different stages of the economic process: production, generation of income, distribution of income, redistribution of income, use of income and financial and non-financial accumulation. Institutional units undertake a great number of economic actions which result in economic flows such as wages, subsidies, taxes, fixed capital formation, etc.
The input-output framework reports in detail the production and consumption activities by reporting the flows of goods and services by product group and industry: output, imports, exports, final consumption, intermediate consumption and capital formation. The framework comprises supply and use tables and symmetric input-output tables. An important feature of these tables is that the data are presented broken down by industries using the NACE classification.
Current transfers
Subsidies (D3) are defined in ESA (§ 4.30) as ‘current unrequited payments which general government or the institutions of the European Union make to resident producers’. The purpose of the subsidies can be manifold: influencing levels of production, product prices or the remuneration of the factors of production.
Subsidies are further classified into:
a) subsidies on products (D31), including import subsidies (D311) and other subsidies on products (D319) and
b) other subsidies on production (D39).
Subsidies on products (D31) are subsidies payable per unit of a good or service produced or imported.
Other subsidies on production (D39) consist of subsidies other than subsidies on products which resident producer units may receive as a consequence of engaging in production. It is important to highlight that D39 includes subsidies to reduce pollution i.e., to cover some or all of the costs of additional processing undertaken to reduce or eliminate the discharge of pollutants into the environment. ESA § 4.37 provides further examples of D39.
Only current transfers to producers are considered as subsidies in national accounts. Subsidies are not payable to final consumers, and current transfers that governments make directly to households as consumers fall under social benefits or other current transfers. Subsidies do not include grants that governments may award to producers in order to finance their capital formation, or compensate them for damage to their capital assets, which are treated as capital transfers.
Social contributions and benefits (D6) are defined in ESA (§ 4.83) as ‘transfers to households, in cash or in kind, intended to relieve them from the financial burden of a number of risks or needs, made through collectively organised schemes, or outside such schemes by government units and NPISHs; they include payments from general government to producers which individually benefit households and which are made in the context of social risks or needs.’
In particular, social contributions given for the need of housing (e.g. energy saving) could be relevant for the environment.

Environmental subsidies and similar transfers 15
Definitions, categories and links to other modules 1 Other current transfers (D7) are also current transfers, including for example current international cooperation (D74) which includes all transfers in cash or in kind between general government and governments or international organisations in the rest of the world, except capital transfers. Current transfers made directly by the institutions of the European Union to resident market producers are recorded as subsidies (D3) paid by the rest of the world.
Capital transfers
Capital transfers are different from current transfers in that they involve the acquisition or disposal of an asset, or assets, by at least one of the parties in the transaction.
Capital transfers (D9) are described in ESA (§ 4.145 and § 4.146) and can be in cash or in kind. A capital transfer in cash ‘consists of the transfer of cash that the first party has raised by disposing of an asset, or assets (other than inventories), or that the second party is expected, or required, to use for the acquisition of an asset, or assets (other than inventories). The second party, the recipient, is often obliged to use the cash to acquire an asset, or assets, as a condition on which the transfer is made’. A capital transfer in kind ‘consists of the transfer of ownership of an asset (other than inventories and cash) or the cancellation of a liability by a creditor, without any counterpart being received in return.’
Investment grants (D92) consist of capital transfers in cash or in kind by governments or by the rest of the world to other resident or non-resident institutional units to finance all or part of the costs of their acquiring fixed assets. Investment grants received in cash are made for purposes of gross fixed capital formation of the beneficiary, and the grants are often tied to specific investment projects, such as large construction projects.
Other capital transfers (D99) cover capital transfers which do not redistribute income themselves but redistribute saving or wealth among the different sectors or subsectors of the economy or the rest of the world. Examples of transfers here are transfers to cover capital losses or accumulated deficit. They can be made in cash or kind (cases of debt assumption or of debt cancellation) and correspond to voluntary transfers of wealth.
1.2 Environmental tax abatements (21) Tax abatements may be defined as an indirect flow of public resources achieved by reducing tax obligations with respect to a benchmark tax, rather than by a direct expenditure (22). By reducing the government revenue that would otherwise have been collected, tax abatements may have an impact similar to that of transfers.
Tax abatements may provide a potential taxpayer the complete relief from a tax, a tax at a reduced rate, or a tax on only a portion of the tax base and are usually not recorded in budget documents.
Tax abatements take a number of forms, all involving a certain benchmark or reference tax not actually collected: Different forms of tax abatements are:
— tax exemptions: some amounts are excluded from the tax base;
— tax allowances: some amounts deducted from the benchmark to arrive at the tax base;
— tax credits: some amounts are deducted from tax liability;
— tax rate relief: a reduced rate of tax is applied to a class of taxpayer or taxable transactions;
— tax deferral: a delay in paying tax.
Accelerated depreciation allowances for tax purposes could also be seen as tax abatements. In fact a provision in the national tax code allowing businesses to allocate the costs of past expenditures on fixed assets over a shorter accounting period allows deducting faster the cost of capital than they would allow under the benchmark system. Such provisions allow for higher deductions and lower taxes in the early years of an assessment and lower deductions and higher taxes in later years.
(21) The OECD calls these tax abatements tax expenditures, but the term expenditure should be avoided in environmental accounting as there is no link
to the meaning of the term ‘expenditure’ in national accounts.
(22) OECD (2010), Tax Expenditures in OECD Countries, Paris.

Environmental subsidies and similar transfers 16
Definitions, categories and links to other modules 1 Tax abatements, although not falling under the definition of environmental subsidies and similar transfers, can be of particular interest for environmental reasons. Tax abatements can be used as replacements for environmental subsidies or similar transfers to influence the behaviour of economic actors. In some countries they can have an important role as environmental policy tool e.g. in France or the Netherlands.
As tax abatements do not involve any flow from the government in cash or in kind they are not recorded in the national accounts as a transfer. However, governments sometimes prepare reports and documents on tax abatements cost to the budget. In these cases, the primary data source to gather information could be certain reports produced by for example the Ministry of Finance. Unfortunately the information in those documents is often highly aggregated and it is based on ad hoc estimations. Furthermore information on the value of a tax abatement received by particular industries or companies is usually much more difficult to obtain.
Whenever tax abatements are used to replace environmental transfers, they could be recorded as memorandum items for national purposes in the statistics on environmental subsidies and similar transfers. The main reason for recording them is for comparability across countries.
An important issue for the measurement of environmental tax abatements is the overall taxation system. A feature of the tax system that may be considered as tax abatement in one country may not be included in another country, given differing overarching systems. For example, a reduced tax rate on a certain activity may for one country be regarded as a mechanism to compensate another penalising feature of the tax system, whereas in another country this penalising feature may not exist.
Several methods can be used to estimate tax abatements. Detailed explanations are provided in the OECD 2013 Inventory of Estimated Budgetary Support and Tax Expenditures for Fossil Fuels (23). In the following overview of measurement methods, the term ‘tax abatements’ is used as representing ‘tax abatements for environmental purpose’.
Unlike direct expenditures, for which outlays can usually be readily measured, tax abatements are estimates of revenue that are foregone due to a particular feature of the tax system that reduces or postpones tax due relative to some benchmark tax system. There are a number of important measurement issues that could have an impact on the comparability of estimates of environmental tax abatements.
A key challenge in determining or assessing tax abatements is to identify the standard or benchmark tax regime against which the nature and extent of any concession is assessed. A number of different approaches to deciding on the benchmark regime are possible, and these vary among countries:
— Many countries base their tax abatements estimates on a conceptual view about ‘normal’ taxation. Typically, the benchmark is defined to include normal features of the tax system, whereas exemptions that are intended to address objectives other than the basic function of the tax (e.g. raising revenues, or internalising externalities) may be considered to be deviations from the benchmark. The line between what is normal and what is exemption, however, is often not a clear one.
— Some countries take a reference-law approach and identify only concessions which appear as such on the face of the law as tax abatements. Under this approach, a tax credit would likely be identified as tax abatement, whereas differential tax rates on two products within a broader category might not be.
— Even in a relatively straightforward case, such as reduced VAT rates, different approaches with different results are possible. Some countries take their standard VAT rate as the baseline for measuring the revenue foregone from taxation of some goods and services at lower rates, while others regard lower rates as an intrinsic part of their VAT and would therefore report no tax expenditure. Where countries have many different rates, it may not be clear which rate should be considered the benchmark.
— An analytic approach is to look at an ‘optimal’ tax regime. This is of particular relevance when investigating tax abatements potentially damaging for the environment (e.g. related to fossil fuels), given the presence of externalities. Externalities refer in general to those costs (negative externalities) and benefits (positive externalities) of activities that affect parties who have not chosen to incur them. For example, air pollution from burning fossil fuels is a negative externality if
(23) http://www.oecd-ilibrary.org/environment/inventory-of-estimated-budgetary-support-and-tax-expenditures-for-fossil-fuels-2013_9789264187610-en.

Environmental subsidies and similar transfers 17
Definitions, categories and links to other modules 1 it causes damages to the environment and the health of human beings: the costs are incurred by others than the polluter (e.g. by individuals who may suffer from respiratory diseases, by the government which needs to spend more money on public health, by forest owners who may have a lower return on their investment due to forests damage). An ‘optimal’ tax on a polluting activity would therefore be that level of tax that fully charges the costs of pollution to the polluter (internalisation). The choice of an ‘optimal’ tax as a baseline level can have significant impacts on the measurement of tax abatements.
Even when the benchmark is clear, countries may use different ways to measure the extent of the tax abatement. Each of these different ways of measuring is presented below.
— The revenue foregone method, the most straightforward method, looks at the rate of the tax concession multiplied by the tax base. For example, a reduced rate of EUR 0.25 per litre of biofuel for taxis from a normal fuel tax rate of EUR 0.45 per litre would yield annual tax abatements of EUR 180 million if taxi drivers consumed 900 million litres of biofuel a year. It is assumed the price change has no impact on the biofuel consumption.
— The revenue gain method estimates the increase in government revenues expected to be realised if the tax abatements were eliminated, thereby incorporating anticipated behavioural changes due to changes in the price ratios. Using the same example, the tax expenditure under this method would be the difference between tax rates – EUR 0.20 as before – multiplied by the consumption of biofuel under the tax abatement regime (900 million litres) and a tax revenue change due to anticipated behavioural changes. In the given example such a behavioural change may be represented by clients that no longer take taxis and use public transport instead, assuming the cost increase due to the elimination of the tax abatement is (partly) compensated by the behaviour change of clients. Moreover, also the different energy contents of the types of fuels can have an impact on the total consumption of fuels. Therefore, the total fuel consumption (biofuel and conventional fuel) of taxi drivers may fall (under the hypothetical situation of elimination of tax abatement) below the level observed under tax abatement, leading to a lower tax abatement estimate under the revenue gain method.
The box below illustrates both the revenue foregone and the revenue gain method.
REVENUE FOREGONE AND REVENUE GAIN METHOD — ILLUSTRATIVE EXAMPLE
Biofuel Conventional fuel Total
Situation: tax abatement
Consumption (million l) 900 1,200 2,100
Tax rate (EUR/l) 0.25 0.45
Revenue (million EUR) 225 540 765
Amount of tax abatement estimated by revenue foregone method (million EUR): 180 = 900*(0.45-0.25)
Hypothetical situation: tax abatement eliminated
Consumption (million l) 400 1,600 2,000
Tax rate (EUR/l) 0.45 0.45
Tax revenue (million EUR) 180 720 900
Amount of tax abatement estimated by revenue gain method (million. EUR): 135 = 180 –0.45*(2100–2000) = 900-765
The different results obtained by those methods are not different estimates of the same underlying concept, but are in fact due to different variants of the concept of tax abatement. A variant which includes indirect effects is not interchangeable with a variant that only considers direct effect. For the choice of method, the analytical purpose of measuring tax abatements plays a role as well as more practical considerations such as ease of method and availability of data. This also holds for the other methods presented below.
Environmental subsidies and similar transfers 18
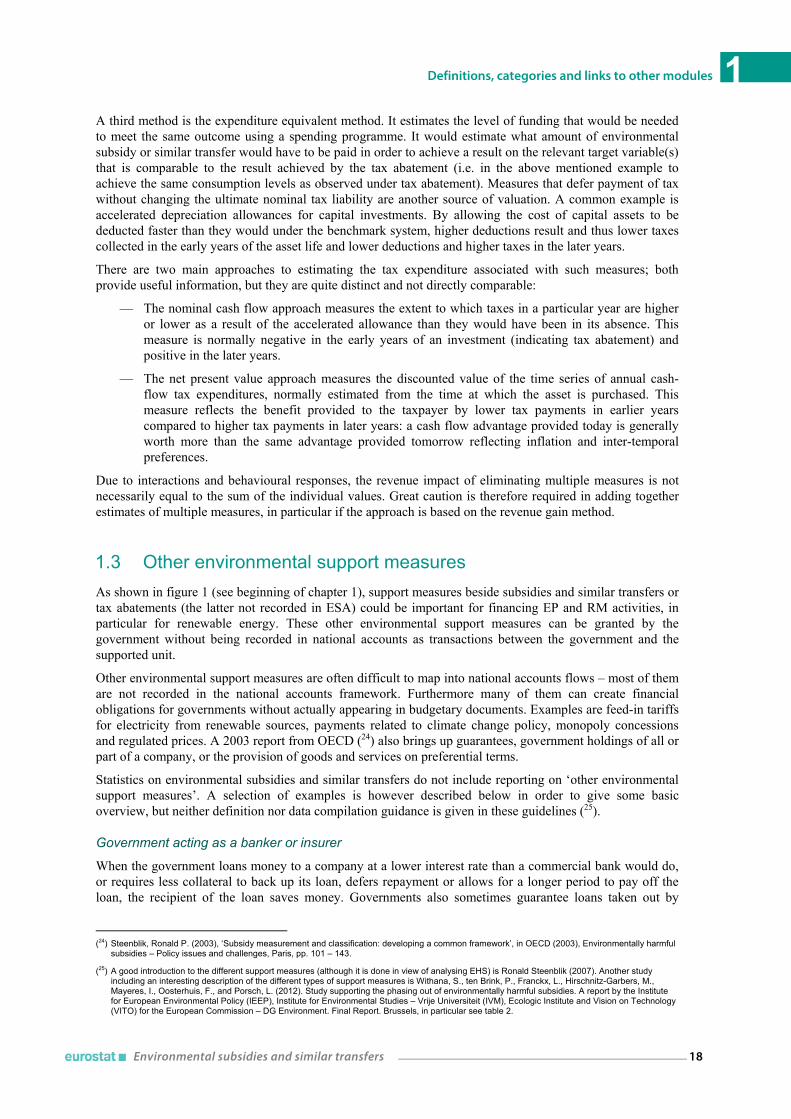
Definitions, categories and links to other modules 1 A third method is the expenditure equivalent method. It estimates the level of funding that would be needed to meet the same outcome using a spending programme. It would estimate what amount of environmental subsidy or similar transfer would have to be paid in order to achieve a result on the relevant target variable(s) that is comparable to the result achieved by the tax abatement (i.e. in the above mentioned example to achieve the same consumption levels as observed under tax abatement). Measures that defer payment of tax without changing the ultimate nominal tax liability are another source of valuation. A common example is accelerated depreciation allowances for capital investments. By allowing the cost of capital assets to be deducted faster than they would under the benchmark system, higher deductions result and thus lower taxes collected in the early years of the asset life and lower deductions and higher taxes in the later years.
There are two main approaches to estimating the tax expenditure associated with such measures; both provide useful information, but they are quite distinct and not directly comparable:
— The nominal cash flow approach measures the extent to which taxes in a particular year are higher or lower as a result of the accelerated allowance than they would have been in its absence. This measure is normally negative in the early years of an investment (indicating tax abatement) and positive in the later years.
— The net present value approach measures the discounted value of the time series of annual cash-flow tax expenditures, normally estimated from the time at which the asset is purchased. This measure reflects the benefit provided to the taxpayer by lower tax payments in earlier years compared to higher tax payments in later years: a cash flow advantage provided today is generally worth more than the same advantage provided tomorrow reflecting inflation and inter-temporal preferences.
Due to interactions and behavioural responses, the revenue impact of eliminating multiple measures is not necessarily equal to the sum of the individual values. Great caution is therefore required in adding together estimates of multiple measures, in particular if the approach is based on the revenue gain method.
1.3 Other environmental support measures As shown in figure 1 (see beginning of chapter 1), support measures beside subsidies and similar transfers or tax abatements (the latter not recorded in ESA) could be important for financing EP and RM activities, in particular for renewable energy. These other environmental support measures can be granted by the government without being recorded in national accounts as transactions between the government and the supported unit.
Other environmental support measures are often difficult to map into national accounts flows – most of them are not recorded in the national accounts framework. Furthermore many of them can create financial obligations for governments without actually appearing in budgetary documents. Examples are feed-in tariffs for electricity from renewable sources, payments related to climate change policy, monopoly concessions and regulated prices. A 2003 report from OECD (24) also brings up guarantees, government holdings of all or part of a company, or the provision of goods and services on preferential terms.
Statistics on environmental subsidies and similar transfers do not include reporting on ‘other environmental support measures’. A selection of examples is however described below in order to give some basic overview, but neither definition nor data compilation guidance is given in these guidelines (25).
Government acting as a banker or insurer
When the government loans money to a company at a lower interest rate than a commercial bank would do, or requires less collateral to back up its loan, defers repayment or allows for a longer period to pay off the loan, the recipient of the loan saves money. Governments also sometimes guarantee loans taken out by
(24) Steenblik, Ronald P. (2003), ‘Subsidy measurement and classification: developing a common framework’, in OECD (2003), Environmentally harmful
subsidies – Policy issues and challenges, Paris, pp. 101 – 143.
(25) A good introduction to the different support measures (although it is done in view of analysing EHS) is Ronald Steenblik (2007). Another study including an interesting description of the different types of support measures is Withana, S., ten Brink, P., Franckx, L., Hirschnitz-Garbers, M., Mayeres, I., Oosterhuis, F., and Porsch, L. (2012). Study supporting the phasing out of environmentally harmful subsidies. A report by the Institute for European Environmental Policy (IEEP), Institute for Environmental Studies – Vrije Universiteit (IVM), Ecologic Institute and Vision on Technology (VITO) for the European Commission – DG Environment. Final Report. Brussels, in particular see table 2.

Environmental subsidies and similar transfers 19
Definitions, categories and links to other modules 1 companies or individuals through commercial banks. That means that the government assumes the risk of default on the loan, rather than the bank, which in turn means that the bank can offer the borrower more favourable lending terms, such as a lower rate of interest. These mechanisms are often used for financing investments in renewable energy production equipment.
Implicit subsidies from the provision of general infrastructure
This is the case e.g. of direct investment by government in energy infrastructure to promote renewable energy production which is not fully paid by the users of the infrastructure. Infrastructures are frequently regarded as public goods, and therefore provided by the government. This is often excluded from the definition of a subsidy. However, although not explicitly meant as a subsidy, some benefit accrues from the provision of this general infrastructure and thus could be considered a subsidy. These guidelines recommend excluding such implicit subsidies from the reporting framework.
Price support and/or regulatory support mechanisms
This is the case e.g. of feed-in tariffs (26) and price premiums for renewable electricity production. Transfers of money to producers are typically divided into two broad categories: those provided at a cost to government, such as grants and tax abatements, and those provided through the market as a result of policies that raise prices artificially. The latter, called market price support (MPS) may derive from domestic price interventions (for example, a minimum-price policy) and is usually supported by foreign trade barriers such as a tariff or quantitative restriction on imports.
OECD defines market price support (for agriculture) as ‘an indicator of the annual monetary value of gross transfers from consumers and taxpayers to agricultural producers arising from policy measures creating a gap between domestic producer prices and reference prices of a specific agricultural commodity measured at the farm-gate level.’
The government could set up regulatory mechanisms to support the production of certain goods and services by encouraging consumers to buy them e.g. electricity from renewable sources. An example is purchase obligations which set targets for consumption of electricity and transport fuels (usually percentage based). This mechanism has been deployed for electricity from renewable sources, combined heat and power, and biofuels in most Member States. For example, energy distribution companies must prove the origin of purchase, pay a penalty or produce the required amount themselves, creating an artificial demand and price premium for the production of energy from renewable sources. If the overall system target cannot be met, prices rise until new market entrants and investors are attracted. Tradable certificates often accompany such schemes. The cost of this type of support is borne by consumers.
Selective exemptions from government standards
This happens when the government exempts certain subjects or groups from specific regulations/standards. This is the case for e.g. greenhouse gas emissions from landfill and incineration not included in EU Emission Trading Scheme.
Lack of resource pricing / resource rent for foregone natural resources
This covers situations when certain primary industries enjoy privileged access to a government owned or controlled natural resource for free or at prices below market prices, e.g. to public lands for mining or grazing livestock, to state forests for logging, to rivers for irrigation, or to foreign seas for fishing (through so-called ‘access agreements’). This category also includes non-payment for not unlimited resources such as water from aquifers, which have a societal value (shadow price) not taken into account.
Payments related to international climate change policies
Several countries have set up climate funds. These funds are involved in all kinds of transactions to fight climate change: buying and selling emission permits and similar rights, giving assistance to domestic and foreign actors, etc. The analysis of the different types of climate-related expenditure is important to develop recommendations for recording such expenditure in the monetary environmental accounts. It is not always
(26) Governments set a price at which the country’s electricity supply companies must purchase all renewable energy delivered to the distribution grid.
Price premiums are passed on to consumers in the form of higher electricity prices.

Environmental subsidies and similar transfers 20
Definitions, categories and links to other modules 1 easy to understand how these transactions are accounted in the national accounts. Monitoring how national accounts treat these items would be useful for completing the coverage of environmental support measures. Some of these items have been already discussed in task forces and working groups.
This is the case for example of Assigned Amount Units (AAUs) which are tradable emission permits whose disposal should be classified as non-produced non-financial assets (K2) in the national accounts and assigned to COFOG (27) division 05.3 (pollution abatement). Nevertheless there are still many items which have not been settled yet. For instance cross-border flows of government outlays related to the Kyoto protocol and the mechanisms of the Directive on the promotion of the use of energy from renewable sources (2009/28/EC (28), RES Directive). This issue seems to be rapidly evolving in most countries.
Other environmental support measures, which represent in many cases government foregone revenue, are often not recorded in national accounts. Consequently, they are more difficult to identify.
Some forms of other environmental support measures, while not falling in the definition of environmental subsidies and similar transfers, could be of particular interest for environmental reasons. Whenever they are nationally relevant e.g. if they are widely used as replacement of subsidies and similar transfers, they could be recorded as memorandum items in statistics on environmental subsidies and similar transfers for national purposes.
1.4 Linkages to other modules of monetary environmental accounts The SNA 2008 describes in chapter 29 'Satellite accounts and other extensions' the aim of environmental accounts. They reflect within a close connection to the national accounts the impacts of using (or consuming) natural resources, the generation of residuals that pollute the air, water, etc., and the specific activities undertaken to prevent or combat the environmental impacts of human activity.
In Europe, the term of environmental subsidies has its roots in the European System for the Collection of Economic Data on the Environment (SERIEE 1994) whose purpose was to set out the conceptual framework for a monetary description of environmental activities according to the provisions of SNA. Work on updating and integrating the various monetary accounts has been undertaken in Europe in Working Groups and Task Forces; the latest available document at the time of publication of this guidelines is the document ‘'ENV_EXP_WG_2015_1 Integrating the monetary environmental accounts’(29) (March 2015).
Environmental protection expenditure account
Both the SERIEE and the SEEA CF 2012 establish accounting frameworks for the calculation of environmental protection national expenditure and its financing (Environmental protection expenditure accounts – EPEA). The goal of EPEA is to assess the actual expenditure for environmental protection by the whole economy. It aims at providing indicators of the social demand to reduce pollution, to explain changes in environmental pressure and in the state of the environment in general. EPEA thus provide a framework for integrating consistently all available basic data on environmental expenditure and activities. It links the uses of environmental protection services with their supply, following the model of the national accounts supply-use tables. In this context the EPEA also record environmental protection transfers.
In practice, the compilation of EPEA usually starts with the analysis of the supply of EP characteristic products (30) (production costs and thus also subsidies on production) and the capital transactions (including investments grants and other capital transfers) needed for that production. This supply is then complemented with available information on the uses. These uses, together with some additional information (for examples on certain environmental transfers that are paid to units that do not fall under producers of characteristic products) allow estimating national expenditure.
(27) COFOG stands for ‘classification of functions of government ‘and is a classification followed by the national accounts and it is used to allocate
governmental expenditure according to its main purpose. This allows for the identification of actual or imputed expenditure made in connection with particular functions or to achieve particular purposes.
(28) http://eur-lex.europa.eu/LexUriServ/LexUriServ.do?uri=OJ:L:2009:140:0016:0062:EN:PDF.
(29) https://circabc.europa.eu/d/a/workspace/SpacesStore/52482f36-773d-4eb9-9f69-7c8095134a59/ENV_EXP_WG_2015_1%20Integrating%20the%20monetary%20environmental%20accounts.pdf.
(30) Environmental activities that directly serve an environmental purpose are called characteristic environmental activities. EP characteristic products correspond to the principal output of characteristic environmental protection activities.

Environmental subsidies and similar transfers 21
Definitions, categories and links to other modules 1 Based on the definition and scope of environmental subsidies and similar transfers and their operationalisation as provided in section 1.1 transfers recorded in the EPEA as a subsidy on production given to a producer of EP characteristic products can be identified as environmental because they support activities whose technical nature is to protect the environment or manage resources. However, general subsidies and similar transfers received by a producer unit are not environmental subsidies and similar transfers and would need to be excluded in line with the scope defined in section 1.1. For the compilation of national expenditure, the EPEA sums up also those environmental transfers that do not enter the purchaser’s value of uses of environmental products and capital formation.
A module on environmental subsidies and similar transfers is not yet part of the Regulation (EU) No 691/2011 on European environmental economic accounts. However, data on environmental subsidies and similar transfers will be required as part of the EPEA module that became mandatory and it is part of Regulation 691/2011 allowing for the calculation of environmental protection expenditure and better analysis of the financing of EP expenditure.
Environmental transfers in the EPEA and in statistics on environmental subsidies and similar transfers are complementary and use in principle the same data sources from national accounts. Statistics on environmental subsidies and similar transfers include beside the ones accounted in the EPEA, also those transfers linked to the resource management activities (accounted in the resource management expenditure accounts). Statistics on environmental subsidies and similar transfers provide more details than the EPEA as regards the types of transfers and beneficiary industries for both environmental protection and resource management.
Currently also a European accounting framework is being developed on expenditure for natural resource management and its financing. The Resource Management Expenditure Accounts (ReMEA) use the methodological framework developed for the EPEA. In this context resource management transfers are defined in the same way as the environmental protection ones. They can contribute to the financing of RM national expenditure or be a component of RM national expenditure.
Whereas EPEA and ReMEA focus mainly on the use side of environmental protection and resource management, the Environmental Goods and Service Sector Accounts (EGSS) focus on the production of environmental products. EGSS data can be compared to environmental subsidies for further analysis of the EGSS. This allows to know if/which proportion of environmental subsidies and similar transfers are made by the government to influence the production of EGSS output, the prices of EGSS output and the prices of the factors engaged in EGSS output.
Environmental taxes
An environmental tax is defined as a tax whose base is a physical unit (or a proxy of it) of something that has a proven, specific negative impact on the environment (SEEA CF 2012 § 4.150). This definition puts the emphasis on the tax base, which is seen as the only objective basis for identifying environmental taxes for the purpose of international comparisons. Other possible criteria, such as the purpose stated by the tax legislator, the name of the tax or the earmarking of the revenue for environmental purposes, were judged to be less suitable and more difficult to use in practice.
The approach chosen in the definition of environmental subsidies and similar transfers is based on the primary purpose criterion. This is different from the one chosen for environmental taxes which uses an effect-based approach where the specific tax bases decide if a tax is environmental or not. Given their definition, environmental taxes cannot be associated with environmental products, since environmental products are supposed to have a beneficial impact on the environment. The counterpart of environmental taxes is formed by potentially environmentally damaging subsidies, which are also not linked to the environmental products as defined for EGSS, EPEA and ReMEA.

Environmental subsidies and similar transfers 22
Definitions, categories and links to other modules 1 1.5 Potentially environmentally damaging subsidies (PEDS) and
environmentally harmful subsidies (EHS) The potentially environmentally damaging or harmful subsidies are high on the political agenda. In the past 10 years they have gone from being at first a topic mainly discussed in the OECD arena to having the highest interest at national, European and international levels (for example in the context of Rio+20 Conference (31), within the OECDs Green Growth initiative (32) and in the context of G20 (33) as well as in some Member States such as France in the context of the Grenelle Environnement Acts (34)). The European Commission has dialogues with Member States on issues such as greening tax systems and phasing out environmentally harmful subsidies. They can potentially deliver budgetary savings, stimulate growth through improved incentives and redirect financial resources from unsustainable practices towards environmental improvement. Agreements for the way forward in the phasing out of potentially environmentally damaging subsidies have been adopted at global level in the context of the Convention on Biological Diversity (CBD (35)) and the G20, while some existing ones were reiterated at the Rio+20 Conference. However, despite these numerous achievements progress has been slow. Further advancements in the reform of subsidies have been slowed down by the lack of an agreed definition of PEDS, the lack of agreed methods to keep track and quantify them, the lack of application of assessment methods and a lack of commitment to keep a transparent inventory of subsidies.
The SEEA CF does not give a definition of PEDS but mentions them in chapter 4. PEDS encompass subsidies and similar transfers that support activities considered environmentally damaging. In some definitions this measure also includes so-called implicit (or indirect) subsidies, such as preferential tax rates.
Methodologies for collecting PEDS data are not easy to standardise because PEDS are quite specific to national situations and make most sense in relation to national targets. Furthermore, the link with national accounts is not straightforward as many PEDS are in fact tax abatements; the use of COFOG does not seem to help either. Comparability across countries will therefore be a major issue.
Two approaches - PEDS and EHS
Two different names for (potentially) damaging subsidies seem to be used internationally. This guide uses the term potentially environmentally damaging subsidies. However, these subsidies can also go under the name environmental harmful subsidies (EHS).
Two main approaches to identifying these transfers are behind the two different uses of terminology:
— based on assessments or checklist leading to the effect of the transfer, leads to EHS;
— based on the beneficiary of the transfer, leads to PEDS.
The first approach (‘assessment/checklist’) identifies transfers that according to some established method or checklist are environmentally harmful. These transfers could be called EHS as they are assessed to have an environmentally harmful effect. One example is setting a methodology for the calculation of an indicator comparing the emission intensities (or other indicators of environmental impacts) of the transfers to each economic sector. The emission intensity of an industry compared to the mean of the region or country could then be used to single out what transfers should be regarded as EHS. For the industries having emission intensities above the mean, the transfers might be analysed in more details. If the transfers are seen to increase the level of production and then the emissions, they could be labelled as EHS. Usually such assessments are not done by statistical offices but they could use them if available.
The second approach (‘based on beneficiary’) identifies transfers going to (producers in) certain activities or industries which are considered particularly polluting e.g. energy, transport or agriculture. These transfers
(31) Outcome document of the United Nations Conference on Sustainable Development – ‘The future we want’, A66/L.56, http://daccess-dds-
ny.un.org/doc/UNDOC/LTD/N12/436/88/PDF/N1243688.pdf?OpenElement.
(32) OECD (2009), Declaration on Green Growth, Adopted at the Meeting of the Council at Ministerial Level on 25 June 2009, Ref. C/MIN (2009)5/ADD1/FINAL, Paris. www.oecd.org/greengrowth.
(33) G20 leaders statement: The Pittsburgh Summit, 24-25 September 2009, http://ec.europa.eu/commission_2010-2014/president/pdf/statement_20090826_en_2.pdf.
(34) France, LOI n° 2009-967 du 3 août 2009 de programmation relative à la mise en œuvre du Grenelle de l'environnement, article 26 and 48, http://www.legifrance.gouv.fr/affichTexte.do?cidTexte=JORFTEXT000020949548.
(35) http://www.cbd.int/.

Environmental subsidies and similar transfers 23
Definitions, categories and links to other modules 1 may or may not have a negative effect on the environment. For this reason they are called PEDS.
There is no established definition of potentially environmentally damaging subsidies but there are ideas of how such a definition could be elaborated.
One idea is to look at reductions and exemptions related to environmental taxes (using the list of environmental tax bases — see table 1 below), which includes tax abatements.
Another possible idea is to create a list of potentially harmful activities. This approach is an example of an approach ‘based on beneficiary’ since each subsidy would have to be allocated to the receiving activities and those transfers that are allocated to potentially harmful activities are considered as PEDS. All environmental subsidies and similar transfers should be excluded from the scope.
Table 1: List of environmental tax bases
Energy (including fuel for transport)
— Energy products for transport purposes
• Unleaded petrol • Leaded petrol • Diesel • Other energy products for transport purposes (e.g. LPG, natural gas, kerosene or fuel oil)
— Energy products for stationary purposes
• Light fuel oil • Heavy fuel oil • Natural gas • Coal • Coke • Biofuels • Electricity consumption and production • District heat consumption and production • Other energy products for stationary use
— Greenhouse gases
• carbon content of fuels • emissions of greenhouse gases (including proceeds from emission permits recorded as taxes in
the national accounts)
Transport (excluding fuel for transport)
— Motor vehicles import or sale (one off taxes)
— Registration or use of motor vehicles, recurrent (e.g. yearly taxes)
— Road use (e.g. motorway taxes)
— Congestion charges and city tolls (if taxes in national accounts)
— Other means of transport (ships, airplanes, railways, etc.)
— Flights and flight tickets
— Vehicle insurance (excludes general insurance taxes)
Pollution
— Measured or estimated emissions to air
• Measured or estimated NOx emissions • Measured or estimated SOx emissions • Other measured or estimated emissions to air (excluding CO2)
— Ozone depleting substances (e.g. CFCs or halons)

Environmental subsidies and similar transfers 24
Definitions, categories and links to other modules 1
Table 1 (continuing): List of environmental tax bases
Pollution
— Measured or estimated effluents to water
• Measured or estimated effluents of oxydisable matter (BOD, COD) • Other measured or estimated effluents to water • Effluent collection and treatment, fixed annual taxes
— Non-point sources of water pollution
• Pesticides (based on e.g. chemical content, price or volume) • Artificial fertilisers (based on e.g. phosphorus or nitrogen content or price) • Manure
— Waste management
• Collection, treatment or disposal • Individual products (e.g. packaging, beverage containers, batteries, tyres, lubricants)
— Noise (e.g. aircraft take-off and landings)
Resources
— Water abstraction
— Harvesting of biological resources (e.g. timber, hunted and fished species)
— Extraction of raw materials (e.g. minerals, oil and gas)
Most PEDS/EHS studies are literature and case studies or they focus on policies for reforming subsidies. They regard different definitions and present case studies of specific sectors in view of tracing a roadmap for the elimination of PEDS. The Annex summarises the results with the name of the study, country/organisation, year as well as the definition of potentially environmental harmful subsidies.
Whereas those studies do not address the compilation of PEDS statistics, a few NSIs have started to work on establishing methods for compiling statistics on potentially environmentally harmful subsidies.
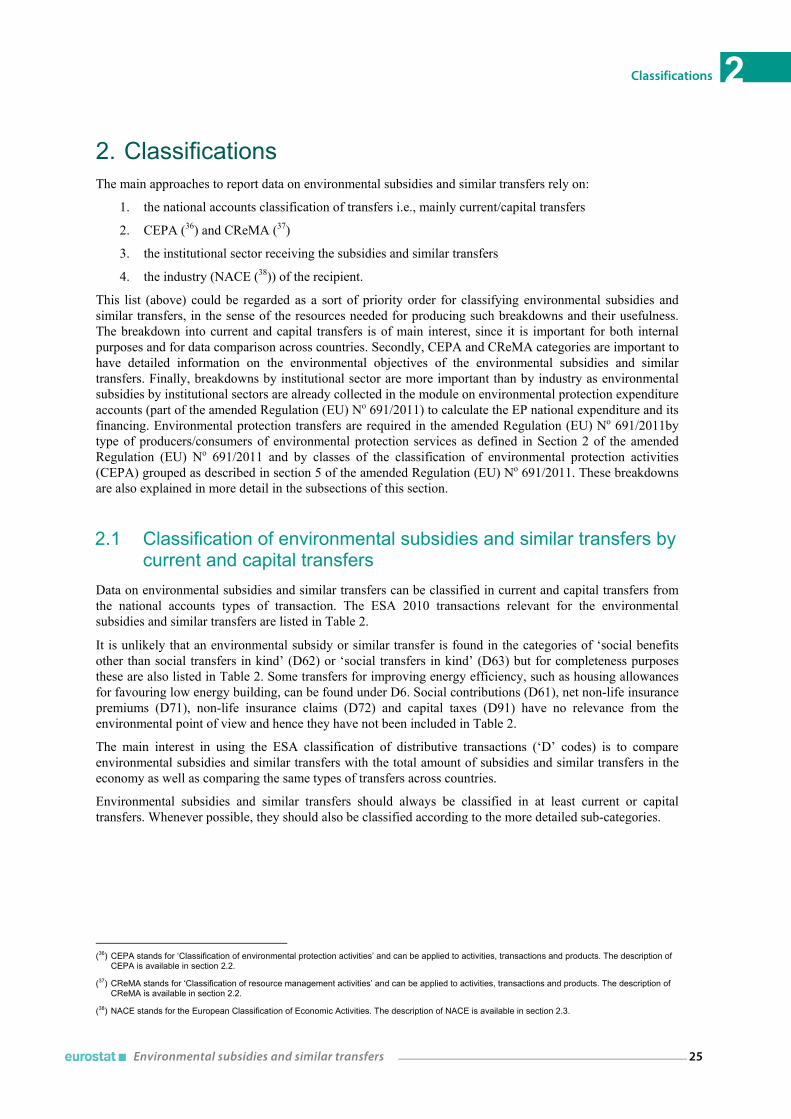
Environmental subsidies and similar transfers 25
Classifications 2
2. Classifications The main approaches to report data on environmental subsidies and similar transfers rely on:
1. the national accounts classification of transfers i.e., mainly current/capital transfers
2. CEPA (36) and CReMA (37)
3. the institutional sector receiving the subsidies and similar transfers
4. the industry (NACE (38)) of the recipient.
This list (above) could be regarded as a sort of priority order for classifying environmental subsidies and similar transfers, in the sense of the resources needed for producing such breakdowns and their usefulness. The breakdown into current and capital transfers is of main interest, since it is important for both internal purposes and for data comparison across countries. Secondly, CEPA and CReMA categories are important to have detailed information on the environmental objectives of the environmental subsidies and similar transfers. Finally, breakdowns by institutional sector are more important than by industry as environmental subsidies by institutional sectors are already collected in the module on environmental protection expenditure accounts (part of the amended Regulation (EU) No 691/2011) to calculate the EP national expenditure and its financing. Environmental protection transfers are required in the amended Regulation (EU) No 691/2011by type of producers/consumers of environmental protection services as defined in Section 2 of the amended Regulation (EU) No 691/2011 and by classes of the classification of environmental protection activities (CEPA) grouped as described in section 5 of the amended Regulation (EU) No 691/2011. These breakdowns are also explained in more detail in the subsections of this section.
2.1 Classification of environmental subsidies and similar transfers by current and capital transfers
Data on environmental subsidies and similar transfers can be classified in current and capital transfers from the national accounts types of transaction. The ESA 2010 transactions relevant for the environmental subsidies and similar transfers are listed in Table 2.
It is unlikely that an environmental subsidy or similar transfer is found in the categories of ‘social benefits other than social transfers in kind’ (D62) or ‘social transfers in kind’ (D63) but for completeness purposes these are also listed in Table 2. Some transfers for improving energy efficiency, such as housing allowances for favouring low energy building, can be found under D6. Social contributions (D61), net non-life insurance premiums (D71), non-life insurance claims (D72) and capital taxes (D91) have no relevance from the environmental point of view and hence they have not been included in Table 2.
The main interest in using the ESA classification of distributive transactions (‘D’ codes) is to compare environmental subsidies and similar transfers with the total amount of subsidies and similar transfers in the economy as well as comparing the same types of transfers across countries.
Environmental subsidies and similar transfers should always be classified in at least current or capital transfers. Whenever possible, they should also be classified according to the more detailed sub-categories.
(36) CEPA stands for ‘Classification of environmental protection activities’ and can be applied to activities, transactions and products. The description of
CEPA is available in section 2.2.
(37) CReMA stands for ‘Classification of resource management activities’ and can be applied to activities, transactions and products. The description of CReMA is available in section 2.2.
(38) NACE stands for the European Classification of Economic Activities. The description of NACE is available in section 2.3.

Environmental subsidies and similar transfers 26
Classifications 2 Table 2: Environmental subsides and similar transfers in the national accounts
Current transfers (D3, D6 and D7) — Subsidies (D3)
• Subsidies on products (D31) o Import subsidies (D311) o Other subsidies on products (D319) - which includes export subsidies
• Other subsidies on production (D39)
— Social contributions and benefits (D6) • Social benefits other than social transfers in kind (D62) • Social transfers in kind (D63)
o Social transfers in kind – general government and NPISHs non-market production (D631)
o Social transfers in kind – market production purchased by general government and NPISHs (D632)
— Other current transfers (D7) • Current transfers within general government (D73) • Current international cooperation (D74) • Miscellaneous current transfer (D75)
o Current transfers to NPISHs (D751) o Current transfers between households (D752) o Other miscellaneous current transfers (D759)
Capital transfers (D9) — Investment grants (D92) — Other capital transfers (D99)
2.2 Classification of environmental subsidies and similar transfers by environmental domain
Environmental subsidies and similar transfers can be classified by the environmental/natural resource domain they are targeted to. CEPA and CReMA are the two main classifications used for this purpose.
CEPA is used for environmental protection and CReMA is used for resource management. These two classifications are briefly presented below.
CEPA
CEPA is a multi-purpose internationally agreed classification by environmental domains to classify activities, products and transactions for the protection of the environment. CEPA is included in the amended Regulation (EU) No 691/2011. The 1-digit levels codes are listed in table 3 below.
Table 3: CEPA 2000
1. Protection of ambient air and climate
2. Wastewater management
3. Waste management
4. Protection and remediation of soil, groundwater and surface water
5. Noise and vibration abatement
6. Protection of biodiversity and landscape
7. Protection against radiation
8. Research and development
9. Other environmental protection activities
CEPA is available on RAMON, Eurostat’s metadata server (39).
(39) http://ec.europa.eu/eurostat/ramon/index.cfm?TargetUrl=DSP_PUB_WELC.

Environmental subsidies and similar transfers 27
Classifications 2 CReMA
CReMA can be used to classify environmental subsidies and similar transfers for resource management. This classification has been implemented and tested in the Environmental Goods and Services Sector Accounts. CReMA is included in the amended Regulation (EU) No 691/2011.
The CReMA classes are presented in table 4 below.
Table 4: CReMA 2008
10. Management of water
11. Management of forest resources
11A. Management of forest areas 11B. Minimisation of the intake of forest resources
12. Management of wild flora and fauna
13. Management of energy resources
13A. Production of energy from renewable sources 13B. Heat/energy saving and management 13C. Minimisation of the intake of fossil resources
for raw materials for uses other than energy production
14. Management of minerals
15. Research and development activities for natural resources management
16. Other natural resource management activities
For the detailed description of the CReMA see page 60 of the EGSS 2009 handbook(40).
2.3 Classification of environmental subsidies and similar transfers by payers and beneficiaries
Entities paying the subsidies and similar transfers
The statistics on environmental subsidies and similar transfers record transfers paid by the general government and the rest of the world, in particular by the EU institutions.
The general government could be further broken down into its main subsectors, national, state or local governments as well as social security funds. For the EPEA module the amended Regulation (EU) No 691/2011 asks for total current and capital transfers paid by general government and the rest of the world.
Entities receiving the subsidies and similar transfers
The entities receiving the transfers can be classified in different ways, the two main ones are:
— by institutional sector. According to ESA an institutional sector, or simply ‘sector’, is an aggregation of institutional units with similar economic behaviour, the latter based on the type of producer, principal activity and function. ESA distinguishes the following institutional sectors: non-financial corporations (S11), financial corporations (S12), general government (S13), households (S14), non-profit institutions serving households (S15), rest of the world (S2).
— by industry. An industry is a group of producer units with the same principal economic activity. An activity is characterised by an input of products, a production process and an output of products. NACE is the European reference classification for the production and the dissemination of statistics related to economic activities. The current NACE classification (NACE Rev.2) (41) has 21 sections and 88 divisions (42).
(40) http://ec.europa.eu/eurostat/en/web/products-manuals-and-guidelines/-/KS-RA-09-012. This handbook is currently being updated.
(41) See Regulation (EU) No 1893/2006 of the European Parliament and of the Council, establishing the statistical classification of economic activities NACE Revision 2.
(42) The broad structure of the NACE Rev.2 can be found at: http://ec.europa.eu/eurostat/ramon/nomenclatures/index.cfm?TargetUrl=LST_NOM_DTL&StrNom=NACE_REV2&StrLanguageCode=EN&IntPcKey=&StrLayoutCode=HIERARCHIC.

Environmental subsidies and similar transfers 28
Classifications 2 The breakdown of environmental subsidies data by sector would allow for example to calculate national expenditure on environmental protection and resource management and its financing. The EPEA module to be implemented for the amended Regulation (EU) No 691/2011 collects total current and capital transfers received by:
— Corporations (S11 and S12)
— General government (S13)
— Households (S14) and non-profit institutions serving households – NPISH (S15)
— Rest of the world (S2).
Furthermore, a detailed breakdown of the entities receiving the transfers by industry, using NACE, should be implemented. As a first priority this should be done at least for subsidies (D3). The overall total of current and capital transfers should be distributed by economic activities.
An aggregated breakdown of NACE should be used, the NACE A*10 breakdown. However, some activities can be further singled out from the NACE A*10 breakdown in order to highlight some environmental sensitive sectors. This breakdown, referred to as A*10+ in these guidelines, is presented in table 5.
Table 5: NACE A*10 structure adjusted for environmental subsidies and similar transfers reporting (A*10+)
NACE Rev. 2 sections /divisions Description
A Agriculture, forestry and fishing
B, C, D and E Mining and quarrying; manufacturing; electricity, gas, steam and air conditioning supply; water supply; sewerage, waste management and remediation activities
of which B Mining and quarrying
of which C Manufacturing
of which D Electricity, gas, steam and air conditioning supply
of which E36 Water collection, treatment and supply
of which E37 Sewerage
of which E38 Waste collection, treatment and disposal activities; materials recovery
of which E39 Remediation activities and other waste management services
F Construction
G, H and I Wholesale and retail trade; repair of motor vehicles and motorcycles; transportation and storage; accommodation and food service activities
of which H Transportation and storage
J Information and communication
K Financial and insurance activities
L Real estate activities
M and N Professional, scientific and technical activities; administrative and support service activities
O, P, and Q Public administration and defence; compulsory social security; education; human health and social work activities
of which P Education
R, S, T and U Arts, entertainment and recreation, other service activities; activities of households as employers; undifferentiated goods and services producing activities, of households for own use, activities of extraterritorial organisations and bodies

Environmental subsidies and similar transfers 29
Framework for data collection 3 3. Framework for data collection This chapter presents a framework for data collection on environmental subsidies and similar transfers. Some proposals for environmental subsidies and similar transfers statistics for national purposes are also given.
Environmental subsidies and similar transfers statistics should be compiled in close cooperation with the national accounts and the EPEA legal mosule, both to ensure consistency and to reduce the amount of work involved.
3.1 Basic approach Data on government expenditure classified by COFOG are important sources for compiling statistics on environmental subsidies and similar transfers. This process can follow a step-wise approach. Once the system is established, some steps can be simplified for the purposes of the updating routines.
1. Identify environmental subsidies and similar transfers in COFOG division 05 (‘Environmental protection’ and other relevant divisions such as 01 (‘General public services’), 04 (‘Economic affairs’) and 06 (‘Housing and community amenities’) and if needed for national purpose - establish a list of environmental subsidies and similar transfers (43).
2. Classify the environmental subsidies and similar transfers by type of ESA transaction (e.g. current and capital transfers or their further breakdowns as explained in sections 1.1 and 2.1). This should be simple based on the allocation done already in the national accounts. In the rare case when no such classification is feasible, subsidies and similar transfers could be reported as total.
3. Allocate the environmental subsidies and similar transfers to the environmental domains using CEPA and CReMA. This step is straightforward unless some subsidies and similar transfers cover several environmental domains. In that case, a split should be made between the environmental domains, or if not possible, a predominance principle should be used.
4. Allocate the environmental subsidies and similar transfers to the entities receiving them, using primarily the national accounts classification of institutional sectors, and if possible an industry breakdown using NACE Rev. 2.
These guidelines advocate the principle of compiling environmental subsidies and similar transfers statistics from already existing sources. In general, the compilation of statistics on environmental subsidies and similar transfers can be done through an integrative approach, following a progression from a minimum set of estimates based on national accounts data regularly produced to more detailed and exhaustive estimates to include data from a wider range of sources (state aid, agencies and producers associations). The approach must balance the needs of detail and exhaustiveness of the estimates with timeliness of the statistical production and the resources available.
It is understood that compilers of environmental subsidies and similar transfers in the national statistical institutes are able to reach a coverage and data quality well above the level presented in this part of the guidelines since they have access to more detailed data sources and expert information specific for their countries.
(43) Countries may produce a second list of environmental subsidies and similar transfers for national purposes where they include environmental
support measures (e.g. environmental tax abatements, other environmental support measures as described in chapter 1). As well, at national level countries could capture PEDS that are considered important to be highlighted to policy makers, but they should be aware that PEDS are not part of the environmental subsidies and similar transfers statistics (as described in chapter 1).

Environmental subsidies and similar transfers 30
Framework for data collection 3 3.2 Data sources for environmental subsidies and similar transfers Data sources to be explored in order to compile statistics on environmental subsidies and similar transfers are:
— The national accounts databases and government budget documents as the main source of data for environmental subsidies and similar transfers. This includes tables of the ESA transmission programme, more detailed databases behind national accounts published data (intermediary databases), government budget analysis, etc.
— Other data sources, for example state aid data and national databases can be used mainly as primary sources for tax abatements (and other support measures as well) and as additional sources of data on environmental subsidies for cross checking purposes. They can also be relevant for cross checking purposes or as a starting point for further investigations of data in the concerned institutions. Moreover, they can be used to retrieve information on tax abatements since these types of support measures are unlikely to be found in government budgets.
Using national accounts as a data source for the compilation of environmental subsidies and similar transfers ensures consistency with the national accounts and enhances international comparability.
National accounts integrate economic and related statistics in a system that is based on consistent economic and statistical concepts and methods. As such, it allows domestic and international comparative analysis.
Each Member State compiles its own national accounts in accordance with ESA 2010, through an institution appointed by its government, such as its national statistical office or its national central bank.
National accounts offer a wide set of data as a starting point for the compilation of environmental subsidies and similar transfers. In Europe, the ESA transmission programme (44) determines the publication of data on transfers from general government (Table 11 — general government expenditure by function) and transfers received from the different institutional sector of an economy (Table 8 — non-financial accounts by sector). Other national accounts data could be useful in the allocation of environmental subsidies to environmental domains or recipient industries. Supply tables (Table 15) and use tables (Table 16) could allow identifying subsidies paid to some relevant environmental activities (waste management for example).
However, in order to obtain the information with the detail necessary to identify the environmental subsidies and similar transfers and their allocation to environmental domains and economic activities, it may be necessary to explore unpublished national accounts data.
Further analysis of national accounts data sources can give a more detailed picture needed to identify environmental subsides and similar transfers. Although the national accounts are set up differently in each country, they generally identify the type of transfer and the institutional sectors giving and receiving it.
Whenever national accounts do not provide sufficient detail to compile statistics on environmental subsidies and similar transfers, more details should be sought from the sources for national accounts and eventually analyse the government budget.
3.2.1 ESA transmission programme Table 11 The ESA 2010 transmission programme Table 11 (General government expenditure by function) and the underlying basic data used to compile it, are a starting point for gathering data on environmental subsidies and similar transfers.
Table 11 reports government expenditure by function, using the Classification of Functions of Government (COFOG). It reports data on transactions by type of transfers (subsidies, other current transfers, capital transfers, investments grants, etc.) and by function (45) (defence, economic affairs, housing, etc.).
(44) Annex B of Council Regulation (EU) No 2223/96 of 25 June 1996 as amended by the European Parliament and Council Regulation (EU) No
1392/2007.
(45) The first level of COFOG splits expenditure data into 10 functional divisions: general public services (01), defence (02), public order and safety (03), economic affairs (04), environmental protection (05), housing and community amenities (06), health (07), recreation, culture and religion (08), education (09) and social protection (10). Each division is divided in groups (level II) and classes (level III).

Environmental subsidies and similar transfers 31
Framework for data collection 3 Table 6 (see next page) presents the structure of the Table 11 of ESA transmission programme and highlights some columns/rows that could be used as source for environmental subsidies and similar transfers. COFOG divisions and groups are both mandatory for transfers data and are to be provided for reference year 2001 onwards.
Table 6: ESA transmission programme Table 11 — General government expenditure by function (extract of codes relevant for environmental subsidies and similar transfers46)
Code List of variables Function Subsector breakdown (1)
D.3 Subsidies COFOG divisions S.13, S.1311, S.1312, S.1313, S.1314
COFOG groups (3) (7)
D.62+D.632 Social benefits other than social transfers in kind and social transfers in kind — purchased market production
COFOG divisions S.13, S.1311, S.1312, S.1313, S.1314
COFOG groups (3) (7)
D.62 Social benefits other than social transfers in kind (8)
COFOG divisions S.13, S.1311, S.1312, S.1313, S.1314
COFOG groups (3) (7)
D.632 Social transfers in kind - purchased market production (8)
COFOG divisions S.13, S.1311, S.1312, S.1313, S.1314
COFOG groups (3) (7)
D.7 Other current transfers (2) COFOG divisions S.13, S.1311, S.1312, S.1313, S.1314
COFOG groups (3) (7)
D.7p_S.1311 of which, payable to subsector central government (S.1311) (2) (6)
COFOG divisions S.1312, S.1313, S.1314
COFOG groups (3)
D.7p_S.1312 of which, payable to subsector state government (S.1312) (2) (6)
COFOG divisions S.1312, S.1313, S.1315
COFOG groups (3)
D.7p_S.1313 of which, payable to subsector local government (S.1313) (2) (6)
COFOG divisions S.1312, S.1313, S.1316
COFOG groups (3)
D.7p_S.1314 of which, payable to subsector social security funds (S.1314) (2) (6)
COFOG divisions S.1312, S.1313, S.1317
COFOG groups (3)
D.9 Capital transfers (2) (5) COFOG divisions S.13, S.1311, S.1312, S.1313, S.1314
COFOG groups (3) (7)
D.92p of which, investment grants (2) (3) COFOG divisions S.13
COFOG groups (7)
(1) Breakdown of general government subsectors: S.13 - General government, S.1311 - Central government, S.1312 - State government, S.1313 - Local government and S.1314 - Social security funds.
(2) Subsector data should be consolidated within each subsector but not between subsectors. Sector S.13 data equal the sum of subsector data, except for items D.4, D.7 and D.9 (and their sub-items) which should be consolidated between subsectors (with counterpart information).
(3) On a voluntary basis for subsectors. (5) No amounts for D.995 are to be included under D.9p. D.995 is to be deducted from D.99r. (6) On a voluntary basis for subsectors. (7) To be provided for reference year 2001 onwards. (8) Data for reference years before 2012 to be transmitted on a voluntary basis. Transmission is compulsory for reference years from 2012
onwards.
(46) This table includes extract of codes relevant for environmental subsidies and similar transfers from the ESA transmission programme Table 11 —
General government expenditure by function. Footnotes at the end of the table were kept as presented in the ESA transmission programme; please note that footnote no. 4 is missing because it belongs to a code that is not relevant for environmental subsidies and similar transfers.
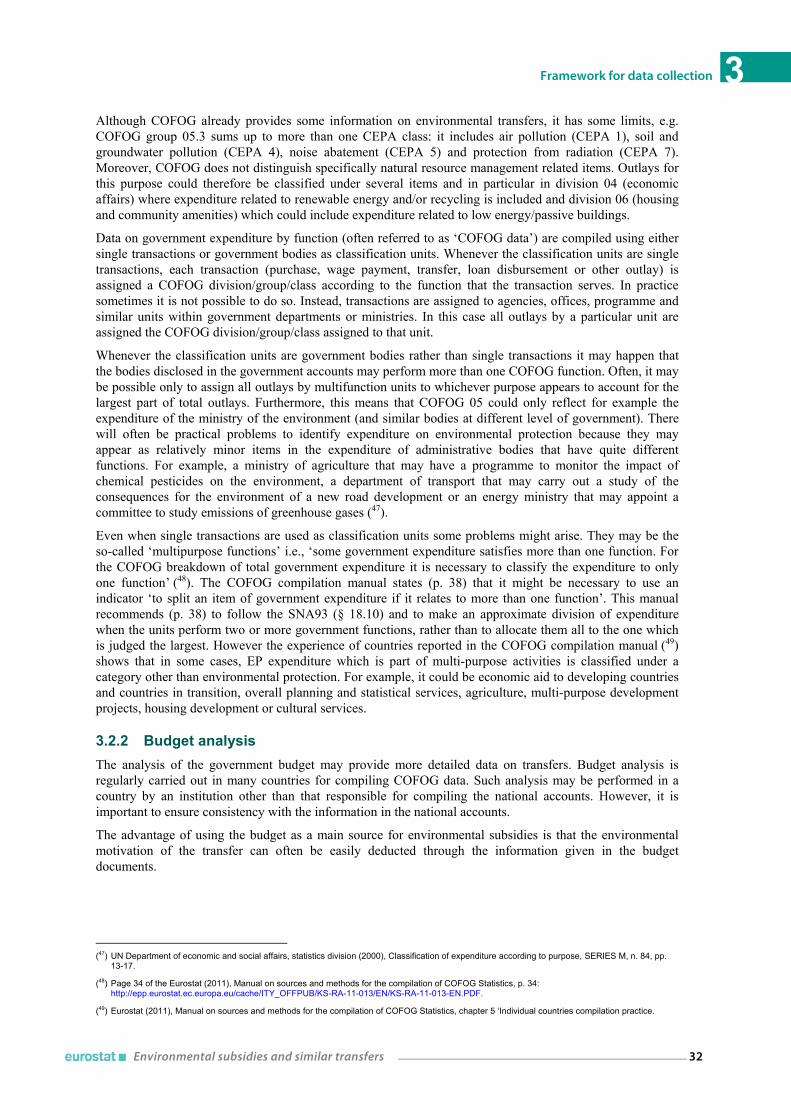
Environmental subsidies and similar transfers 32
Framework for data collection 3 Although COFOG already provides some information on environmental transfers, it has some limits, e.g. COFOG group 05.3 sums up to more than one CEPA class: it includes air pollution (CEPA 1), soil and groundwater pollution (CEPA 4), noise abatement (CEPA 5) and protection from radiation (CEPA 7). Moreover, COFOG does not distinguish specifically natural resource management related items. Outlays for this purpose could therefore be classified under several items and in particular in division 04 (economic affairs) where expenditure related to renewable energy and/or recycling is included and division 06 (housing and community amenities) which could include expenditure related to low energy/passive buildings.
Data on government expenditure by function (often referred to as ‘COFOG data’) are compiled using either single transactions or government bodies as classification units. Whenever the classification units are single transactions, each transaction (purchase, wage payment, transfer, loan disbursement or other outlay) is assigned a COFOG division/group/class according to the function that the transaction serves. In practice sometimes it is not possible to do so. Instead, transactions are assigned to agencies, offices, programme and similar units within government departments or ministries. In this case all outlays by a particular unit are assigned the COFOG division/group/class assigned to that unit.
Whenever the classification units are government bodies rather than single transactions it may happen that the bodies disclosed in the government accounts may perform more than one COFOG function. Often, it may be possible only to assign all outlays by multifunction units to whichever purpose appears to account for the largest part of total outlays. Furthermore, this means that COFOG 05 could only reflect for example the expenditure of the ministry of the environment (and similar bodies at different level of government). There will often be practical problems to identify expenditure on environmental protection because they may appear as relatively minor items in the expenditure of administrative bodies that have quite different functions. For example, a ministry of agriculture that may have a programme to monitor the impact of chemical pesticides on the environment, a department of transport that may carry out a study of the consequences for the environment of a new road development or an energy ministry that may appoint a committee to study emissions of greenhouse gases (47).
Even when single transactions are used as classification units some problems might arise. They may be the so-called ‘multipurpose functions’ i.e., ‘some government expenditure satisfies more than one function. For the COFOG breakdown of total government expenditure it is necessary to classify the expenditure to only one function’ (48). The COFOG compilation manual states (p. 38) that it might be necessary to use an indicator ‘to split an item of government expenditure if it relates to more than one function’. This manual recommends (p. 38) to follow the SNA93 (§ 18.10) and to make an approximate division of expenditure when the units perform two or more government functions, rather than to allocate them all to the one which is judged the largest. However the experience of countries reported in the COFOG compilation manual (49) shows that in some cases, EP expenditure which is part of multi-purpose activities is classified under a category other than environmental protection. For example, it could be economic aid to developing countries and countries in transition, overall planning and statistical services, agriculture, multi-purpose development projects, housing development or cultural services.
3.2.2 Budget analysis The analysis of the government budget may provide more detailed data on transfers. Budget analysis is regularly carried out in many countries for compiling COFOG data. Such analysis may be performed in a country by an institution other than that responsible for compiling the national accounts. However, it is important to ensure consistency with the information in the national accounts.
The advantage of using the budget as a main source for environmental subsidies is that the environmental motivation of the transfer can often be easily deducted through the information given in the budget documents.
(47) UN Department of economic and social affairs, statistics division (2000), Classification of expenditure according to purpose, SERIES M, n. 84, pp.
13-17.
(48) Page 34 of the Eurostat (2011), Manual on sources and methods for the compilation of COFOG Statistics, p. 34: http://epp.eurostat.ec.europa.eu/cache/ITY_OFFPUB/KS-RA-11-013/EN/KS-RA-11-013-EN.PDF.
(49) Eurostat (2011), Manual on sources and methods for the compilation of COFOG Statistics, chapter 5 ‘Individual countries compilation practice.

Environmental subsidies and similar transfers 33
Framework for data collection 3 The disadvantage of budget analysis lies in the huge amount of information (budget lines) to be checked. Furthermore, whenever budget lines do not have sufficient information, other sources are to be used to find out the underlying purpose for each budget line. These complementary sources are ministries’ reports, government budget texts or legislative texts. Another problem is that budget documents may not classify the budget items following the national accounts conventions and definitions (e.g. subsides, other current transfers or capital transfers, etc.). Finally the budget lines may record budgetary commitments i.e., intended payments instead of actual payments. These differences have to do both with the size of payments and their timing.
The information from analyses of the government budget will look different in every country. In countries where an institution is in charge of a centralised budget analysis and maintains a database it may be a good source of data. It is important that the information is consistent with national accounts.
COUNTRY EXAMPLE: SWEDEN
In Sweden the Swedish National Financial Management Authority is responsible for the yearly analysis of the result of the government budget. This is also the source used for the government finance statistics in the national accounts. If this information was to be taken from national accounts after it has been processed, rather than from the source of information, it would not have been detailed enough to see if a payment is environmentally motivated or not, or in order to further classify it by CEPA and CReMA. However, when using the background material directly from the Swedish National Financial Management Authority the name of the budget line from the dataset provides enough information to determine the environmental relevance: sometimes, using only the name of the budget line, other times with help from reading the budget documents. The background data comes from the central government accounting system, called ‘HERMES’. The National Financial Management Authority is responsible for the development and administration of this system. In Sweden it is also the Swedish National Financial Management Authority that classifies the budget lines according to COFOG divisions/groups/classes, with the agreement of national accountants. When a new authority or budget line arises the two actors classify the respective transaction to COFOG together. The information used to classify each budget line to COFOG is the State budget and the description there.
3.2.3 Other useful information from national accounts The ESA 2010 Transmission Programme Table 8 might be useful in combination with Table 11 in order to estimate a breakdown by the institutional sector of the beneficiary of the subsidies/transfers. Table 7 (see next page) shows a few rows from ESA 2010 Transmission Programme Table 8 that could be of interest for the compilation of environmental subsidies and similar transfers statistics.

Environmental subsidies and similar transfers 34
Framework for data collection 3 Table 7: ESA 2010 Transmission Programme Table 8 — Non-financial accounts by sector — annual (extract relevant for environmental subsidies and similar transfers)
Transactions and balancing items Sectors
S.1 S.11 S.11001 S.12 S.12001 S.13 S.14+S.15 S.14 (1) S.15 (1) S.1N S.2
Total Economy
Non-financial corporations
Public non-financial
corporations
Financial corporations
Public financial
corporations
General government
Households + non-profit institution serving
households
Households
Non-profit institution serving
households
Not sectorised
Rest of the
world
II.1.1 Generation of income account
Resources D.3 Subsidies X X 0 X 0 X X X X X D.31 Subsidies on products X X D.39 Other subsidies on production X X 0 X 0 X X X X II.1.2 Allocation of primary income account
Uses D.3 Subsidies X X X D.31 Subsidies on products X X X D.39 Other subsidies on production X X X II.2 Secondary distribution of income account
Resources
D.62 Social benefits other than social transfers in kind X X X X
D.632 Social transfers in kind — purchased market production 0 0 0 0
D.7 Other current transfers X X 0 X 0 X X X X X
Uses
D.62 Social benefits other than social transfers in kind X X 0 X 0 X X X X X
D.632 Social transfers in kind — purchased market production 0 X 0 0
D.7 Other current transfers X X 0 X 0 X X X X X

Environmental subsidies and similar transfers 35
Framework for data collection 3 Table 7 (continuing): ESA 2010 Transmission Programme table 8 — Non-financial accounts by sector — annual (extract relevant for environmental subsidies and similar transfers)
Transactions and balancing items Sectors
S.1 S.11 S.11001 S.12 S.12001 S.13 S.14+S.15 S.14 (1) S.15 (1) S.1N S.2
Total Economy
Non-financial corporations
Public non-financial
corporations
Financial corporations
Public financial
corporations
General government
Households + non-profit institution serving
households
Households
Non-profit institution serving
households
Not sectorised
Rest of the
world
III.1.1 Change in net worth due to saving and capital transfers account
Changes in liabilities and net worth
D.9r Capital transfers, receivable X X 0 X 0 X X X X X
Changes in assets
D.9p Capital transfers, payable X X 0 X 0 X X X X X
(1) Data for S14 and S15 for reference years before 2012 to be transmitted on a voluntary basis. Transmission is compulsory for reference years from 2012 onwards. 0 voluntary X required Grey area — not relevant

Environmental subsidies and similar transfers 36
Framework for data collection 3 In order to fill in these tables, national accountants must first analyse a large number of primary data sources, among which government accounts (which could contain also the information on government expenditure by function described above) and budgets. Usually national accounts build up intermediary databases from government budgets and accounts. These databases contain much more information than published in the tables. Thus, whenever possible, it is suggested to search for the data underlying the ESA Transmission Programme tables in order to compile data on environmental subsidies. It allows a better identification of environmental protection subsidies.
3.2.4 Other data sources Beside national accounts and government budgets, other data sources could also provide useful information. The sources included here mainly concern subsidies and similar transfers and as well tax abatements since they can be recorded as memo items in the reporting tables.
Administrative registers and databases on state aid in general or on particular forms of government support could have useful information about environmental subsidies and other transfers. If only totals are given they can be used for cross checking the subsidy data of the national accounts. The other data sources included in these guidelines are:
— International data sources;
— Databases;
— Data sources for tax abatements.
International data sources
Official development assistance (ODA)
ODA is reported internationally and is the key measure used in practically all aid targets (50). In Norway there are ODA data by purpose which could be a source for determining the environmental part of the official aid.
State aid reported to EU, OECD and WTO
In the European Union, State aid policy is regulated by the Treaty on the Functioning of the European Union (TFEU). Member States must collect data on state aid and report them to the European Commission. This source could contain more information on transfers by beneficiary and be used in order to allocate transfers to industries (e.g. in Sweden). It may also provide information that is useful to allocate transfers to environmental domains. Furthermore, all countries must report their tax abatements as state aid.
However this source has limitations for subsidies and similar transfers statistics due to the different coverage between the state aid concept and the environmental transfers (state aid includes ‘other support measures’ as explained in section 1). Moreover only aid to corporations above a certain threshold is included in the reports.
COUNTRY EXAMPLE: SWEDEN
In Sweden the authority called ‘Growth analysis’ has the responsibility to collect each year the information on state aid for the Ministry of Enterprise. This is carried out in February each year by a survey. The last response is in May and the delivery to the Ministry is in June. The last day for the Swedish Ministry of Enterprise to send in to the European Commission (Directorate General for Competition – DG COMP) is end July. The survey is sent to all relevant authorities who paid out support. The survey is web-based from 2013 onwards. For Sweden the amount is around billion 21 SEK (for all state aid to enterprises), of which 85% represent tax reductions. Information on tax reductions could be taken from the Ministry of Finance which in Sweden calculates the Swedish tax subsidies based on a reference tax for every budget. The Ministry of Enterprise sends information on state aid not only to DG COMP, but also to WTO and OECD based on this data.
(50) http://www.oecd.org/dac/stats/officialdevelopmentassistancedefinitionandcoverage.htm.

Environmental subsidies and similar transfers 37
Framework for data collection 3 Analyses of the EU budget
Relevant information for environmental subsidies can also be found in the EU budget. This data source could be investigated and used as source of information for specific areas of interest, as for example the agricultural support. The total values in the EU budget could also be used for cross checking totals for some expenditure areas, as for example, energy, agriculture and environment. In particular, expenditure on agriculture, rural development and regional support are areas of interest for environmental subsidies and similar transfers.
Contributions from the Member States to the EU budget for the third (VAT based) and fourth (GNI based) own resources i.e. types of payments to the EU budget are not environmentally earmarked. They should therefore not be part of environmental transfers. This has to be taken into account when interpreting figures of transfers paid by general government (environmental transfers paid by the EU but financed by non-earmarked contributions from general governments).
Economic accounts for agriculture
The Economic Accounts for Agriculture (EAA) provide detailed information on income in the agricultural sector. The purpose is to analyse the production process of the agricultural industry and the primary income generated by this production. The EAA accounts, among others for the subsidies on production. The recording of such transfers should follow the guidelines as set out in ESA. Current transfers made by EU institutions directly to market producers are recorded as paid by the rest of the world (ROW) and received by producers. The beneficiaries can be general government or non-government units and transfers should be recorded as received by the final beneficiary. Subsidies are generally recorded according to the accrual principle: payments made by general government in advance of EU cash receipts being financial transactions in accounts receivable/payable. ESA sets out that co-financed government expenditure transfers are recoded when the EU authorisation is given.
Data databases available at national level
There may also be databases and registers of micro data of interest. However compiling statistics from these data sources is rather time consuming. In some countries a centralised database of all support measures given by the government may exist. Some institutions (ministries, agencies, etc.) may have databases on beneficiaries they support. Databases of producers of environmental products could also be possibly used as they could be beneficiaries of environmental subsidies and similar transfers. Such micro-data can be very useful for allocating environmental subsidies. These institutions may also publish useful annual reports.
COUNTRY EXAMPLES: THE MICRO-DATA IN THE NETHERLANDS AND DATABASE ON STATE AID MEASURES IN AUSTRIA
In the Netherlands it is possible to use data collected at the level of individual subsidy schemes via the agencies responsible for executing subsidy schemes. In a second step, these micro-data can be linked to the business register. However, studies have shown the limits of such a method. Only using micro data to compile statistics on environmental subsidies was labour intensive and it was difficult to identify the type of transfer (current or capital) appeared. On the other hand the use of micro data makes it easier to split the subsidies to environmental domain (51). In Austria a centralised database on state aid measures is currently being implemented.
Data sources for tax abatements
Tax abatements are a difficult area in terms of international comparisons. The monetary value of tax abatements depends on the taxation structure in the country of analysis. A country with high environmental taxes is more likely to also have exemptions and differentiated tax rates. This is important to bear in mind when comparative analyses are made. Given the importance of abatements in some countries, these guidelines recommend considering national tax abatements and reporting them as memorandum items in the data collection on environmental subsidies and similar transfers.
(51) Statistics Netherlands, 2009, Environmental Accounts of the Netherlands 2009, (also published 2010 and 2011) - http://www.cbs.nl/en-
GB/menu/themas/natuur-milieu/publicaties/publicaties/archief/2013/default.htm.

Environmental subsidies and similar transfers 38
Framework for data collection 3 Several data sources are available depending on the focus of the estimation. One data source for tax abatements is the state aid reporting to the European Commission. Another source is government budgets where such information is given (e.g. Sweden, the Netherlands (52) and France (53) — where the ministries of finance publish data on tax abatements annually).
3.3 Compilation methods for environmental subsidies and similar transfers
3.3.1 Identification of environmental subsidies and similar transfers using COFOG statistics
The ideal solution is to have a code with the environmental dimension in the existing COFOG databases.
In most countries the national statistical offices (national accounts units) are responsible for the compilation of COFOG statistics. In some others (e.g. Denmark and Belgium), departments for Public Finances or from the National Bank are cooperating with national accountants to produce COFOG statistics. However, the way transactions are classified by government function in COFOG as well as the data source used differs across countries.
In order to classify government expenditure according to function information of the use of the expenditure is required. Environmental accountants may face two different situations:
— A detailed COFOG database exists and it can be used directly by environmental accountants;
— No detailed COFOG database exists (or is not available) but COFOG compilers can help environmental accountants flagging environmentally relevant transfers when they classify expenditure by functions.
If a database is available including background COFOG information usable to determine the function, the same information can most likely be also used to determine the purpose and motive of the environmental subsidies and similar transfers. Such a database may be based on the government budget data used to classify each transaction to one function of government.
If no such database exists, or if there is no access to such information, a closer collaboration would probably be required aiming that COFOG compilers flag the budget lines potentially relevant for their environmental accounts colleagues. The environmental accountants would then do a detailed analysis of the flagged items.
Suggested method for breakdown of COFOG data source
If the COFOG databases are well structured and contain relevant titles/codes, the environment accounts could identify environmental transfers by the means of a keyword search. Keywords can also be used in a COFOG dataset if relevant expenditure codes can be selected and transactions flagged for their use in environmental accounts. Each ‘flagged’ transaction will need further investigation since some keywords are open and could identify environmental subsidies but as well subsidies potentially damaging for the environment. The examples given below are mainly based on both the CEPA and CReMA classifications.
(52) Statistics Netherlands, 2010, Final report on environmental subsidies and transfers. – See ‘Catalogue of pilot studies reports related to
environmental accounts ‘on Eurostat website: http://epp.eurostat.ec.europa.eu/portal/page/portal/environmental_accounts/documents/Catalogue-of-pilot-study-reports-07-07-2014.xls.
(53) http://www.performance-publique.budget.gouv.fr/sites/performance_publique/files/farandole/ressources/2015/pap/pdf/VMT2-2015.pdf.

Environmental subsidies and similar transfers 39
Framework for data collection 3 EXAMPLE OF KEYWORDS TO BE USED IN FLAGGING ENVIRONMENT IN COFOG DATA
Government budget keywords: environment, environmental, eco, energy-efficient, renewable, energy technology, energy investment, electricity, nature, solar, sun, wind, wave, climate, energy research, sustainable, pollution, preserve, congestion, fuels, Inspire Directive themes (54).
CEPA and CReMA classification keywords: protection, air, climate, waste, water, soil, groundwater, surface water, noise, vibration, biodiversity, landscape, radiation, environmental, environment, forest, flora, fauna, energy, renewable, energy saving, heat saving, raw materials, fossil, minerals.
COUNTRY EXAMPLE: DENMARK
The Department for Public Finances in Denmark is responsible for the COFOG compilation. The national accounts department cooperate with the Public Finances, regarding for example the taxes and subsidies. In the classification process the department for Public Finances uses the name of the budget line in the state budget. Only if the name is not clear enough they go into the budget and read more information about the purpose of the budget lines and if necessary they could also look at the webpage of the authority responsible for the payment. In 2013 Denmark completed a pilot project: Denmark is as a result planning to extend the COFOG with an environmental dimension, as a second layer in the future.
Identifying the environmental subsidies and similar transfers is not an easy task. Some transfers have a clear environmental dimension but others don’t. Additional sources may be necessary to learn more about the transfer. An example of such a source is a government budget and accompanying document where the budget lines are described in detail. In some cases it may be necessary to find additional explanations from legislation. For some expenditure it may be relevant to only extract a share of it as environmental, for example regarding agricultural support and foreign aid.
Guidance on the selection of environmental transfers is needed in order to increase coherence across countries. The list of special cases shown in Table 8 is an example of such guidance. This list needs to be revised and updated regularly by the relevant task force or working group after countries’ increased experience in the area of environmental subsidies and similar transfers.
(54) http://inspire.ec.europa.eu/index.cfm/pageid/2/list/7.

Environmental subsidies and similar transfers 40
Framework for data collection 3 Table 8: List of special cases, environmental subsidies and similar transfers
Energy To be included: subsidies for biofuels, for renewable energy research, for energy efficiency and saving(CReMA 13) Not to be included: nuclear energy subsidies
Agriculture To be included: subsidies for compensating the costs of environmental measures, eco-labelling, greening measures, subsidies received for organic farming activities (CEPA 4) Not to be included: social parts in the rural and development programme, subsidies with primary focusto support incomes and employment in conventional farming
Biodiversity To be included: measures to re-introduce wild fauna and flora species in cultivated and uncultivatedforests; subsidies for rebuilding natural fish stocks in lakes, rivers and seas (CReMA 12 and CEPA 6) Not to be included: subsidies for the plantation of trees for timber production in cultivated forests; subsidies for building-up fish-stocks for catch beyond the natural resource level
Foreign aid To be included: aid with primary environmental purposes, e.g. aid for vegetal cover to increaseinfiltration of rainwater (CEPA 4) Not to be included: aid with primary nutritional purpose, e.g. aid for planting draught resistant foodplants in arid climates even if it has a positive side-effect on rainwater infiltration and water resources
Protection of ambient air and climate
To be included: support for investments that aim at reducing GHG emissions, subsidies for climaterelated research, subsidies to municipalities for their CO2-emission reducing projects (CEPA 1, CEPA 8 and CEPA 9) Not to be included: subsidies for public transport even it has a positive side-effect on reducing GHG emissions
Transport-related
To be included: R&D subsidies for cars with alternative (e.g. hydrogen powered) or fuel saving motorand gear concepts aimed at reducing air emissions or the depletion of energy resources (CEPA 8 and/or CEPA 1) Not to be included: subsidies paid to producers of public transport equipment with primary focus to support employment in this industry (even if lower prices for such equipment can have positive side-effects on the environment), subsidies for public transport (even if it can have positive side-effects on the environment)
Note: subsidies to arctic areas or to mitigation of natural disasters (e.g. floods, storms) could be added to the table (if part of CEPA or CReMA).
3.3.2 Environmental shares Following the SEEA CF 2012 (§ 4.140 to 4.143): ‘in principle, a decision as to whether the primary purpose of a transfer is environmental should be made for each individual transfer. Then, once a decision on the primary purpose has been made, the total value of the transfer is treated as being for that primary purpose.’
In practice, information on government transfers is usually reported in the budget and other government expenditure data. Generally, these data do not show individual transactions but information by type of government program thus including a large number of individual transfers. Usually such programs have multiple purposes and hence determining the number and value of individual transfers that have a primary purpose of environmental protection or resource management may require additional information. In these cases, it may be necessary to estimate the share of the value of transfers for a given government program that reflects the value of individual transfers within the program that have environmental protection or resource management as their primary purpose.
The primary purpose principle should be used for single transfers. The information available in the underlying data sources for national accounts data is often sufficient to identify the primary purpose. A single transfer whose primary purpose is environmental should be fully included. If an environmental subsidy is part of a larger measure/programme which is not entirely environmental a share is to be estimated, often requiring extra information, for example full analysis of budget line, direct contacts with the agency or department responsible for the implementation of the programme, etc. Depending on the extra research needed the burden could be high.
In a few cases, the data source for subsidies and similar transfers may not be detailed enough to identify the environmental part. In such cases a share of the total expenditures must be estimated. Examples are identifying the part of the environmentally related international aid out of the total international aid or the part of the environmental support out of the total agricultural support.

Environmental subsidies and similar transfers 41
Framework for data collection 3 For agricultural support the data may not be detailed enough to identify all environmental supports in the larger group of agricultural support.
COUNTRY EXAMPLE: SWEDEN
In Sweden there is a budget line for the whole rural and development programme. The environmental supports need to be separated from the rest of this programme (the programme also involves social and employment purposes). The calculated share is based on the data used to produce the Economic Accounts for Agriculture (EAA). This table is produced by the Swedish Board of Agriculture each year and it allows seeing how much is paid for environmental support. This is used to calculate a share which is then applied to the total subsidies and similar transfers paid from the total budget line.
Most countries do not have a position called environmental aid in their state budget. To identify the environmental part of the aid it is necessary to use a share. It may be possible to calculate it if the official development aid is reported by purpose. Another source would be the state budget if it identifies the aid given for environmental reason.
COUNTRY EXAMPLE: SWEDEN
In Sweden, the Swedish International Development Cooperation Agency (SIDA) produces an environmental publication each year as part of their annual report work. This publication gives information about the amount of aid given for a principal environmental objective. There is also information about the amount of aid paid out with a significant environmental objective which is a lot higher. Only the aid paid having a principal environmental objective, that is the primary objective, is used to calculate a share. This environmental share is applied to the total amount of subsidies and similar transfers paid out as aid from the SIDA authority.
3.3.3 Breakdown of environmental subsidies and similar transfers by type of transfer
Information on the type of transfer (current or capital transfer) will be generally given when national accounts are used as a data source. The breakdown of current transfers into D3, D6, D7 and of capital transfers into D92 and D93 may be interesting; however the first priority is the breakdown into current and capital transfers.
3.3.4 Breakdown of environmental subsidies and similar transfers by environmental domain
Whenever possible, background data used for the compilation of COFOG should be analysed to seek any information useful for a more accurate classification by environmental domain. If the background information is not enough the budget could be analysed at least for the most important transfers. Additional information on the environmental domains could be obtained from the agencies responsible for the transfers.
Establishing the correspondence between the actual environmental domain from CEPA and the COFOG codes could be difficult if they are not detailed. This is the case of COFOG 05.3 — pollution abatement, which includes the following CEPA classes: protection of ambient air and climate (CEPA 1), protection and remediation of soil, groundwater and surface water (CEPA 4), noise and vibration abatement (CEPA 5) and protection against radiation (CEPA 7).

Environmental subsidies and similar transfers 42
Framework for data collection 3 Table 9: Correspondence between COFOG 05 and CEPA
COFOG 05 CEPA 2000
05.1.0 Waste management 3 Waste management
05.2.0 Wastewater management 2 Wastewater management
05.3.0 Pollution abatement 1 Protection of ambient air and climate
4 Protection and remediation of soil groundwater and surface water
5 Noise and vibration abatement
7 Protection against radiation
05.4.0 Protection of biodiversity and landscape 6 Protection of biodiversity and landscape
05.5.0 Research and development for environment protection
8 Research and development
05.6.0 Environment protection n.e.c. 9 Other environmental protection activities
Source: Eurostat (2011), COFOG manual, p. 54
3.3.5 Breakdown of subsidies and similar transfers by payers and beneficiaries A breakdown of the environmental subsidies by industry is needed to analyse e.g. the links to the level of emissions by certain industries, to emission permits or environmental taxes. However, in most countries, a NACE Rev. 2 — A64 breakdown is too detailed. In general, identifying the beneficiaries from available sources such as national accounts published data and background data sources is very difficult or can be done only at very aggregated level, as for example by institutional sector.
Environmental subsidies and similar transfers could take place between units in the same aggregated sector (general government and its subsectors). In such case there might be a need to remove, from both uses and resources, the environmental subsidies and similar transfers that occur between units in the same aggregated sector. This removal from both uses and resources is called consolidation.
However, ESA 2010 § 1.107 recommends that ‘as a matter of principle, flows and stocks between constituent units within subsectors or sectors must not be consolidated’. ESA 2010 § 1.108 also mentions that ‘consolidated accounts may be built up for complementary presentations and analyses. Information on the transactions of such (sub) sectors with other sectors and the corresponding ‘external’ financial position may be more significant than overall gross figures.’ These guidelines recommend reporting data on environmental subsidies and similar transfers non-consolidated. Non-consolidated data may be more significant than the overall gross figures (consolidated) and are considered (ESA §1.109) ‘very useful for understanding the channels through which the financing surpluses move from final lenders to final borrowers’.
For complementary purposes and analysis, figures could be consolidated afterwards.
In most cases the data from the national accounts will identify the type of transfer but not the NACE code. One method to allocate to industries is to use existing information from the budget data. It is possible that transfers are registered by beneficiary in the government budget, albeit very broadly e.g. if the beneficiaries are households, international beneficiaries, municipalities or enterprises. If such division is available only the transfers to producer units would have to be distributed to the correct NACE.
Some prior knowledge could facilitate the allocation to beneficiaries, even if verification is nevertheless needed. For example, subsidies are usually received by the business sector. It could be of interest to have a look in particular at subsidies to public corporations and quasi-corporations, as they often carry out activities in the environmental protection field.
Usually the current transfers within general government (D73) are received by local governments; current international cooperation, development aid (D74) by foreign governments and/or international organisations, while miscellaneous current transfers (D75) by the NPISH.

Environmental subsidies and similar transfers 43
Framework for data collection 3 Investment grants are often received by the business sector, whereas other capital transfers can be received also by households or local governments.
However an analysis of the documents is needed in order to get precise data. Budget analysis is therefore a valuable source to know the institutional unit and the particular NACE code of the actors receiving the environmental transfers.
It should however be noticed that budget documents do not always mention the receiving institutional sector.
The ESA 2010 TP Table 8 ‘Non-financial accounts by sector’ provides information that may be useful in order to produce estimates in a breakdown by the beneficiary of the subsidies/transfers.
Depending on the data source it could be difficult to identify precisely the beneficiary. Distribution keys should therefore be used to estimate amounts received by particular institutional sectors. It is the case for example of the funding for exhaust filters for particulates. In this case, the levels of fuel use per transport mode, vehicle category and fuel type can be used in order to estimate relevant keys of distribution.
COUNTRY EXAMPLE: SWEDEN
A pilot study in 2010 (55) in Sweden made a first attempt to distribute the environmental subsidies and similar transfers to NACE. The method used followed this principle:
1 The background material gave information on households, foreign beneficiaries and municipalities where the distribution was made.
2 If the national accounts had distributed the budget line by NACE (if D3 was paid out), then the same NACE was used also for D6, D7 and D9 code transfers.
3 Some of the larger subsidies, such as the ones for energy research and renewable energy, were analysed in depth. The authorities administrating the subsidies were asked to provide the register that included information about each beneficiary. Then, the environmental transfers were attributed using the predominance principle, to the largest beneficiary NACE.
4 To identify some of the smaller subsidies it was sometimes enough to read the state budget looking for guiding examples or to read the table of contents.
When time was invested in the work of distributing all subsidies for the first time, larger subsidies were given more focus than the smaller.
COUNTRY EXAMPLE: DENMARK Denmark made a study in 2013 to distribute the environmental subsidies and similar transfers by NACE Rev.2.
(55) http://www.scb.se/statistik/_publikationer/MI1301_2010A01_BR_MI71BR1002.pdf
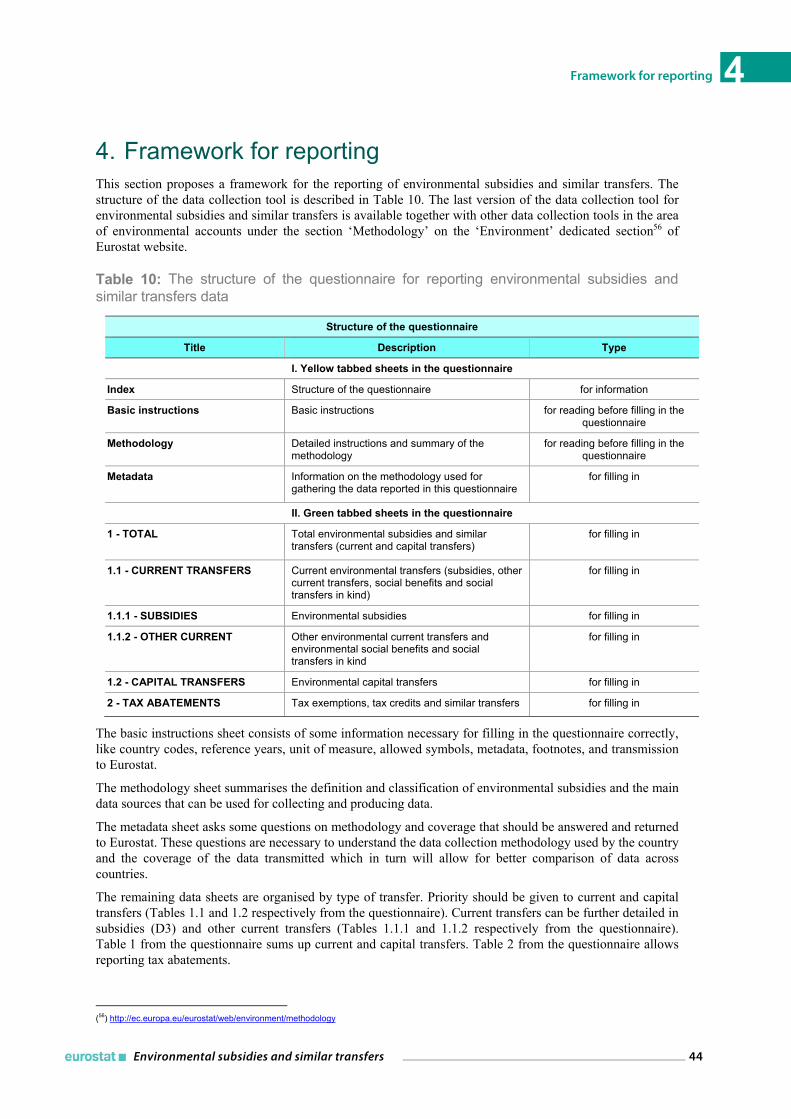
Environmental subsidies and similar transfers 44
Framework for reporting 4
4. Framework for reporting This section proposes a framework for the reporting of environmental subsidies and similar transfers. The structure of the data collection tool is described in Table 10. The last version of the data collection tool for environmental subsidies and similar transfers is available together with other data collection tools in the area of environmental accounts under the section ‘Methodology’ on the ‘Environment’ dedicated section56 of Eurostat website.
Table 10: The structure of the questionnaire for reporting environmental subsidies and similar transfers data
Structure of the questionnaire
Title Description Type
I. Yellow tabbed sheets in the questionnaire
Index Structure of the questionnaire for information
Basic instructions Basic instructions for reading before filling in the questionnaire
Methodology Detailed instructions and summary of the methodology
for reading before filling in the questionnaire
Metadata Information on the methodology used for gathering the data reported in this questionnaire
for filling in
II. Green tabbed sheets in the questionnaire
1 - TOTAL Total environmental subsidies and similar transfers (current and capital transfers)
for filling in
1.1 - CURRENT TRANSFERS Current environmental transfers (subsidies, other current transfers, social benefits and social transfers in kind)
for filling in
1.1.1 - SUBSIDIES Environmental subsidies for filling in
1.1.2 - OTHER CURRENT Other environmental current transfers and environmental social benefits and social transfers in kind
for filling in
1.2 - CAPITAL TRANSFERS Environmental capital transfers for filling in
2 - TAX ABATEMENTS Tax exemptions, tax credits and similar transfers for filling in
The basic instructions sheet consists of some information necessary for filling in the questionnaire correctly, like country codes, reference years, unit of measure, allowed symbols, metadata, footnotes, and transmission to Eurostat.
The methodology sheet summarises the definition and classification of environmental subsidies and the main data sources that can be used for collecting and producing data.
The metadata sheet asks some questions on methodology and coverage that should be answered and returned to Eurostat. These questions are necessary to understand the data collection methodology used by the country and the coverage of the data transmitted which in turn will allow for better comparison of data across countries.
The remaining data sheets are organised by type of transfer. Priority should be given to current and capital transfers (Tables 1.1 and 1.2 respectively from the questionnaire). Current transfers can be further detailed in subsidies (D3) and other current transfers (Tables 1.1.1 and 1.1.2 respectively from the questionnaire). Table 1 from the questionnaire sums up current and capital transfers. Table 2 from the questionnaire allows reporting tax abatements.
(56) http://ec.europa.eu/eurostat/web/environment/methodology

Environmental subsidies and similar transfers 45
Framework for reporting 4 Data sheets ask first to report transfers by the paying entity (general government). Then transfers data by receiving entity should be filled in, with the following breakdown by institutional sector: corporations, government’s subsectors, households, NPISH and the rest of the world. The total of transfers paid out should be equal to the total of transfers received by these sectors. Data on environmental subsidies and similar transfers should be reported non-consolidated. Finally each sheet allows detailing the receiving entities by economic activities using the NACE A*10+ breakdown as described in chapter 2.
Countries are asked to break down transfers by environmental and resource domains following the CEPA and CReMA classifications. The correspondence between COFOG and CEPA for environmental protection is given in the heading of the columns. Although transfers can be reported using the aggregation level of CEPA as expressed by COFOG 05, the tables also give the possibility of further detailing COFOG 05.3 by singling out CEPA 1, 4, 5 and 7. For resource management (e.g. recycling activities) can be reported under one heading or split by the respective CReMA 14, parts of CReMA 11 and 13B. CReMA 12 (management of wild flora and fauna) are to be reported with CReMA 16 (other resource management activities).
Environmental protection transfers are required in the EPE module of the amended Regulation (EU) No 691/2011by type of producers/consumers of environmental protection services as defined in Section 2 of the amended Regulation (EU) No 691/2011 and by classes of the classification of environmental protection activities (CEPA) grouped as described in section 5 of the amended Regulation (EU) No 691/2011. The type of producers/consumers of environmental protection services as defined in Section 2 of the amended Regulation (EU) No 691/2011 are: general government (including non-profit institutions serving households) and corporations as institutional sectors producing environmental protection services; households, general government and corporations as consumers of environmental protection services and the rest of the world as beneficiary, or origin, of transfers for environmental protection. The classes of the classification of environmental protection activities (CEPA) grouped as described in section 5 of the amended Regulation (EU) No 691/2011 are:
— For general government activities and for environmental protection transfers: CEPA 2, CEPA 3, sum of CEPA 1, CEPA 4, CEPA 5 and CEPA 7, CEPA 6, sum of CEPA 8 and CEPA 9;
— For ancillary activities of corporations: CEPA 1, CEPA 2, CEPA 3, sum of CEPA 4, CEPA 5, CEPA 6, CEPA 7, CEPA 8 and CEPA 9;
— For corporations as secondary and specialist producers: CEPA 2, CEPA 3, CEPA 4;
— For households as consumers: CEPA 2 and CEPA 3.

Environmental subsidies and similar transfers 46
Use of environmental transfers data 5
5. Use of environmental transfers data This chapter gives some examples for demand and use of environmental subsidies and similar transfers data.
5.1 Demand for environmental subsidies statistics The demand for statistics on environmental subsidies and similar transfers at national and EU level is supported by the EU 7th Environment Action Program (EAP) — ‘Living well, within the limits of our planet’, the renewed EU Sustainable Development Strategy, as well as by the Europe 2020 Strategy.
The EU 7th EAP is an EU Directive which calls the European Commission to ensure the monitoring of the implementation of relevant elements in the context of the regular monitoring process of the Europe 2020 Strategy. From a national point of view, the 7th EAP also binds national governments to take appropriate legislative measures to accommodate with implementing its provisions. The 7th EAP highlights that the process should make use, alongside with the European Environment Agency's indicators on the state of the environment, of ‘indicators used to monitor progress in achieving existing environment and climate-related legislation and targets such as the climate and energy targets, biodiversity targets and resource efficiency milestones’. Priority actions 5 and 6 are relevant for developing statistics on environmental subsidies and similar transfers. These priorities mention, on the one hand the need for continuous investment ‘to ensure that credible, comparable and quality-assured data and indicators are available and accessible to those involved in defining and implementing environmental policy ‘and on the other hand the increase in ‘public and private sector funding for environment and climate-related expenditure’. Moreover, these priorities are complemented by the need to phase out EHS and to consider fiscal measures supporting use of sustainable resources. The 7th EAP is building on policy initiatives in the Europe 2020 strategy.
Europe 2020 is the EU growth strategy for the present decade. Member States have committed to the Europe 2020 targets and have translated them into national targets and growth-enhancing policies. Every year the European Commission undertakes a detailed analysis of Member States programmes of economic and structural reforms and provides them with recommendations for the next 12-18 months (European Semester).
The European Semester starts when the European Commission adopts its Annual Growth Survey, usually towards the end of the year, which sets out EU priorities for the coming year to boost growth and job creation. Latest documents published by the European Commission are available on the website of Europe 2020 (57).
Thematic summaries facilitate a comparison between Member States and to put the economic challenges they face into a broader context. The summaries cover the main policy themes relevant for the Europe 2020 Strategy. In the 2014 thematic summaries for resource efficiency, climate change and energy, the need for action is expressed towards a ‘higher use of Cohesion funds and innovative financing mechanisms’ that is essential in reaching the national and EU target from the EU.
Statistics on environmental subsidies and similar transfers can be used for monitoring and follow up policies taken towards achieving environmental goals and for evaluating different environmental policy tools. Together with other environmental-economic data, statistics on environmental subsidies and similar transfers can be used to calculate environmental protection and natural resource management expenditure as well as its financing and other indicators related to environmental burden.
Follow up of environmental policy
Statistics on environmental subsidies and similar transfers can be used in environmental performance reviews. They can show, for example, actions taken by countries to reduce the pressure on the environment. They can indicate the society response to environmental pressure in general and can be used for a sustainable development indicator. Information on environmental subsidies and similar transfers can also serve to review policies targeting the development of the market for environmental goods and services.
(57) http://ec.europa.eu/europe2020/making-it-happen/country-specific-recommendations/index_en.htm.

Environmental subsidies and similar transfers 47
Use of environmental transfers data 5 Comparison and evaluation of environmental policy tools (for example environmental taxes)
Data on environmental subsidies and similar transfers support analyses of the economic impact of environmental policy and in particular provide a basis for cost/benefit analyses for new environmental policy proposals. For example environmental subsides can be compared to environmental taxes.
Environmental subsidies, in contrast to environmental taxes, do not put an extra financial burden to activities affecting negatively the environment. These two types of instruments are widely used in environmental policy making.
Calculating environmental protection and natural resource expenditure
There is increasing demand for environmental protection and resource management expenditure data. Environmental subsidies are needed to calculate national expenditure. The EPEA module of the amended Regulation (EU) No 691/2011 on environmental protection expenditure requires for example data of environmental subsidies to be delivered.
Statistics on environmental subsidies and similar transfers can be used to calculate the financing of national expenditure.
5.2 Use of data on environmental subsidies and similar transfers The environmental subsidies and similar transfers can be analysed at different levels, such as:
— Analysis by type of transfer: it provides a picture of the types of governmental action in favour of the environment. Are subsidies paid for investments or for current expenditure most common? Such analyses could be of interest both inside the country as well as between countries.
— Analysis by environmental domain: it indicates the environmental priorities of the countries. Combined with emissions data or production indexes, the actual effect of the subsidisation policies can be evaluated. The result can show if areas covered by environmental taxes are the same as the areas covered by environmental subsidies and may indicate that some areas are better suited for being promoted using taxes and others using subsidies.
— Analysis by beneficiaries: it identifies which sectors, activities or products are considered important at environmental level. It can show if the receiving industries are the same or different from, for example, participants of the emission trade or beneficiaries that have exceptions in the environmental taxes legislation or the NACE.
— Analysis of time series: it shows the time evolution of environmental policies and priorities. It shows if the environmental subsidies paid have increased or decreased, if there has been peaks in the expenditures or if new areas have emerged.
The users of such statistics in the international arena would not only be the EU but also OECD and WTO. The OECD database on instruments used for environmental policy and natural resources management (58) could be updated regularly with these statistics.
5.3 Presenting subsidy data This section provides examples of different ways to present information on environmental subsidies and similar transfers. The information can also be used to calculate and present indicators. It is also possible and more interesting to present the statistics of environmental subsidies together with information from other environmental accounts modules. For instance, environmental subsidies can be related to statistics of environmental pressures or to statistics of other economic instruments as environmental taxes or emission trading. When comparing data from different countries, it is important to choose the right variable to build up meaningful indicators.
(58) The database can be found at: http://www2.oecd.org/ecoinst/queries/index.htm.

Environmental subsidies and similar transfers 48
Use of environmental transfers data 5 This section gives examples of possible analyses and presentation of environmental subsidies statistics. The figures presented in the tables and graphs have been taken from countries studies and publications and have the purpose of illustrating possible data presentations. Numbers given in the figures and tables could be outdated as some of these studies have undertaken revision processes.
5.3.1 Environmental subsidies and similar transfers according to receiving NACE Table 11 uses as example a Danish grant report on ‘Environmental subsidies and similar transfers’ (2013)59. It shows environmental subsidies and similar transfers for the years 2007-2011 broken down by beneficiary industry.
Table 11: Environmental subsidies and similar transfers by industries
2007 2008 2009 2010 2011
Total industries 2,242 2,419 2,509 2,594 2,678
A Agriculture, forestry, fishing 508 509 589 586 613
B Mining and quarrying 2 2 2 2 2
C Manufacturing 111 114 123 123 122
D-E Utility services 17 18 19 19 19
F Construction 15 16 16 17 18
G-I Trade and transport etc. 460 481 502 504 487
J Information and communication 183 192 200 201 193
K Financial and insurance 15 47 49 49 48
LA Real estate; rent of non-residents 5 5 6 6 5
LB Dwellings 6 6 7 7 8
M-N Other business services 82 85 90 90 88
O-Q Public administration, education, health 731 865 824 906 995
R-S Arts, entertainment, other services 77 80 84 84 81
Source: Statistics Denmark, February 2013 ‘Environmental subsidies and similar transfers in the framework of the SEEA CF’, page 22 (grant agreement no. 50904.2011.005- 2011.291); million DKK
5.3.2 Environmental subsidies and similar transfers by environmental domains Environmental subsidies and similar transfers are classified by environmental domains using the CEPA and CReMA classifications. The use of environmental domain classifications allows for better analysis of the policies targeting specific environmental domains. This kind of classification helps to analyse how the focus of policymakers has changed for example showing the shift from air protection (e.g. pollution problems caused by emissions of SO2 and NOx, giving raise to the problem of acid rain) and problems related to waste and wastewater treatment to soil, groundwater and surface water protection and biodiversity protection. Domain classifications also allow crossed analyses with other environmental accounts, for example with environmental protection and resource management expenditure and the EGSS and EPEA.
Table 12 (see next page) is an example of how to present data on environmental transfers by environmental domains.
(59) http://ec.europa.eu/eurostat/documents/1798247/6079569/Catalogue-of-pilot-study-reports-23-04-2015

Environmental subsidies and similar transfers 49
Use of environmental transfers data 5 Table 12: Environmental subsidies and similar transfers by environmental domains 2007-2011 (million DKK)
CEPA/CReMA 2007 2008 2009 2010 2011
Total 3,715 3,960 4,110 4,204 4,225
Total CEPA 3,421 3,638 3,783 3,865 3,877
CEPA 1 70 104 99 116 134
CEPA 2 17 39 23 38 58
CEPA 3 475 493 523 525 513
CEPA 4 34 46 40 47 56
CEPA 5 106 101 100 97 96
CEPA 6 2,565 2,676 2,825 2,846 2,799
CEPA 7 0 0 0 0 0
CEPA 8 0 0 0 0 0
CEPA 9 153 181 174 197 221
Total CReMA 294 322 327 339 348
CReMA 10 85 93 94 98 100
CReMA 11 186 204 207 215 220
CReMA 12 0 0 0 0 0
CReMA 13 0 0 0 0 0
CReMA 14 0 0 0 0 0
CReMA 15 23 26 26 27 28
CReMA 16 0 0 0 0 0
Source: Statistics Denmark, February 2013 ‘Environmental subsidies and similar transfers in the framework of the SEEA CF’, page 19 (grant agreement no. 50904.2011.005- 2011.291)
60
Moreover, environmental subsidies and similar transfers by environmental domain could also be complemented by an analysis by the corresponding COFOG division. Table 13 on the next page presents this kind of analysis:
(60) http://ec.europa.eu/eurostat/documents/1798247/6079569/Catalogue-of-pilot-study-reports-23-04-2015

Environmental subsidies and similar transfers 50
Use of environmental transfers data 5 Table 13: Environmental subsidies and similar transfers by type of transfer, environmental domains and corresponding COFOG division, 2008
Transaction Description of transaction COFOG CEPA/ CReMA
Million DKK
Total Environmental transfers 3,960
Subsidies 3,638
D.31 Subsidies on products 2,998
Subsidy to farms (energy crops) 4 1 13
Subsidy to forests 4 11 170
Subsidy to Public railway 4 1 15
Subsidy to waste management 5 3 492
Subsidy to pollution abatement (particulate matter)
5 1 1
Subsidy to noise abatement 5 5 100
Subsidy to biodiversity 5 6 2,207
D.39 Other subsidies on production 639 Subsidy to farms (nature planning) 4 6 23
Subsidy to forests (afforestation) 4 11 20
Subsidy to fishing (fish care) 4 6 25
Subsidy to Energy (heating) 4 1 1
Subsidy to support to R&D (energy) 4 15 25
Subsidy to waste management 5 3 1
Subsidy to waste water management 5 2 0
Subsidy to pollution abatement (clean tech) 5 1 13
Subsidy to pollution abatement (ground water) 5 4 18
Subsidy to biodiversity (bio farming) 5 6 369
Subsidy to ecology 5 10 92
Subsidy to genetics (crops) 5 11 14
Subsidy to environmental protection (water and nature)
5 9 37
Other current transfers 134
D.61 Social contributions 2
Transfer related to waste management 5 3 1
Transfer related to wastewater management 5 2 1
D.62 Current international cooperation 116
Transfer related to biodiversity and landscape 5 6 24
Transfer related to environment and landscape 5 9 92
D.73 Current transfers within General Government and D.74 Current international cooperation
5
Transfer related to biodiversity and landscape 5 6 1
Transfer related to environment and landscape 5 9 4
D.75 Miscellaneous current transfers
12
Transfer related to pollution abatement (soil) 5 4 2
Transfer related to biodiversity and landscape 5 6 3
Transfer related to environmental protection 5 9 6

Environmental subsidies and similar transfers 51
Use of environmental transfers data 5 Table 13 (continuing): Environmental subsidies and similar transfers by type of transfer, environmental domains and corresponding COFOG division, 2008
Transaction Description of transaction COFOG CEPA/ CReMA
Million DKK
Capital transfers 189
D.9 Investment grants and other capital transfers 189
Transfer related to energy (biofuels) 4 1 11
Transfer related to energy (heat pumps, savings, electric cars) 4 1 18
Transfer related to protection of landscape 4 1 0
Transfer related to waste water management 5 2 38
Transfer related to climate 5 1 31
Transfer related to ground water and soil 5 4 25
Transfer related to biodiver. and landscape (biotopes, coasts) 5 6 25
Transfer related to environmental protection 5 9 41
Source: Statistics Denmark, February 2013 ‘Environmental subsidies and similar transfers in the framework of the SEEA CF’, page 17 (grant agreement no. 50904.2011.005- 2011.291)
61
5.3.3 Environmental subsidies as part of a sector environmental profile Table 14 is an example of how a profile can be made for a sector using economic activity information (output, employment, export, etc.), information on environmental subsidies and similar transfers together with information of other economic instruments (CO2 emissions, environmental taxes and environmental subsidies).
Table 14: Environmental-economic profile for the energy sector, 2008-2011
2007 2008 2009 2010 2011
Energy-related subsidies (million SEK) 1 292 1 263 2086 1 466 1 672
Energy taxes (million SEK) 67 691 69 128 70465 73 619 70 931
Output of renewable energy (million SEK) 93 679 117 223 111 067 117 490 115 766 Employment in the renewable energy sector (gainfully employed) 13 296 13 937 14 328 13 019 12 460
Export of renewable energy (million SEK) 11 177 15 858 14 995 11 609 9 318
CO2 emissions from NACE 35 (million tonnes) 7.2 7.6 9.9 7.8
Source: Statistics Sweden data base (section ‘Environment’, subsection ‘System of Environmental and Economic Accounts’— tables and graphs), data extracted on 23 January 201562
(61) http://ec.europa.eu/eurostat/documents/1798247/6079569/Catalogue-of-pilot-study-reports-23-04-2015.
(62) http://ec.europa.eu/eurostat/documents/1798247/6079569/Catalogue-of-pilot-study-reports-23-04-2015.

Environmental subsidies and similar transfers 52
Annex
Annex: PEDS Table 15 below lists recent studies defining, describing, compiling and estimating PEDS. The table includes the name of the study, country/organisation and year. All studies include PEDS which are recorded in national accounts as government expenditure, and PEDS that are not recorded (e.g. tax credits). In column 3 of the table, ‘based on activities/receiver’ means that the economic activity of the subsidy receiver is relevant for identifying whether the subsidy is harmful. This means that if the activity or the receiver is included in a list of chosen (potentially) harmful activities or receivers the subsidy will be (potentially) harmful. As an example, if fossil fuel is listed as a harmful activity then subsidies to producers or consumers of fossil fuels are classified as harmful. The term ‘potential’ is often added when the effect of the subsidy or transfer is not known. Checklist/assessment refers to the cases where either an impact assessment has been used to identify harmful subsidies or when a checklist (in the form of a simplified assessment) has been used.
Table 15: Overview of methods used for compiling, estimating, defining or describing PEDs (EHS) as available in November 2014
Name of study Country/organisation (year) Definition Link
1. Environmental tax reform in Europe: opportunities for the future
IEEP, Report to the Netherlands Ministry of Infrastructure and the environment (2014)
No definition http://www.ieep.eu/work-areas/environmental-economics/market-based-instruments/2014/06/environmental-tax-reform-in-europe-opportunities-for-the-future
2. Study of Environmental Fiscal Reform Potential in 12 EU Member States
DG ENV (2014) Based on activities/ receiver
http://ec.europa.eu/environment/integration/green_semester/pdf/EFR-Final%20Report.pdf
3. Paying the polluter IEEP (2014) http://www.e-elgar.co.uk/bookentry_main.lasso?currency=UK&id=15338
4. Steps toward greening in the EU, Member States’ achievement in selected environmental policy area – EU summary report
IEEP (2013) http://ec.europa.eu/environment/enveco/resource_efficiency/pdf/Greening.pdf
5. The use of economics instruments in Nordic Environmental Policy 2010-2013
NORDEN (2014) Check list/ assessment
http://www.copenhageneconomics.com/Website/Publications/Energy---Climate.aspx
6. Les aides publiques dommageables à la biodiversité
Conseil d’Analyse Stratégique (2011)
Check list/ assessment
http://www.ladocumentationfrancaise.fr/rapports-publics/124000434/index.shtml
7. Environmental Performance Review : Mexico and Colombia
OECD (2013) OECD (2014)
Check list/ assessment
http://www.oecd-ilibrary.org/environment/oecd-environmental-performance-reviews_19900090

HOW TO OBTAIN EU PUBLICATIONS
Free publications: • one copy:
via EU Bookshop (http://bookshop.europa.eu); • more than one copy or posters/maps:
from the European Union’s representations (http://ec.europa.eu/represent_en.htm); from the delegations in non-EU countries (http://eeas.europa.eu/delegations/index_en.htm); by contacting the Europe Direct service (http://europa.eu/europedirect/index_en.htm) or calling 00 800 6 7 8 9 10 11 (freephone number from anywhere in the EU) (*). (*) The information given is free, as are most calls (though some operators, phone boxes or hotels may charge you).
Priced publications: • via EU Bookshop (http://bookshop.europa.eu).

Exer in vulla faci blamconse euis nibh el utat dip ex elestisim
Rilis augiati siscilit venis nim
2013 ed
ition
KS-GQ
-15-005-EN-N
doi:10.2785/907129