environmental research brief: the impact of ground-water · environmental research brief ......
TRANSCRIPT

ENVIRONMENTALRESEARCH BRIEFThe Impact of Ground-Water/Surface-Water Interactions on Contaminant Transport with Application to an Arsenic Contaminated Site
Robert Ford*
Introduction It is recognized that physical and chemical interactions between adjacent ground water and surface water bodies are an important factor impacting water budget and nutrient/ contaminant transport within a watershed (Winter et al., 1998). This observation is also of importance for hazardous waste site cleanup within the United States, since about 75% of sites regulated under the Resource Conservation and Recovery Act (RCRA) and the Comprehensive Environmental Response, Compensation, and Liability Act (CERCLA or Superfund) are located within a half mile of a surface-water body (Tomassoni, 2000; Biksey and Gross, 2001). The boundary between adjacent ground-water and surface-water bodies is referred to as the ground-water/surface-water (GW/ SW) transition zone. The transition zone plays a critical role in governing contaminant exchange and transformation during water exchange between the two water bodies. The intervening transition zone between a stream and its adjacent aquifer has historically been referred to as the hyporheic zone (see Triska et al., 1993 for specific definition). The more general terminology, GW/SW transition zone, is used throughout this document to stress the importance that water and solute exchange is not limited only to streams. The purpose of this document is to provide a brief overview of the dynamics of chemical processes that govern contaminant transport and speciation during water exchange across the GW/SW transition zone and to present results from a field study examining the fate of arsenic during ground-water discharge into a shallow lake at a contaminated site. A conceptual model of the GW/SW transition zone is defi ned to serve as a starting point for prioritizing tasks carried out during site characterization to define contaminant mass flux across the GW/SW transition zone. This information is a critical component towards estab-lishing site-specific risks and alternatives for remedial intervention to reduce or eliminate these risks. Developing a knowledge base for delineating the biogeochemical processes controlling subsurface transport of the contaminant is one component of the investigative effort to define human or ecological risk. The discussion that follows necessarily ignores specific risk receptors. Since risk is dependent on the degree of current and future con-taminant exposure to the receptor, it is important to define contaminant mass distribu-tion (aqueous, solid, gas) and the dynamics of mass re-distribution within the regulatory boundaries established for the site. However, receptor response to contaminant exposure may not vary proportionally to contaminant mass or media-specific concentration, so the overall risk characterization effort must be guided by knowledge of both contaminant and receptor(s) distribution within the investigative boundary.
* U.S. EPA, Office of Research and Development, National Risk Management Research Laboratory, Ground Water and Ecosystems Restoration Division, Ada, OK. contact: 580-436-8872, [email protected]

Assessment of the factors controlling contaminant transport and distribution between interacting ground-water and sur-face-water bodies will be guided by the conceptual model that delineates the relevant hydrologic and biogeochemi-cal processes. The conceptual model is developed based on site-specific data and will be improved or revised with continued accumulation of data that document relevant processes active on site. The complexity of the conceptual model and the extent of required refinement or revision will be dictated by site heterogeneity and process variability in time and space. While similarities may exist between dif-ferent sites with regard to hydrology, contaminant identity, and system biogeochemistry, the initial conceptual model should always be viewed as a prototype for each given site. Therefore, site-specific monitoring plans should include iterative review and revision of the site conceptual model concurrent with improvements in the knowledge base.
Evaluation of GW/SW Interactions at Waste Sites Regulatory Framework There is general recognition within the USEPA regulatory program of the significance of water transport across the GW/SW transition zone as a pathway for contaminant transport (Tomassoni, 2000). Programs administered in support of achieving requirements set forth in RCRA and CERCLA have common goals of returning usable ground water to beneficial uses where practical and preventing contaminant migration and exposure to surface-water receptors. The Environmental Indicators (EI) assessment programs administered through the RCRA Corrective Ac-tion (CA) Program and the Superfund Program provide an example where the Agency provides guidance for evaluating the importance of ground water/surface water (GW/SW) interactions for contaminant transport and exposure. These indicators are used to monitor intermediate progress in en-vironmental terms at sites identified for restoration. Under Superfund, the Migration of Contaminated Groundwater Under Control (GM) Environmental Indicator is used for assessment of contaminant levels in ground water and the potential for contaminant migration and discharge to surface water (http://www.epa.gov/superfund/accomp/ei/ gwsurvey.pdf). Under the RCRA CA Program, the Migration of Contaminated Groundwater Under Control EI (RCRIS code CA750) determination is used to monitor whether any existing plumes of contaminated ground water are getting larger or adversely affecting surface-water bodies (http://www.epa.gov/epaoswer/hazwaste/ca/eis/ei_guida. pdf). Guidance documents developed to support these EI assessments point towards the potential need to col-lect cross-media data (e.g., ground water, surface water, sediment and ecological data) for evaluating site-specific progress towards meeting cleanup goals.
Agency Documentation There are two documents published by the USEPA that directly address scientific and policy aspects of chemical transport between ground-water and surface-water bodies as well as approaches to site characterization. A review of methods for assessing contaminated ground-water discharge to surface water was published by the Office of
Water in 1991 (EPA, 1991). While there have been new technological developments that improve the capability for delineating GW/SW interactions, the general approaches and many of the specific techniques for mapping the dis-charge of non-point contaminant sources from ground-water to surface-water bodies are still applicable. The Office of Water has supplemented the 1991 document by outlining an approach for using biological indicators to assist in assess-ing the impact of contaminated ground-water discharge on surface-water quality (EPA, 1998a). The U. S. Geological Survey has also published examples where contaminant discharge area(s) have been mapped out using hydrologic and physicochemical techniques to assess the fate of volatile organic compounds and inorganic contaminants during transport across the GW/SW transition zone (e.g., Savoie et al., 2000; McCobb et al., 2003).
The USEPA Office of Solid Waste and Emergency Re-sponse (OSWER) sponsored a workshop in January 1999 to bring together a group of experts to address the ecological importance of the GW/SW transition zone and review approaches to characterize relevant hydrogeologi-cal, chemical, and biological processes within this zone. This workshop was jointly organized by the Ecological Risk Assessment Forum (ERAF) and the Ground Water Forum (GWF), which comprise ecological risk assessment and ground-water specialists, respectively, from USEPA Re-gional Offices, Headquarters, and the Office of Research and Development. A proceedings document was published to synthesize workshop discussions and to propose directions for future research that will benefit the USEPA regulatory mission (EPA, 2000a). This document also provides an update to many of the methods for site characterization published by the Office of Water and a compendium of case studies where GW/SW investigations have been a critical component of site characterization. Together, these publications provide a concise synthesis of the technical and policy issues relevant to contaminant transport across the GW/SW transition zone, and they should be consulted as resources for designing a site characterization plan. In addition, a draft ERAF-GWF Issue Paper is currently in preparation entitled, “Evaluating Ground-Water/Surface-Water Transition Zones in Ecological Risk Assessment.” The intent of this document is to provide Agency guidance on data requirements and techniques for performing an ecological risk assessment.
National Research Initiatives As a regulatory body, the USEPA does not maintain/oper-ate field sites to support long-term research in the area of GW/SW interactions. However, several site-specific case studies are documented within the 1999 OSWER-sponsored workshop on GW/SW interactions (EPA, 2000a) that can be consulted as points of reference for designing a monitor-ing plan to support a site-specific conceptual model. The Agency also maintains web-based resources pertinent to this technical area, e.g., the Ground Water Task Force website located at http://gwtf.cluin.org/resources/. This website provides a compilation of information sources for characterization of ground-water plumes, several of which
2

pertain directly to GW/SW interactions. In addition, the USEPA partners with other federal agencies, such as the U. S. Geological Survey (USGS), that are better positioned to support long-term field-based research initiatives. The USGS supports several research programs that address chemical transport at the watershed level, including hydro-geological investigations pertaining to the GW/SW transition zone. The National Science Foundation also sponsors the Long Term Ecological Research (LTER) Network, which has as one of its core research areas the assessment of patterns of inorganic inputs and movements of nutrients through soils, ground water, and surface waters. Internet links are provided below to several of these programs:
1) Water, Energy, and Biogeochemical Budgets Program http://water.usgs.gov/webb/
2) Toxic Substances Hydrology Program http://toxics.usgs.gov/
3) Shingobee Headwaters Aquatic Ecosystems Project http://wwwbrr.cr.usgs.gov/projects/SHAEP/index.html
4) Long-Term Ecological Research Network http://lternet.edu/
While the primary focus of these research initiatives is not exclusive to contaminated sites, they provide a unique resource to practitioners due to the knowledge base developed relative to evaluation of successful tools for site characterization and modeling of water transport and solute interactions across the GW/SW transition zone.
Conceptual Model Development Interacting System Components A simplified diagram of the GW/SW transition zone is shown in Figure 1A. The graphic simplicity of this diagram is purposeful to emphasize the importance of process iden-tification (hydrologic or biotic-abiotic chemical processes) in guiding design of the monitoring program for assessing contaminant transport and distribution. Three components are identified within a hypotheticalboundary encompassing the ground-water and surface-water bodies that exchange water and the chemicalcomponents mobile within this phase. The three system components include 1) the ground-water aquifer, 2) the GW/SW transition zone, and 3) the surface-water body. Arrows located at the water surface in both the ground-water aquifer and the surface-water body are shown to emphasize that water levels may fluctuate in
Figure 1. Conceptual model of the system components that govern contaminant transport across the GW/SW transition zone. (A) Chemical fluxes entering the GW/SW transition zone (Zone 2) emanate from surface-water (Zone 3) and/or ground-water (Zone 1) sources. Arrows shown at the surface of the ground- and surface-water components indicate the fluctuations in hydraulic head that may occur resulting in a potential change in the direction of water flow. (B) The soil/sediment material within the GW/SW transition zone can further be de-lineated into surface sediments (or gyttja) and aquifer solids. (C) Solid matter within the GW/SW transition zone includes inorganic/organic substrates of which the soils/sediments are composed as well as plant and animal biomass.
3
either component. Differences in the relative water level between these two components will dictate both the direction and magnitude of water flux across the GW/SW transition zone (Winter et al., 1998). The detail shown in Figure 1B is included to emphasize that the physical composition of the GW/SW transition zone may incorporate both aquifer and surface-water sediments. The importance of plants as well as the microbial and benthic communities that in-habit the GW/SW transition zone is emphasized in Figure 1C. These organisms play an important role in governing nutrient transport and the development of chemical gradi-ents within the GW/SW transition zone (e.g., Jaynes and Carpenter, 1986). Chemical gradients develop across the GW/SW transition zone due to the inherent difference in the ground-water and surface-water chemistry and the biotic communities inhabiting this unique ecological niche. The microbial community within the GW/SW transition zone may, in part, govern contaminant transport across this zone through regulation of the chemistry of redox-sensitive elements such as carbon, iron, nitrogen, and sulfur. This will impact the chemical composition of water and solids within this zone and, therefore, contaminant mobility (EPA, 2000b).
Surface-water sediments are delineated separately from aquifer sediments in the diagram shown in Figure 1 due to their intimate contact with the surface-water body. As a result of inputs from terrestrial sources, surface-water sediments (referred to as gyttja) may develop chemical properties distinct from adjacent aquifer sediments. Due to these unique characteristics, contaminants that otherwise are not attenuated by sorption onto aquifer sediments may accumulate within surface-water sediments. While contami-nant partitioning to surface-water sediments may mitigate transport into the surface-water body, sediments that have accumulated a significant mass of a recalcitrant contami-nant may present either a separate exposure medium or pose a significant long-term source of contamination to the surface- or ground-water body as a result of contaminant release. In addition, contaminant reactions with surface-water sediments may be controlled by light- or tempera-ture-dependent factors, e.g., photosynthesis-induced pH changes (e.g., Jones et al., 2004 and references therein). These reactions are distinct from those that may be active outside of the zone of light influence in buried surface-water sediments or aquifer sediments within the GW/SW transi-tion zone and must be accounted for separately in order to properly assess the influence of ground-water discharge on contaminant mass in the surface-water body. From this perspective, it is important that the site investigation provides data to assess contaminant mass loading and reactivity in surface-water sediments, including sorption capacity for continued contaminant uptake.
Contaminant flux may be multi-directional and transient, so developing an understanding of contaminant flux within or between the relevant compartments will depend on ascertaining the dynamics and distribution of temporal and spatial factors governing contaminant reactive transport. Contaminant transport and, therefore, exposure-based risk estimates can best be understood in the context of a mass
balance of the contaminant(s) of concern. A contaminant may remain mobile across the GW/SW transition zone, become immobilized on sediments within or adjacent to the boundaries of the transition zone, or undergo transformation in water to products with lower/greater toxicity. Development of an understanding of the processes that control contaminant mass distribution within the boundaries of the site investigation underpins the risk evaluation and the design of intervention strategies to minimize risk.
Unifying Concept: Contaminant Flux While contaminant concentration is a determining factor for human or ecological risk, this metric does not provide a measure of contaminant mass and distribution within the system of interest. Determination of a contaminant mass balance is critical for determining changes in contaminant mass or speciation during water transport within and across the transition zone. The transition zone not only encom-passes the transition from one flow regime to another, it is also commonly the location of dramatic chemical gradients driven by biotic/abiotic reactions. For organic contami-nants, a mass balance calculation aids determination of whether contaminant degradation or sorption is occurring. For inorganic contaminants, a mass balance is required to assess changes in chemical speciation and mobility. The mass balance is inclusive of liquid and solid matrices (e.g., sediments) within the boundaries of the conceptual model. The distribution of contaminant mass is important with respect to projecting current and future risk. This is critical for recalcitrant organic compounds and inorganic contaminants that may accumulate on solid matrices within the transition zone, thus posing future risk due to processes such as contaminant desorption.
Contaminant flux (M) is defined as the product of contami-nant concentration (C) in the mobile phase (water and mobile colloids) and the volumetric flow of the mobile phase (Q).
M = C * Q Eq. 1
Contaminant flux can be calculated for point locations or cross-sectional areas perpendicular to water fl ux depending on the level of heterogeneity in water flow or contaminant concentration distribution (Einarson and Mackay, 2001; Buscheck et al., 2004). For inorganic contaminants, this general equation represents the flux of all contaminant species at a given point in time. Since a mobile inorganic contaminant can change chemical form, it may be useful or necessary to further define contaminant flux for individual contaminant species relevant to site-specific conditions.
M = C * Q Eq. 2 i i
Contaminant transport occurs along water flow paths in the subsurface. Therefore, the first step to determining contaminant flux is developing an understanding of system hydrology. With the establishment of a water budget for the site (i.e., water flux distribution), then a mass budget can be developed to establish contaminant flux across the system component boundaries.
Within the aquifer and the GW/SW transition zone, con-taminant flux is dependent on water flow and contaminant
4

Figure 2. Conceptual diagram illustrating potential spatial heterogeneity and variability in the magnitude of contaminant flux across the GW/SW transition zone: A) plan view and B) cross-sectional view through monitoring transect D-D’. Variation in magnitude of contaminant flux is indicated by thickness of arrows and is a function of the contaminant concentration and water flux within a given reaction volume.
distribution as illustrated in Figure 2. The spatial and temporal distribution of the contaminant will depend on source location, the spatial distribution and velocity of water flow (or diffusion where advective flux is low), and the abundance and biotic/abiotic reactivity of aqueous and solid phase biogeochemical components along the paths of water flow. The extent to which biogeochemical processes will influence contaminant chemical speciation during transport will depend on the relative rates of fluid transport and chemical reactions (Morgan and Stone, 1985). For example, contaminant transport will be relatively conservative for systems in which the timescale for water flow within a hypothetical reaction volume is much shorter than the timeframe for significant reaction to take place. Conversely, significant attenuation/transformation will be observed for contaminants in systems where reactions occur rapidly relative to the timescale for fluid transport. The latter situation is commonly assumed to apply to ground-water systems, but this needs to be confirmed during site char-acterization. This is particularly important for near-surface systems that may experience large variability in water fl ux and fluid velocities (e.g., Conant Jr., 2004).
Sebestyen and Schneider (2004) present field results that illustrate the interdependence between fluid flow
and chemical reactions. Trends in the sediment pore water concentrations of iron and zinc were related to the magnitude of ground-water seepage. Low seepage flows resulted in higher concentrations of these metals due to the development of anoxia from microbial reactions. The influence of these reactions was diminished with higher seepage flows, since solutes were rapidly flushed from the system. Harvey and Fuller (1998) have proposed a dimensionless index that may be used to assess the rela-tive significance of chemical reactions within the hyporheic zone in mitigating solute transport within a drainage basin based on the assessment of chemical reaction rates and fluid residence times within the GW/SW transition zone (specifically, the hyporheic zone). These authors provide a detailed assessment of the influence of manganese uptake within the hyporheic zone in the Pinal Creek Basin, Arizona. Manganese was partially sequestered from contaminated ground water within the hyporheic zone due to the down-ward flux of oxygen from stream water, which stimulated microbial oxidation and precipitation of manganese within shallow sediments. As demonstrated in a subsequent publication (Fuller and Harvey, 2000), the manganese oxidation-precipitation process exerted direct influence on the transport of contaminant metals (cobalt, nickel, zinc) derived from ground-water discharge to the stream. These
5

studies illustrate the importance of understanding the bal-ance between fluid transport and chemical reaction rates for assessing contaminant migration across the GW/SW transition zone.
A concise summary of relevant chemical processes that may influence contaminant flux is presented by Winter et al. (1998). Common types of biogeochemical reactions that impact contaminant transport across the GW/SW transition zone include acid-base reactions, precipitation and dissolution of minerals, sorption and ion exchange, oxidation-reduction reactions, biodegradation, and dis-solution and exsolution of gases (Winter et al., 1998). Examples of these reaction types relevant to the GW/SW transition zone are presented in Table 1. These reactions will impact contaminant phase distribution (liquid, solid, gas) and chemical speciation within a given phase. Thus, it is critical to understand the chemical properties unique to the contaminant(s) under consideration in relation to the bio-geochemical characteristics of the GW/SW transition zone. A detailed discussion of the physical and biogeochemical processes leading to organic contaminant (chlorinated solvents and fuel hydrocarbons) degradation/immobiliza-tion is provided by Wiedemeier and others (EPA, 1998b). Discussions of chemical processes that may influence inorganic contaminant transport in surface and subsurface
systems are presented in texts by Chapelle (1993), Stumm and Morgan (1996), and Langmuir (1997). The reader is referred to these references for a more comprehensive overview of chemical processes relevant to lacustrine sediment and ground-water systems.
Documented Impact of GW/SW Interaction on Chemical Transport
Understanding of the factors controlling contaminant trans-port across the GW/SW transition zone is improving with increased publication of site-specific field studies in the literature. The literature review that follows highlights salient features that should be considered during assessment of contaminant transport across the GW/SW transition zone. This review targets only those studies where contaminant fate was examined in conjunction with assessment of system hydrology. There are numerous studies that focus solely on evaluating and modeling the hydrologic charac-teristics of GW/SW interactions for various flow regimes, and the reader should consider alternate sources for ad-ditional background on this aspect of site characterization. Literature reports included in Tables 2 and 3 below were predicated on thorough characterization of site-specific hydraulic characteristics prior to initiating or interpreting results from geochemical site characterization.
Table 1. Classes of Biochemical Reactions with Examples Relevant to Contaminant Transport Across the GW/SW Transition Zone.
Geochemical Reaction
Relevant Process Example Reaction
Acid neutralization Acid-Base by aqueous HCO3
- + H+ = H2CO3
o
carbonate alkalinity Precipitation-Dissolution of Minerals
Precipitation of metal sulfide
Zn2+ + HS- = ZnS(s) + H+
Sorption and Ion Exchange
Ion exchange on feldspars
KAlSi3O8(s) + NH4
+ = NH4AlSi3O8(s) + K+
Oxidation-Reduction
Reductive dissolution of iron oxide coupled to organic carbon oxidation
4Fe(OH)3(s) + 8H+ + CH2O = 4Fe2+ + CO2(g) + 11H2O
Biodegradation Benzene oxidation coupled to denitrification
C6H6 + 6NO3
- + 6H+ = 6CO2(g) + 6H2O + 3N2(g)
Gas Dissolution and Exsolution
Ammonia gas-water exchange
NH3(g) + H2O = NH4
+ + OH-
6

Table 2. Examples from Peer-Reviewed Literature Documenting Field Case Studies Designed to Assess the Physicochemical Processes In-fl uencing Inorganic Contaminant Transport Across the GW/SW Transition Zone. OC = organic carbon, DOC = dissolved organic car-bon, EDTA = ethylene daminetetraacetic acid.
CompoundIdentity Location Hydrologic Setting Chemical Processes Reference
Nitrate Great South Bay, New York
Submarine ground-water discharge to coastal marine ecosystem
Denitrification (N 2 or N 2 O production) and dissimilation (NH4 -N production) in sediments
Capone and Bautista, 1985
Nitrate, Ammonia
Seine River, France water
River-water infiltration into ground Nitrification-denitrification coupled to microbial mineralization of aqueous and solid OC; ammonia release from OC decay
Doussan et al., 1997
Nitrate Elbe River, eastern Germany water
River-water infiltration into ground Denitrification using oxidizable aqueous and solid OC from river water and river bed/aquifer sediments
Grischek et al., 1998
Nitrate Western Sierra Nevada foothills, California
temporal variations in mixing of bedrock and soil drainage sources
Ground-water discharge into stream; Nitrification of ammonia; leaching of nitrogen compounds from soil solids
Holloway and Dahlgren, 2001
Nitrate Northwestern France discharge into second-order stream
Shallow and deep ground-water Denitrification coupled to pyrite oxidation
Grimaldi et al., 2004
Nitrate Florida Keys canal system Ground-water discharge to coastal Near-conservative transport of low-salinity plume;
denitrification in off-axis portions of plume Griggs et al., 2003
Phosphate Tidal freshwater marsh, Virginia exfiltration
Marsh ground-water infiltration- Iron oxidation-precipitation limits diffusive and advective phosphate transport into marsh
Chambers and Odum, 1990
Manganese, Nitrate
Oder River, north-eastern Germany water
River-water infiltration into ground Denitrification and Mn reduction-oxidation coupled to microbial degradation of OC
Massmann et al., 2004
Manganese Lot River, Bordeaux, France water
River-water infiltration into ground Weathering of Mn-bearing minerals coupled to bacterial degradation of OC; Mn(II) oxidation coupled to sorption-precipitation
Bourg and Bertin, 1993
Manganese Lot River, Bordeaux, France water
River-water infiltration into ground Weathering of Mn-bearing minerals coupled to microbial degradation of OC – spatial variability due to different OC or mineralogical Mn sources; Mn(II) oxidation coupled to sorption-precipitation
Bourg and Bertin, 1994
Cadmium, Copper, Iron, Manganese, Nitrate, Zinc
Glatt River, northeastern Switzerland
waterRiver-water infiltration into ground
Mineral weathering/precipitation coupled to microbial degradation of OC; Cu-EDTA complexation; metal sorption-precipitation due to fluctuations in abiotic chemical equilibria; denitrification
Jacobs et al., 1988
Cadmium, Copper, Manganese, Nitrate, Zinc
Glatt River, northeastern Switzerland
waterRiver-water infiltration into ground
Mineral weathering/precipitation coupled to microbial degradation of OC; Cu-DOC complexation; metal sorption-precipitation due to fluctuations in abiotic chemical equilibria; denitrification
von Gunten et al., 1991
Cadmium, Copper, Iron, Manganese, Nitrate, Zinc
Silver Bow Creek, Montana exfiltration
River-water/ground-water infiltration- Oxidative precipitation of Fe and Mn; precipitation-sorption of Cd, Cu, Zn; denitrification
Benner et al., 1995
Arsenic, Iron Montana
Silver Bow Creek, exfiltration River-water/ground-water infiltration- Dissolution of As-bearing iron oxides from sediment
deposited in reducing hyporheic zone Nagorski and Moore, 1999
Iron, Zinc
Several lakes, Adirondack Mountains, New York
exfiltrations Lake/ground-water infiltration- Anaerobic microbial OC degradation, mineral
weathering and ion exchange reactions Sebestyen and Schneider, 2004
7

Table 3. Examples from Peer-Reviewed Literature Documenting Field Case Studies Designed to Assess the PhysicoChemical Processes Infl uencing Organic Contaminant Transport Across the GW/SW Transition Zone. EDTA = ethylene diaminetetraacetic acid, NTA = nitrilotriacetic acid, NDC = naphthalene dicarboxylate, APEC = alkylphenol polyethoxy carboxylates, HAA = haloacetic acid, CFC = chlorofl uorocarbon.
Compound Identity Location Hydrologic Setting Chemical Processes Reference Trichloroethylene, Tetrachloroethylene, 1,4-Dichlorobenzene, 1,3-Dimethylbenzene, Organochlorine
Glatt and Aare Rivers, northeastern Switzerland
ground water River-water infiltration into
Conservative transport for some volatile organic compounds; aerobic and anaerobic microbial degradation; sorption of lipophilic compounds limited by low organic carbon content of aquifer solids
Schwarzenbach et al., 1983
Volatile, Semivolatile, Non-volatile compounds
Croatia, Yugoslavia Sava River, northern
ground water River-water infiltration into
Inferred biological degradation and/or sorption onto solid OC in surface water and aquifer sediments
Ahel, 1991
Chloroform, Benzene, Tetrachloroethylene, Trichlorethylene
Watson Creek, Aberdeen Proving Ground, Maryland
into stream Ground-water discharge Not studied; passive samplers used to
delineate contaminant plume discharge zone Vroblesky et al., 1991
Volatile Organic Compounds
Inner Piedmont, South Carolina into stream
Ground-water discharge Not studied; passive samplers used to locate rock fractures that were conduits for contaminant discharge
Vroblesky et al., 1996
Alkylphenol polyethoxylate surfactants
Glatt and Sitter Rivers, northern Switzerland ground water
River-water infiltration into Biological degradation of organic compounds primarily within GW/SW transition zone (shallow aquifer)
Ahel et al., 1996
Chloroethene St. Joseph, Michigan recharge into lake with wave infiltration
Ground-water discharge-Chloroethene co-oxidation by methane-oxidizing bacteria
Lendvay et al., 1998
EDTA, NTA, NDC, APEC, HAA
Santa Ana River, Orange County, California
ground water River-water infiltration into
Microbial degradation of NTA, APEC and HAA Ding et al., 1999
Trichloroethylene, 1,1,2,2-tetrachloroethane
West Branch Canal Creek, Aberdeen Proving Ground, Maryland
recharge into wetland and stream
Ground-water discharge-Anaerobic biodegradation (hydrogenolysis and reductive dechlorination) under reducing conditions (iron-reducing, sulfate-reducing, methanogenesis)
Lorah and Olsen, 1999
Tetrachlorethylene Pine River, Angus Ontario, Canada
into river (short circuiting and low-high dispersed flow)
Ground-water discharge Reductive dehalogenation producing cis-1,2-dichloroethylene and vinyl chloride (low-moderate discharge zone)
Conant Jr., 2000
Tetrachloroethene Pine River, Angus Ontario, Canada
into river (short circuiting and low-high dispersed flow)
Ground-water discharge Reductive dehalogenation producing cis-1,2-dichloroethylene and vinyl chloride (low-moderate discharge zone)
Conant Jr. et al., 2004
CFC-11, CFC-12, CFC-113
Everglades National Park, south Florida into ground water
Surface-water infiltration CFC degradation coupled to microbial methanogenesis
Happell et al., 2003
α-hexachlorocyclohexane
Coastal northeastern Florida into a stream
Ground-water discharge Biological degradation in non-acidic, anaerobic portions of plume
Law et al., 2004
8
Summaries of published studies from the peer-reviewed literature that document the influence of GW/SW interactions on inorganic and organic contaminant fate are provided in Tables 2 and 3, respectively. Several general themes are echoed throughout the summarized studies:
1) Hydrologic transients imposed by long-term (e.g., seasonal) and short-term (e.g., storm events) flow variations impact the types and intensity of chemical reactions that influence contaminant chemical specia-tion and transport;
2) Chemical gradients of major and trace elements/con-taminants are often greatest in the vicinity of the GW/SW transition zone;
3) Contaminant transport is dependent on the diversity and interactions between the biotic and abiotic solid components within the GW/SW transition zone; and
4) Microbial degradation of natural and anthropogenic sources of organic matter and the availability of terminal electron acceptors influence the distribution of redox zones within the GW/SW transition zone.
Hydrologic Transients. With regard to hydrology, it must be understood that water flow across the transition zone is a two-way street. The direction of water flow (and contaminant flux) will respond to changes in water level in surface water or ground water. Changes in water level may originate from natural events such as rainfall, snow melt, evaporation, or tidal/wave influences or from man-made events such as changes in water storage in a managed reservoir or from ground-water withdrawal. In wetland or peatland settings with dense plant growth, water transport due to evapotranspi-ration can also exert a signifi cant influence on ground-water flow patterns (Doss, 1993; Fraser et al., 2001). Water flow dynamics influence contaminant transport directly due to changes in the volume and direction of water flux. However, changes in water flow also exert an indirect effect by altering major element chemistry that can stimulate or quench bio-geochemical reactions controlling the chemical speciation of contaminants. As an example, changes in the activity of organic matter degradation that accompany variations in the flux of dissolved organic matter due to ground-water recharge/discharge may impact iron and/or sulfur oxidation-reduction reactions. Oxidation-reduction transformations of iron or sulfur drive the precipitation/dissolution of iron- and sulfur-bearing minerals involved in inorganic contaminant sorption (e.g., Moore et al., 1988; Moore, 1994) or abiotic degradation of organic contaminants (e.g., Ferrey et al., 2004). Thus, the accuracy of a site-specific conceptual model depends on defining the interaction between fl uid fl ow and the biogeochemical processes governing contaminant transformations and mobility.
Chemical Gradients. The dynamics of hydrologic events in concert with the diversity and activity of microscopic and macroscopic organisms that occupy the GW/SW transi-tion zone can result in steep gradients in chemical mass in transitioning from the ground-water to the surface-water body (and vice versa). The chemical gradients that develop may pertain both to the major element composition as
well as the contaminant mass in the water or solids in the GW/SW transition zone. Two examples are discussed to illustrate the magnitude of chemical mass changes relative to transport distances. The first example is taken from work conducted by Conant et al. (2004) to assess the extent of PCE discharge from a contaminated ground-water plume into a stream. Determination of the potential for natural at-tenuation/degradation of PCE during transport was a critical component of this assessment. The authors observed the following: 1) transport of PCE with little attenuation to the streambed, 2) the presence of both PCE and degradation products within the streambed, and 3) low detections of PCE and degradation products in the overlying stream. The predominant fraction of anaerobic degradation of the PCE plume occurred within the top 2.5 meters of the streambed. Solids within the streambed also served to concentrate volatile organic compounds from the plume due to sorp-tion or retardation. Failure to monitor water and sediment concentrations within the streambed could have resulted in a misinterpretation of low surface water PCE concen-trations as resulting only from dilution of the discharging plume. The second example illustrating the development of sharp chemical gradients is taken from work published by Benner et al. (1995). These authors observed changes in water chemistry during GW/SW interactions in a stream receiving discharge from an acidic, metal rich ground water. Order-of-magnitude changes in cadmium, copper, and zinc concentrations were observed over a distance of less than one meter during ground-water transport through the hyporheic zone into the overlying stream. The reduction in contaminant metal concentrations was due to partitioning to solid phases such as iron oxides that precipitated as pH and dissolved oxygen levels increased during transport from ground water to surface water. Knowledge of the solid-phase partitioning process was critical in order to assess the potential long-term stability of the contaminant metals accumulating within streambed sediments.
Transition Zone Composition. Solid components within a ground-water aquifer are primarily derived from weathered rock or soil materials and subsurface microbial communi-ties. In contrast, solid components within the GW/SW transition zone may include both aquifer materials as well as microscopic/macroscopic biotic and abiotic components that are primarily derived from the surface terrestrial system. For example, both submerged and emergent plants can contribute a significant portion of the total mass of solid components within the GW/SW transition zone. These components can play two critical roles with regard to the chemistry within this zone 1) by influencing the transport of important chemical constituents directly through nor-mal physiological functions (e.g., Jaynes and Carpenter, 1986) or indirectly by hosting microbial communities that infl uence localized oxidation-reduction (redox) conditions, and 2) by contributing a source of organic material to surface sediments within the GW/SW transition zone at the end of their life cycle. The abiotic organic and mineral components within the GW/SW transition zone, in part, control the system chemistry by buffering changes in redox or pH and serving as temporary/permanent reservoirs for
9

contaminants that are absorbed/adsorbed during transport across the transition zone.
Redox Chemistry. The importance of redox processes for organic and inorganic contaminant transport and fate in sub-surface systems at waste sites has been addressed in detail in a recent Agency publication (EPA, 2000b). Developing an understanding of the relevant redox processes control-ling contaminant degradation or solid-liquid partitioning is a critical task for projecting contaminant flux. Due to spatial and temporal heterogeneity in the physical and chemical properties across the GW/SW transition zone, multiple reaction zones with differential impacts on contaminant transport may develop as illustrated in Figure 3. Many redox reactions that govern contaminant fate are directly
Figure 3. Conceptualdiagram showing snapshot of chem-ical component profiles across the GW/SW transition zone. Redox reaction zones develop within fixed spatial regions due to biogeochemi-cal reactions maintained by chemical fluxes. Conceptual adaptation of illustration from Figure 7 in Bourg and Bertin (1993). NOM = natural organic matter, TEAP = terminal elec-tron acceptor process.
or indirectly influenced by microbial degradation of natural or anthropogenic organic compounds coupled to electron transfer reactions with terminal electron acceptors such as oxygen, nitrate, ferric iron, sulfate, and carbon dioxide (Chapelle, 1993; Vroblesky and Chapelle, 1994).
Variations in the mass flux of these chemical components in addition to temperature fluctuations will influence both the type and intensity of microbially-mediated redox reactions that affect contaminant chemical speciation. For example, Groffman and Crossey (1999) monitored the response of oxygen, iron, manganese, and sulfur distributions in a shallow alluvial aquifer in contact with a first order stream influenced by rain and snow melt infiltration events. The distribution of terminal electron acceptors or redox zones in the shallow aquifer shifted spatially and temporally in response to seasonal infiltration events. These variations were significant across spatial and temporal scales of centimeters and weeks, respectively. The impact of flow fluctuations on nitrate concentrations in a stream partially fed by ground-water discharge was illustrated by Grimaldi et al. (2004). Reduction of nitrate coupled to the oxidation of sulfur in the pyrite-bearing aquifer played a key role in de-termining stream nitrate concentration throughout the year. The magnitude of nitrate reduction was mediated by daily, storm-event, and seasonal variations in system hydrology. Both studies point to the importance of delineating the role of both soluble and solid-phase redox reactants/products toward developing a sound conceptual understanding of contaminant fate across the GW/SW transition zone.
These studies illustrate the impact of redox-driven processes on the transport of inorganic and organic contaminants across the GW/SW transition zone. The evaluations docu-mented in these reports provide a useful context for evaluat-ing the spatial and temporal detail needed in a monitoring program designed to support development and validation of site-specific conceptual and analytic models.
Application to an Arsenic Contaminated Site Contaminant source identification is a critical task during site characterization to assess contaminant transport across the GW/SW transition zone. Identification of the major contaminant sources provides the basis for assessing po-tential long-term contaminant flux to the risk receptor and for targeting intervention efforts to minimize contaminant transport and exposure. As previously noted, a common direct source of contaminant flux to a surface-water body is from discharge of a contaminated ground-water plume from an upgradient waste site. Removal or isolation of the contaminant source zone within the upgradient ground-water aquifer is a logical step to minimize continued contaminant flux. However, historical contaminant attenuation and ac-cumulation within the GW/SW transition zone may pose a secondary long-term source of contaminant flux to the surface-water body. Determination of the fraction of the total contaminant flux derived from sediment desorption/ dissolution thus becomes an important aspect for appor-tioning risk to the various contaminant source terms and for evaluating whether intervention is required to manage estimated risk from sediment contamination.
10

The following field study provides an example where sur-face-water sediment contamination due to arsenic transport from an upgradient ground-water plume poses a potential long-term source for arsenic flux into the surface-water body. Methods employed for site assessment are illustrated along with field data that provide evidence that the flux of arsenic into surface water is due to 1) direct discharge from contaminated ground water and 2) concurrent release of arsenic from contaminated sediments.
Initial Site Conceptual Model Site Hydrology. The study location is down gradient from a Superfund site in Massachusetts in which historical on-site disposal of arsenic-bearing wastes has resulted in leaching of arsenic into site ground water (Durant et al., 1990; Davis et al., 1994). A portion of the ground-water plume discharges into a constructed shallow lake that also receives surface-water inputs from a perennial stream (Halls Brook) on its western edge and an intermittent runoff channel at its northwestern end (Figure 4). The constructed shallow lake was built for flood control and is referred to as the Halls Brook Holding Area (HBHA) Pond throughout this report. The HBHA Pond has a maximum depth of approximately 5 meters, and it discharges into a heavily vegetated wetland area. The HBHA Pond discharge reconstitutes Halls Brook, which meanders through the wetland until discharge into the Aberjona River. Based on eight measurements during
the period of 7/1/1997 to 1/27/1998, Wick et al. (2000) determined a range in surface-water inputs and HBHA Pond outflow of approximately 48,380-459,090 ft3d-1, 0-423,776 ft3d-1, and 118,304-953,496 ft3d-1 for Halls Brook, the intermittent runoff channel, and the HBHA Pond outflow, respectively. Assuming steady state for the lake water balance, this resulted in an estimated total flow input from ground-water discharge ranging from 27,898 to 185,755 ft3d-1 (ranging from approximately 7% to 60% of the water fl ux). This ground-water discharge corresponds with an independent estimate of approximately 91,818 ft3d-1 based on surface-water flow measurements at the Halls Brook discharge into the HBHA Pond and the point of discharge into the Aberjona River (Aurilio et al., 1994). These estimates are higher than ground-water discharge rates determined using seepage meters installed along the center-line of the lake (706 ft3d-1; Davis et al., 1996). However, based on salt balance calculations, Wick and others (1998a, 2000) have estimated that the contaminated ground-water plume contributes 1,412-16,951 ft3d-1 to the HBHA Pond. Visual observations of ground water seeps along the northern edge of the HBHA Pond (Aurilio et al., 1994) and salt balance calculations within the HBHA Pond (Wick et al., 2000) indicated that contaminated ground water primarily discharges into the northern end of the HBHA Pond.
Figure 4. (A) Aerial photograph and (B) aerial schematic of study site including approximate locations of ground-water and surface-water monitoring points. The major sources of water input into the pond include discharge from 1) Halls Brook, 2) site-derived ground water with overlapping plumes of arsenic and BTEX compounds (ap-proximately 130 and 100 m of shoreline, respectively), and 3) an intermittent runoff channel.
11

Monitoring Strategy. Based on this information, the site characterization effort for this study was focused towards defining the spatial extent of contaminated ground-water discharge into the northern portion of the HBHA Pond. The spatial location of ground-water and surface-water monitoring points is shown in plan-view relative to the configuration of the pond (Figure 4). Tubing wells were employed at multiple depths adjacent to and within the lake to capture the vertical extent of the GW/SW transition zone. A combination of tubing wells, diffusion samplers, and depth-resolved sampling within the pond was used to measure water chemistry parameters in-situ and collect water samples for laboratory analyses. Tubing wells con-sisted of six-inch stainless steel screens attached to the end of Teflon-lined tubing. The multi-level tube cluster (NML) consisted of a series of ten six-inch screens with attendant Teflon-lined tubing attached to a PVC pipe anchored in the shallow aquifer. Sampling from tubing wells was carried out under low-flow sampling conditions (Puls and Paul, 1995). The locations of key monitoring points including the elevation at which water samples were collected within the HBHA Pond and adjacent aquifer are shown in Figure 5. Discrete monitoring points within the HBHA Pond bound-ary were used to assess the magnitude of time-dependent variations in arsenic concentration. Water chemistry data collected from ground-water monitoring points adjacent to the HBHA Pond perimeter indicated that the highest arsenic concentrations were being discharged proximate to well-cluster location TW07.
Arsenic Plume Characteristics. Historical data collected from the site indicated that ground water contaminated with arsenic and hydrocarbons discharges into the lake along the north-northeastern portion of the HBHA Pond (Davis et al., 1994;Wick and Gschwend, 1998b). Site-derived ground water contains elevated concentrations of ferrous iron and sulfate (Davis et al., 1994), which leads to the production of iron oxides and iron sulfi des in oxic and anoxic portions of the HBHA Pond, respectively. Shallow ground-water seeps are distributed along the northern boundary of the HBHA Pond as evidenced by the formation of orangish-red iron oxide precipitates where reduced ground water comes in contact with air. These shallow oxidized sediments contain arsenic concentrations ranging from 500-850 mg/kg based on measurements in this study. The ground-water input represents a significant fraction of the volumetric flow into the lake (Wick and Gschwend, 1998a; Wick et al., 2000). Contaminants discharging into the lake via the ground-water input potentially interact with aqueous and solid-phase components in the sediments and water column. Signifi cant portions of the site under study consist of former wetland areas in-filled with native soil materials and waste products from historical industrial activities. The general chemistry of the shallow unconsolidated aquifer is thus reflective of the high productivity commonly observed in wetland areas with significant rates of organic carbon turnover. In general, site ground water is reducing due to this native productivity and from anthropogenic factors such as degradation of buried waste materials (Davis et al., 1994). Ground water
Figure 5. (A) Cross-sectional view of surface elevation through the northern end of the HBHA Pond and the upgradient aquifer. (B) Relative depths of sampling intakes for ground water and surface water are shown for locations TW10, TW07, TW02, and NML. (C) Aerial photograph showing the cross-section used to construct the dia-gram in Panel A. Land surface elevation at locations TW10 and TW07 is 67.25 and 58.75 feet above see level, respectively. A scale used to track water level in the HBHA Pond is installed at the location marked ‘culvert’.
12

is characterized by high concentrations of iron, sulfate, and organic carbon (natural and anthropogenic). Published data for sediment samples collected from the lake indicate that a fraction of the arsenic transported across the GW/SW transition zone is partitioned to sediments (Aurilio et al., 1994; Davis et al., 1996; Wilkin and Ford, 2002; Ford, 2004).
An initial conceptual model was developed around the as-sumption that transformations of redox-sensitive elements such as iron, sulfur, and carbon would in part govern the speciation and transport of arsenic across the GW/SW tran-sition zone. Differences in specific conductance between surface-water and ground-water inputs into the HBHA Pond result in nearly continuous chemical and physical stratifica-tion of the water column throughout the year (Wick et al., 2000). Seasonal profiles of specifi c conductance, dissolved oxygen, and oxidation-reduction potential measured in the HBHA Pond water column during this study support this observation (Figure 6). It was hypothesized that the chemocline that develops within the lake water column would maintain distinct oxic and anoxic zones at shallow and deep depths, respectively. It was assumed that iron oxides derived from oxidation-precipitation of ferrous iron supplied continuously from discharging ground water would control the concentration of soluble arsenic within the lake water column. However, the fate of arsenic partitioned to iron oxides formed in the presence of dissolved oxygen near the chemocline was not known. Data from sediment characterization by Wilkin and Ford (2002) indicated that a fraction of the arsenic carried down to the sediments with settling iron oxide particles would ultimately partition to
authigenic sediment minerals such as iron sulfides. There was no direct method to identify whether dissolved arsenic measured in the water column was derived from ground-water discharge or desorption/dissolution of arsenic from iron oxides deposited onto the reduced sediments. Thus, delineation of the relative contributions of arsenic to the lake water column from direct ground-water discharge or release from previously contaminated sediments was criti-cal towards developing an understanding of arsenic fluxes across the GW/SW transition zone.
Identifying Arsenic Sources to Surface-Water Receptor Monitoring the recovery of the HBHA Pond water column to steady-state conditions following a surge in surface-water input was used to assist delineation of arsenic sources. During Spring 2001 of our sampling campaign, a significant rainfall event coupled with snow melt resulted in a major flow event within the Aberjona watershed. Surface-water flow data for a monitoring station at Winchester, MA (USGS 01102500 approximately 2.5 miles down gradient of the HBHA Pond), are shown in Figure 7 to document the relative intensity of this flow event. Depth-resolved sampling of the HBHA Pond water column was carried out over a period of several months to observe the recovery to pre-storm strati-fication. The time trend in specific conductance measured for ground water collected at the TW10, TW07, and TW02 sampling locations is illustrated in Figure 8. These data in-dicated little variation in ground-water specifi c conductance over a period of approximately 1.5 years. However, there is a slight reduction in specific conductance for sampling
Figure 6. Conceptual diagram depicting important hydrologic and chemical processes controlling water column chem-istry within the HBHA Pond. Predominant inputs of water into the surface-water body include site-derived ground water and discharge from Halls Brook. Iron and sulfate reduction processes are active at the sedi-ment-water interface and within shallow sediments. Representative vertical profiles of specific conductance (Sp. Cnd.), dissolved oxygen (DO), and redox potential (Eh) are shown to illustrate the chemical stratification that prevents mixing of shallow oxic and deep anoxic water (April 4, 2000; north end).
13

14
Figure 7. (A) Daily streamfl ow for USGS 01102500 Aberjona River at Winchester, MA, located approximately 2.5 miles downgradient of the HBHA Pond. Open circles show the NML sampling dates following the March 2001 storm event, and fi lled triangles show sampling dates for the TW07 and TW10 ground-water wells. Inset (B) shows NML and TW sampling dates relative to surface-water fl ow in greater detail. Two apparent phases of the post-storm water column recovery in the HBHA Pond are noted with labels ‘1’ and ‘2’ in inset (B). Inset (C) shows relative water levels measured at a fi xed scale mounted to the culvert on the eastern side of the HBHA Pond (see Figure 4 for culvert location).
Figure 8. Trends in specifi c conductance with depth for ground-water upgradient to NML: (A) TW10, (B) TW07, and (C) at TW02 below the HBHA Pond sediments adjacent to NML (fbgs = feet below ground surface). The dates for maximum fl ow observed at the USGS 01102500 station and the subsequent NML sampling dates are shown in Panel C with open and closed triangles, respectively. The inset in Panel C documents changes in the specifi c conductance depth profi le in the south end of the HBHA Pond as a result of the March 2001 peak surface fl ow. Error of duplicate measurements is within the size of the data symbol.
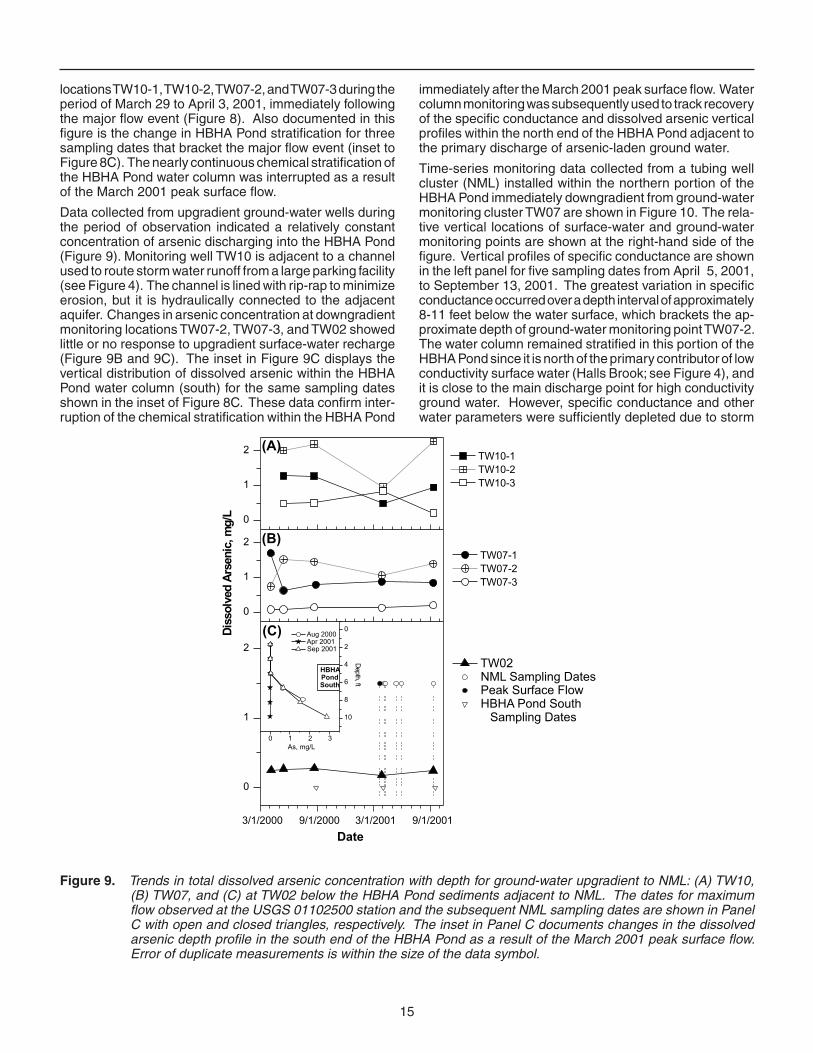
locations TW10-1, TW10-2, TW07-2, and TW07-3 during the period of March 29 to April 3, 2001, immediately following the major flow event (Figure 8). Also documented in this figure is the change in HBHA Pond stratification for three sampling dates that bracket the major flow event (inset to Figure 8C). The nearly continuous chemical stratification of the HBHA Pond water column was interrupted as a result of the March 2001 peak surface flow.
Data collected from upgradient ground-water wells during the period of observation indicated a relatively constant concentration of arsenic discharging into the HBHA Pond (Figure 9). Monitoring well TW10 is adjacent to a channel used to route storm water runoff from a large parking facility (see Figure 4). The channel is lined with rip-rap to minimize erosion, but it is hydraulically connected to the adjacent aquifer. Changes in arsenic concentration at downgradient monitoring locations TW07-2, TW07-3, and TW02 showed little or no response to upgradient surface-water recharge (Figure 9B and 9C). The inset in Figure 9C displays the vertical distribution of dissolved arsenic within the HBHA Pond water column (south) for the same sampling dates shown in the inset of Figure 8C. These data confirm inter-ruption of the chemical stratification within the HBHA Pond
immediately after the March 2001 peak surface flow. Water column monitoring was subsequently used to track recovery of the specifi c conductance and dissolved arsenic vertical profiles within the north end of the HBHA Pond adjacent to the primary discharge of arsenic-laden ground water.
Time-series monitoring data collected from a tubing well cluster (NML) installed within the northern portion of the HBHA Pond immediately downgradient from ground-water monitoring cluster TW07 are shown in Figure 10. The rela-tive vertical locations of surface-water and ground-water monitoring points are shown at the right-hand side of the figure. Vertical profiles of specific conductance are shown in the left panel for five sampling dates from April 5, 2001, to September 13, 2001. The greatest variation in specific conductance occurred over a depth interval of approximately 8-11 feet below the water surface, which brackets the ap-proximate depth of ground-water monitoring point TW07-2. The water column remained stratifi ed in this portion of the HBHA Pond since it is north of the primary contributor of low conductivity surface water (Halls Brook; see Figure 4), and it is close to the main discharge point for high conductivity ground water. However, specific conductance and other water parameters were sufficiently depleted due to storm
Figure 9. Trends in total dissolved arsenic concentration with depth for ground-water upgradient to NML: (A) TW10, (B) TW07, and (C) at TW02 below the HBHA Pond sediments adjacent to NML. The dates for maximum flow observed at the USGS 01102500 station and the subsequent NML sampling dates are shown in Panel C with open and closed triangles, respectively. The inset in Panel C documents changes in the dissolved arsenic depth profile in the south end of the HBHA Pond as a result of the March 2001 peak surface flow. Error of duplicate measurements is within the size of the data symbol.
15

16
September 13, 2001, and this increase was most signifi cant near the sediment-water interface. Insignifi cant changes in dissolved arsenic were observed in sediment pore water (NML-9) and the underlying shallow aquifer (NML-10; TW02 in Figure 9C) at this location within the HBHA Pond. The concentration of dissolved arsenic at the sediment-water interface (NML-8) exceeded the concentrations observed at all proximate ground-water monitoring locations (compare Figures 9 and 10). For this reason, it was proposed that two separate processes were contributing arsenic to the HBHA Pond water column: 1) direct ground-water discharge and 2) dissolution of fresh arsenic-bearing suspended solids deposited within the reducing sediments subsequent to the March 2001 peak surface fl ow. Based on the arsenic vertical profi les, it appeared that ground-water discharge dominated arsenic fl ux into the northern end of the HBHA Pond during the period April 5 to at least May 14, 2001 (Phase 1 in Figure 7). After May 14, 2001, the arsenic fl ux was derived from a combination of ground-water discharge and the apparent dissolution of arsenic-bearing iron oxides that had settled into the anoxic portion of the water column (Phase 2 in Figure 7). This data set would have been strengthened by additional sampling at the NML location during the period of May-September 2001. However, the
water dilution to allow observation of changes in water chemistry following the peak fl ow event. According to specifi c conductance measurements, the pre-storm stratifi cation in the water column was re-established by May 14, 2001, or earlier. Variations in specifi c conductance observed beyond this date within the water column and the underlying shallow aquifer (see Figure 10 caption) were smaller in magnitude and representative of non-storm fl ow conditions. The stable specifi c conductance profi le indicates re-establishment of a new steady-state mixing profi le between ground-water and surface-water inputs into the HBHA Pond.
In contrast, evolution of the vertical distribution of dissolved arsenic did not parallel that observed for specifi c conduc-tance (Figure 10, right panel). Assuming that specifi c conductance can be used as a conservative indicator for water chemistry in this system, the observed changes in the vertical distribution of arsenic indicated the infl uence of processes other than mixing of different water sources. Up to May 14, 2001, the vertical distribution of arsenic appeared to evolve in a fashion similar to that observed for specifi c conductance. The greatest change was again observed over the depth interval of approximately 8-11 feet. However, arsenic concentrations continued to increase up to
Figure 10. Water column recovery following the March 2001 peak surface fl ow event based on specifi c conductance and dissolved arsenic measurements. The vertical location of the NML sampling ports is shown relative to upgradient (TW07) and adjacent (TW02) ground-water sampling locations (see aerial view in Figure 4). Error of duplicate measurements is within the size of the data symbol. The mean and standard deviation for specifi c conductance at NML-2, NML-6, NML-8, and NML-10 for the period of April – September 2001 are 804 ± 136 (n=5), 8006 ± 2964 (n=5), 13665 ± 515 (n=4), 15445 ± 876 (n=4) µS/cm, respectively. For comparison, the mean and standard deviation for specifi c conductance at TW07-2 and TW02 for the period of April 2000 to September 2001 are 960 ± 312 (n=5) and 8852 ± 342 (n=5) µS/cm, respectively.

17
for the system. However, the estimated values for arsenic fl ux indicate that sediment dissolution can account for a signifi cant fraction of the total mass of dissolved arsenic within the HBHA Pond water column.
Revised Site Conceptual Model
The patterns in ground-water and surface-water solute chemistry can be used to revise the initial site conceptual model. Upgradient ground water is clearly a source of ar-senic into the HBHA Pond. A fraction of the arsenic derived from ground water is partitioned to sediments along the margin and the bottom of the pond (400-1500 mg As/kg for sediments at the sediment-water interface over the aerial extent of the HBHA Pond). However, patterns in dissolved As and Fe observed in the north end of the HBHA Pond indicated that an internal recycling process contributed a fraction of the observed concentration of these solutes within the intermediate and deep portions of the pond. The elevated concentration of As observed at the NML sampling location on September 2001 was likely derived from dis-solution of As-bearing iron oxides deposited at the bottom of the HBHA Pond. A general schematic of arsenic fl uxes into and out of the HBHA Pond water column is shown in Figure 11. A key component that contributes to the arse-nic mass balance within the water column is the internal recycling of arsenic originally derived from ground-water discharge (Ford, 2004).
relative stability of measured specifi c conductance above the sediment-water interface and the underlying aquifer indicated that the monitoring data suffi ciently captured the endpoints of the transition following post-storm recovery.
Estimates of the magnitude of the arsenic fl ux from ground-water discharge and dissolution of arsenic-bearing iron oxides formed within the HBHA Pond water column can be used to assess the relative importance of these two sources of arsenic to the water column. Assuming a cross-sectional area for the arsenic-bearing plume of 852 ft2 (approximately 426 ft of shoreline over a depth interval of 2 ft between sampling locations NML-4 and NML-7) and an average arsenic concentration of 1.5 mg As L-1, an instantaneous arsenic aerial fl ux of 0.0018 mg As L-1 ft-2 was derived from ground-water discharge at the north end of the HBHA Pond. The fl ux of arsenic from sediment dissolution/desorption can be estimated assuming that all arsenic is derived from a depth within the HBHA Pond corresponding to the location of NML-8. A bathymetric survey of the HBHA Pond (data not shown) indicated an approximate sediment area of 3,726 ft2 at this depth within the north end of the pond. Thus, the instantaneous aerial fl ux of arsenic derived from sediment dissolution/desorption on September 13, 2001, near NML-8 (approximately 5 mg As L-1) was 0.0013 mg As L-1 ft-2. The reader is cautioned that these are estimates that represent a snapshot in time
Figure 11. Revised conceptual model illustrating the arsenic fl ux balance within the HBHA Pond water column and em-phasizing the importance of internal recycling of arsenic between the water column and sediments. Inputs of arsenic into the water column (shown with a plus sign) include discharge of site-derived ground water and dissolution/re-suspension of contaminated sediments. Removal of arsenic from the water column (shown with a minus sign) is due to a combination of discharge at the pond outlet and arsenic removal during iron oxidation-precipitation (HFO = hydrous ferric oxide) and settling at the chemocline and partitioning of arsenic to reduced sediments during diagenesis and burial.
The internal recycling process is due to the coupling of iron oxidation-reduction processes that, in part, control the distribution of arsenic between water and solids within the water column (Figure 11). Observations within the HBHA Pond water column indicate that ferrous iron generated from dissolution of iron minerals diffuses upward from within the water column (Process 1). When diffusing ferrous iron encounters dissolved oxygen at the chemocline within the water column, it is oxidized and precipitated (Process 2). Poorly crystalline iron oxides collected within the HBHA Pond at the chemocline contain signifi cant concentrations of arsenic, since these precipitates efficiently sequester arsenic at the pH within the HBHA Pond (Ford, 2002). The iron oxides subsequently settle back to the sediment-water interface and are subject to iron reduction and dissolution, again releasing coprecipitated/adsorbed arsenic (Process 3). A fraction of the arsenic derived from settled suspended solids is likely incorporated into the sediments (Process 4). A similar process has been documented in lake and stream sediments where iron oxides were abundant (Har-rington et al., 1998; Nagorski and Moore, 1999; Senn and Hemond, 2002).
Conclusions and Implications for Site Characterization
The importance of arsenic partitioning to Fe-bearing sol-ids within the HBHA Pond impacts both the approach to characterizing the GW/SW transition zone and assessing the fate of arsenic within the surface-water body. Temporal and spatial measurements of arsenic within ground water and surface water coupled with knowledge of arsenic partitioning to solids within the HBHA Pond demonstrated that ground-water discharge was not the only contributor to dissolved arsenic concentrations within the pond water column. Measured specifi c conductance proximate to the sediment-water interface at the NML monitoring location and adjacent shallow aquifer locations served as a constraint for delineating an arsenic flux at the sediment-water interface that was separate from direct ground-water discharge. This observation supported the importance of recognizing the distinct properties of sediments in direct contact with the surface-water body as well as the aquifer solids that may exist within the GW/SW transition zone (as illustrated in Figure 1). The apparent instability of arsenic associated with sediments at the bottom of the HBHA Pond also indi-cates that elimination of the ground-water arsenic source will not necessarily eliminate dissolved arsenic within the lake water column. The potential for sediments to serve as a secondary source of arsenic to surface water is an important factor to be recognized with respect to selec-tion of remedial alternatives and evaluation of subsequent performance monitoring data. Due to the importance of inorganic contaminant sorption to solids, the approach to characterization of the GW/SW transition zone employed at this site has general applicability to other sites impacted by inorganic contaminants in ground water. Specifically, the value of detailed temporal monitoring during hydraulic transients within the site can provide useful information for delineating coupled processes that are difficult to discern within these complex systems.
Overall, the behavior of arsenic at this contaminant site illustrates the level of complexity one may anticipate for evaluating fate and transport of contaminants across the GW/SW transition zone. This and other studies indicate that site monitoring to support a reliable conceptual model must properly address spatial and temporal variations that are a common trait of this environmental setting. The density of data collection will be dictated by the complexity of the geomorphic setting as well as the variability in lo-cal climatic conditions that can influence both the system hydrology and biogeochemistry. The field study presented here and the literature studies highlighted earlier all point to the need to monitor during base-flow conditions and during times when system hydrology is perturbed from base-flow, e.g., during a storm cycle. Observation of the response and recovery of the GW/SW transition zone to significant perturbations to the hydrologic system could provide use-ful insight into the system functionality. First, this type of monitoring data will provide a realistic assessment of the range in the magnitude and directionality of contaminant flux that can be anticipated for the system. In addition, for complex systems with multiple potential contaminant sources this type of monitoring data may provide the most straightforward means to delineate the relative importance of the various contaminant sources and the dominant pro-cesses controlling contaminant transport into or out of the surface-water body.
Acknowledgement Richard Wilkin, Frank Beck, Jr., Patrick Clark, Thomas Holdsworth, Cynthia Paul, and Joseph LeMay provided valuable assistance and guidance during field sampling. Ning Xu and Sandra Saye provided analytical support for determination of metals, and Victor Murray provided support for GIS applications under Contract #68-C-98-138. Martha Williams provided support for document formatting under Contract #68W01032, Task Order 2018. This manuscript benefi ted significantly from critical and constructive reviews from Bart Faulkner (USEPA), Douglas Kent (USGS), Sonia Nagorski (University of Alaska Southeast), Donald Rosen-berry (USGS), Rebecca Schneider (Cornell University), and representatives from the USEPA Ground Water Forum and Ecosystem Risk Assessment Forum.
Notice The U. S. Environmental Protection Agency through its Office of Research and Development funded the research described here. This research brief has been subjected to Agency's peer and administrative review and has been approved for publication as an EPA document. Mention of trade names or commercial products does not constitute endorsement or recommendation for use.
References Ahel, M. Infiltration of organic pollutants into groundwater:
Field studies in the alluvial aquifer of the Sava River. Bulletin of Environmental Contamination and Toxicology 47: 586-593 (1991).
Ahel, M., C. Schaffner, and W. Giger. Behaviour of al-kylphenol polyethoxylate surfactants in the aquatic environment-III. Occurrence and elimination of their
18

persistent metabolites during infiltration of river water to groundwater. Water Research 30: 37-46 (1996).
Aurilio, A. C., R. P. Mason, and H. F. Hemond. Speciation and fate of arsenic in three lakes of the Aberjona wa-tershed. Environmental Science and Technology 28: 577-585 (1994).
Benner, S. G., E. W. Smart, and J. N. Moore. Metal behavior during surface-groundwater interaction, Silver Bow Creek, Montana. Environmental Science and Technol-ogy 29: 1789-1795 (1995).
Biksey, T. M., and E. D. Gross. The hyporheic zone: linking groundwater and surface water – understanding the paradigm. Remediation 12: 55-62 (2001).
Bourg, A. C. M., and C. Bertin. Biogeochemical processes during the infiltration of river water into an alluvial aquifer. Environmental Science and Technology 27: 661-666 (1993).
Bourg, A. C. M., and C. Bertin. Seasonal and spatial trends in manganese solubility in an alluvial aquifer. Environ-mental Science and Technology 28: 868-876 (1994).
Buscheck, T. E., N. Nijhawan, and K. O’Reilly. “Mass flux estimates to assist remediation decision-making.” In 2003 Proceedings of the Seventh International In Situ and On-Site Bioremediation Symposium, Orlando, FL, 2004.
Capone, D. G., and M. F. Bautista. A groundwater source of nitrate in nearshore marine sediments. Nature 313: 214-216 (1985).
Chambers, R. M., and W. E. Odum. Porewater oxidation, dis-solved phosphate and the iron curtain: Iron-phosphorus relations in tidal freshwater marshes. Biogeochemistry 10: 37-52 (1990).
Chapelle, F. H. Ground Water Microbiology and Geochem-istry. New York: Wiley, 1993, 424.
Conant Jr., B. “Ground-water plume behavior near the ground-water/surface water interface of a river.” In Proceedings of the Ground-Water/Surface-Water In-teractions Workshop, Denver, CO, 1999.
Conant Jr., B. Delineating and quantifying ground water dis-charge zones using streambed temperatures. Ground Water 42: 243-257 (2004).
Conant Jr., B., J. A. Cherry, and R. W. Gillham. A PCE groundwater plume discharging to a river: influence of the streambed and near-river zone on contaminant distributions. Journal of Contaminant Hydrology 73: 249-279 (2004).
Davis, A., J. H. Kempton, A. Nicholson, and B.Yare. Ground-water transport of arsenic and chromium at a histori-cal tannery, Woburn, Massachusetts, U.S.A. Applied Geochemistry 9: 569-582 (1994).
Davis, A., C. Sellstone, S. Clough, R. Barrick, and B.Yare. Bioaccumulation of arsenic, chromium, and lead in fish: constraints imposed by sediment geochemistry.
Applied Geochemistry 11: 409-423 (1996).
Ding, W. H., J. Wu, M. Semadeni, and M. Reinhard. Occur-rence and behavior of wastewater indicators in the Santa Ana River and the underlying aquifer. Chemosphere 39: 1781-1794 (1999).
Doss, P. K. The nature of a dynamic water table in a system of non-tidal, freshwater coastal wetlands. Journal of Hydrology 141: 107-126 (1993).
Doussan, C., G. Poitevin, E. Ledoux, and M. Detay. River bank filtration: modeling of the changes in water chem-istry with emphasis on nitrogen species. Journal of Contaminant Hydrology 25: 129-156 (1997).
Durant, J. L., J. J. Zemach, and H. F. Hemond. The history of leather industry waste contamination in the Aberjona watershed: A mass balance approach.Civil Engineering Practice 5: 41-66 (1990).
Einarson, M.D., and D. M. Mackay. Predicting impacts of groundwater contamination. Environmental Science and Technology 35: 66A-73A (2001).
Ferrey, M. L., R. T. Wilkin, R. G. Ford, and J. T. Wilson. Nonbiological removal of cis-Dichloroethylene and 1,1-Dichloroethylene in aquifer sediment containing magnetite. Environmental Science and Technology 38: 1746-1752 (2004).
Ford, R. G. Rates of hydrous ferric oxide crystallization and the influence on coprecipitated arsenate.Environmental Science and Technology 36: 2459-2463 (2002).
Ford, R. G. Industri-Plex Superfund Site Natural Attenua-tion Study, EPA/600/X-04/019. Cincinnati, OH: U.S. Environmental Protection Agency, 2004.
Fraser, C. J. D., N. T. Roulet, and M. Lafluer. Groundwater flow patterns in a large peatland. Journal of Hydrology 246: 142-154 (2001).
Fuller, C. C., and J. W. Harvey. Reactive uptake of trace metals in the hyporheic zone of a mining-contaminated stream, Pinal Creek, Arizona. Environmental Science and Technology 34: 1150-1155 (2000).
Griggs, E. M., L. R. Kump, and J. K. Bohlke. The fate of wastewater-derived nitrate in the subsurface of the Florida Keys: Key Colony Beach, Florida. Estuarine, Coastal and Shelf Science 58: 517-539 (2003).
Grimaldi, C., V. Viaud, F. Massa, L. Carteaux, S. Derosch, A. Regeard, Y. Fauvel, N. Gilliet, and F. Rouault. Stream nitrate variations explained by ground water head fluctuations in a pyrite-bearing aquifer. Journal of En-vironmental Quality 33: 994-1001 (2004).
Grischek, T., K. M. Hiscock, T. Metschies, P. F. Dennis, and W. Nestler. Factors affecting denitrification during infi ltration of river water into a sand and gravel aquifer in Saxony, Germany. Water Research 32: 450-460 (1998).
Groffman, A. R., and L. J. Crossey.Transient redox regimes in a shallow alluvial aquifer. Chemical Geology 161: 415-442 (1999).
19

Happell, J. D., R. M. Price, Z.Top, and P. K. Swart. Evidence for the removal of CFC-11, CFC-12, and CFC-13 at the groundwater-surface water interface in the Everglades. Journal of Hydrology 279: 94-105 (2003).
Harrington, J. M., S. E. Fendorf, and R. F. Rosenzweig. Biotic generation of arsenic(III) in metal(loid) contaminated freshwater lake sediments.Environmental Science and Technology 32: 2425-2430 (1998).
Harvey, J. W., and C. C. Fuller. Effect of enhanced manga-nese oxidation in the hyporheic zone on basin-scale geochemical mass balance.Water Resources Research 34: 623-636 (1998).
Holloway, J. M., and R. A. Dahlgren. Seasonal and event-scale variations in solute chemistry for four Sierra Nevada catchments. Journal of Hydrology 250: 106-121 (2001).
Jacobs, L. A., H. R. von Gunten, R. Keil, and M. Kuslys. Geochemical changes along a river-groundwater infil-tration flow path: Glattfelden, Switzerland. Geochimica et Cosmochimica Acta 52: 2693-2706 (1998).
Jaynes, M. L., and S. R. Carpenter. Effects of vascular and nonvascular macrophytes on sediment redox and solute dynamics. Ecology 67: 875-882 (1986).
Jones, C. A., D. A. Nimick, and R. B. McCleskey. Relative effect of temperature and pH on diel cycling of dissolved trace elements in Prickly Pear Creek, Montana. Water, Air, and Soil Pollution 153: 95-113 (2004).
Langmuir, D. Aqueous Environmental Geochemistry, New Jersey: Prentice Hall, Inc., 1997, 600.
Law, S. A., T. F. Bidleman, M. J. Martin, and M. V. Ruby. Evidence of enantioselective degradation of α-hexchlo-rocyclohexane in groundwater.Environmental Science and Technology 38: 1633-1638 (2004).
Lendvay, J. M., S. M. Dean, and P. Adriaens. Temporal and spatial trends in biogeochemical conditions at a groundwater/surface water interface: Implications for natural bioattenuation. Environmental Science and Technology 23: 3472-3478 (1998).
Lorah, M. M., and L. D. Olsen. Natural attenuation of chlori-nated volatile organic compounds in a freshwater tidal wetland: Field evidence of anaerobic biodegradation. Water Resources Research 35: 3811-3827 (1999).
Massmann, G., A. Pekdeger, and C. Merz. Redox processes in the Oderbruch polder groundwater flow system in Germany. Applied Geochemistry 19: 863-886 (2004).
McCobb, T. D., D. R. LeBlanc, D. A.Walter, K. M. Hess, K. M., D. B. Kent, and R. L. Smith. Phosphorous in a ground-water contaminant plume discharging to Ashumet Pond, Cape Cod, Massachusetts, 1999. USGS Water-Resources Investigations Report 02-4306, 2003.
Moore, J. N. “Contaminant mobilization resulting from re-dox pumping in a metal-contaminated river-reservoir system.” In Environmental Chemistry of Lakes and
Reservoirs, by American Chemical Society, Washing-ton, DC: L. A. Baker, 1994, 451-471.
Moore, J. N., W. H. Ficklin, and C. Johns. Partitioning of arsenic and metals in reducing sulfidic sediments. Environmental Science and Technology 22 (4), 432-437 (1988).
Morgan J. J., and Stone, A. T. “Kinetics of chemical pro-cesses of importance in lacustrine environments.” In Chemical Processes in Lakes, New York: John Wiley & Sons, Inc., 1985, 389-426.
Nagorski, S. A., and J. N. Moore. Arsenic mobilization in the hyporheic zone of a contaminated stream. Water Resources Research, 35: 3441-3450 (1999).
Puls, R. W., and C. J. Paul. Low-flow purging of monitor-ing wells and field filtration of groundwater samples. Ground Water Monitoring and Remediation 15: 116-123 (1995).
Savoie, J. G., D. R. LeBlanc, D. S. Blackwood, T. D. Mc-Cobb, and R. R. Rendigs. Delineation of discharge areas of two contaminant plumes by use of diffusion samplers, Johns Pond, Cape Cod, Massachusetts, 1998. USGS Water-Resources Investigations Report 00-4017, 2000.
Schwarzenbach, R. P., W. Giger, E. Hoehn, and J. K. Schneider. Behavior of organic compounds during infiltration of river water to groundwater field studies. Environmental Science and Technology 17: 472-479. (1983)
Sebestyen, S. D., and R. L. Schneider. Seepage patterns, pore water, and aquatic plants: hydrological and bio-geochemical relationships in lakes. Biogeochemistry 68: 383-409 (2004).
Senn, D. B., and H. F. Hemond. Nitrate controls on iron and arsenic in an urban lake. Science 296: 2373-2376 (2002).
Stumm, W., and Morgan, J. J. Aquatic Chemistry, 3rd ed., New York: John Wiley & Sons, Inc., 1996, 1022.
Tomassoni, G. “A federal statutory/regulatory/policy per-spective on remedial decision-making with respect to ground-water/surface-water interaction.” In Proceed-ings of the Ground-Water/Surface-Water Interactions Workshop, Denver, CO,1999.
Triska, F. J., J. H. Duff, and R. J. Avanzino. The role of water exchange between a stream channel and its hyporheic zone in nitrogen cycling at the terrestrial-aquatic inter-face. Hydrobiologia 251: 167-184. (1993).
U. S. EPA. A Review of Methods for Assessing Nonpoint Source Contaminated Ground-Water Discharge to Surface Water. EPA 570/9-91/010, U. S. Environmental Protection Agency, Office of Water, Washington, DC, 1991.
U.S. EPA. Biological Indicators of Ground Water – Surface Water Interaction: Update. EPA 816-R-98-018,
20

U.S. Environmental Protection Agency, Office of Water, Washington, DC, 1998a. http://www.epa.gov/safewa-ter/swp/bioind.pdf
U.S. EPA. Technical Protocol for Evaluating Natural Attenu-ation of Chlorinated Solvents in Ground Water. EPA 600/R-98/128, U.S. Environmental Protection Agency, Office of Research and Development, Washington, DC, 1998b. http://www.epa.gov/ada/download/reports/pro-tocol.pdf
U. S. EPA.Proceedings of the Ground-Water/Surface-Water Interactions Workshop. EPA 542/R-00/007, Office of Solid Waste and Emergency Response, Washington, DC, 2000a. http://www.clu-in.org/s.focus/c/pub/i/600/
U. S. EPA. Workshop on Monitoring Oxidation-Reduction Processes for Ground-water Restoration. EPA/600/R-02/002, Office of Research and Development, Wash-ington, DC, 2000b. http://www.epa.gov/ada/download/ reports/epa_600_r02_002.pdf
von Gunten, H. R., G. Karametaxas, U. Krahenbuhl, M. Kuslys, R. Giovanoli, E. Hoehn, and R. Keil. Seasonal biogeochemical cycles in riverborne groundwater. Geochimica et Cosmochimica Acta. 55: 3597-3609 (1991).
Vroblesky, D. A., M. M. Lorah, and S. P. Trimble. Mapping zones of contaminated ground-water discharge using creek-bottom-sediment vapor samplers, Aberdeen Proving Ground, Maryland. Ground Water 29: 7-12 (1991).
Vroblesky, D. A., and F. H. Chapelle. Temporal and spatial changes of terminal electron-accepting processes in a petroleum hydrocarbon-contaminated aquifer and the significance for contaminant biodegradation. Water Resources Research 30: 1561-1570 (1994).
Vroblesky, D. A., L. C. Rhodes, J. F. Robertson, and J. A. Harrigan. Locating VOC contamination in a fractured-rock aquifer at the ground-water/surface-water inter-face using passive vapor collectors. Ground Water 34: 223-230 (1996).
Wick, L.Y., and P. M. Gschwend. Source and chemodynamic behavior of diphenyl sulfone and ortho- and para-hy-droxybiphenyl in a small lake receiving discharges from an adjacent superfund site.Environmental Science and Technology 32: 1319-1328 (1998a).
Wick, L.Y., and P. M. Gschwend. By-products of a former phenol manufacturing site in a small lake adjacent to a superfund site in the Aberjona watershed.Environmen-tal Health Perspectives 106: 1069-1074 (1998b).
Wick, L.Y., K. McNeill, M. Rojo, E. Medilanski, and P. M. Gschwend. Fate of benzene in a stratified lake re-ceiving contaminated groundwater discharges from a superfund site.Environmental Science and Technology 34: 4354-4362 (2000).
Wilkin, R. T., and R. G. Ford. Use of hydrochloric acid for determining solid-phase arsenic partitioning in sulfidic sediments.Environmental Science and Technology 36: 4921-4927 (2002).
Winter, T. C., J. W. Harvey, O. L. Franke, and W. M. Alley. Ground water and surface water: a single resource. USGS Circular 1139, (1998) http://water.usgs.gov/ pubs/circ/circ1139/pdf/circ1139.pdf
21

Please make all necessary changes on the below label, detach PRESORTED STANDARD or copy, and return to the address in the upper left-hand corner. POSTAGE & FEES PAID
If you do not wish to receive these reports CHECK HERE ; EPA detach, or copy this cover, and return to the address in the upper PERMIT No. G-35 left-hand corner.
National Risk Management Research Laboratory Cincinnati, OH 45268
Offi cial Business Penalty for Private Use $300
EPA/600/S-05/002 January 2005
Recycled/Recyclable Printed with vegetable-based ink on paper that contains a minimum of
processed chlorine free. 50% post-consumer fi ber content