environmental regulations and multinational corporations...
TRANSCRIPT
Environmental Regulations and MultinationalCorporations’ Foreign Market Entry Investments
Jorge Rivera and Chang Hoon Oh
In this study, we examine how differences in environmental regulation characteristics are linked tomultinational corporations’ (MNCs) foreign market entry (FME) investments decisions around theworld. We rely on a data set with 29,303 observations from 94 European Fortune Global 500 companiesoperating across 77 countries during the period 2001–2007. We found that MNCs are more likely toenter countries with more certain—i.e., clearer and more stable—environmental regulations than thoseof their home countries. Results also suggest that there is a higher level of MNC entry into foreigncountries with environmental regulations that are more stringent than those of their home countries.This finding challenges the controversial but commonly held view that more stringent environmentalregulations deter MNCs’ FME investments. Notably, the magnitude of the regulatory certaintyrelationship with MNCs’ FME investments is larger than that of regulatory stringency. Findings alsoindicate that the increased tendency of MNCs to enter countries with more stringent environmentalregulations is higher in more democratic countries and for cleaner industry firms.
KEY WORDS: environmental policy, multinational corporations, foreign investment, regulation cer-tainty, regulation stringency
Introduction
The nature of the relationship between environmental regulations and eco-nomic activities, such as foreign direct investment (FDI) and international trade, isa topic that, for decades, has drawn much attention from influential groups aroundthe globe. When considering FDIs by multinational corporations (MNCs), much ofthe focus of environmental policymaking debates and the scholarly literature havebeen on whether environmental regulation stringency negatively affects theseinvestments. The controversial but popular “race to the bottom” perspective sug-gests a vicious cycle dynamic in which countries have to steadily relax their envi-ronmental protection requirements to attract more FDI (Koniski, 2008; Potoski,2001; Woods, 2006). Despite its controversial nature, the race to the bottom viewcontinues to be frequently embraced in heated public policy debates (Koniski,2008), thus encouraging passionate, and sometimes violent, resistance by environ-mental activists to the promotion of free-trade and globalization.1 Interestingly,
bs_bs_banner
The Policy Studies Journal, Vol. 41, No. 2, 2013
243
0190-292X © 2013 Policy Studies OrganizationPublished by Wiley Periodicals, Inc., 350 Main Street, Malden, MA 02148, USA, and 9600 Garsington Road, Oxford, OX4 2DQ.

major U.S. industry groupsthat have dismissed the race to the bottom perspectiveare now opposing the adoption of new environmental regulations because of theirsupposed threat to economic growth and business investment.2 Yet, the scholarlyliterature examining the link between FDI and environmental regulations’ strin-gency offers opposing conceptual views and non-conclusive empirical evidence(Darnall, 2009; Madsen, 2009).3
To be sure, when making FDI decisions, managers may consider other charac-teristics of environmental regulations, such as their certainty. Given the long-termnature of most environmental investments, regulations’ certainty is particularlyimportant for encouraging firms to develop and adopt efficient and/or innovativeways of compliance. Additionally, a country’s democratic context and the type ofindustry may change how business managers perceive the nature of the relationshipbetween FDI and environmental regulations’ characteristics. This is because the costsof compliance vary greatly across industries. Democracy levels also vary widelyacross countries and they shape the power of business and other interest groupsduring the environmental policy process. Accordingly, we address the followingquestions: Are differences in the certainty of environmental regulations (betweenhost and home countries) linked to MNCs’ foreign market entry (FME) investments?How do host countries’ democracy levels moderate the relationship between MNCs’FME investments and environmental regulations’ stringency and certainty? Howdoes the type of industry moderate the relationship between MNCs’ FME invest-ments and environmental regulations’ stringency and certainty?
The term FME investment, a particular kind of FDI, is used in this article to referto the initial establishment of a MNC’s wholly owned subsidiary in a foreigncountry. It does not include expansions of already existing subsidiaries or subse-quent entries by other subsidiaries of a given MNC. Our focus on FME investmentshas the advantage of examining those investments for which firms need to dedicateconsiderable resources to a foreign country. This is because the initial establishmentof a wholly owned subsidiary brings substantial responsibility, commitment, andhigher risks to a MNC’s headquarters (Anderson & Coughlan, 1987; Hill, Hwang, &Kim, 1990).
To answer our research questions, we rely on over 29,000 observations of FMEinvestment decisions from European Fortune Global 500 companies operating across77 countries during 2001–2007. We focus on these 7 years because for this period,worldwide cross-country data are publicly available to measure the perceived levelsof environmental regulatory stringency and certainty by top corporate managers.Our analysis of FME investments by individual companies contributes to previousempirical studies that have relied on industry-level FDI trends to examine decisionsthat are obviously made by the managers of individual firms (Kolk & Pinkse, 2005;Madsen, 2009).4 Additionally, the wide variety of foreign host countries and Euro-pean MNCs from multiple industries included in our study provides managers andpolicymakers with more generalizable findings than those of previous research.Earlier research has tended to focus on data from a single or a few heavy manufac-turing industries in the United States to examine the relationship between environ-mental policy and MNCs’ FME investments decisions.
244 Policy Studies Journal, 41:2

Literature Review
Trends in Environmental Regulations and Foreign Direct Investment
Since the early 1970s when the first major environmental protection policies andgovernment agencies were established in Europe and the United States, the strin-gency and number of environmental regulations have greatly increased, not only inindustrialized countries but also in developing nations around the world. Mostcountries now have high-level government agencies or ministries equivalent to theU.S. Environmental Protection Agency (U.S. EPA). Additionally, given the risingprevalence of local and global environmental problems, the enactment of morestringent environmental regulations is expected to continue growing in both devel-oped and developing countries. Regulatory stringency is understood here as thelevel of severity of a particular regulation’s targets and requirements.
Estimates of the cost of these regulations suggest that expenditures vary between0.6 percent and 2 percent of gross domestic product (GDP) among industrializedcountries (OECD, 1999). European MNCs are used to have very strict levels ofenvironmental regulations and tend to take a proactive approach to environmentalprotection (Ramus & Steger, 2000). A small number of European countries, such asGermany, Denmark, and the Netherlands, have some of the most stringent environ-mental regulations in the world. Similarly, Finland has some of the most certainenvironmental regulations followed by Denmark and Sweden. Regulatory certaintyrefers in this article to the degree of clarity and stability of a regulation’s targets andrequirements (Bressers & Rosenbaum, 2000; Marcus, 1981). A few non-Europeannations such as the United States, Australia, and New Zealand have environmentalregulation stringency and certainty levels comparable with those in northernEurope. Yet, it is important to stress that countries in southern Europe (e.g., Spainand Portugal) have had local environmental regulations that show lower levels ofstringency and certainty than those in the north.
Trends in outward FDI have similarly shown a steady increase since the 1970sthanks in part to a steady worldwide decrease in countries’ restrictions and tariffs onforeign ownership and international trade. In fact, for the 2001–2007 period, outwardFDI showed an expansion of more than 200 percent in real terms from US$8.7 to 18billion (UNCTAD, 2010). During this period outward FDI by the European Unioncountries increased about 2.5 times from US$3.5 to 8.9 billion (UNCTAD, 2010). Onaverage, a large European Union company listed in the Fortune Global 500 had 46subsidiaries across 14 countries in 2001, and 59 subsidiaries across 18 countries in2007.
Multinational Corporations’ Foreign Market Entry Investments:Key Concepts and Empirical Findings
There is a large literature examining the determinants of FME by MNCs. Thisliterature is influenced by multiple theoretical perspectives highlighting differentforeign country characteristics and firm-level factors that increase the tendency of
Rivera and Oh: Environmental Regulation and Foreign Entry 245

MNCs to establish subsidiaries in specific foreign countries. At the most basic level,previous work has suggested that MNCs are less likely to enter countries that aregeographically distant, have smaller markets, or that impose stricter limits on foreigninvestment (Caves, 1996; Dunning, 1998). Besides geographic proximity, it tends tobe easier for firms to successfully enter foreign countries that have cultures andinstitutions that are more similar to those of the firms’ home countries (Fratianni,2009; Ghemawat, 2007; Kostova, 1997; Madsen, 2009). Firms tend to go abroadsequentially starting with neighboring geographic countries because internationalinvestments are inherently seen as more risky than domestic ones. This process ofincremental expansion permits the firm to gain knowledge about foreign markets,and such learning is facilitated through sequential expansion to more and moredistant foreign markets (Johanson & Vahlne, 1977; Kogut & Zander, 1993).
The higher complexity of organizing and managing foreign subsidiaries requiresMNCs to possess and develop resources and capabilities to overcome the increasedmarket, political, and cultural risks of overseas operations. Previous FME researchsuggests that the MNCs better able to overcome these risks are those that are larger,more profitable, more geographically diversified, own more proprietary technolo-gies, and have more differentiation, trademarks, or brand equities (Dunning, 1998).
Perspectives on Environmental Regulations and Multinational Corporations’ ForeignMarket Entry Investments
The Pollution Haven Hypothesis. The large differences in the stringency, quantity, andenforcement of environmental regulations between industrialized and developingcountries have been well established by multiple scholars (Blackman, 2006; Shah &Rivera, 2007; Wehrmeyer & Mulugetta, 1999). The magnitude of these mismatchescan be illustrated by comparing the number of full-time employees at the U.S. EPA,almost 18,000 in 2005, with those at the Chinese State EPA, about 400 for the sameyear (Balfour, 2005, p. 122). These differences have, for a long time, generated seriouscontroversies and concerns about the nature of the relationship between environ-mental regulations and economic activity. The “pollution haven hypothesis” assumesthat valuable manufacturing and natural resource extraction businesses relocate todeveloping countries to take advantage of lax and seldom enforced environmentalregulations. This perspective relies on the basic assumption that the costs of envi-ronmental protection are high enough to make variations in regulatory stringency acritical factor in determining business entry and investment in foreign markets(Ambec, Cohen, Elgie, & Lanoie, 2011; Brunnermeier & Levison, 2004; Jaffe &Palmer, 1997; Madsen, 2009; Palmer, Oates, & Portney, 1995). Firms find environmen-tal regulations costly because they reduce managerial discretion by forcing invest-ments in specific raw materials, manufacturing technologies and practices, andbyproducts disposal among other things. The reduced pollution and enhanced pro-tection of natural resources that result from all these efforts, although beneficial forsociety, do not generate extra income for companies because they are rarely tradablein the marketplace.
246 Policy Studies Journal, 41:2

Awareness that laxer environmental regulations may attract more foreign invest-ment, as the pollution haven hypothesis argument goes, may make policymakersfrom different countries relax environmental regulations even more. Competitionamong countries for limited foreign investment then results in additional regulatorystringency reductions to keep attracting business investment. This generates a “raceto the bottom” dynamic involving the decline of valuable industrial activity indeveloped countries and an acute increase in pollution and the degradation ofnatural resources in developing countries. Additionally, the lenient environmentalprotection requirements in developing nations spurs, rarely successfully, calls forthe adoption, in industrialized countries, of protectionist policies that erect barriersto international trade (Ambec et al., 2011; Brunnermeier & Levison, 2004; Jaffe &Palmer, 1997; Madsen, 2009). Although the pollution haven logic is now controver-sial among scholars because of a large body of contradictory empirical studies (seedetails on next page), it is still common in public debates involving politicians,policymakers, industry associations’ lobbyists, and environmentalists. In sum, thesearguments suggest that: MNCs are more likely to enter foreign markets with environmen-tal regulations that are less stringent than those of their home countries.
Win-Win Perspective on Environmental Regulations. An alternative win-win perspectiveproposed by Porter (1991) suggests that the traditional view espoused by the pollu-tion haven hypothesis follows from analyzing environmental regulations with astatic approach that assumes away changes in environmental technologies, manufac-turing processes, product characteristics, and customer preferences (Porter, 1991;Porter & Van der Linde, 1995a). Proponents of this alternative view argue that whentaking into consideration the intrinsically dynamic nature of competition, technologydevelopment, and customer desires, more stringent environmental regulations thatare appropriately designed can enhance a country’s competitiveness to promotebusiness and attract investment even if they are more rigorous and/or implementedearlier (Palmer et al., 1995; Porter & Van der Linde, 1995a; Seeliger, 1996).
The win-win perspective rejects the assumptions that profit-seeking firms haveperfect access to information, and have already discovered the best and most effi-cient technologies to comply with environmental regulations (Christmann, 1997;Porter & van der Linde, 1995a, 1995b). On the contrary, it emphasizes that becauseof a reactive approach to environmental management, firms systematically fail toconsider pollution as a waste of resources and as a sign of inefficient productionprocesses. Thus, firms often neglect opportunities to improve the efficiency of theirmanufacturing processes (Hart, 1995; Russo & Fouts, 1997). Implementation of envi-ronmental management strategies focused on reducing or eliminating waste before itis created can, e.g., generate cost savings (Koehler, 2007). Additionally, given thegrowing demand for environmentally friendly products and services, stricter envi-ronmental regulations can also help enhance competitiveness by allowing firstmover firms to obtain price premiums and/or gain exclusive access to new environ-mentally sensitive markets (Reinhardt, 1998; Rivera, 2002).5 This reasoning suggeststhat: MNCs are more likely to make FME investments in countries with environmentalregulations that are more stringent than those of their home countries.
Rivera and Oh: Environmental Regulation and Foreign Entry 247

Empirical Evidence. There is a large number of empirical studies examining thecontradictory predictions of the pollution haven hypothesis and the win-win per-spective. Their findings are inconclusive spanning the whole spectrum from insig-nificant to small positive or negative effects of environmental regulation stringency(Domínguez & Grossman, 2007). Even for studies that have found statistically sig-nificant effects, the effect size is smaller than the effect of other country factors suchas, e.g., market size, infrastructure, unionization, etc. (Ambec et al., 2011; Levison,2010). These studies exhibit some key limitations preventing researchers fromdrawing conclusions about the contradictory logics advanced by the win-win per-spective and the pollution haven hypotheses.
First, most of them have been restricted to examining new plant locations indifferent parts of the United States, or on foreign investment decisions by a few U.S.heavy manufacturing industries. Second, previous research focused on plant loca-tion trends at the aggregate industry level, treats all firms as having the samecharacteristics ignoring the competitive advantages gained by the most environmen-tally proactive firms. Third, these studies focus on regulatory stringency, ignoringother characteristics of well-designed environmental regulations that may affectMNC tendency to enter foreign countries. Fourth, previous published work hasused country pollution levels and pollution abatement costs as proxies of environ-mental regulations’ stringency. These proxies are problematic because they can beboth the outcome and the cause of different levels of environmental regulations’stringency.6 Fifth, almost all previous studies examining these issues have used grosslevels of country environmental regulatory stringency to predict MNCs’ FME invest-ment decisions. Yet, the international business literature suggests that host–homecountry differences in regulatory characteristics are better predictors of MNCs’ FMEinvestment decisions than gross measures of these characteristics (Kostova, 1997;Madsen, 2009).
Our analytical approach seeks to address these limitations by examining indi-vidual MNCs’ FME investment decisions for companies from multiple sectors of theeconomy, operating in more than 75 countries around the world. We also avoid usingaggregate pollution levels or pollution abatement costs as proxies for environmentalregulation stringency. Instead, we calculate differences in environmental regulationstringency between host and home countries using data from the World EconomicForum’s (WEF’s) Annual Survey. On an annual basis, this survey gathers top corpo-rate executives’ assessment of countries’ environmental regulations stringency (seedetails in the Methodology section). Additionally, besides stringency, we also con-sider how MNCs’ FME investment is affected by host–home country differences inenvironmental regulations’ certainty.
Environmental Regulations Certainty and Multinational Corporations’Foreign Market Entry Investments
When considering foreign investment, a high degree of certainty should also beconsidered as a critical characteristic of well-designed environmental regulations.Regulatory certainty is understood here as the degree of clarity and stability of a
248 Policy Studies Journal, 41:2

regulation’s targets and requirements (Bressers & Rosenbaum, 2000; Marcus, 1981).Given the long-term nature of most environmental investments, stricter require-ments need to be certain enough to allow firms to develop and adopt innovativeways of compliance. Unstable and/or unclear regulations make it very hard formanagers to predict actual environmental protection requirements and thus signifi-cantly hinder the potential for win-win environmental innovations to accrue gainsfrom higher productivity (Rosenbaum & Bressers, 2000). Given the inherently riskynature of investments in environmental innovations, if environmental requirementsare uncertain, firms will postpone investments in enhanced environmental protec-tion to wait for “final” environmental regulations standards (Johnstone, Hascic, &Popp, 2010; Marcus, 1981).
Business managers also have a strong preference for regulatory certainty becauseit allows them to reduce compliance risks and maintain high levels of legitimacywith multiple stakeholders. Even the most polluting companies seek to develop andsustain reputations as good environmental stewards to improve their “green” legiti-macy (Rivera, de Leon, & Koerber, 2006). This is, however, difficult to do whenenvironmental regulations are unstable and/or unclear because regulatory require-ments determine the minimum benchmark to attain “green” legitimacy. Hence,when examining the relationship between environmental regulations and businessinvestment in different country locations, it is critical to not only consider thestringency of regulations but also their level of certainty. Overall, these argumentscan be summarized by suggesting that: MNCs are more likely to make FME investmentsin countries with environmental regulations that are more certain than those of their homecountries.
Moderating Effect of Political Context and Industry Type
Besides the stringency and certainty of environmental regulations, other countrycontextual characteristics such as economic wealth and market size are known tomoderate how firms perceive the attractiveness of a country for investment and howfirms may respond to environmental protection demands. Political context variables,such as the respect for the rule of law and government stability, are also consideredimportant factors determining a firm’s market entry decisions (Daude & Stein, 2007).Political context factors may also change how businesses respond to environmentalregulations, but these effects have not been extensively explored by empiricalresearch. Most empirical studies examining the moderating effect of political contexton business strategy choices have focused on variations between the more confron-tational U.S. style of politics and policymaking and the more cooperative approachprevalent in Europe (Spencer, Murtha, & Lenway, 2005); thus, assuming very highlevels of democratic rights and freedoms as given.7 Yet, levels of democratizationvary widely around the world. In emerging market countries, democratic traditionsand advocacy channels are more likely to be limited, fragile, and incipient.
Democracy levels are particularly important to consider when examining MNCresponses to environmental regulation, because variations in basic democratic rightsand liberties shape the interaction of different actors during the environmental
Rivera and Oh: Environmental Regulation and Foreign Entry 249
policy process by defining which interest groups and political strategies are legiti-mate, delineating appropriate advocacy procedures, and establishing rules for gov-ernment decision making and law enforcement (Ascher, 1999; Payne, 1995; Rivera,2010). Freedom of the press, speech, association, political participation, and theunhindered right to vote are core rights taken for granted in democratic systems.These rights open information and advocacy channels to multiple grassroots actorsthat in authoritarian regimes are traditionally, and almost exclusively, enjoyed bybusiness, military, and political elites (Ascher, 1999; Grindle & Thomas, 1991). Thesefreedoms are then used by environmentalists and businesses to limit the discretionof public policy makers to enact and implement arbitrary environmental regulations(Rivera, 2010). Hence, in general, business resistance to environmental regulationsmay be lower in democratic countries than in authoritarian ones (Rivera, 2010).
It is also important to consider how industry type may moderate the relationshipbetween FME investments and environmental regulations. Different industriesexperience distinct competition dynamics, cost structures, and regulatory require-ments that influence companies’ profits and their choice of different strategies(Powell, 1996; Rumelt, 1991; Schmalensee, 1985; Tashman & Rivera, 2010). In the caseof environmental regulations, the costs of compliance vary greatly across industries,particularly when comparing firms in “cleaner” manufacturing sectors (e.g., aero-space; computer, office, and electronics; food and drugs; motor vehicle and parts;and pharmaceutical firms) and those operating in “dirty” industries that produce thehighest levels of pollution (e.g., heavy manufacturing industries such as chemicaland oil and gas refining). Environmentalists and government agencies also tend tomonitor more the environmental practices of companies from heavy polluting indus-tries than those from companies in cleaner industries that produce the lower levelsof pollution (Shah & Rivera, 2007). Accordingly, MNCs from dirty industries, withhigher pollution management costs, may be much more averse to investing in coun-tries with more stringent and certain environmental regulations.
In sum, the previously discussed arguments indicate that the relationshipsbetween MNCs’ FME investments and environmental regulations’ stringency andcertainty are moderated by the democratic nature of the host countries and by thetype of industry. Specifically, we suggest that: MNCs’ tendency to make FME invest-ments in countries with more stringent environmental regulations than those of homecountries is: (i) higher in more democratic countries; and (ii) higher for cleaner industryfirms. We also suggest that: MNCs’ tendency to make FME investments in countries withmore certain environmental regulations than those of home countries is: (i) is higher forcleaner industry companies; and (ii) higher in more democratic countries.
Research Methodology
Data Collection and Sample
We used MNCs’ annual reports to shareholders and their yearly legal statementsto the U.S. Securities and Exchange Commission (10-K reports) to collect informationabout their FME investment decisions. Our final sample consisted of a panel data set
250 Policy Studies Journal, 41:2

containing 29,303 company-year observations from 94 MNCs that originated in Euro-pean Union countries. The 94 MNCs were from 13 countries: Austria, Belgium,Denmark, Finland, France, Germany, Ireland, Italy, Luxembourg, the Netherlands,Spain, Sweden, and the U.K. These MNCs operated across 77 foreign countriesduring the period 2001–2007. This sample was drawn from the population of 217European Union companies listed as Fortune Global 500 firms during any yearbetween 2001 and 2007. We excluded three types of companies from this populationof European Fortune Global 500 companies. First, we dropped purely domesticcompanies. Second, we discarded companies that did not list their subsidiary loca-tions for multiple years and those that did not provide firm-level information (e.g.,research and development [R&D] expenditures, sales, general and administrativeexpenditures, geographic sales, and current assets and liabilities). Third, weexcluded companies that did not enter a new foreign country during the observationperiod. In addition, we excluded countries in which MNCs had established subsid-iaries before 2001. The main effect of these exclusions is to focus our analysis onMNCs engaged in FME investment during the 2001–2007 period.
Variable Measures
Dependent Variable—Multinational Corporations’ Foreign Market Entry Investment.Given the binary nature of our dependent variable (entering or avoiding a country),we used a dummy variable equal to one if an MNC invests in a wholly ownedsubsidiary in a foreign country for the first time and zero otherwise.
Independent Variables—National Differences in Environmental Regulation Stringency.We calculated this variable by subtracting the level of a home country’s environmen-tal regulation stringency from that of MNCs’ host country’s environmentalregulation stringency (i.e., host environmental regulation stringency – home envi-ronmental regulation stringency). We used a similar procedure to calculate nationaldifferences in environmental regulation certainty. Data on countries’ environmentalregulation stringency and certainty levels were obtained from the WEF’s AnnualExecutive Opinion Surveys (WEF, 2000–2007).8 In these surveys, top business execu-tives from over 120 countries rank the overall stringency and certainty of countries’environmental regulations. Specifically, we use the answers to two questionsincluded in the WEF Executive Opinion Survey. First, “the stringency of overallenvironmental regulation in your country is: (1 = lax compared with most othercountries, 7 = among the world’s most stringent)” for the environmental regulationstringency dimension. Second, for the environmental regulation certainty dimen-sion: “environmental regulations in your country are: (1 = confusing and frequentlychange, 7 = transparent and stable).” These responses about the perceived environ-mental regulations’ stringency and certainty by top business managers offer the keyadvantage that these executives are also the ones making FME investment decisions.
Country Democracy Levels. To measure this variable we used data on democracyaccountability levels from the International Country Risk Guide by Political Risks
Rivera and Oh: Environmental Regulation and Foreign Entry 251

Service (2010). Democratic accountability is a scale variable with a minimum value ofzero for the most authoritarian governments and maximum value of six for highlydemocratic countries. It measures how responsive a government is to its peoplebased on the following factors: free and fair elections for the legislature and execu-tive; the active presence of more than one political party and a viable opposition;evidence of checks and balances among the executive, legislative and judicialbranches of government; evidence of an independent judiciary; and evidence of theprotection of personal liberties through constitutional or other legal guarantees.
We used dummy variables to indicate four MNC industry type categories: (i) cleanmanufacturing for firms in the least polluting production sectors (aerospace, com-puter, office and electronics, food and drugs, motor vehicle and parts, and pharma-ceutical industries); (ii) heavy (“dirty”) manufacturing for firms in the most pollutingproduction sectors in our sample (chemicals, energy generation utilities, petroleumrefining, and natural resources extraction); (iii) services (entertainment and publish-ing, merchandiser, telecommunications, food services, and transportation servicesfirms); and (iv) finance (bank, insurance, and other financial service firms).
Control Variables. We also include in our regression analysis firm-level and country-level variables to control for factors that are well known to affect MNCs’ FMEinvestment decisions (Delios & Henisz, 2003; Holburn & Zelner, 2010; Oh & Oetzel,2011). The firm-level characteristics included as control variables are: firm size (log ofsales), geographic diversification (entropy measure using geographic sales), R&Dintensity (R&D expenditure divided by sales), advertising intensity (selling, generaland administrative expenditure divided by sales), and financial resources (currentassets divided by liabilities), and managerial capability.9 The data for these variableswere collected from annual reports of sample firms supplemented by CompustatGlobal by Standard & Poor’s and OSIRIS by Bureau van Dijk.
Additionally, we included in our models the following country-level variables:country size (log of GDP), population (log of population), land size (log of squaredkilometers), adult literacy rate (%), unemployment rate (%), openness to trade(import divided by GDP), and openness to FDI (inward FDI flows divided by GDP).Data for these variables were collected from the World Development Indicators bythe World Bank (2010).
We also included the following dyadic-level variables (host–home countries):geographic distance (log of miles), common border (dummy), common language(dummy), colonial relationship (dummy), and institutional closeness (EuropeanUnion membership; dummy). Data for these dyadic-level variables were collectedfrom the Central Intelligence Agency’s World Factbook (CIA, 2010) and supple-mented by various other sources.
Analytical Methodology
Given the dichotomous nature of our dependent variable, MNCs’ FME invest-ment, we used logistic regression for our quantitative analysis. The logit model canbe represented as Equation (1):
252 Policy Studies Journal, 41:2

P y X fX
Xi j t z i j t zi j t z
i j t z, , , , , ,
, , ,
, , ,;
expexp
=( ) = ( ) = ( )+ ( )1 1
1!
!{{ } , (1)
where yi,j,t,z is the entry (0/1) of firm i in industry j to country z at year t. Xi,j,t,z is avector of the independent and control variables, and b is the vector of the coefficientsto be estimated by the econometric modeling. To control for the panel nature of ourdata and for unobserved heteroskedasticity, we included two-digit industry and yearfixed effects. The regression analysis also used heteroskedasticity and autocorrela-tion robust standard errors clustered by firm–host country (Kennedy, 2003). Addi-tionally, in order to reduce possible endogeneity issues, all independent and controlvariables were lagged 1 year.
Findings
Table 1 shows summary descriptive statistics for the variables included in theanalysis. FME frequency distributions by different levels of countries’ stringency andcertainty of environmental regulations are presented in Table 2. The FME frequencydistributions provide initial indication of MNCs’ predilection for investing in coun-tries with more stringent regulations than those of their home countries. Of a total of
Table 1. Summary Statistics
Variable Mean SD Min Max
Entry 0.0554 0.2287 0 1Dirty manufacturing (dummy) 0.2880 0.4528 0 1Clean manufacturing (dummy) 0.1855 0.3887 0 1Service industry (dummy) 0.2671 0.4425 0 1Financial industry (dummy) 0.2594 0.4383 0 1Stringency environmental regulation -1.7802 1.3135 -4.8 2.4Certainty environmental regulation -1.2219 1.0626 -4.3 2.8Democracy accountability 4.4776 1.4325 1 6Firm size (log) 9.8339 0.9862 3.884 12.515Geographic diversification 0.6587 0.3921 0 1.323Financial slack resources 0.8921 0.6876 0 3.773R&D intensity 0.0192 0.0481 -0.001 0.335Advertising intensity 0.4838 0.4545 0 1.663Managerial capability 0.4298 0.2128 0.032 0.908Host country GDP (log) 24.7890 1.7067 20.393 30.053Host country population (log) 16.6043 1.4380 12.896 20.827Host country land size (log) 12.3672 1.9405 5.768 16.612Host country import openness 46.2242 30.0419 9.530 216.310Host country FDI openness 5.6931 23.4701 -14.841 311.900Host country unemployment rate 9.1996 5.6161 0.9 31.1Host country literacy rate 88.2158 14.8016 24 100Common border 0.0297 0.1696 0 1Common language 0.1818 0.3857 0 1Colonial relationship 0.1618 0.3682 0 1Geographic distance (log) 7.9206 0.9961 1 9.417Institutional closeness 0.1839 0.3874 0 1
N = 29,303.
Rivera and Oh: Environmental Regulation and Foreign Entry 253

5,341 MNCs’ FME investments observed in our 7-year database, only 3.4 percentoccurred in countries whose environmental regulations’ stringency was in the bottom20 percent. On the other hand, countries with the top 20 percent most stringentenvironmental regulations received 47.1 percent of all the MNCs’ FME investments.Similarly, countries with environmental regulation certainty in the top 20 percentreceived about 45 percent of all the MNCs’ FME investments. Only 5 percent of theMNCs’ FME investments observed in our database occurred in countries whose levelsof environmental regulation certainty were in the bottom 20 percent.
Table 3 shows the results of the logit regression analysis. In models 1 and 2, weincluded environmental regulation stringency and certainty respectively with allcontrol variables. In models 3 and 4, we added the interaction terms between envi-ronmental regulation stringency and certainty and our moderating variables(national democracy differences and industry categories). As a diagnostic procedurefor our sample and variables, we checked the cross-correlation and variance inflationfactors (average VIF is 3.25 and the highest individual VIF is 6.51) and did not finda symptom of multicollinearity. Additionally, the Akaike information criterion andlikelihood ratio tests showed that adding interaction terms between industrydummy variables and democracy variable and interaction term between environ-mental regulation variables and democracy variable increased the model fit.
The findings from our logistic regression models indicate that the MNCs’ FME ispositively and significantly associated with environmental regulation stringency (seeTable 3, model 1; b = 0.0, p < 0.0) and environmental regulation certainty (see model2; b = 0.0, p < 0.001). It is also important to note that the environmental regulationcertainty coefficient is larger than the stringency one (p < 0.001) (e.g., Johnstone et al.,2010; Marcus, 1981).
The nonlinear nature of our logistic models makes it difficult to interpret theregression coefficients. Hence, we used a simulation-based approach increasingly
Table 2. MNCs’ Foreign Market Entry Investments: Frequency Distributions by Country’sEnvironmental Regulation Stringency and Certainty
Country’s Environmental Regulations Foreign Market Entry Investments
N %
Stringency levels*Top quintile most stringent 2,513 47.1Second quintile 1,766 33.1Third quintile 580 10.9Fourth quintile 298 5.6Bottom quintile 184 3.4Total 5,341 100.0
Certainty levels*Top quintile most certain 2,386 44.7Second quintile 1,763 33.0Third quintile 645 12.1Fourth quintile 278 5.2Bottom quintile 269 5.0Total 5,341 100.0
*Each quintile represents 20%, or one fifth, of the stringency and certainty scales.
254 Policy Studies Journal, 41:2

Table 3. Environmental Regulation Characteristics and MNC Foreign Market Entry Investments
Model (1) (2) (3) (4)
Environmental regulation Stringency Certainty Stringency Certainty
Dirty manufacturing (dummy) -1.0153*** -0.9830*** -0.9611** -1.0475***(0.2886) (0.2889) (0.2974) (0.2926)
Clean manufacturing (dummy) 1.3735*** 1.3655*** 1.6479*** 1.5757***(0.2302) (0.2322) (0.2498) (0.2495)
Service industry (dummy) -0.4308† -0.4284† -0.3531 -0.5536*(0.2354) (0.2354) (0.2533) (0.2460)
Environmental regulation 0.0823† 0.1949*** 0.0065 0.1691*(0.0429) (0.0454) (0.0587) (0.0666)
Dirty manufacturing ¥ environmental regulation 0.0836 0.0553(0.0643) (0.0841)
Clean manufacturing ¥ environmental regulation 0.2689*** 0.2451*(0.0733) (0.0955)
Service industry ¥ environmental regulation 0.0974 -0.1486†(0.0695) (0.0902)
Democracy accountability 0.2260*** 0.2178*** 0.3295*** 0.2231***(0.0307) (0.0305) (0.0493) (0.0379)
Democracy accountability ¥ environmental regulation 0.0559** 0.0066(0.0205) (0.0248)
Firm size (log) 0.2552*** 0.2575*** 0.2505*** 0.2512***(0.0565) (0.0548) (0.0554) (0.0548)
Geographic diversification 0.9920*** 1.0318*** 1.0212*** 1.0577***(0.1284) (0.1290) (0.1274) (0.1285)
Financial resources 0.0894 0.0847 0.1078 0.0680(0.0957) (0.0964) (0.0963) (0.0976)
R&D intensity -5.9269*** -5.9044*** -6.0598*** -6.2680***(1.1715) (1.1574) (1.1795) (1.1791)
Advertising intensity -1.1811*** -1.1710*** -1.1611*** -1.2021***(0.1012) (0.1012) (0.1023) (0.1022)
Managerial capability -0.1060 -0.0544 -0.1314 -0.0419(0.2608) (0.2581) (0.2622) (0.2579)
Host country GDP (log) 0.4628*** 0.4235*** 0.4671*** 0.4210***(0.0515) (0.0467) (0.0513) (0.0479)
Host country population (log) 0.0424 0.0930† 0.0696 0.0972†(0.0584) (0.0555) (0.0579) (0.0555)
Host country land size (log) 0.1122*** 0.1082*** 0.0960** 0.1069***(0.0297) (0.0298) (0.0301) (0.0301)
Host country import openness 0.0103*** 0.0097*** 0.0111*** 0.0097***(0.0019) (0.0019) (0.0020) (0.0020)
Host country FDI openness 0.0059*** 0.0065*** 0.0058*** 0.0064***(0.0011) (0.0011) (0.0011) (0.0011)
Host country unemployment rate 0.0156* 0.0171* 0.0206** 0.0174*(0.0072) (0.0071) (0.0074) (0.0072)
Host country literacy rate -0.0069† -0.0046 -0.0063 -0.0043(0.0041) (0.0042) (0.0040) (0.0042)
Sharing common border 0.7157*** 0.7201*** 0.7077*** 0.7183***(0.1485) (0.1480) (0.1487) (0.1484)
Sharing common language -0.2127† -0.2075† -0.2220† -0.2049†(0.1213) (0.1209) (0.1206) (0.1203)
Sharing colonial relationship 0.2383† 0.2515† 0.2642* 0.2603†(0.1345) (0.1339) (0.1329) (0.1335)
Geographic distance (log) -0.3766*** -0.3739*** -0.3697*** -0.3752***(0.0401) (0.0400) (0.0402) (0.0396)
Institutional closeness -0.2717** -0.2394* -0.2835** -0.2452*(0.1010) (0.1002) (0.1019) (0.1007)
Log likelihood -4,282.0 -4,274.6 -4,270.4 -4,265.6Akaike information criterion (AIC) 8,651.9 8,637.3 8,636.8 8,627.2Likelihood ratio (LR) test (c2) Against (1) Against (2)
23.06*** 18.03**
Note: N = 29,303. †p < 0.10, *p < 0.05; **p < 0.01; ***p < 0.001. We used distance measures for environmental regulation stringencyand certainty and democracy variables. Heteroskedasticity and autocorrelation robust standard errors clustered by firm–hostcountry are in parentheses. Two-digit industry and year fixed effects are estimated but are not reported here.
Rivera and Oh: Environmental Regulation and Foreign Entry 255

used in the political science and management literatures to facilitate the interpreta-tion of nonlinear regression results (King, Tomz, & Wittenberg, 2000; Zelner, 2009).10
Figure 1 shows a graph illustrating the average value of these simulation estimations(with vertical bars representing the 95 percent confidence intervals): as expected, theprobability of MNCs’ FME investments increases with higher levels of environmen-tal regulations’ stringency and certainty. Interestingly, Figure 1 also reveals that athigher levels of stringency and certainty, regulatory certainty has a more pro-nounced effect on promoting FME investment than regulatory stringency. The oppo-site occurs at lower levels of stringency and certainty, where the effect stringency ishigher.
Specific examples of large differences in environmental regulations’ stringencyand certainty may also help illustrate our findings. For instance, other things equal,model 1 results (see Table 3) indicate that when considering differences in environ-mental regulations stringency, the likelihood of FME investment of an Italian MNCinto Denmark is about 5 percent higher than the likelihood of entry into Malaysia.This is because Denmark has environmental regulations that are about two standarddeviations more stringent than those of Malaysia. In the case of environmentalregulations certainty levels, model 2 findings indicate that the likelihood of FME ofan Italian MNC into Denmark is about 7 percent higher than the likelihood of entryinto Brazil, ceteris paribus. Here again, environmental regulation certainty is abouttwo standard deviations greater in Denmark than in Brazil.
Regarding democracy levels, the findings only suggest statistically significantsupport for a moderating effect on environmental regulation stringency (see Table 3,model 3; b = 0.0559; p < 0.01). This implies that the MNCs’ positive tendency to entercountries with stricter levels of environmental regulation is higher in more demo-
00.
020.
040.
060.
080.
1
For
eign
Mar
ket E
ntry
Inve
stm
ent
-5 -2.5 0 2.5 5
Level of Environmental Regulation (Distance from Home Country)
__ Certainty
__ Stringency
Figure 1. MNC Foreign Market Entry Investment Tendency and Regulatory Stringency and Certainty.
256 Policy Studies Journal, 41:2

cratic countries. The moderating effect of democracy level is nonsignificant forenvironmental regulation certainty (model 4; b = 0.0066; p < NS). The results confirmthat business resistance to environmental regulations stringency may be lower indemocratic countries than in authoritarian ones (Rivera, 2010). However, environ-mental regulation certainty remains important by itself irrespective of the democracylevel of host country.
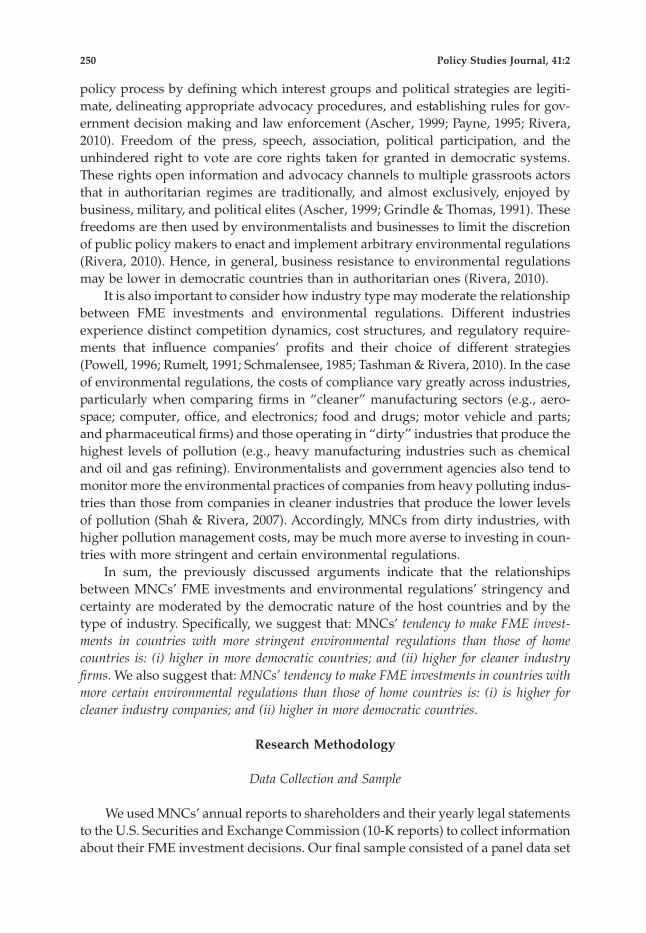
Models 3 and 4 (see Table 3) also indicate statistically significant support for themoderating effects of clean industry type on regulatory stringency (model 3;b = 0.2689, p < 0.001) and on regulatory certainty (model 4; b = 0.2451, p < 0.05). Thepropensity of European MNCs to enter foreign markets with environmental regu-lations that are more stringent and/or certain is higher for cleaner industry compa-nies. For example, when the home and host countries have the same level ofenvironmental regulation certainties the likelihood of FME by a cleaner manufactur-ing MNC is about 16 percent higher than the likelihood of entry by a dirty manu-facturing MNC.
Figures 2 and 3 show simulation estimations illustrating our findings about themoderating effect of the country’s democracy levels and clean industry type. Toprepare Figures 2 and 3 we followed a similar simulation estimation procedure asthe one used for Figure 1 (see Endnote 10 for additional details).
Robustness Checks
We calculated alternative logistic regression models to verify the robustness ofour findings (see Table 4). First, because the MNCs are more likely to enter wealthiercountries, models 1 and 2 in Table 4 explicitly control for per capita GDP.11 Second,
0.01
0.02
0.03
0.04
For
eign
Mar
ket E
ntry
Inve
stm
ent
-4 -2 0 2
Level of Stringency (Distance from Home Country)
__ High democracy
__ Low democracy
Figure 2. Moderating Effect by Democracy Levels.
Rivera and Oh: Environmental Regulation and Foreign Entry 257
previous studies find that host country political safety or risk is an important deter-minant for the entry decision of MNCs. Thus, we estimated an additional regressionmodel that controls for host country political safety using data from the World Bank’sWorld Governance Indicators (World Bank, 2011; see models 3 and 4; Table 4). Third,because environmental regulation stringency and certainty may be correlated withgeneral regulatory quality, we recalculated our models controlling for general regu-latory quality using data from the World Bank’s World Governance Indicators (WorldBank, 2011; see models 5 and 6; Table 4). Fourth, our initial regression analysis usedan entropy measure based on geographic sales as the indicator of geographic diver-sification. As an alternative measure, we used the foreign-to-total number of subsid-iaries, which is another common proxy for geographic diversification (see models 7and 8; Table 4).12 In addition, we tested our model with dyad fixed effects and theresults (shown on Table 5) are consistent with our reported findings.13 All robustnesschecks confirm the findings of our original models, showing that: (i) MNCs’ FMEinvestment remains positively and significantly associated with both environmentalregulatory stringency and certainty; and (ii) similar moderating effects for countrydemocracy levels and industry type.
Discussion of Results
Foreign Market Entry Investments and Regulatory Stringency
Our logistic regression analyses suggest rather interesting results that chal-lenge the controversial but commonly held view that more stringent environmen-tal regulations deter FME investments by multinational companies. First, when we
00.
020.
040.
060.
08
For
eign
Mar
ket E
ntry
Inve
stm
ent
-4 -2 0 2
Level of Environmental Regulation (Distance from Home Country)
__ Clean industry
__ Dirty industry
Figure 3. Moderating Effect by Clean Industry Type.
258 Policy Studies Journal, 41:2

Tab
le4.
Rob
ustn
ess
Che
ckM
odel
s
Mod
elC
ontr
olpe
rC
apita
GD
PC
ontr
olPo
litic
alSt
abili
tyC
ontr
olR
egul
ator
yQ
ualit
yA
ltern
ativ
eG
eogr
aphi
cD
iver
sity
(1)
(2)
(3)
(4)
(5)
(6)
(7)
(8)
Envi
ronm
enta
lreg
ulat
ion
Stri
ngen
cyC
erta
inty
Stri
ngen
cyC
erta
inty
Stri
ngen
cyC
erta
inty
Stri
ngen
cyC
erta
inty
Dir
tym
anuf
actu
ring
(dum
my)
-0.9
611*
*-1
.047
5***
-0.9
801*
*-1
.048
6***
-1.0
027*
**-1
.067
6***
-0.8
939*
*-1
.003
2**
(0.2
974)
(0.2
926)
(0.2
982)
(0.2
932)
(0.2
975)
(0.2
926)
(0.3
297)
(0.3
215)
Cle
anm
anuf
actu
ring
(dum
my)
1.64
79**
*1.
5757
***
1.66
88**
*1.
5967
***
1.66
50**
*1.
5944
***
1.82
10**
*1.
7601
***
(0.2
498)
(0.2
495)
(0.2
501)
(0.2
495)
(0.2
500)
(0.2
493)
(0.2
539)
(0.2
511)
Serv
ice
indu
stry
(dum
my)
-0.3
531
-0.5
536*
-0.3
644
-0.5
490*
-0.3
782
-0.5
582*
-0.1
175
-0.3
240
(0.2
533)
(0.2
460)
(0.2
534)
(0.2
462)
(0.2
533)
(0.2
460)
(0.2
907)
(0.2
778)
Envi
ronm
enta
lreg
ulat
ion
0.00
650.
1691
*-0
.032
60.
1432
*-0
.047
80.
1262
†-0
.048
80.
1368
†(0
.058
7)(0
.066
6)(0
.059
9)(0
.067
5)(0
.060
4)(0
.068
0)(0
.064
0)(0
.072
3)D
irty
man
ufac
turi
ng¥
envi
ronm
enta
lreg
ulat
ion
0.08
360.
0553
0.07
930.
0514
0.07
920.
0483
0.07
400.
0233
(0.0
643)
(0.0
841)
(0.0
643)
(0.0
844)
(0.0
646)
(0.0
848)
(0.0
685)
(0.0
892)
Cle
anm
anuf
actu
ring
¥en
viro
nmen
talr
egul
atio
n0.
2689
***
0.24
51*
0.26
55**
*0.
2430
*0.
2658
***
0.24
02*
0.29
46**
*0.
2634
**(0
.073
3)(0
.095
5)(0
.073
3)(0
.095
7)(0
.073
7)(0
.096
2)(0
.077
1)(0
.098
1)Se
rvic
ein
dust
ry¥
envi
ronm
enta
lreg
ulat
ion
0.09
74-0
.148
6†0.
0947
-0.1
510†
0.09
38-0
.155
0†0.
1046
-0.1
512
(0.0
695)
(0.0
902)
(0.0
695)
(0.0
902)
(0.0
698)
(0.0
906)
(0.0
765)
(0.0
966)
Dem
ocra
cyac
coun
tabi
lity
0.32
95**
*0.
2231
***
0.32
06**
*0.
2139
***
0.28
57**
*0.
1894
***
0.31
92**
*0.
2212
***
(0.0
493)
(0.0
379)
(0.0
497)
(0.0
382)
(0.0
504)
(0.0
396)
(0.0
498)
(0.0
384)
Dem
ocra
cyac
coun
tabi
lity¥
envi
ronm
enta
lreg
ulat
ion
0.05
59**
0.00
660.
0588
**0.
0094
0.05
61**
0.01
00.
0489
*-0
.001
3(0
.020
5)(0
.024
8)(0
.020
3)(0
.024
5)(0
.020
4)(0
.024
8)(0
.021
0)(0
.025
2)Fi
rmsi
ze(lo
g)0.
2505
***
0.25
12**
*0.
2496
***
0.25
19**
*0.
2459
***
0.24
90**
*0.
2317
***
0.23
08**
*(0
.055
4)(0
.054
8)(0
.055
9)(0
.055
4)(0
.056
0)(0
.055
5)(0
.053
7)(0
.053
7)G
eogr
aphi
cdi
vers
ifica
tion
1.02
12**
*1.
0577
***
1.01
34**
*1.
0458
***
1.00
96**
*1.
0395
***
1.65
23**
*1.
6336
***
(0.1
274)
(0.1
285)
(0.1
276)
(0.1
288)
(0.1
273)
(0.1
285)
(0.1
462)
(0.1
479)
Fina
ncia
lres
ourc
es0.
1078
0.06
800.
1017
0.06
610.
1030
0.06
790.
0413
0.00
76(0
.096
3)(0
.097
6)(0
.096
4)(0
.097
6)(0
.096
5)(0
.097
5)(0
.099
5)(0
.100
3)R
&D
inte
nsity
-6.0
598*
**-6
.268
0***
-5.9
849*
**-6
.300
6***
-5.8
560*
**-6
.206
3***
-5.7
528*
**-6
.032
4***
(1.1
795)
(1.1
791)
(1.1
810)
(1.1
835)
(1.1
762)
(1.1
768)
(1.1
769)
(1.1
785)
Adv
ertis
ing
inte
nsity
-1.1
611*
**-1
.202
1***
-1.1
674*
**-1
.209
1***
-1.1
686*
**-1
.211
1***
-1.0
141*
**-1
.067
7***
(0.1
023)
(0.1
022)
(0.1
026)
(0.1
024)
(0.1
028)
(0.1
026)
(0.1
089)
(0.1
088)
Man
ager
ialc
apab
ility
-0.1
314
-0.0
419
-0.1
582
-0.0
637
-0.1
817
-0.0
872
-0.1
238
-0.0
731
(0.2
622)
(0.2
579)
(0.2
624)
(0.2
583)
(0.2
624)
(0.2
586)
(0.2
682)
(0.2
655)
Rivera and Oh: Environmental Regulation and Foreign Entry 259

Tab
le4.
Con
tinue
d
Mod
elC
ontr
olpe
rC
apita
GD
PC
ontr
olPo
litic
alSt
abili
tyC
ontr
olR
egul
ator
yQ
ualit
yA
ltern
ativ
eG
eogr
aphi
cD
iver
sity
(1)
(2)
(3)
(4)
(5)
(6)
(7)
(8)
Hos
tcou
ntry
polit
ical
safe
ty0.
2205
**0.
1772
**(0
.069
9)(0
.068
4)H
ostc
ount
ryre
gula
tory
qual
ity(q
ualit
y)0.
4256
***
0.35
47**
(0.1
148)
(0.1
146)
Hos
tcou
ntry
per
capi
taG
DP
(log)
0.46
71**
*0.
4210
***
(0.0
513)
(0.0
479)
Hos
tcou
ntry
GD
P(lo
g)0.
4215
***
0.37
26**
*0.
3255
***
0.29
35**
*0.
5253
***
0.49
20**
*(0
.052
9)(0
.051
1)(0
.064
3)(0
.063
7)(0
.053
0)(0
.048
9)H
ostc
ount
rypo
pula
tion
(log)
0.53
68**
*0.
5182
***
0.15
04*
0.17
27**
0.23
06**
0.24
01**
0.03
030.
0392
(0.0
375)
(0.0
372)
(0.0
628)
(0.0
627)
(0.0
743)
(0.0
740)
(0.0
602)
(0.0
570)
Hos
tcou
ntry
land
size
(log)
0.09
60**
0.10
69**
*0.
0773
*0.
0906
**0.
0850
**0.
0958
**0.
1176
***
0.12
89**
*(0
.030
1)(0
.030
1)(0
.031
4)(0
.031
5)(0
.030
5)(0
.030
5)(0
.031
1)(0
.031
0)H
ostc
ount
ryim
port
open
ness
0.01
11**
*0.
0097
***
0.00
96**
*0.
0086
***
0.00
80**
*0.
0073
***
0.01
21**
*0.
0108
***
(0.0
020)
(0.0
020)
(0.0
021)
(0.0
020)
(0.0
021)
(0.0
021)
(0.0
020)
(0.0
020)
Hos
tcou
ntry
FDIo
penn
ess
0.00
58**
*0.
0064
***
0.00
62**
*0.
0066
***
0.00
65**
*0.
0069
***
0.00
57**
*0.
0061
***
(0.0
011)
(0.0
011)
(0.0
011)
(0.0
011)
(0.0
011)
(0.0
011)
(0.0
012)
(0.0
012)
Hos
tcou
ntry
unem
ploy
men
t(ra
te)
0.02
06**
0.01
74*
0.02
53**
*0.
0213
**0.
0218
**0.
0188
**0.
0201
**0.
0165
*(0
.007
4)(0
.007
2)(0
.007
4)(0
.007
3)(0
.007
2)(0
.007
1)(0
.007
6)(0
.007
5)H
ostc
ount
rylit
erac
yra
te-0
.006
3-0
.004
3-0
.006
3-0
.004
2-0
.004
4-0
.002
8-0
.007
3†-0
.006
2(0
.004
0)(0
.004
2)(0
.003
9)(0
.004
1)(0
.004
1)(0
.004
3)(0
.004
1)(0
.004
2)Sh
arin
gco
mm
onbo
rder
0.70
77**
*0.
7183
***
0.69
70**
*0.
7189
***
0.72
25**
*0.
7405
***
0.67
79**
*0.
6756
***
(0.1
487)
(0.1
484)
(0.1
491)
(0.1
487)
(0.1
491)
(0.1
490)
(0.1
647)
(0.1
644)
Shar
ing
com
mon
lang
uage
-0.2
220†
-0.2
049†
-0.2
004†
-0.1
925
-0.2
423*
-0.2
294†
-0.2
459†
-0.2
284†
(0.1
206)
(0.1
203)
(0.1
206)
(0.1
202)
(0.1
215)
(0.1
213)
(0.1
279)
(0.1
275)
Shar
ing
colo
nial
rela
tions
hip
0.26
42*
0.26
03†
0.27
22*
0.26
77*
0.22
95†
0.23
33†
0.23
59†
0.23
48†
(0.1
329)
(0.1
335)
(0.1
326)
(0.1
333)
(0.1
342)
(0.1
344)
(0.1
388)
(0.1
394)
Geo
grap
hic
dist
ance
(log)
-0.3
697*
**-0
.375
2***
-0.3
601*
**-0
.364
3***
-0.3
818*
**-0
.381
8***
-0.3
751*
**-0
.382
4***
(0.0
402)
(0.0
396)
(0.0
399)
(0.0
395)
(0.0
403)
(0.0
396)
(0.0
415)
(0.0
408)
Inst
itutio
nalc
lose
ness
-0.2
835*
*-0
.245
2*-0
.297
4**
-0.2
652*
*-0
.370
7***
-0.3
336*
*-0
.265
0*-0
.243
2*(0
.101
9)(0
.100
7)(0
.101
5)(0
.100
9)(0
.104
4)(0
.104
3)(0
.106
1)(0
.104
7)Lo
glik
elih
ood
-4,2
70.4
2-4
,265
.62
-4,2
65.0
7-4
,262
.01
-4,2
61.6
3-4
,259
.48
-4,0
20.1
7-4
,020
.25
Aka
ike
info
rmat
ion
crite
rion
(AIC
)8,
636.
848,
627.
248,
628.
148,
622.
028,
621.
278,
616.
968,
136.
348,
136.
50
Not
e:Se
eTa
ble
3.
260 Policy Studies Journal, 41:2

Table 5. Dyadic Fixed-Effects Models
Model (1) (2) (3) (4)
Environmental regulation Stringency Certainty Stringency Certainty
Dirty manufacturing (dummy) -1.9713*** -1.9962*** -1.9594*** -2.0597***(0.3258) (0.3260) (0.3356) (0.3323)
Clean manufacturing (dummy) 0.1711 0.1587 0.4105 0.3147(0.2411) (0.2416) (0.2588) (0.2555)
Service industry (dummy) -0.6629* -0.7042** -0.5759* -0.7977**(0.2658) (0.2657) (0.2871) (0.2788)
Environmental regulation 0.2712* 0.3239** 0.2694* 0.3520*(0.1190) (0.1106) (0.1370) (0.1431)
Dirty manufacturing ¥ environmentalregulation
0.0232 0.0707(0.0758) (0.1040)
Clean manufacturing ¥ environmentalregulation
0.2218** 0.1959†(0.0828) (0.1135)
Service industry ¥ environmentalregulation
0.0962 0.1112(0.0821) (0.1119)
Democracy accountability -0.1710† -0.1558† 0.0324 -0.1314(0.0882) (0.0873) (0.1355) (0.1066)
Democracy accountability ¥ environmentalregulation
0.1041* 0.0283(0.0514) (0.0581)
Firm size (log) -0.0869† -0.0785 -0.0829† -0.0754(0.0478) (0.0479) (0.0479) (0.0484)
Geographic diversification 1.8805*** 1.8927*** 1.8864*** 1.9055***(0.1481) (0.1483) (0.1478) (0.1484)
Financial resources 0.0456 0.0518 0.0720 0.0539(0.1102) (0.1101) (0.1109) (0.1103)
R&D intensity 5.5501*** 5.6093*** 5.4531*** 5.4532***(1.3897) (1.3863) (1.3953) (1.3876)
Advertising intensity -0.9790*** -0.9861*** -0.9639*** -0.9826***(0.1168) (0.1172) (0.1175) (0.1175)
Managerial capability 0.8570** 0.8762** 0.8206** 0.9130**(0.2883) (0.2882) (0.2914) (0.2906)
Host country GDP (log) 3.6215*** 4.4396*** 3.3984*** 4.3507***(1.0300) (1.0280) (1.0310) (1.0331)
Host country population (log) -2.6971 -1.2494 -2.3855 -1.3481(2.7826) (2.7232) (2.7814) (2.7288)
Host country land size (log) -17.9291 -26.0509 -19.6089 -26.0892(21.0076) (20.9167) (20.8728) (21.0282)
Host country import openness -0.0146† -0.0120 -0.0129 -0.0126(0.0080) (0.0080) (0.0082) (0.0081)
Host country FDI openness 0.0046 0.0057† 0.0054 0.0057†(0.0033) (0.0034) (0.0034) (0.0034)
Host country unemployment rate -0.0215 -0.0138 -0.0218 -0.0157(0.0377) (0.0378) (0.0378) (0.0379)
Host country literacy rate -0.0843 -0.0816 -0.0803 -0.0833(0.0767) (0.0766) (0.0772) (0.0768)
Institutional closeness -0.2509 -0.0884 -0.2791 -0.0884(0.3082) (0.3064) (0.3093) (0.3080)
Log likelihood -2,782.30 -2,780.59 -2,775.56 -2,776.03Akaike information criterion (AIC) 5,642.60 5,639.19 5,637.11 5,638.06
Note: N = 18,858. †p < 0.10, *p < 0.05; **p < 0.01; ***p < 0.001. We used distance measures for environmental regu-lation stringency and certainty and democracy variables. Heteroskedasticity and autocorrelation robust standarderrors clustered by firm–host country are in parentheses. Two-digit industry, dyadic, and year fixed effects areestimated but are not reported here.
Rivera and Oh: Environmental Regulation and Foreign Entry 261

consider national differences in environmental regulation stringency (foreign host–home country) our findings indicate significantly higher levels of company entryinto foreign countries with more stringent environmental regulations than those ofthe companies’ home countries.14 This higher tendency to enter foreign countrieswith more stringent regulations than those of MNCs’ home countries is observedabove and beyond the effect of more than 20 other factors typically known to influ-ence companies’ foreign investment decisions. These findings suggest that for thecase of large European MNCs (Fortune Global 500 companies), countries withstricter environmental regulations than those of their home countries may actuallybe seen as more attractive for establishing new subsidiaries. Interestingly, this maybe because, contrary to the main suggestion of the pollution haven logic, the costsof environmental regulations may actually be lower for European MNCs. LargeEuropean MNCs have long been exposed to stricter environmental regulations intheir home countries. Over time, this experience may have allowed these compa-nies to view stricter environmental regulations as opportunities. More stringentregulations may force top managers to consider environmental protection as a keybusiness strategy issue requiring increased attention. Thus, triggering the discov-ery of win-win opportunities to develop new technologies and managementsystems that increase environmental protection and simultaneously help them tobecome more efficient. The increased environmental performance may alsoimprove businesses’ “green” reputations resulting in better relations with govern-ments and environmentalist groups, and perhaps higher sales to environmentallyaware customers.
We also believe that these findings cannot only be explained by a logic of costand innovation offsets but also by the unique type of business political engagementprevalent in many European countries. In their home countries, European MNCstend to experience a more collaborative and consensus-based political process toenact and implement environmental regulations. Contrary to the intense adversarialregulatory processes prevalent in the United States, in Europe regulations tend to bedeveloped through shared participation with government, business associations, topenvironmentalists, and union labor groups (Rivera, 2010). Hence, European MNCsare less likely to perceive stringent environmental regulations as a threat, and mayactually see them as an opportunity to compete abroad with companies from othercountries.15 Additionally, the increased cooperation and consensus with environ-mentalists and other groups may allow European MNCs to more easily develop“green” technologies and management systems.
Foreign Market Entry Investments and Regulatory Certainty
Our analysis does suggest that some environmental regulations may actually beassociated with lower FME investment decisions by MNCs. Yet, as we describedpreviously, this is not the case for environmental regulations that are more stringentthan those of MNCs’ home countries. We found that multinational companies aresignificantly less likely to enter countries with less certain environmental regulations
262 Policy Studies Journal, 41:2

than those of their home countries (see Figure 1). That is, environmental regulationsappear to be linked to significantly diminished levels of entry into foreign countrieswhen they are less clear and less stable than the regulations of companies’ homecountries. Most notably, this finding shows that the magnitude of the regulatorycertainty relationship with MNCs’ FME investments is larger than that of regulatorystringency.
These findings are consistent with research examining how the certainty of othertypes of regulations affects MNCs’ FME investment decisions (Delios & Henisz,2003). Yet, to the best of our knowledge, previous research examining environmentalregulations has paid little attention to how differences in regulatory certainty mayaffect MNCs’ FME investment decisions. FME investments tend to have long-termpayoffs (sometimes over a decade) and are considered risky. Uncertain environmen-tal regulations tend to deter these investments by making them riskier. This isbecause unclear and unstable environmental protection requirements make it diffi-cult for companies to develop win-win compliance technologies and managementsystems. Also, because research and development horizons for innovative greenefforts are also long, uncertain regulations make it difficult for firms to reap thebenefits of greening.
Moderating Effect of Country Democracy Levels and Industry Type
Our findings suggest that MNCs’ positive tendency to enter countries withstricter levels of environmental regulation is higher in host nations that are moredemocratic (see Figure 2). It is important to stress that the large magnitude ofthe moderating effect of host country democracy levels is such that it reversesthe direction of the relationship between MNCs’ FME investments and more strin-gent environmental regulations. In authoritarian countries, more stringent environ-mental regulations are linked to a propensity to avoid FME investments by MNCs.On the other hand, the level of host country democracy does not appear to mod-erate the relationship between FME investments and environmental regulationcertainty.
Our findings about the moderating effect of countries’ democracy levels stressthe importance of considering not only macroeconomic context factors (such ascountry per capita income), but also political context factors when examining therelationship between environmental regulations’ stringency and MNCs’ FME invest-ments. Higher levels of host country democracy increase substantially the chancethat environmental regulations are perceived as fairer, and thus more legitimate, bybusinesses, government officials, environmentalists, and other groups. Hence,MNCs are actually more likely to enter democratic host countries with more strin-gent environmental regulations than those of their home countries.
MNC investment is substantially deterred in authoritarian host countries withstricter environmental regulations because these regulations and their enforcementare more likely to be perceived as arbitrary and illegitimate. MNCs, in particular,perceive that when an authoritarian government needs to show symbolic concern forenvironmental protection, they are more likely to be made scapegoat targets of
Rivera and Oh: Environmental Regulation and Foreign Entry 263

autocratic enforcement. This may also happen in democratic host countries but therebusinesses can take advantage of rights, freedoms, and rule of law traditions to fendoff arbitrary government regulations and enforcement. For example, in democraticcountries freedom of the press and speech allow businesses (and other groups) to bemore informed and to monitor the government’s decisions and the environmentalrecord of other companies. Free speech traditions also make it easier to conveyconcerns and demands to the media and different authorities about the arbitraryactions of government environmental agencies publicly and in a timely manner.Also, well-established freedom of association mechanisms, inherent in democraticnations, expedite the organization of international business associations that arebetter able to debate, promote, and sustain fair enactment and enforcement of envi-ronmental regulations (Rivera, 2010).
Our results also indicate that belonging to a clean industry moderates the natureof the relationship between FME investments and environmental regulations’ strin-gency and certainty. We found that the increased tendency of MNCs to enter coun-tries with more stringent environmental regulations than those of their homecountries is higher for clean industry firms than for other industrial sectors. Simi-larly, cleaner industry companies are more likely to enter host countries with morecertain regulations than those of their home countries (see Figure 3). Cleaner indus-try companies may be more attracted to invest in countries with more stringentenvironmental regulatory requirements because they are less pollution intensive.Alternatively, they may also have developed innovative green technologies that allowthem to be more competitive in host countries with more stringent and certainenvironmental regulations. That is, cleaner industry companies likely transformmore stringent environmental regulations into business opportunities.
Limitations
Finally, before elaborating on the conclusions, it is important to highlight keylimitations of our study. First, our analysis is restricted to FME investment decisionsby European MNCs during 2001–2007. Although this is an improvement from pre-vious analyses focusing on the United States (see Conclusion section), it preemptsour ability to generalize our findings for MNCs from other countries and for entryinvestment decisions made outside this period. To be sure, MNCs from countrieswith weaker environmental regulations may show different FME investment pat-terns in response to host country environmental regulations. Second, our analysisdoes not consider variations across the subsidiaries belonging to single MNCs. AMNC’s response to environmental regulations can differ across its multiple subsid-iaries due to the differences in subsidiary roles and characteristics as well asin-country and industry factors (Birkinshaw, 2008; Birkinshaw, Hood, & Jonsson,1998; Rugman & Verbeke, 2001). Some foreign subsidiaries can be more proactiveand internally develop unique environmental protection capabilities and a “green”entrepreneurial culture (Pinkse, Kuss, & Hoffmann, 2010).
Third, our measures of environmental regulation characteristics are from asurvey of top corporate managers’ perceptions. The respondents of the survey may
264 Policy Studies Journal, 41:2
not be experts in environmental policy. Future research might include qualitativeinterviews with headquarters and subsidiary managers to capture decision mecha-nisms regarding environmental regulations and FME investments. Another mean-ingful avenue of future research is the investigation of how subsidiary capabilitiesinfluence entry and expansion decisions within a host country.
Fourth, our sample includes 77 countries where potential MNCs’ FME couldoccur. Besides varying in stringency and certainty, the environmental regulations inthese countries may show other differences in incentives, implementation, and/orother design characteristics (Potoski & Woods, 2002; Rigby, 2007). Our empiricalanalysis does not examine the effect of other environmental regulations designcharacteristics on MNCs’ FME investments. Future research should consider howother differences in environmental regulation design may affect MNCs’ FME invest-ments and expansion decisions.
Conclusions
The extensive literature exploring the relationship between environmental regu-lation characteristics and MNCs’ foreign investment offers contradictory perspec-tives and inconclusive empirical evidence. Previous research has examined thisrelationship by focusing on regulatory stringency and foreign investment into theUnited States or by studying the overseas investments of a few heavy U.S. manufac-turing industries. Our study offers interesting contributions for managers, scholars,and policymakers. First, besides considering stringency, we stress the importanceof other regulation characteristics by examining how national differences in thecertainty of environmental regulations affect MNCs’ FME investment decisions.Second, our findings are more generalizable than previous work because we lookbeyond the United States and study worldwide FME investment decisions by MNCsin a wide variety of industries from over ten European countries.
Our results indicate that European MNCs are more likely to enter countries withenvironmental regulations that are more certain than those of their home countries.The magnitude of the regulatory certainty relationship with MNCs’ FME invest-ments is larger than that of regulatory stringency. Moreover, we found that EuropeanMNCs are more likely to enter countries with environmental regulations that aremore stringent than those of their home countries. This finding about environmentalregulatory stringency challenges the pollution haven hypothesis’ controversial, butcommonly, held wisdom predicting lower levels of entry by MNCs into countrieswith more stringent environmental regulations.
Third, we advance the literature by analyzing how the relationship of environ-mental regulations’ stringency to MNCs’ FME investments change when companiesconsider entering countries with different levels of democracy. Previous research inthis area has focused on examining how economic contextual factors (e.g., countryincome per capita) alter the links between environmental regulations’ stringency andbusiness investment. However, our results point out the importance of countries’political context in determining how business FME investment decisions are asso-ciated with environmental regulation characteristics. Specifically, we found that
Rivera and Oh: Environmental Regulation and Foreign Entry 265

European MNCs’ positive tendency to enter countries with more stringent environ-mental regulations than those of their home countries is higher in more democraticnations. Furthermore, the moderating effect of democracy levels on the MNCs’ FMEinvestment-environmental regulation stringency relationship is such that in authori-tarian countries, more stringent environmental regulations are linked to a propensityto avoid FME investments by MNCs.
Fourth, our study also contributes to the literature by examining how differentindustry types may moderate the relationship between MNCs’ FME investmentsand environmental regulations. Previous studies examining this relationship focuson investment decisions by a single or a few highly polluting industries. Yet, thecompliance requirements and opportunities for green innovation vary greatly acrossindustries, particularly when comparing firms in “cleaner” industrial sectors andthose operating in highly polluting industries. We found that European MNCs’positive tendency to enter countries with more stringent environmental regulationsthan those of their home countries is higher for cleaner industry companies. Ourfindings also indicate that MNCs’ tendency to enter countries with more certainenvironmental regulations than those of home countries is higher for cleaner indus-try companies.
Implications
Our study suggests interesting implications for both policymakers and manag-ers. The fact that countries with more stringent environmental regulations appear tobe more attractive to MNCs’ FME investments suggests that when consideringmultiple industries and countries: (i) the worldwide trend to create new and morestringent environmental regulations may provide competitive advantages to MNCswith experience operating in countries with very strict environmental standards(such as those prevailing in Europe), (ii) these competitive advantages may generatelarge enough benefits to MNCs that can make up for—or in some case, outweigh—the cost of complying with stringent environmental regulations.16
Most importantly, our findings about the positive effect of environmentalregulations’ certainty on European MNCs’ FME investments suggest that whenexamining the impact of environmental regulations on business investment, policy-makers need to look beyond stringency and also pay attention to enacting morecertain regulations. Lax environmental regulations that are uncertain—i.e., unstableand non-transparent—appear to deter foreign investment by MNCs with globalbrand names and access to advanced environmental protection technologies.
Managers also need to consider the authoritarian or democratic nature of theenvironmental policymaking process. Democratic rights and freedoms reduce thediscretion of government officials, increasing the ability of investors and othergroups to shape the creation and enforcement of environmental regulations makingthem less arbitrary. For policymakers, a higher level of country democracy increasesthe legitimacy of environmental regulations allowing the adoption of more stringentrequirements without deterring MNCs’ FME investments. Finally, for managers, our
266 Policy Studies Journal, 41:2

findings about clean industries suggest that the pollution haven hypothesis mayhave arisen from early past experience with foreign investment by heavy manufac-turing and natural resource extraction companies. Clean industry firms that are lesspollution intensive may actually gain cost and differentiations advantages in foreigncountries with more stringent and certain environmental regulations. For policy-makers, these findings suggest that countries interested in attracting clean industryMNCs appear to be better off with environmental regulations that are more certainand actually more stringent.
Notes
The authors acknowledge helpful comments from the PSJ editors, Peter deLeon and Chris Weible, andthree anonymous reviewers. Financial support was provided by the National Research Foundation ofKorea (NRF-2011-330-B00092).
1. For instance, opposition to the North American Free Trade Agreement in the 1990s and repeateddemonstrations against the annual meetings of the World Bank, World Trade Organization, and theInternational Monetary Fund.
2. A recent front page article in the New York Times (Rich & Broder, 2011, p. B1) illustrates this fallbackargument used by business groups:
Do environmental regulations kill jobs? . . . business groups say yes, arguing that environmentalprotection is simply too expensive for a battered economy. They were quick to claim victoryFriday after the Obama administration abandoned stricter ozone pollution standards. [Others]agree that regulation comes with undeniable costs that can affect workers. Factories may closebecause of the high cost of cleanup, or owners may relocate to countries with weaker regulations.”
3. According to the International Monetary Fund (2009), “FDI is a category of international investmentin which an investor in one country, generally an enterprise, acquires an ownership interest thatconfers [significant] influence over the management of an enterprise in another country (defined asholding 10 percent or more of voting power).”
4. Examples of studies at the aggregate industry levels are, among others, Jaffe, Peterson, Portney, andStavins (1995); Garofalo and Malhotra (1995); Greenstone (2002); and Leiter, Parolini, and Winner(2011).
5. It is important to stress that the win-win perspective does not suggest that all stricter environmentalregulations enhance competitiveness and promote innovation. Additionally, it does not suggest thatinnovation benefits arise quickly and/or always completely offset the cost of environmental protec-tion. The core arguments of the win-win perspective are that stricter environmental regulations mustbe well designed and that potential offsets arise over time (Ambec et al., 2011). Characteristics ofwell-designed environmental regulations include: (i) using a comprehensive approach that simulta-neously protects air, soil, water, and other natural resources; (ii) focusing on continuous performanceimprovements rather than requiring the use of specific end-of-pipe technologies; (iii) using regulatoryflexibility and providing either economic or political incentives to proactive environmental firms; (iv)encouraging participation and coordination of multiple stakeholders (industry, environmentalists,local governments, and international organizations) in the design and implementation of new stan-dards (Norberg-Bohm, 1999; Porter & van der Linde, 1995a, 1995b; Rondinelli & Berry, 2000); and (v)they also need to include gradual phase-in periods to allow the development of innovative environ-mental protection technologies and systems.
6. The nature and direction of causality between regulatory stringency and these proxies (pollutionlevels and pollution abatement costs) is not always clear (Wagner & Timmins, 2009). Stringent regu-lations can result in lower levels of pollution. Alternatively, higher levels of pollution can trigger theenactment of stringent regulations. Similarly, high abatement costs can be the result of stringentregulations or lead to laxer regulations. To elucidate the association between environmental regulationstringency and FME investments, it is necessary to use direct measures of regulatory stringency—instead of its outcomes and/or causes—available for most countries.
Rivera and Oh: Environmental Regulation and Foreign Entry 267

7. Traditional democratic rights and liberties include: freedom of the press, speech, association, politicalparticipation, and the right to vote.
8. The World Economic Forum has conducted its annual Survey for over 30 years to prepare annualGlobal Competitiveness Reports. This survey has also expanded the scope of its sample, achieving in2007 a record of over 11,000 survey responses from business leaders in 131 economies.
9. The measure of financial resources may not be comparable across different industries with differentcapital intensity, but we included industry fixed effects in order to make it comparable within industry.
10. This approach estimates simulated 95 percent confidence intervals for the probability of FME byrandomly drawing a thousand normally distributed values of the coefficient on environmental regu-lation stringency. Then, a similar simulation estimation is repeated for the coefficient on environmen-tal regulation certainty.
11. In our main model, we controlled for both the log of GDP and log of population. Thus, the model isthe same as model with the log of per capita GDP due to the nature of log transformation.
12. While the results are consistent, we used the sales based entropy measure in our displayed modelsbecause it is a better proxy for geographic diversification in comparison to many different measuressuch as foreign-to-total number of subsidiaries, number of foreign subsidiaries, and number offoreign countries (Oh, 2009).
13. The dyad fixed-effects models add a total of 988 dyadic dummies to our models, in addition to theindustry and year fixed-effects already included in our previous regressions. It is also important tostress that although estimating additional firm fixed-effects models would reduce unobserved het-erogeneity, this regression approach would exclude important time-invariant independent variablesfrom the analysis. An extensive theoretical and empirical literature examining these investmentdecisions stresses that these time-invariant variables have important effects on firms’ FME decision(see e.g., Berry, Guillen, & Zhou, 2010; Dunning, 1980, 1998; Rugman & Verbeke, 1998, 2001; Selmier& Oh, 2012). Also, based on extensive previous empirical studies, we do not think that our currentmodels have an omitted (missing) variable problem. Our models include 22 control variables besidesindustry, year, and dyad fixed effects. Moreover, it is likely that when adding many fixed-effectsdummies, the results could be potentially affected by a downward bias and convergence problems.Simulation studies (Greene, 2002, 2004) show that the estimated asymptotic estimators for fixed-effects estimators uniformly have downward biases in nonlinear models such as probit, logit, andpoisson regression models. We also tested other complex fixed-effects estimators such as firm-yearfixed effects and country-firm fixed effects, but these estimators failed to converge. The problem ofconvergence is not uncommon in a logit regression model. In most cases, the frequency distributionof sample observations across different categories is discontinuous when a model includes dummyvariables (Allison, 2008; Kali & Sarkar, 2011).
14. Our logit regression analysis also shows no significant relationship between gross levels of environ-mental regulation stringency and MNCs’ FME investments (models not shown).
15. Rugman and Verbeke (1998) note that the level of environmental regulations does not likely discour-age European Union MNCs’ FME investment decisions because home country environmental pres-sures to the MNCs are higher than international environmental pressures.
16. We thank one of the anonymous reviewers for stressing the importance of environmental regulationoffsets.
References
Allison, Paul D. 2008. “Convergence Failures in Logistic Regression.” SAS Global Forum. Working Paper360-20.
Ambec, Stefan, Mark A. Cohen, Stewart Elgie, and Paul Lanoie. 2011. “The Porter Hypothesis at 20: CanEnvironmental Regulation Enhance Innovation and Competitiveness?” Resources for the FutureWorking Paper, RFF DP 11-01. Washington, DC: Resources for the Future.
Anderson, Erin, and Anne T. Coughlan. 1987. “International Market Entry and Expansion via Indepen-dent or Integrated Channels of Distribution.” Journal of Marketing 51 (1): 71–82.
Ascher, W. 1999. Why Governments Waste Natural Resources: Policy Failures in Developing Countries. Balti-more, MD: Johns Hopkins University Press.
268 Policy Studies Journal, 41:2

Balfour, Frederick. 2005. “A Big, Dirty Growth Engine; Pollution Still Chokes China, but Green Technol-ogy Is Starting to Emerge.” Business Week 3948 (22): 122.
Berry, Heather, Mauro F. Guillen, and Nan Zhou. 2010. “An Institutional Approach to Cross-NationalDistance.” Journal of International Business Studies 41: 1460–80.
Birkinshaw, Julian. 2008. “Strategy and Management in MNE Subsidiaries.” In Oxford Handbook of Inter-national Business, eds. Alan M. Rugman, and Thomas Brewer. Oxford: Oxford University Press,380–401.
Birkinshaw, Julian, Neil Hood, and Stefan Jonsson. 1998. “Building Firm-Specific Advantages in Multi-national Corporations: The Role of Subsidiary Initiative.” Strategic Management Journal 19 (3): 221–42.
Blackman, Allen, ed. 2006. Small Firms and the Environment in Developing Countries: Collective Impacts,Collective Action. Washington, DC: Resources for the Future Press.
Bressers, Hans T. A., and Walter A. Rosenbaum. 2000. “Innovation, Learning, and Environmental Policy:Overcoming ‘A Plague of Uncertainties’.” Policy Studies Journal 28 (3): 523–23.
Brunnermeier, Smita B., and Arik Levison. 2004. “Examining the Evidence on Environmental Regulationsand Industry Location.” Journal of Environment and Development 13 (1): 6–41.
Caves, Richard E. 1996. Multinational Enterprise and Economic Analysis, 2nd ed. Cambridge, UK: Cam-bridge University Press.
Central Intelligence Agency (CIA). 2010. “World Factbook, 2009.” https://www.cia.gov/library/publications/the-world-factbook/. Accessed September 12, 2010.
Christmann, Petra. 1997. Environmental Strategies of Multinational Companies: Determinants and Effects onCompetitive Advantage. Los Angeles, CA: University of California.
Darnall, Nicole. 2009. “Environmental Regulations, Green Production Offsets and Organizations’ Finan-cial Performance.” Public Administration Review 69 (3): 418–34.
Daude, Christian, and Ernesto Stein. 2007. “The Quality of Institutions and Foreign Direct Investment.”Economics and Politics 19 (3): 317–44.
Delios, Andrew, and Witold H. Henisz. 2003. “Policy Uncertainty and the Sequence of Entry by JapaneseFirms, 1980–1998.” Journal of International Business Studies 34 (3): 227–41.
Domínguez, Lilia, and Flor Grossman. 2007. “NAFTA’s Impact on Business Environmental DecisionMaking.” Policy Studies Journal 35 (2): 245–63.
Dunning, John. 1980. “Towards an Eclectic Theory of International Production: Some Empirical Tests.”Journal of International Business Studies 11 (1): 9–31.
———. 1998. “Location and the Multinational Enterprise: A Neglected Factor?” Journal of InternationalBusiness Studies 29 (1): 45–66.
Fratianni, Michele. 2009. “The Gravity Model in International Trade.” In Oxford Handbook of InternationalBusiness, ed. Alan M. Rugman. Oxford: Oxford University Press, 72–89.
Garofalo, Gasper A., and Devinder M. Malhotra. 1995. “Effect of Environmental Regulations on State-Level Manufacturing Capital Formation.” Journal of Regional Science 35 (2): 201–16.
Ghemawat, Pankaj. 2007. Redefining Global Strategy. Boston: Harvard Business School Press.
Greene, William. 2002. “The Behavior of the Fixed Effects Estimator in Nonlinear Models.” NYU WorkingPaper No. EC-02-05.
———. 2004. “The Behavior of the Maximum Likelihood Estimator of Limited Dependent VariableModels in the Presence of Fixed Effects.” Econometrics Journal 7: 98–119.
Greenstone, Michael. 2002. “The Impacts of Environmental Regulations on Industrial Activity: Evidencefrom the 1970 and 1977 Clean Air Act Amendments and the Census of Manufacturers.” Journal ofPolitical Economy 110 (6): 1175–219.
Grindle, M., and J. Thomas. 1991. Public Choices and Policy Change: The Political Economy of Reform inDeveloping Countries. Baltimore, MD: The Johns Hopkins University Press.
Hart, Stewart. 1995. “A Natural Resource-Based View of the Firm.” Academy of Management Review 20 (4):986–1014.
Hill, Charles W. L., Peter Hwang, and W. Chan Kim. 1990. “An Eclectic Theory of the Choice of Interna-tional Entry Mode.” Strategic Management Journal 11 (2): 117–28.
Rivera and Oh: Environmental Regulation and Foreign Entry 269

Holburn, Guy L. F., and Bennet A. Zelner. 2010. “Political Capabilities, Policy Risk, and InternationalInvestment Strategy: Evidence from the Global Electric Power Industry.” Strategic ManagementJournal 31 (12): 1290–315.
International Monetary Fund. 2009. Balance of Payments and International Investment Position Manual, 6thed. Washington, DC: International Monetary Fund.
Jaffe, Adam B., and Karen Palmer. 1997. “Environmental Regulations and Innovation: A Panel DataStudy.” Review of Economics and Statistics 79 (4): 610–19.
Jaffe, Adam B., Steven R. Peterson, Paul R. Portney, and Robert N. Stavins. 1995. “Environmental-Regulation and the Competitiveness of United States Manufacturing: What Does the Evidence TellUs.” Journal of Economic Literature 33 (1): 132–63.
Johanson, Jan, and Jan-Erik Vahlne. 1977. “The Internationalization Process of the Firm—A Model ofKnowledge Development and Increasing Foreign Market Commitments.” Journal of InternationalBusiness Studies 8 (1): 23–32.
Johnstone, Nick, Ivan Hascic, and David Popp. 2010. “Renewable Energy Policies and TechnologicalInnovation: Evidence Based on Patent Counts.” Environmental and Resource Economics 45 (1): 133–55.
Kali, Raja, and Jayati Sarkar. 2011. “Diversification and Tunneling: Evidence from Indian BusinessGroups.” Journal of Comparative Economics 39: 349–67.
Kennedy, Peter. 2003. A Guide to Econometrics. Cambridge, MA: The MIT Press.
King, Gary, Michael Tomz, and Jason Wittenberg. 2000. “Making the Most of Statistical Analyses: Improv-ing Interpretation and Presentation.” American Journal of Political Science 44 (2): 341–55.
Koehler, Dinah A. 2007. “The Effectiveness of Voluntary Environmental Programs—A Policy at a Cross-roads?” Policy Studies Journal 35 (4): 689–722.
Kogut, Bruce, and Udo Zander. 1993. “Knowledge of the Firm and the Evolutionary-Theory of theMultinational-Corporation.” Journal of International business Studies 24 (4): 625–45.
Kolk, Ans, and Jonatan Pinkse. 2005. “Business Responses to Climate Change: Identifying EmergentStrategies.” California Management Review 47 (3): 6–20.
Koniski, David. 2008. “Regulator Attitudes and the Environmental Race to the Bottom Argument.” Journalof Public Administration Research and Theory 18 (2): 521–44.
Kostova, Tatiana. 1997. “Country Institutional Profile: Concept and Measurement.” The Academy of Man-agement Best Paper Proceedings August: 180–89.
Leiter, Andrea M., Arno Parolini, and Hannes Winner. 2011. “Environmental Regulation and Investment:Evidence from European Industry Data.” Ecological Economics 70 (4): 759–70.
Levison, Arik. 2010. “Offshoring Pollution: Is the U.S. Increasingly Importing Polluting Goods?” Review ofEnvironmental Economics and Policy 4 (1): 63–83.
Madsen, Peter M. 2009. “Does Corporate Investment Drive A Race to the Bottom in EnvironmentalProtection? A Reexamination of the Effect of Environmental Regulation on Investment.” Academy ofManagement Journal 52 (6): 1297–318.
Marcus, Alfred A. 1981. “Policy Uncertainty and Technological Innovation.” Academy of ManagementReview 6 (3): 443–48.
Norberg-Bohm, Vicki. 1999. “Stimulating ‘Green’ Technological Innovation: An Analysis of AlternativePolicy Mechanism.” Policy Sciences 32 (1): 13–38.
OECD. 1999. OECD Environmental Data Compendium. Paris: OECD.
Oh, Chang H. 2009. “The International Scale and Scope of European Multinationals.” European Manage-ment Journal 27 (5): 336–43.
Oh, Chang H., and Jennifer Oetzel. 2011. “Multinationals’ Response to Major Disasters: How DoesSubsidiary Investment Vary in Response to the Type of Disaster and the Quality of Country Gover-nance?” Strategic Management Journal 32 (6): 658–81.
Palmer, Karen, Wallace E. Oates, and Paul R. Portney. 1995. “Tightening Environmental Standards: TheBenefit-Cost of the No-Cost Paradigm?” Journal of Economic Perspectives 9 (4): 119–32.
Payne, R. A. 1995. “Freedom and the Environment.” Journal of Democracy 6: 41–55.
270 Policy Studies Journal, 41:2

Pinkse, Jonatan, Matthias J. Kuss, and Jolker H. Hoffmann. 2010. “On the Implementation of a ‘Global’Strategy: The Role of Absorptive Capacity.” International Business Review 19 (2): 160–77.
Political Risks Service (PRS). 2010. “International Political Risk Guide, 2009.” http://www.prsgroup.com/icrg.aspx. Accessed September 12, 2010.
Porter, Michael E. 1991. “America’s Green Strategy.” Scientific American 264 (4): 168.
Porter, Michael E., and Claas van der Linde. 1995a. “Toward a New Conception of the Environment-Competitiveness Relationship.” Journal of Economic Perspective 9 (4): 97–118.
———. 1995b. “Green and Competitive: Ending the Stalemate.” Harvard Business Review 73 (5): 120–34.
Potoski, Matthew. 2001. “Clean Air Federalism: Do States Race to the Bottom?” Public AdministrationReview 61: 335–42.
Potoski, Matthew, and Neal D. Woods. 2002. “Dimensions of State Environmental Policies: Air PollutionRegulation in the United States.” Policy Studies Journal 30 (2): 208–26.
Powell, Thomas C. 1996. “How Much Does Industry Matter? An Alternative Empirical Test.” StrategicManagement Journal 17 (4): 323–34.
Ramus, Catherine A., and Ulrich Steger. 2000. “The Roles of Supervisory Support Behaviors and Envi-ronmental Policy in Employee Ecoinitiatives at Leading-Edge European Companies.” Academy ofManagement Journal 43 (4): 605–26.
Reinhardt, Forest L. 1998. “Environmental Product Differentiation: Implications for Corporate Strategy.”California Management Review 40 (4): 43–73.
Rich, Motoko, and John Broder. 2011. “A Debate Arises on Job Creation vs. Environmental Regulation.”The New York Times (September 5): B1.
Rigby, Elizabeth. 2007. “Same Policy Area, Different Politics: How Characteristics of Policy Tools Alter theDeterminants of Early Childhood Education Policy.” Policy Studies Journal 35 (4): 653–69.
Rivera, Jorge. 2002. “Assessing a Voluntary Environmental Initiative in the Developing World: The CostaRican Certification for Sustainable Tourism.” Policy Sciences 35 (4): 333–60.
———. 2010. Business and Public Policy: Responses to Environmental & Social Protection Processes. Cambridge:Cambridge University Press.
Rivera, Jorge, Peter de Leon, and Charles Koerber. 2006. “Is Greener Whiter Yet? The Sustainable SlopesProgram after Five Years.” Policy Studies Journal 34 (2): 195–221.
Rondinelli, Dennis A., and Michael A. Berry. 2000. “Corporate Environmental Management and PublicPolicy: Bridging the Gap.” American Behavioral Scientist 44 (2): 168–87.
Rosenbaum, Walter A., and Hans T. A. Bressers. 2000. “Uncertainty as Environmental Education.” PolicyStudies Journal 28 (3): 668–71.
Rugman, Alan M., and Alain Verbeke. 1998. “Corporate Strategy and International Environmental Policy.”Journal of International Business Studies 29 (4): 819–33.
———. 2001. “Subsidiary-Specific Advantages in Multinational Enterprises.” Strategic Management Journal22 (3): 237–50.
Rumelt, Richard P. 1991. “How Much Does Industry Matter?” Strategic Management Journal 12 (3): 167–85.
Russo, Michael V., and Paul A. Fouts. 1997. “A Resource-Based Perspective on Corporate EnvironmentalPerformance and Profitability.” Academy of Management Journal 40 (3): 534–59.
Schmalensee, Richard. 1985. “Do Markets Differ Much?” American Economic Review 75 (3): 341–51.
Seeliger, Robert. 1996. “Conceptualizing and Researching Policy Convergence.” Policy Studies Journal 24(2): 287–306.
Selmier, W. Travis, and Chang H. Oh. 2012. “The Power of Major Trade Languages in Trade and ForeignDirect Investment.” Review of International Political Economy, doi:10.1080/09692290.2011.648567.
Shah, Kalim U., and Jorge E. Rivera. 2007. “Export Processing Zones and Corporate EnvironmentalPerformance in Emerging Economies: The Case of the Oil, Gas, and Chemical Sectors of Trinidad andTobago.” Policy Sciences 40 (4): 265–85.
Spencer, Jennifer W., Thomas Murtha, and Stefanie A. Lenway. 2005. “How Governments Matter to NewIndustry Creation.” Academy of Management Review 30 (2): 321–37.
Rivera and Oh: Environmental Regulation and Foreign Entry 271

Tashman, Peter, and Jorge Rivera. 2010. “Are Members of Business for Social Responsibility More SociallyResponsible?” Policy Studies Journal 38 (3): 487–514.
United Nations Conference on Trade and Development (UNCTAD). 2010. “UNCTADstat.” http://unctadstat.unctad.org/. Accessed May 4, 2010.
Wagner, Ulrich J., and Christopher Timmins. 2009. “Agglomeration Effects in Foreign Direct Investmentand the Pollution Haven Hypothesis.” Environmental and Resource Economics 43 (2): 231–56.
Wehrmeyer, Walter, and Yacob Mulugetta. 1999. Growing Pains: Environmental Management in DevelopingCountries. Shiffield, UK: Greenleaf Publishing Limited.
Woods, Neal D. 2006. “Interstate Competition and Environmental Regulation: A Test of the Race to theBottom Thesis.” Social Science Quarterly 87: 174–89.
World Bank. 2010. “World Development Indicators, 2009.” http://data.worldbank.org/indicator.Accessed September 12, 2010.
———. 2011. “World Governance Indicators, 2010.” http://info.worldbank.org/governance/wgi.Accessed July 18, 2011.
World Economic Forum (WEF). Various Years. The Global Competitiveness Report. New York: OxfordUniversity Press and Palgrave Macmillan.
Zelner, Bennet A. 2009. “Using Simulation to Interpret Results from Logit, Probit, and Other NonlinearModels.” Strategic Management Journal 30 (12): 1335–48.
272 Policy Studies Journal, 41:2