environmental radiation monitoring in hong kong
TRANSCRIPT
EnvironmentalRadiation Monitoring
in Hong KongTechnical Report No. 22
Annual Report 2002


Environmental Radiation Monitoring in Hong Kong
Technical Report No. 22
Annual Report 2002
Published May 2003Copyright reserved. Permission to reproduce any part of the report should be obtained from theHong Kong Observatory of the Hong Kong Special Administrative Region.
This publication is prepared and disseminated in the interest of promoting the exchange of information. The Government of the Hong KongSpecial Administrative Region (including its officers and employees) makes no warranty, statement or representation, expressed or implied,with respect to accuracy, completeness, or usefulness of the information contained herein, and in so far as permitted by law, shall not have anylegal liability or responsibility (including liability for negligence) for any loss, damage, or injury (including death) which may result, whetherdirectly or indirectly, from the supply or use of such information.
Mention of product of manufacturer does not necessarily constitute or imply endorsement or recommendation.

i
Contents
Contents........................................................................................................... i
List of Tables................................................................................................... ii
List of Figures ................................................................................................. vi
Acknowledgement........................................................................................... ix
Chapter 1 Environmental Radiation Monitoring in Hong Kong ....................................... 1
Chapter 2 The Sampling Programme and the Direct RadiationMeasurement Programme ................................................................................. 3
Chapter 3 Methods of Measurement ................................................................................. 7
Chapter 4 Reporting Rationale .......................................................................................... 14
Chapter 5 Quality Assurance............................................................................................. 18
Chapter 6 Summary of Measurement Results ................................................................... 20
References......................................................................................................... 26
Appendix A....................................................................................................... 28
Appendix B ....................................................................................................... 29
ii
List of Tables
Table 1 Summary of the sampling programme .............................................................. 30
Table 2 Summary of methods of measurement.............................................................. 32
Table 3 Technical specifications of RSS-131 High Pressure Ionisation Chamber ........ 33
Table 4 List of major artificial radionuclides routinely monitored in the EnvironmentalRadiation Monitoring Programme .................................................................... 34
Table 5 Summary of typical measurement parameters .................................................. 35
Table 6 Results of the IAEA Proficiency Test for the determination of γ-emittingradionuclides in a mineral matrix...................................................................... 37
Table 7 Re-measurement results of IAEA reference materials IAEA-Soil-6 (Soil),IAEA-152 (Milk Powder) and IAEA-368 (Pacific Ocean Sediment)............... 38
Table 8 Salinity and pH of aquatic samples ................................................................... 39
Table 9 Ambient gamma dose rate recorded by the Radiation Monitoring Networkin January 2002 ................................................................................................. 40
Table 10 Ambient gamma dose rate recorded by the Radiation Monitoring Networkin February 2002 ............................................................................................... 42
Table 11 Ambient gamma dose rate recorded by the Radiation Monitoring Networkin March 2002 ................................................................................................... 44
Table 12 Ambient gamma dose rate recorded by the Radiation Monitoring Networkin April 2002 ..................................................................................................... 46
Table 13 Ambient gamma dose rate recorded by the Radiation Monitoring Networkin May 2002 ...................................................................................................... 48
Table 14 Ambient gamma dose rate recorded by the Radiation Monitoring Networkin June 2002 ...................................................................................................... 50
Table 15 Ambient gamma dose rate recorded by the Radiation Monitoring Networkin July 2002 ....................................................................................................... 52
Table 16 Ambient gamma dose rate recorded by the Radiation Monitoring Networkin August 2002 .................................................................................................. 54
Table 17 Ambient gamma dose rate recorded by the Radiation Monitoring Networkin September 2002............................................................................................. 56
Table 18 Ambient gamma dose rate recorded by the Radiation Monitoring Networkin October 2002................................................................................................. 58
iii
Table 19 Ambient gamma dose rate recorded by the Radiation Monitoring Networkin November 2002............................................................................................. 60
Table 20 Ambient gamma dose rate recorded by the Radiation Monitoring Networkin December 2002 ............................................................................................. 62
Table 21 Monthly ambient gamma dose rates recorded by the Radiation MonitoringNetwork in 2002................................................................................................ 64
Table 22 Summary of occurrenecs with significant rise in ambient gamma dose ratesin 2002............................................................................................................... 65
Table 23 Gamma dose rate due to cosmic radiation ........................................................ 66
Table 24 Measurement results at the Daya Bay Contigency Plan emergency survey sites 67
Table 25 Readings recorded by the Automatic Gamma Spectrometry Systemlocated at Ping Chau in January 2002 ............................................................... 68
Table 26 Readings recorded by the Automatic Gamma Spectrometry Systemlocated at Ping Chau in February 2002 ............................................................. 69
Table 27 Readings recorded by the Automatic Gamma Spectrometry Systemlocated at Ping Chau in March 2002 ................................................................. 70
Table 28 Readings recorded by the Automatic Gamma Spectrometry Systemlocated at Ping Chau in April 2002 ................................................................... 71
Table 29 Readings recorded by the Automatic Gamma Spectrometry Systemlocated at Ping Chau in May 2002 .................................................................... 72
Table 30 Readings recorded by the Automatic Gamma Spectrometry Systemlocated at Ping Chau in June 2002 .................................................................... 73
Table 31 Readings recorded by the Automatic Gamma Spectrometry Systemlocated at Ping Chau in July 2002..................................................................... 74
Table 32 Readings recorded by the Automatic Gamma Spectrometry Systemlocated at Ping Chau in August 2002 ................................................................ 75
Table 33 Readings recorded by the Automatic Gamma Spectrometry Systemlocated at Ping Chau in September 2002 .......................................................... 76
Table 34 Readings recorded by the Automatic Gamma Spectrometry Systemlocated at Ping Chau in October 2002............................................................... 77
Table 35 Readings recorded by the Automatic Gamma Spectrometry Systemlocated at Ping Chau in November 2002........................................................... 78
Table 36 Readings recorded by the Automatic Gamma Spectrometry Systemlocated at Ping Chau in December 2002 ........................................................... 79
iv
Table 37 Mean gamma plus beta and mean gamma only radiation levels measured byradioactivity sonde on 6 June 2002 ................................................................... 80
Table 38 Mean gamma plus beta and mean gamma only radiation levels measured byradioactivity sonde on 16 August 2002............................................................. 83
Table 39 Mean gamma plus beta and mean gamma only radiation levels measured byradioactivity sonde on 6 October 2002 ............................................................. 86
Table 40 Specific gamma activity of airborne particulate samples.................................. 89
Table 41 Specific gamma activity of air sampled by iodine cartridges at King's Park.... 90
Table 42 Specific gamma activity of deposition samples ................................................ 91
Table 43 Specific gamma activity of terrestrial food samples ......................................... 93
Table 44 Specific gamma activity of water and suspended particulatein sea water samples .......................................................................................... 95
Table 45 Specific gamma activity of aquatic food and seaweed samples........................ 98
Table 46 Specific gamma activity of sediment and land soil samples ............................. 101
Table 47 Specific activity of tritium in deposition and airborne water vapour samples.. 103
Table 48 Specific activity of tritium in terrestrial food samples ...................................... 105
Table 49 Specific activity of tritium in water samples..................................................... 107
Table 50 Specific activity of tritium in aquatic food and seaweed samples .................... 109
Table 51 Specific activity of strontium-90 in airborne particulate samples..................... 111
Table 52 Specific activity of strontium-90 in deposition samples ................................... 112
Table 53 Specific activity of strontium-90 in terrestrial food samples ............................ 114
Table 54 Specific activity of strontium-90 in suspended particulatein sea water samples .......................................................................................... 116
Table 55 Specific activity of strontium-90 in aquatic food and seaweed samples........... 117
Table 56 Specific activity of strontium-90 in land soil samples ...................................... 119
Table 57 Specific activity of plutonium-239 in airborne particulate samples ................. 120
Table 58 Specific activity of plutonium-239 in deposition samples ................................ 121
Table 59 Specific activity of plutonium-239 in suspended particulatein sea water samples .......................................................................................... 123
Table 60 Specific activity of plutonium-239 in aquatic food and seaweed samples ....... 124
v
Table 61 Specific activity of plutonium-239 in sediment and land soil samples............. 126
Table 62 Specific activity of carbon-14 in airborne particulate, airborne carbon dioxide,terrestrial food and aquatic food........................................................................ 128
Table 63 Re-meaurement results of strontium-90 for land soil samples collectedin 1994-1996 ..................................................................................................... 130
Table 64 Comparison of specific activity of carbon-14 in 2002 samples with thosein previous years and the Background Radiation Monitoring Programme(1987-1991)....................................................................................................... 131
Table 65 Comparison of specific activity of measurable artificial radionuclidesin samples collected in 2002 and those collected in the Background RadiationMonitoring Programme (1987 - 1991) .............................................................. 132

vi
List of Figures
Figure 1 Environmental radiation measurement and sampling locations........................ 135
Figure 2 Annual mean ambient gamma dose rates recorded by theRadiation Monitoring Network in 2002 ............................................................ 136
Figure 3 Annual mean ambient gamma dose rates recorded by theTLD Network in 2002 ....................................................................................... 137
Figure 4 Locations of the ten emergency survey sites in the Daya Bay Contigency Plan 138
Figure 5 Daily mean ambient gamma dose rates recorded by theRadiation Monitoring Network from January to June 2002 ............................. 139
Figure 6 Daily mean ambient gamma dose rates recorded by theRadiation Monitoring Network from July to December 2002 ......................... 141
Figure 7 Track of Severe Tropical Storm Hagupit (from 10 to 12 September 2002) ..... 143
Figure 8 Daily mean ambient gamma dose rates recorded by theRadiation Monitoring Network from 10 to 17 September 2002 ....................... 144
Figure 9 Ground level activity concentration of potassium-40 measured by the AMSover Sai Kung.................................................................................................... 146
Figure 10 Ground level activity concentration of potassium-40 measured by the AMSover Soko Islands .............................................................................................. 147
Figure 11 Variation of count rate with altitude at Mirs Bay.............................................. 148
Figure 12 Variation of count rate with altitude at Tuen Mun............................................ 149
Figure 13 Spatial distribution of environmental gamma dose rate in open field............... 150
Figure 14 Spatial distribution of environmental gamma dose rate in built-up areas......... 151
Figure 15 Comparison of daily dose rate recorded by the High Pressure IonizationChamber and the Automatic Gamma Spectrometry System at Ping Chau ...... 152
Figure 16 Vertical profiles of gamma plus beta and gamma only radiation measured byradioactivity sonde on 6 June 2002 ................................................................... 153
Figure 17 Vertical profiles of gamma plus beta and gamma only radiation measured byradioactivity sonde on 16 August 2002............................................................. 154
Figure 18 Vertical profiles of gamma plus beta and gamma only radiation measured byradioactivity sonde on 6 October 2002 ............................................................. 155
Figure 19 K-40 specific activity, salinity and pH for intertidal sediment in 2002 ............ 156
vii
Figure 20 Scatter diagram of K-40 specific activity against salinity for intertidal sedimentin 2000 – 2002................................................................................................... 157
Figure 21 K-40 specific activity, salinity and pH for sea water in 2002 ........................... 158
Figure 22 Scatter diagram of K-40 specific activity against salinity for sea waterin 2000 – 2002................................................................................................... 159
Figure 23 K-40 specific activity, salinity and pH for seabed sediment in 2002................ 160
Figure 24 Scatter diagram of K-40 specific activity against salinity for seabed sedimentin 2000 – 2002................................................................................................... 161

viii
ix
Acknowledgement
The Hong Kong Observatory wishes to express its gratitude to the Agriculture, Fisheries andConservation Department, Civil Engineering Department, Environmental Protection Department,Water Supplies Department and Housing Department for their assistance in sample collection,Government Laboratory for chemical treatment of samples and Radiation Health Unit of Departmentof Health for providing and reading of the thermoluminescent dosimeters. We wish to express ourappreciation to the Government Flying Service for operation of the Aerial Monitoring System, andHong Kong Police Force for providing accommodation at police stations to a number of RadiationMonitoring Stations and the Automatic Gamma Spectrometry System. Special thanks also go to thoseorganisations that kindly permitted the installation of thermoluminescent dosimeters and thecollection of land soil samples within their premises.

- 1 -
Chapter 1
Environmental Radiation Monitoring in Hong Kong
1.1 Early Activities of Environmental Radiation Monitoring in Hong Kong
Environmental radiation monitoring in Hong Kong began in 1961 when the Hong KongObservatory started to measure beta radioactivity of air particulate, total deposition andrainwater at King’s Park. At around the same time, the Observatory began to participate ininternational programmes on environmental radiation monitoring, and the practice continuesafter more than four decades. One of the earliest programmes is Global Network of Isotopesin Precipitation Programme organised by the International Atomic Energy Agency (IAEA)and the World Meteorological Organisation (WMO). Since 1961, the Observatory has beendespatching rainwater samples from King’s Park every three months to the IAEA in Vienna,Austria. The concentrations of tritium, deuterium and oxygen-18 in precipitation in HongKong are published in a series of IAEA Technical Reports entitled “Environmental IsotopeData : World Survey of Isotope Concentration in Precipitation” and at its web site:http://isohis.iaea.org/GNIP.asp.
The Observatory also participates in another global radiation monitoring programmeorganised by the Atomic Energy Authority (AEA) at Harwell in the U.K. Since 1962,rainwater samples collected at King’s Park have been despatched to the AEA for radioactivitymeasurements once every three months or whenever two full 5-litre bottles of rainwatersamples have been obtained. Airborne particulate samples have been collected and sent twicea week since 1964. The results of radioactivity measurements and the detailed analyses ofradionuclides in these samples are published in a report series entitled “Radioactive fallout inair and rain: results” by the AEA.
In 1965, the scope of measurement was expanded to include the total gamma activityand the activity concentration of caesium-137. The results of the total beta activitymeasurements in Hong Kong for the period from 1965 to 1980 were published by theObservatory in the monthly “Radioactivity Bulletin (monthly)” (Hong Kong Observatory,1965-1980), and a publication entitled “Radioactivity Bulletin (Beta activity) (1973 - 80)”(Hong Kong Observatory, 1983a) also summarised the results from 1973 to 1980. The resultsof gamma activity measurements from 1965 to 1980 were reported in a publication entitled“Radioactivity Bulletin (Gamma Activity) (1965 - 80)” (Hong Kong Observatory, 1983b).From 1981 to 1983, both the beta and gamma activity measurements were published togetherin the annual “Radioactivity Bulletin (yearly)” (Hong Kong Observatory, 1983-1984). In1983, the Observatory embarked on a comprehensive environmental radiation monitoringprogramme (ERMP) in response to the construction of the nuclear power stations at Daya Bayin Guangdong. Unit 1 and Unit 2 of the Guangdong Nuclear Power Station (GNPS) at DayaBay began commercial operation on 1 February 1994 and 6 May 1994 respectively. Unit 1and Unit 2 of the Lingao Nuclear Power Station (LNPS), about 1 km northeast of the GNPS,began commercial operation on 28 May 2002 and 8 January 2003 respectively. Majoroperational events of the GNPS and LNPS are listed in Appendices A and B respectively.
1.2 Environmental Radiation Monitoring Programme (ERMP)
The first phase of the ERMP, known as the Background Radiation MonitoringProgramme (BRMP), was carried out before the GNPS began to operate. The objective of theBRMP was to establish the baseline radiation level in Hong Kong against which changesarising from the operation of the nuclear power stations at Daya Bay would be determined.The programme comprised territory-wide monitoring of the ambient gamma radiation level,
- 2 -
and measurement of the activity concentrations of alpha, beta and gamma emittingradionuclides in various types of environmental samples.
The BRMP lasted five years from 1987 to 1991. An interim report of the BRMPcovering the results of the first two years of measurements was published in 1989. A finalreport covering all five years of measurements was published in December 1992 (Hong KongObservatory, 1992).
The second phase of the ERMP contains all the essential features of the BRMP. It is anon-going programme so that any long term changes in environmental radioactivity,particularly those arising from the operation of the nuclear power stations at Daya Bay, can bedetermined. The results of measurements have been published in annual reports since 1992(Hong Kong Observatory, 1994-2002).
Technical reports on environmental radiation monitoring in Hong Kong are available inthe web site of the Hong Kong Observatory at http://www.hko.gov.hk orhttp://www.weather.gov.hk.
- 3 -
Chapter 2
The Sampling Programme and the Direct Radiation Measurement Programme
The ERMP consists of two major components. The first component is to detect artificialradioactive materials in the environment of Hong Kong arising from the operation of theGNPS and LNPS. Three major exposure pathways are monitored, namely the atmosphericpathway, the terrestrial pathway and the aquatic pathway. The second component is themeasurement of the ambient gamma radiation level in Hong Kong by the radiationmonitoring network, thermoluminescent dosimeter network and radiological survey. Thelocations where sampling and ambient gamma radiation measurements were conductedduring 2002 are shown in Figure 1. A summary of the sampling programme of the ERMP istabulated in Table 1.
2.1 Atmospheric pathway
Ambient gamma radiation levels are continuously monitored by a radiation monitoringnetwork (RMN) consisting of 10 fixed monitoring stations at locations shown in Figure 2.The ambient gamma dose rate at each station is measured continuously by a high pressureionisation chamber (HPIC) and the data are transmitted to the Observatory Headquarters onceevery minute..
The ambient gamma dose accumulated over a longer period is also measured throughoutthe territory by a thermoluminescent dosimeter (TLD) network with 27 fixed monitoringpoints at the locations shown in Figure 3. The TLDs are read and replaced once every quarter.The data from one of the TLD monitoring sites, namely, the Tuen Mun Government Office,was not available in the last quarter of 2002 due to civil works there.
Upper-air radioactivity soundings to measure gamma radiation and high-energy betaparticles (> 0.25 MeV) in the atmosphere are also conducted. Launches are made in differentcombinations of wind direction, wind speed and atmospheric stability class so as to obtainradioactivity sounding profiles for various meteorological conditions. In 2002, threeradioactivity soundings were launched.
Airborne radionuclides can originate either directly from the source, or fromre-suspension following deposition. Atmospheric samples which are collected continuouslyin the ERMP include airborne particulate, wet deposition (precipitation), total deposition (wetplus dry deposition) and gaseous iodine. Water vapour and carbon dioxide samples arecollected intermittently for a total time of about 36 hours within any week in a month.
Airborne particulate and wet deposition samples are collected at King’s Park, Sha TauKok and Yuen Ng Fan. Airborne particulates are sampled with high volume air samplers(General Metal Works Model UV-2H-1). The flow rate through the sampler is typically0.5 m3 min-1. One to three carboys with a top funnel collect the wet deposition. Totaldeposition is collected at King’s Park only. The sampler is a stainless-steel pan of 260 mmdiameter filled with distilled water.
Gaseous iodine, water vapour and carbon dioxide samples are collected only at King’sPark. Gaseous iodine is sampled using a radioiodine sampler (Hi-Q Environmental ProductsModel CMP-14CV) with a silver impregnated zeolite cartridge (Hi-Q EnvironmentalProducts Model AGX-2). The typical flow rate through the sampler is 0.04 m3 min-1. Watervapour and carbon dioxide are collected using a gaseous effluent sampler (ScienceApplications International Corporation Model ACT-100) with a drierite cartridge (The W.A.
- 4 -
Hammond Drierite Company Model 4045-W) and an ascarite cartridge (Science ApplicationsInternational Corporation Model GN-160) respectively. The typical flow rate through thesampler is 8x10⁻⁵ m3 min-1.
The automatic gamma spectrometry system at Ping Chau in Mirs Bay continuouslymeasures the ambient gamma dose rate and transmits the measurement results to a centralstation at the Observatory Headquarters every hour. The system also continuously collectsairborne particulates on a rotating circular air filter drum and gaseous iodine on a charcoalcartridge (RADeCO Model BG-300), with nominal sampler flow rates of 0.47 m3 min-1 and0.05 m3 min-1 respectively. Nuclide-specific gamma spectrometry measurements as well asgross alpha and beta measurements are performed on the air filter samples. Iodine-131concentration in the charcoal cartridge is also determined. All measurements are performedcontinuously around the clock. The gross alpha and beta count rates as well as the iodineconcentration are transmitted to the central station at hourly intervals, while the gammaspectrometry analysis data are sent back once every two hours. The spectrum can also bemade available upon polling from the central station.
2.2 Terrestrial pathway
Radioactive particles enter the terrestrial pathway by direct deposition on the ground.Some of these particles, after uptake by plants and animals, eventually enter the human bodyvia ingestion.
In monitoring the terrestrial pathway, samples of various types of foodstuff typical to thediet of the local population and consumed in large quantities are collected at main distributionpoints and wholesales markets. Particular attention has been given to food produced locallyand in Shenzhen. Foodstuffs collected include rice, milk, beef, pork, pig's liver, chicken,duck, pak choi, choi sum, banana, lychee, sugar cane and mandarin orange. For foodstuffavailable year-round, the sampling frequency is once every quarter. Seasonal fruits arecollected when in season, usually once or twice a year. Due to the avian influennza incident atthe beginning of 2002, no samples of local chicken could be obtained in the first three quartersof 2002.
Land soil is sampled at 39 designated sampling sites throughout the territory to monitorthe long-term variations in the concentration of artificial radionuclides in soil. At each site,samples are collected from two layers with the upper layer from the surface down to 15 cmand the lower layer from 15 cm to 30 cm deep. Sampling from the 39 sites is spread over acycle of six years. In 2002, land soil samples from eight sites, namely Tap Shek Kok PowerStation, Yuen Long R.G. Filters, Tsim Bei Tsui Police Station, Shek Kong Airfield, KadoorieFarm, Cheung Chau Meteorological Station, Lamma Police Post and Peng Chau PumpingStation, were collected. In-situ gamma measurements using a Portable Gamma SpectrometricAnalysis Module (PGSAM) were also performed at Tap Shek Kok Power Station, Yuen LongR.G. Filters, Tsim Bei Tsui Police Station, Shek Kong Airfield and Kadoorie Farm. The in-situ gamma spectra thus obtained could characterise deposited radionuclides in soil and onexposed surfaces. The results of the in-situ gamma measurements will be reported when anin-depth analysis of the properties and characteristics of the land soil in Hong Kong iscompleted.
2.3 Aquatic pathway
Exposure to radioactive materials in the aquatic pathway is primarily through ingestionof the water-borne radionuclides in water and irrigated crops, as well as the radionuclidestaken up by the aquatic plants and animals. Of secondary importance is the externalirradiation from surface water, or from deposits in the sediment along the shoreline. Samples
- 5 -
collected in the aquatic pathway include drinking water, underground water, sea water,aquatic food, seaweed, as well as intertidal and seabed sediments.
Treated drinking water samples are collected from the distribution taps at Kowloon andTuen Mun as well as the treatment works at Shatin, Tuen Mun and Yau Kom Tau. Rawdrinking water samples are collected from the High Island Reservoir, the Plover CoveReservoir, the Muk Wu B Pumping Station and the treatment works at Shatin, Tuen Mun andYau Kom Tau. The samples are collected once every three months by the staff of the WaterSupplies Department.
With the assistance of the staff of the Housing Department, underground water issampled at six locations, namely Siu Hong Court (Tuen Mun), Cheung Hong Estate (TsingYi), Yuen Long Estate (Yuen Long), Wan Tsui Estate (East Hong Kong Island), Wah FuEstate (West Hong Kong Island) and Fu Shan Estate (East Kowloon).
Samples of sea water are taken at three depths - the upper level (a few metres underneaththe surface), the middle level and the lower level (several metres above the seabed). There arefour sampling locations in the eastern part of the coastal waters of Hong Kong, namely watersoff Waglan Island, Basalt Island, Tai Long Wan and Port Island. Sampling is carried outannually with the assistance of the Water Policy and Planning Group of the EnvironmentalProtection Department. Suspended particulate in the sea water at the three levels is obtainedby filtering the sea water samples through a membrane filter.
Aquatic foodstuff samples include freshwater fish, marine fish, shellfish, shrimp, crab,squid and cuttlefish. These samples are collected either at the wholesale fish markets or fromenlisted fishermen with the assistance of the Agriculture, Fisheries and ConservationDepartment. Only one species of the freshwater fish is selected, namely aristichthys nobilis,which is collected quarterly from Shenzhen and Yuen Long. Marine fish and squid samplesare collected quarterly from Hong Kong waters, waters west of Hong Kong and Daya Bay.Shrimp, crab and cuttlefish samples are collected quarterly from the Hong Kong waters and,with the exception of cuttlefish, from the waters west of Hong Kong. Three types of shellfishsamples (babylonia formosae, tapes philippinarum and perna viridis) are collected quarterlyfrom the Hong Kong waters. Perna viridis samples are also collected from Daya Bay. Due torestrictions on commercial fishing in the Daya Bay region, samples in Daya Bay are collectedthrough arrangements with an aqua produce farm in the region.
Four species of local seaweed are sampled. Ulva lactuca and enteromorpha prolifera arespecies of the green algae. Porphyra dentata is a red algae and sargassum hemiphyllum is abrown algae. Enteromorpha prolifera is collected fresh by Observatory staff in the ToloHarbour area. All others are purchased as dried seaweed from local fishermen at Po Toi O orPo Toi Island. Since seaweed proliferates in the cool seasons, sampling is performed only inwinter and spring. In 2002, seaweed from Po Toi Island was not available from the market.
Intertidal sediments are sampled quarterly at three locations along the coast of HongKong, namely Pak Sha Wan, Tsim Bei Tsui and Sha Tau Kok. Two layers are taken at eachsampling point, the upper layer from the surface to 15 cm deep and the lower layer from15 cm to 30 cm in depth. Sampling of seabed sediments is carried out annually with theassistance and facilities of the Technical Services Division of the Civil EngineeringDepartment at four locations in the coastal waters of Hong Kong, namely Tai Tan Hoi Hap,Lung Ha Wan, Picnic Bay and Western Anchorage.
2.4 Radiological survey programme

- 6 -
The Radiological Survey Programme consists of aerial survey and mobile survey. Theaerial survey aims at detecting radiation level at different altitudes using the AerialMonitoring System (AMS). The mobile survey makes use of the Mobile RadiationMonitoring Station (MRMS) to carry out radiological measurement and sample collection indifferent parts of the territory.
The objective of the mobile survey is to monitor the distribution and long-term variationof environmental terrestrial gamma dose rate over the territory. The territory of Hong Kong isdivided into 42 grid boxes of 5 km x 5 km for open field areas and 61 grid boxes of2.5 km x 2.5 km for built-up areas according to the population and land use. A survey site isselected within each grid box for radiological survey. An intensive survey was conducted in1999 (Wong et al., 1999) and subsequent surveys are conducted in cycle of five years.Measurements are scheduled so that upon completion of one cycle, about six data spanning allseasons will be collected for each site. The current cycle started in 2000 and will complete in2004.
Additional surveys are also conducted at the ten designated emergency survey sites inthe Daya Bay Contingency Plan (Figure 4). Besides monitoring the ambient gamma dose rateat these survey sites, surface activity concentration of beta emitters at ground surface and in-situ gamma spectrum of land soil are measured. Airborne particulate and radioiodine samplesare also collected at these sites.
As the environmental radiation field is a combination of terrestrial gamma radiation andcosmic radiation from space, it is necessary to measure the cosmic contribution for correctionin order to gain a perspective of the terrestrial component. Cosmic measurements areconducted at the centre of a fresh water reservoir where the contribution from the terrestrialcomponent is minimal (Tsui et al., 1991). These measurements are conducted quarterly inorder to detect any seasonal variations that may be present.
The aerial survey operates either in the plume tracking mode or ground contaminationmeasurement mode. Background radiation levels at altitudes of 500 m and 600 m have beendetermined in the plume tracking mode for use as reference in emergency operations.Measurement of radionuclides on ground surface is performed using the groundcontamination measurement mode with the helicopter flying at 100 m above ground surface.Establishment of background levels in this mode continued throughout 2002.
- 7 -
Chapter 3
Methods of Measurement
A summary of the methods of measurement in the ERMP is listed in Table 2 and thedetails are given below.
3.1 Monitoring of the ambient gamma radiation level
3.1.1 Radiation Monitoring Network (RMN)
Ambient gamma dose rate at each of the ten fixed monitoring stations in RMN ismeasured continuously using a Reuter-Stokes Model RSS-131 HPIC EnvironmentalRadiation Monitoring Station. The detector consists of an 8-litre capacity stainless-steelspherical ionisation chamber that is pressurised to around 25 atmospheres with pure argon gasand an electrometer, which is directly mounted onto the ionisation chamber to reduce noise.The ionisation chamber and the associated electronics are placed inside a wooden housing.The one-minute mean gamma dose rate readings are telemetered every minute to a centralprocessing unit located at the Observatory Headquarters. The technical specifications of theHPIC are summarised in Table 3.
3.1.2 Thermoluminescent Dosimeter (TLD) Network
A set of TLDs at each of the 27 fixed monitoring points measures the cumulative gammadose over an exposure period. The TLD network complements the HPIC network byachieving a wide spatial coverage at a much lower operation cost.
Lithium fluoride (LiF:Mg,Ti) TLDs (Harshaw Type 8807) are used in the network. Abatch of five TLDs is used at each site to improve the statistical precision. The TLDs arereplaced and read once every three months.
3.1.3 Aerial Monitoring System (AMS)
The AMS, manufactured by Scintrex Ltd. of Canada, is mounted on board a SikorskyS76A+ helicopter of the Government Flying Service during operation.
Nuclide specific gamma spectrometry measurements of the environment arecontinuously performed by the system during flight. The gamma spectra, spectroscopicanalysis results and spatial locations of the measurement derived from the AMS’s globalpositioning system (GPS) are displayed on-board in real-time and archived. The positionalinformation is updated once every tenth of a second. The data can be retrieved for morerigorous analysis after flight.
The AMS can operate in two modes, namely, the plume tracking mode and the groundcontamination measurement mode. In the plume tracking mode, the radiation levels atdifferent altitudes in the lower atmosphere are measured. In the ground contaminationmeasurement mode, the composition of radionuclides on the ground is measured. The AMSconsists of a system control unit, a data display unit, and two detector assemblies, which areconfigured with different sets of NaI gamma ray detectors to suit individual modes ofoperation. The detector assembly configured for plume tracking contains two 4.2L NaIcrystals, whereas the detector assembly for ground contamination measurement has five 1.6LNaI crystals. Only one type of detector assembly is used for each aerial survey flight.
While operating in the plume tracking mode, the helicopter installed with the AMS flies
- 8 -
at a speed of about 100 km h-1 in accordance with pre-determined flight plans at altitudes of500 m, 600 m and 800 m above sea level respectively. The design of the flight plan is basedon 5 km length grid boxes, which are specifically positioned such that the flight paths will notencounter obstacles or grounds at heights at and above the planned altitude. Radiation levelsdetected by the system operating in this mode are measured in counts per second to maximisesystem sensitivity. However, analysis of the count rate data in selected regions of interest(representing specific radionuclides) can also be performed in real time if required.
To study the change of environmental radiation levels with altitude, the helicopterperforms spiral climb flights in the plume tracking mode of operation over two fixed points,namely Tuen Mun and Mirs Bay, one over land and another over sea. The helicopter ascendsin a spiral pattern over the fixed points from about 150 m to 1000 m with a pitch of about 100 m. The one-second count rate data obtained during the spiral climbs over the two pointsshow the contrast between the environmental radiation levels above land and those above sea.
To measure environmental radiation levels at the ground surface in the groundcontamination measurement mode of operation, the helicopter flies at a fixed altitude of100 m above ground in a terrain-following mode with a cruising speed of 150 km h-1.Neighbouring flight paths are typically separated by 200 m. Activity concentrations ofselected radionuclides can be displayed in both counts per second and Bq m-2.
In emergency situations, the AMS will first be used in the plume tracking mode fordetecting the presence of a radioactive plume, if any, in the atmosphere and mapping out theextent of plume coverage over the territory. After passage of the radioactive plume, thesystem will be used for rapid determination of the amount and composition of radionuclidesdeposited on ground. The data on environmental radiation levels collected during routineoperations will be used as background reference levels.
3.2 Automatic Gamma Spectrometry System
The automatic gamma spectrometry system was manufactured by EG&G Berthold. Thesystem is housed inside an air-conditioned housing with an internal dimension of2.8 m x 2.6 m x 2.3 m at Ping Chau.
Ambient gamma dose rates are measured by a proportional counter (EG&G BertholdLB6360) mounted on the roof of the housing.
A rotating circular filter drum collects the airborne particulate. The air from the outsideis sucked in through an air inlet tubing to the circular filter drum depositing the air particulateonto the filter tape. After passing through the circular filter drum, a portion of the air will bedirected to the outside, while the rest will go via a secondary tubing to reach the charcoalcartridge for iodine collection before being discharged.
Outside the circular filter drum, a fixed ZnS coated plastic scintillator (EG&G BAIModel BAI 9300AB) facing the filter tape measures the gross alpha and the gross beta activityof the airborne particulate. Since natural radon contributes significantly to these gross counts,the system will subtract this radon component to obtain the artificial alpha and artificial betaactivity of the samples.
At the centre of the circular filter drum, an electro-mechanically cooled high puritygermanium detector (EG&G Ortec GEM-25185-S p-type) using the EG&G Ortec Omnigamsoftware performs nuclide specific gamma spectrometry analysis on the airborne particulate.The activities of up to 62 nuclides are routinely monitored.
- 9 -
A NaI detector (EG&G BAI Model BAI 9311) with a single channel analyser measuresthe iodine-131 concentration in the charcoal cartridge samples.
All measurements are performed automatically and continuously. During normaloperation, the 5-minute averaged ambient gamma dose rate, the 15-minute averaged grossalpha and gross beta activity concentrations, as well as the 10-minute averaged iodine-131activity concentration are transmitted to the central station at the Observatory Headquartersevery hour. The gamma spectrometry analysis data are transmitted to the central station atfixed two hourly intervals, and the spectrum can be made available upon manual polling.
The system also monitors the level of the ambient gamma dose rate, the artificial alphaactivity, the artificial beta activity and the iodine concentration. User editable alarm levels arepre-set for these measurements. Once the measured data exceed the alarm level, the latestavailable readings will be sent back to the Observatory Headquarters immediately. This willalso trigger an alarm at the central station to alert the user and activate a more frequentmeasurement interval at the field station and produce reports at shorter time intervals (exceptfor the iodine channel, which has a fixed measurement interval of 10-minutes). The user canedit the polling frequency at the central station to request the measurement reports to be sentback to the central station as frequently as possible. However, this alarm function does notapply to the spectrometry data or spectrum.
The existing automatic gamma spectrometry system has been in operation for over fiveyears and deterioration in performance was observed in the past two years, especially in theelectro-mechanically cooled high purity germanium detector. A replacement system has beenordered and will be operational in 2003.
3.3 Mobile Radiation Monitoring Station
The Mobile Radiation Monitoring Station (MRMS) is converted from a commerciallyavailable van and equipped with portable or specially designed instruments for use in routineand emergency radiological surveys.
The instruments on board the MRMS include a portable HPIC (Reuter-Stokes ModelRSS-131), a surface contamination monitor (EG&G Berthold Model LB-123), a survey meter(Seibersdorf Model SSM-1) and a Portable Gamma Spectrometric Analysis Module(PGSAM). The portable instruments are stored in built-in metal cabinets inside the MRMS.An external gamma probe (Seibersdorf Model SSM1-07) is installed on the vehicle roof andconnected to the survey meter inside the MRMS to measure the gamma dose rate.
The portable HPIC is used to measure the ambient gamma radiation level. Its sensor ismounted with its centre at 1 metre above ground. At each measurement location, data areacquired for a continuous period of 30 minutes. The technical specifications of the HPIC areidentical to that used in the RMN.
The surface contamination monitor is an instrument designed for the detection andmeasurement of alpha and beta sources on surfaces. It comprises a display unit withmicroprocessor electronics and a butane-filled alpha-beta counter tube (LB-6358G). Thedetector takes measurement at one cm above the surface. The results are displayed as activityper unit area (Bq cm-2).

- 10 -
The PGSAM has the capability to rapidly estimate the environmental gammaradioactivity inventory without the need to take samples. Using a high purity germanium(HPGe) detector and an In-Situ Object Calibration System (Canberra ISOCS), the PGSAMcan characterise deposited radionuclides in soil as well as on exposed surfaces by acquiringand analyzing gamma spectra in-situ. During emergencies, calibration factors for thegeometry of an exponential circular plane will be used to simulate the freshly depositedradionuclides on the soil surface. In routine surveys, calibration factors for a cylindricalgeometry are used to simulate the vertical distribution of radionuclides in the soil.
A high volume air sampler and a radioiodine sampler are custom-fitted inside thevehicle. Air is drawn into both samplers through an inlet on the vehicle roof. The flow of airthrough each sampler is continuously monitored and can be independently controlled. Thenominal flow rates for the high volume air sampler and the radioiodine sampler are0.9 m3 min-1 and 0.08 m3 min-1 respectively. Furthermore, a NaI-based system is installed forrapid screening of samples from the air sampler as well as other samples collected. Sampleswith elevated activity will be re-analysed using the high resolution gamma spectrometrysystems at the King’s Park Radiation Laboratory.
In 2002, a Global Positioning System receiver and an Automatic Survey Data InputSystem (ASDIS) were installed on the MRMS. The ASDIS facilitates real-time automatictransmission of survey data, with location information, to the Observatory Headquarters.
3.4 Radioactivity sounding
Radioactivity soundings are carried out using radiosondes (Vaisala Model RS80) thatincorporate radiation sensor assemblies (Vaisala Model NSS14A). The sensor assemblycomprises two special low-temperature type Geiger-Mueller tubes, one of which onlymeasures gamma radiation and the other measures both gamma and high energy betaradiation (>0.25 MeV). The gamma only tube is larger and therefore more sensitive andefficient than the gamma plus beta tube. The mean ascent rate of the radiosonde is about6 m s-1, and readings are taken at 0.3-second intervals.
Both types of tubes have an intrinsic background. The maximum intrinsic backgroundcount rate is 0.17 count per second for the gamma only tube and 0.2 count per second for thegamma plus beta tube, corresponding to minimum measurable dose rates of 0.03 and0.21 µGy h-1 respectively. The maximum dose rates for the gamma only tube and the gammaplus beta tube are 550 µGy h-1 and 1100 µGy h-1 respectively. The conversion from countrates to dose rates is based on calibration of the tubes using a caesium-137 source, as given bythe following equations according to the manufacturer:
Gamma only tube: dose rate (µGy h-1) = 0.23 x (count rate)1.15
Gamma plus beta tube: dose rate (µGy h-1) = 1.1 x (count rate)1.02
The ground station is a Vaisala DigiCORA MW11 upper-air sounding system for thereception and analysis of data from the radioactivity sonde.
With the introduction of the AMS, which can provide detailed spatial distribution ofradioactivity in the lower atmosphere, there are plans to phase out the routine radioactivitysoundings in the near future.
- 11 -
3.5 Analysis of environmental samples
With the exception of carbon-14 measurements, all radioactivity measurements ofenvironmental samples collected are carried out at the Radiation Laboratory at King’s Park.Samples received at the Radiation Laboratory are first examined and recorded by thelaboratory staff. Radiochemical methods are used to determine the activity concentrations ofselected radionuclides, mainly artificial ones, in the samples. The radionuclides monitoredinclude plutonium-239 (alpha emitter), tritium, strontium-90 and carbon-14 (beta emitter) aswell as iodine-131, caesium-137 and potassium-40 (gamma emitters). A list of the majorartificial radionuclides routinely monitored in the ERMP is given in Table 4. After thesamples are collected and delivered to the Radiation Laboratory at King’s Park, they aresubjected to sample treatment processes using various physical and chemical methods,followed by radioactivity measurement. Each sample, depending on the sample type, will gothrough one or more of the following analysis processes:
(a) gamma spectrometry for detecting and measuring the activity concentration ofgamma-emitting radionuclides;
(b) liquid scintillation counting to determine the activity concentration of tritium;
(c) low level gross beta counting to determine the activity concentration ofstrontium-90;
(d) alpha spectrometry to determine the activity concentration of plutonium-239; and
(e) accelerator mass spectrometry for analysis of carbon-14.
For alpha and beta emitting radionuclides, measurement is only made for thosepotentially significant in contributing to population dose and environmental impact as a resultof the operation of a nuclear power plant. This includes radionuclides having a long half-lifeand capable to come into equilibrium with the environment. Tritium activity concentration ismeasured for all samples containing water. Strontium-90 and plutonium-239 activityconcentrations are measured for selected samples only because of the laborious chemicaltreatment required. Carbon-14 activity concentration is measured for 13 selected types ofsamples. Several samples of the same type collected at the same location within the year arebulked to make a larger sample for one measurement. Of the 13 sample types, two areatmospheric and the remaining 11 are foodstuff collected in Hong Kong. Same sample typesare collected as far as possible for trend studies.
In 2002, radioactivity measurements of carbon-14 in the ERMP samples were carriedout by Rafter Radiocarbon Laboratory, New Zealand, using the accelerator massspectrometry technique under a service contract.
3.5.1Gamma spectrometric analysis
Apart from tritiated water vapour and carbon dioxide in the air, all samples are analysedfor gamma emitting radionuclides.
Due to inherent differences in the sample types, sample treatment procedures for gammameasurement vary from basically none for the radioiodine cartridge to laborious physicaltreatments such as those required for the food samples. Various combinations of thefollowing procedures have been used :

- 12 -
(a) Examination to see whether the correct species are collected. Other characteristicssuch as their freshness, sample sizes, etc., are also noted.
(b) Cleaning if dirt is found to adhere to the sample.
(c) Removal of foreign matters such as soil and sand in vegetables, attached seaweedand mollusc in fish, empty shells in shellfish, species other than the sample itself,etc., so as to obtain a representative raw sample.
(d) Drying of sample. For vegetables, sediment, fresh seaweed, etc., excess water inthe sample is drained off prior to other treatment. Filter papers for air particulateare dried to constant weight inside a desiccator.
(e) Weighing of the raw sample to facilitate calculation of activity concentration andother related quantities.
(f) Extraction of the portion to be measured, e.g., the edible portion of food samples,by removing shells, bones, seeds, scales, offal, etc.
(g) Weighing of the portion to be measured.
(h) Homogenisation of the portion to be measured to ensure uniform distribution.
(i) Containing the sample for measurement. The homogenised portion of the sampleis put into a designated sample container (e.g. Marinelli beaker) and weighed todetermine the amount of the sample being measured. Filter papers are pressed orfolded together to a more uniform geometry and placed inside a plastic disk formeasurement.
Gamma spectroscopic analysis is carried out using a gamma spectrometry system withfour liquid-nitrogen-cooled high purity germanium detectors (Canberra Model GC3519 p-type, EG & G Ortec Model GEM-35200 p-type, Tennelec Model CPVDS30-35200 p-typeand Tennelec Model CNVDS30-35200 n-type). The Canberra Genie-2000 software is usedfor data acquisition and spectral analysis.
3.5.2 Liquid scintillation counting
Tritium (H-3) is a pure beta emitter of low energy and its activity has to be measuredusing a liquid scintillation counter. Tritium measurement is performed for water samples andthe water extracted from foodstuff samples. Chemical procedures are carried out to extractthe water from the samples by azeotropic distillation. As the sample of underground water islargely inhibited from free exchange with the moisture in the atmosphere, it is expected tohave lower tritium content. To increase the sensitivity of measurement, electrolyticenrichment of tritium is performed for underground water samples. The extracted water fromall samples is mixed with a liquid scintillant in a 20 ml plastic vial before radioactivitymeasurement.
Tritium measurements are made using a Wallac-1414 liquid scintillation countingsystem with Hisafe-3 as the liquid scintillant. The detector consists of two high performancephoto-multiplier tubes coupled on opposite sides of an optical chamber. Photons emitted bythe Hisafe-3 scintillant after excitation by beta particles are captured and amplified by thephoto-multiplier tubes to form electrical pulses, which are stored as beta energy spectrum.
- 13 -
The Wallac protocol “Easy GLP” is used for tracking the system’s performance. Theprotocol performs tests on eight performance parameters and reports their latest results alongwith a full history of each parameter as a means to monitor the stability and reliability of theinstrument. The system is maintained at optimal performance by regularly fine-tuning of thesystem using a series of known activity standards with varying quench.
3.5.3Low level gross beta counting
The activity of another pure beta-emitting radionuclide, strontium-90, is measured usinga low level alpha-beta counting system.
For all ERMP samples except those that are mineral based, strontium is selectivelysegregated by chemical means from other elements in the sample before radiationmeasurement. This involves ashing of the sample, fusing of the ashed sample in alkaline,separation of strontium by ion exchange and purification of strontium by a nitrate process.The strontium is finally precipitated as strontium carbonate on a 60 mm diameter stainlesssteel planchet for radiation measurement. For mineral samples strontium is extracted fromthe matrix using strontium carriers and precipitation as oxalates. The strontium is thenseparated by successive precipitation as nitrates.
Strontium-90 measurement is carried out using a Berthold LB770-2 low level alpha-betacounter. The system consists of 11 gas flow proportional counters (10 measuring countersand one large guard counter mounted above the measuring counters). The counting gas isaged P-10 gas (90% argon, 10% methane).
3.5.4 Alpha spectrometric analysis
Only one alpha-emitting radionuclide, plutonium-239, is monitored in the ERMP.
Plutonium is first extracted from other elements in the sample. An isotope of plutonium,plutonium-242, is used as a tracer to determine the overall efficiency in the chemicaltreatment process and the counting procedure. The whole process involves ashing of thesample, addition of a known amount of plutonium-242 as tracer, acid digestion and hydroxideprecipitation of the mixture, separation of plutonium by ion exchange and finallyelectroplating the plutonium on stainless steel disks before radiation measurement. Thethickness of the sample is minimised so as to avoid self absorption within the sample.
The analysis of plutonium-239 is done on an alpha spectrometry system (EG & G OrtecOCTETE PC), which consists of eight passivated ion-implanted planar silicon (PIPS)detectors (Ortec BU-017-450-100-ULTRA) each housed inside a vacuum chamber. All eightvacuum chambers are connected to an external vacuum pump. The digitised signals of thedetectors are stored as energy spectra in a multi-channel analyser system. The specificactivity of plutonium-239 in the sample is analysed using the Ortec Alphamat alpha spectrumanalysis software.
- 14 -
Chapter 4
Reporting Rationale
4.1 Ambient gamma dose rates
The radiation monitoring network measures and records the average ambient gammadose rate every minute. From these 1-minute data, the daily, monthly and annual meanambient gamma dose rates and the corresponding monthly standard deviations are calculated.These results are presented in this report together with the minimum and maximum 1-minutereadings for each day and each month. Also reported are the annual mean dose rates and thecorresponding two sigma levels calculated from the dose culminated over the period ofexposure as measured by the TLD network.
4.2 Automatic gamma spectrometry system measurements
The ambient gamma dose rates obtained by the automatic gamma spectrometry systemare tabulated in this report in a format similar to those measured by the radiation monitoringnetwork for easy comparison. The daily and monthly mean ambient gamma dose rates arepresented. The minimum and maximum 15-minute readings for each day and each month arealso given.
The artificial alpha activity and the artificial beta activity in the airborne particulate arereported after removal of the contribution from natural radon by means of pseudocoincidenttechnique (Berthold, 1995). The gaseous iodine-131 concentrations in the air are alsopresented. The measurement data are presented only if they are greater than the typicaldetection limit of the system. Those below the typical detection limit is denoted by“< detection limit”.
Nuclide specific gamma spectrometric analyses of the airborne particulate are given inthe report. The radionuclides reported are iodine-131 and caesium-137 together with anyother artificial radionuclides detected.
4.3 Vertical profiles of gamma plus beta and gamma only radiation
The objective of the radioactivity soundings is to monitor the radiation levels at differentaltitudes of the atmosphere. Since the conversion from count rates to dose rates is subject to alarge uncertainty depending on the actual energy spectrum, count rates as measured arereported here. The ratio between the count rates of the gamma plus beta and the gamma onlytubes may be used as an indicator of the presence of contaminants. This ratio is expected to befairly constant for the natural background radiation, but would be different if an artificialradioactivity is present. Increased count rates accompanied by a marked increase in thegamma plus beta to gamma only ratio would give a strong indication of an abnormalradioactivity than that suggested by the increased count rates alone. The ratio between thecount rates of the gamma plus beta and the gamma only tubes is therefore also reported.
The mean gamma plus beta and mean gamma only count rates and their ratio at 100 mintervals from station level up to 3000 m are reported for each ascent. Above 3000 m, they arereported at intervals of 300 m.

- 15 -
4.4 Laboratory analytical measurements
4.4.1 Radionuclides reported
With the exception of potassium-40, which has a natural origin, only artificialradionuclides are reported in this report. While airborne particulate virtually contains nopotassium-40, foodstuff usually contains a substantial amount of potassium-40. With a singlegamma ray energy peak well separated from the peaks of other natural gamma emitters, thedetermination of potassium-40 helps to assure the quality of the gamma spectrometrymeasurement.
Caesium-137 and iodine-131 are two of the major artificial gamma emittingradionuclides representative of the releases from a nuclear power station. As these twonuclides were detectable in the BRMP, their activity concentrations in all ERMP samples arespecifically tabulated in the report. Other artificial gamma emitting radionuclides in allsamples will be reported only when they are detected.
For alpha and beta emitting radionuclides, tritium activity concentration is measured andreported for all samples containing water. Strontium-90 and plutonium-239 activityconcentrations are measured and reported for selected samples only because of the laboriouschemical treatment required. Carbon-14 activity concentration is measured and reported for13 selected types of samples.
4.4.2 Treatment of spectrometric data
All radioactivity data are decay-corrected to the date of sampling except for iodine-131.Where sampling is done over an extended period, decay correction is made to the middle ofthe sampling period. Iodine-131 has a rather short half-life of around eight days, which wouldusually lead to an artificially large activity after decay correction because of the time lapsebetween the measurement date and the sampling date. Thus as a practice no decay correctionis made for iodine-131. All specific radionuclide analyses are reported with a countinguncertainty at the 95% confidence level.
SI units are used throughout the report. Units of activity concentration are referred to theunit weight or unit volume of the raw sample, whichever is appropriate.
In this report, if the radiation level for a counting measurement, except those by liquidscintillation counting, is too low for the signal to be distinguished with statistical confidencefrom the background noise, the estimated minimum detectable activity (MDA), based on thebackground noise, is reported. Activity concentration below the MDA is reported as “< xx”,where xx is the MDA value for that particular measurement.
In liquid scintillation counting, if the output signal from the detector with the sample inplace is weaker than the signal output using a blank sample (i.e. the control measurement),“## Less than detection limit” is reported.
A list of typical “Detection limits” for the various activity measurements under“typical” measurement conditions for the samples used in the ERMP is given in Table 5.These detection limits serve to provide a quick reference for easy interpretation of themeasurement results in this report.
Except for the measurement of tritiated water vapour in the atmosphere, the Curie MDAformulation was used to calculate the detection limits (Currie, 1968). The MDA is calculatedat the 95% confidence level. For the tritiated water vapour sample, the sampling equipment is
- 16 -
efficient only when the tritium concentration in the water vapour exceeds a minimum level,which is specified by the equipment manufacturer. This minimum sampling level is higherthan the value one would obtain by applying the Currie MDA formulation under typicalmeasurement conditions. The limit specified by the sampling equipment is therefore used forthe tritium detection limit for water vapour in Table 5.
All activity concentration measurements and uncertainties are reported in accordancewith one or more of the following conditions:
(a) Uncertainties will be reported to one significant figure.
(b) Activity concentration measurements will be reported to no more than threesignificant figures.
(c) For any measurement result pair, i.e. measured activity concentration with anuncertainty, the smaller of the two results will be reported to one significantfigure. The position of the most significant figure of the smaller will be theposition of the least significant figure of the larger.
(d) Within any given tabulation, measured activity concentrations and uncertaintieswill be reported to the decimal position of the most significant figure of thesmallest uncertainty figure within that tabulation.
4.5 Radiological survey
4.5.1 Aerial survey
Data obtained from the ground contamination measurement mode are analysed by acommercially available software package GEOSOFT. Activity concentration of the naturalradionuclide, potassium-40, will be reported. Any artificial radionuclide detected will also bereported.
Background measurement in the ground contamination measurement mode is beingconducted over various parts of the territory in phase. When the background survey iscompleted, the data will be composited to produce a background map for the whole territoryfor use as reference in emergency operations.
4.5.2 Mobile survey
The ambient gamma dose rates reported are averaged values of 1-minute data over asampling period of 30 minutes. When more than one survey had been conducted in one gridbox in a year, the average of the measurements will be used to represent the terrestrial gammadose rates of that grid box. On the other hand, individual measurement results will be used fordetermining the range of the terrestrial gamma dose rates. As the current survey cycle beganin 2000, the 2002 data have not been adjusted to reflect seasonal variations. A more detailedanalysis of all data acquired in one 5-year survey cycle will be performed in 2004 oncompletion of the cycle.
The cosmic radiation measurements presented in this report have been corrected for thegamma absorbed dose rate due to air and water, contribution from nearby human bodies andthe internal background of the HPIC. The various contributing components are estimated tobe about 0.004 µGy h-1 to the cosmic measurement (Tsui et al., 1991).
- 17 -
The activity concentrations of iodine-131 and caesium-137 in air samples taken at theemergency survey locations are reported if they are greater than their typical detection limits,otherwise “< detection limit” will be reported. The count rates obtained from the surfacecontamination monitor are converted into area activities. The calibration factor for betaemitters is based on the value of strontium-90, which is one of the beta emitting radionuclidesmost frequently encountered in an accident in a nuclear power plant. Iodine-131 andcaesium-137 together with other artificial radionuclides, if detected, from the gammaspectrometric analyses of land soil by PGSAM are reported.
- 18 -
Chapter 5
Quality Assurance
A comprehensive quality assurance programme is of utmost importance in maintainingand improving the reliability of the analyses in environmental monitoring. The quality of theradiation measurements in the Environmental Radiation Monitoring Programme is assuredthrough an internal quality assurance programme and the inter-laboratory comparisonexercises. The Observatory has been participating in the IAEA inter-comparison exercisessince 1989. Samples with similar composition and radionuclide concentrations are preparedand despatched by the IAEA to the participating laboratories for measurement and the resultsare published by the IAEA. The Observatory has also participated in the inter-laboratorycomparison exercises organised by various laboratories in the mainland. The intercomparisonresults made by the King’s Park Radiation Laboratory of the Observatory are mostly withinthe acceptable ranges, and have been presented in the annual reports.
IAEA published in May 2002 the results of a proficiency exercise on the determinationof gamma emitting radionuclides in a mineral matrix conducted in 2001 and early 2002. Asummary of the measurement results reported by the Observatory is given in Table 6. Thevalues reported by the Observatory were in good agreement with the reference values givenby the IAEA.
In 2002, the Observatory participated in the IAEA inter-laboratory comparison exerciseon an Irish Sea Sediment sample (IAEA-385). The result of this exercise will be presented ina future annual report after the comparison result is officially published by the IAEA.
In the past few years IAEA had organized a number of proficiency tests which requiredthe samples to be measured in whole as homogeneity of sub-samples was not guaranteed. Asthe samples were not divided into sub-samples the uncertainty introduced in an “one-off”sample preparation process could not be determined. In order to report the degree ofuncertainty introduced by sample preparation, the Government Laboratory in accordance withthe “Guide to the Expression of Uncertainty in Measurement” (International Organisation forthe Standardisation, 1995) is establishing a set of nominal uncertainties for each techniqueused in preparing samples of food, water and mineral matrices for the measurement of gammaemitting radionuclides, tritium, strontium-90 and plutonium-239. The nominal uncertaintiesassociated with the preparation of samples for measurement of gamma emitters in matricescontained in 1 L and 4 L Marinelli beakers have been determined to be 0.018% and 0.0045%respectively. Determination of nominal uncertainties for other techniques is in progress andwill be reported in future annual reports. In future proficiency tests the nominal uncertaintieswill be reported together with the counting errors.
In order to further monitor the quality of the analyses in the ERMP, re-measurement ofthe reference material IAEA-Soil-6 (Soil), IAEA-152 (Milk Powder) and IAEA-368 (PacificOcean Sediment) were conducted in 2002 as part of the routine quality assurance. The re-measured values, as shown in Table 7, were within IAEA confidence limits.
Significant variations in the level of potassium-40 activity concentration were detectedin a number of aquatic samples. This could be associated with the volume of fresh waterdischarged from the Pearl River mixing with the sea water. Since 2000, simultaneousmeasurements of salinity, pH and potassium-40 activity concentration in ERMP samples ofsea water, fresh seaweed (enteromorpha prolifera), intertidal and seabed sediment have beenconducted to provide better clues to this conjecture. A summary of the salinity and pHmeasurement results, together with the potassium-40 activity concentration, is given in
- 19 -
Table 8 and Figures 19 to 24. Positive correlation between salinity and potassium-40 activityconcentration can be established for sample types with sufficient number of samples collected(Figures 20, 22 and 24). Such measurement will be continued as a routine quality assuranceprocedure to ensure that the radiation measurement is in order.
The HPIC sensors used in the RMN are sent to the manufacturer, Reuter-Stokes, Inc.USA, for calibration once every two years. Calibration is carried out using the shadow outputtechnique with a reference source traceable to the National Institute of Standards andTechnology, USA.
- 20 -
Chapter 6
Summary of Measurement Results
The results of measurements in this report reflect the environmental radiation levels inHong Kong in 2002. The results show that there has been no observable increase in theamount of artificial radionuclides in the environment of Hong Kong. Continuous monitoringof the ambient gamma radiation level in 2002 has shown that it was within normalbackground fluctuation. The measured specific activities of the artificial radionuclides in the377 samples collected in 2002 for atmospheric, terrestrial, and aquatic pathways were allwithin the BRMP ranges.
6.1 Ambient gamma radiation level
The ambient gamma radiation near ground level originates primarily from naturalradioactive materials in the earth and building materials. Gamma radiation resulting from theinteraction of cosmic rays with air molecules is another major constituent. The annual meanambient gamma dose rates recorded by the RMN and the TLD network are given in Figures 2and 3 respectively. The daily mean ambient gamma dose rates recorded by the RMN inJanuary to June and July to December 2002 are shown in Figures 5 and 6 respectively. Thedaily and monthly ambient gamma dose rate values of each station of the RMN are tabulatedin Tables 9 to 21.
The ambient gamma radiation level in Hong Kong in 2002 was within normalbackground fluctuation. The annual levels recorded in 2002 ranged from 0.088 to0.137 µGy h-1. The levels recorded at all stations were about the same as those recorded in2001.
The spatial variation in readings among the stations reflected the differences in thegeological composition of the soil and rocks, as well as the building materials used for thefoundation of the stations. Stations built on granite were exposed to higher gamma dose ratesin comparison with stations on sedimentary rocks. The temporal variation at each station wasmainly due to variation in the meteorological conditions and the physical environmentadjacent to the station.
There was a small seasonal change in the ambient gamma radiation level, with thesummer months generally having lower values and winter months higher ones. In summer,the prevailing wind was from the sea, which was relatively deficit in radon and thorondaughters. A contrary effect occurs during the winter months when a continental airstreamdominates and bring natural radioactive materials from inland to Hong Kong. The morestable atmosphere in winter also helped to trap the natural radioactive materials in a shallowlayer near the ground.
Besides the seasonal variations, the ambient gamma radiation level also varied in ashorter time frame. The latter could be related to the changes in the concentration of radon andthoron daughters over the site. Rain would wash down natural radioactive materials, such asradon and thoron daughters, from the atmosphere and in general, cause the ambient gammadose rate to rise. However, the ambient gamma radiation level would return to the normallevel rather quickly when rain ceased because of the relatively short half-lives of most of thegamma emitting nuclides of the radon and thoron daughters. In the event of a tropical cyclone,the relationship of the ambient gamma dose rates with winds and rain is even more complex.Such effects were observed in the past years and documented in previous annual reports.Since the operation of the RMN, the typical changes in the radiation levels have been in the
- 21 -
range from a few percent in seasonal variations, to about 40% in heavy rain and to about 100%in cases involving tropical cyclones affecting Hong Kong. However, the extreme in the lattersituation can be as much as 180% as recorded in 2001 during the passage of Typhoon Chebion 23 June 2001.
Table 22 tabulates the three occasions with the most significant rises in ambient gammadose rates in 2002. The first occasion was associated with heavy rain on 27 January 2002.The other two occasions were associated with the passage of tropical cyclones over HongKong.
Of the three occasions, Severe Tropical Storm Hagupit brought the highest rise in theradiation levels. Hagupit developed into a tropical depression on 10 September 2002 to thesoutheast of Dongsha Dao over the northern part of the South China Sea (Figure 7). It thentracked steadily west-northwestwards towards the coast of Guangdong and intensified rapidlyinto a severe tropical storm on 11 September 2002 with maximum winds near its centrereaching 110 km/h. Hagupit was closest to Hong Kong on the afternoon of11 September 2002. Heavy rain and thunderstorms associated with its rainbands affectedHong Kong from 10 to 11 September 2002. The rain then gradually subsided as Hagupitmoved away from Hong Kong. It made landfall near Yangjiang of western Guangdong on theearly morning of 12 September 2002 and weakened into an area of low pressure overGuangxi. This area of low pressure then drifted back towards the east and brought heavy rainand thunderstorms to Hong Kong from 15 to 17 September 2002. During the passage ofHagupit, the maximum rise in ambient gamma dose rates recorded by the RMN ranged from24% (at Tsim Bei Tsui) to 70% (at Ping Chau) above their normal background levels due tothe heavy rainfall associated with the storm. The ambient gamma dose rates recorded by theRMN and the rainfall amount recorded by their respective nearby rain gauges from10 to 17 September 2002 are shown in Figure 8.
6.2 Radiological survey
In 2002, background measurements using the AMS in the ground contaminationmeasurement mode were conducted over Sai Kung and the Soko Islands. No artificialradionuclides were detected. Figures 9 and 10 show the ground level activity concentrationsof potassium-40 over Sai Kung and the Soko Islands respectively. The data were obtainedwith the AMS flying at an altitude of 100 m above ground level. It is observed that theactivity concentration of potassium-40 is much higher over land, up to above 200 Bq kg-1,than over water where it is relatively constant at around 50 Bq kg-1.
Spiral climb flights in the plume tracking mode of operation from about 150 m up toabout 1 000 m above sea level were carried out at both Tuen Mun and Mirs Bay on 4 Jan 2002and 4 September 2002. The weather conditions during the flights on both days were verysimilar – fine weather with light to moderate easterlies. The results of the spiral climbs on4 January 2002 were comparable to those on 4 September 2002. Vertical profiles over MirsBay (Figure 11) show that there was little variation in the count rate with altitude over the seaon these two days. Vertical profiles over Tuen Mun (Figure 12) show that the count ratedecreased rapidly with altitude between 200 to 500 m as the terrestrial contribution decreasedwith height before reaching a count rate similar to those measured over the sea.
Four measurements of the cosmic radiation were carried out at Plover Cove in 2002.Results of the cosmic radiation measurements in 2002, ranging from 0.029 µGy h-1 to0.031 µGy h-1 with an average of 0.030 µGy h-1, are listed in Table 23. In addition to thecosmic radiation measurements, 54 and 86 measurements of the environmental gamma doserates were conducted in 42 grid boxes for open fields and 61 grid boxes for built-up areas

- 22 -
respectively. These results are summarized in Figures 13 and 14. After deduction of thecosmic contribution, the terrestrial environmental gamma dose rate in open fields ranged from0.047 µGy h-1 to 0.140 µGy h-1 with an average of 0.096 µGy h-1. This compared well with theRMN data. The dose rate in built-up areas ranged from 0.120 to 0.246 µGy h-1 with anaverage of 0.178 µGy h-1. The ratio of environmental gamma dose rate in built-up areas tothat in open fields was 1.85.
Mobile survey was also conducted at the following nine designated emergency surveysites: Hoi Ha, Wu Kau Tang, Wo Hop Shek, Luk Keng, Tai Mong Tsai, Sham Shui Po, Tai Po,Tseung Kwan O and Shatin South. The measurements for these surveys, namely the ambientgamma dose rates, the surface activity concentrations of beta emitters, the iodine-131 andcaesium-137 concentrations in airborne particulate, the gaseous iodine-131 concentration inradioiodine cartridge and the iodine-131 and caesium-137 concentrations of in-situ gammameasurement using the PGSAM, are summarised in Table 24. No artificial radionuclide,apart from caesium-137 in land soil at Tai Mong Tsai, was detected. For the caesium-137detected, the specific activity, 1.4 ± 0.8 Bq kg-1, was within the range of the specific activity ofcaesium-137 in land soil samples collected in the BRMP.
6.3 Automatic Gamma Spectrometry System
The ambient gamma dose rates, artificial alpha concentration, artificial betaconcentration, iodine-131 and caesium-137 concentration in airborne particulate and thegaseous iodine-131 concentration obtained by the automatic gamma spectrometry systemsystem are tabulated in Tables 25 to 36. No man-made radionuclides have been detected.
The ambient gamma dose rates recorded by the automatic gamma spectrometry systemwere found to be highly correlated with the readings obtained by the RMN station at PingChau (Figure 15). The differences between the two were largely due to the two sensors beinginstalled at two different locations even though nearby.
6.4 Radioactivity sounding
Three radioactivity soundings were made in 2002. The weather conditions during thesesoundings were: cloudy with moderate easterly winds on 6 June 2002, cloudy with lightnortheasterly winds on 16 August 2002 and cloudy with light north-northeasterly winds on6 October 2002. The mean gamma only and mean gamma plus beta count rates for thesesoundings are shown in Tables 37 to 39. The vertical profiles of the readings taken at 2-second interval and the mean gamma plus beta to gamma only ratio are also plotted in Figures16 to 18.
Cosmic rays produce secondary, low energy neutrons by nuclear reactions withatmospheric gases, which in turn produce most of the natural radionuclides in the atmosphere.The rate of production of these radionuclides is a function of two opposing factors: theincrease of secondary low energy neutron flux with altitude and the decrease of the air densitywith height. A maximum concentration of these radionuclides was found in the upperatmosphere near the tropopause. This maximum manifested itself in all three soundings inwhich both the gamma only and the gamma plus beta count rates increased with heightsteadily from the surface, reaching a maximum at around 15 to 17 km.
The larger fluctuation observed in the mean gamma plus beta to gamma only ratio atlow levels was largely due to the higher measurement uncertainty at low count rates and to acertain extent the smaller number of data in each chosen vertical interval at these low levels.

- 23 -
6.5 Environmental samples
The measurement results of the environmental samples collected in 2002 are tabulatedin Tables 40 to 62. Tables 40 to 46 summarise the gamma spectrometry measurement resultsof the samples. Beta measurement results of tritium and strontium-90 in samples are given inTables 47 to 50 and Tables 51 to 56 respectively. The results of the plutonium-239measurements are given in Tables 57 to 61. The carbon-14 concentrations are tabulated inTable 62. A comparison of the specific activity of the artificial radionuclides in theenvironmental samples collected in 2002 against those collected in the BRMP is given inTable 65.
6.5.1 Gamma emitters
No artificial gamma emitting radionuclide, apart from caesium-137, was detected inenvironmental samples. Caesium-137 was found in a marine fish (trichiurus haumela)sample, three rice samples, seven land soil samples, all seabed sediment samples and in allintertidal sediment samples. The concentrations of caesium-137 in these samples were withinthe range of the corresponding values obtained in the BRMP.
As caesium-134, a radioisotope of caesium with a much shorter half-life of 2.062 years,is produced together with caesium-137 (half-life about 30.17 years) during fission reaction, itsabsence from all samples led to the conclusion that the source of caesium-137 in the sampleswas not from the GNPS and LNPS. The origin for the caesium-137 detected in these samplesis most probably from the fall-out of the nuclear weapons tests in the 1960s and to a lesserextent from the Chernobyl accident in 1986.
Depending on the sediment composition and the tidal current characteristics, differentintertidal sediments have dissimilar nuclide retention capabilities. The radioactive caesiumcontents in the intertidal sediment collected at Tsim Bei Tsui were generally higher than thatat Sha Tau Kok and Pak Sha Wan, while the radioactive potassium content of the sediment atTsim Bei Tsui was relatively lower than that of the other two locations. This is consistentwith the findings of the BRMP.
The salinity values for the intertidal sediment collected at Tsim Bei Tsui weresignificantly lower than that at Pak Sha Wan and Sha Tau Kok. The potassium-40 activityconcentration of the sediment obtained at Tsim Bei Tsui was also lower than those of the othertwo locations, as shown in Table 8 and Figure 19. This could very well be associated with thevolume of fresh water discharged from the Pearl River mixing with the sea water. Aspotassium chloride is a major component of sea water it is observed that a correlation existedbetween salinity and potassium-40 activity concentration in the intertidal sediment samples(Figure 20). Both the salinity values and potassium-40 concentrations for the sea watersamples collected at upper level were generally lower than that at the middle and lower levels,as shown in Table 8 and Figure 21. A weaker correlation between salinity and potassium-40concentration was observed in sea water and seabed sediment samples (Figures 22 and 24).As only two fresh seaweed enteromorpha prolifera samples have been collected since 2000,the correlation between the salinity and potassium-40 in this sample could not be established.For all samples analysed, no correlation between the pH values and potassium-40concentration was observed.
- 24 -
6.5.2 Beta emitters
The specific activity of tritium in the environmental samples was measured to be withinthe background fluctuations obtained in the BRMP. As the specific activity of tritium in thesamples collected was very low, the uncertainties in the measurement were correspondinglylarge. The amounts of tritium in individual samples mainly depended on the water content ofthe samples, and could differ from one to two orders of magnitude for samples of the sametype.
Unlike tritium, the absorption and retention capabilities for metallic elements werefound to be rather dissimilar for different organisms. The specific activity of strontium-90was found to be relatively higher in leafy vegetables and seaweed than in other food sampletypes. The specific activity of strontium-90 in the environmental samples collected in 2002was measured to be within the background fluctuations obtained in the BRMP.
In 1999, the results of strontium-90 measurements for the land soil samples collected inthe second round of sampling between 1994 and 1996 could not meet the requirements ofquality control (Hong Kong Observatory, 2000). Based on advice from IAEA, theGovernment Laboratory revised the chemical preparation procedure to mitigate interferenceof alkaline earth metals. The procedure was validated using the reference material IAEA-375(Soil) (Hong Kong Observatory, 2001). Re-measurement of the land soil samples collectedbetween 1994 and 1996 and prepared using the revised chemical separation procedurecontinued in 2002 and the results are shown in Table 63. The measured values were within theBRMP range.
The concentrations of carbon-14 measured in the 13 samples were within the range ofvalues in the BRMP. The measurement results are listed and compared with those of theprevious years in Table 64.
6.5.3Alpha emitter
In 2002, traces of plutonium-239 had been identified in seaweed, sediment and land soilsamples. The activity concentrations of plutonium-239 in the seaweed and sediment sampleswere within the background ranges obtained in the BRMP. For land soil samples, due to thelaborious chemical preparation procedures and the time constraint to complete the BRMPbefore the commissioning of the reactors at GNPS, of the 39 land soil samples only 14 and 11measurements were conducted for the upper and lower layers respectively. Furthermore,some of the sampling sites in the ERMP were relocated due to changes in land use and/ordevelopment. These made a direct comparison between the BRMP and ERMP measurementsdifficult. The BRMP values for land soil in Table 65 are given for reference only.
6.5.4Conclusions
The activity concentrations of all artificial radionuclides in the samples collected in2002 were within the corresponding base-line values obtained in the BRMP.
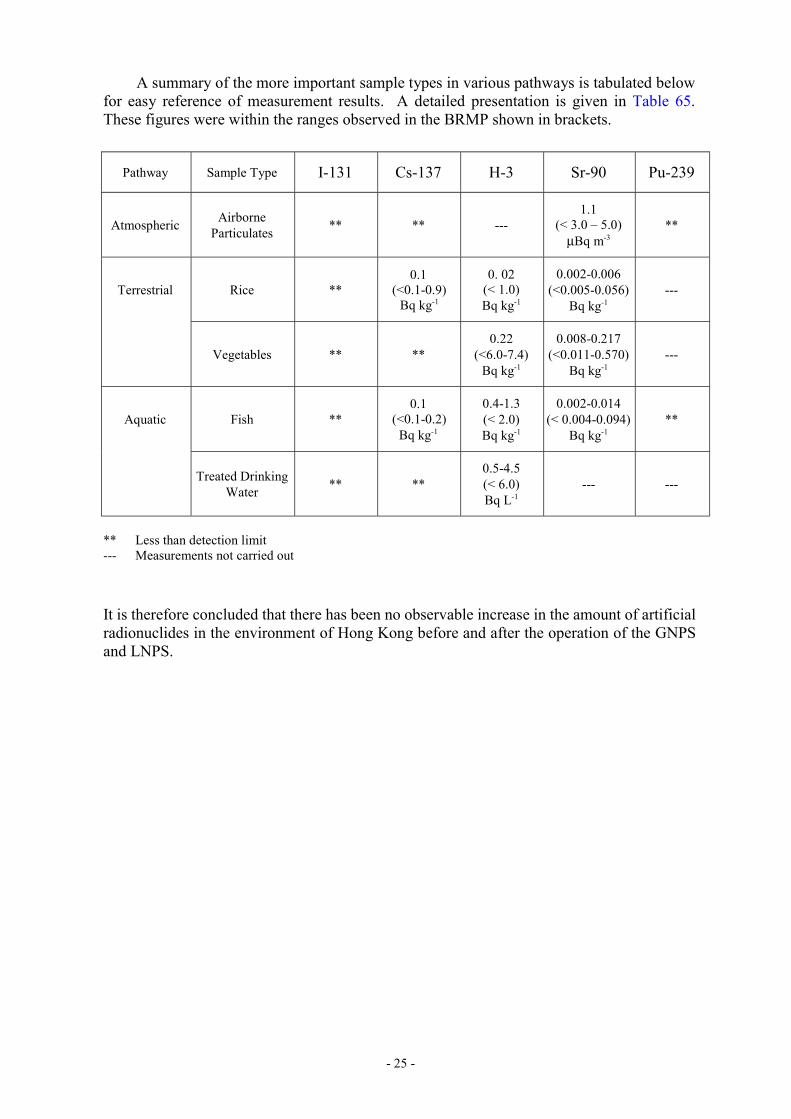
- 25 -
A summary of the more important sample types in various pathways is tabulated belowfor easy reference of measurement results. A detailed presentation is given in Table 65.These figures were within the ranges observed in the BRMP shown in brackets.
Pathway Sample Type I-131 Cs-137 H-3 Sr-90 Pu-239
Atmospheric AirborneParticulates ** ** ---
1.1(< 3.0 – 5.0)
µBq m-3**
Terrestrial Rice **0.1
(<0.1-0.9)Bq kg-1
0. 02(< 1.0)Bq kg-1
0.002-0.006(<0.005-0.056)
Bq kg-1---
Vegetables ** **0.22
(<6.0-7.4)Bq kg-1
0.008-0.217(<0.011-0.570)
Bq kg-1---
Aquatic Fish **0.1
(<0.1-0.2)Bq kg-1
0.4-1.3(< 2.0)Bq kg-1
0.002-0.014(< 0.004-0.094)
Bq kg-1**
Treated DrinkingWater ** **
0.5-4.5(< 6.0)Bq L-1
--- ---
** Less than detection limit--- Measurements not carried out
It is therefore concluded that there has been no observable increase in the amount of artificialradionuclides in the environment of Hong Kong before and after the operation of the GNPSand LNPS.
- 26 -
References
1. Berthold Technologies GmbH & Co. KG, Automatic Gamma Spectrometry SystemOperational Manual, Version 1, November 1995.
2. Currie, L.A., Limits for Qualitative Detection and Quantitative Determination, Anal.Chem. 40, 586-93, March 1968.
3. Hong Kong Observatory*, Radioactivity Bulletin (monthly, 1965-80), 1965-1980.
4. Hong Kong Observatory*, Radioactivity Bulletin (Beta Activity) (1973-80), 1983a.
5. Hong Kong Observatory*, Radioactivity Bulletin (Gamma Activity) (1965-80),1983b.
6. Hong Kong Observatory*, Radioactivity Bulletin (yearly, 1981-83), 1983-84.
7. Hong Kong Observatory*, Environmental Radiation Monitoring in Hong Kong:Background Radiation Monitoring Programme 1987 - 1991, 1992.
8. Hong Kong Observatory*, Environmental Radiation Monitoring in Hong Kong:Radioactivity Bulletin 1992, 1994.
9. Hong Kong Observatory*, Environmental Radiation Monitoring in Hong Kong:Radioactivity Bulletin 1993, 1994.
10. Hong Kong Observatory*, Environmental Radiation Monitoring in Hong Kong:Radioactivity Bulletin 1994, 1995.
11. Hong Kong Observatory*, Environmental Radiation Monitoring in Hong Kong:Annual Report 1995, 1996.
12. Hong Kong Observatory*, Environmental Radiation Monitoring in Hong Kong:Annual Report 1996, 1997.
13. Hong Kong Observatory, Environmental Radiation Monitoring in Hong Kong:Annual Report 1997, 1998.
14. Hong Kong Observatory, Environmental Radiation Monitoring in Hong Kong:Annual Report 1998, 1999.
15. Hong Kong Observatory, Environmental Radiation Monitoring in Hong Kong:Annual Report 1999, 2000.
16. Hong Kong Observatory, Environmental Radiation Monitoring in Hong Kong:Annual Report 2000, 2001.
17. Hong Kong Observatory, Environmental Radiation Monitoring in Hong Kong:Annual Report 2001, 2002.
18. International Organisation for the Standardisation, Guide to the Expression ofUncertainty in Measurement, Geneva, 1995.

- 27 -
19. Tsui, K.C., Wong, M.C., Lee, B.Y., Field estimation of cosmic contribution to totalexternal gamma radiation in Hong Kong Environmental Monitoring, TechnicalReport No.4, Hong Kong Observatory, 1991.
20. Wong, M.C., Chan, Y.K., Poon, H.T., Leung, W.M., Mok, H.Y., So, C.K.,Environmental Gamma Absorbed Dose Rate in Air in Hong Kong 1999, TechnicalReport No.17. Hong Kong Observatory, 1999.
* The Hong Kong Observatory was listed as “Royal Observatory Hong Kong” inpublications released before 1 July 1997.
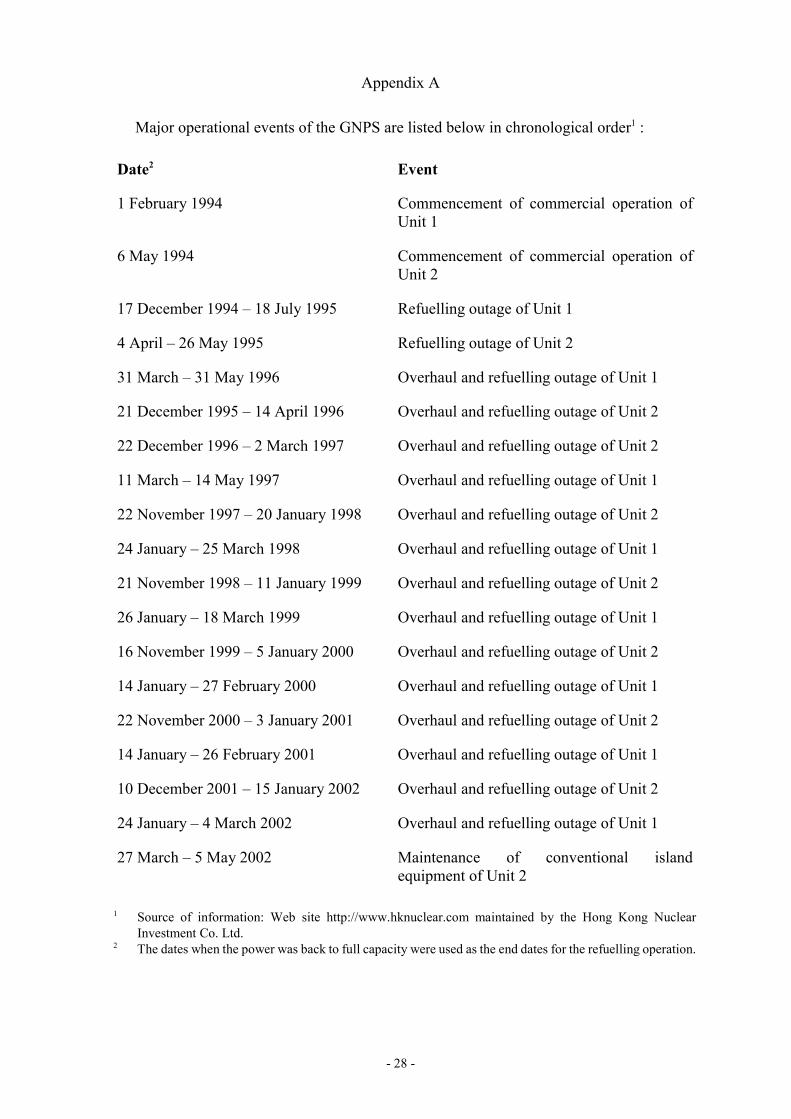
- 28 -
Appendix A
Major operational events of the GNPS are listed below in chronological order1 :
Date2 Event
1 February 1994 Commencement of commercial operation ofUnit 1
6 May 1994 Commencement of commercial operation ofUnit 2
17 December 1994 – 18 July 1995 Refuelling outage of Unit 1
4 April – 26 May 1995 Refuelling outage of Unit 2
31 March – 31 May 1996 Overhaul and refuelling outage of Unit 1
21 December 1995 – 14 April 1996 Overhaul and refuelling outage of Unit 2
22 December 1996 – 2 March 1997 Overhaul and refuelling outage of Unit 2
11 March – 14 May 1997 Overhaul and refuelling outage of Unit 1
22 November 1997 – 20 January 1998 Overhaul and refuelling outage of Unit 2
24 January – 25 March 1998 Overhaul and refuelling outage of Unit 1
21 November 1998 – 11 January 1999 Overhaul and refuelling outage of Unit 2
26 January – 18 March 1999 Overhaul and refuelling outage of Unit 1
16 November 1999 – 5 January 2000 Overhaul and refuelling outage of Unit 2
14 January – 27 February 2000 Overhaul and refuelling outage of Unit 1
22 November 2000 – 3 January 2001 Overhaul and refuelling outage of Unit 2
14 January – 26 February 2001 Overhaul and refuelling outage of Unit 1
10 December 2001 – 15 January 2002 Overhaul and refuelling outage of Unit 2
24 January – 4 March 2002 Overhaul and refuelling outage of Unit 1
27 March – 5 May 2002 Maintenance of conventional islandequipment of Unit 2
1 Source of information: Web site http://www.hknuclear.com maintained by the Hong Kong NuclearInvestment Co. Ltd.
2 The dates when the power was back to full capacity were used as the end dates for the refuelling operation.
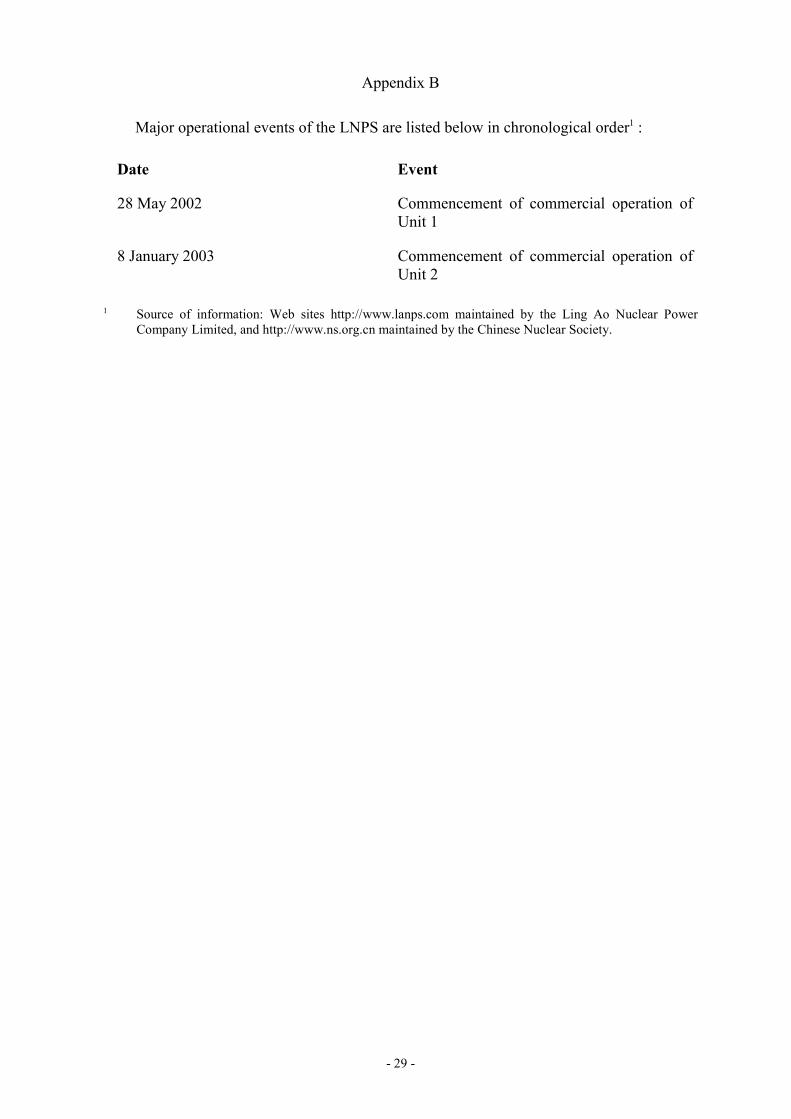
- 29 -
Appendix B
Major operational events of the LNPS are listed below in chronological order1 :
Date Event
28 May 2002 Commencement of commercial operation ofUnit 1
8 January 2003 Commencement of commercial operation ofUnit 2
1 Source of information: Web sites http://www.lanps.com maintained by the Ling Ao Nuclear PowerCompany Limited, and http://www.ns.org.cn maintained by the Chinese Nuclear Society.
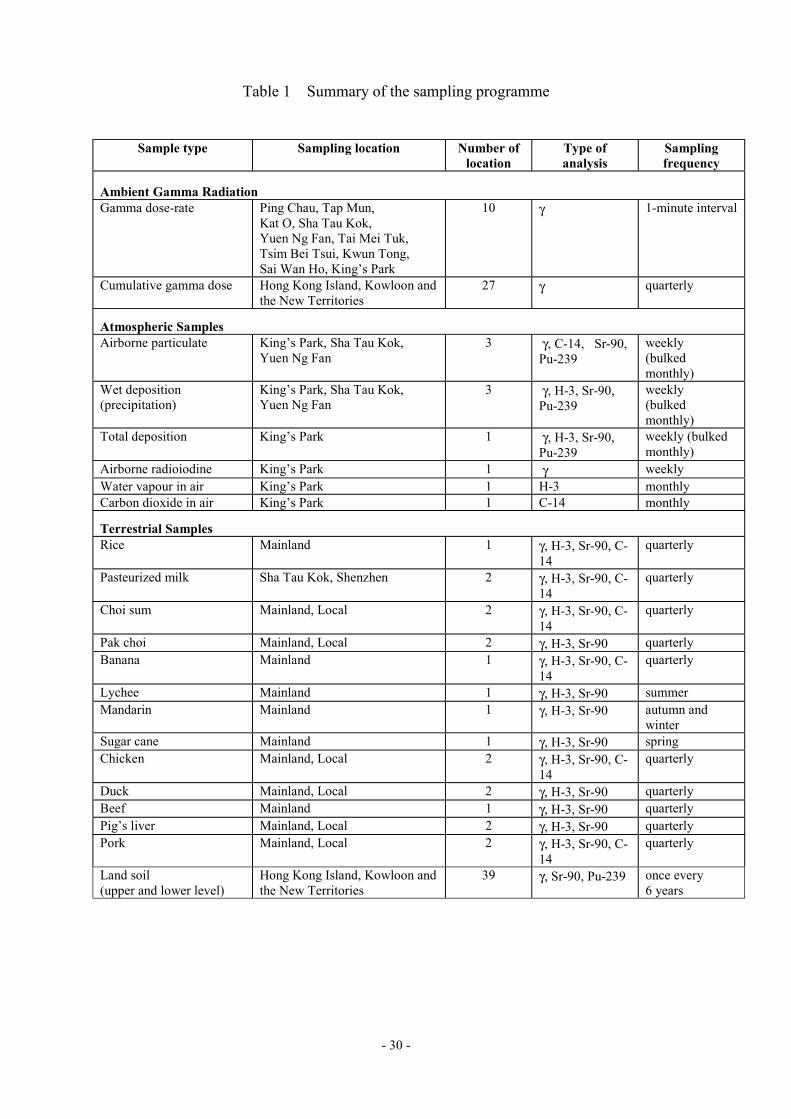
- 30 -
Table 1 Summary of the sampling programme
Sample type Sampling location Number oflocation
Type ofanalysis
Samplingfrequency
Ambient Gamma RadiationGamma dose-rate Ping Chau, Tap Mun,
Kat O, Sha Tau Kok,Yuen Ng Fan, Tai Mei Tuk,Tsim Bei Tsui, Kwun Tong,Sai Wan Ho, King’s Park
10 γ 1-minute interval
Cumulative gamma dose Hong Kong Island, Kowloon andthe New Territories
27 γ quarterly
Atmospheric SamplesAirborne particulate King’s Park, Sha Tau Kok,
Yuen Ng Fan3 γ, C-14, Sr-90,
Pu-239weekly(bulkedmonthly)
Wet deposition(precipitation)
King’s Park, Sha Tau Kok,Yuen Ng Fan
3 γ, H-3, Sr-90,Pu-239
weekly(bulkedmonthly)
Total deposition King’s Park 1 γ, H-3, Sr-90,Pu-239
weekly (bulkedmonthly)
Airborne radioiodine King’s Park 1 γ weeklyWater vapour in air King’s Park 1 H-3 monthlyCarbon dioxide in air King’s Park 1 C-14 monthly
Terrestrial SamplesRice Mainland 1 γ, H-3, Sr-90, C-
14quarterly
Pasteurized milk Sha Tau Kok, Shenzhen 2 γ, H-3, Sr-90, C-14
quarterly
Choi sum Mainland, Local 2 γ, H-3, Sr-90, C-14
quarterly
Pak choi Mainland, Local 2 γ, H-3, Sr-90 quarterlyBanana Mainland 1 γ, H-3, Sr-90, C-
14quarterly
Lychee Mainland 1 γ, H-3, Sr-90 summerMandarin Mainland 1 γ, H-3, Sr-90 autumn and
winterSugar cane Mainland 1 γ, H-3, Sr-90 springChicken Mainland, Local 2 γ, H-3, Sr-90, C-
14quarterly
Duck Mainland, Local 2 γ, H-3, Sr-90 quarterlyBeef Mainland 1 γ, H-3, Sr-90 quarterlyPig’s liver Mainland, Local 2 γ, H-3, Sr-90 quarterlyPork Mainland, Local 2 γ, H-3, Sr-90, C-
14quarterly
Land soil(upper and lower level)
Hong Kong Island, Kowloon andthe New Territories
39 γ, Sr-90, Pu-239 once every6 years
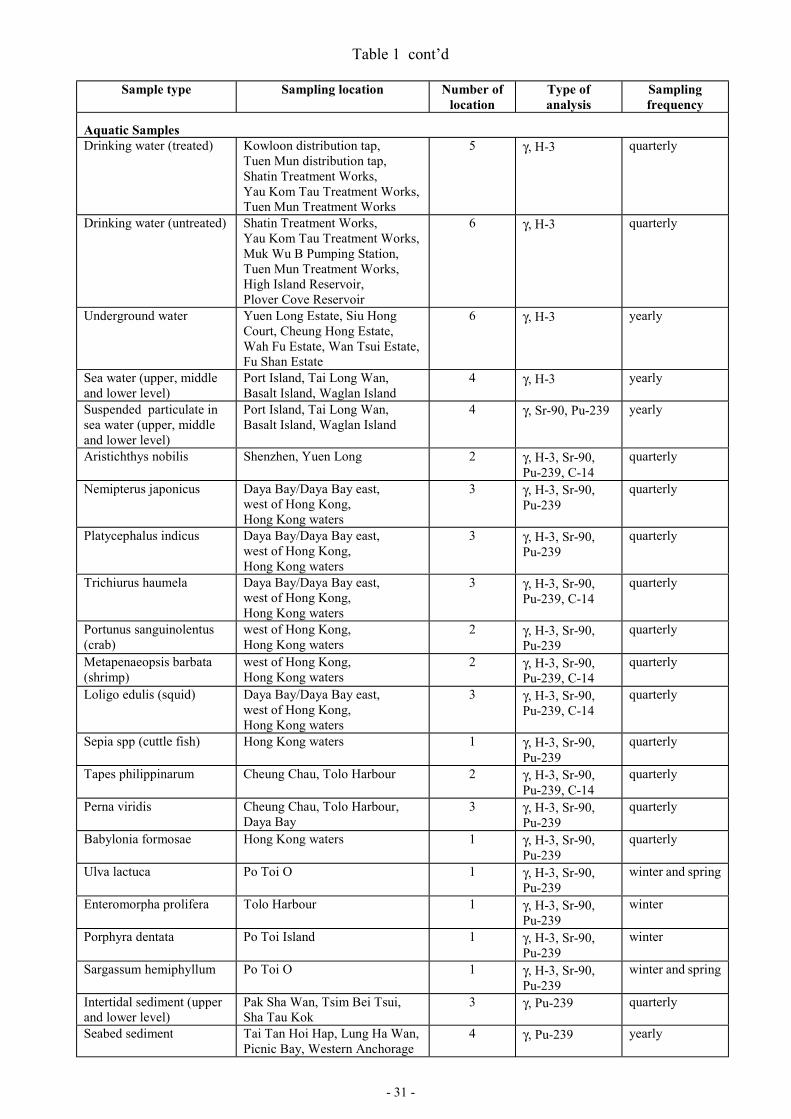
- 31 -
Table 1 cont’d
Sample type Sampling location Number oflocation
Type ofanalysis
Samplingfrequency
Aquatic SamplesDrinking water (treated) Kowloon distribution tap,
Tuen Mun distribution tap,Shatin Treatment Works,Yau Kom Tau Treatment Works,Tuen Mun Treatment Works
5 γ, H-3 quarterly
Drinking water (untreated) Shatin Treatment Works,Yau Kom Tau Treatment Works,Muk Wu B Pumping Station,Tuen Mun Treatment Works,High Island Reservoir,Plover Cove Reservoir
6 γ, H-3 quarterly
Underground water Yuen Long Estate, Siu HongCourt, Cheung Hong Estate,Wah Fu Estate, Wan Tsui Estate,Fu Shan Estate
6 γ, H-3 yearly
Sea water (upper, middleand lower level)
Port Island, Tai Long Wan,Basalt Island, Waglan Island
4 γ, H-3 yearly
Suspended particulate insea water (upper, middleand lower level)
Port Island, Tai Long Wan,Basalt Island, Waglan Island
4 γ, Sr-90, Pu-239 yearly
Aristichthys nobilis Shenzhen, Yuen Long 2 γ, H-3, Sr-90,Pu-239, C-14
quarterly
Nemipterus japonicus Daya Bay/Daya Bay east,west of Hong Kong,Hong Kong waters
3 γ, H-3, Sr-90,Pu-239
quarterly
Platycephalus indicus Daya Bay/Daya Bay east,west of Hong Kong,Hong Kong waters
3 γ, H-3, Sr-90,Pu-239
quarterly
Trichiurus haumela Daya Bay/Daya Bay east,west of Hong Kong,Hong Kong waters
3 γ, H-3, Sr-90,Pu-239, C-14
quarterly
Portunus sanguinolentus(crab)
west of Hong Kong,Hong Kong waters
2 γ, H-3, Sr-90,Pu-239
quarterly
Metapenaeopsis barbata(shrimp)
west of Hong Kong,Hong Kong waters
2 γ, H-3, Sr-90,Pu-239, C-14
quarterly
Loligo edulis (squid) Daya Bay/Daya Bay east,west of Hong Kong,Hong Kong waters
3 γ, H-3, Sr-90,Pu-239, C-14
quarterly
Sepia spp (cuttle fish) Hong Kong waters 1 γ, H-3, Sr-90,Pu-239
quarterly
Tapes philippinarum Cheung Chau, Tolo Harbour 2 γ, H-3, Sr-90,Pu-239, C-14
quarterly
Perna viridis Cheung Chau, Tolo Harbour,Daya Bay
3 γ, H-3, Sr-90,Pu-239
quarterly
Babylonia formosae Hong Kong waters 1 γ, H-3, Sr-90,Pu-239
quarterly
Ulva lactuca Po Toi O 1 γ, H-3, Sr-90,Pu-239
winter and spring
Enteromorpha prolifera Tolo Harbour 1 γ, H-3, Sr-90,Pu-239
winter
Porphyra dentata Po Toi Island 1 γ, H-3, Sr-90,Pu-239
winter
Sargassum hemiphyllum Po Toi O 1 γ, H-3, Sr-90,Pu-239
winter and spring
Intertidal sediment (upperand lower level)
Pak Sha Wan, Tsim Bei Tsui,Sha Tau Kok
3 γ, Pu-239 quarterly
Seabed sediment Tai Tan Hoi Hap, Lung Ha Wan,Picnic Bay, Western Anchorage
4 γ, Pu-239 yearly
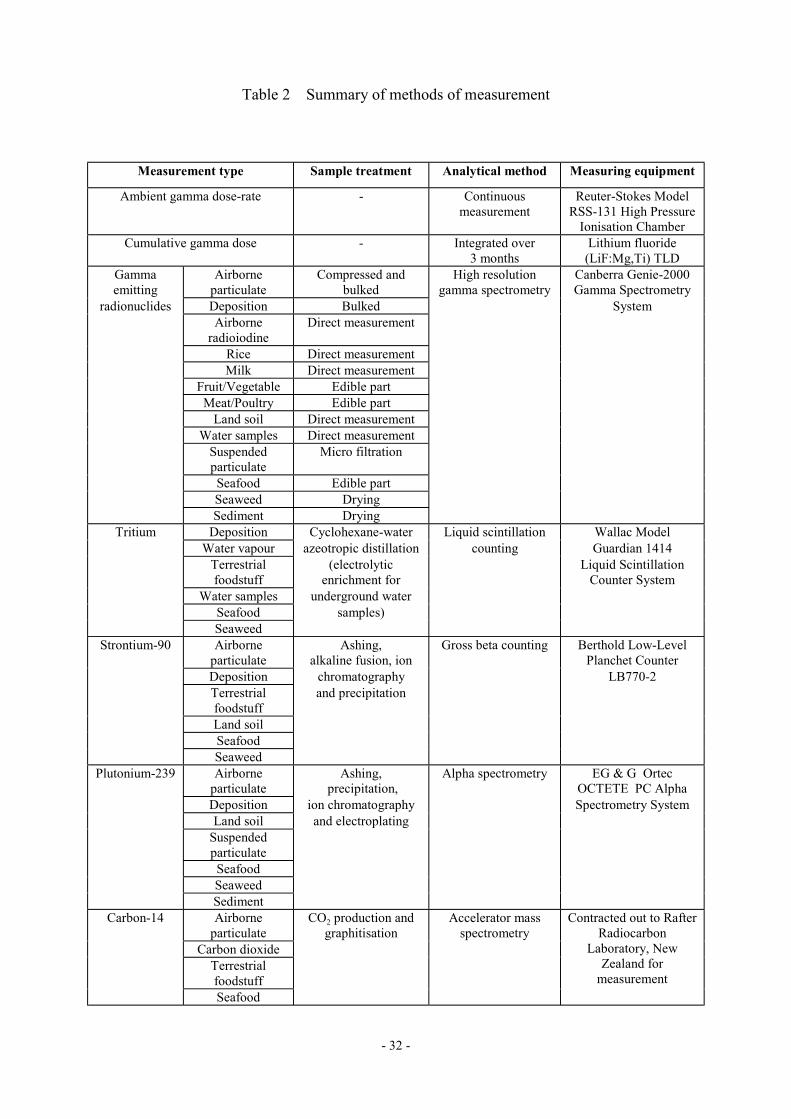
- 32 -
Table 2 Summary of methods of measurement
Measurement type Sample treatment Analytical method Measuring equipment
Ambient gamma dose-rate - Continuousmeasurement
Reuter-Stokes ModelRSS-131 High Pressure
Ionisation ChamberCumulative gamma dose - Integrated over
3 monthsLithium fluoride(LiF:Mg,Ti) TLD
Gammaemitting
Airborneparticulate
Compressed andbulked
High resolutiongamma spectrometry
Canberra Genie-2000Gamma Spectrometry
radionuclides Deposition Bulked SystemAirborne
radioiodineDirect measurement
Rice Direct measurementMilk Direct measurement
Fruit/Vegetable Edible partMeat/Poultry Edible part
Land soil Direct measurementWater samples Direct measurement
Suspendedparticulate
Micro filtration
Seafood Edible partSeaweed DryingSediment Drying
Tritium Deposition Cyclohexane-water Liquid scintillation Wallac ModelWater vapour azeotropic distillation counting Guardian 1414
Terrestrialfoodstuff
(electrolyticenrichment for
Liquid ScintillationCounter System
Water samples underground waterSeafood samples)Seaweed
Strontium-90 Airborneparticulate
Ashing,alkaline fusion, ion
Gross beta counting Berthold Low-LevelPlanchet Counter
Deposition chromatography LB770-2Terrestrialfoodstuff
and precipitation
Land soilSeafoodSeaweed
Plutonium-239 Airborneparticulate
Ashing, precipitation,
Alpha spectrometry EG & G OrtecOCTETE PC Alpha
Deposition ion chromatography Spectrometry SystemLand soil and electroplating
SuspendedparticulateSeafoodSeaweedSediment
Carbon-14 Airborneparticulate
CO2 production andgraphitisation
Accelerator massspectrometry
Carbon dioxideTerrestrialfoodstuffSeafood
Contracted out to RafterRadiocarbon
Laboratory, NewZealand for
measurement
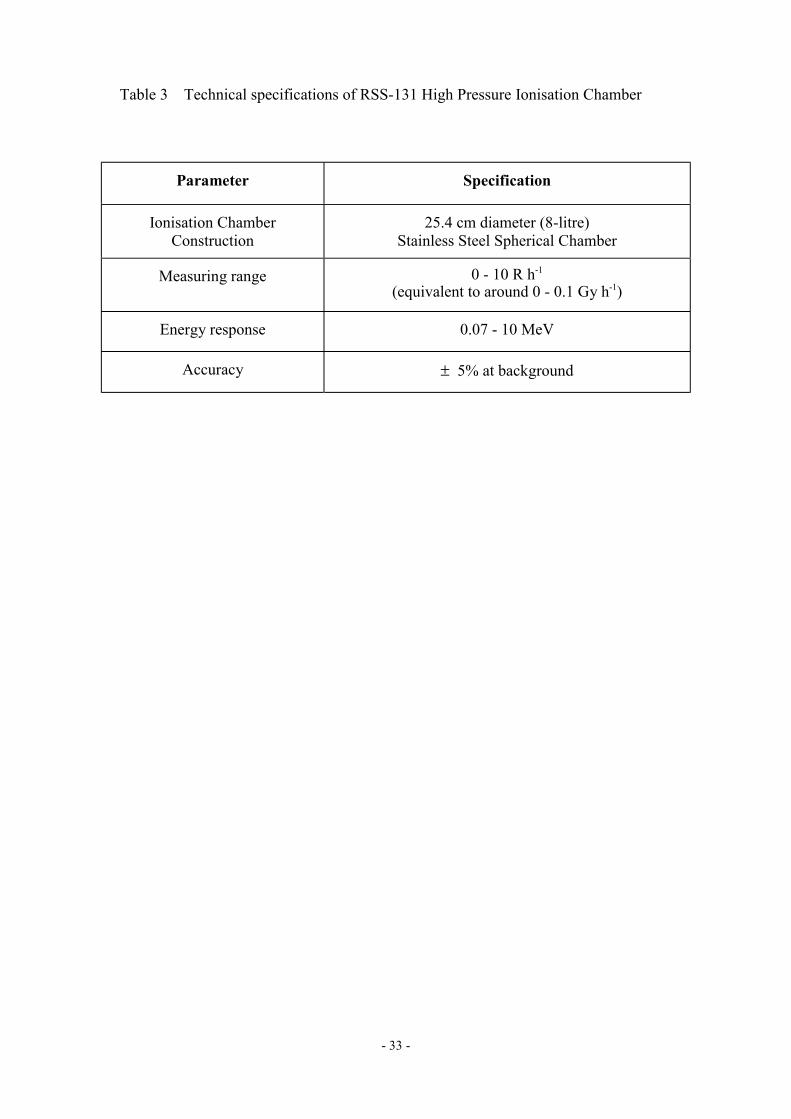
- 33 -
Table 3 Technical specifications of RSS-131 High Pressure Ionisation Chamber
Parameter Specification
Ionisation ChamberConstruction
25.4 cm diameter (8-litre)Stainless Steel Spherical Chamber
Measuring range 0 - 10 R h-1
(equivalent to around 0 - 0.1 Gy h-1)
Energy response 0.07 - 10 MeV
Accuracy ± 5% at background
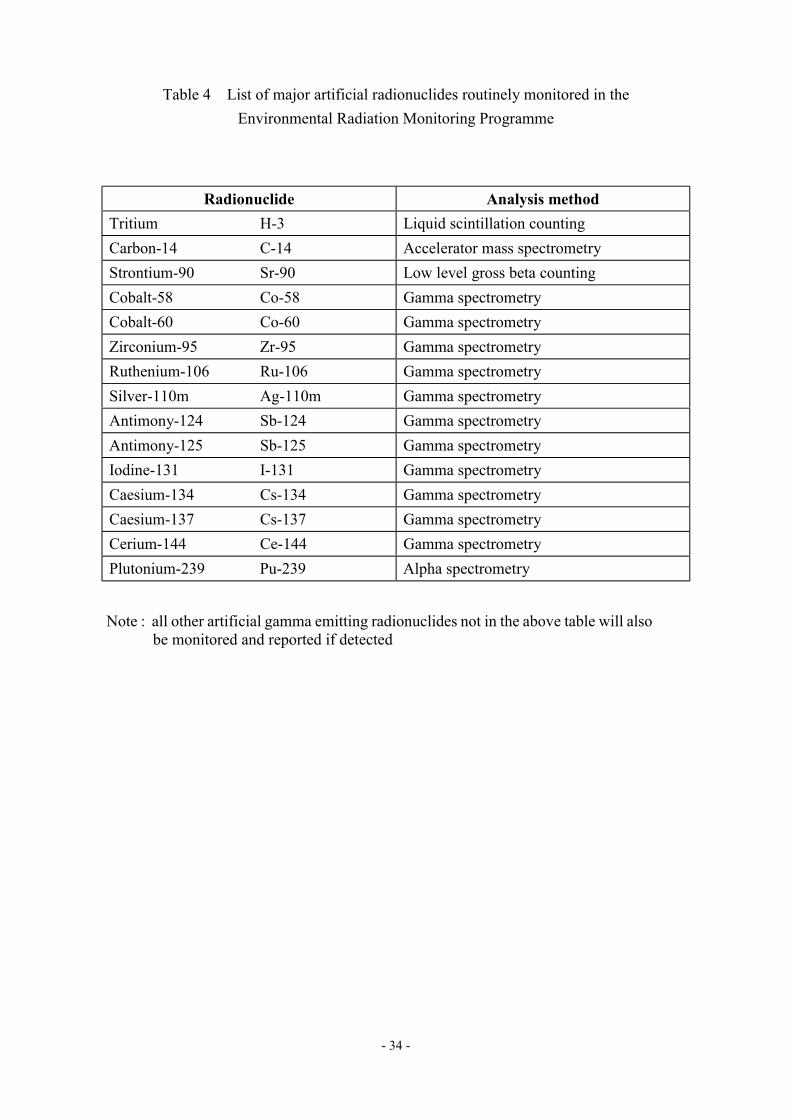
- 34 -
Table 4 List of major artificial radionuclides routinely monitored in theEnvironmental Radiation Monitoring Programme
Radionuclide Analysis methodTritium H-3 Liquid scintillation countingCarbon-14 C-14 Accelerator mass spectrometryStrontium-90 Sr-90 Low level gross beta countingCobalt-58 Co-58 Gamma spectrometryCobalt-60 Co-60 Gamma spectrometryZirconium-95 Zr-95 Gamma spectrometryRuthenium-106 Ru-106 Gamma spectrometrySilver-110m Ag-110m Gamma spectrometryAntimony-124 Sb-124 Gamma spectrometryAntimony-125 Sb-125 Gamma spectrometryIodine-131 I-131 Gamma spectrometryCaesium-134 Cs-134 Gamma spectrometryCaesium-137 Cs-137 Gamma spectrometryCerium-144 Ce-144 Gamma spectrometryPlutonium-239 Pu-239 Alpha spectrometry
Note : all other artificial gamma emitting radionuclides not in the above table will alsobe monitored and reported if detected
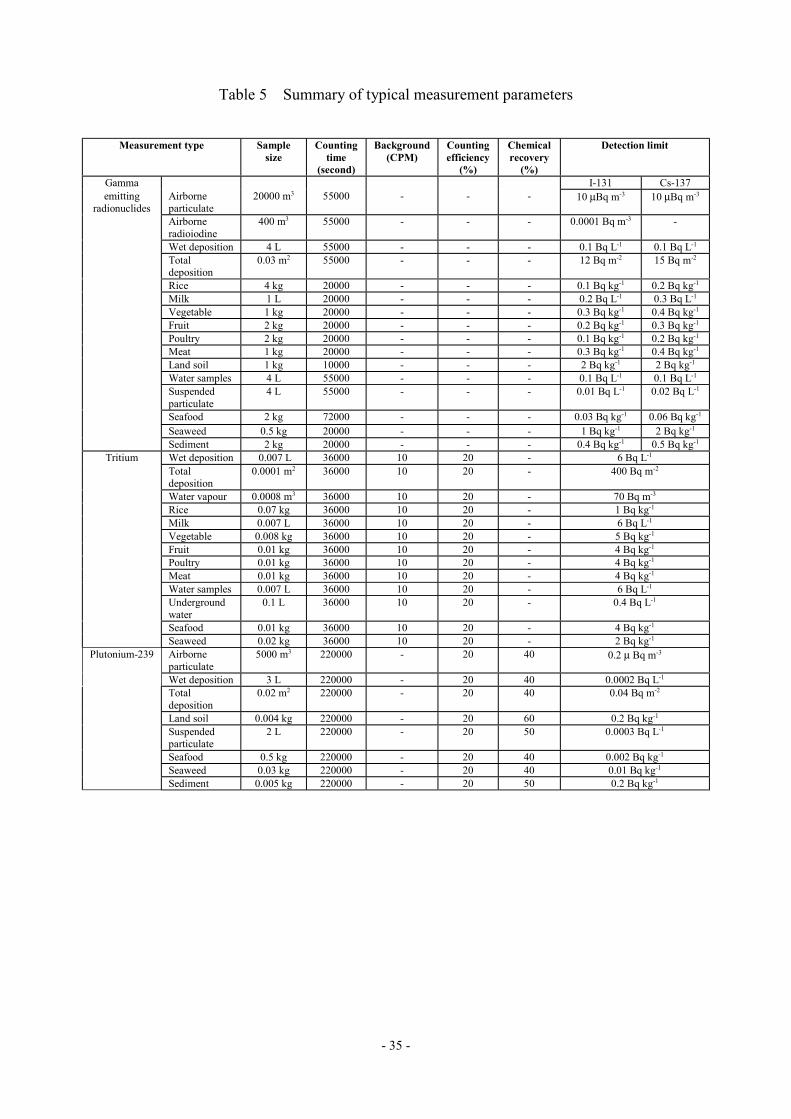
- 35 -
Table 5 Summary of typical measurement parameters
Measurement type Samplesize
Countingtime
(second)
Background(CPM)
Countingefficiency
(%)
Chemicalrecovery
(%)
Detection limit
Gamma I-131 Cs-137emitting
radionuclidesAirborneparticulate
20000 m3 55000 - - - 10 µBq m-3 10 µBq m-3
Airborneradioiodine
400 m3 55000 - - - 0.0001 Bq m-3 -
Wet deposition 4 L 55000 - - - 0.1 Bq L-1 0.1 Bq L-1
Totaldeposition
0.03 m2 55000 - - - 12 Bq m-2 15 Bq m-2
Rice 4 kg 20000 - - - 0.1 Bq kg-1 0.2 Bq kg-1
Milk 1 L 20000 - - - 0.2 Bq L-1 0.3 Bq L-1
Vegetable 1 kg 20000 - - - 0.3 Bq kg-1 0.4 Bq kg-1
Fruit 2 kg 20000 - - - 0.2 Bq kg-1 0.3 Bq kg-1
Poultry 2 kg 20000 - - - 0.1 Bq kg-1 0.2 Bq kg-1
Meat 1 kg 20000 - - - 0.3 Bq kg-1 0.4 Bq kg-1
Land soil 1 kg 10000 - - - 2 Bq kg-1 2 Bq kg-1
Water samples 4 L 55000 - - - 0.1 Bq L-1 0.1 Bq L-1
Suspendedparticulate
4 L 55000 - - - 0.01 Bq L-1 0.02 Bq L-1
Seafood 2 kg 72000 - - - 0.03 Bq kg-1 0.06 Bq kg-1
Seaweed 0.5 kg 20000 - - - 1 Bq kg-1 2 Bq kg-1
Sediment 2 kg 20000 - - - 0.4 Bq kg-1 0.5 Bq kg-1
Wet deposition 0.007 L 36000 10 20 - 6 Bq L-1TritiumTotaldeposition
0.0001 m2 36000 10 20 - 400 Bq m-2
Water vapour 0.0008 m3 36000 10 20 - 70 Bq m-3
Rice 0.07 kg 36000 10 20 - 1 Bq kg-1
Milk 0.007 L 36000 10 20 - 6 Bq L-1
Vegetable 0.008 kg 36000 10 20 - 5 Bq kg-1
Fruit 0.01 kg 36000 10 20 - 4 Bq kg-1
Poultry 0.01 kg 36000 10 20 - 4 Bq kg-1
Meat 0.01 kg 36000 10 20 - 4 Bq kg-1
Water samples 0.007 L 36000 10 20 - 6 Bq L-1
Undergroundwater
0.1 L 36000 10 20 - 0.4 Bq L-1
Seafood 0.01 kg 36000 10 20 - 4 Bq kg-1
Seaweed 0.02 kg 36000 10 20 - 2 Bq kg-1
Plutonium-239 Airborneparticulate
5000 m3 220000 - 20 40 0.2 µ Bq m-3
Wet deposition 3 L 220000 - 20 40 0.0002 Bq L-1
Totaldeposition
0.02 m2 220000 - 20 40 0.04 Bq m-2
Land soil 0.004 kg 220000 - 20 60 0.2 Bq kg-1
Suspendedparticulate
2 L 220000 - 20 50 0.0003 Bq L-1
Seafood 0.5 kg 220000 - 20 40 0.002 Bq kg-1
Seaweed 0.03 kg 220000 - 20 40 0.01 Bq kg-1
Sediment 0.005 kg 220000 - 20 50 0.2 Bq kg-1

- 36 -
Table 5 cont’d
Measurement type Samplesize
Countingtime
(second)
Background(CPM)
Countingefficiency
(%)
Chemicalrecovery
(%)
Detection limit
Strontium-90 Airborneparticulate
5000 m3 30000 1 75 90 1 µ Bq m-3
Wet deposition 3 L 30000 1 75 100 0.001 Bq L-1
Totaldeposition
0.01 m2 30000 1 75 100 0.3 Bq m-2
Rice 3 kg 30000 1 75 90 0.002 Bq kg-1
Milk 1 L 30000 1 75 90 0.005 Bq L-1
Vegetable 1 kg 30000 1 75 90 0.005 Bq kg-1
Fruit 2 kg 30000 1 75 90 0.003 Bq kg-1
Poultry 2 kg 30000 1 75 90 0.002 Bq kg-1
Meat 1 kg 30000 1 75 90 0.005 Bq kg-1
Land soil 0.005 kg 30000 1 75 90 1 Bq kg-1
Suspendedparticulate
3 L 30000 1 75 90 0.002 Bq L-1
Seafood 2 kg 30000 1 75 90 0.003 Bq kg-1
Seaweed 0.1 kg 30000 1 75 90 0.05 Bq kg-1
The values given in the table are typical values and are bound to variations in practice. These values should be used as quick referenceonly. Under certain special circumstances, some samples may be measured under substantially different conditions.

- 37 -
Table 6 Results of the IAEA Proficiency Test for the determination of γ-emittingradionuclides in a mineral matrix
Reference Date: 1 January 2002, unit: Bq kg-1 dry weight
HKO IAEARadionuclides Reported value Reference value Range of accepted valueCo-57 33.7 ± 0.8 33.9 ± 0.9 30.9 – 36.9Co-60 149.7 ± 2.4 145.0 ± 3.6 133.8 – 156.2Zn-65 22.4 ± 1.1 23.0 ± 0.7 19.6 – 26.4Y-88 35.5 ± 0.8 34.9 ± 0.9 31.7 – 38.1Cs-137 164.9 ± 3.1 160.0 ± 4.6 145.7 – 174.3

- 38 -
Table 7 Re-measurement results of IAEA reference materials IAEA-Soil-6 (Soil),IAEA-152 (Milk Powder) and IAEA-368 (Pacific Ocean Sediment)
Re-measurement results of IAEA-Soil-6Pu-239/240 measurement results (reference date: 30 January 1983, unit: Bq kg-1)
Measurement date Measurementresult Reference value 95% confidence
interval from IAEA3 May 2002 1.1 ± 0.2 1.04 0.96 – 1.1122 May 2002 1.0 ± 0.2 1.04 0.96 – 1.1122 May 2002 1.2 ± 0.3 1.04 0.96 – 1.11
Sr-90 measurement results (reference date: 30 January 1983, unit: Bq kg-1)
Measurement date Measurementresult Reference value 95% confidence
interval from IAEA18 June 2002 28.3 ± 8.5 30.34 24.20 – 31.6719 June 2002 26.7 ± 8.1 30.34 24.20 – 31.6720 June 2002 26.7 ± 8.1 30.34 24.20 – 31.67
Re-measurement results of IAEA-152Sr-90 measurement results (reference date: 31 August 1987, unit Bq kg-1)
Measurement date Measurementresult Reference value 95% confidence
interval from IAEA10 December 2002 7.8 ± 2.3 7.7 7.0 – 8.310 December 2002 7.7 ± 2.3 7.7 7.0 – 8.311 December 2002 7.5 ± 2.3 7.7 7.0 – 8.3
Re-measurement results of IAEA-368Pu-239/240 measurement results (reference date: 1 January 1990, unit Bq kg-1)
Measurement date Measurementresult Reference value 95% confidence
interval from IAEA24 December 2002 29.4 ± 1.2 31 29 – 3431 December 2002 30.9 ± 1.2 31 29 – 3431 December 2002 29.2 ± 1.4 31 29 – 34
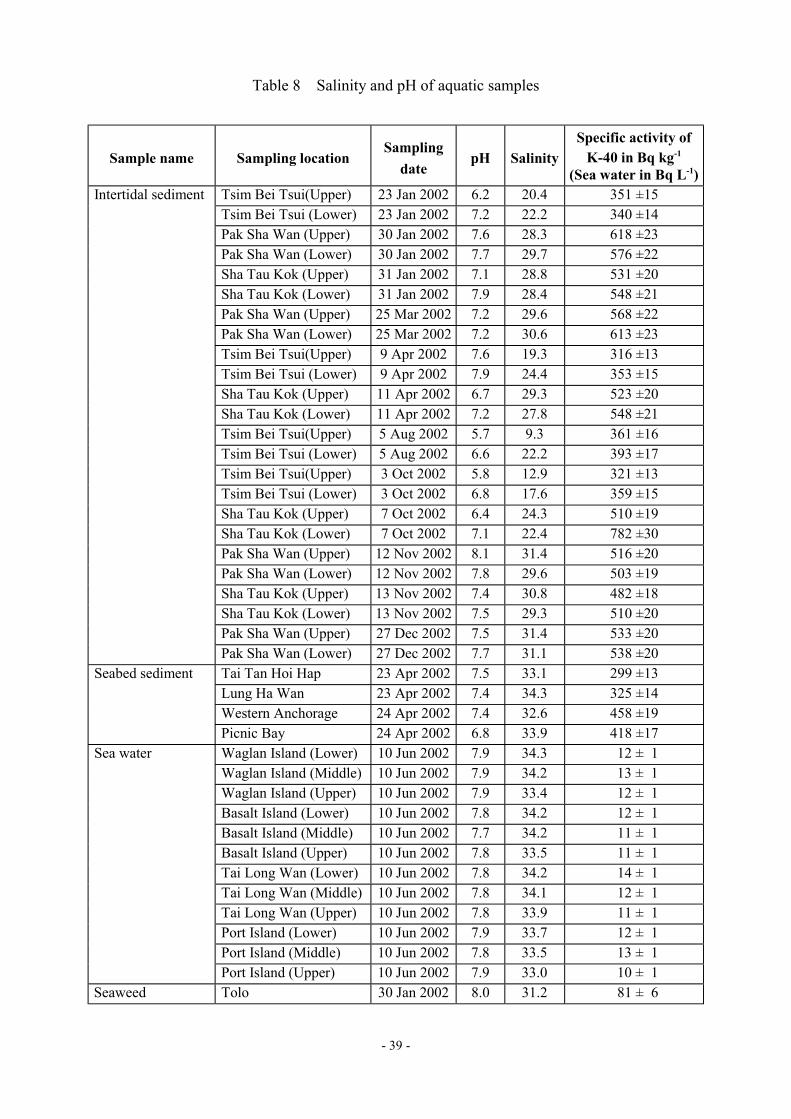
- 39 -
Table 8 Salinity and pH of aquatic samples
Sample name Sampling locationSampling
datepH Salinity
Specific activity ofK-40 in Bq kg-1
(Sea water in Bq L-1)Tsim Bei Tsui(Upper) 23 Jan 2002 6.2 20.4 351 ±15Tsim Bei Tsui (Lower) 23 Jan 2002 7.2 22.2 340 ±14Pak Sha Wan (Upper) 30 Jan 2002 7.6 28.3 618 ±23Pak Sha Wan (Lower) 30 Jan 2002 7.7 29.7 576 ±22Sha Tau Kok (Upper) 31 Jan 2002 7.1 28.8 531 ±20Sha Tau Kok (Lower) 31 Jan 2002 7.9 28.4 548 ±21Pak Sha Wan (Upper) 25 Mar 2002 7.2 29.6 568 ±22Pak Sha Wan (Lower) 25 Mar 2002 7.2 30.6 613 ±23Tsim Bei Tsui(Upper) 9 Apr 2002 7.6 19.3 316 ±13Tsim Bei Tsui (Lower) 9 Apr 2002 7.9 24.4 353 ±15Sha Tau Kok (Upper) 11 Apr 2002 6.7 29.3 523 ±20Sha Tau Kok (Lower) 11 Apr 2002 7.2 27.8 548 ±21Tsim Bei Tsui(Upper) 5 Aug 2002 5.7 9.3 361 ±16Tsim Bei Tsui (Lower) 5 Aug 2002 6.6 22.2 393 ±17Tsim Bei Tsui(Upper) 3 Oct 2002 5.8 12.9 321 ±13Tsim Bei Tsui (Lower) 3 Oct 2002 6.8 17.6 359 ±15Sha Tau Kok (Upper) 7 Oct 2002 6.4 24.3 510 ±19Sha Tau Kok (Lower) 7 Oct 2002 7.1 22.4 782 ±30Pak Sha Wan (Upper) 12 Nov 2002 8.1 31.4 516 ±20Pak Sha Wan (Lower) 12 Nov 2002 7.8 29.6 503 ±19Sha Tau Kok (Upper) 13 Nov 2002 7.4 30.8 482 ±18Sha Tau Kok (Lower) 13 Nov 2002 7.5 29.3 510 ±20Pak Sha Wan (Upper) 27 Dec 2002 7.5 31.4 533 ±20
Intertidal sediment
Pak Sha Wan (Lower) 27 Dec 2002 7.7 31.1 538 ±20Tai Tan Hoi Hap 23 Apr 2002 7.5 33.1 299 ±13Lung Ha Wan 23 Apr 2002 7.4 34.3 325 ±14Western Anchorage 24 Apr 2002 7.4 32.6 458 ±19
Seabed sediment
Picnic Bay 24 Apr 2002 6.8 33.9 418 ±17Waglan Island (Lower) 10 Jun 2002 7.9 34.3 12 ± 1Waglan Island (Middle) 10 Jun 2002 7.9 34.2 13 ± 1Waglan Island (Upper) 10 Jun 2002 7.9 33.4 12 ± 1Basalt Island (Lower) 10 Jun 2002 7.8 34.2 12 ± 1Basalt Island (Middle) 10 Jun 2002 7.7 34.2 11 ± 1Basalt Island (Upper) 10 Jun 2002 7.8 33.5 11 ± 1Tai Long Wan (Lower) 10 Jun 2002 7.8 34.2 14 ± 1Tai Long Wan (Middle) 10 Jun 2002 7.8 34.1 12 ± 1Tai Long Wan (Upper) 10 Jun 2002 7.8 33.9 11 ± 1Port Island (Lower) 10 Jun 2002 7.9 33.7 12 ± 1Port Island (Middle) 10 Jun 2002 7.8 33.5 13 ± 1
Sea water
Port Island (Upper) 10 Jun 2002 7.9 33.0 10 ± 1Seaweed Tolo 30 Jan 2002 8.0 31.2 81 ± 6
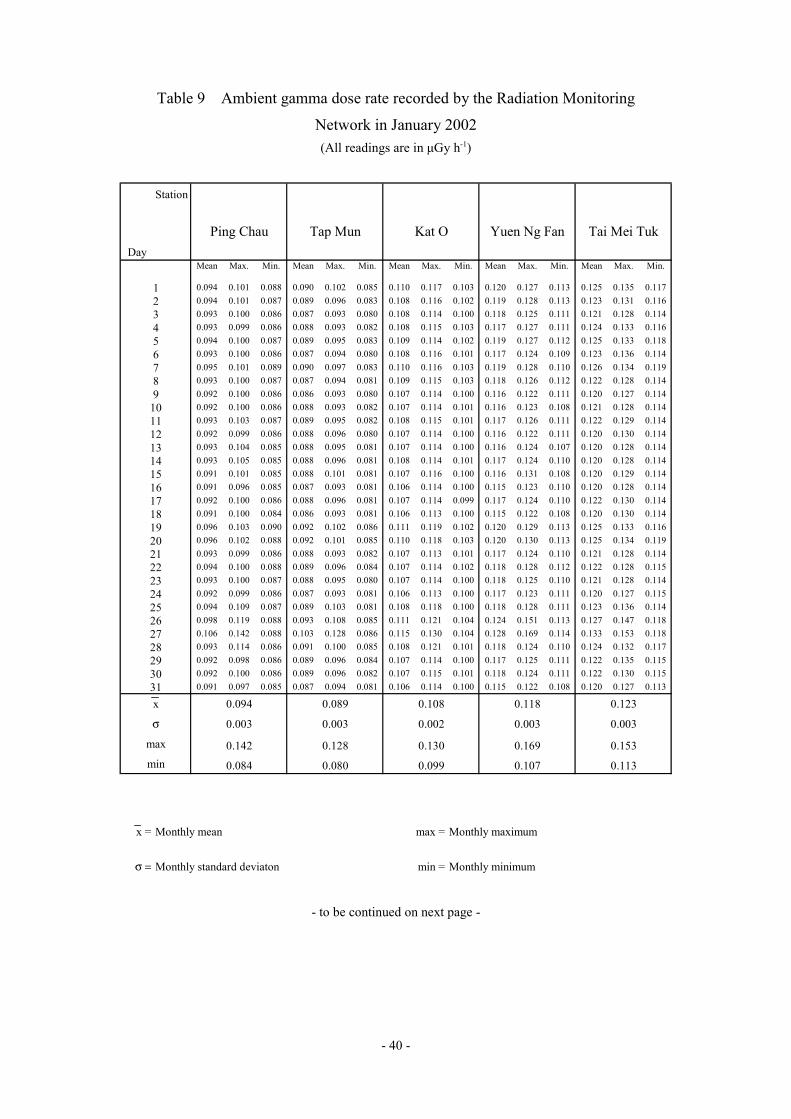
- 40 -
Table 9 Ambient gamma dose rate recorded by the Radiation Monitoring
Network in January 2002(All readings are in µGy h-1)
- to be continued on next page -
Station
Ping Chau Tap Mun Kat O Yuen Ng Fan Tai Mei TukDay
Mean Max. Min. Mean Max. Min. Mean Max. Min. Mean Max. Min. Mean Max. Min.
1 0.094 0.101 0.088 0.090 0.102 0.085 0.110 0.117 0.103 0.120 0.127 0.113 0.125 0.135 0.1172 0.094 0.101 0.087 0.089 0.096 0.083 0.108 0.116 0.102 0.119 0.128 0.113 0.123 0.131 0.1163 0.093 0.100 0.086 0.087 0.093 0.080 0.108 0.114 0.100 0.118 0.125 0.111 0.121 0.128 0.1144 0.093 0.099 0.086 0.088 0.093 0.082 0.108 0.115 0.103 0.117 0.127 0.111 0.124 0.133 0.1165 0.094 0.100 0.087 0.089 0.095 0.083 0.109 0.114 0.102 0.119 0.127 0.112 0.125 0.133 0.1186 0.093 0.100 0.086 0.087 0.094 0.080 0.108 0.116 0.101 0.117 0.124 0.109 0.123 0.136 0.1147 0.095 0.101 0.089 0.090 0.097 0.083 0.110 0.116 0.103 0.119 0.128 0.110 0.126 0.134 0.1198 0.093 0.100 0.087 0.087 0.094 0.081 0.109 0.115 0.103 0.118 0.126 0.112 0.122 0.128 0.1149 0.092 0.100 0.086 0.086 0.093 0.080 0.107 0.114 0.100 0.116 0.122 0.111 0.120 0.127 0.114
10 0.092 0.100 0.086 0.088 0.093 0.082 0.107 0.114 0.101 0.116 0.123 0.108 0.121 0.128 0.11411 0.093 0.103 0.087 0.089 0.095 0.082 0.108 0.115 0.101 0.117 0.126 0.111 0.122 0.129 0.11412 0.092 0.099 0.086 0.088 0.096 0.080 0.107 0.114 0.100 0.116 0.122 0.111 0.120 0.130 0.11413 0.093 0.104 0.085 0.088 0.095 0.081 0.107 0.114 0.100 0.116 0.124 0.107 0.120 0.128 0.11414 0.093 0.105 0.085 0.088 0.096 0.081 0.108 0.114 0.101 0.117 0.124 0.110 0.120 0.128 0.11415 0.091 0.101 0.085 0.088 0.101 0.081 0.107 0.116 0.100 0.116 0.131 0.108 0.120 0.129 0.11416 0.091 0.096 0.085 0.087 0.093 0.081 0.106 0.114 0.100 0.115 0.123 0.110 0.120 0.128 0.11417 0.092 0.100 0.086 0.088 0.096 0.081 0.107 0.114 0.099 0.117 0.124 0.110 0.122 0.130 0.11418 0.091 0.100 0.084 0.086 0.093 0.081 0.106 0.113 0.100 0.115 0.122 0.108 0.120 0.130 0.11419 0.096 0.103 0.090 0.092 0.102 0.086 0.111 0.119 0.102 0.120 0.129 0.113 0.125 0.133 0.11620 0.096 0.102 0.088 0.092 0.101 0.085 0.110 0.118 0.103 0.120 0.130 0.113 0.125 0.134 0.11921 0.093 0.099 0.086 0.088 0.093 0.082 0.107 0.113 0.101 0.117 0.124 0.110 0.121 0.128 0.11422 0.094 0.100 0.088 0.089 0.096 0.084 0.107 0.114 0.102 0.118 0.128 0.112 0.122 0.128 0.11523 0.093 0.100 0.087 0.088 0.095 0.080 0.107 0.114 0.100 0.118 0.125 0.110 0.121 0.128 0.11424 0.092 0.099 0.086 0.087 0.093 0.081 0.106 0.113 0.100 0.117 0.123 0.111 0.120 0.127 0.11525 0.094 0.109 0.087 0.089 0.103 0.081 0.108 0.118 0.100 0.118 0.128 0.111 0.123 0.136 0.11426 0.098 0.119 0.088 0.093 0.108 0.085 0.111 0.121 0.104 0.124 0.151 0.113 0.127 0.147 0.11827 0.106 0.142 0.088 0.103 0.128 0.086 0.115 0.130 0.104 0.128 0.169 0.114 0.133 0.153 0.11828 0.093 0.114 0.086 0.091 0.100 0.085 0.108 0.121 0.101 0.118 0.124 0.110 0.124 0.132 0.11729 0.092 0.098 0.086 0.089 0.096 0.084 0.107 0.114 0.100 0.117 0.125 0.111 0.122 0.135 0.11530 0.092 0.100 0.086 0.089 0.096 0.082 0.107 0.115 0.101 0.118 0.124 0.111 0.122 0.130 0.11531 0.091 0.097 0.085 0.087 0.094 0.081 0.106 0.114 0.100 0.115 0.122 0.108 0.120 0.127 0.113
x 0.094 0.089 0.108 0.118 0.123
σ 0.003 0.003 0.002 0.003 0.003
max 0.142 0.128 0.130 0.169 0.153min 0.084 0.080 0.099 0.107 0.113
x = Monthly mean max = Monthly maximum
σ = Monthly standard deviaton min = Monthly minimum
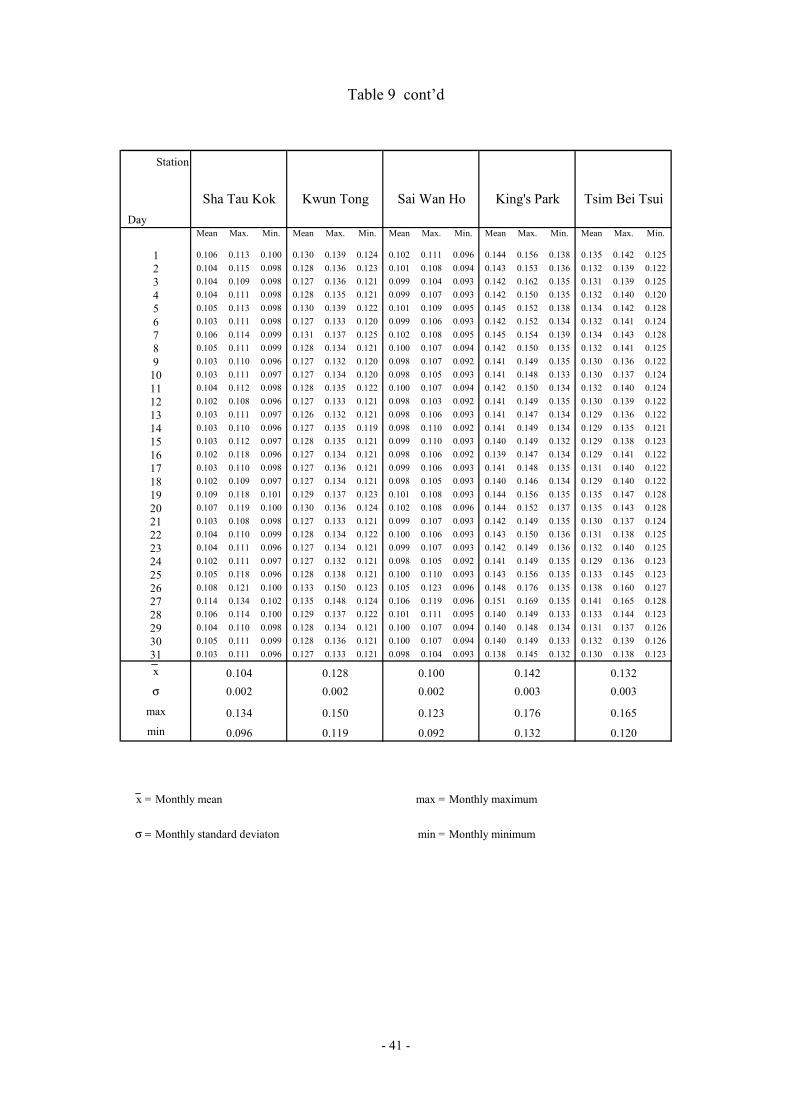
- 41 -
Table 9 cont’d
Station
Sha Tau Kok Kwun Tong Sai Wan Ho King's Park Tsim Bei TsuiDay
Mean Max. Min. Mean Max. Min. Mean Max. Min. Mean Max. Min. Mean Max. Min.
1 0.106 0.113 0.100 0.130 0.139 0.124 0.102 0.111 0.096 0.144 0.156 0.138 0.135 0.142 0.1252 0.104 0.115 0.098 0.128 0.136 0.123 0.101 0.108 0.094 0.143 0.153 0.136 0.132 0.139 0.1223 0.104 0.109 0.098 0.127 0.136 0.121 0.099 0.104 0.093 0.142 0.162 0.135 0.131 0.139 0.1254 0.104 0.111 0.098 0.128 0.135 0.121 0.099 0.107 0.093 0.142 0.150 0.135 0.132 0.140 0.1205 0.105 0.113 0.098 0.130 0.139 0.122 0.101 0.109 0.095 0.145 0.152 0.138 0.134 0.142 0.1286 0.103 0.111 0.098 0.127 0.133 0.120 0.099 0.106 0.093 0.142 0.152 0.134 0.132 0.141 0.1247 0.106 0.114 0.099 0.131 0.137 0.125 0.102 0.108 0.095 0.145 0.154 0.139 0.134 0.143 0.1288 0.105 0.111 0.099 0.128 0.134 0.121 0.100 0.107 0.094 0.142 0.150 0.135 0.132 0.141 0.1259 0.103 0.110 0.096 0.127 0.132 0.120 0.098 0.107 0.092 0.141 0.149 0.135 0.130 0.136 0.122
10 0.103 0.111 0.097 0.127 0.134 0.120 0.098 0.105 0.093 0.141 0.148 0.133 0.130 0.137 0.12411 0.104 0.112 0.098 0.128 0.135 0.122 0.100 0.107 0.094 0.142 0.150 0.134 0.132 0.140 0.12412 0.102 0.108 0.096 0.127 0.133 0.121 0.098 0.103 0.092 0.141 0.149 0.135 0.130 0.139 0.12213 0.103 0.111 0.097 0.126 0.132 0.121 0.098 0.106 0.093 0.141 0.147 0.134 0.129 0.136 0.12214 0.103 0.110 0.096 0.127 0.135 0.119 0.098 0.110 0.092 0.141 0.149 0.134 0.129 0.135 0.12115 0.103 0.112 0.097 0.128 0.135 0.121 0.099 0.110 0.093 0.140 0.149 0.132 0.129 0.138 0.12316 0.102 0.118 0.096 0.127 0.134 0.121 0.098 0.106 0.092 0.139 0.147 0.134 0.129 0.141 0.12217 0.103 0.110 0.098 0.127 0.136 0.121 0.099 0.106 0.093 0.141 0.148 0.135 0.131 0.140 0.12218 0.102 0.109 0.097 0.127 0.134 0.121 0.098 0.105 0.093 0.140 0.146 0.134 0.129 0.140 0.12219 0.109 0.118 0.101 0.129 0.137 0.123 0.101 0.108 0.093 0.144 0.156 0.135 0.135 0.147 0.12820 0.107 0.119 0.100 0.130 0.136 0.124 0.102 0.108 0.096 0.144 0.152 0.137 0.135 0.143 0.12821 0.103 0.108 0.098 0.127 0.133 0.121 0.099 0.107 0.093 0.142 0.149 0.135 0.130 0.137 0.12422 0.104 0.110 0.099 0.128 0.134 0.122 0.100 0.106 0.093 0.143 0.150 0.136 0.131 0.138 0.12523 0.104 0.111 0.096 0.127 0.134 0.121 0.099 0.107 0.093 0.142 0.149 0.136 0.132 0.140 0.12524 0.102 0.111 0.097 0.127 0.132 0.121 0.098 0.105 0.092 0.141 0.149 0.135 0.129 0.136 0.12325 0.105 0.118 0.096 0.128 0.138 0.121 0.100 0.110 0.093 0.143 0.156 0.135 0.133 0.145 0.12326 0.108 0.121 0.100 0.133 0.150 0.123 0.105 0.123 0.096 0.148 0.176 0.135 0.138 0.160 0.12727 0.114 0.134 0.102 0.135 0.148 0.124 0.106 0.119 0.096 0.151 0.169 0.135 0.141 0.165 0.12828 0.106 0.114 0.100 0.129 0.137 0.122 0.101 0.111 0.095 0.140 0.149 0.133 0.133 0.144 0.12329 0.104 0.110 0.098 0.128 0.134 0.121 0.100 0.107 0.094 0.140 0.148 0.134 0.131 0.137 0.12630 0.105 0.111 0.099 0.128 0.136 0.121 0.100 0.107 0.094 0.140 0.149 0.133 0.132 0.139 0.12631 0.103 0.111 0.096 0.127 0.133 0.121 0.098 0.104 0.093 0.138 0.145 0.132 0.130 0.138 0.123
x 0.104 0.128 0.100 0.142 0.132σ 0.002 0.002 0.002 0.003 0.003
max 0.134 0.150 0.123 0.176 0.165min 0.096 0.119 0.092 0.132 0.120
x = Monthly mean max = Monthly maximum
σ = Monthly standard deviaton min = Monthly minimum
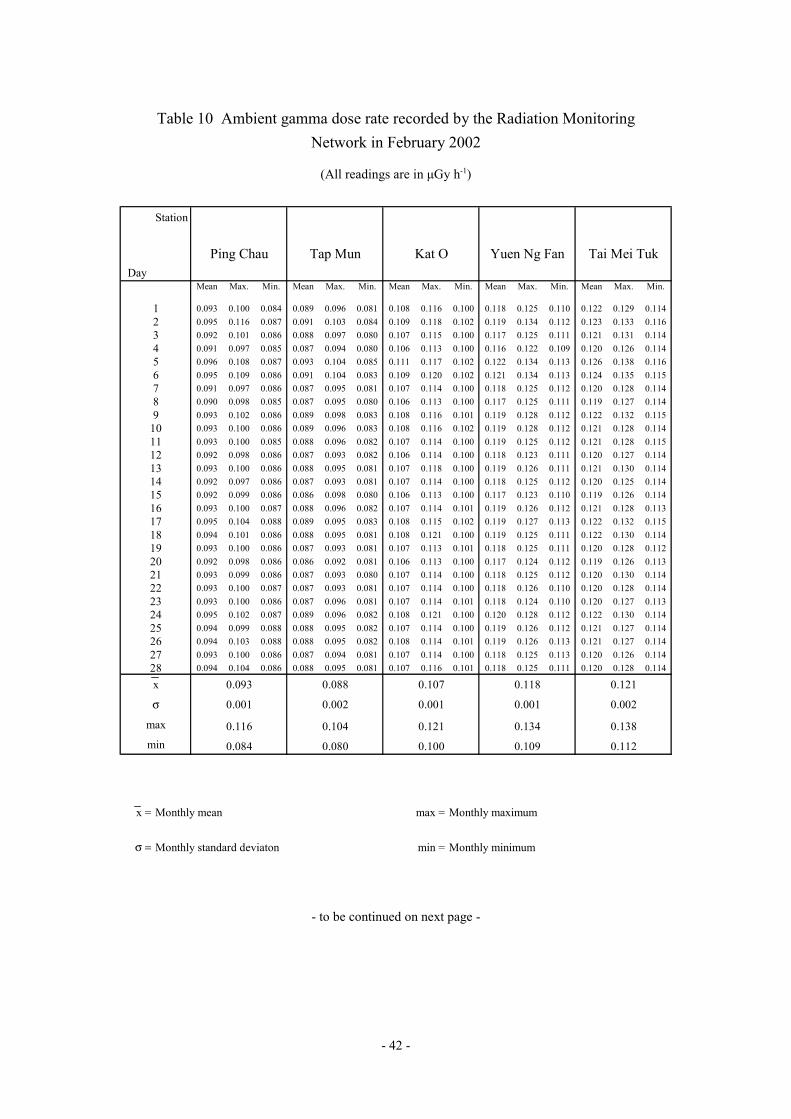
- 42 -
Table 10 Ambient gamma dose rate recorded by the Radiation MonitoringNetwork in February 2002
(All readings are in µGy h-1)
- to be continued on next page -
Station
Ping Chau Tap Mun Kat O Yuen Ng Fan Tai Mei TukDay
Mean Max. Min. Mean Max. Min. Mean Max. Min. Mean Max. Min. Mean Max. Min.
1 0.093 0.100 0.084 0.089 0.096 0.081 0.108 0.116 0.100 0.118 0.125 0.110 0.122 0.129 0.1142 0.095 0.116 0.087 0.091 0.103 0.084 0.109 0.118 0.102 0.119 0.134 0.112 0.123 0.133 0.1163 0.092 0.101 0.086 0.088 0.097 0.080 0.107 0.115 0.100 0.117 0.125 0.111 0.121 0.131 0.1144 0.091 0.097 0.085 0.087 0.094 0.080 0.106 0.113 0.100 0.116 0.122 0.109 0.120 0.126 0.1145 0.096 0.108 0.087 0.093 0.104 0.085 0.111 0.117 0.102 0.122 0.134 0.113 0.126 0.138 0.1166 0.095 0.109 0.086 0.091 0.104 0.083 0.109 0.120 0.102 0.121 0.134 0.113 0.124 0.135 0.1157 0.091 0.097 0.086 0.087 0.095 0.081 0.107 0.114 0.100 0.118 0.125 0.112 0.120 0.128 0.1148 0.090 0.098 0.085 0.087 0.095 0.080 0.106 0.113 0.100 0.117 0.125 0.111 0.119 0.127 0.1149 0.093 0.102 0.086 0.089 0.098 0.083 0.108 0.116 0.101 0.119 0.128 0.112 0.122 0.132 0.115
10 0.093 0.100 0.086 0.089 0.096 0.083 0.108 0.116 0.102 0.119 0.128 0.112 0.121 0.128 0.11411 0.093 0.100 0.085 0.088 0.096 0.082 0.107 0.114 0.100 0.119 0.125 0.112 0.121 0.128 0.11512 0.092 0.098 0.086 0.087 0.093 0.082 0.106 0.114 0.100 0.118 0.123 0.111 0.120 0.127 0.11413 0.093 0.100 0.086 0.088 0.095 0.081 0.107 0.118 0.100 0.119 0.126 0.111 0.121 0.130 0.11414 0.092 0.097 0.086 0.087 0.093 0.081 0.107 0.114 0.100 0.118 0.125 0.112 0.120 0.125 0.11415 0.092 0.099 0.086 0.086 0.098 0.080 0.106 0.113 0.100 0.117 0.123 0.110 0.119 0.126 0.11416 0.093 0.100 0.087 0.088 0.096 0.082 0.107 0.114 0.101 0.119 0.126 0.112 0.121 0.128 0.11317 0.095 0.104 0.088 0.089 0.095 0.083 0.108 0.115 0.102 0.119 0.127 0.113 0.122 0.132 0.11518 0.094 0.101 0.086 0.088 0.095 0.081 0.108 0.121 0.100 0.119 0.125 0.111 0.122 0.130 0.11419 0.093 0.100 0.086 0.087 0.093 0.081 0.107 0.113 0.101 0.118 0.125 0.111 0.120 0.128 0.11220 0.092 0.098 0.086 0.086 0.092 0.081 0.106 0.113 0.100 0.117 0.124 0.112 0.119 0.126 0.11321 0.093 0.099 0.086 0.087 0.093 0.080 0.107 0.114 0.100 0.118 0.125 0.112 0.120 0.130 0.11422 0.093 0.100 0.087 0.087 0.093 0.081 0.107 0.114 0.100 0.118 0.126 0.110 0.120 0.128 0.11423 0.093 0.100 0.086 0.087 0.096 0.081 0.107 0.114 0.101 0.118 0.124 0.110 0.120 0.127 0.11324 0.095 0.102 0.087 0.089 0.096 0.082 0.108 0.121 0.100 0.120 0.128 0.112 0.122 0.130 0.11425 0.094 0.099 0.088 0.088 0.095 0.082 0.107 0.114 0.100 0.119 0.126 0.112 0.121 0.127 0.11426 0.094 0.103 0.088 0.088 0.095 0.082 0.108 0.114 0.101 0.119 0.126 0.113 0.121 0.127 0.11427 0.093 0.100 0.086 0.087 0.094 0.081 0.107 0.114 0.100 0.118 0.125 0.113 0.120 0.126 0.11428 0.094 0.104 0.086 0.088 0.095 0.081 0.107 0.116 0.101 0.118 0.125 0.111 0.120 0.128 0.114
x 0.093 0.088 0.107 0.118 0.121
σ 0.001 0.002 0.001 0.001 0.002
max 0.116 0.104 0.121 0.134 0.138min 0.084 0.080 0.100 0.109 0.112
x = Monthly mean max = Monthly maximum
σ = Monthly standard deviaton min = Monthly minimum
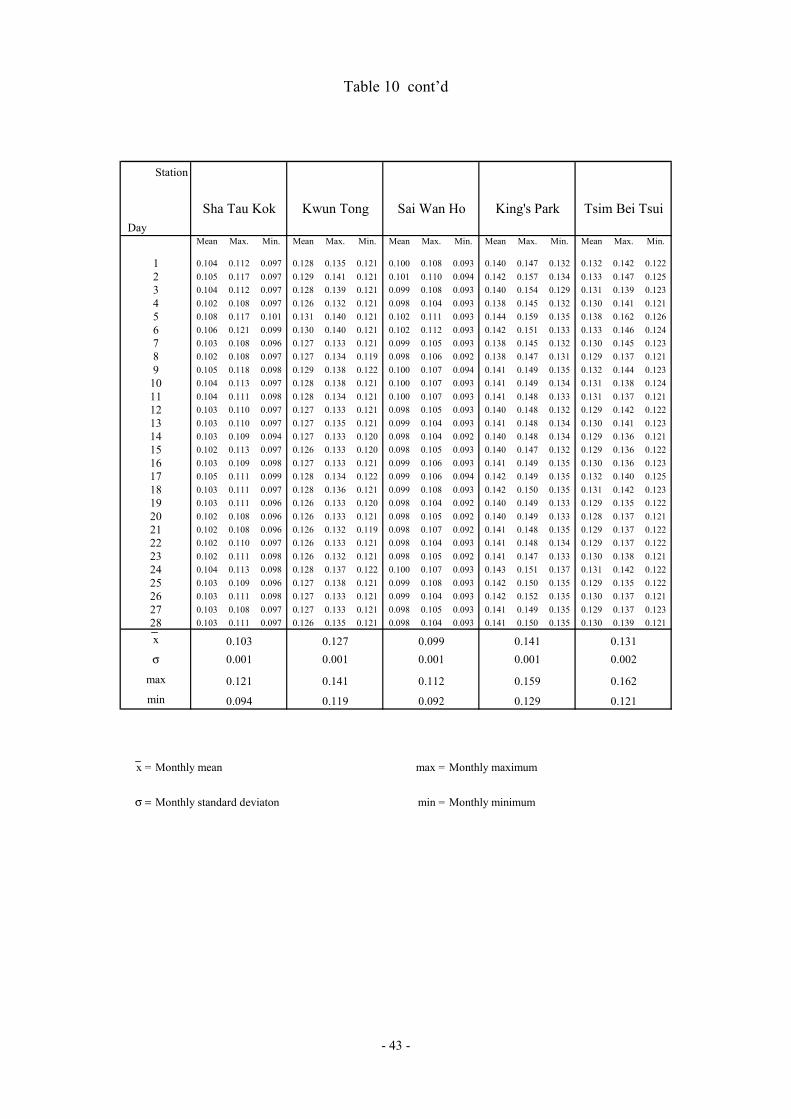
- 43 -
Table 10 cont’d
Station
Sha Tau Kok Kwun Tong Sai Wan Ho King's Park Tsim Bei TsuiDay
Mean Max. Min. Mean Max. Min. Mean Max. Min. Mean Max. Min. Mean Max. Min.
1 0.104 0.112 0.097 0.128 0.135 0.121 0.100 0.108 0.093 0.140 0.147 0.132 0.132 0.142 0.1222 0.105 0.117 0.097 0.129 0.141 0.121 0.101 0.110 0.094 0.142 0.157 0.134 0.133 0.147 0.1253 0.104 0.112 0.097 0.128 0.139 0.121 0.099 0.108 0.093 0.140 0.154 0.129 0.131 0.139 0.1234 0.102 0.108 0.097 0.126 0.132 0.121 0.098 0.104 0.093 0.138 0.145 0.132 0.130 0.141 0.1215 0.108 0.117 0.101 0.131 0.140 0.121 0.102 0.111 0.093 0.144 0.159 0.135 0.138 0.162 0.1266 0.106 0.121 0.099 0.130 0.140 0.121 0.102 0.112 0.093 0.142 0.151 0.133 0.133 0.146 0.1247 0.103 0.108 0.096 0.127 0.133 0.121 0.099 0.105 0.093 0.138 0.145 0.132 0.130 0.145 0.1238 0.102 0.108 0.097 0.127 0.134 0.119 0.098 0.106 0.092 0.138 0.147 0.131 0.129 0.137 0.1219 0.105 0.118 0.098 0.129 0.138 0.122 0.100 0.107 0.094 0.141 0.149 0.135 0.132 0.144 0.123
10 0.104 0.113 0.097 0.128 0.138 0.121 0.100 0.107 0.093 0.141 0.149 0.134 0.131 0.138 0.12411 0.104 0.111 0.098 0.128 0.134 0.121 0.100 0.107 0.093 0.141 0.148 0.133 0.131 0.137 0.12112 0.103 0.110 0.097 0.127 0.133 0.121 0.098 0.105 0.093 0.140 0.148 0.132 0.129 0.142 0.12213 0.103 0.110 0.097 0.127 0.135 0.121 0.099 0.104 0.093 0.141 0.148 0.134 0.130 0.141 0.12314 0.103 0.109 0.094 0.127 0.133 0.120 0.098 0.104 0.092 0.140 0.148 0.134 0.129 0.136 0.12115 0.102 0.113 0.097 0.126 0.133 0.120 0.098 0.105 0.093 0.140 0.147 0.132 0.129 0.136 0.12216 0.103 0.109 0.098 0.127 0.133 0.121 0.099 0.106 0.093 0.141 0.149 0.135 0.130 0.136 0.12317 0.105 0.111 0.099 0.128 0.134 0.122 0.099 0.106 0.094 0.142 0.149 0.135 0.132 0.140 0.12518 0.103 0.111 0.097 0.128 0.136 0.121 0.099 0.108 0.093 0.142 0.150 0.135 0.131 0.142 0.12319 0.103 0.111 0.096 0.126 0.133 0.120 0.098 0.104 0.092 0.140 0.149 0.133 0.129 0.135 0.12220 0.102 0.108 0.096 0.126 0.133 0.121 0.098 0.105 0.092 0.140 0.149 0.133 0.128 0.137 0.12121 0.102 0.108 0.096 0.126 0.132 0.119 0.098 0.107 0.092 0.141 0.148 0.135 0.129 0.137 0.12222 0.102 0.110 0.097 0.126 0.133 0.121 0.098 0.104 0.093 0.141 0.148 0.134 0.129 0.137 0.12223 0.102 0.111 0.098 0.126 0.132 0.121 0.098 0.105 0.092 0.141 0.147 0.133 0.130 0.138 0.12124 0.104 0.113 0.098 0.128 0.137 0.122 0.100 0.107 0.093 0.143 0.151 0.137 0.131 0.142 0.12225 0.103 0.109 0.096 0.127 0.138 0.121 0.099 0.108 0.093 0.142 0.150 0.135 0.129 0.135 0.12226 0.103 0.111 0.098 0.127 0.133 0.121 0.099 0.104 0.093 0.142 0.152 0.135 0.130 0.137 0.12127 0.103 0.108 0.097 0.127 0.133 0.121 0.098 0.105 0.093 0.141 0.149 0.135 0.129 0.137 0.12328 0.103 0.111 0.097 0.126 0.135 0.121 0.098 0.104 0.093 0.141 0.150 0.135 0.130 0.139 0.121
x 0.103 0.127 0.099 0.141 0.131σ 0.001 0.001 0.001 0.001 0.002
max 0.121 0.141 0.112 0.159 0.162min 0.094 0.119 0.092 0.129 0.121
x = Monthly mean max = Monthly maximum
σ = Monthly standard deviaton min = Monthly minimum

- 44 -
Table 11 Ambient gamma dose rate recorded by the Radiation MonitoringNetwork in March 2002
(All readings are in µGy h-1)
- to be continued on next page -
Station
Ping Chau Tap Mun Kat O Yuen Ng Fan Tai Mei TukDay
Mean Max. Min. Mean Max. Min. Mean Max. Min. Mean Max. Min. Mean Max. Min.
1 0.093 0.101 0.087 0.087 0.093 0.080 0.107 0.113 0.100 0.118 0.124 0.111 0.119 0.126 0.1142 0.094 0.107 0.087 0.087 0.093 0.080 0.107 0.114 0.100 0.118 0.124 0.112 0.120 0.127 0.1143 0.094 0.102 0.087 0.087 0.094 0.081 0.107 0.114 0.102 0.118 0.128 0.112 0.120 0.128 0.1134 0.094 0.100 0.088 0.087 0.093 0.080 0.107 0.114 0.101 0.118 0.125 0.112 0.120 0.128 0.1145 0.094 0.102 0.087 0.088 0.100 0.082 0.108 0.114 0.100 0.119 0.128 0.111 0.121 0.131 0.1146 0.095 0.102 0.089 0.088 0.094 0.084 0.108 0.114 0.100 0.120 0.128 0.114 0.121 0.128 0.1147 0.096 0.102 0.090 0.089 0.095 0.084 0.108 0.116 0.101 0.120 0.127 0.113 0.122 0.128 0.1148 0.094 0.100 0.090 0.087 0.093 0.081 0.107 0.114 0.102 0.118 0.127 0.113 0.120 0.127 0.1149 0.094 0.102 0.088 0.087 0.093 0.081 0.107 0.116 0.100 0.118 0.126 0.112 0.120 0.127 0.114
10 0.094 0.100 0.088 0.087 0.093 0.081 0.107 0.113 0.101 0.118 0.125 0.112 0.120 0.127 0.11311 0.094 0.102 0.088 0.088 0.093 0.082 0.108 0.114 0.102 0.119 0.125 0.112 0.120 0.127 0.11412 0.094 0.102 0.087 0.088 0.093 0.081 0.108 0.120 0.102 0.118 0.125 0.112 0.120 0.127 0.11413 0.094 0.101 0.088 0.087 0.095 0.081 0.107 0.114 0.100 0.118 0.125 0.113 0.120 0.126 0.11414 0.094 0.107 0.088 0.087 0.093 0.082 0.107 0.114 0.102 0.118 0.124 0.113 0.120 0.126 0.11315 0.094 0.102 0.086 0.087 0.093 0.082 0.108 0.114 0.102 0.118 0.124 0.113 0.120 0.127 0.11316 0.095 0.102 0.089 0.089 0.096 0.082 0.109 0.116 0.102 0.119 0.127 0.111 0.122 0.135 0.11517 0.096 0.103 0.089 0.088 0.097 0.082 0.108 0.116 0.101 0.119 0.129 0.113 0.122 0.132 0.11418 0.097 0.105 0.091 0.089 0.095 0.082 0.109 0.115 0.102 0.120 0.127 0.112 0.122 0.130 0.11419 0.094 0.101 0.087 0.088 0.096 0.082 0.108 0.115 0.101 0.118 0.126 0.112 0.121 0.128 0.11420 0.095 0.104 0.089 0.088 0.096 0.082 0.108 0.116 0.101 0.118 0.128 0.112 0.120 0.127 0.11421 0.095 0.103 0.086 0.088 0.097 0.083 0.108 0.115 0.101 0.118 0.125 0.114 0.121 0.130 0.11422 0.094 0.102 0.088 0.088 0.095 0.081 0.108 0.115 0.102 0.118 0.125 0.112 0.121 0.128 0.11423 0.097 0.122 0.085 0.095 0.117 0.082 0.109 0.126 0.100 0.123 0.142 0.112 0.124 0.143 0.11424 0.094 0.115 0.084 0.090 0.108 0.081 0.107 0.118 0.100 0.118 0.133 0.109 0.122 0.136 0.11125 0.089 0.097 0.084 0.087 0.099 0.080 0.105 0.122 0.098 0.115 0.123 0.107 0.120 0.135 0.11426 0.088 0.096 0.082 0.086 0.092 0.080 0.103 0.110 0.097 0.114 0.121 0.108 0.118 0.124 0.11227 0.088 0.095 0.081 0.086 0.093 0.079 0.103 0.111 0.097 0.114 0.121 0.108 0.118 0.125 0.11228 0.088 0.098 0.081 0.086 0.092 0.079 0.103 0.110 0.098 0.114 0.122 0.107 0.118 0.125 0.11329 0.088 0.097 0.081 0.087 0.102 0.079 0.104 0.111 0.098 0.115 0.135 0.107 0.120 0.134 0.11230 0.092 0.100 0.086 0.091 0.106 0.083 0.107 0.120 0.100 0.118 0.128 0.111 0.123 0.135 0.11531 0.092 0.105 0.085 0.089 0.102 0.083 0.107 0.116 0.100 0.117 0.128 0.109 0.122 0.132 0.115
x 0.093 0.088 0.107 0.118 0.121
σ 0.003 0.002 0.002 0.002 0.001
max 0.122 0.117 0.126 0.142 0.143min 0.081 0.079 0.097 0.107 0.111
x = Monthly mean max = Monthly maximum
σ = Monthly standard deviaton min = Monthly minimum

- 45 -
Table 11 cont’d
Station
Sha Tau Kok Kwun Tong Sai Wan Ho King's Park Tsim Bei TsuiDay
Mean Max. Min. Mean Max. Min. Mean Max. Min. Mean Max. Min. Mean Max. Min.
1 0.102 0.109 0.096 0.126 0.133 0.121 0.098 0.105 0.091 0.141 0.148 0.135 0.129 0.138 0.1212 0.103 0.109 0.097 0.127 0.133 0.121 0.098 0.104 0.092 0.141 0.148 0.135 0.129 0.135 0.1213 0.103 0.110 0.096 0.127 0.135 0.120 0.098 0.106 0.093 0.142 0.149 0.134 0.130 0.139 0.1224 0.103 0.109 0.096 0.127 0.136 0.121 0.098 0.106 0.093 0.141 0.148 0.135 0.129 0.137 0.1225 0.103 0.110 0.097 0.127 0.135 0.121 0.099 0.107 0.092 0.142 0.162 0.133 0.130 0.142 0.1226 0.103 0.108 0.097 0.127 0.134 0.121 0.099 0.107 0.093 0.143 0.149 0.136 0.130 0.137 0.1247 0.104 0.110 0.098 0.127 0.134 0.121 0.099 0.106 0.093 0.143 0.149 0.135 0.130 0.138 0.1238 0.103 0.108 0.097 0.126 0.132 0.121 0.098 0.105 0.093 0.141 0.148 0.135 0.129 0.139 0.1219 0.102 0.114 0.096 0.126 0.132 0.121 0.098 0.105 0.093 0.142 0.148 0.135 0.129 0.135 0.121
10 0.102 0.108 0.096 0.126 0.135 0.121 0.098 0.105 0.092 0.142 0.149 0.135 0.129 0.135 0.12111 0.103 0.108 0.095 0.127 0.134 0.121 0.098 0.105 0.093 0.141 0.149 0.133 0.130 0.137 0.12312 0.103 0.110 0.096 0.126 0.132 0.120 0.098 0.104 0.093 0.141 0.148 0.133 0.130 0.137 0.12313 0.102 0.111 0.096 0.126 0.133 0.121 0.098 0.104 0.093 0.141 0.148 0.134 0.130 0.137 0.12314 0.103 0.109 0.096 0.127 0.135 0.120 0.098 0.111 0.092 0.142 0.149 0.133 0.130 0.140 0.12315 0.102 0.109 0.097 0.127 0.134 0.121 0.098 0.105 0.092 0.141 0.149 0.133 0.130 0.136 0.12316 0.105 0.119 0.098 0.127 0.134 0.121 0.099 0.108 0.092 0.142 0.149 0.135 0.131 0.140 0.12317 0.104 0.113 0.097 0.127 0.135 0.121 0.099 0.107 0.093 0.142 0.153 0.136 0.131 0.142 0.12418 0.105 0.118 0.097 0.128 0.134 0.121 0.100 0.107 0.091 0.143 0.154 0.135 0.132 0.140 0.12519 0.103 0.109 0.097 0.127 0.135 0.120 0.099 0.105 0.093 0.141 0.149 0.134 0.130 0.137 0.12320 0.104 0.110 0.096 0.127 0.132 0.121 0.099 0.105 0.093 0.141 0.159 0.133 0.131 0.139 0.12421 0.103 0.114 0.098 0.127 0.133 0.120 0.098 0.110 0.092 0.142 0.149 0.135 0.131 0.142 0.12122 0.103 0.110 0.096 0.127 0.141 0.121 0.098 0.106 0.093 0.142 0.149 0.135 0.131 0.140 0.12423 0.106 0.128 0.098 0.130 0.142 0.121 0.102 0.119 0.093 0.140 0.163 0.128 0.131 0.146 0.12124 0.105 0.120 0.096 0.130 0.145 0.121 0.101 0.115 0.094 0.138 0.159 0.128 0.132 0.148 0.12225 0.103 0.111 0.096 0.127 0.134 0.121 0.099 0.106 0.093 0.135 0.143 0.128 0.130 0.138 0.12326 0.101 0.107 0.094 0.126 0.133 0.121 0.098 0.105 0.092 0.134 0.144 0.128 0.129 0.137 0.12127 0.101 0.109 0.095 0.126 0.134 0.119 0.098 0.104 0.091 0.134 0.142 0.127 0.129 0.136 0.12228 0.101 0.108 0.095 0.126 0.140 0.120 0.098 0.106 0.093 0.134 0.142 0.128 0.129 0.136 0.12129 0.102 0.109 0.096 0.128 0.146 0.121 0.099 0.120 0.093 0.137 0.170 0.128 0.130 0.141 0.12130 0.106 0.116 0.100 0.132 0.142 0.124 0.103 0.114 0.096 0.140 0.156 0.132 0.137 0.163 0.12831 0.105 0.120 0.098 0.129 0.137 0.123 0.100 0.107 0.093 0.137 0.148 0.130 0.133 0.149 0.123
x 0.103 0.127 0.099 0.140 0.130σ 0.001 0.001 0.001 0.003 0.002
max 0.128 0.146 0.120 0.170 0.163min 0.094 0.119 0.091 0.127 0.121
x = Monthly mean max = Monthly maximum
σ = Monthly standard deviaton min = Monthly minimum
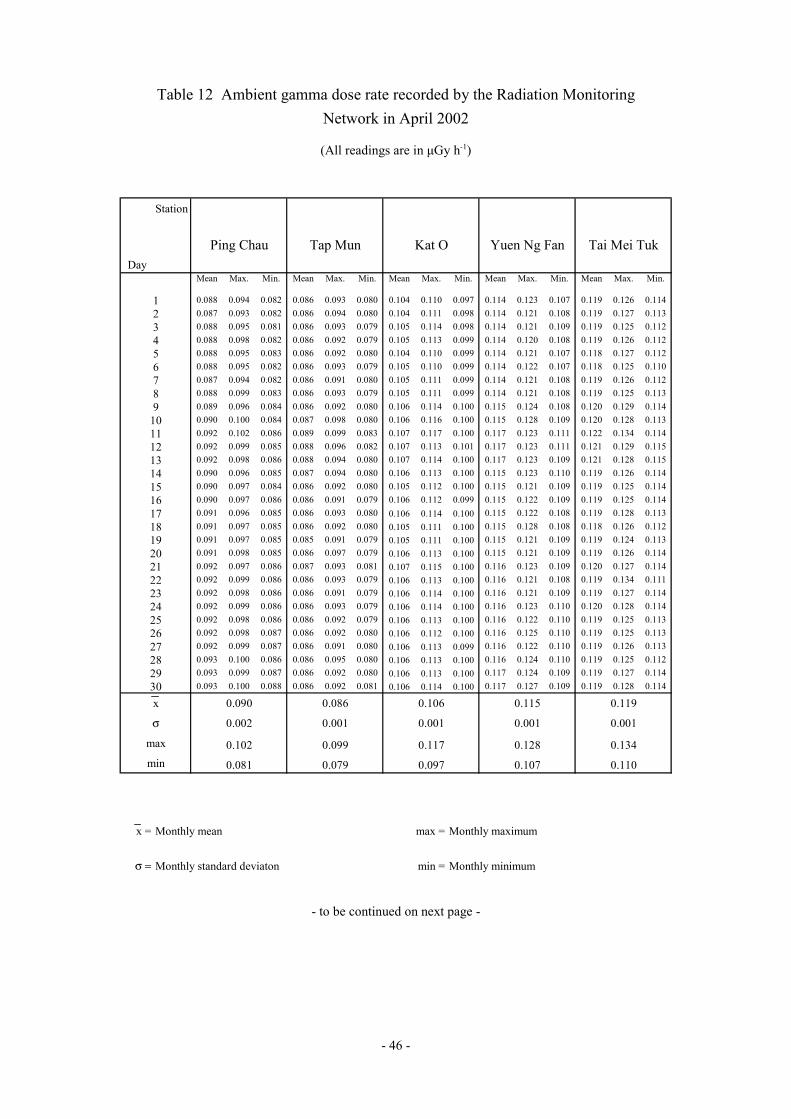
- 46 -
Table 12 Ambient gamma dose rate recorded by the Radiation MonitoringNetwork in April 2002
(All readings are in µGy h-1)
- to be continued on next page -
Station
Ping Chau Tap Mun Kat O Yuen Ng Fan Tai Mei TukDay
Mean Max. Min. Mean Max. Min. Mean Max. Min. Mean Max. Min. Mean Max. Min.
1 0.088 0.094 0.082 0.086 0.093 0.080 0.104 0.110 0.097 0.114 0.123 0.107 0.119 0.126 0.1142 0.087 0.093 0.082 0.086 0.094 0.080 0.104 0.111 0.098 0.114 0.121 0.108 0.119 0.127 0.1133 0.088 0.095 0.081 0.086 0.093 0.079 0.105 0.114 0.098 0.114 0.121 0.109 0.119 0.125 0.1124 0.088 0.098 0.082 0.086 0.092 0.079 0.105 0.113 0.099 0.114 0.120 0.108 0.119 0.126 0.1125 0.088 0.095 0.083 0.086 0.092 0.080 0.104 0.110 0.099 0.114 0.121 0.107 0.118 0.127 0.1126 0.088 0.095 0.082 0.086 0.093 0.079 0.105 0.110 0.099 0.114 0.122 0.107 0.118 0.125 0.1107 0.087 0.094 0.082 0.086 0.091 0.080 0.105 0.111 0.099 0.114 0.121 0.108 0.119 0.126 0.1128 0.088 0.099 0.083 0.086 0.093 0.079 0.105 0.111 0.099 0.114 0.121 0.108 0.119 0.125 0.1139 0.089 0.096 0.084 0.086 0.092 0.080 0.106 0.114 0.100 0.115 0.124 0.108 0.120 0.129 0.114
10 0.090 0.100 0.084 0.087 0.098 0.080 0.106 0.116 0.100 0.115 0.128 0.109 0.120 0.128 0.11311 0.092 0.102 0.086 0.089 0.099 0.083 0.107 0.117 0.100 0.117 0.123 0.111 0.122 0.134 0.11412 0.092 0.099 0.085 0.088 0.096 0.082 0.107 0.113 0.101 0.117 0.123 0.111 0.121 0.129 0.11513 0.092 0.098 0.086 0.088 0.094 0.080 0.107 0.114 0.100 0.117 0.123 0.109 0.121 0.128 0.11514 0.090 0.096 0.085 0.087 0.094 0.080 0.106 0.113 0.100 0.115 0.123 0.110 0.119 0.126 0.11415 0.090 0.097 0.084 0.086 0.092 0.080 0.105 0.112 0.100 0.115 0.121 0.109 0.119 0.125 0.11416 0.090 0.097 0.086 0.086 0.091 0.079 0.106 0.112 0.099 0.115 0.122 0.109 0.119 0.125 0.11417 0.091 0.096 0.085 0.086 0.093 0.080 0.106 0.114 0.100 0.115 0.122 0.108 0.119 0.128 0.11318 0.091 0.097 0.085 0.086 0.092 0.080 0.105 0.111 0.100 0.115 0.128 0.108 0.118 0.126 0.11219 0.091 0.097 0.085 0.085 0.091 0.079 0.105 0.111 0.100 0.115 0.121 0.109 0.119 0.124 0.11320 0.091 0.098 0.085 0.086 0.097 0.079 0.106 0.113 0.100 0.115 0.121 0.109 0.119 0.126 0.11421 0.092 0.097 0.086 0.087 0.093 0.081 0.107 0.115 0.100 0.116 0.123 0.109 0.120 0.127 0.11422 0.092 0.099 0.086 0.086 0.093 0.079 0.106 0.113 0.100 0.116 0.121 0.108 0.119 0.134 0.11123 0.092 0.098 0.086 0.086 0.091 0.079 0.106 0.114 0.100 0.116 0.121 0.109 0.119 0.127 0.11424 0.092 0.099 0.086 0.086 0.093 0.079 0.106 0.114 0.100 0.116 0.123 0.110 0.120 0.128 0.11425 0.092 0.098 0.086 0.086 0.092 0.079 0.106 0.113 0.100 0.116 0.122 0.110 0.119 0.125 0.11326 0.092 0.098 0.087 0.086 0.092 0.080 0.106 0.112 0.100 0.116 0.125 0.110 0.119 0.125 0.11327 0.092 0.099 0.087 0.086 0.091 0.080 0.106 0.113 0.099 0.116 0.122 0.110 0.119 0.126 0.11328 0.093 0.100 0.086 0.086 0.095 0.080 0.106 0.113 0.100 0.116 0.124 0.110 0.119 0.125 0.11229 0.093 0.099 0.087 0.086 0.092 0.080 0.106 0.113 0.100 0.117 0.124 0.109 0.119 0.127 0.11430 0.093 0.100 0.088 0.086 0.092 0.081 0.106 0.114 0.100 0.117 0.127 0.109 0.119 0.128 0.114
x 0.090 0.086 0.106 0.115 0.119
σ 0.002 0.001 0.001 0.001 0.001
max 0.102 0.099 0.117 0.128 0.134min 0.081 0.079 0.097 0.107 0.110
x = Monthly mean max = Monthly maximum
σ = Monthly standard deviaton min = Monthly minimum
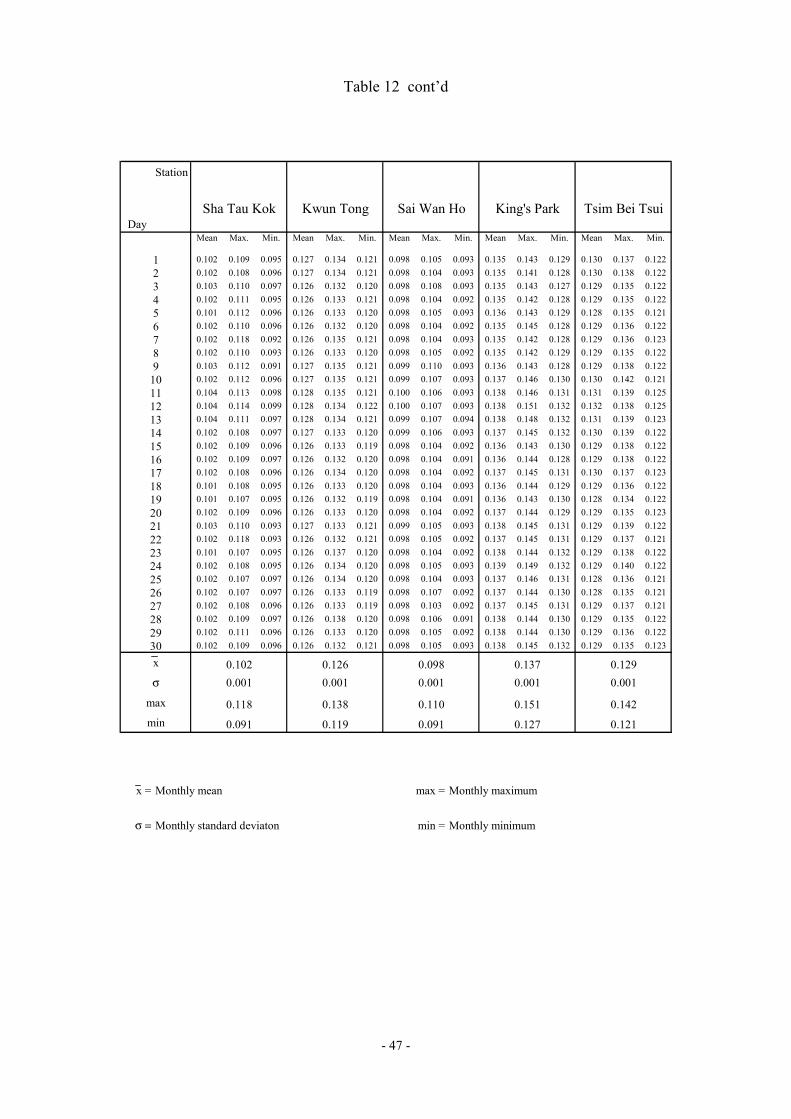
- 47 -
Table 12 cont’d
Station
Sha Tau Kok Kwun Tong Sai Wan Ho King's Park Tsim Bei TsuiDay
Mean Max. Min. Mean Max. Min. Mean Max. Min. Mean Max. Min. Mean Max. Min.
1 0.102 0.109 0.095 0.127 0.134 0.121 0.098 0.105 0.093 0.135 0.143 0.129 0.130 0.137 0.1222 0.102 0.108 0.096 0.127 0.134 0.121 0.098 0.104 0.093 0.135 0.141 0.128 0.130 0.138 0.1223 0.103 0.110 0.097 0.126 0.132 0.120 0.098 0.108 0.093 0.135 0.143 0.127 0.129 0.135 0.1224 0.102 0.111 0.095 0.126 0.133 0.121 0.098 0.104 0.092 0.135 0.142 0.128 0.129 0.135 0.1225 0.101 0.112 0.096 0.126 0.133 0.120 0.098 0.105 0.093 0.136 0.143 0.129 0.128 0.135 0.1216 0.102 0.110 0.096 0.126 0.132 0.120 0.098 0.104 0.092 0.135 0.145 0.128 0.129 0.136 0.1227 0.102 0.118 0.092 0.126 0.135 0.121 0.098 0.104 0.093 0.135 0.142 0.128 0.129 0.136 0.1238 0.102 0.110 0.093 0.126 0.133 0.120 0.098 0.105 0.092 0.135 0.142 0.129 0.129 0.135 0.1229 0.103 0.112 0.091 0.127 0.135 0.121 0.099 0.110 0.093 0.136 0.143 0.128 0.129 0.138 0.122
10 0.102 0.112 0.096 0.127 0.135 0.121 0.099 0.107 0.093 0.137 0.146 0.130 0.130 0.142 0.12111 0.104 0.113 0.098 0.128 0.135 0.121 0.100 0.106 0.093 0.138 0.146 0.131 0.131 0.139 0.12512 0.104 0.114 0.099 0.128 0.134 0.122 0.100 0.107 0.093 0.138 0.151 0.132 0.132 0.138 0.12513 0.104 0.111 0.097 0.128 0.134 0.121 0.099 0.107 0.094 0.138 0.148 0.132 0.131 0.139 0.12314 0.102 0.108 0.097 0.127 0.133 0.120 0.099 0.106 0.093 0.137 0.145 0.132 0.130 0.139 0.12215 0.102 0.109 0.096 0.126 0.133 0.119 0.098 0.104 0.092 0.136 0.143 0.130 0.129 0.138 0.12216 0.102 0.109 0.097 0.126 0.132 0.120 0.098 0.104 0.091 0.136 0.144 0.128 0.129 0.138 0.12217 0.102 0.108 0.096 0.126 0.134 0.120 0.098 0.104 0.092 0.137 0.145 0.131 0.130 0.137 0.12318 0.101 0.108 0.095 0.126 0.133 0.120 0.098 0.104 0.093 0.136 0.144 0.129 0.129 0.136 0.12219 0.101 0.107 0.095 0.126 0.132 0.119 0.098 0.104 0.091 0.136 0.143 0.130 0.128 0.134 0.12220 0.102 0.109 0.096 0.126 0.133 0.120 0.098 0.104 0.092 0.137 0.144 0.129 0.129 0.135 0.12321 0.103 0.110 0.093 0.127 0.133 0.121 0.099 0.105 0.093 0.138 0.145 0.131 0.129 0.139 0.12222 0.102 0.118 0.093 0.126 0.132 0.121 0.098 0.105 0.092 0.137 0.145 0.131 0.129 0.137 0.12123 0.101 0.107 0.095 0.126 0.137 0.120 0.098 0.104 0.092 0.138 0.144 0.132 0.129 0.138 0.12224 0.102 0.108 0.095 0.126 0.134 0.120 0.098 0.105 0.093 0.139 0.149 0.132 0.129 0.140 0.12225 0.102 0.107 0.097 0.126 0.134 0.120 0.098 0.104 0.093 0.137 0.146 0.131 0.128 0.136 0.12126 0.102 0.107 0.097 0.126 0.133 0.119 0.098 0.107 0.092 0.137 0.144 0.130 0.128 0.135 0.12127 0.102 0.108 0.096 0.126 0.133 0.119 0.098 0.103 0.092 0.137 0.145 0.131 0.129 0.137 0.12128 0.102 0.109 0.097 0.126 0.138 0.120 0.098 0.106 0.091 0.138 0.144 0.130 0.129 0.135 0.12229 0.102 0.111 0.096 0.126 0.133 0.120 0.098 0.105 0.092 0.138 0.144 0.130 0.129 0.136 0.12230 0.102 0.109 0.096 0.126 0.132 0.121 0.098 0.105 0.093 0.138 0.145 0.132 0.129 0.135 0.123
x 0.102 0.126 0.098 0.137 0.129σ 0.001 0.001 0.001 0.001 0.001
max 0.118 0.138 0.110 0.151 0.142min 0.091 0.119 0.091 0.127 0.121
x = Monthly mean max = Monthly maximum
σ = Monthly standard deviaton min = Monthly minimum

- 48 -
Table 13 Ambient gamma dose rate recorded by the Radiation MonitoringNetwork in May 2002
(All readings are in µGy h-1)
- to be continued on next page -
Station
Ping Chau Tap Mun Kat O Yuen Ng Fan Tai Mei TukDay
Mean Max. Min. Mean Max. Min. Mean Max. Min. Mean Max. Min. Mean Max. Min.
1 0.093 0.102 0.087 0.086 0.094 0.080 0.107 0.113 0.100 0.117 0.122 0.111 0.119 0.127 0.1132 0.093 0.099 0.087 0.086 0.092 0.080 0.106 0.114 0.101 0.117 0.123 0.111 0.119 0.128 0.1143 0.093 0.100 0.088 0.086 0.092 0.080 0.107 0.114 0.100 0.117 0.124 0.110 0.119 0.126 0.1144 0.094 0.100 0.088 0.086 0.092 0.081 0.107 0.113 0.100 0.117 0.123 0.111 0.119 0.126 0.1145 0.094 0.101 0.088 0.086 0.092 0.081 0.107 0.113 0.100 0.117 0.124 0.112 0.119 0.128 0.1136 0.094 0.100 0.087 0.086 0.093 0.079 0.104 0.113 0.098 0.116 0.123 0.108 0.119 0.125 0.1137 0.094 0.105 0.087 0.086 0.093 0.080 0.103 0.113 0.097 0.116 0.124 0.110 0.119 0.126 0.1128 0.094 0.100 0.087 0.086 0.095 0.079 0.103 0.113 0.097 0.116 0.122 0.111 0.119 0.125 0.1139 0.094 0.100 0.088 0.086 0.093 0.079 0.103 0.109 0.097 0.115 0.122 0.109 0.119 0.127 0.113
10 0.090 0.101 0.084 0.086 0.093 0.080 0.102 0.108 0.096 0.115 0.124 0.108 0.119 0.126 0.11211 0.090 0.103 0.083 0.086 0.094 0.079 0.103 0.124 0.096 0.114 0.124 0.107 0.119 0.128 0.11312 0.089 0.096 0.084 0.090 0.137 0.080 0.103 0.116 0.096 0.122 0.231 0.107 0.119 0.128 0.11213 0.089 0.097 0.082 0.086 0.093 0.080 0.102 0.108 0.096 0.114 0.120 0.107 0.118 0.125 0.11114 0.089 0.096 0.082 0.086 0.093 0.079 0.102 0.108 0.096 0.114 0.123 0.107 0.118 0.126 0.11215 0.089 0.098 0.082 0.087 0.094 0.082 0.103 0.111 0.096 0.115 0.121 0.107 0.120 0.127 0.11316 0.092 0.129 0.084 0.089 0.107 0.082 0.105 0.114 0.098 0.117 0.138 0.107 0.121 0.134 0.11417 0.091 0.117 0.082 0.089 0.107 0.081 0.103 0.114 0.096 0.117 0.136 0.107 0.121 0.136 0.11318 0.088 0.100 0.082 0.087 0.101 0.080 0.102 0.108 0.094 0.115 0.123 0.107 0.119 0.126 0.11219 0.094 0.116 0.083 0.089 0.104 0.080 0.103 0.114 0.094 0.120 0.140 0.108 0.121 0.132 0.11420 0.092 0.141 0.083 0.090 0.119 0.082 0.103 0.123 0.096 0.117 0.142 0.107 0.120 0.137 0.11221 0.093 0.114 0.084 0.087 0.104 0.080 0.101 0.112 0.093 0.114 0.138 0.107 0.118 0.126 0.11122 0.090 0.113 0.083 0.087 0.098 0.081 0.102 0.113 0.096 0.117 0.172 0.107 0.121 0.153 0.11323 0.092 0.114 0.083 0.089 0.099 0.082 0.104 0.120 0.095 0.119 0.157 0.110 0.121 0.129 0.11424 0.093 0.133 0.082 0.093 0.151 0.081 0.104 0.132 0.096 0.119 0.163 0.108 0.120 0.132 0.11425 0.087 0.095 0.080 0.086 0.093 0.080 0.102 0.117 0.095 0.114 0.120 0.108 0.119 0.126 0.11326 0.088 0.095 0.083 0.087 0.093 0.081 0.102 0.110 0.097 0.115 0.122 0.109 0.119 0.126 0.11327 0.087 0.094 0.081 0.086 0.092 0.081 0.102 0.108 0.096 0.114 0.122 0.108 0.119 0.126 0.11228 0.087 0.095 0.082 0.086 0.092 0.081 0.102 0.109 0.096 0.114 0.121 0.108 0.119 0.127 0.11329 0.088 0.095 0.082 0.086 0.092 0.080 0.103 0.109 0.096 0.115 0.121 0.108 0.119 0.127 0.11430 0.089 0.096 0.083 0.087 0.095 0.081 0.104 0.112 0.098 0.116 0.126 0.109 0.120 0.128 0.11331 0.090 0.096 0.085 0.087 0.094 0.082 0.104 0.114 0.099 0.116 0.123 0.108 0.120 0.129 0.114
x 0.091 0.087 0.103 0.116 0.119
σ 0.002 0.002 0.002 0.002 0.001
max 0.141 0.151 0.132 0.231 0.153min 0.080 0.079 0.093 0.107 0.111
x = Monthly mean max = Monthly maximum
σ = Monthly standard deviaton min = Monthly minimum
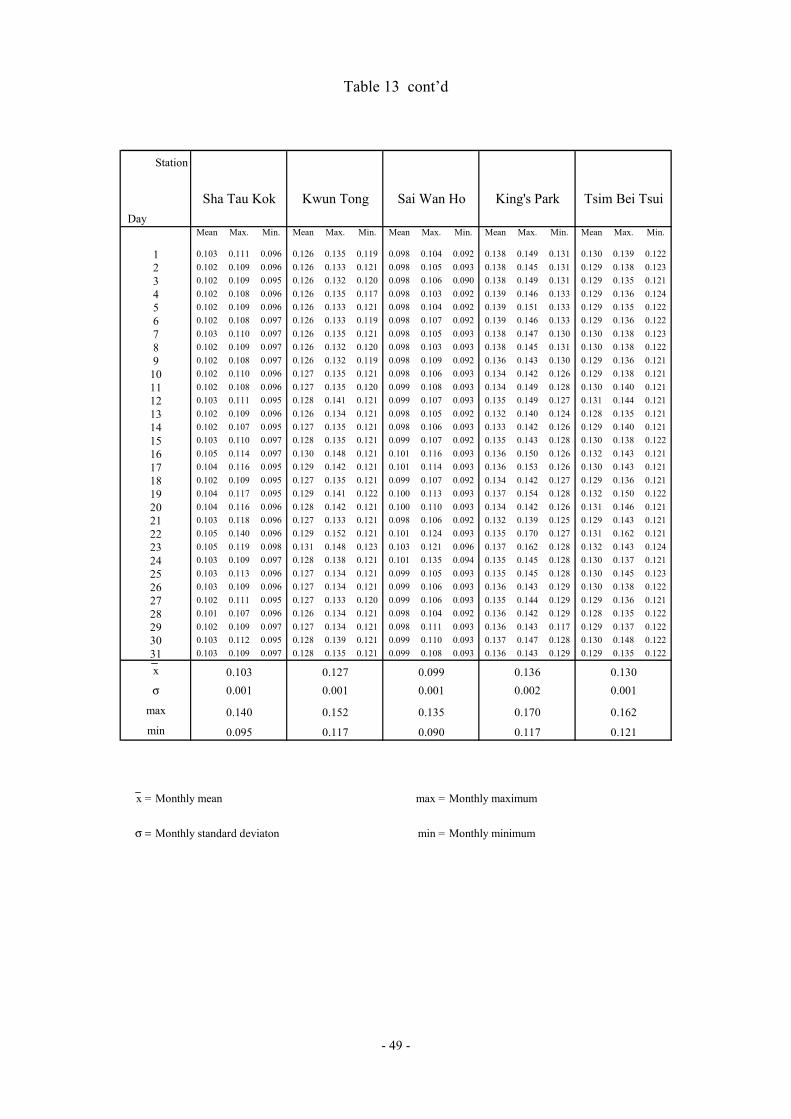
- 49 -
Table 13 cont’d
Station
Sha Tau Kok Kwun Tong Sai Wan Ho King's Park Tsim Bei TsuiDay
Mean Max. Min. Mean Max. Min. Mean Max. Min. Mean Max. Min. Mean Max. Min.
1 0.103 0.111 0.096 0.126 0.135 0.119 0.098 0.104 0.092 0.138 0.149 0.131 0.130 0.139 0.1222 0.102 0.109 0.096 0.126 0.133 0.121 0.098 0.105 0.093 0.138 0.145 0.131 0.129 0.138 0.1233 0.102 0.109 0.095 0.126 0.132 0.120 0.098 0.106 0.090 0.138 0.149 0.131 0.129 0.135 0.1214 0.102 0.108 0.096 0.126 0.135 0.117 0.098 0.103 0.092 0.139 0.146 0.133 0.129 0.136 0.1245 0.102 0.109 0.096 0.126 0.133 0.121 0.098 0.104 0.092 0.139 0.151 0.133 0.129 0.135 0.1226 0.102 0.108 0.097 0.126 0.133 0.119 0.098 0.107 0.092 0.139 0.146 0.133 0.129 0.136 0.1227 0.103 0.110 0.097 0.126 0.135 0.121 0.098 0.105 0.093 0.138 0.147 0.130 0.130 0.138 0.1238 0.102 0.109 0.097 0.126 0.132 0.120 0.098 0.103 0.093 0.138 0.145 0.131 0.130 0.138 0.1229 0.102 0.108 0.097 0.126 0.132 0.119 0.098 0.109 0.092 0.136 0.143 0.130 0.129 0.136 0.121
10 0.102 0.110 0.096 0.127 0.135 0.121 0.098 0.106 0.093 0.134 0.142 0.126 0.129 0.138 0.12111 0.102 0.108 0.096 0.127 0.135 0.120 0.099 0.108 0.093 0.134 0.149 0.128 0.130 0.140 0.12112 0.103 0.111 0.095 0.128 0.141 0.121 0.099 0.107 0.093 0.135 0.149 0.127 0.131 0.144 0.12113 0.102 0.109 0.096 0.126 0.134 0.121 0.098 0.105 0.092 0.132 0.140 0.124 0.128 0.135 0.12114 0.102 0.107 0.095 0.127 0.135 0.121 0.098 0.106 0.093 0.133 0.142 0.126 0.129 0.140 0.12115 0.103 0.110 0.097 0.128 0.135 0.121 0.099 0.107 0.092 0.135 0.143 0.128 0.130 0.138 0.12216 0.105 0.114 0.097 0.130 0.148 0.121 0.101 0.116 0.093 0.136 0.150 0.126 0.132 0.143 0.12117 0.104 0.116 0.095 0.129 0.142 0.121 0.101 0.114 0.093 0.136 0.153 0.126 0.130 0.143 0.12118 0.102 0.109 0.095 0.127 0.135 0.121 0.099 0.107 0.092 0.134 0.142 0.127 0.129 0.136 0.12119 0.104 0.117 0.095 0.129 0.141 0.122 0.100 0.113 0.093 0.137 0.154 0.128 0.132 0.150 0.12220 0.104 0.116 0.096 0.128 0.142 0.121 0.100 0.110 0.093 0.134 0.142 0.126 0.131 0.146 0.12121 0.103 0.118 0.096 0.127 0.133 0.121 0.098 0.106 0.092 0.132 0.139 0.125 0.129 0.143 0.12122 0.105 0.140 0.096 0.129 0.152 0.121 0.101 0.124 0.093 0.135 0.170 0.127 0.131 0.162 0.12123 0.105 0.119 0.098 0.131 0.148 0.123 0.103 0.121 0.096 0.137 0.162 0.128 0.132 0.143 0.12424 0.103 0.109 0.097 0.128 0.138 0.121 0.101 0.135 0.094 0.135 0.145 0.128 0.130 0.137 0.12125 0.103 0.113 0.096 0.127 0.134 0.121 0.099 0.105 0.093 0.135 0.145 0.128 0.130 0.145 0.12326 0.103 0.109 0.096 0.127 0.134 0.121 0.099 0.106 0.093 0.136 0.143 0.129 0.130 0.138 0.12227 0.102 0.111 0.095 0.127 0.133 0.120 0.099 0.106 0.093 0.135 0.144 0.129 0.129 0.136 0.12128 0.101 0.107 0.096 0.126 0.134 0.121 0.098 0.104 0.092 0.136 0.142 0.129 0.128 0.135 0.12229 0.102 0.109 0.097 0.127 0.134 0.121 0.098 0.111 0.093 0.136 0.143 0.117 0.129 0.137 0.12230 0.103 0.112 0.095 0.128 0.139 0.121 0.099 0.110 0.093 0.137 0.147 0.128 0.130 0.148 0.12231 0.103 0.109 0.097 0.128 0.135 0.121 0.099 0.108 0.093 0.136 0.143 0.129 0.129 0.135 0.122
x 0.103 0.127 0.099 0.136 0.130σ 0.001 0.001 0.001 0.002 0.001
max 0.140 0.152 0.135 0.170 0.162min 0.095 0.117 0.090 0.117 0.121
x = Monthly mean max = Monthly maximum
σ = Monthly standard deviaton min = Monthly minimum

- 50 -
Table 14 Ambient gamma dose rate recorded by the Radiation MonitoringNetwork in June 2002
(All readings are in µGy h -1)
- to be continued on next page -
Station
Ping Chau Tap Mun Kat O Yuen Ng Fan Tai Mei TukDay
Mean Max. Min. Mean Max. Min. Mean Max. Min. Mean Max. Min. Mean Max. Min.
1 0.090 0.096 0.083 0.088 0.094 0.080 0.105 0.110 0.099 0.116 0.125 0.109 0.120 0.128 0.1142 0.089 0.096 0.083 0.087 0.093 0.081 0.104 0.111 0.099 0.116 0.123 0.109 0.119 0.128 0.1143 0.089 0.097 0.084 0.086 0.093 0.082 0.104 0.112 0.099 0.116 0.122 0.109 0.119 0.127 0.1134 0.089 0.096 0.084 0.086 0.093 0.081 0.104 0.110 0.099 0.116 0.122 0.110 0.119 0.126 0.1135 0.090 0.098 0.084 0.086 0.094 0.079 0.104 0.113 0.099 0.115 0.122 0.107 0.119 0.128 0.1136 0.089 0.100 0.084 0.087 0.095 0.080 0.104 0.113 0.097 0.115 0.122 0.109 0.119 0.126 0.1147 0.089 0.096 0.082 0.087 0.092 0.081 0.104 0.111 0.098 0.116 0.123 0.109 0.119 0.126 0.1148 0.089 0.096 0.084 0.086 0.093 0.080 0.104 0.114 0.099 0.116 0.122 0.110 0.119 0.128 0.1149 0.090 0.100 0.083 0.087 0.097 0.079 0.104 0.113 0.097 0.116 0.126 0.107 0.119 0.128 0.113
10 0.087 0.099 0.081 0.086 0.093 0.080 0.102 0.109 0.095 0.114 0.121 0.107 0.118 0.125 0.11011 0.094 0.110 0.081 0.092 0.107 0.079 0.104 0.113 0.096 0.119 0.142 0.107 0.122 0.137 0.11112 0.088 0.096 0.082 0.087 0.093 0.080 0.101 0.109 0.095 0.114 0.124 0.100 0.118 0.125 0.11213 0.087 0.093 0.080 0.085 0.091 0.079 0.101 0.107 0.094 0.113 0.119 0.106 0.118 0.124 0.11114 0.087 0.093 0.080 0.085 0.092 0.080 0.101 0.109 0.095 0.113 0.119 0.107 0.118 0.125 0.11215 0.087 0.093 0.080 0.086 0.092 0.079 0.101 0.108 0.095 0.114 0.121 0.107 0.118 0.124 0.11216 0.086 0.095 0.080 0.086 0.092 0.079 0.101 0.108 0.094 0.114 0.121 0.107 0.117 0.124 0.11117 0.086 0.093 0.080 0.086 0.092 0.080 0.101 0.107 0.096 0.113 0.119 0.107 0.117 0.125 0.11118 0.086 0.093 0.079 0.085 0.092 0.079 0.102 0.110 0.096 0.113 0.119 0.107 0.118 0.124 0.11219 0.086 0.093 0.081 0.085 0.091 0.079 0.102 0.108 0.096 0.113 0.120 0.107 0.117 0.124 0.11220 0.086 0.093 0.079 0.085 0.091 0.080 0.101 0.107 0.095 0.112 0.120 0.107 0.117 0.125 0.11221 0.086 0.094 0.080 0.085 0.092 0.080 0.101 0.108 0.094 0.113 0.120 0.107 0.117 0.124 0.11122 0.086 0.092 0.079 0.085 0.092 0.080 0.101 0.108 0.095 0.113 0.120 0.107 0.117 0.124 0.11023 0.086 0.092 0.081 0.085 0.091 0.079 0.101 0.109 0.095 0.114 0.121 0.107 0.117 0.127 0.11224 0.086 0.093 0.081 0.085 0.092 0.079 0.102 0.109 0.097 0.114 0.120 0.108 0.118 0.124 0.11225 0.087 0.094 0.081 0.086 0.093 0.080 0.103 0.108 0.096 0.114 0.121 0.108 0.118 0.128 0.11226 0.088 0.095 0.081 0.086 0.093 0.081 0.104 0.110 0.098 0.115 0.121 0.108 0.119 0.125 0.11327 0.088 0.093 0.083 0.086 0.092 0.079 0.104 0.114 0.096 0.115 0.124 0.109 0.119 0.125 0.11328 0.088 0.096 0.083 0.086 0.094 0.080 0.104 0.111 0.098 0.115 0.123 0.110 0.119 0.126 0.11329 0.089 0.096 0.082 0.086 0.093 0.080 0.105 0.111 0.099 0.116 0.123 0.110 0.119 0.127 0.11330 0.089 0.097 0.084 0.086 0.093 0.081 0.105 0.114 0.099 0.116 0.127 0.109 0.119 0.126 0.114
x 0.088 0.086 0.103 0.115 0.118
σ 0.002 0.001 0.002 0.001 0.001
max 0.110 0.107 0.114 0.142 0.137min 0.079 0.079 0.094 0.100 0.110
x = Monthly mean max = Monthly maximum
σ = Monthly standard deviaton min = Monthly minimum
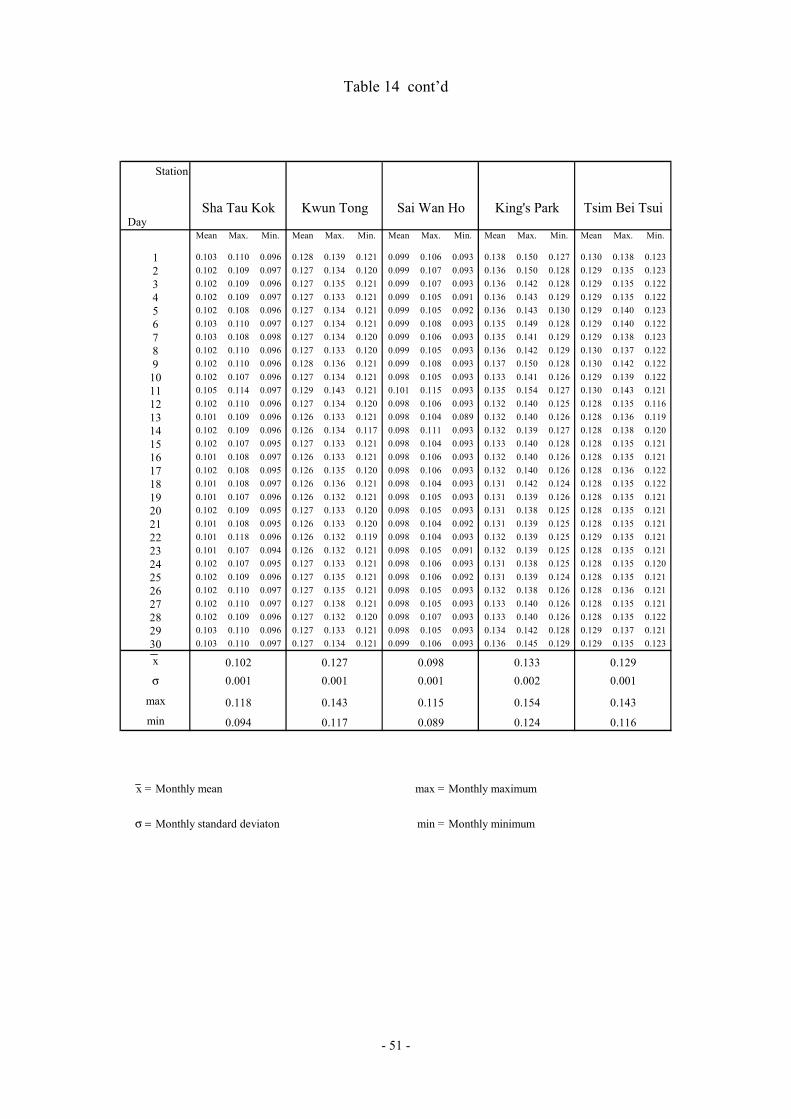
- 51 -
Table 14 cont’d
Station
Sha Tau Kok Kwun Tong Sai Wan Ho King's Park Tsim Bei TsuiDay
Mean Max. Min. Mean Max. Min. Mean Max. Min. Mean Max. Min. Mean Max. Min.
1 0.103 0.110 0.096 0.128 0.139 0.121 0.099 0.106 0.093 0.138 0.150 0.127 0.130 0.138 0.1232 0.102 0.109 0.097 0.127 0.134 0.120 0.099 0.107 0.093 0.136 0.150 0.128 0.129 0.135 0.1233 0.102 0.109 0.096 0.127 0.135 0.121 0.099 0.107 0.093 0.136 0.142 0.128 0.129 0.135 0.1224 0.102 0.109 0.097 0.127 0.133 0.121 0.099 0.105 0.091 0.136 0.143 0.129 0.129 0.135 0.1225 0.102 0.108 0.096 0.127 0.134 0.121 0.099 0.105 0.092 0.136 0.143 0.130 0.129 0.140 0.1236 0.103 0.110 0.097 0.127 0.134 0.121 0.099 0.108 0.093 0.135 0.149 0.128 0.129 0.140 0.1227 0.103 0.108 0.098 0.127 0.134 0.120 0.099 0.106 0.093 0.135 0.141 0.129 0.129 0.138 0.1238 0.102 0.110 0.096 0.127 0.133 0.120 0.099 0.105 0.093 0.136 0.142 0.129 0.130 0.137 0.1229 0.102 0.110 0.096 0.128 0.136 0.121 0.099 0.108 0.093 0.137 0.150 0.128 0.130 0.142 0.122
10 0.102 0.107 0.096 0.127 0.134 0.121 0.098 0.105 0.093 0.133 0.141 0.126 0.129 0.139 0.12211 0.105 0.114 0.097 0.129 0.143 0.121 0.101 0.115 0.093 0.135 0.154 0.127 0.130 0.143 0.12112 0.102 0.110 0.096 0.127 0.134 0.120 0.098 0.106 0.093 0.132 0.140 0.125 0.128 0.135 0.11613 0.101 0.109 0.096 0.126 0.133 0.121 0.098 0.104 0.089 0.132 0.140 0.126 0.128 0.136 0.11914 0.102 0.109 0.096 0.126 0.134 0.117 0.098 0.111 0.093 0.132 0.139 0.127 0.128 0.138 0.12015 0.102 0.107 0.095 0.127 0.133 0.121 0.098 0.104 0.093 0.133 0.140 0.128 0.128 0.135 0.12116 0.101 0.108 0.097 0.126 0.133 0.121 0.098 0.106 0.093 0.132 0.140 0.126 0.128 0.135 0.12117 0.102 0.108 0.095 0.126 0.135 0.120 0.098 0.106 0.093 0.132 0.140 0.126 0.128 0.136 0.12218 0.101 0.108 0.097 0.126 0.136 0.121 0.098 0.104 0.093 0.131 0.142 0.124 0.128 0.135 0.12219 0.101 0.107 0.096 0.126 0.132 0.121 0.098 0.105 0.093 0.131 0.139 0.126 0.128 0.135 0.12120 0.102 0.109 0.095 0.127 0.133 0.120 0.098 0.105 0.093 0.131 0.138 0.125 0.128 0.135 0.12121 0.101 0.108 0.095 0.126 0.133 0.120 0.098 0.104 0.092 0.131 0.139 0.125 0.128 0.135 0.12122 0.101 0.118 0.096 0.126 0.132 0.119 0.098 0.104 0.093 0.132 0.139 0.125 0.129 0.135 0.12123 0.101 0.107 0.094 0.126 0.132 0.121 0.098 0.105 0.091 0.132 0.139 0.125 0.128 0.135 0.12124 0.102 0.107 0.095 0.127 0.133 0.121 0.098 0.106 0.093 0.131 0.138 0.125 0.128 0.135 0.12025 0.102 0.109 0.096 0.127 0.135 0.121 0.098 0.106 0.092 0.131 0.139 0.124 0.128 0.135 0.12126 0.102 0.110 0.097 0.127 0.135 0.121 0.098 0.105 0.093 0.132 0.138 0.126 0.128 0.136 0.12127 0.102 0.110 0.097 0.127 0.138 0.121 0.098 0.105 0.093 0.133 0.140 0.126 0.128 0.135 0.12128 0.102 0.109 0.096 0.127 0.132 0.120 0.098 0.107 0.093 0.133 0.140 0.126 0.128 0.135 0.12229 0.103 0.110 0.096 0.127 0.133 0.121 0.098 0.105 0.093 0.134 0.142 0.128 0.129 0.137 0.12130 0.103 0.110 0.097 0.127 0.134 0.121 0.099 0.106 0.093 0.136 0.145 0.129 0.129 0.135 0.123
x 0.102 0.127 0.098 0.133 0.129σ 0.001 0.001 0.001 0.002 0.001
max 0.118 0.143 0.115 0.154 0.143min 0.094 0.117 0.089 0.124 0.116
x = Monthly mean max = Monthly maximum
σ = Monthly standard deviaton min = Monthly minimum
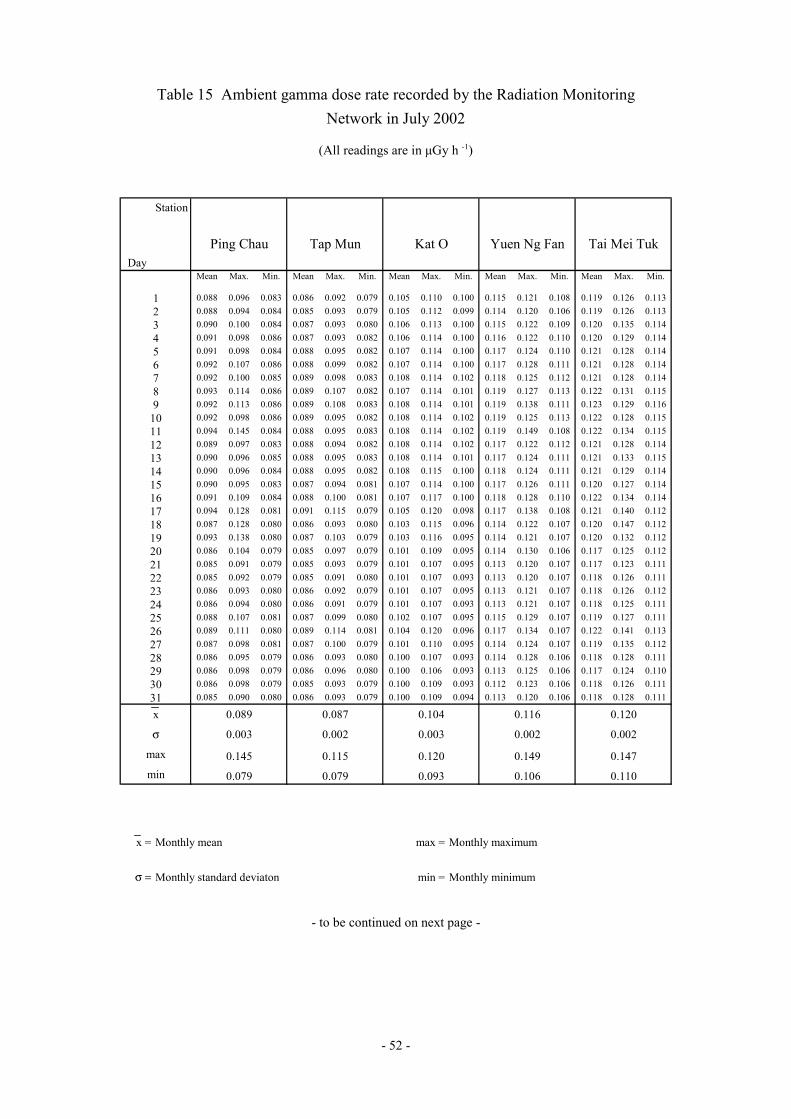
- 52 -
Table 15 Ambient gamma dose rate recorded by the Radiation MonitoringNetwork in July 2002
(All readings are in µGy h -1)
- to be continued on next page -
Station
Ping Chau Tap Mun Kat O Yuen Ng Fan Tai Mei TukDay
Mean Max. Min. Mean Max. Min. Mean Max. Min. Mean Max. Min. Mean Max. Min.
1 0.088 0.096 0.083 0.086 0.092 0.079 0.105 0.110 0.100 0.115 0.121 0.108 0.119 0.126 0.1132 0.088 0.094 0.084 0.085 0.093 0.079 0.105 0.112 0.099 0.114 0.120 0.106 0.119 0.126 0.1133 0.090 0.100 0.084 0.087 0.093 0.080 0.106 0.113 0.100 0.115 0.122 0.109 0.120 0.135 0.1144 0.091 0.098 0.086 0.087 0.093 0.082 0.106 0.114 0.100 0.116 0.122 0.110 0.120 0.129 0.1145 0.091 0.098 0.084 0.088 0.095 0.082 0.107 0.114 0.100 0.117 0.124 0.110 0.121 0.128 0.1146 0.092 0.107 0.086 0.088 0.099 0.082 0.107 0.114 0.100 0.117 0.128 0.111 0.121 0.128 0.1147 0.092 0.100 0.085 0.089 0.098 0.083 0.108 0.114 0.102 0.118 0.125 0.112 0.121 0.128 0.1148 0.093 0.114 0.086 0.089 0.107 0.082 0.107 0.114 0.101 0.119 0.127 0.113 0.122 0.131 0.1159 0.092 0.113 0.086 0.089 0.108 0.083 0.108 0.114 0.101 0.119 0.138 0.111 0.123 0.129 0.116
10 0.092 0.098 0.086 0.089 0.095 0.082 0.108 0.114 0.102 0.119 0.125 0.113 0.122 0.128 0.11511 0.094 0.145 0.084 0.088 0.095 0.083 0.108 0.114 0.102 0.119 0.149 0.108 0.122 0.134 0.11512 0.089 0.097 0.083 0.088 0.094 0.082 0.108 0.114 0.102 0.117 0.122 0.112 0.121 0.128 0.11413 0.090 0.096 0.085 0.088 0.095 0.083 0.108 0.114 0.101 0.117 0.124 0.111 0.121 0.133 0.11514 0.090 0.096 0.084 0.088 0.095 0.082 0.108 0.115 0.100 0.118 0.124 0.111 0.121 0.129 0.11415 0.090 0.095 0.083 0.087 0.094 0.081 0.107 0.114 0.100 0.117 0.126 0.111 0.120 0.127 0.11416 0.091 0.109 0.084 0.088 0.100 0.081 0.107 0.117 0.100 0.118 0.128 0.110 0.122 0.134 0.11417 0.094 0.128 0.081 0.091 0.115 0.079 0.105 0.120 0.098 0.117 0.138 0.108 0.121 0.140 0.11218 0.087 0.128 0.080 0.086 0.093 0.080 0.103 0.115 0.096 0.114 0.122 0.107 0.120 0.147 0.11219 0.093 0.138 0.080 0.087 0.103 0.079 0.103 0.116 0.095 0.114 0.121 0.107 0.120 0.132 0.11220 0.086 0.104 0.079 0.085 0.097 0.079 0.101 0.109 0.095 0.114 0.130 0.106 0.117 0.125 0.11221 0.085 0.091 0.079 0.085 0.093 0.079 0.101 0.107 0.095 0.113 0.120 0.107 0.117 0.123 0.11122 0.085 0.092 0.079 0.085 0.091 0.080 0.101 0.107 0.093 0.113 0.120 0.107 0.118 0.126 0.11123 0.086 0.093 0.080 0.086 0.092 0.079 0.101 0.107 0.095 0.113 0.121 0.107 0.118 0.126 0.11224 0.086 0.094 0.080 0.086 0.091 0.079 0.101 0.107 0.093 0.113 0.121 0.107 0.118 0.125 0.11125 0.088 0.107 0.081 0.087 0.099 0.080 0.102 0.107 0.095 0.115 0.129 0.107 0.119 0.127 0.11126 0.089 0.111 0.080 0.089 0.114 0.081 0.104 0.120 0.096 0.117 0.134 0.107 0.122 0.141 0.11327 0.087 0.098 0.081 0.087 0.100 0.079 0.101 0.110 0.095 0.114 0.124 0.107 0.119 0.135 0.11228 0.086 0.095 0.079 0.086 0.093 0.080 0.100 0.107 0.093 0.114 0.128 0.106 0.118 0.128 0.11129 0.086 0.098 0.079 0.086 0.096 0.080 0.100 0.106 0.093 0.113 0.125 0.106 0.117 0.124 0.11030 0.086 0.098 0.079 0.085 0.093 0.079 0.100 0.109 0.093 0.112 0.123 0.106 0.118 0.126 0.11131 0.085 0.090 0.080 0.086 0.093 0.079 0.100 0.109 0.094 0.113 0.120 0.106 0.118 0.128 0.111
x 0.089 0.087 0.104 0.116 0.120
σ 0.003 0.002 0.003 0.002 0.002
max 0.145 0.115 0.120 0.149 0.147min 0.079 0.079 0.093 0.106 0.110
x = Monthly mean max = Monthly maximum
σ = Monthly standard deviaton min = Monthly minimum
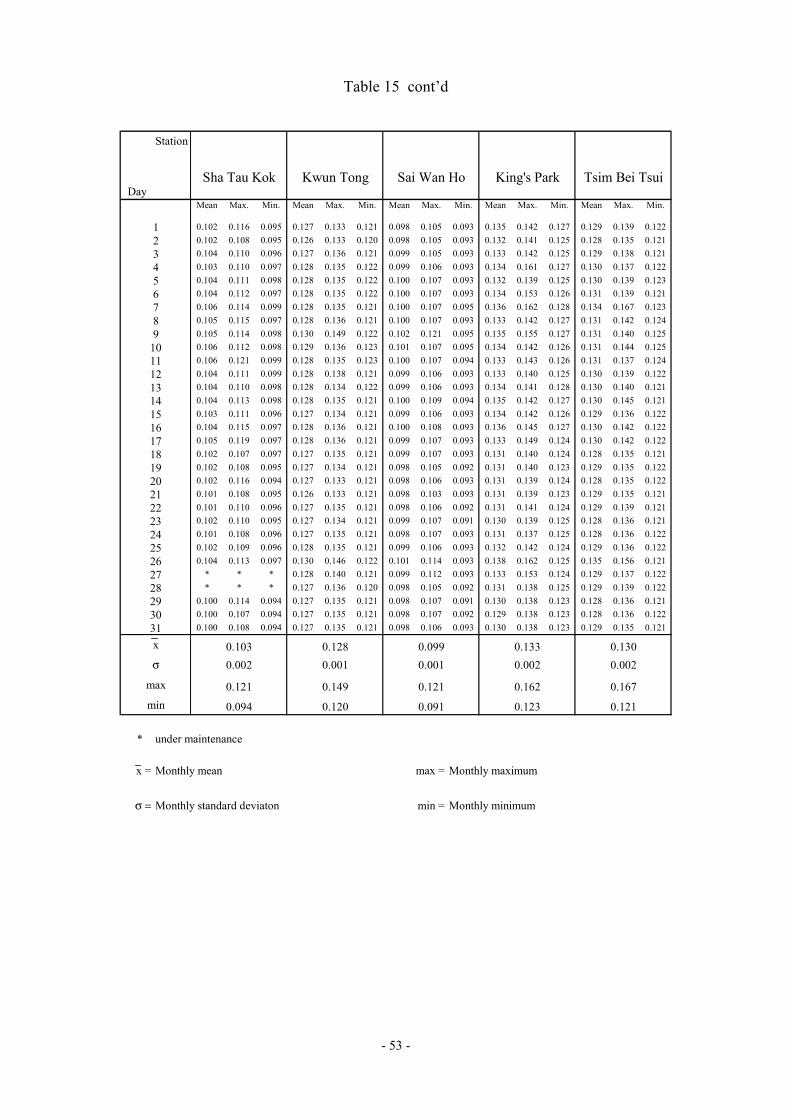
- 53 -
Table 15 cont’d
Station
Sha Tau Kok Kwun Tong Sai Wan Ho King's Park Tsim Bei TsuiDay
Mean Max. Min. Mean Max. Min. Mean Max. Min. Mean Max. Min. Mean Max. Min.
1 0.102 0.116 0.095 0.127 0.133 0.121 0.098 0.105 0.093 0.135 0.142 0.127 0.129 0.139 0.1222 0.102 0.108 0.095 0.126 0.133 0.120 0.098 0.105 0.093 0.132 0.141 0.125 0.128 0.135 0.1213 0.104 0.110 0.096 0.127 0.136 0.121 0.099 0.105 0.093 0.133 0.142 0.125 0.129 0.138 0.1214 0.103 0.110 0.097 0.128 0.135 0.122 0.099 0.106 0.093 0.134 0.161 0.127 0.130 0.137 0.1225 0.104 0.111 0.098 0.128 0.135 0.122 0.100 0.107 0.093 0.132 0.139 0.125 0.130 0.139 0.1236 0.104 0.112 0.097 0.128 0.135 0.122 0.100 0.107 0.093 0.134 0.153 0.126 0.131 0.139 0.1217 0.106 0.114 0.099 0.128 0.135 0.121 0.100 0.107 0.095 0.136 0.162 0.128 0.134 0.167 0.1238 0.105 0.115 0.097 0.128 0.136 0.121 0.100 0.107 0.093 0.133 0.142 0.127 0.131 0.142 0.1249 0.105 0.114 0.098 0.130 0.149 0.122 0.102 0.121 0.095 0.135 0.155 0.127 0.131 0.140 0.125
10 0.106 0.112 0.098 0.129 0.136 0.123 0.101 0.107 0.095 0.134 0.142 0.126 0.131 0.144 0.12511 0.106 0.121 0.099 0.128 0.135 0.123 0.100 0.107 0.094 0.133 0.143 0.126 0.131 0.137 0.12412 0.104 0.111 0.099 0.128 0.138 0.121 0.099 0.106 0.093 0.133 0.140 0.125 0.130 0.139 0.12213 0.104 0.110 0.098 0.128 0.134 0.122 0.099 0.106 0.093 0.134 0.141 0.128 0.130 0.140 0.12114 0.104 0.113 0.098 0.128 0.135 0.121 0.100 0.109 0.094 0.135 0.142 0.127 0.130 0.145 0.12115 0.103 0.111 0.096 0.127 0.134 0.121 0.099 0.106 0.093 0.134 0.142 0.126 0.129 0.136 0.12216 0.104 0.115 0.097 0.128 0.136 0.121 0.100 0.108 0.093 0.136 0.145 0.127 0.130 0.142 0.12217 0.105 0.119 0.097 0.128 0.136 0.121 0.099 0.107 0.093 0.133 0.149 0.124 0.130 0.142 0.12218 0.102 0.107 0.097 0.127 0.135 0.121 0.099 0.107 0.093 0.131 0.140 0.124 0.128 0.135 0.12119 0.102 0.108 0.095 0.127 0.134 0.121 0.098 0.105 0.092 0.131 0.140 0.123 0.129 0.135 0.12220 0.102 0.116 0.094 0.127 0.133 0.121 0.098 0.106 0.093 0.131 0.139 0.124 0.128 0.135 0.12221 0.101 0.108 0.095 0.126 0.133 0.121 0.098 0.103 0.093 0.131 0.139 0.123 0.129 0.135 0.12122 0.101 0.110 0.096 0.127 0.135 0.121 0.098 0.106 0.092 0.131 0.141 0.124 0.129 0.139 0.12123 0.102 0.110 0.095 0.127 0.134 0.121 0.099 0.107 0.091 0.130 0.139 0.125 0.128 0.136 0.12124 0.101 0.108 0.096 0.127 0.135 0.121 0.098 0.107 0.093 0.131 0.137 0.125 0.128 0.136 0.12225 0.102 0.109 0.096 0.128 0.135 0.121 0.099 0.106 0.093 0.132 0.142 0.124 0.129 0.136 0.12226 0.104 0.113 0.097 0.130 0.146 0.122 0.101 0.114 0.093 0.138 0.162 0.125 0.135 0.156 0.12127 * * * 0.128 0.140 0.121 0.099 0.112 0.093 0.133 0.153 0.124 0.129 0.137 0.12228 * * * 0.127 0.136 0.120 0.098 0.105 0.092 0.131 0.138 0.125 0.129 0.139 0.12229 0.100 0.114 0.094 0.127 0.135 0.121 0.098 0.107 0.091 0.130 0.138 0.123 0.128 0.136 0.12130 0.100 0.107 0.094 0.127 0.135 0.121 0.098 0.107 0.092 0.129 0.138 0.123 0.128 0.136 0.12231 0.100 0.108 0.094 0.127 0.135 0.121 0.098 0.106 0.093 0.130 0.138 0.123 0.129 0.135 0.121
x 0.103 0.128 0.099 0.133 0.130σ 0.002 0.001 0.001 0.002 0.002
max 0.121 0.149 0.121 0.162 0.167min 0.094 0.120 0.091 0.123 0.121
* under maintenance
x = Monthly mean max = Monthly maximum
σ = Monthly standard deviaton min = Monthly minimum
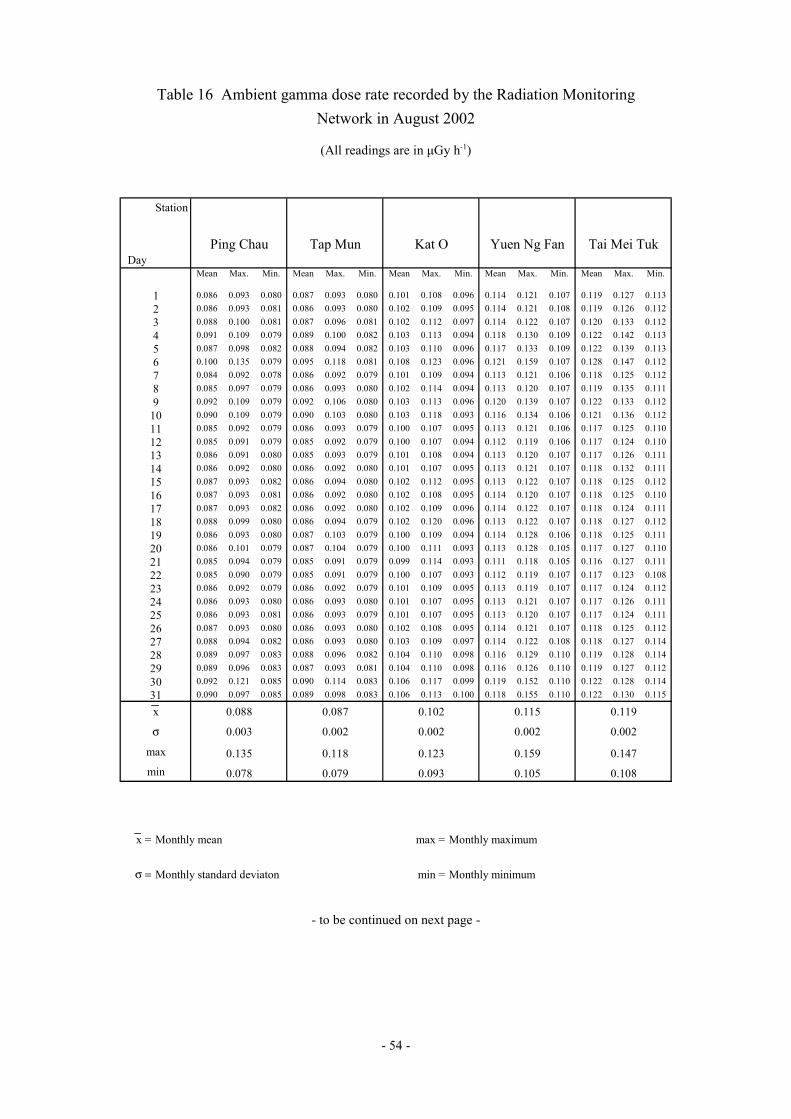
- 54 -
Table 16 Ambient gamma dose rate recorded by the Radiation MonitoringNetwork in August 2002
(All readings are in µGy h-1)
- to be continued on next page -
Station
Ping Chau Tap Mun Kat O Yuen Ng Fan Tai Mei TukDay
Mean Max. Min. Mean Max. Min. Mean Max. Min. Mean Max. Min. Mean Max. Min.
1 0.086 0.093 0.080 0.087 0.093 0.080 0.101 0.108 0.096 0.114 0.121 0.107 0.119 0.127 0.1132 0.086 0.093 0.081 0.086 0.093 0.080 0.102 0.109 0.095 0.114 0.121 0.108 0.119 0.126 0.1123 0.088 0.100 0.081 0.087 0.096 0.081 0.102 0.112 0.097 0.114 0.122 0.107 0.120 0.133 0.1124 0.091 0.109 0.079 0.089 0.100 0.082 0.103 0.113 0.094 0.118 0.130 0.109 0.122 0.142 0.1135 0.087 0.098 0.082 0.088 0.094 0.082 0.103 0.110 0.096 0.117 0.133 0.109 0.122 0.139 0.1136 0.100 0.135 0.079 0.095 0.118 0.081 0.108 0.123 0.096 0.121 0.159 0.107 0.128 0.147 0.1127 0.084 0.092 0.078 0.086 0.092 0.079 0.101 0.109 0.094 0.113 0.121 0.106 0.118 0.125 0.1128 0.085 0.097 0.079 0.086 0.093 0.080 0.102 0.114 0.094 0.113 0.120 0.107 0.119 0.135 0.1119 0.092 0.109 0.079 0.092 0.106 0.080 0.103 0.113 0.096 0.120 0.139 0.107 0.122 0.133 0.112
10 0.090 0.109 0.079 0.090 0.103 0.080 0.103 0.118 0.093 0.116 0.134 0.106 0.121 0.136 0.11211 0.085 0.092 0.079 0.086 0.093 0.079 0.100 0.107 0.095 0.113 0.121 0.106 0.117 0.125 0.11012 0.085 0.091 0.079 0.085 0.092 0.079 0.100 0.107 0.094 0.112 0.119 0.106 0.117 0.124 0.11013 0.086 0.091 0.080 0.085 0.093 0.079 0.101 0.108 0.094 0.113 0.120 0.107 0.117 0.126 0.11114 0.086 0.092 0.080 0.086 0.092 0.080 0.101 0.107 0.095 0.113 0.121 0.107 0.118 0.132 0.11115 0.087 0.093 0.082 0.086 0.094 0.080 0.102 0.112 0.095 0.113 0.122 0.107 0.118 0.125 0.11216 0.087 0.093 0.081 0.086 0.092 0.080 0.102 0.108 0.095 0.114 0.120 0.107 0.118 0.125 0.11017 0.087 0.093 0.082 0.086 0.092 0.080 0.102 0.109 0.096 0.114 0.122 0.107 0.118 0.124 0.11118 0.088 0.099 0.080 0.086 0.094 0.079 0.102 0.120 0.096 0.113 0.122 0.107 0.118 0.127 0.11219 0.086 0.093 0.080 0.087 0.103 0.079 0.100 0.109 0.094 0.114 0.128 0.106 0.118 0.125 0.11120 0.086 0.101 0.079 0.087 0.104 0.079 0.100 0.111 0.093 0.113 0.128 0.105 0.117 0.127 0.11021 0.085 0.094 0.079 0.085 0.091 0.079 0.099 0.114 0.093 0.111 0.118 0.105 0.116 0.127 0.11122 0.085 0.090 0.079 0.085 0.091 0.079 0.100 0.107 0.093 0.112 0.119 0.107 0.117 0.123 0.10823 0.086 0.092 0.079 0.086 0.092 0.079 0.101 0.109 0.095 0.113 0.119 0.107 0.117 0.124 0.11224 0.086 0.093 0.080 0.086 0.093 0.080 0.101 0.107 0.095 0.113 0.121 0.107 0.117 0.126 0.11125 0.086 0.093 0.081 0.086 0.093 0.079 0.101 0.107 0.095 0.113 0.120 0.107 0.117 0.124 0.11126 0.087 0.093 0.080 0.086 0.093 0.080 0.102 0.108 0.095 0.114 0.121 0.107 0.118 0.125 0.11227 0.088 0.094 0.082 0.086 0.093 0.080 0.103 0.109 0.097 0.114 0.122 0.108 0.118 0.127 0.11428 0.089 0.097 0.083 0.088 0.096 0.082 0.104 0.110 0.098 0.116 0.129 0.110 0.119 0.128 0.11429 0.089 0.096 0.083 0.087 0.093 0.081 0.104 0.110 0.098 0.116 0.126 0.110 0.119 0.127 0.11230 0.092 0.121 0.085 0.090 0.114 0.083 0.106 0.117 0.099 0.119 0.152 0.110 0.122 0.128 0.11431 0.090 0.097 0.085 0.089 0.098 0.083 0.106 0.113 0.100 0.118 0.155 0.110 0.122 0.130 0.115
x 0.088 0.087 0.102 0.115 0.119
σ 0.003 0.002 0.002 0.002 0.002
max 0.135 0.118 0.123 0.159 0.147min 0.078 0.079 0.093 0.105 0.108
x = Monthly mean max = Monthly maximum
σ = Monthly standard deviaton min = Monthly minimum

- 55 -
Table 16 cont’d
Station
Sha Tau Kok Kwun Tong Sai Wan Ho King's Park Tsim Bei TsuiDay
Mean Max. Min. Mean Max. Min. Mean Max. Min. Mean Max. Min. Mean Max. Min.
1 0.101 0.107 0.095 0.128 0.134 0.121 0.099 0.106 0.091 0.131 0.140 0.123 0.130 0.138 0.1232 0.102 0.107 0.095 0.128 0.135 0.120 0.099 0.106 0.093 0.131 0.139 0.124 0.132 0.149 0.1213 0.102 0.113 0.095 0.128 0.135 0.122 0.100 0.106 0.093 0.132 0.146 0.125 0.131 0.142 0.1224 0.103 0.115 0.095 0.131 0.141 0.122 0.102 0.113 0.094 0.135 0.149 0.126 0.131 0.142 0.1235 0.103 0.114 0.097 0.131 0.147 0.123 0.102 0.115 0.093 0.136 0.154 0.126 0.132 0.143 0.1246 0.109 0.128 0.096 0.131 0.156 0.121 0.102 0.123 0.093 0.136 0.166 0.124 0.135 0.156 0.1227 0.100 0.107 0.094 0.127 0.133 0.121 0.099 0.107 0.093 0.130 0.140 0.124 0.129 0.136 0.1228 0.103 0.117 0.095 0.127 0.133 0.120 0.098 0.108 0.091 0.130 0.137 0.122 0.131 0.149 0.1229 0.105 0.119 0.096 0.132 0.144 0.122 0.103 0.116 0.093 0.138 0.156 0.124 0.132 0.147 0.121
10 0.104 0.117 0.096 0.130 0.143 0.121 0.101 0.114 0.093 0.133 0.147 0.125 0.131 0.149 0.12311 0.100 0.107 0.093 0.127 0.143 0.120 0.098 0.104 0.091 0.130 0.146 0.122 0.129 0.136 0.12112 0.100 0.107 0.093 0.126 0.135 0.121 0.098 0.104 0.093 0.130 0.137 0.122 0.128 0.137 0.12113 0.100 0.107 0.093 0.127 0.134 0.121 0.098 0.104 0.092 0.131 0.137 0.124 0.129 0.135 0.12114 0.100 0.107 0.094 0.127 0.133 0.121 0.098 0.105 0.093 0.132 0.138 0.125 0.129 0.136 0.12215 0.101 0.108 0.094 0.127 0.134 0.121 0.099 0.106 0.092 0.133 0.142 0.125 0.129 0.135 0.12216 0.100 0.106 0.094 0.127 0.135 0.121 0.098 0.106 0.092 0.133 0.140 0.127 0.129 0.135 0.12117 0.100 0.107 0.094 0.127 0.132 0.121 0.098 0.105 0.093 0.134 0.142 0.128 0.129 0.135 0.12218 0.101 0.108 0.095 0.128 0.136 0.121 0.099 0.107 0.093 0.133 0.142 0.126 0.128 0.135 0.12119 0.101 0.108 0.094 0.127 0.134 0.121 0.098 0.107 0.090 0.130 0.139 0.123 0.128 0.137 0.12120 0.100 0.110 0.093 0.127 0.136 0.121 0.098 0.105 0.093 0.131 0.143 0.125 0.128 0.137 0.12121 0.099 0.108 0.093 0.126 0.133 0.120 0.098 0.103 0.091 0.129 0.135 0.123 0.128 0.135 0.12022 0.100 0.106 0.094 0.126 0.133 0.119 0.098 0.105 0.092 0.130 0.137 0.121 0.128 0.136 0.12123 0.100 0.107 0.093 0.126 0.133 0.120 0.098 0.104 0.092 0.130 0.137 0.123 0.128 0.135 0.12124 0.100 0.107 0.093 0.126 0.135 0.121 0.098 0.103 0.093 0.131 0.139 0.126 0.128 0.135 0.12125 0.100 0.107 0.094 0.126 0.132 0.121 0.098 0.105 0.093 0.132 0.139 0.126 0.128 0.135 0.12126 0.101 0.107 0.095 0.126 0.132 0.120 0.098 0.104 0.092 0.132 0.139 0.127 0.128 0.138 0.12127 0.101 0.107 0.094 0.127 0.133 0.121 0.098 0.109 0.093 0.133 0.140 0.124 0.129 0.136 0.12128 0.102 0.108 0.094 0.127 0.135 0.121 0.099 0.105 0.093 0.133 0.146 0.125 0.130 0.138 0.12229 0.101 0.109 0.096 0.128 0.134 0.121 0.099 0.107 0.093 0.134 0.142 0.128 0.130 0.144 0.12230 0.105 0.128 0.097 0.131 0.162 0.122 0.101 0.119 0.095 0.136 0.149 0.129 0.132 0.138 0.12531 0.103 0.111 0.097 0.129 0.136 0.123 0.100 0.107 0.094 0.137 0.144 0.130 0.132 0.147 0.126
x 0.102 0.128 0.099 0.132 0.130σ 0.002 0.002 0.002 0.002 0.002
max 0.128 0.162 0.123 0.166 0.156min 0.093 0.119 0.090 0.121 0.120
x = Monthly mean max = Monthly maximum
σ = Monthly standard deviaton min = Monthly minimum
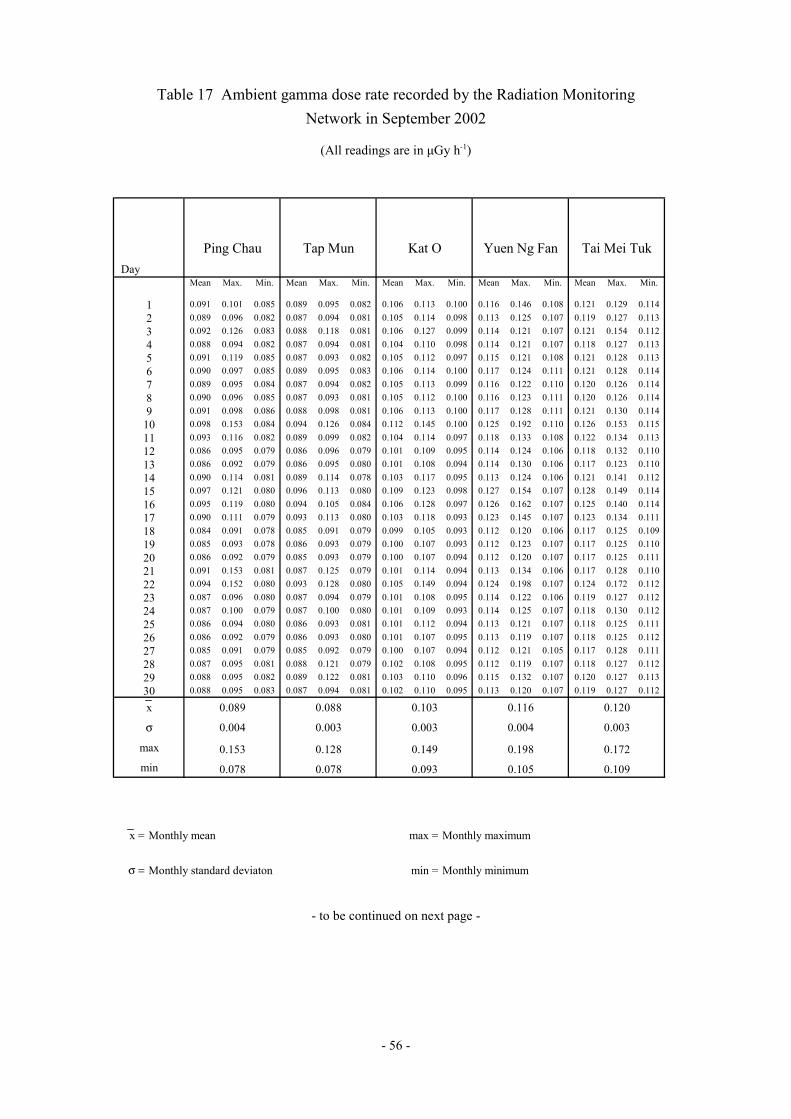
- 56 -
Table 17 Ambient gamma dose rate recorded by the Radiation MonitoringNetwork in September 2002
(All readings are in µGy h-1)
- to be continued on next page -
Ping Chau Tap Mun Kat O Yuen Ng Fan Tai Mei TukDay
Mean Max. Min. Mean Max. Min. Mean Max. Min. Mean Max. Min. Mean Max. Min.
1 0.091 0.101 0.085 0.089 0.095 0.082 0.106 0.113 0.100 0.116 0.146 0.108 0.121 0.129 0.1142 0.089 0.096 0.082 0.087 0.094 0.081 0.105 0.114 0.098 0.113 0.125 0.107 0.119 0.127 0.1133 0.092 0.126 0.083 0.088 0.118 0.081 0.106 0.127 0.099 0.114 0.121 0.107 0.121 0.154 0.1124 0.088 0.094 0.082 0.087 0.094 0.081 0.104 0.110 0.098 0.114 0.121 0.107 0.118 0.127 0.1135 0.091 0.119 0.085 0.087 0.093 0.082 0.105 0.112 0.097 0.115 0.121 0.108 0.121 0.128 0.1136 0.090 0.097 0.085 0.089 0.095 0.083 0.106 0.114 0.100 0.117 0.124 0.111 0.121 0.128 0.1147 0.089 0.095 0.084 0.087 0.094 0.082 0.105 0.113 0.099 0.116 0.122 0.110 0.120 0.126 0.1148 0.090 0.096 0.085 0.087 0.093 0.081 0.105 0.112 0.100 0.116 0.123 0.111 0.120 0.126 0.1149 0.091 0.098 0.086 0.088 0.098 0.081 0.106 0.113 0.100 0.117 0.128 0.111 0.121 0.130 0.114
10 0.098 0.153 0.084 0.094 0.126 0.084 0.112 0.145 0.100 0.125 0.192 0.110 0.126 0.153 0.11511 0.093 0.116 0.082 0.089 0.099 0.082 0.104 0.114 0.097 0.118 0.133 0.108 0.122 0.134 0.11312 0.086 0.095 0.079 0.086 0.096 0.079 0.101 0.109 0.095 0.114 0.124 0.106 0.118 0.132 0.11013 0.086 0.092 0.079 0.086 0.095 0.080 0.101 0.108 0.094 0.114 0.130 0.106 0.117 0.123 0.11014 0.090 0.114 0.081 0.089 0.114 0.078 0.103 0.117 0.095 0.113 0.124 0.106 0.121 0.141 0.11215 0.097 0.121 0.080 0.096 0.113 0.080 0.109 0.123 0.098 0.127 0.154 0.107 0.128 0.149 0.11416 0.095 0.119 0.080 0.094 0.105 0.084 0.106 0.128 0.097 0.126 0.162 0.107 0.125 0.140 0.11417 0.090 0.111 0.079 0.093 0.113 0.080 0.103 0.118 0.093 0.123 0.145 0.107 0.123 0.134 0.11118 0.084 0.091 0.078 0.085 0.091 0.079 0.099 0.105 0.093 0.112 0.120 0.106 0.117 0.125 0.10919 0.085 0.093 0.078 0.086 0.093 0.079 0.100 0.107 0.093 0.112 0.123 0.107 0.117 0.125 0.11020 0.086 0.092 0.079 0.085 0.093 0.079 0.100 0.107 0.094 0.112 0.120 0.107 0.117 0.125 0.11121 0.091 0.153 0.081 0.087 0.125 0.079 0.101 0.114 0.094 0.113 0.134 0.106 0.117 0.128 0.11022 0.094 0.152 0.080 0.093 0.128 0.080 0.105 0.149 0.094 0.124 0.198 0.107 0.124 0.172 0.11223 0.087 0.096 0.080 0.087 0.094 0.079 0.101 0.108 0.095 0.114 0.122 0.106 0.119 0.127 0.11224 0.087 0.100 0.079 0.087 0.100 0.080 0.101 0.109 0.093 0.114 0.125 0.107 0.118 0.130 0.11225 0.086 0.094 0.080 0.086 0.093 0.081 0.101 0.112 0.094 0.113 0.121 0.107 0.118 0.125 0.11126 0.086 0.092 0.079 0.086 0.093 0.080 0.101 0.107 0.095 0.113 0.119 0.107 0.118 0.125 0.11227 0.085 0.091 0.079 0.085 0.092 0.079 0.100 0.107 0.094 0.112 0.121 0.105 0.117 0.128 0.11128 0.087 0.095 0.081 0.088 0.121 0.079 0.102 0.108 0.095 0.112 0.119 0.107 0.118 0.127 0.11229 0.088 0.095 0.082 0.089 0.122 0.081 0.103 0.110 0.096 0.115 0.132 0.107 0.120 0.127 0.11330 0.088 0.095 0.083 0.087 0.094 0.081 0.102 0.110 0.095 0.113 0.120 0.107 0.119 0.127 0.112
x 0.089 0.088 0.103 0.116 0.120
σ 0.004 0.003 0.003 0.004 0.003
max 0.153 0.128 0.149 0.198 0.172min 0.078 0.078 0.093 0.105 0.109
x = Monthly mean max = Monthly maximum
σ = Monthly standard deviaton min = Monthly minimum
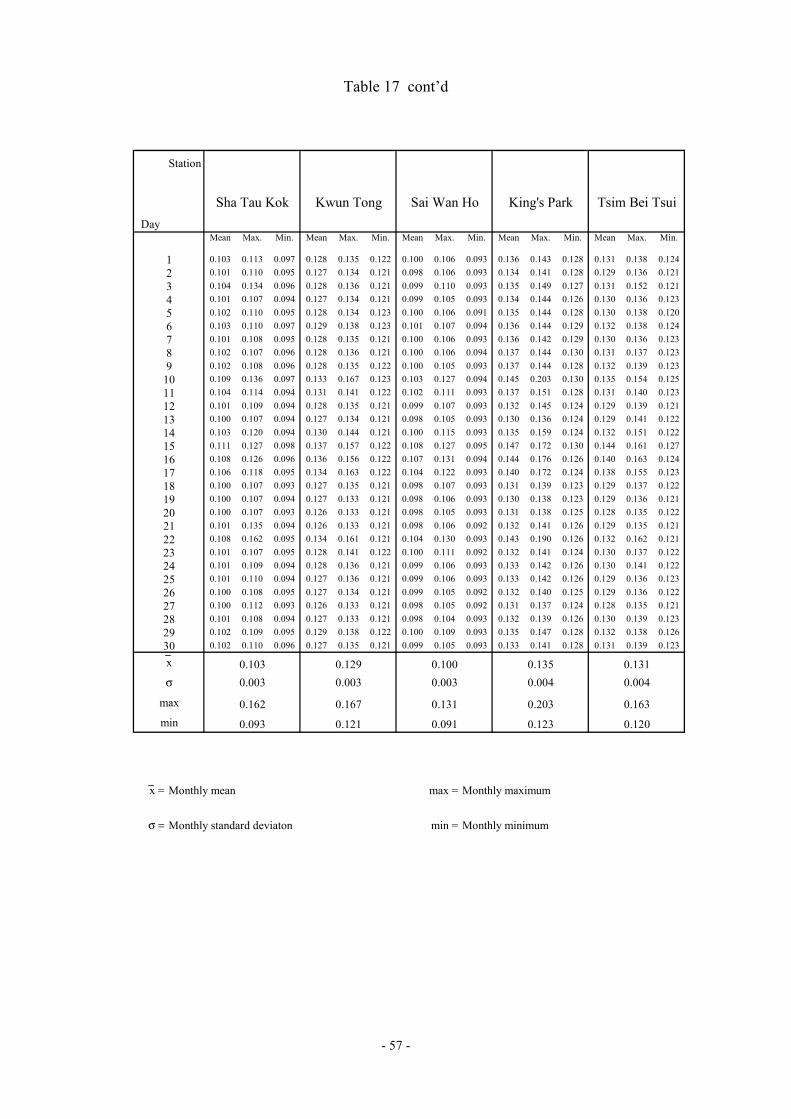
- 57 -
Table 17 cont’d
Station
Sha Tau Kok Kwun Tong Sai Wan Ho King's Park Tsim Bei TsuiDay
Mean Max. Min. Mean Max. Min. Mean Max. Min. Mean Max. Min. Mean Max. Min.
1 0.103 0.113 0.097 0.128 0.135 0.122 0.100 0.106 0.093 0.136 0.143 0.128 0.131 0.138 0.1242 0.101 0.110 0.095 0.127 0.134 0.121 0.098 0.106 0.093 0.134 0.141 0.128 0.129 0.136 0.1213 0.104 0.134 0.096 0.128 0.136 0.121 0.099 0.110 0.093 0.135 0.149 0.127 0.131 0.152 0.1214 0.101 0.107 0.094 0.127 0.134 0.121 0.099 0.105 0.093 0.134 0.144 0.126 0.130 0.136 0.1235 0.102 0.110 0.095 0.128 0.134 0.123 0.100 0.106 0.091 0.135 0.144 0.128 0.130 0.138 0.1206 0.103 0.110 0.097 0.129 0.138 0.123 0.101 0.107 0.094 0.136 0.144 0.129 0.132 0.138 0.1247 0.101 0.108 0.095 0.128 0.135 0.121 0.100 0.106 0.093 0.136 0.142 0.129 0.130 0.136 0.1238 0.102 0.107 0.096 0.128 0.136 0.121 0.100 0.106 0.094 0.137 0.144 0.130 0.131 0.137 0.1239 0.102 0.108 0.096 0.128 0.135 0.122 0.100 0.105 0.093 0.137 0.144 0.128 0.132 0.139 0.123
10 0.109 0.136 0.097 0.133 0.167 0.123 0.103 0.127 0.094 0.145 0.203 0.130 0.135 0.154 0.12511 0.104 0.114 0.094 0.131 0.141 0.122 0.102 0.111 0.093 0.137 0.151 0.128 0.131 0.140 0.12312 0.101 0.109 0.094 0.128 0.135 0.121 0.099 0.107 0.093 0.132 0.145 0.124 0.129 0.139 0.12113 0.100 0.107 0.094 0.127 0.134 0.121 0.098 0.105 0.093 0.130 0.136 0.124 0.129 0.141 0.12214 0.103 0.120 0.094 0.130 0.144 0.121 0.100 0.115 0.093 0.135 0.159 0.124 0.132 0.151 0.12215 0.111 0.127 0.098 0.137 0.157 0.122 0.108 0.127 0.095 0.147 0.172 0.130 0.144 0.161 0.12716 0.108 0.126 0.096 0.136 0.156 0.122 0.107 0.131 0.094 0.144 0.176 0.126 0.140 0.163 0.12417 0.106 0.118 0.095 0.134 0.163 0.122 0.104 0.122 0.093 0.140 0.172 0.124 0.138 0.155 0.12318 0.100 0.107 0.093 0.127 0.135 0.121 0.098 0.107 0.093 0.131 0.139 0.123 0.129 0.137 0.12219 0.100 0.107 0.094 0.127 0.133 0.121 0.098 0.106 0.093 0.130 0.138 0.123 0.129 0.136 0.12120 0.100 0.107 0.093 0.126 0.133 0.121 0.098 0.105 0.093 0.131 0.138 0.125 0.128 0.135 0.12221 0.101 0.135 0.094 0.126 0.133 0.121 0.098 0.106 0.092 0.132 0.141 0.126 0.129 0.135 0.12122 0.108 0.162 0.095 0.134 0.161 0.121 0.104 0.130 0.093 0.143 0.190 0.126 0.132 0.162 0.12123 0.101 0.107 0.095 0.128 0.141 0.122 0.100 0.111 0.092 0.132 0.141 0.124 0.130 0.137 0.12224 0.101 0.109 0.094 0.128 0.136 0.121 0.099 0.106 0.093 0.133 0.142 0.126 0.130 0.141 0.12225 0.101 0.110 0.094 0.127 0.136 0.121 0.099 0.106 0.093 0.133 0.142 0.126 0.129 0.136 0.12326 0.100 0.108 0.095 0.127 0.134 0.121 0.099 0.105 0.092 0.132 0.140 0.125 0.129 0.136 0.12227 0.100 0.112 0.093 0.126 0.133 0.121 0.098 0.105 0.092 0.131 0.137 0.124 0.128 0.135 0.12128 0.101 0.108 0.094 0.127 0.133 0.121 0.098 0.104 0.093 0.132 0.139 0.126 0.130 0.139 0.12329 0.102 0.109 0.095 0.129 0.138 0.122 0.100 0.109 0.093 0.135 0.147 0.128 0.132 0.138 0.12630 0.102 0.110 0.096 0.127 0.135 0.121 0.099 0.105 0.093 0.133 0.141 0.128 0.131 0.139 0.123
x 0.103 0.129 0.100 0.135 0.131σ 0.003 0.003 0.003 0.004 0.004
max 0.162 0.167 0.131 0.203 0.163min 0.093 0.121 0.091 0.123 0.120
x = Monthly mean max = Monthly maximum
σ = Monthly standard deviaton min = Monthly minimum
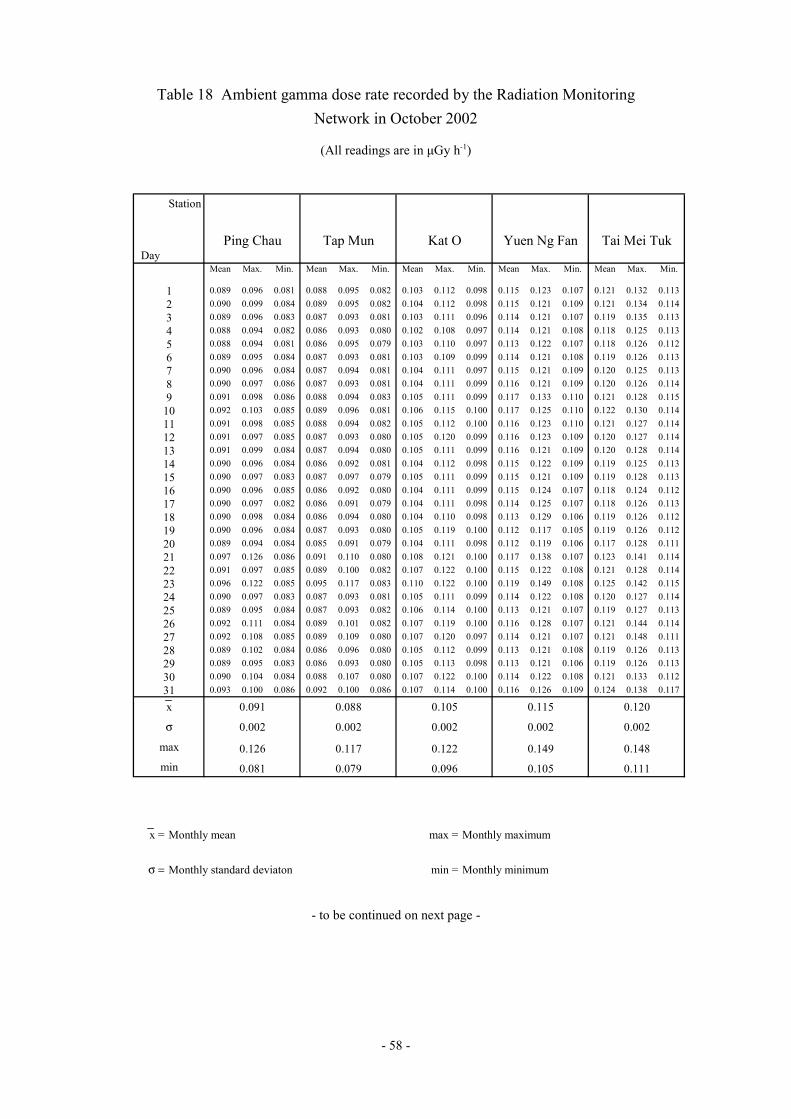
- 58 -
Table 18 Ambient gamma dose rate recorded by the Radiation MonitoringNetwork in October 2002
(All readings are in µGy h-1)
- to be continued on next page -
Station
Ping Chau Tap Mun Kat O Yuen Ng Fan Tai Mei TukDay
Mean Max. Min. Mean Max. Min. Mean Max. Min. Mean Max. Min. Mean Max. Min.
1 0.089 0.096 0.081 0.088 0.095 0.082 0.103 0.112 0.098 0.115 0.123 0.107 0.121 0.132 0.1132 0.090 0.099 0.084 0.089 0.095 0.082 0.104 0.112 0.098 0.115 0.121 0.109 0.121 0.134 0.1143 0.089 0.096 0.083 0.087 0.093 0.081 0.103 0.111 0.096 0.114 0.121 0.107 0.119 0.135 0.1134 0.088 0.094 0.082 0.086 0.093 0.080 0.102 0.108 0.097 0.114 0.121 0.108 0.118 0.125 0.1135 0.088 0.094 0.081 0.086 0.095 0.079 0.103 0.110 0.097 0.113 0.122 0.107 0.118 0.126 0.1126 0.089 0.095 0.084 0.087 0.093 0.081 0.103 0.109 0.099 0.114 0.121 0.108 0.119 0.126 0.1137 0.090 0.096 0.084 0.087 0.094 0.081 0.104 0.111 0.097 0.115 0.121 0.109 0.120 0.125 0.1138 0.090 0.097 0.086 0.087 0.093 0.081 0.104 0.111 0.099 0.116 0.121 0.109 0.120 0.126 0.1149 0.091 0.098 0.086 0.088 0.094 0.083 0.105 0.111 0.099 0.117 0.133 0.110 0.121 0.128 0.115
10 0.092 0.103 0.085 0.089 0.096 0.081 0.106 0.115 0.100 0.117 0.125 0.110 0.122 0.130 0.11411 0.091 0.098 0.085 0.088 0.094 0.082 0.105 0.112 0.100 0.116 0.123 0.110 0.121 0.127 0.11412 0.091 0.097 0.085 0.087 0.093 0.080 0.105 0.120 0.099 0.116 0.123 0.109 0.120 0.127 0.11413 0.091 0.099 0.084 0.087 0.094 0.080 0.105 0.111 0.099 0.116 0.121 0.109 0.120 0.128 0.11414 0.090 0.096 0.084 0.086 0.092 0.081 0.104 0.112 0.098 0.115 0.122 0.109 0.119 0.125 0.11315 0.090 0.097 0.083 0.087 0.097 0.079 0.105 0.111 0.099 0.115 0.121 0.109 0.119 0.128 0.11316 0.090 0.096 0.085 0.086 0.092 0.080 0.104 0.111 0.099 0.115 0.124 0.107 0.118 0.124 0.11217 0.090 0.097 0.082 0.086 0.091 0.079 0.104 0.111 0.098 0.114 0.125 0.107 0.118 0.126 0.11318 0.090 0.098 0.084 0.086 0.094 0.080 0.104 0.110 0.098 0.113 0.129 0.106 0.119 0.126 0.11219 0.090 0.096 0.084 0.087 0.093 0.080 0.105 0.119 0.100 0.112 0.117 0.105 0.119 0.126 0.11220 0.089 0.094 0.084 0.085 0.091 0.079 0.104 0.111 0.098 0.112 0.119 0.106 0.117 0.128 0.11121 0.097 0.126 0.086 0.091 0.110 0.080 0.108 0.121 0.100 0.117 0.138 0.107 0.123 0.141 0.11422 0.091 0.097 0.085 0.089 0.100 0.082 0.107 0.122 0.100 0.115 0.122 0.108 0.121 0.128 0.11423 0.096 0.122 0.085 0.095 0.117 0.083 0.110 0.122 0.100 0.119 0.149 0.108 0.125 0.142 0.11524 0.090 0.097 0.083 0.087 0.093 0.081 0.105 0.111 0.099 0.114 0.122 0.108 0.120 0.127 0.11425 0.089 0.095 0.084 0.087 0.093 0.082 0.106 0.114 0.100 0.113 0.121 0.107 0.119 0.127 0.11326 0.092 0.111 0.084 0.089 0.101 0.082 0.107 0.119 0.100 0.116 0.128 0.107 0.121 0.144 0.11427 0.092 0.108 0.085 0.089 0.109 0.080 0.107 0.120 0.097 0.114 0.121 0.107 0.121 0.148 0.11128 0.089 0.102 0.084 0.086 0.096 0.080 0.105 0.112 0.099 0.113 0.121 0.108 0.119 0.126 0.11329 0.089 0.095 0.083 0.086 0.093 0.080 0.105 0.113 0.098 0.113 0.121 0.106 0.119 0.126 0.11330 0.090 0.104 0.084 0.088 0.107 0.080 0.107 0.122 0.100 0.114 0.122 0.108 0.121 0.133 0.11231 0.093 0.100 0.086 0.092 0.100 0.086 0.107 0.114 0.100 0.116 0.126 0.109 0.124 0.138 0.117
x 0.091 0.088 0.105 0.115 0.120
σ 0.002 0.002 0.002 0.002 0.002
max 0.126 0.117 0.122 0.149 0.148min 0.081 0.079 0.096 0.105 0.111
x = Monthly mean max = Monthly maximum
σ = Monthly standard deviaton min = Monthly minimum

- 59 -
Table 18 cont’d
Station
Sha Tau Kok Kwun Tong Sai Wan Ho King's Park Tsim Bei TsuiDay
Mean Max. Min. Mean Max. Min. Mean Max. Min. Mean Max. Min. Mean Max. Min.
1 0.103 0.109 0.096 0.129 0.144 0.121 0.101 0.119 0.093 0.138 0.197 0.127 0.132 0.139 0.1252 0.103 0.110 0.097 0.129 0.135 0.122 0.100 0.107 0.094 0.134 0.141 0.128 0.132 0.139 0.1243 0.102 0.109 0.096 0.128 0.134 0.122 0.099 0.106 0.093 0.133 0.141 0.126 0.131 0.137 0.1224 0.101 0.107 0.095 0.127 0.135 0.121 0.099 0.105 0.093 0.132 0.139 0.126 0.129 0.135 0.1215 0.101 0.108 0.094 0.127 0.132 0.121 0.098 0.104 0.092 0.132 0.138 0.126 0.129 0.137 0.1236 0.101 0.107 0.095 0.127 0.136 0.121 0.099 0.105 0.093 0.134 0.143 0.128 0.130 0.136 0.1227 0.101 0.108 0.095 0.128 0.135 0.122 0.099 0.105 0.094 0.136 0.144 0.128 0.130 0.137 0.1228 0.102 0.108 0.095 0.127 0.135 0.121 0.099 0.106 0.093 0.136 0.143 0.130 0.130 0.136 0.1249 0.102 0.108 0.096 0.128 0.135 0.121 0.100 0.107 0.093 0.137 0.143 0.129 0.131 0.138 0.122
10 0.103 0.116 0.096 0.128 0.135 0.122 0.100 0.107 0.093 0.137 0.146 0.131 0.132 0.139 0.12511 0.102 0.111 0.096 0.127 0.134 0.121 0.099 0.109 0.093 0.136 0.142 0.130 0.132 0.139 0.12412 0.102 0.109 0.094 0.127 0.134 0.121 0.099 0.106 0.093 0.136 0.143 0.130 0.131 0.138 0.12313 0.102 0.108 0.096 0.127 0.134 0.121 0.099 0.106 0.093 0.137 0.144 0.130 0.130 0.137 0.12414 0.101 0.106 0.095 0.127 0.135 0.121 0.098 0.104 0.093 0.136 0.143 0.130 0.129 0.135 0.12315 0.101 0.107 0.095 0.127 0.135 0.121 0.098 0.104 0.093 0.135 0.142 0.128 0.130 0.136 0.12316 0.100 0.107 0.095 0.126 0.134 0.120 0.098 0.107 0.093 0.135 0.142 0.127 0.129 0.136 0.12317 0.100 0.107 0.094 0.126 0.144 0.121 0.098 0.106 0.092 0.135 0.142 0.128 0.129 0.135 0.12318 0.101 0.110 0.096 0.128 0.140 0.121 0.099 0.108 0.093 0.133 0.142 0.124 0.129 0.135 0.12219 0.102 0.108 0.094 0.127 0.136 0.121 0.098 0.105 0.093 0.130 0.142 0.123 0.130 0.138 0.12120 0.100 0.114 0.093 0.126 0.134 0.120 0.098 0.108 0.092 0.130 0.139 0.123 0.129 0.136 0.12221 0.106 0.123 0.098 0.130 0.148 0.121 0.102 0.117 0.093 0.138 0.164 0.125 0.135 0.161 0.12022 0.104 0.115 0.097 0.128 0.135 0.122 0.100 0.107 0.094 0.135 0.146 0.128 0.133 0.143 0.12523 0.108 0.127 0.096 0.131 0.148 0.124 0.103 0.119 0.095 0.140 0.162 0.128 0.136 0.155 0.12424 0.102 0.112 0.096 0.128 0.134 0.122 0.100 0.107 0.094 0.134 0.142 0.128 0.130 0.138 0.12325 0.102 0.112 0.096 0.127 0.135 0.120 0.099 0.105 0.093 0.133 0.152 0.126 0.131 0.138 0.12326 0.103 0.113 0.097 0.129 0.140 0.122 0.101 0.109 0.091 0.136 0.147 0.128 0.132 0.138 0.12427 0.103 0.119 0.096 0.128 0.140 0.121 0.100 0.105 0.094 0.136 0.153 0.129 0.131 0.142 0.12128 0.101 0.107 0.095 0.127 0.135 0.121 0.099 0.106 0.093 0.134 0.142 0.127 0.129 0.135 0.12329 0.101 0.108 0.095 0.127 0.135 0.121 0.099 0.105 0.093 0.134 0.140 0.127 0.129 0.136 0.12230 0.104 0.119 0.096 0.129 0.138 0.121 0.101 0.114 0.094 0.141 0.162 0.127 0.132 0.149 0.12231 0.106 0.118 0.100 0.129 0.135 0.121 0.101 0.109 0.093 0.137 0.152 0.128 0.136 0.149 0.126
x 0.102 0.128 0.099 0.135 0.131σ 0.002 0.001 0.001 0.002 0.002
max 0.127 0.148 0.119 0.197 0.161min 0.093 0.120 0.091 0.123 0.120
x = Monthly mean max = Monthly maximum
σ = Monthly standard deviaton min = Monthly minimum

- 60 -
Table 19 Ambient gamma dose rate recorded by the Radiation MonitoringNetwork in November 2002
(All readings are in µGy h-1)
- to be continued on next page -
Station
Ping Chau Tap Mun Kat O Yuen Ng Fan Tai Mei TukDay
Mean Max. Min. Mean Max. Min. Mean Max. Min. Mean Max. Min. Mean Max. Min.
1 0.092 0.100 0.085 0.089 0.095 0.083 0.105 0.116 0.099 0.115 0.122 0.109 0.120 0.128 0.1132 0.091 0.097 0.086 0.087 0.093 0.081 0.104 0.110 0.097 0.114 0.122 0.107 0.119 0.126 0.1123 0.091 0.098 0.086 0.087 0.094 0.081 0.104 0.110 0.098 0.114 0.122 0.108 0.119 0.126 0.1124 0.091 0.098 0.086 0.087 0.093 0.081 0.105 0.112 0.099 0.115 0.121 0.108 0.119 0.126 0.1135 0.092 0.098 0.086 0.087 0.095 0.081 0.105 0.112 0.097 0.115 0.121 0.107 0.119 0.127 0.1136 0.091 0.099 0.086 0.086 0.094 0.080 0.105 0.111 0.099 0.114 0.121 0.107 0.118 0.125 0.1127 0.093 0.099 0.086 0.089 0.095 0.082 0.107 0.113 0.100 0.116 0.128 0.110 0.121 0.128 0.1148 0.094 0.100 0.088 0.090 0.097 0.085 0.108 0.116 0.101 0.118 0.128 0.109 0.122 0.129 0.1159 0.092 0.100 0.086 0.087 0.095 0.081 0.106 0.115 0.100 0.115 0.123 0.107 0.120 0.128 0.112
10 0.091 0.097 0.086 0.087 0.093 0.081 0.105 0.112 0.098 0.115 0.121 0.110 0.119 0.126 0.11111 0.091 0.097 0.086 0.087 0.093 0.081 0.106 0.114 0.100 0.115 0.122 0.108 0.118 0.125 0.11312 0.092 0.099 0.086 0.087 0.093 0.081 0.106 0.113 0.099 0.115 0.121 0.108 0.119 0.128 0.11413 0.093 0.100 0.086 0.088 0.095 0.082 0.107 0.114 0.100 0.116 0.123 0.109 0.120 0.128 0.11414 0.092 0.100 0.086 0.087 0.093 0.082 0.106 0.113 0.100 0.116 0.123 0.110 0.119 0.127 0.11215 0.091 0.101 0.085 0.086 0.092 0.080 0.106 0.112 0.100 0.115 0.121 0.108 0.118 0.125 0.11316 0.095 0.130 0.085 0.090 0.112 0.082 0.107 0.124 0.099 0.119 0.143 0.109 0.121 0.142 0.11317 0.091 0.097 0.086 0.088 0.101 0.082 0.106 0.115 0.100 0.116 0.124 0.109 0.120 0.127 0.11318 0.092 0.100 0.087 0.089 0.095 0.083 0.107 0.114 0.101 0.117 0.124 0.111 0.121 0.128 0.11419 0.092 0.109 0.084 0.089 0.100 0.082 0.107 0.112 0.100 0.116 0.128 0.108 0.121 0.128 0.11520 0.091 0.098 0.084 0.088 0.094 0.083 0.107 0.115 0.100 0.116 0.122 0.106 0.121 0.132 0.11421 0.092 0.097 0.086 0.089 0.095 0.083 0.107 0.114 0.100 0.117 0.125 0.110 0.121 0.128 0.11322 0.092 0.106 0.086 0.089 0.094 0.083 0.107 0.114 0.100 0.117 0.131 0.111 0.122 0.128 0.11623 0.093 0.103 0.087 0.090 0.097 0.085 0.108 0.115 0.101 0.118 0.126 0.112 0.123 0.132 0.11724 0.093 0.104 0.087 0.089 0.098 0.082 0.108 0.116 0.100 0.118 0.124 0.110 0.122 0.133 0.11425 0.092 0.098 0.086 0.088 0.096 0.082 0.106 0.113 0.100 0.117 0.123 0.110 0.121 0.127 0.11426 0.092 0.100 0.086 0.088 0.093 0.083 0.107 0.114 0.101 0.117 0.123 0.110 0.120 0.127 0.11327 0.094 0.104 0.088 0.089 0.097 0.083 0.108 0.116 0.101 0.118 0.125 0.112 0.122 0.130 0.11628 0.096 0.114 0.085 0.092 0.106 0.082 0.109 0.118 0.102 0.120 0.135 0.109 0.124 0.136 0.11429 0.091 0.097 0.082 0.087 0.094 0.081 0.107 0.118 0.100 0.115 0.122 0.109 0.120 0.127 0.11430 0.093 0.105 0.085 0.089 0.099 0.081 0.108 0.116 0.100 0.116 0.130 0.109 0.121 0.132 0.113
x 0.092 0.088 0.106 0.116 0.120
σ 0.001 0.001 0.001 0.002 0.001
max 0.130 0.112 0.124 0.143 0.142min 0.082 0.080 0.097 0.106 0.111
x = Monthly mean max = Monthly maximum
σ = Monthly standard deviaton min = Monthly minimum
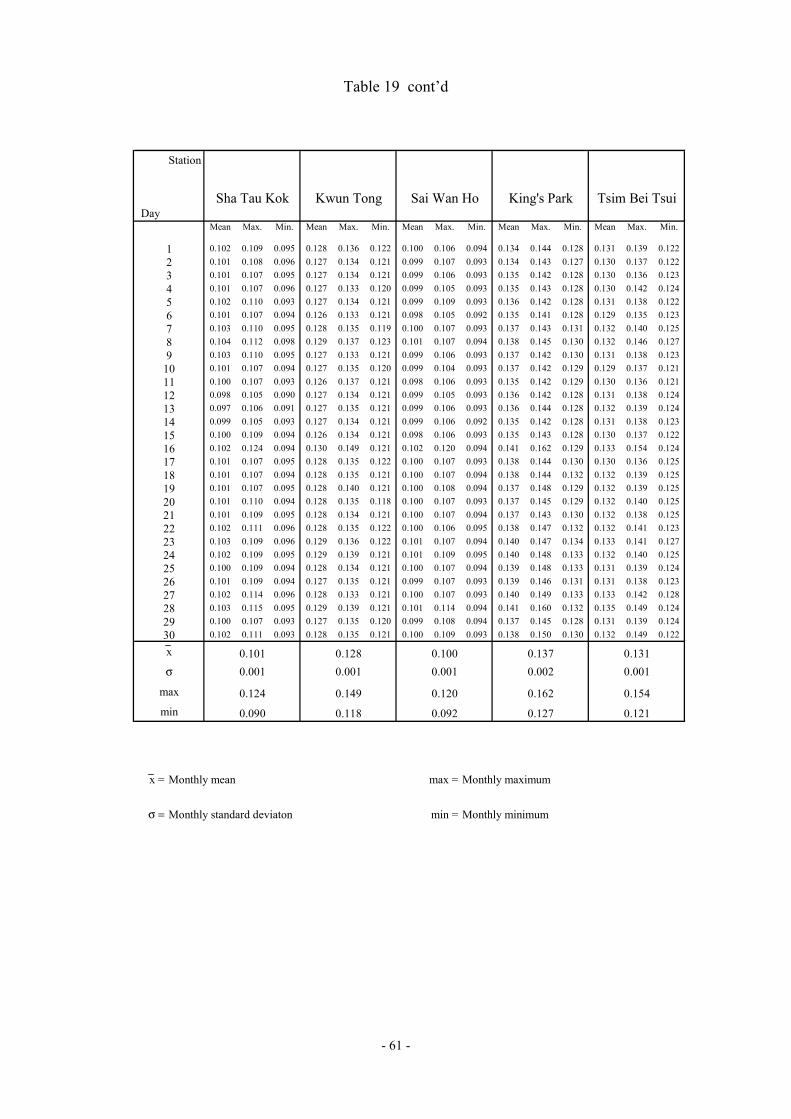
- 61 -
Table 19 cont’d
Station
Sha Tau Kok Kwun Tong Sai Wan Ho King's Park Tsim Bei TsuiDay
Mean Max. Min. Mean Max. Min. Mean Max. Min. Mean Max. Min. Mean Max. Min.
1 0.102 0.109 0.095 0.128 0.136 0.122 0.100 0.106 0.094 0.134 0.144 0.128 0.131 0.139 0.1222 0.101 0.108 0.096 0.127 0.134 0.121 0.099 0.107 0.093 0.134 0.143 0.127 0.130 0.137 0.1223 0.101 0.107 0.095 0.127 0.134 0.121 0.099 0.106 0.093 0.135 0.142 0.128 0.130 0.136 0.1234 0.101 0.107 0.096 0.127 0.133 0.120 0.099 0.105 0.093 0.135 0.143 0.128 0.130 0.142 0.1245 0.102 0.110 0.093 0.127 0.134 0.121 0.099 0.109 0.093 0.136 0.142 0.128 0.131 0.138 0.1226 0.101 0.107 0.094 0.126 0.133 0.121 0.098 0.105 0.092 0.135 0.141 0.128 0.129 0.135 0.1237 0.103 0.110 0.095 0.128 0.135 0.119 0.100 0.107 0.093 0.137 0.143 0.131 0.132 0.140 0.1258 0.104 0.112 0.098 0.129 0.137 0.123 0.101 0.107 0.094 0.138 0.145 0.130 0.132 0.146 0.1279 0.103 0.110 0.095 0.127 0.133 0.121 0.099 0.106 0.093 0.137 0.142 0.130 0.131 0.138 0.123
10 0.101 0.107 0.094 0.127 0.135 0.120 0.099 0.104 0.093 0.137 0.142 0.129 0.129 0.137 0.12111 0.100 0.107 0.093 0.126 0.137 0.121 0.098 0.106 0.093 0.135 0.142 0.129 0.130 0.136 0.12112 0.098 0.105 0.090 0.127 0.134 0.121 0.099 0.105 0.093 0.136 0.142 0.128 0.131 0.138 0.12413 0.097 0.106 0.091 0.127 0.135 0.121 0.099 0.106 0.093 0.136 0.144 0.128 0.132 0.139 0.12414 0.099 0.105 0.093 0.127 0.134 0.121 0.099 0.106 0.092 0.135 0.142 0.128 0.131 0.138 0.12315 0.100 0.109 0.094 0.126 0.134 0.121 0.098 0.106 0.093 0.135 0.143 0.128 0.130 0.137 0.12216 0.102 0.124 0.094 0.130 0.149 0.121 0.102 0.120 0.094 0.141 0.162 0.129 0.133 0.154 0.12417 0.101 0.107 0.095 0.128 0.135 0.122 0.100 0.107 0.093 0.138 0.144 0.130 0.130 0.136 0.12518 0.101 0.107 0.094 0.128 0.135 0.121 0.100 0.107 0.094 0.138 0.144 0.132 0.132 0.139 0.12519 0.101 0.107 0.095 0.128 0.140 0.121 0.100 0.108 0.094 0.137 0.148 0.129 0.132 0.139 0.12520 0.101 0.110 0.094 0.128 0.135 0.118 0.100 0.107 0.093 0.137 0.145 0.129 0.132 0.140 0.12521 0.101 0.109 0.095 0.128 0.134 0.121 0.100 0.107 0.094 0.137 0.143 0.130 0.132 0.138 0.12522 0.102 0.111 0.096 0.128 0.135 0.122 0.100 0.106 0.095 0.138 0.147 0.132 0.132 0.141 0.12323 0.103 0.109 0.096 0.129 0.136 0.122 0.101 0.107 0.094 0.140 0.147 0.134 0.133 0.141 0.12724 0.102 0.109 0.095 0.129 0.139 0.121 0.101 0.109 0.095 0.140 0.148 0.133 0.132 0.140 0.12525 0.100 0.109 0.094 0.128 0.134 0.121 0.100 0.107 0.094 0.139 0.148 0.133 0.131 0.139 0.12426 0.101 0.109 0.094 0.127 0.135 0.121 0.099 0.107 0.093 0.139 0.146 0.131 0.131 0.138 0.12327 0.102 0.114 0.096 0.128 0.133 0.121 0.100 0.107 0.093 0.140 0.149 0.133 0.133 0.142 0.12828 0.103 0.115 0.095 0.129 0.139 0.121 0.101 0.114 0.094 0.141 0.160 0.132 0.135 0.149 0.12429 0.100 0.107 0.093 0.127 0.135 0.120 0.099 0.108 0.094 0.137 0.145 0.128 0.131 0.139 0.12430 0.102 0.111 0.093 0.128 0.135 0.121 0.100 0.109 0.093 0.138 0.150 0.130 0.132 0.149 0.122
x 0.101 0.128 0.100 0.137 0.131σ 0.001 0.001 0.001 0.002 0.001
max 0.124 0.149 0.120 0.162 0.154min 0.090 0.118 0.092 0.127 0.121
x = Monthly mean max = Monthly maximum
σ = Monthly standard deviaton min = Monthly minimum
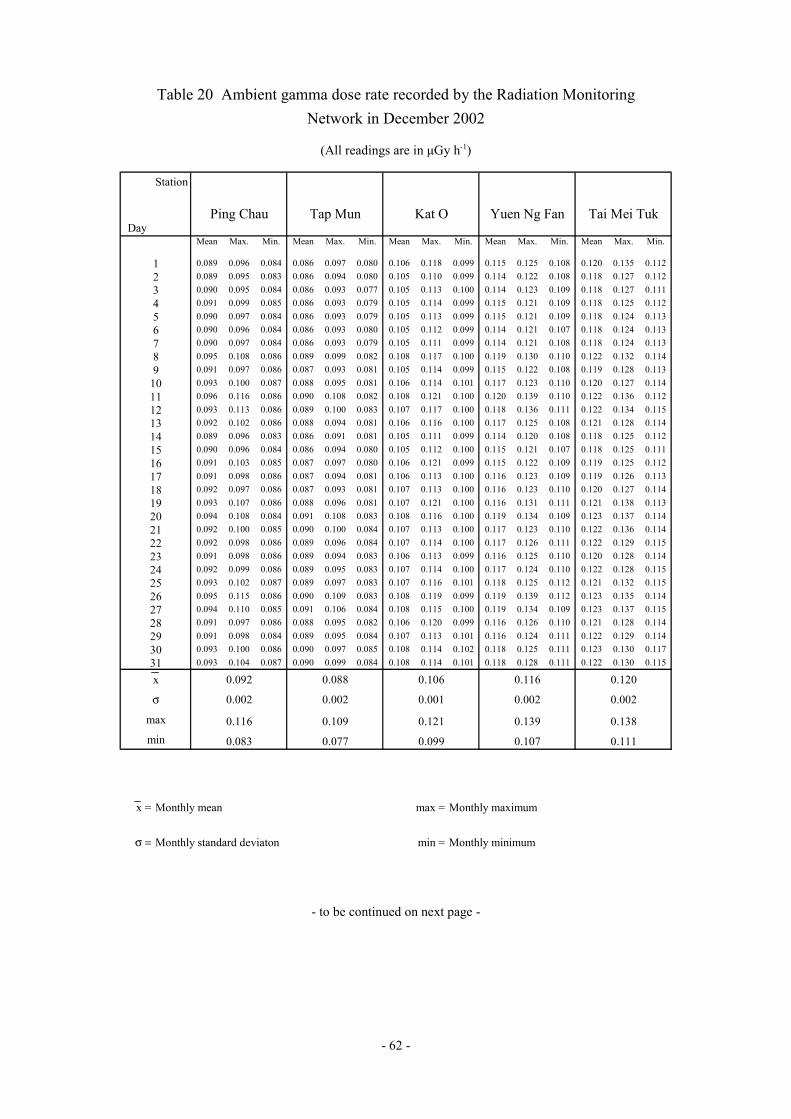
- 62 -
Table 20 Ambient gamma dose rate recorded by the Radiation MonitoringNetwork in December 2002
(All readings are in µGy h-1)
- to be continued on next page -
Station
Ping Chau Tap Mun Kat O Yuen Ng Fan Tai Mei TukDay
Mean Max. Min. Mean Max. Min. Mean Max. Min. Mean Max. Min. Mean Max. Min.
1 0.089 0.096 0.084 0.086 0.097 0.080 0.106 0.118 0.099 0.115 0.125 0.108 0.120 0.135 0.1122 0.089 0.095 0.083 0.086 0.094 0.080 0.105 0.110 0.099 0.114 0.122 0.108 0.118 0.127 0.1123 0.090 0.095 0.084 0.086 0.093 0.077 0.105 0.113 0.100 0.114 0.123 0.109 0.118 0.127 0.1114 0.091 0.099 0.085 0.086 0.093 0.079 0.105 0.114 0.099 0.115 0.121 0.109 0.118 0.125 0.1125 0.090 0.097 0.084 0.086 0.093 0.079 0.105 0.113 0.099 0.115 0.121 0.109 0.118 0.124 0.1136 0.090 0.096 0.084 0.086 0.093 0.080 0.105 0.112 0.099 0.114 0.121 0.107 0.118 0.124 0.1137 0.090 0.097 0.084 0.086 0.093 0.079 0.105 0.111 0.099 0.114 0.121 0.108 0.118 0.124 0.1138 0.095 0.108 0.086 0.089 0.099 0.082 0.108 0.117 0.100 0.119 0.130 0.110 0.122 0.132 0.1149 0.091 0.097 0.086 0.087 0.093 0.081 0.105 0.114 0.099 0.115 0.122 0.108 0.119 0.128 0.113
10 0.093 0.100 0.087 0.088 0.095 0.081 0.106 0.114 0.101 0.117 0.123 0.110 0.120 0.127 0.11411 0.096 0.116 0.086 0.090 0.108 0.082 0.108 0.121 0.100 0.120 0.139 0.110 0.122 0.136 0.11212 0.093 0.113 0.086 0.089 0.100 0.083 0.107 0.117 0.100 0.118 0.136 0.111 0.122 0.134 0.11513 0.092 0.102 0.086 0.088 0.094 0.081 0.106 0.116 0.100 0.117 0.125 0.108 0.121 0.128 0.11414 0.089 0.096 0.083 0.086 0.091 0.081 0.105 0.111 0.099 0.114 0.120 0.108 0.118 0.125 0.11215 0.090 0.096 0.084 0.086 0.094 0.080 0.105 0.112 0.100 0.115 0.121 0.107 0.118 0.125 0.11116 0.091 0.103 0.085 0.087 0.097 0.080 0.106 0.121 0.099 0.115 0.122 0.109 0.119 0.125 0.11217 0.091 0.098 0.086 0.087 0.094 0.081 0.106 0.113 0.100 0.116 0.123 0.109 0.119 0.126 0.11318 0.092 0.097 0.086 0.087 0.093 0.081 0.107 0.113 0.100 0.116 0.123 0.110 0.120 0.127 0.11419 0.093 0.107 0.086 0.088 0.096 0.081 0.107 0.121 0.100 0.116 0.131 0.111 0.121 0.138 0.11320 0.094 0.108 0.084 0.091 0.108 0.083 0.108 0.116 0.100 0.119 0.134 0.109 0.123 0.137 0.11421 0.092 0.100 0.085 0.090 0.100 0.084 0.107 0.113 0.100 0.117 0.123 0.110 0.122 0.136 0.11422 0.092 0.098 0.086 0.089 0.096 0.084 0.107 0.114 0.100 0.117 0.126 0.111 0.122 0.129 0.11523 0.091 0.098 0.086 0.089 0.094 0.083 0.106 0.113 0.099 0.116 0.125 0.110 0.120 0.128 0.11424 0.092 0.099 0.086 0.089 0.095 0.083 0.107 0.114 0.100 0.117 0.124 0.110 0.122 0.128 0.11525 0.093 0.102 0.087 0.089 0.097 0.083 0.107 0.116 0.101 0.118 0.125 0.112 0.121 0.132 0.11526 0.095 0.115 0.086 0.090 0.109 0.083 0.108 0.119 0.099 0.119 0.139 0.112 0.123 0.135 0.11427 0.094 0.110 0.085 0.091 0.106 0.084 0.108 0.115 0.100 0.119 0.134 0.109 0.123 0.137 0.11528 0.091 0.097 0.086 0.088 0.095 0.082 0.106 0.120 0.099 0.116 0.126 0.110 0.121 0.128 0.11429 0.091 0.098 0.084 0.089 0.095 0.084 0.107 0.113 0.101 0.116 0.124 0.111 0.122 0.129 0.11430 0.093 0.100 0.086 0.090 0.097 0.085 0.108 0.114 0.102 0.118 0.125 0.111 0.123 0.130 0.11731 0.093 0.104 0.087 0.090 0.099 0.084 0.108 0.114 0.101 0.118 0.128 0.111 0.122 0.130 0.115
x 0.092 0.088 0.106 0.116 0.120
σ 0.002 0.002 0.001 0.002 0.002
max 0.116 0.109 0.121 0.139 0.138min 0.083 0.077 0.099 0.107 0.111
x = Monthly mean max = Monthly maximum
σ = Monthly standard deviaton min = Monthly minimum
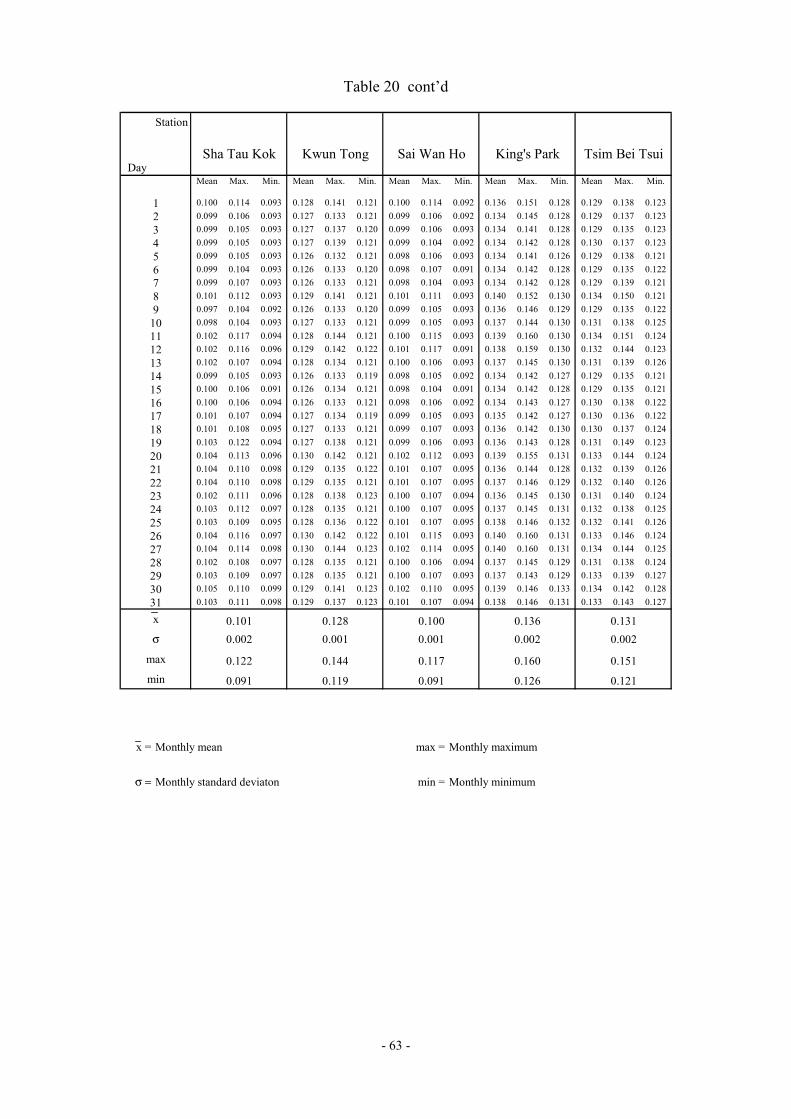
- 63 -
Table 20 cont’d
Station
Sha Tau Kok Kwun Tong Sai Wan Ho King's Park Tsim Bei TsuiDay
Mean Max. Min. Mean Max. Min. Mean Max. Min. Mean Max. Min. Mean Max. Min.
1 0.100 0.114 0.093 0.128 0.141 0.121 0.100 0.114 0.092 0.136 0.151 0.128 0.129 0.138 0.1232 0.099 0.106 0.093 0.127 0.133 0.121 0.099 0.106 0.092 0.134 0.145 0.128 0.129 0.137 0.1233 0.099 0.105 0.093 0.127 0.137 0.120 0.099 0.106 0.093 0.134 0.141 0.128 0.129 0.135 0.1234 0.099 0.105 0.093 0.127 0.139 0.121 0.099 0.104 0.092 0.134 0.142 0.128 0.130 0.137 0.1235 0.099 0.105 0.093 0.126 0.132 0.121 0.098 0.106 0.093 0.134 0.141 0.126 0.129 0.138 0.1216 0.099 0.104 0.093 0.126 0.133 0.120 0.098 0.107 0.091 0.134 0.142 0.128 0.129 0.135 0.1227 0.099 0.107 0.093 0.126 0.133 0.121 0.098 0.104 0.093 0.134 0.142 0.128 0.129 0.139 0.1218 0.101 0.112 0.093 0.129 0.141 0.121 0.101 0.111 0.093 0.140 0.152 0.130 0.134 0.150 0.1219 0.097 0.104 0.092 0.126 0.133 0.120 0.099 0.105 0.093 0.136 0.146 0.129 0.129 0.135 0.122
10 0.098 0.104 0.093 0.127 0.133 0.121 0.099 0.105 0.093 0.137 0.144 0.130 0.131 0.138 0.12511 0.102 0.117 0.094 0.128 0.144 0.121 0.100 0.115 0.093 0.139 0.160 0.130 0.134 0.151 0.12412 0.102 0.116 0.096 0.129 0.142 0.122 0.101 0.117 0.091 0.138 0.159 0.130 0.132 0.144 0.12313 0.102 0.107 0.094 0.128 0.134 0.121 0.100 0.106 0.093 0.137 0.145 0.130 0.131 0.139 0.12614 0.099 0.105 0.093 0.126 0.133 0.119 0.098 0.105 0.092 0.134 0.142 0.127 0.129 0.135 0.12115 0.100 0.106 0.091 0.126 0.134 0.121 0.098 0.104 0.091 0.134 0.142 0.128 0.129 0.135 0.12116 0.100 0.106 0.094 0.126 0.133 0.121 0.098 0.106 0.092 0.134 0.143 0.127 0.130 0.138 0.12217 0.101 0.107 0.094 0.127 0.134 0.119 0.099 0.105 0.093 0.135 0.142 0.127 0.130 0.136 0.12218 0.101 0.108 0.095 0.127 0.133 0.121 0.099 0.107 0.093 0.136 0.142 0.130 0.130 0.137 0.12419 0.103 0.122 0.094 0.127 0.138 0.121 0.099 0.106 0.093 0.136 0.143 0.128 0.131 0.149 0.12320 0.104 0.113 0.096 0.130 0.142 0.121 0.102 0.112 0.093 0.139 0.155 0.131 0.133 0.144 0.12421 0.104 0.110 0.098 0.129 0.135 0.122 0.101 0.107 0.095 0.136 0.144 0.128 0.132 0.139 0.12622 0.104 0.110 0.098 0.129 0.135 0.121 0.101 0.107 0.095 0.137 0.146 0.129 0.132 0.140 0.12623 0.102 0.111 0.096 0.128 0.138 0.123 0.100 0.107 0.094 0.136 0.145 0.130 0.131 0.140 0.12424 0.103 0.112 0.097 0.128 0.135 0.121 0.100 0.107 0.095 0.137 0.145 0.131 0.132 0.138 0.12525 0.103 0.109 0.095 0.128 0.136 0.122 0.101 0.107 0.095 0.138 0.146 0.132 0.132 0.141 0.12626 0.104 0.116 0.097 0.130 0.142 0.122 0.101 0.115 0.093 0.140 0.160 0.131 0.133 0.146 0.12427 0.104 0.114 0.098 0.130 0.144 0.123 0.102 0.114 0.095 0.140 0.160 0.131 0.134 0.144 0.12528 0.102 0.108 0.097 0.128 0.135 0.121 0.100 0.106 0.094 0.137 0.145 0.129 0.131 0.138 0.12429 0.103 0.109 0.097 0.128 0.135 0.121 0.100 0.107 0.093 0.137 0.143 0.129 0.133 0.139 0.12730 0.105 0.110 0.099 0.129 0.141 0.123 0.102 0.110 0.095 0.139 0.146 0.133 0.134 0.142 0.12831 0.103 0.111 0.098 0.129 0.137 0.123 0.101 0.107 0.094 0.138 0.146 0.131 0.133 0.143 0.127
x 0.101 0.128 0.100 0.136 0.131σ 0.002 0.001 0.001 0.002 0.002
max 0.122 0.144 0.117 0.160 0.151min 0.091 0.119 0.091 0.126 0.121
x = Monthly mean max = Monthly maximum
σ = Monthly standard deviaton min = Monthly minimum
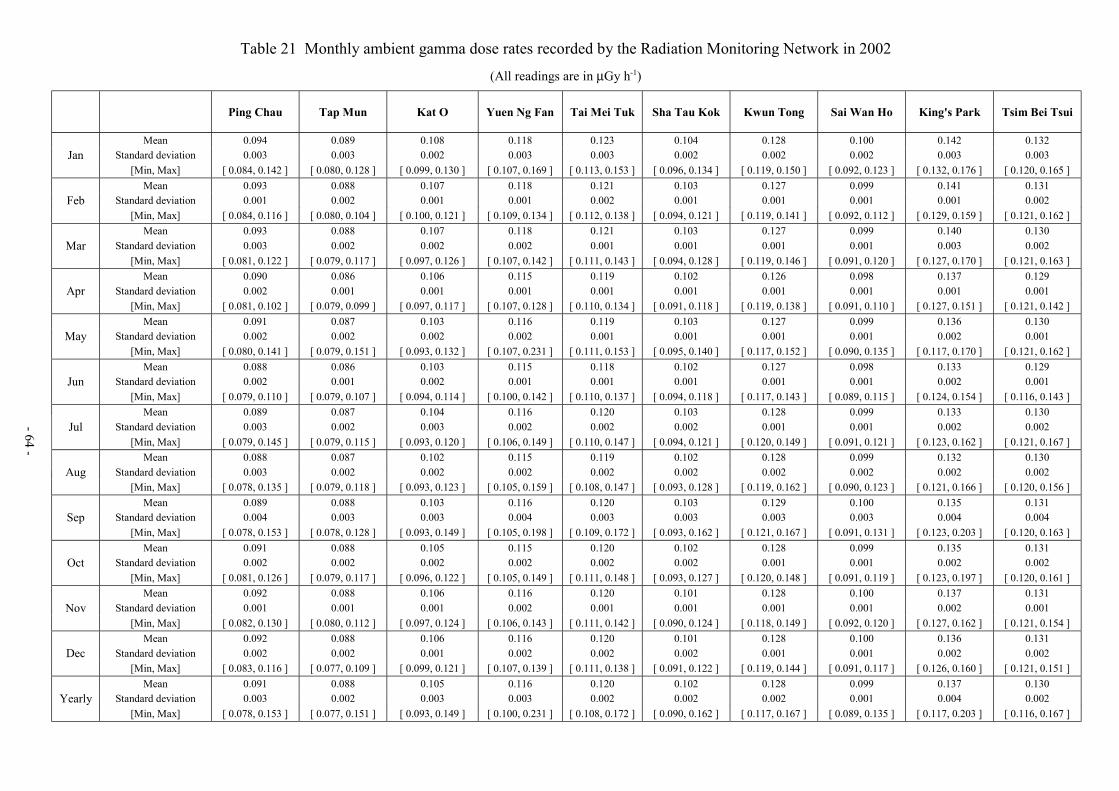
Table 21 Monthly ambient gamma dose rates recorded by the Radiation Monitoring Network in 2002
(All readings are in µGy h-1)
Ping Chau Tap Mun Kat O Yuen Ng Fan Tai Mei Tuk Sha Tau Kok Kwun Tong Sai Wan Ho King's Park Tsim Bei Tsui
Mean 0.094 0.089 0.108 0.118 0.123 0.104 0.128 0.100 0.142 0.132Jan Standard deviation 0.003 0.003 0.002 0.003 0.003 0.002 0.002 0.002 0.003 0.003
[Min, Max] [ 0.084, 0.142 ] [ 0.080, 0.128 ] [ 0.099, 0.130 ] [ 0.107, 0.169 ] [ 0.113, 0.153 ] [ 0.096, 0.134 ] [ 0.119, 0.150 ] [ 0.092, 0.123 ] [ 0.132, 0.176 ] [ 0.120, 0.165 ]Mean 0.093 0.088 0.107 0.118 0.121 0.103 0.127 0.099 0.141 0.131
Feb Standard deviation 0.001 0.002 0.001 0.001 0.002 0.001 0.001 0.001 0.001 0.002[Min, Max] [ 0.084, 0.116 ] [ 0.080, 0.104 ] [ 0.100, 0.121 ] [ 0.109, 0.134 ] [ 0.112, 0.138 ] [ 0.094, 0.121 ] [ 0.119, 0.141 ] [ 0.092, 0.112 ] [ 0.129, 0.159 ] [ 0.121, 0.162 ]
Mean 0.093 0.088 0.107 0.118 0.121 0.103 0.127 0.099 0.140 0.130Mar Standard deviation 0.003 0.002 0.002 0.002 0.001 0.001 0.001 0.001 0.003 0.002
[Min, Max] [ 0.081, 0.122 ] [ 0.079, 0.117 ] [ 0.097, 0.126 ] [ 0.107, 0.142 ] [ 0.111, 0.143 ] [ 0.094, 0.128 ] [ 0.119, 0.146 ] [ 0.091, 0.120 ] [ 0.127, 0.170 ] [ 0.121, 0.163 ]Mean 0.090 0.086 0.106 0.115 0.119 0.102 0.126 0.098 0.137 0.129
Apr Standard deviation 0.002 0.001 0.001 0.001 0.001 0.001 0.001 0.001 0.001 0.001[Min, Max] [ 0.081, 0.102 ] [ 0.079, 0.099 ] [ 0.097, 0.117 ] [ 0.107, 0.128 ] [ 0.110, 0.134 ] [ 0.091, 0.118 ] [ 0.119, 0.138 ] [ 0.091, 0.110 ] [ 0.127, 0.151 ] [ 0.121, 0.142 ]
Mean 0.091 0.087 0.103 0.116 0.119 0.103 0.127 0.099 0.136 0.130May Standard deviation 0.002 0.002 0.002 0.002 0.001 0.001 0.001 0.001 0.002 0.001
[Min, Max] [ 0.080, 0.141 ] [ 0.079, 0.151 ] [ 0.093, 0.132 ] [ 0.107, 0.231 ] [ 0.111, 0.153 ] [ 0.095, 0.140 ] [ 0.117, 0.152 ] [ 0.090, 0.135 ] [ 0.117, 0.170 ] [ 0.121, 0.162 ]Mean 0.088 0.086 0.103 0.115 0.118 0.102 0.127 0.098 0.133 0.129
Jun Standard deviation 0.002 0.001 0.002 0.001 0.001 0.001 0.001 0.001 0.002 0.001[Min, Max] [ 0.079, 0.110 ] [ 0.079, 0.107 ] [ 0.094, 0.114 ] [ 0.100, 0.142 ] [ 0.110, 0.137 ] [ 0.094, 0.118 ] [ 0.117, 0.143 ] [ 0.089, 0.115 ] [ 0.124, 0.154 ] [ 0.116, 0.143 ]
Mean 0.089 0.087 0.104 0.116 0.120 0.103 0.128 0.099 0.133 0.130Jul Standard deviation 0.003 0.002 0.003 0.002 0.002 0.002 0.001 0.001 0.002 0.002
[Min, Max] [ 0.079, 0.145 ] [ 0.079, 0.115 ] [ 0.093, 0.120 ] [ 0.106, 0.149 ] [ 0.110, 0.147 ] [ 0.094, 0.121 ] [ 0.120, 0.149 ] [ 0.091, 0.121 ] [ 0.123, 0.162 ] [ 0.121, 0.167 ]Mean 0.088 0.087 0.102 0.115 0.119 0.102 0.128 0.099 0.132 0.130
Aug Standard deviation 0.003 0.002 0.002 0.002 0.002 0.002 0.002 0.002 0.002 0.002[Min, Max] [ 0.078, 0.135 ] [ 0.079, 0.118 ] [ 0.093, 0.123 ] [ 0.105, 0.159 ] [ 0.108, 0.147 ] [ 0.093, 0.128 ] [ 0.119, 0.162 ] [ 0.090, 0.123 ] [ 0.121, 0.166 ] [ 0.120, 0.156 ]
Mean 0.089 0.088 0.103 0.116 0.120 0.103 0.129 0.100 0.135 0.131Sep Standard deviation 0.004 0.003 0.003 0.004 0.003 0.003 0.003 0.003 0.004 0.004
[Min, Max] [ 0.078, 0.153 ] [ 0.078, 0.128 ] [ 0.093, 0.149 ] [ 0.105, 0.198 ] [ 0.109, 0.172 ] [ 0.093, 0.162 ] [ 0.121, 0.167 ] [ 0.091, 0.131 ] [ 0.123, 0.203 ] [ 0.120, 0.163 ]Mean 0.091 0.088 0.105 0.115 0.120 0.102 0.128 0.099 0.135 0.131
Oct Standard deviation 0.002 0.002 0.002 0.002 0.002 0.002 0.001 0.001 0.002 0.002[Min, Max] [ 0.081, 0.126 ] [ 0.079, 0.117 ] [ 0.096, 0.122 ] [ 0.105, 0.149 ] [ 0.111, 0.148 ] [ 0.093, 0.127 ] [ 0.120, 0.148 ] [ 0.091, 0.119 ] [ 0.123, 0.197 ] [ 0.120, 0.161 ]
Mean 0.092 0.088 0.106 0.116 0.120 0.101 0.128 0.100 0.137 0.131Nov Standard deviation 0.001 0.001 0.001 0.002 0.001 0.001 0.001 0.001 0.002 0.001
[Min, Max] [ 0.082, 0.130 ] [ 0.080, 0.112 ] [ 0.097, 0.124 ] [ 0.106, 0.143 ] [ 0.111, 0.142 ] [ 0.090, 0.124 ] [ 0.118, 0.149 ] [ 0.092, 0.120 ] [ 0.127, 0.162 ] [ 0.121, 0.154 ]Mean 0.092 0.088 0.106 0.116 0.120 0.101 0.128 0.100 0.136 0.131
Dec Standard deviation 0.002 0.002 0.001 0.002 0.002 0.002 0.001 0.001 0.002 0.002[Min, Max] [ 0.083, 0.116 ] [ 0.077, 0.109 ] [ 0.099, 0.121 ] [ 0.107, 0.139 ] [ 0.111, 0.138 ] [ 0.091, 0.122 ] [ 0.119, 0.144 ] [ 0.091, 0.117 ] [ 0.126, 0.160 ] [ 0.121, 0.151 ]
Mean 0.091 0.088 0.105 0.116 0.120 0.102 0.128 0.099 0.137 0.130Yearly Standard deviation 0.003 0.002 0.003 0.003 0.002 0.002 0.002 0.001 0.004 0.002
[Min, Max] [ 0.078, 0.153 ] [ 0.077, 0.151 ] [ 0.093, 0.149 ] [ 0.100, 0.231 ] [ 0.108, 0.172 ] [ 0.090, 0.162 ] [ 0.117, 0.167 ] [ 0.089, 0.135 ] [ 0.117, 0.203 ] [ 0.116, 0.167 ]
- 64 -
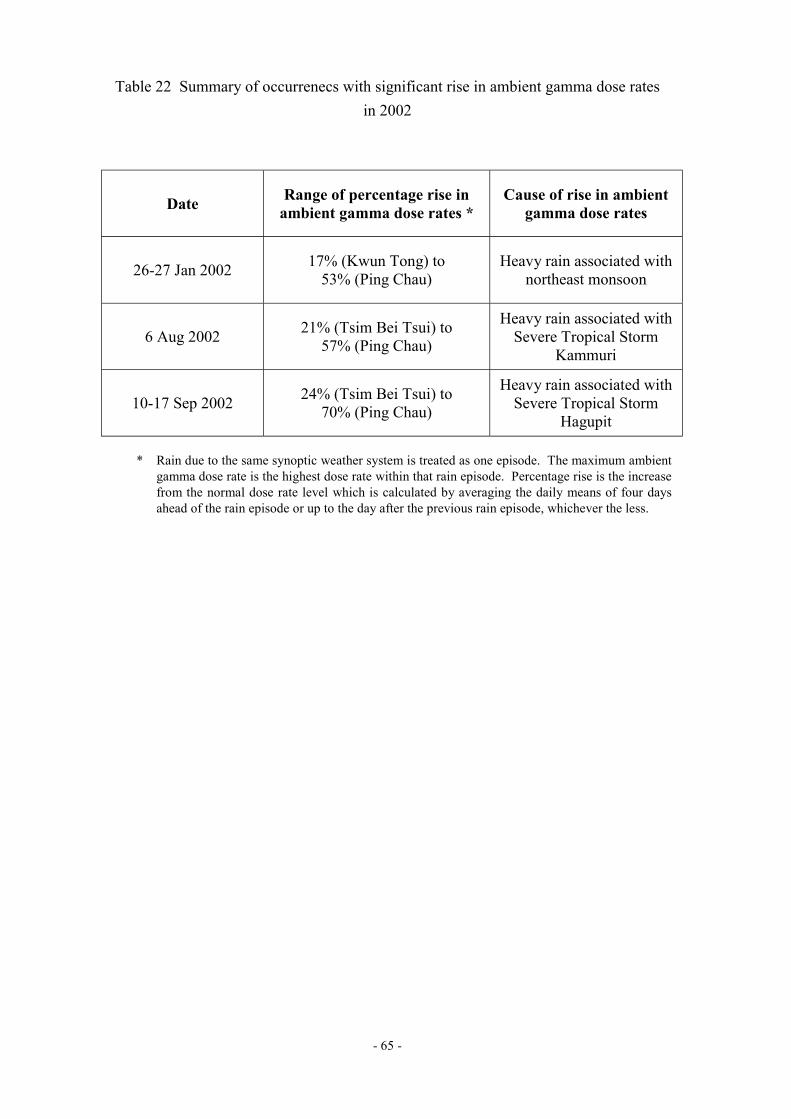
- 65 -
Table 22 Summary of occurrenecs with significant rise in ambient gamma dose ratesin 2002
Date Range of percentage rise inambient gamma dose rates *
Cause of rise in ambientgamma dose rates
26-27 Jan 2002 17% (Kwun Tong) to53% (Ping Chau)
Heavy rain associated withnortheast monsoon
6 Aug 2002 21% (Tsim Bei Tsui) to57% (Ping Chau)
Heavy rain associated withSevere Tropical Storm
Kammuri
10-17 Sep 2002 24% (Tsim Bei Tsui) to70% (Ping Chau)
Heavy rain associated withSevere Tropical Storm
Hagupit
* Rain due to the same synoptic weather system is treated as one episode. The maximum ambientgamma dose rate is the highest dose rate within that rain episode. Percentage rise is the increasefrom the normal dose rate level which is calculated by averaging the daily means of four daysahead of the rain episode or up to the day after the previous rain episode, whichever the less.
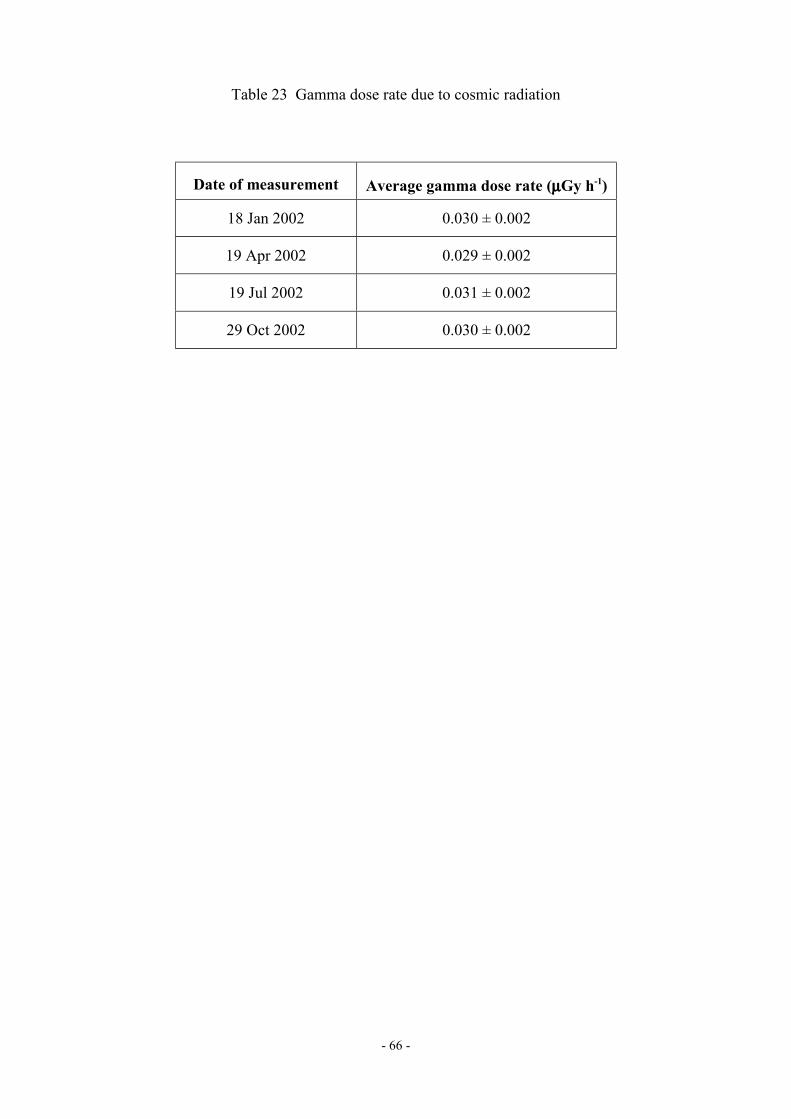
- 66 -
Table 23 Gamma dose rate due to cosmic radiation
Date of measurement Average gamma dose rate (µµµµGy h-1)
18 Jan 2002 0.030 ± 0.002
19 Apr 2002 0.029 ± 0.002
19 Jul 2002 0.031 ± 0.002
29 Oct 2002 0.030 ± 0.002
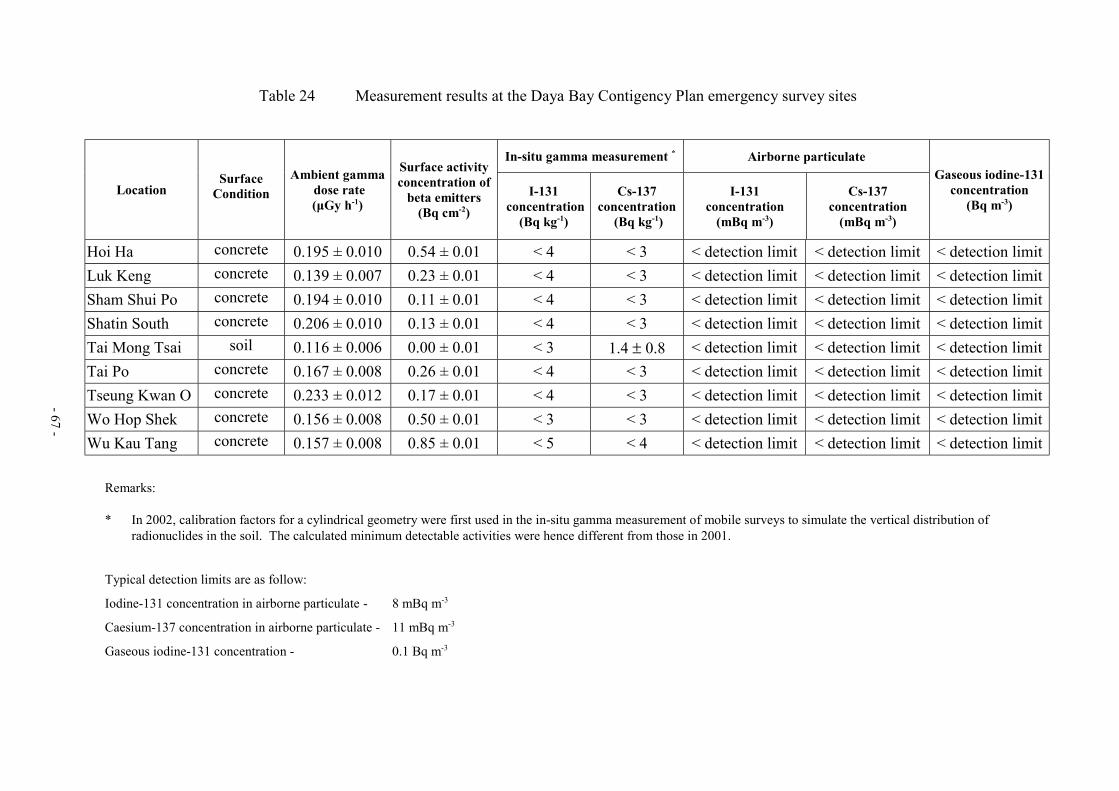
Table 24 Measurement results at the Daya Bay Contigency Plan emergency survey sites
In-situ gamma measurement * Airborne particulate
LocationSurface
ConditionAmbient gamma
dose rate(µGy h-1)
Surface activityconcentration of
beta emitters(Bq cm-2)
I-131 concentration
(Bq kg-1)
Cs-137concentration
(Bq kg-1)
I-131concentration
(mBq m-3)
Cs-137concentration
(mBq m-3)
Gaseous iodine-131concentration
(Bq m-3)
Hoi Ha concrete 0.195 ± 0.010 0.54 ± 0.01 < 4 < 3 < detection limit < detection limit < detection limitLuk Keng concrete 0.139 ± 0.007 0.23 ± 0.01 < 4 < 3 < detection limit < detection limit < detection limitSham Shui Po concrete 0.194 ± 0.010 0.11 ± 0.01 < 4 < 3 < detection limit < detection limit < detection limitShatin South concrete 0.206 ± 0.010 0.13 ± 0.01 < 4 < 3 < detection limit < detection limit < detection limitTai Mong Tsai soil 0.116 ± 0.006 0.00 ± 0.01 < 3 1.4 ± 0.8 < detection limit < detection limit < detection limitTai Po concrete 0.167 ± 0.008 0.26 ± 0.01 < 4 < 3 < detection limit < detection limit < detection limitTseung Kwan O concrete 0.233 ± 0.012 0.17 ± 0.01 < 4 < 3 < detection limit < detection limit < detection limitWo Hop Shek concrete 0.156 ± 0.008 0.50 ± 0.01 < 3 < 3 < detection limit < detection limit < detection limitWu Kau Tang concrete 0.157 ± 0.008 0.85 ± 0.01 < 5 < 4 < detection limit < detection limit < detection limit
Remarks:
* In 2002, calibration factors for a cylindrical geometry were first used in the in-situ gamma measurement of mobile surveys to simulate the vertical distribution ofradionuclides in the soil. The calculated minimum detectable activities were hence different from those in 2001.
Typical detection limits are as follow:
Iodine-131 concentration in airborne particulate - 8 mBq m-3
Caesium-137 concentration in airborne particulate - 11 mBq m-3
Gaseous iodine-131 concentration - 0.1 Bq m-3
- 67 -
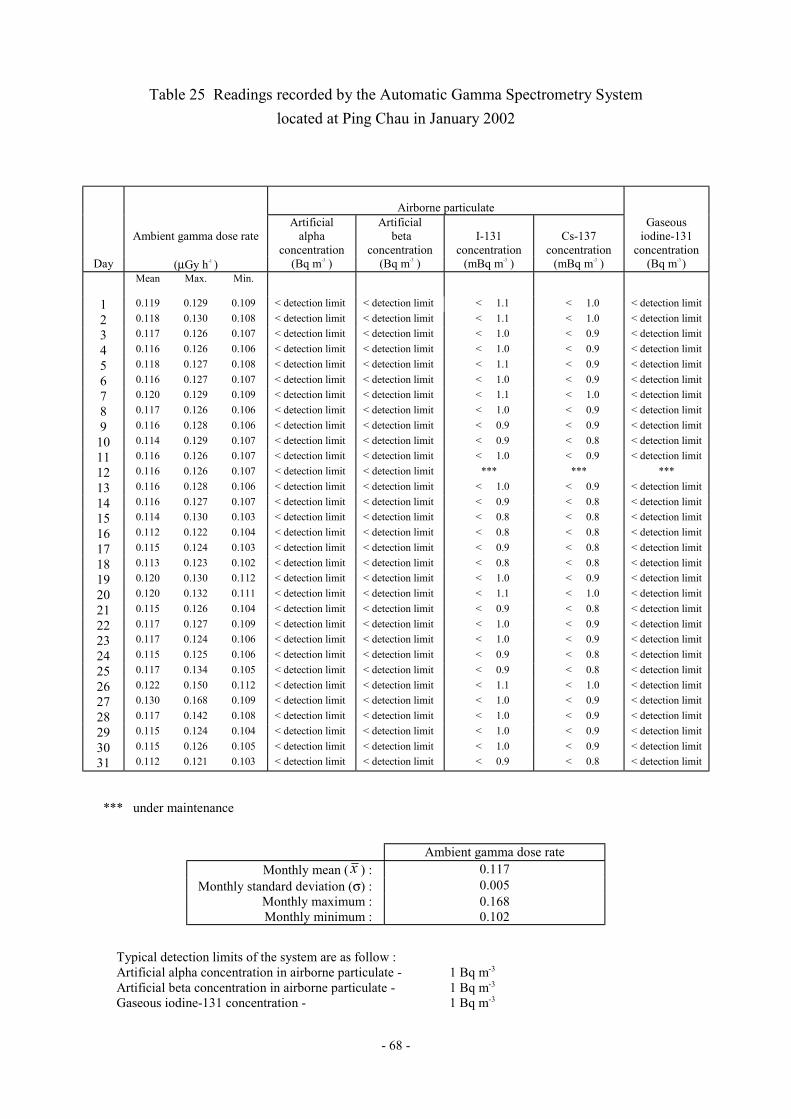
- 68 -
Table 25 Readings recorded by the Automatic Gamma Spectrometry Systemlocated at Ping Chau in January 2002
Airborne particulate
Ambient gamma dose rateArtificial
alphaconcentration
Artificial beta
concentrationI-131
concentrationCs-137
concentration
Gaseousiodine-131
concentrationDay (µGy h-1 ) (Bq m-3 ) (Bq m-3 ) (mBq m-3 ) (mBq m-3 ) (Bq m-3 )
Mean Max. Min.
1 0.119 0.129 0.109 < detection limit < detection limit < 1.1 < 1.0 < detection limit
2 0.118 0.130 0.108 < detection limit < detection limit < 1.1 < 1.0 < detection limit3 0.117 0.126 0.107 < detection limit < detection limit < 1.0 < 0.9 < detection limit
4 0.116 0.126 0.106 < detection limit < detection limit < 1.0 < 0.9 < detection limit
5 0.118 0.127 0.108 < detection limit < detection limit < 1.1 < 0.9 < detection limit
6 0.116 0.127 0.107 < detection limit < detection limit < 1.0 < 0.9 < detection limit7 0.120 0.129 0.109 < detection limit < detection limit < 1.1 < 1.0 < detection limit
8 0.117 0.126 0.106 < detection limit < detection limit < 1.0 < 0.9 < detection limit
9 0.116 0.128 0.106 < detection limit < detection limit < 0.9 < 0.9 < detection limit
10 0.114 0.129 0.107 < detection limit < detection limit < 0.9 < 0.8 < detection limit11 0.116 0.126 0.107 < detection limit < detection limit < 1.0 < 0.9 < detection limit
12 0.116 0.126 0.107 < detection limit < detection limit *** *** ***
13 0.116 0.128 0.106 < detection limit < detection limit < 1.0 < 0.9 < detection limit
14 0.116 0.127 0.107 < detection limit < detection limit < 0.9 < 0.8 < detection limit15 0.114 0.130 0.103 < detection limit < detection limit < 0.8 < 0.8 < detection limit
16 0.112 0.122 0.104 < detection limit < detection limit < 0.8 < 0.8 < detection limit
17 0.115 0.124 0.103 < detection limit < detection limit < 0.9 < 0.8 < detection limit
18 0.113 0.123 0.102 < detection limit < detection limit < 0.8 < 0.8 < detection limit19 0.120 0.130 0.112 < detection limit < detection limit < 1.0 < 0.9 < detection limit
20 0.120 0.132 0.111 < detection limit < detection limit < 1.1 < 1.0 < detection limit
21 0.115 0.126 0.104 < detection limit < detection limit < 0.9 < 0.8 < detection limit
22 0.117 0.127 0.109 < detection limit < detection limit < 1.0 < 0.9 < detection limit23 0.117 0.124 0.106 < detection limit < detection limit < 1.0 < 0.9 < detection limit
24 0.115 0.125 0.106 < detection limit < detection limit < 0.9 < 0.8 < detection limit
25 0.117 0.134 0.105 < detection limit < detection limit < 0.9 < 0.8 < detection limit
26 0.122 0.150 0.112 < detection limit < detection limit < 1.1 < 1.0 < detection limit27 0.130 0.168 0.109 < detection limit < detection limit < 1.0 < 0.9 < detection limit
28 0.117 0.142 0.108 < detection limit < detection limit < 1.0 < 0.9 < detection limit
29 0.115 0.124 0.104 < detection limit < detection limit < 1.0 < 0.9 < detection limit
30 0.115 0.126 0.105 < detection limit < detection limit < 1.0 < 0.9 < detection limit31 0.112 0.121 0.103 < detection limit < detection limit < 0.9 < 0.8 < detection limit
*** under maintenance
Ambient gamma dose rateMonthly mean ( x ) : 0.117
Monthly standard deviation (σ) : 0.005Monthly maximum : 0.168Monthly minimum : 0.102
Typical detection limits of the system are as follow :Artificial alpha concentration in airborne particulate - 1 Bq m-3
Artificial beta concentration in airborne particulate - 1 Bq m-3
Gaseous iodine-131 concentration - 1 Bq m-3
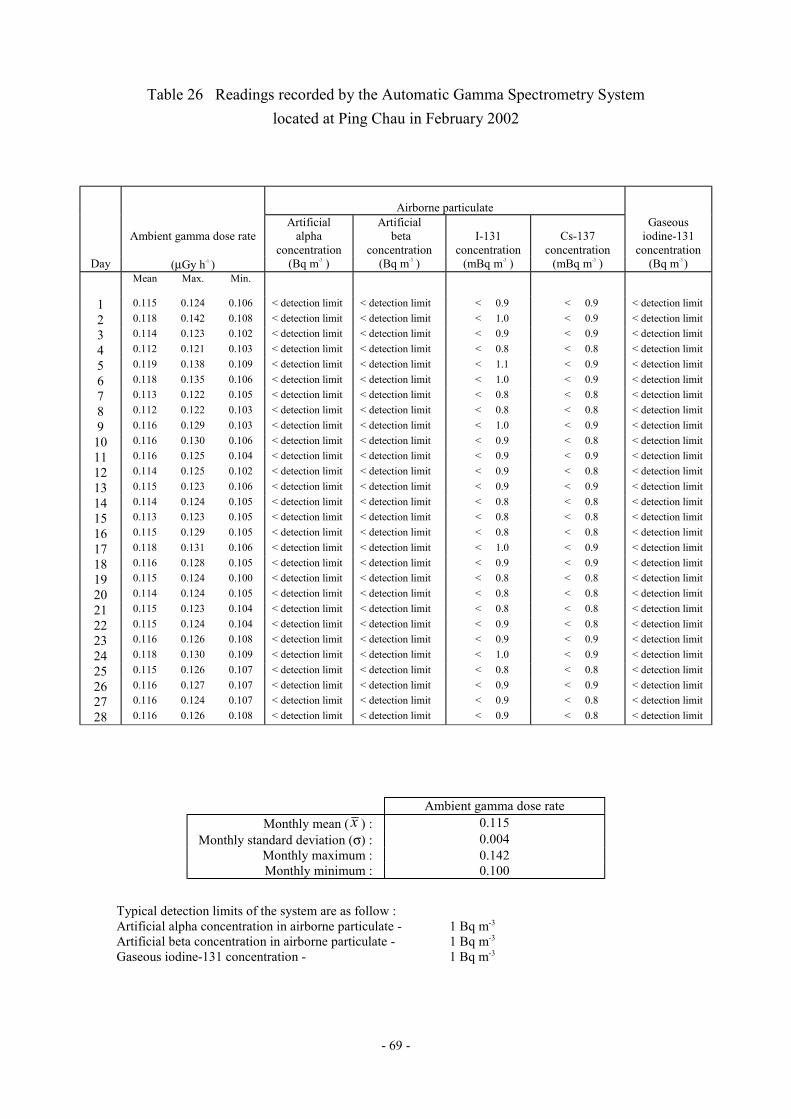
- 69 -
Table 26 Readings recorded by the Automatic Gamma Spectrometry Systemlocated at Ping Chau in February 2002
Airborne particulate
Ambient gamma dose rateArtificial
alphaconcentration
Artificial beta
concentrationI-131
concentrationCs-137
concentration
Gaseousiodine-131
concentrationDay (µGy h-1 ) (Bq m-3 ) (Bq m-3 ) (mBq m-3 ) (mBq m-3 ) (Bq m-3 )
Mean Max. Min.
1 0.115 0.124 0.106 < detection limit < detection limit < 0.9 < 0.9 < detection limit
2 0.118 0.142 0.108 < detection limit < detection limit < 1.0 < 0.9 < detection limit3 0.114 0.123 0.102 < detection limit < detection limit < 0.9 < 0.9 < detection limit
4 0.112 0.121 0.103 < detection limit < detection limit < 0.8 < 0.8 < detection limit
5 0.119 0.138 0.109 < detection limit < detection limit < 1.1 < 0.9 < detection limit
6 0.118 0.135 0.106 < detection limit < detection limit < 1.0 < 0.9 < detection limit7 0.113 0.122 0.105 < detection limit < detection limit < 0.8 < 0.8 < detection limit
8 0.112 0.122 0.103 < detection limit < detection limit < 0.8 < 0.8 < detection limit
9 0.116 0.129 0.103 < detection limit < detection limit < 1.0 < 0.9 < detection limit
10 0.116 0.130 0.106 < detection limit < detection limit < 0.9 < 0.8 < detection limit11 0.116 0.125 0.104 < detection limit < detection limit < 0.9 < 0.9 < detection limit
12 0.114 0.125 0.102 < detection limit < detection limit < 0.9 < 0.8 < detection limit
13 0.115 0.123 0.106 < detection limit < detection limit < 0.9 < 0.9 < detection limit
14 0.114 0.124 0.105 < detection limit < detection limit < 0.8 < 0.8 < detection limit15 0.113 0.123 0.105 < detection limit < detection limit < 0.8 < 0.8 < detection limit
16 0.115 0.129 0.105 < detection limit < detection limit < 0.8 < 0.8 < detection limit
17 0.118 0.131 0.106 < detection limit < detection limit < 1.0 < 0.9 < detection limit
18 0.116 0.128 0.105 < detection limit < detection limit < 0.9 < 0.9 < detection limit19 0.115 0.124 0.100 < detection limit < detection limit < 0.8 < 0.8 < detection limit
20 0.114 0.124 0.105 < detection limit < detection limit < 0.8 < 0.8 < detection limit
21 0.115 0.123 0.104 < detection limit < detection limit < 0.8 < 0.8 < detection limit
22 0.115 0.124 0.104 < detection limit < detection limit < 0.9 < 0.8 < detection limit23 0.116 0.126 0.108 < detection limit < detection limit < 0.9 < 0.9 < detection limit
24 0.118 0.130 0.109 < detection limit < detection limit < 1.0 < 0.9 < detection limit
25 0.115 0.126 0.107 < detection limit < detection limit < 0.8 < 0.8 < detection limit
26 0.116 0.127 0.107 < detection limit < detection limit < 0.9 < 0.9 < detection limit27 0.116 0.124 0.107 < detection limit < detection limit < 0.9 < 0.8 < detection limit
28 0.116 0.126 0.108 < detection limit < detection limit < 0.9 < 0.8 < detection limit
Ambient gamma dose rateMonthly mean ( x ) : 0.115
Monthly standard deviation (σ) : 0.004Monthly maximum : 0.142Monthly minimum : 0.100
Typical detection limits of the system are as follow :Artificial alpha concentration in airborne particulate - 1 Bq m-3
Artificial beta concentration in airborne particulate - 1 Bq m-3
Gaseous iodine-131 concentration - 1 Bq m-3

- 70 -
Table 27 Readings recorded by the Automatic Gamma Spectrometry Systemlocated at Ping Chau in March 2002
Airborne particulate
Ambient gamma dose rateArtificial
alphaconcentration
Artificial beta
concentrationI-131
concentrationCs-137
concentration
Gaseousiodine-131
concentrationDay (µGy h-1 ) (Bq m-3 ) (Bq m-3 ) (mBq m-3 ) (mBq m-3 ) (Bq m-3 )
Mean Max. Min.
1 0.115 0.123 0.107 < detection limit < detection limit < 0.8 < 0.8 < detection limit
2 0.116 0.126 0.106 < detection limit < detection limit < 0.8 < 0.8 < detection limit3 0.116 0.126 0.103 < detection limit < detection limit < 0.9 < 0.8 < detection limit
4 0.115 0.126 0.104 < detection limit < detection limit < 0.8 < 0.8 < detection limit
5 0.117 0.129 0.108 < detection limit < detection limit < 0.8 < 0.8 < detection limit
6 0.118 0.129 0.108 < detection limit < detection limit < 0.9 < 0.9 < detection limit7 0.118 0.129 0.107 < detection limit < detection limit < 0.9 < 0.9 < detection limit
8 0.116 0.126 0.106 < detection limit < detection limit < 0.9 < 0.8 < detection limit
9 0.115 0.126 0.106 < detection limit < detection limit < 0.8 < 0.8 < detection limit
10 0.115 0.126 0.107 < detection limit < detection limit < 0.8 < 0.8 < detection limit11 0.116 0.125 0.105 < detection limit < detection limit < 0.8 < 0.8 < detection limit
12 0.116 0.126 0.107 < detection limit < detection limit < 0.8 < 0.8 < detection limit
13 0.116 0.124 0.106 < detection limit < detection limit < 0.8 < 0.8 < detection limit
14 0.116 0.126 0.105 < detection limit < detection limit < 0.8 < 0.8 < detection limit15 0.116 0.124 0.106 < detection limit < detection limit < 0.8 < 0.8 < detection limit
16 0.117 0.126 0.108 < detection limit < detection limit *** *** < detection limit
17 0.118 0.127 0.107 < detection limit < detection limit < 0.9 < 0.8 < detection limit
18 0.119 0.131 0.107 < detection limit < detection limit < 0.9 < 0.9 < detection limit19 0.116 0.125 0.106 < detection limit < detection limit < 0.8 < 0.8 < detection limit
20 0.117 0.128 0.109 < detection limit < detection limit < 0.9 < 0.8 < detection limit
21 0.117 0.129 0.107 < detection limit < detection limit < 1.0 < 0.9 < detection limit
22 0.116 0.129 0.107 < detection limit < detection limit < 0.8 < 0.8 < detection limit23 0.120 0.159 0.102 < detection limit < detection limit < 0.9 < 0.8 < detection limit
24 0.116 0.139 0.100 < detection limit < detection limit < 0.8 < 0.8 < detection limit
25 0.110 0.122 0.101 < detection limit < detection limit < 0.8 < 0.8 < detection limit
26 0.108 0.116 0.098 < detection limit < detection limit < 0.8 < 0.8 < detection limit27 0.109 0.121 0.100 < detection limit < detection limit < 0.8 < 0.8 < detection limit
28 0.109 0.121 0.099 < detection limit < detection limit < 0.8 < 0.7 < detection limit
29 0.108 0.118 0.099 < detection limit < detection limit < 0.8 < 0.8 < detection limit
30 0.114 0.125 0.105 < detection limit 1.196 < 1.0 < 0.9 < detection limit31 0.113 0.132 0.103 < detection limit < detection limit < 0.9 < 0.9 < detection limit
*** under maintenance
Ambient gamma dose rateMonthly mean ( x ) : 0.115
Monthly standard deviation (σ) : 0.005Monthly maximum : 0.159Monthly minimum : 0.098
Typical detection limits of the system are as follow :Artificial alpha concentration in airborne particulate - 1 Bq m-3
Artificial beta concentration in airborne particulate - 1 Bq m-3
Gaseous iodine-131 concentration - 1 Bq m-3
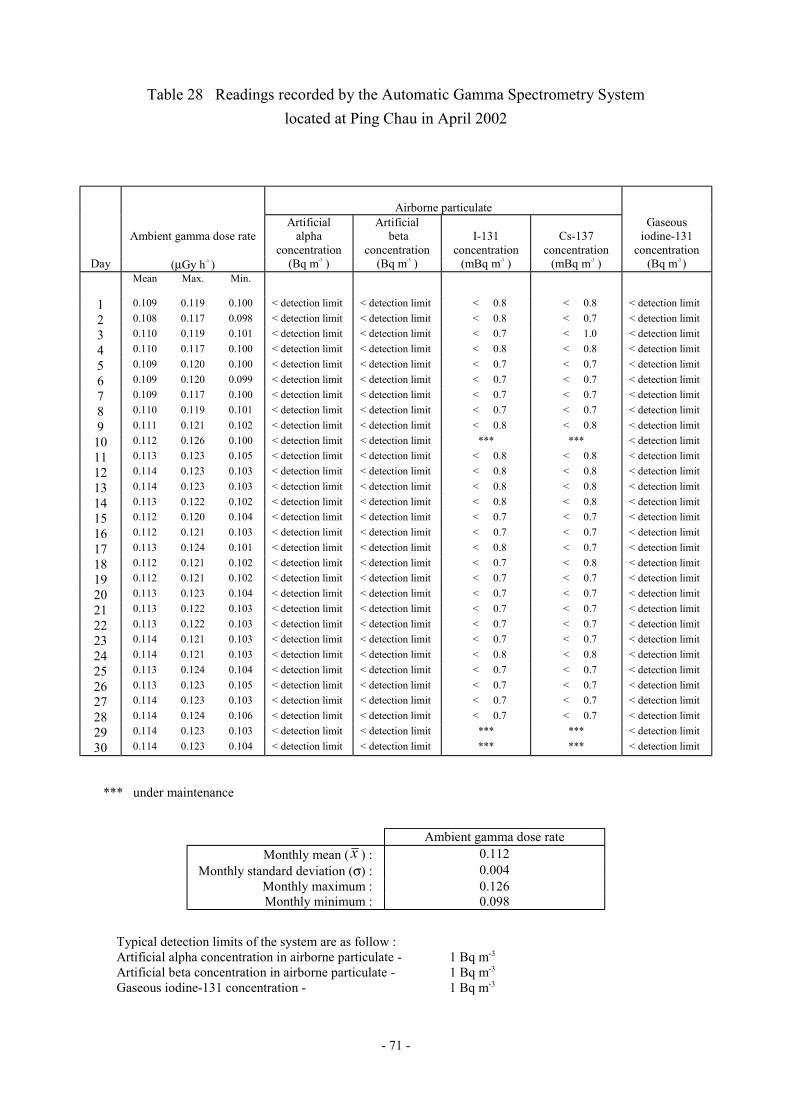
- 71 -
Table 28 Readings recorded by the Automatic Gamma Spectrometry Systemlocated at Ping Chau in April 2002
Airborne particulate
Ambient gamma dose rateArtificial
alphaconcentration
Artificial beta
concentrationI-131
concentrationCs-137
concentration
Gaseousiodine-131
concentrationDay (µGy h-1 ) (Bq m-3 ) (Bq m-3 ) (mBq m-3 ) (mBq m-3 ) (Bq m-3 )
Mean Max. Min.
1 0.109 0.119 0.100 < detection limit < detection limit < 0.8 < 0.8 < detection limit
2 0.108 0.117 0.098 < detection limit < detection limit < 0.8 < 0.7 < detection limit3 0.110 0.119 0.101 < detection limit < detection limit < 0.7 < 1.0 < detection limit
4 0.110 0.117 0.100 < detection limit < detection limit < 0.8 < 0.8 < detection limit
5 0.109 0.120 0.100 < detection limit < detection limit < 0.7 < 0.7 < detection limit
6 0.109 0.120 0.099 < detection limit < detection limit < 0.7 < 0.7 < detection limit7 0.109 0.117 0.100 < detection limit < detection limit < 0.7 < 0.7 < detection limit
8 0.110 0.119 0.101 < detection limit < detection limit < 0.7 < 0.7 < detection limit
9 0.111 0.121 0.102 < detection limit < detection limit < 0.8 < 0.8 < detection limit
10 0.112 0.126 0.100 < detection limit < detection limit *** *** < detection limit11 0.113 0.123 0.105 < detection limit < detection limit < 0.8 < 0.8 < detection limit
12 0.114 0.123 0.103 < detection limit < detection limit < 0.8 < 0.8 < detection limit
13 0.114 0.123 0.103 < detection limit < detection limit < 0.8 < 0.8 < detection limit
14 0.113 0.122 0.102 < detection limit < detection limit < 0.8 < 0.8 < detection limit15 0.112 0.120 0.104 < detection limit < detection limit < 0.7 < 0.7 < detection limit
16 0.112 0.121 0.103 < detection limit < detection limit < 0.7 < 0.7 < detection limit
17 0.113 0.124 0.101 < detection limit < detection limit < 0.8 < 0.7 < detection limit
18 0.112 0.121 0.102 < detection limit < detection limit < 0.7 < 0.8 < detection limit19 0.112 0.121 0.102 < detection limit < detection limit < 0.7 < 0.7 < detection limit
20 0.113 0.123 0.104 < detection limit < detection limit < 0.7 < 0.7 < detection limit
21 0.113 0.122 0.103 < detection limit < detection limit < 0.7 < 0.7 < detection limit
22 0.113 0.122 0.103 < detection limit < detection limit < 0.7 < 0.7 < detection limit23 0.114 0.121 0.103 < detection limit < detection limit < 0.7 < 0.7 < detection limit
24 0.114 0.121 0.103 < detection limit < detection limit < 0.8 < 0.8 < detection limit
25 0.113 0.124 0.104 < detection limit < detection limit < 0.7 < 0.7 < detection limit
26 0.113 0.123 0.105 < detection limit < detection limit < 0.7 < 0.7 < detection limit27 0.114 0.123 0.103 < detection limit < detection limit < 0.7 < 0.7 < detection limit
28 0.114 0.124 0.106 < detection limit < detection limit < 0.7 < 0.7 < detection limit
29 0.114 0.123 0.103 < detection limit < detection limit *** *** < detection limit
30 0.114 0.123 0.104 < detection limit < detection limit *** *** < detection limit
*** under maintenance
Ambient gamma dose rateMonthly mean ( x ) : 0.112
Monthly standard deviation (σ) : 0.004Monthly maximum : 0.126Monthly minimum : 0.098
Typical detection limits of the system are as follow :Artificial alpha concentration in airborne particulate - 1 Bq m-3
Artificial beta concentration in airborne particulate - 1 Bq m-3
Gaseous iodine-131 concentration - 1 Bq m-3
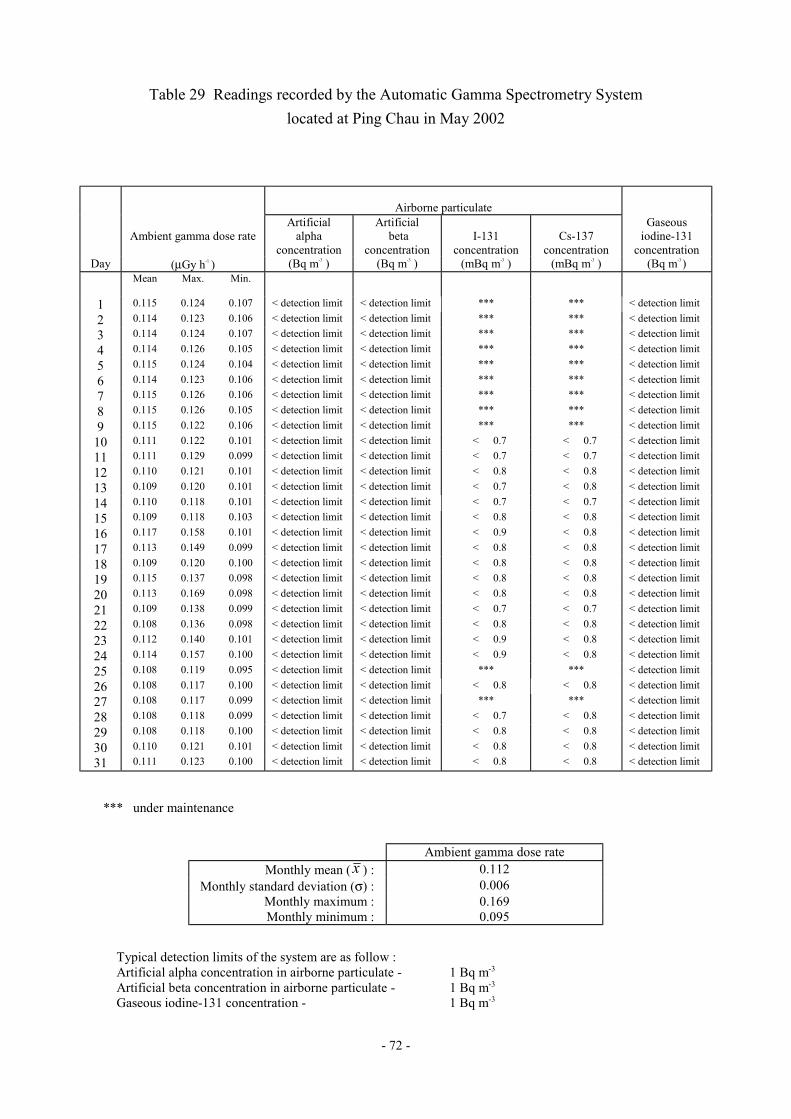
- 72 -
Table 29 Readings recorded by the Automatic Gamma Spectrometry Systemlocated at Ping Chau in May 2002
Airborne particulate
Ambient gamma dose rateArtificial
alphaconcentration
Artificial beta
concentrationI-131
concentrationCs-137
concentration
Gaseousiodine-131
concentrationDay (µGy h-1 ) (Bq m-3 ) (Bq m-3 ) (mBq m-3 ) (mBq m-3 ) (Bq m-3 )
Mean Max. Min.
1 0.115 0.124 0.107 < detection limit < detection limit *** *** < detection limit
2 0.114 0.123 0.106 < detection limit < detection limit *** *** < detection limit3 0.114 0.124 0.107 < detection limit < detection limit *** *** < detection limit
4 0.114 0.126 0.105 < detection limit < detection limit *** *** < detection limit
5 0.115 0.124 0.104 < detection limit < detection limit *** *** < detection limit
6 0.114 0.123 0.106 < detection limit < detection limit *** *** < detection limit7 0.115 0.126 0.106 < detection limit < detection limit *** *** < detection limit
8 0.115 0.126 0.105 < detection limit < detection limit *** *** < detection limit
9 0.115 0.122 0.106 < detection limit < detection limit *** *** < detection limit
10 0.111 0.122 0.101 < detection limit < detection limit < 0.7 < 0.7 < detection limit11 0.111 0.129 0.099 < detection limit < detection limit < 0.7 < 0.7 < detection limit
12 0.110 0.121 0.101 < detection limit < detection limit < 0.8 < 0.8 < detection limit
13 0.109 0.120 0.101 < detection limit < detection limit < 0.7 < 0.8 < detection limit
14 0.110 0.118 0.101 < detection limit < detection limit < 0.7 < 0.7 < detection limit15 0.109 0.118 0.103 < detection limit < detection limit < 0.8 < 0.8 < detection limit
16 0.117 0.158 0.101 < detection limit < detection limit < 0.9 < 0.8 < detection limit
17 0.113 0.149 0.099 < detection limit < detection limit < 0.8 < 0.8 < detection limit
18 0.109 0.120 0.100 < detection limit < detection limit < 0.8 < 0.8 < detection limit19 0.115 0.137 0.098 < detection limit < detection limit < 0.8 < 0.8 < detection limit
20 0.113 0.169 0.098 < detection limit < detection limit < 0.8 < 0.8 < detection limit
21 0.109 0.138 0.099 < detection limit < detection limit < 0.7 < 0.7 < detection limit
22 0.108 0.136 0.098 < detection limit < detection limit < 0.8 < 0.8 < detection limit23 0.112 0.140 0.101 < detection limit < detection limit < 0.9 < 0.8 < detection limit
24 0.114 0.157 0.100 < detection limit < detection limit < 0.9 < 0.8 < detection limit
25 0.108 0.119 0.095 < detection limit < detection limit *** *** < detection limit
26 0.108 0.117 0.100 < detection limit < detection limit < 0.8 < 0.8 < detection limit27 0.108 0.117 0.099 < detection limit < detection limit *** *** < detection limit
28 0.108 0.118 0.099 < detection limit < detection limit < 0.7 < 0.8 < detection limit
29 0.108 0.118 0.100 < detection limit < detection limit < 0.8 < 0.8 < detection limit
30 0.110 0.121 0.101 < detection limit < detection limit < 0.8 < 0.8 < detection limit31 0.111 0.123 0.100 < detection limit < detection limit < 0.8 < 0.8 < detection limit
*** under maintenance
Ambient gamma dose rateMonthly mean ( x ) : 0.112
Monthly standard deviation (σ) : 0.006Monthly maximum : 0.169Monthly minimum : 0.095
Typical detection limits of the system are as follow :Artificial alpha concentration in airborne particulate - 1 Bq m-3
Artificial beta concentration in airborne particulate - 1 Bq m-3
Gaseous iodine-131 concentration - 1 Bq m-3

- 73 -
Table 30 Readings recorded by the Automatic Gamma Spectrometry Systemlocated at Ping Chau in June 2002
Airborne particulate
Ambient gamma dose rateArtificial
alphaconcentration
Artificial beta
concentrationI-131
concentrationCs-137
concentration
Gaseousiodine-131
concentrationDay (µGy h-1 ) (Bq m-3 ) (Bq m-3 ) (mBq m-3 ) (mBq m-3 ) (Bq m-3 )
Mean Max. Min.
1 0.111 0.120 0.102 < detection limit < detection limit < 0.8 < 0.8 < detection limit
2 0.110 0.120 0.100 < detection limit < detection limit < 0.8 < 0.8 < detection limit3 0.110 0.120 0.102 < detection limit < detection limit < 0.7 < 0.8 < detection limit
4 0.110 0.118 0.100 < detection limit < detection limit < 0.7 < 0.8 < detection limit
5 0.110 0.119 0.101 < detection limit < detection limit *** *** < detection limit
6 0.110 0.124 0.098 < detection limit < detection limit < 0.6 < 0.7 < detection limit7 0.110 0.120 0.100 < detection limit < detection limit < 0.6 < 0.8 < detection limit
8 0.110 0.119 0.100 < detection limit < detection limit < 0.6 < 0.7 < detection limit
9 0.110 0.123 0.102 < detection limit < detection limit < 0.6 < 0.7 < detection limit
10 0.107 0.118 0.098 < detection limit < detection limit < 0.6 < 0.7 < detection limit11 0.115 0.154 0.100 < detection limit < detection limit < 0.6 < 0.8 < detection limit
12 0.107 0.119 0.097 < detection limit < detection limit < 0.6 < 0.8 < detection limit
13 0.106 0.115 0.095 < detection limit < detection limit < 0.6 < 0.7 < detection limit
14 0.106 0.117 0.097 < detection limit < detection limit *** *** < detection limit15 0.107 0.114 0.098 < detection limit < detection limit < 0.6 < 0.7 < detection limit
16 0.106 0.115 0.097 < detection limit < detection limit < 0.6 < 0.7 < detection limit
17 0.106 0.113 0.099 < detection limit < detection limit < 0.6 < 0.7 < detection limit
18 0.106 0.114 0.098 < detection limit < detection limit < 0.6 < 0.7 < detection limit19 0.107 0.115 0.099 < detection limit < detection limit *** *** < detection limit
20 0.106 0.114 0.098 < detection limit < detection limit < 0.6 < 0.7 < detection limit
21 0.105 0.114 0.097 < detection limit < detection limit < 0.6 < 0.7 < detection limit
22 0.106 0.116 0.097 < detection limit < detection limit < 0.6 < 0.8 < detection limit23 0.106 0.115 0.098 < detection limit < detection limit < 0.6 < 0.7 < detection limit
24 0.107 0.115 0.095 < detection limit < detection limit < 0.6 < 0.7 < detection limit
25 0.107 0.120 0.099 < detection limit < detection limit *** *** < detection limit
26 0.107 0.119 0.000 < detection limit < detection limit *** *** < detection limit27 0.109 0.117 0.101 < detection limit < detection limit < 0.6 < 0.7 < detection limit
28 0.109 0.118 0.098 < detection limit < detection limit < 0.6 < 0.7 < detection limit
29 0.109 0.117 0.100 < detection limit < detection limit < 0.6 < 0.7 < detection limit
30 0.110 0.119 0.100 < detection limit < detection limit < 0.6 < 0.7 < detection limit
*** under maintenance
Ambient gamma dose rateMonthly mean ( x ) : 0.108
Monthly standard deviation (σ) : 0.004Monthly maximum : 0.154Monthly minimum : 0.095
Typical detection limits of the system are as follow :Artificial alpha concentration in airborne particulate - 1 Bq m-3
Artificial beta concentration in airborne particulate - 1 Bq m-3
Gaseous iodine-131 concentration - 1 Bq m-3
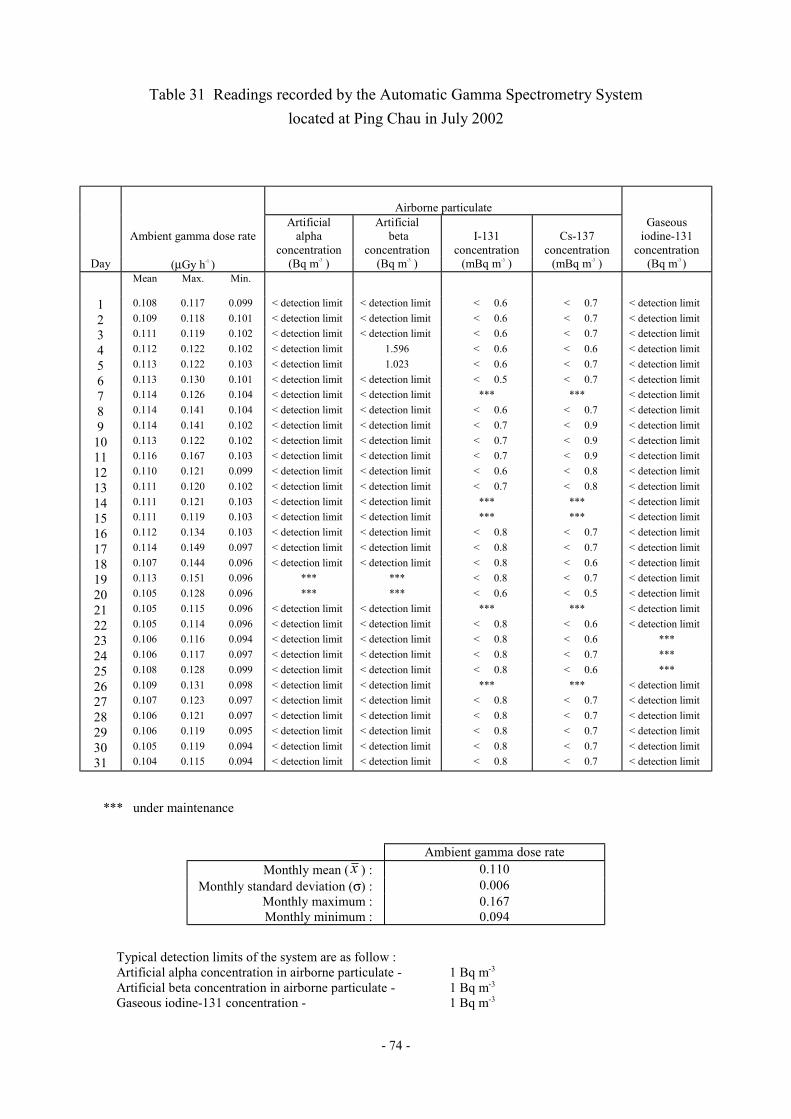
- 74 -
Table 31 Readings recorded by the Automatic Gamma Spectrometry Systemlocated at Ping Chau in July 2002
Airborne particulate
Ambient gamma dose rateArtificial
alphaconcentration
Artificial beta
concentrationI-131
concentrationCs-137
concentration
Gaseousiodine-131
concentrationDay (µGy h-1 ) (Bq m-3 ) (Bq m-3 ) (mBq m-3 ) (mBq m-3 ) (Bq m-3 )
Mean Max. Min.
1 0.108 0.117 0.099 < detection limit < detection limit < 0.6 < 0.7 < detection limit
2 0.109 0.118 0.101 < detection limit < detection limit < 0.6 < 0.7 < detection limit3 0.111 0.119 0.102 < detection limit < detection limit < 0.6 < 0.7 < detection limit
4 0.112 0.122 0.102 < detection limit 1.596 < 0.6 < 0.6 < detection limit
5 0.113 0.122 0.103 < detection limit 1.023 < 0.6 < 0.7 < detection limit
6 0.113 0.130 0.101 < detection limit < detection limit < 0.5 < 0.7 < detection limit7 0.114 0.126 0.104 < detection limit < detection limit *** *** < detection limit
8 0.114 0.141 0.104 < detection limit < detection limit < 0.6 < 0.7 < detection limit
9 0.114 0.141 0.102 < detection limit < detection limit < 0.7 < 0.9 < detection limit
10 0.113 0.122 0.102 < detection limit < detection limit < 0.7 < 0.9 < detection limit11 0.116 0.167 0.103 < detection limit < detection limit < 0.7 < 0.9 < detection limit
12 0.110 0.121 0.099 < detection limit < detection limit < 0.6 < 0.8 < detection limit
13 0.111 0.120 0.102 < detection limit < detection limit < 0.7 < 0.8 < detection limit
14 0.111 0.121 0.103 < detection limit < detection limit *** *** < detection limit15 0.111 0.119 0.103 < detection limit < detection limit *** *** < detection limit
16 0.112 0.134 0.103 < detection limit < detection limit < 0.8 < 0.7 < detection limit
17 0.114 0.149 0.097 < detection limit < detection limit < 0.8 < 0.7 < detection limit
18 0.107 0.144 0.096 < detection limit < detection limit < 0.8 < 0.6 < detection limit19 0.113 0.151 0.096 *** *** < 0.8 < 0.7 < detection limit
20 0.105 0.128 0.096 *** *** < 0.6 < 0.5 < detection limit
21 0.105 0.115 0.096 < detection limit < detection limit *** *** < detection limit
22 0.105 0.114 0.096 < detection limit < detection limit < 0.8 < 0.6 < detection limit23 0.106 0.116 0.094 < detection limit < detection limit < 0.8 < 0.6 ***
24 0.106 0.117 0.097 < detection limit < detection limit < 0.8 < 0.7 ***
25 0.108 0.128 0.099 < detection limit < detection limit < 0.8 < 0.6 ***
26 0.109 0.131 0.098 < detection limit < detection limit *** *** < detection limit27 0.107 0.123 0.097 < detection limit < detection limit < 0.8 < 0.7 < detection limit
28 0.106 0.121 0.097 < detection limit < detection limit < 0.8 < 0.7 < detection limit
29 0.106 0.119 0.095 < detection limit < detection limit < 0.8 < 0.7 < detection limit
30 0.105 0.119 0.094 < detection limit < detection limit < 0.8 < 0.7 < detection limit31 0.104 0.115 0.094 < detection limit < detection limit < 0.8 < 0.7 < detection limit
*** under maintenance
Ambient gamma dose rateMonthly mean ( x ) : 0.110
Monthly standard deviation (σ) : 0.006Monthly maximum : 0.167Monthly minimum : 0.094
Typical detection limits of the system are as follow :Artificial alpha concentration in airborne particulate - 1 Bq m-3
Artificial beta concentration in airborne particulate - 1 Bq m-3
Gaseous iodine-131 concentration - 1 Bq m-3
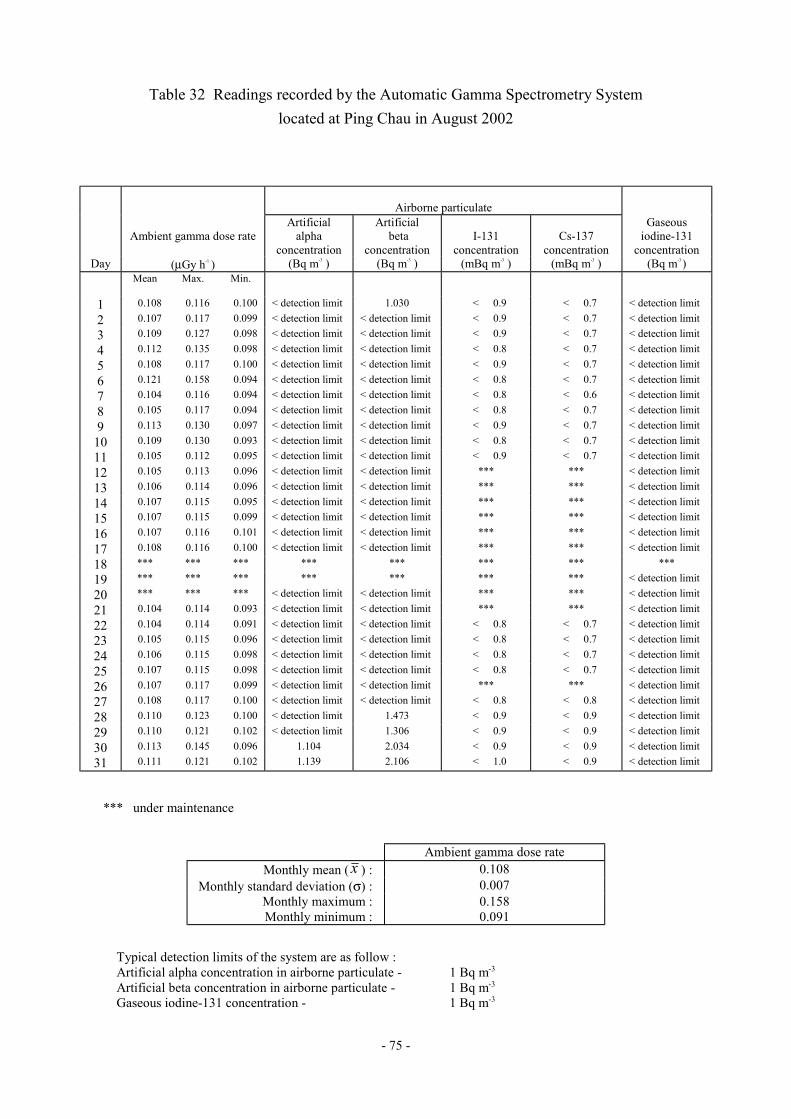
- 75 -
Table 32 Readings recorded by the Automatic Gamma Spectrometry Systemlocated at Ping Chau in August 2002
Airborne particulate
Ambient gamma dose rateArtificial
alphaconcentration
Artificial beta
concentrationI-131
concentrationCs-137
concentration
Gaseousiodine-131
concentrationDay (µGy h-1 ) (Bq m-3 ) (Bq m-3 ) (mBq m-3 ) (mBq m-3 ) (Bq m-3 )
Mean Max. Min.
1 0.108 0.116 0.100 < detection limit 1.030 < 0.9 < 0.7 < detection limit
2 0.107 0.117 0.099 < detection limit < detection limit < 0.9 < 0.7 < detection limit3 0.109 0.127 0.098 < detection limit < detection limit < 0.9 < 0.7 < detection limit
4 0.112 0.135 0.098 < detection limit < detection limit < 0.8 < 0.7 < detection limit
5 0.108 0.117 0.100 < detection limit < detection limit < 0.9 < 0.7 < detection limit
6 0.121 0.158 0.094 < detection limit < detection limit < 0.8 < 0.7 < detection limit7 0.104 0.116 0.094 < detection limit < detection limit < 0.8 < 0.6 < detection limit
8 0.105 0.117 0.094 < detection limit < detection limit < 0.8 < 0.7 < detection limit
9 0.113 0.130 0.097 < detection limit < detection limit < 0.9 < 0.7 < detection limit
10 0.109 0.130 0.093 < detection limit < detection limit < 0.8 < 0.7 < detection limit11 0.105 0.112 0.095 < detection limit < detection limit < 0.9 < 0.7 < detection limit
12 0.105 0.113 0.096 < detection limit < detection limit *** *** < detection limit
13 0.106 0.114 0.096 < detection limit < detection limit *** *** < detection limit
14 0.107 0.115 0.095 < detection limit < detection limit *** *** < detection limit15 0.107 0.115 0.099 < detection limit < detection limit *** *** < detection limit
16 0.107 0.116 0.101 < detection limit < detection limit *** *** < detection limit
17 0.108 0.116 0.100 < detection limit < detection limit *** *** < detection limit
18 *** *** *** *** *** *** *** ***19 *** *** *** *** *** *** *** < detection limit
20 *** *** *** < detection limit < detection limit *** *** < detection limit
21 0.104 0.114 0.093 < detection limit < detection limit *** *** < detection limit
22 0.104 0.114 0.091 < detection limit < detection limit < 0.8 < 0.7 < detection limit23 0.105 0.115 0.096 < detection limit < detection limit < 0.8 < 0.7 < detection limit
24 0.106 0.115 0.098 < detection limit < detection limit < 0.8 < 0.7 < detection limit
25 0.107 0.115 0.098 < detection limit < detection limit < 0.8 < 0.7 < detection limit
26 0.107 0.117 0.099 < detection limit < detection limit *** *** < detection limit27 0.108 0.117 0.100 < detection limit < detection limit < 0.8 < 0.8 < detection limit
28 0.110 0.123 0.100 < detection limit 1.473 < 0.9 < 0.9 < detection limit
29 0.110 0.121 0.102 < detection limit 1.306 < 0.9 < 0.9 < detection limit
30 0.113 0.145 0.096 1.104 2.034 < 0.9 < 0.9 < detection limit31 0.111 0.121 0.102 1.139 2.106 < 1.0 < 0.9 < detection limit
*** under maintenance
Ambient gamma dose rateMonthly mean ( x ) : 0.108
Monthly standard deviation (σ) : 0.007Monthly maximum : 0.158Monthly minimum : 0.091
Typical detection limits of the system are as follow :Artificial alpha concentration in airborne particulate - 1 Bq m-3
Artificial beta concentration in airborne particulate - 1 Bq m-3
Gaseous iodine-131 concentration - 1 Bq m-3
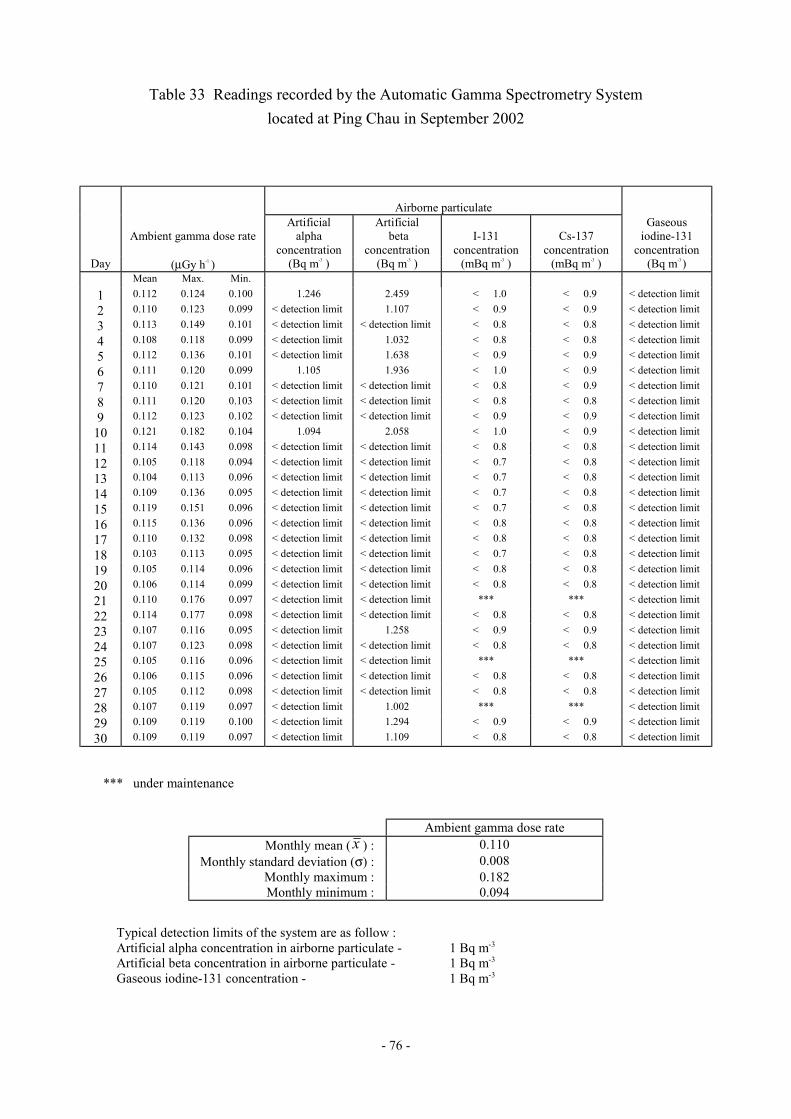
- 76 -
Table 33 Readings recorded by the Automatic Gamma Spectrometry Systemlocated at Ping Chau in September 2002
Airborne particulate
Ambient gamma dose rateArtificial
alphaconcentration
Artificial beta
concentrationI-131
concentrationCs-137
concentration
Gaseousiodine-131
concentrationDay (µGy h-1 ) (Bq m-3 ) (Bq m-3 ) (mBq m-3 ) (mBq m-3 ) (Bq m-3 )
Mean Max. Min.
1 0.112 0.124 0.100 1.246 2.459 < 1.0 < 0.9 < detection limit
2 0.110 0.123 0.099 < detection limit 1.107 < 0.9 < 0.9 < detection limit
3 0.113 0.149 0.101 < detection limit < detection limit < 0.8 < 0.8 < detection limit
4 0.108 0.118 0.099 < detection limit 1.032 < 0.8 < 0.8 < detection limit5 0.112 0.136 0.101 < detection limit 1.638 < 0.9 < 0.9 < detection limit
6 0.111 0.120 0.099 1.105 1.936 < 1.0 < 0.9 < detection limit
7 0.110 0.121 0.101 < detection limit < detection limit < 0.8 < 0.9 < detection limit
8 0.111 0.120 0.103 < detection limit < detection limit < 0.8 < 0.8 < detection limit9 0.112 0.123 0.102 < detection limit < detection limit < 0.9 < 0.9 < detection limit
10 0.121 0.182 0.104 1.094 2.058 < 1.0 < 0.9 < detection limit
11 0.114 0.143 0.098 < detection limit < detection limit < 0.8 < 0.8 < detection limit
12 0.105 0.118 0.094 < detection limit < detection limit < 0.7 < 0.8 < detection limit13 0.104 0.113 0.096 < detection limit < detection limit < 0.7 < 0.8 < detection limit
14 0.109 0.136 0.095 < detection limit < detection limit < 0.7 < 0.8 < detection limit
15 0.119 0.151 0.096 < detection limit < detection limit < 0.7 < 0.8 < detection limit
16 0.115 0.136 0.096 < detection limit < detection limit < 0.8 < 0.8 < detection limit17 0.110 0.132 0.098 < detection limit < detection limit < 0.8 < 0.8 < detection limit
18 0.103 0.113 0.095 < detection limit < detection limit < 0.7 < 0.8 < detection limit
19 0.105 0.114 0.096 < detection limit < detection limit < 0.8 < 0.8 < detection limit
20 0.106 0.114 0.099 < detection limit < detection limit < 0.8 < 0.8 < detection limit21 0.110 0.176 0.097 < detection limit < detection limit *** *** < detection limit
22 0.114 0.177 0.098 < detection limit < detection limit < 0.8 < 0.8 < detection limit
23 0.107 0.116 0.095 < detection limit 1.258 < 0.9 < 0.9 < detection limit
24 0.107 0.123 0.098 < detection limit < detection limit < 0.8 < 0.8 < detection limit25 0.105 0.116 0.096 < detection limit < detection limit *** *** < detection limit
26 0.106 0.115 0.096 < detection limit < detection limit < 0.8 < 0.8 < detection limit
27 0.105 0.112 0.098 < detection limit < detection limit < 0.8 < 0.8 < detection limit
28 0.107 0.119 0.097 < detection limit 1.002 *** *** < detection limit29 0.109 0.119 0.100 < detection limit 1.294 < 0.9 < 0.9 < detection limit
30 0.109 0.119 0.097 < detection limit 1.109 < 0.8 < 0.8 < detection limit
*** under maintenance
Ambient gamma dose rateMonthly mean ( x ) : 0.110
Monthly standard deviation (σ) : 0.008Monthly maximum : 0.182Monthly minimum : 0.094
Typical detection limits of the system are as follow :Artificial alpha concentration in airborne particulate - 1 Bq m-3
Artificial beta concentration in airborne particulate - 1 Bq m-3
Gaseous iodine-131 concentration - 1 Bq m-3
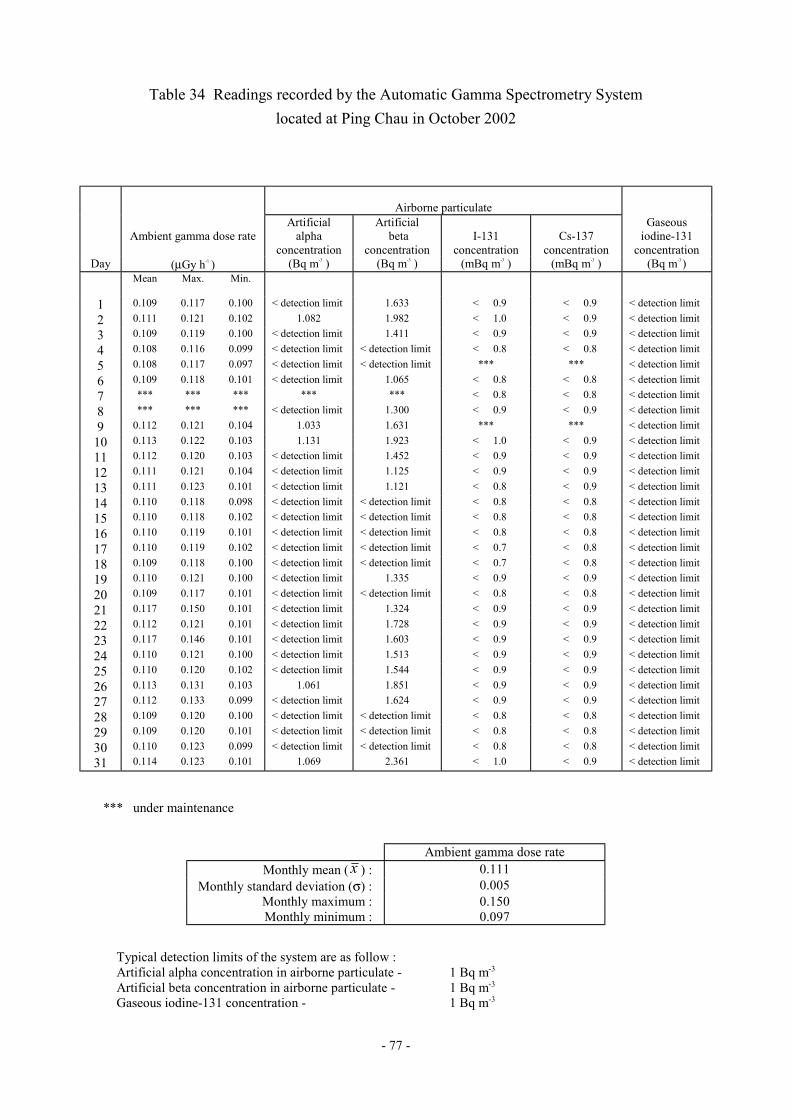
- 77 -
Table 34 Readings recorded by the Automatic Gamma Spectrometry Systemlocated at Ping Chau in October 2002
Airborne particulate
Ambient gamma dose rateArtificial
alphaconcentration
Artificial beta
concentrationI-131
concentrationCs-137
concentration
Gaseousiodine-131
concentrationDay (µGy h-1 ) (Bq m-3 ) (Bq m-3 ) (mBq m-3 ) (mBq m-3 ) (Bq m-3 )
Mean Max. Min.
1 0.109 0.117 0.100 < detection limit 1.633 < 0.9 < 0.9 < detection limit
2 0.111 0.121 0.102 1.082 1.982 < 1.0 < 0.9 < detection limit3 0.109 0.119 0.100 < detection limit 1.411 < 0.9 < 0.9 < detection limit
4 0.108 0.116 0.099 < detection limit < detection limit < 0.8 < 0.8 < detection limit
5 0.108 0.117 0.097 < detection limit < detection limit *** *** < detection limit
6 0.109 0.118 0.101 < detection limit 1.065 < 0.8 < 0.8 < detection limit7 *** *** *** *** *** < 0.8 < 0.8 < detection limit
8 *** *** *** < detection limit 1.300 < 0.9 < 0.9 < detection limit
9 0.112 0.121 0.104 1.033 1.631 *** *** < detection limit
10 0.113 0.122 0.103 1.131 1.923 < 1.0 < 0.9 < detection limit11 0.112 0.120 0.103 < detection limit 1.452 < 0.9 < 0.9 < detection limit
12 0.111 0.121 0.104 < detection limit 1.125 < 0.9 < 0.9 < detection limit
13 0.111 0.123 0.101 < detection limit 1.121 < 0.8 < 0.9 < detection limit
14 0.110 0.118 0.098 < detection limit < detection limit < 0.8 < 0.8 < detection limit15 0.110 0.118 0.102 < detection limit < detection limit < 0.8 < 0.8 < detection limit
16 0.110 0.119 0.101 < detection limit < detection limit < 0.8 < 0.8 < detection limit
17 0.110 0.119 0.102 < detection limit < detection limit < 0.7 < 0.8 < detection limit
18 0.109 0.118 0.100 < detection limit < detection limit < 0.7 < 0.8 < detection limit19 0.110 0.121 0.100 < detection limit 1.335 < 0.9 < 0.9 < detection limit
20 0.109 0.117 0.101 < detection limit < detection limit < 0.8 < 0.8 < detection limit
21 0.117 0.150 0.101 < detection limit 1.324 < 0.9 < 0.9 < detection limit
22 0.112 0.121 0.101 < detection limit 1.728 < 0.9 < 0.9 < detection limit23 0.117 0.146 0.101 < detection limit 1.603 < 0.9 < 0.9 < detection limit
24 0.110 0.121 0.100 < detection limit 1.513 < 0.9 < 0.9 < detection limit
25 0.110 0.120 0.102 < detection limit 1.544 < 0.9 < 0.9 < detection limit
26 0.113 0.131 0.103 1.061 1.851 < 0.9 < 0.9 < detection limit27 0.112 0.133 0.099 < detection limit 1.624 < 0.9 < 0.9 < detection limit
28 0.109 0.120 0.100 < detection limit < detection limit < 0.8 < 0.8 < detection limit
29 0.109 0.120 0.101 < detection limit < detection limit < 0.8 < 0.8 < detection limit
30 0.110 0.123 0.099 < detection limit < detection limit < 0.8 < 0.8 < detection limit31 0.114 0.123 0.101 1.069 2.361 < 1.0 < 0.9 < detection limit
*** under maintenance
Ambient gamma dose rateMonthly mean ( x ) : 0.111
Monthly standard deviation (σ) : 0.005Monthly maximum : 0.150Monthly minimum : 0.097
Typical detection limits of the system are as follow :Artificial alpha concentration in airborne particulate - 1 Bq m-3
Artificial beta concentration in airborne particulate - 1 Bq m-3
Gaseous iodine-131 concentration - 1 Bq m-3
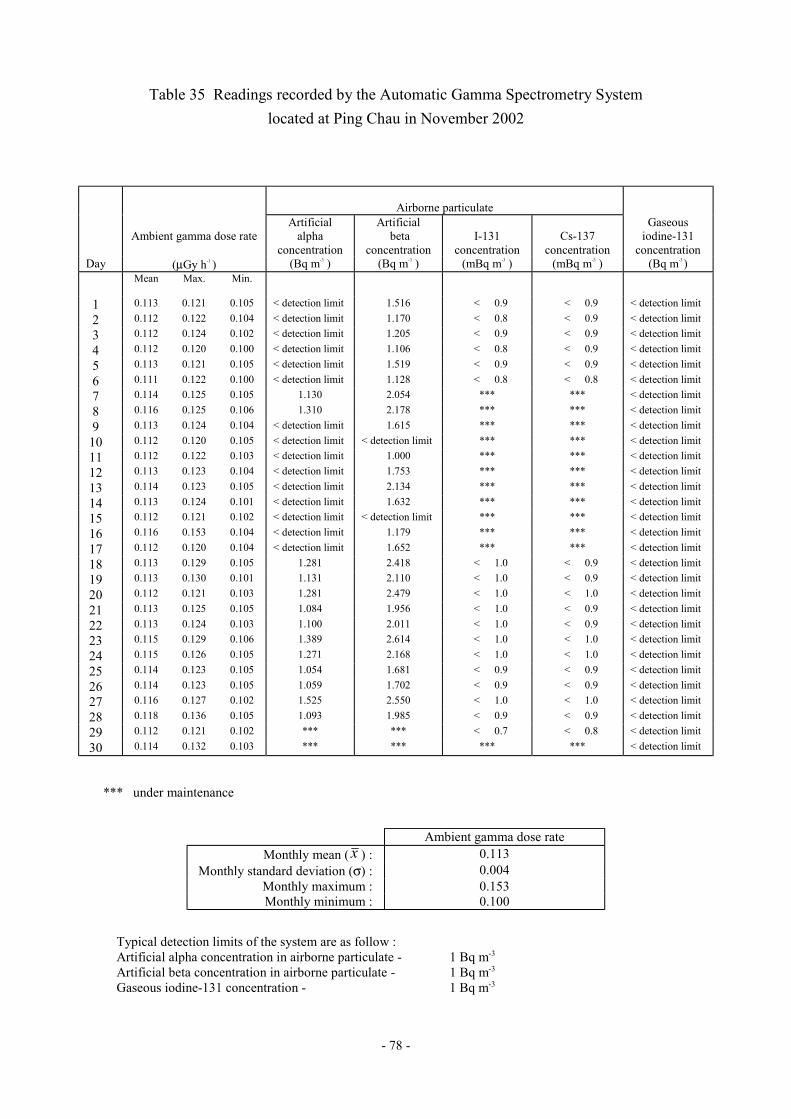
- 78 -
Table 35 Readings recorded by the Automatic Gamma Spectrometry Systemlocated at Ping Chau in November 2002
Airborne particulate
Ambient gamma dose rateArtificial
alphaconcentration
Artificial beta
concentrationI-131
concentrationCs-137
concentration
Gaseousiodine-131
concentrationDay (µGy h-1 ) (Bq m-3 ) (Bq m-3 ) (mBq m-3 ) (mBq m-3 ) (Bq m-3 )
Mean Max. Min.
1 0.113 0.121 0.105 < detection limit 1.516 < 0.9 < 0.9 < detection limit
2 0.112 0.122 0.104 < detection limit 1.170 < 0.8 < 0.9 < detection limit3 0.112 0.124 0.102 < detection limit 1.205 < 0.9 < 0.9 < detection limit
4 0.112 0.120 0.100 < detection limit 1.106 < 0.8 < 0.9 < detection limit
5 0.113 0.121 0.105 < detection limit 1.519 < 0.9 < 0.9 < detection limit
6 0.111 0.122 0.100 < detection limit 1.128 < 0.8 < 0.8 < detection limit7 0.114 0.125 0.105 1.130 2.054 *** *** < detection limit
8 0.116 0.125 0.106 1.310 2.178 *** *** < detection limit
9 0.113 0.124 0.104 < detection limit 1.615 *** *** < detection limit
10 0.112 0.120 0.105 < detection limit < detection limit *** *** < detection limit11 0.112 0.122 0.103 < detection limit 1.000 *** *** < detection limit
12 0.113 0.123 0.104 < detection limit 1.753 *** *** < detection limit
13 0.114 0.123 0.105 < detection limit 2.134 *** *** < detection limit
14 0.113 0.124 0.101 < detection limit 1.632 *** *** < detection limit15 0.112 0.121 0.102 < detection limit < detection limit *** *** < detection limit
16 0.116 0.153 0.104 < detection limit 1.179 *** *** < detection limit
17 0.112 0.120 0.104 < detection limit 1.652 *** *** < detection limit
18 0.113 0.129 0.105 1.281 2.418 < 1.0 < 0.9 < detection limit19 0.113 0.130 0.101 1.131 2.110 < 1.0 < 0.9 < detection limit
20 0.112 0.121 0.103 1.281 2.479 < 1.0 < 1.0 < detection limit
21 0.113 0.125 0.105 1.084 1.956 < 1.0 < 0.9 < detection limit
22 0.113 0.124 0.103 1.100 2.011 < 1.0 < 0.9 < detection limit23 0.115 0.129 0.106 1.389 2.614 < 1.0 < 1.0 < detection limit
24 0.115 0.126 0.105 1.271 2.168 < 1.0 < 1.0 < detection limit
25 0.114 0.123 0.105 1.054 1.681 < 0.9 < 0.9 < detection limit
26 0.114 0.123 0.105 1.059 1.702 < 0.9 < 0.9 < detection limit27 0.116 0.127 0.102 1.525 2.550 < 1.0 < 1.0 < detection limit
28 0.118 0.136 0.105 1.093 1.985 < 0.9 < 0.9 < detection limit
29 0.112 0.121 0.102 *** *** < 0.7 < 0.8 < detection limit
30 0.114 0.132 0.103 *** *** *** *** < detection limit
*** under maintenance
Ambient gamma dose rateMonthly mean ( x ) : 0.113
Monthly standard deviation (σ) : 0.004Monthly maximum : 0.153Monthly minimum : 0.100
Typical detection limits of the system are as follow :Artificial alpha concentration in airborne particulate - 1 Bq m-3
Artificial beta concentration in airborne particulate - 1 Bq m-3
Gaseous iodine-131 concentration - 1 Bq m-3
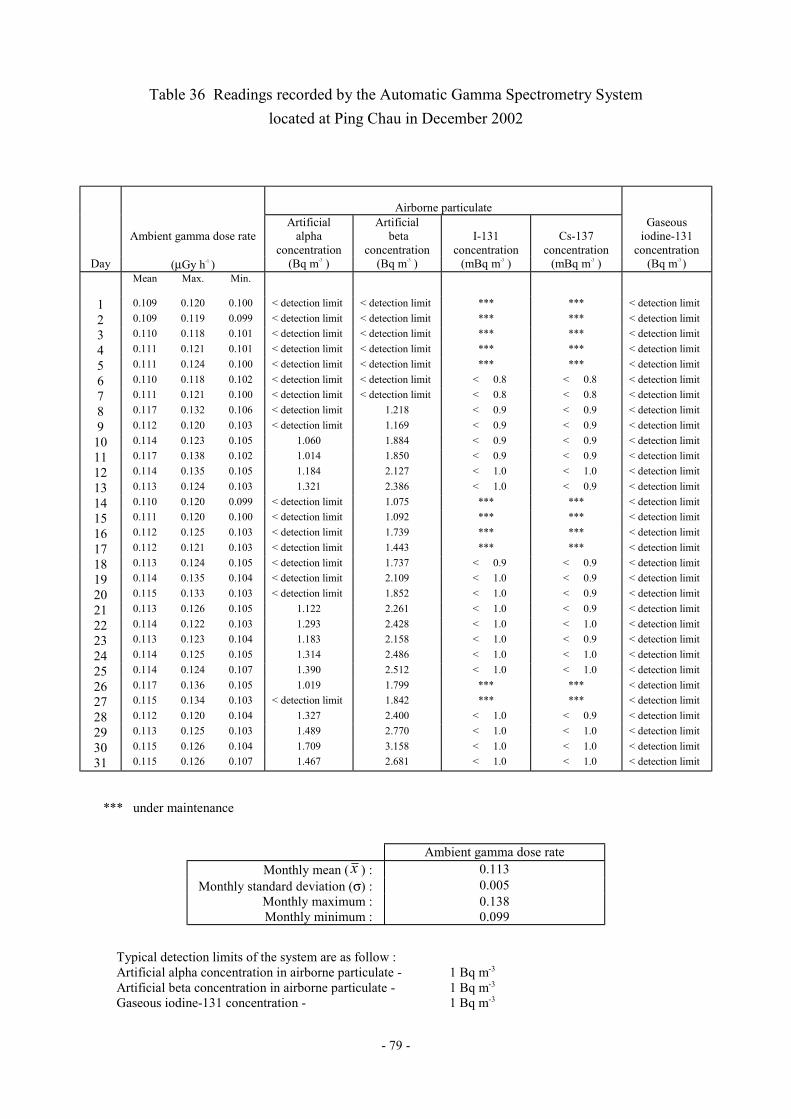
- 79 -
Table 36 Readings recorded by the Automatic Gamma Spectrometry Systemlocated at Ping Chau in December 2002
Airborne particulate
Ambient gamma dose rateArtificial
alphaconcentration
Artificial beta
concentrationI-131
concentrationCs-137
concentration
Gaseousiodine-131
concentrationDay (µGy h-1 ) (Bq m-3 ) (Bq m-3 ) (mBq m-3 ) (mBq m-3 ) (Bq m-3 )
Mean Max. Min.
1 0.109 0.120 0.100 < detection limit < detection limit *** *** < detection limit
2 0.109 0.119 0.099 < detection limit < detection limit *** *** < detection limit3 0.110 0.118 0.101 < detection limit < detection limit *** *** < detection limit
4 0.111 0.121 0.101 < detection limit < detection limit *** *** < detection limit
5 0.111 0.124 0.100 < detection limit < detection limit *** *** < detection limit
6 0.110 0.118 0.102 < detection limit < detection limit < 0.8 < 0.8 < detection limit7 0.111 0.121 0.100 < detection limit < detection limit < 0.8 < 0.8 < detection limit
8 0.117 0.132 0.106 < detection limit 1.218 < 0.9 < 0.9 < detection limit
9 0.112 0.120 0.103 < detection limit 1.169 < 0.9 < 0.9 < detection limit
10 0.114 0.123 0.105 1.060 1.884 < 0.9 < 0.9 < detection limit11 0.117 0.138 0.102 1.014 1.850 < 0.9 < 0.9 < detection limit
12 0.114 0.135 0.105 1.184 2.127 < 1.0 < 1.0 < detection limit
13 0.113 0.124 0.103 1.321 2.386 < 1.0 < 0.9 < detection limit
14 0.110 0.120 0.099 < detection limit 1.075 *** *** < detection limit15 0.111 0.120 0.100 < detection limit 1.092 *** *** < detection limit
16 0.112 0.125 0.103 < detection limit 1.739 *** *** < detection limit
17 0.112 0.121 0.103 < detection limit 1.443 *** *** < detection limit
18 0.113 0.124 0.105 < detection limit 1.737 < 0.9 < 0.9 < detection limit19 0.114 0.135 0.104 < detection limit 2.109 < 1.0 < 0.9 < detection limit
20 0.115 0.133 0.103 < detection limit 1.852 < 1.0 < 0.9 < detection limit
21 0.113 0.126 0.105 1.122 2.261 < 1.0 < 0.9 < detection limit
22 0.114 0.122 0.103 1.293 2.428 < 1.0 < 1.0 < detection limit23 0.113 0.123 0.104 1.183 2.158 < 1.0 < 0.9 < detection limit
24 0.114 0.125 0.105 1.314 2.486 < 1.0 < 1.0 < detection limit
25 0.114 0.124 0.107 1.390 2.512 < 1.0 < 1.0 < detection limit
26 0.117 0.136 0.105 1.019 1.799 *** *** < detection limit27 0.115 0.134 0.103 < detection limit 1.842 *** *** < detection limit
28 0.112 0.120 0.104 1.327 2.400 < 1.0 < 0.9 < detection limit
29 0.113 0.125 0.103 1.489 2.770 < 1.0 < 1.0 < detection limit
30 0.115 0.126 0.104 1.709 3.158 < 1.0 < 1.0 < detection limit31 0.115 0.126 0.107 1.467 2.681 < 1.0 < 1.0 < detection limit
*** under maintenance
Ambient gamma dose rateMonthly mean ( x ) : 0.113
Monthly standard deviation (σ) : 0.005Monthly maximum : 0.138Monthly minimum : 0.099
Typical detection limits of the system are as follow :Artificial alpha concentration in airborne particulate - 1 Bq m-3
Artificial beta concentration in airborne particulate - 1 Bq m-3
Gaseous iodine-131 concentration - 1 Bq m-3

- 80 -
Table 37 Mean gamma plus beta and mean gamma only radiation levels measuredby radioactivity sonde on 6 June 2002
Mean radiation level (counts s-1) Mean ratio Height interval (m) Gamma + beta Gamma (gamma + beta)
gammaMean Min. Max. Mean Min. Max.
66 - 100 0.36 0.34 0.37 0.49 0.41 0.55 0.73100 - 200 0.27 0.19 0.33 0.20 0.12 0.36 1.35200 - 300 0.18 0.17 0.20 0.20 0.18 0.24 0.90300 - 400 0.20 0.15 0.22 0.26 0.22 0.30 0.77400 - 500 0.15 0.12 0.21 0.19 0.16 0.20 0.79500 - 600 0.17 0.15 0.21 0.22 0.16 0.24 0.77600 - 700 0.20 0.17 0.24 0.19 0.17 0.22 1.05700 - 800 0.24 0.21 0.27 0.10 0.05 0.17 2.40800 - 900 0.15 0.12 0.25 0.13 0.09 0.17 1.15900 - 1000 0.21 0.15 0.27 0.19 0.15 0.28 1.11
1000 - 1100 0.13 0.05 0.21 0.20 0.16 0.22 0.651100 - 1200 0.14 0.06 0.20 0.10 0.04 0.13 1.401200 - 1300 0.26 0.23 0.31 0.07 0.03 0.13 3.711300 - 1400 0.17 0.12 0.22 0.20 0.15 0.26 0.851400 - 1500 0.16 0.12 0.18 0.26 0.23 0.30 0.621500 - 1600 0.11 0.08 0.12 0.14 0.09 0.19 0.791600 - 1700 0.06 0.03 0.09 0.03 0.01 0.05 2.001700 - 1800 0.15 0.09 0.23 0.10 0.05 0.17 1.501800 - 1900 0.24 0.21 0.26 0.16 0.14 0.17 1.501900 - 2000 0.27 0.22 0.29 0.13 0.12 0.16 2.082000 - 2100 0.24 0.21 0.30 0.16 0.15 0.18 1.502100 - 2200 0.21 0.20 0.24 0.12 0.11 0.15 1.752200 - 2300 0.23 0.22 0.24 0.11 0.08 0.14 2.092300 - 2400 0.25 0.23 0.29 0.17 0.13 0.19 1.472400 - 2500 0.38 0.29 0.43 0.17 0.15 0.17 2.242500 - 2600 0.29 0.23 0.35 0.09 0.06 0.13 3.222600 - 2700 0.06 0.02 0.20 0.09 0.06 0.16 0.672700 - 2800 0.11 0.07 0.13 0.22 0.16 0.27 0.502800 - 2900 0.16 0.10 0.19 0.32 0.29 0.35 0.502900 - 3000 0.19 0.18 0.22 0.29 0.26 0.33 0.663000 - 3300 0.21 0.15 0.29 0.39 0.19 0.61 0.543300 - 3600 0.28 0.10 0.42 0.40 0.28 0.55 0.703600 - 3900 0.30 0.10 0.46 0.32 0.17 0.51 0.943900 - 4200 0.32 0.16 0.48 0.44 0.23 0.62 0.734200 - 4500 0.35 0.19 0.50 0.51 0.44 0.59 0.694500 - 4800 0.15 0.05 0.35 0.59 0.49 0.68 0.254800 - 5100 0.28 0.16 0.36 0.38 0.22 0.51 0.745100 - 5400 0.33 0.22 0.41 0.50 0.35 0.61 0.665400 - 5700 0.41 0.27 0.56 0.49 0.33 0.64 0.845700 - 6000 0.39 0.27 0.55 0.59 0.47 0.67 0.666000 - 6300 0.50 0.39 0.63 0.65 0.47 0.78 0.776300 - 6600 0.45 0.33 0.66 0.83 0.74 0.94 0.546600 - 6900 0.44 0.36 0.53 0.89 0.62 1.08 0.496900 - 7200 0.48 0.37 0.65 0.83 0.58 0.96 0.587200 - 7500 0.59 0.39 0.73 0.85 0.76 0.91 0.697500 - 7800 0.46 0.25 0.64 1.09 0.91 1.25 0.42
- to be continued on next page -
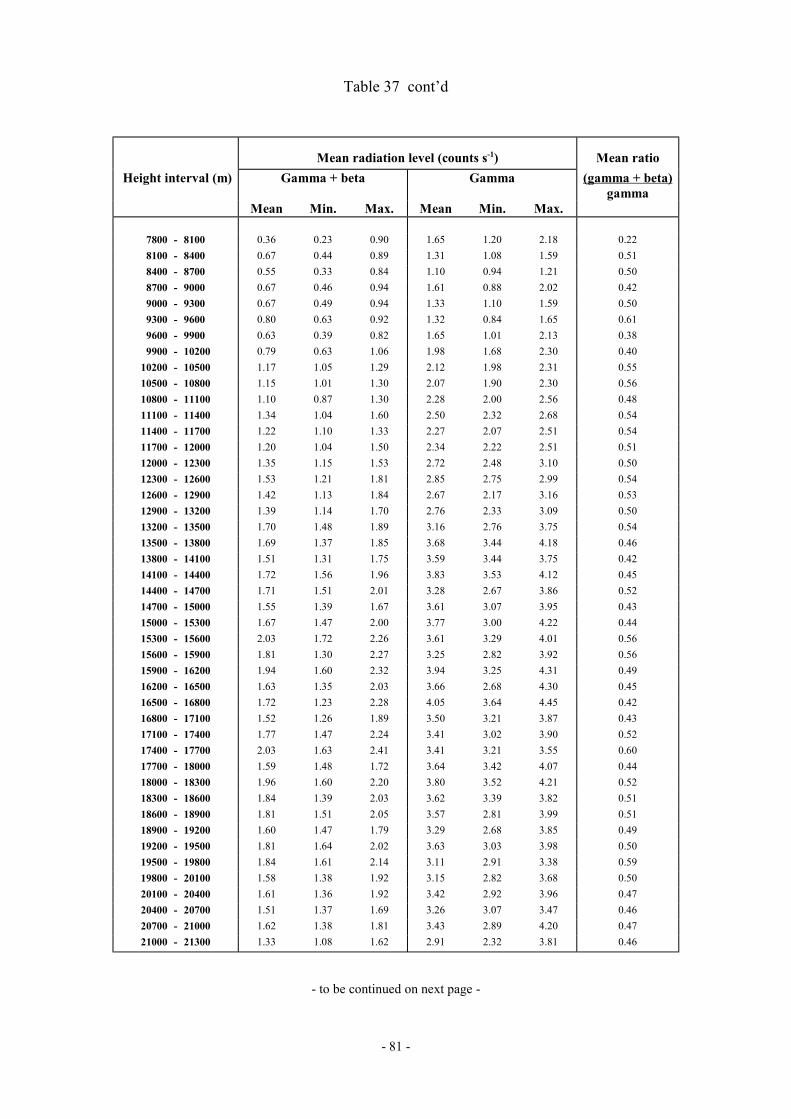
- 81 -
Table 37 cont’d
Mean radiation level (counts s-1) Mean ratio Height interval (m) Gamma + beta Gamma (gamma + beta)
gammaMean Min. Max. Mean Min. Max.
7800 - 8100 0.36 0.23 0.90 1.65 1.20 2.18 0.228100 - 8400 0.67 0.44 0.89 1.31 1.08 1.59 0.518400 - 8700 0.55 0.33 0.84 1.10 0.94 1.21 0.508700 - 9000 0.67 0.46 0.94 1.61 0.88 2.02 0.429000 - 9300 0.67 0.49 0.94 1.33 1.10 1.59 0.509300 - 9600 0.80 0.63 0.92 1.32 0.84 1.65 0.619600 - 9900 0.63 0.39 0.82 1.65 1.01 2.13 0.389900 - 10200 0.79 0.63 1.06 1.98 1.68 2.30 0.40
10200 - 10500 1.17 1.05 1.29 2.12 1.98 2.31 0.5510500 - 10800 1.15 1.01 1.30 2.07 1.90 2.30 0.5610800 - 11100 1.10 0.87 1.30 2.28 2.00 2.56 0.4811100 - 11400 1.34 1.04 1.60 2.50 2.32 2.68 0.5411400 - 11700 1.22 1.10 1.33 2.27 2.07 2.51 0.5411700 - 12000 1.20 1.04 1.50 2.34 2.22 2.51 0.5112000 - 12300 1.35 1.15 1.53 2.72 2.48 3.10 0.5012300 - 12600 1.53 1.21 1.81 2.85 2.75 2.99 0.5412600 - 12900 1.42 1.13 1.84 2.67 2.17 3.16 0.5312900 - 13200 1.39 1.14 1.70 2.76 2.33 3.09 0.5013200 - 13500 1.70 1.48 1.89 3.16 2.76 3.75 0.5413500 - 13800 1.69 1.37 1.85 3.68 3.44 4.18 0.4613800 - 14100 1.51 1.31 1.75 3.59 3.44 3.75 0.4214100 - 14400 1.72 1.56 1.96 3.83 3.53 4.12 0.4514400 - 14700 1.71 1.51 2.01 3.28 2.67 3.86 0.5214700 - 15000 1.55 1.39 1.67 3.61 3.07 3.95 0.4315000 - 15300 1.67 1.47 2.00 3.77 3.00 4.22 0.4415300 - 15600 2.03 1.72 2.26 3.61 3.29 4.01 0.5615600 - 15900 1.81 1.30 2.27 3.25 2.82 3.92 0.5615900 - 16200 1.94 1.60 2.32 3.94 3.25 4.31 0.4916200 - 16500 1.63 1.35 2.03 3.66 2.68 4.30 0.4516500 - 16800 1.72 1.23 2.28 4.05 3.64 4.45 0.4216800 - 17100 1.52 1.26 1.89 3.50 3.21 3.87 0.4317100 - 17400 1.77 1.47 2.24 3.41 3.02 3.90 0.5217400 - 17700 2.03 1.63 2.41 3.41 3.21 3.55 0.6017700 - 18000 1.59 1.48 1.72 3.64 3.42 4.07 0.4418000 - 18300 1.96 1.60 2.20 3.80 3.52 4.21 0.5218300 - 18600 1.84 1.39 2.03 3.62 3.39 3.82 0.5118600 - 18900 1.81 1.51 2.05 3.57 2.81 3.99 0.5118900 - 19200 1.60 1.47 1.79 3.29 2.68 3.85 0.4919200 - 19500 1.81 1.64 2.02 3.63 3.03 3.98 0.5019500 - 19800 1.84 1.61 2.14 3.11 2.91 3.38 0.5919800 - 20100 1.58 1.38 1.92 3.15 2.82 3.68 0.5020100 - 20400 1.61 1.36 1.92 3.42 2.92 3.96 0.4720400 - 20700 1.51 1.37 1.69 3.26 3.07 3.47 0.4620700 - 21000 1.62 1.38 1.81 3.43 2.89 4.20 0.4721000 - 21300 1.33 1.08 1.62 2.91 2.32 3.81 0.46
- to be continued on next page -
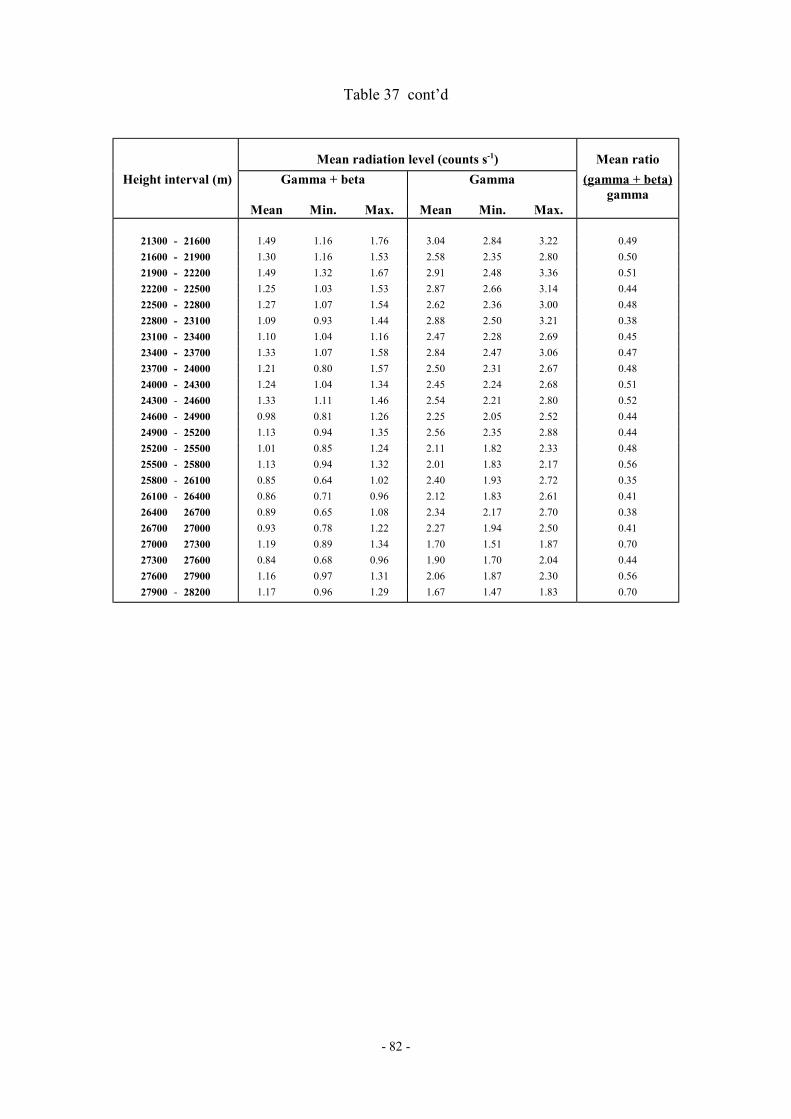
- 82 -
Table 37 cont’d
Mean radiation level (counts s-1) Mean ratio Height interval (m) Gamma + beta Gamma (gamma + beta)
gammaMean Min. Max. Mean Min. Max.
21300 - 21600 1.49 1.16 1.76 3.04 2.84 3.22 0.4921600 - 21900 1.30 1.16 1.53 2.58 2.35 2.80 0.5021900 - 22200 1.49 1.32 1.67 2.91 2.48 3.36 0.5122200 - 22500 1.25 1.03 1.53 2.87 2.66 3.14 0.4422500 - 22800 1.27 1.07 1.54 2.62 2.36 3.00 0.4822800 - 23100 1.09 0.93 1.44 2.88 2.50 3.21 0.3823100 - 23400 1.10 1.04 1.16 2.47 2.28 2.69 0.4523400 - 23700 1.33 1.07 1.58 2.84 2.47 3.06 0.4723700 - 24000 1.21 0.80 1.57 2.50 2.31 2.67 0.4824000 - 24300 1.24 1.04 1.34 2.45 2.24 2.68 0.5124300 - 24600 1.33 1.11 1.46 2.54 2.21 2.80 0.5224600 - 24900 0.98 0.81 1.26 2.25 2.05 2.52 0.4424900 - 25200 1.13 0.94 1.35 2.56 2.35 2.88 0.4425200 - 25500 1.01 0.85 1.24 2.11 1.82 2.33 0.4825500 - 25800 1.13 0.94 1.32 2.01 1.83 2.17 0.5625800 - 26100 0.85 0.64 1.02 2.40 1.93 2.72 0.3526100 - 26400 0.86 0.71 0.96 2.12 1.83 2.61 0.4126400 26700 0.89 0.65 1.08 2.34 2.17 2.70 0.3826700 27000 0.93 0.78 1.22 2.27 1.94 2.50 0.4127000 27300 1.19 0.89 1.34 1.70 1.51 1.87 0.7027300 27600 0.84 0.68 0.96 1.90 1.70 2.04 0.4427600 27900 1.16 0.97 1.31 2.06 1.87 2.30 0.5627900 - 28200 1.17 0.96 1.29 1.67 1.47 1.83 0.70
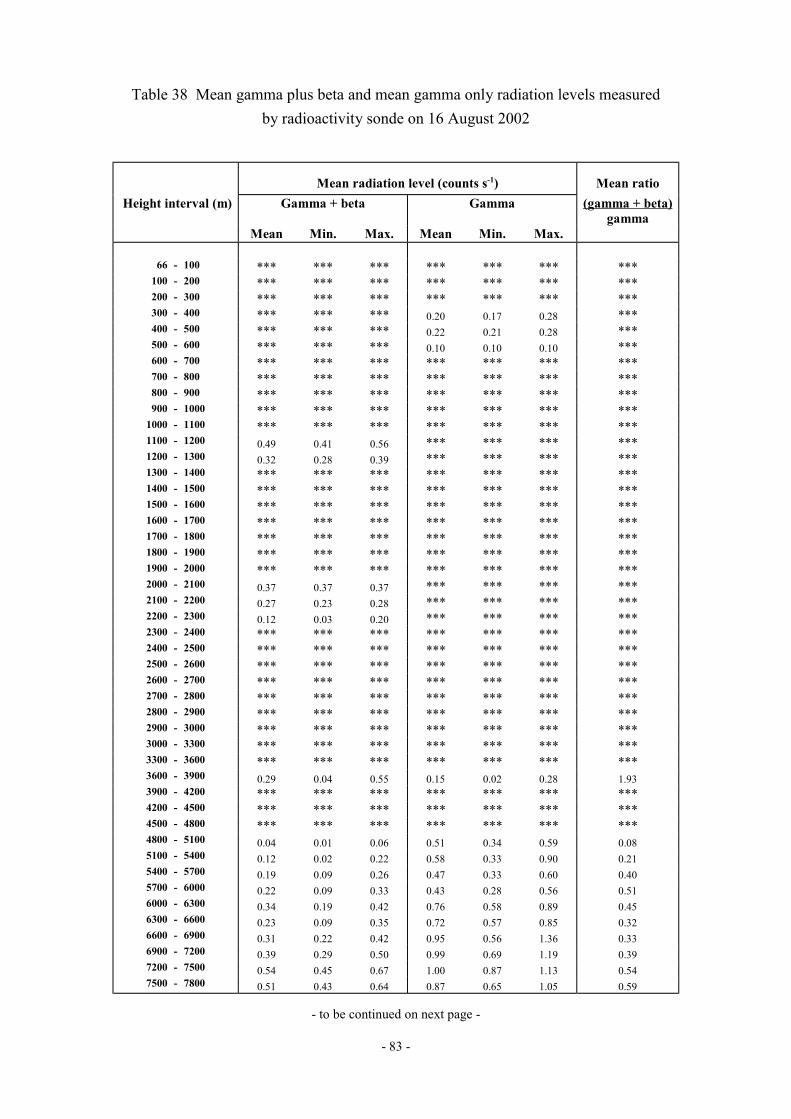
- 83 -
Table 38 Mean gamma plus beta and mean gamma only radiation levels measuredby radioactivity sonde on 16 August 2002
Mean radiation level (counts s-1) Mean ratio Height interval (m) Gamma + beta Gamma (gamma + beta)
gammaMean Min. Max. Mean Min. Max.
66 - 100 *** *** *** *** *** *** ***100 - 200 *** *** *** *** *** *** ***200 - 300 *** *** *** *** *** *** ***300 - 400 *** *** *** 0.20 0.17 0.28 ***400 - 500 *** *** *** 0.22 0.21 0.28 ***500 - 600 *** *** *** 0.10 0.10 0.10 ***600 - 700 *** *** *** *** *** *** ***700 - 800 *** *** *** *** *** *** ***800 - 900 *** *** *** *** *** *** ***900 - 1000 *** *** *** *** *** *** ***
1000 - 1100 *** *** *** *** *** *** ***1100 - 1200 0.49 0.41 0.56 *** *** *** ***1200 - 1300 0.32 0.28 0.39 *** *** *** ***1300 - 1400 *** *** *** *** *** *** ***1400 - 1500 *** *** *** *** *** *** ***1500 - 1600 *** *** *** *** *** *** ***1600 - 1700 *** *** *** *** *** *** ***1700 - 1800 *** *** *** *** *** *** ***1800 - 1900 *** *** *** *** *** *** ***1900 - 2000 *** *** *** *** *** *** ***2000 - 2100 0.37 0.37 0.37 *** *** *** ***2100 - 2200 0.27 0.23 0.28 *** *** *** ***2200 - 2300 0.12 0.03 0.20 *** *** *** ***2300 - 2400 *** *** *** *** *** *** ***2400 - 2500 *** *** *** *** *** *** ***2500 - 2600 *** *** *** *** *** *** ***2600 - 2700 *** *** *** *** *** *** ***2700 - 2800 *** *** *** *** *** *** ***2800 - 2900 *** *** *** *** *** *** ***2900 - 3000 *** *** *** *** *** *** ***3000 - 3300 *** *** *** *** *** *** ***3300 - 3600 *** *** *** *** *** *** ***3600 - 3900 0.29 0.04 0.55 0.15 0.02 0.28 1.933900 - 4200 *** *** *** *** *** *** ***4200 - 4500 *** *** *** *** *** *** ***4500 - 4800 *** *** *** *** *** *** ***4800 - 5100 0.04 0.01 0.06 0.51 0.34 0.59 0.085100 - 5400 0.12 0.02 0.22 0.58 0.33 0.90 0.215400 - 5700 0.19 0.09 0.26 0.47 0.33 0.60 0.405700 - 6000 0.22 0.09 0.33 0.43 0.28 0.56 0.516000 - 6300 0.34 0.19 0.42 0.76 0.58 0.89 0.456300 - 6600 0.23 0.09 0.35 0.72 0.57 0.85 0.326600 - 6900 0.31 0.22 0.42 0.95 0.56 1.36 0.336900 - 7200 0.39 0.29 0.50 0.99 0.69 1.19 0.397200 - 7500 0.54 0.45 0.67 1.00 0.87 1.13 0.547500 - 7800 0.51 0.43 0.64 0.87 0.65 1.05 0.59
- to be continued on next page -

- 84 -
Table 38 cont’d
Mean radiation level (counts s-1) Mean ratio Height interval (m) Gamma + beta Gamma (gamma + beta)
gammaMean Min. Max. Mean Min. Max.
7800 - 8100 0.45 0.24 0.53 1.08 0.81 1.37 0.428100 - 8400 0.48 0.22 0.82 1.07 0.89 1.36 0.458400 - 8700 0.58 0.38 0.73 1.45 1.16 1.68 0.408700 - 9000 0.62 0.31 0.82 1.44 1.13 1.90 0.439000 - 9300 0.62 0.43 0.79 1.39 1.10 1.63 0.459300 - 9600 0.62 0.49 0.82 1.58 1.32 1.78 0.399600 - 9900 0.89 0.74 1.07 1.85 1.55 2.15 0.489900 - 10200 0.77 0.49 1.08 1.97 1.52 2.46 0.39
10200 - 10500 0.92 0.73 1.13 2.26 2.00 2.53 0.4110500 - 10800 1.10 0.93 1.24 2.08 1.63 2.58 0.5310800 - 11100 1.07 0.71 1.26 2.12 1.82 2.71 0.5011100 - 11400 0.73 0.58 0.86 2.19 1.85 2.69 0.3311400 - 11700 0.92 0.76 1.17 2.50 2.07 2.75 0.3711700 - 12000 1.00 0.83 1.17 2.81 2.57 3.23 0.3612000 - 12300 1.20 0.89 1.39 2.95 2.51 3.25 0.4112300 - 12600 1.16 0.97 1.30 3.18 2.91 3.52 0.3612600 - 12900 1.30 1.08 1.48 3.13 2.90 3.40 0.4212900 - 13200 1.46 1.25 1.65 3.32 3.00 3.62 0.4413200 - 13500 1.33 1.08 1.59 3.43 3.06 3.73 0.3913500 - 13800 1.51 1.38 1.71 3.20 2.68 3.88 0.4713800 - 14100 1.32 1.05 1.53 3.67 3.21 3.99 0.3614100 - 14400 1.46 1.12 1.71 2.94 2.59 3.28 0.5014400 - 14700 1.53 1.23 1.70 3.00 2.77 3.23 0.5114700 - 15000 1.53 1.39 1.84 3.28 3.10 3.48 0.4715000 - 15300 1.35 1.09 1.69 3.62 3.31 3.86 0.3715300 - 15600 1.63 1.23 1.87 3.76 3.56 4.04 0.4315600 - 15900 1.44 1.28 1.68 3.41 3.21 3.70 0.4215900 - 16200 1.90 1.17 2.40 3.73 3.48 4.17 0.5116200 - 16500 1.62 1.37 1.84 3.44 3.11 3.86 0.4716500 - 16800 1.30 1.17 1.47 3.65 3.16 3.95 0.3616800 - 17100 1.70 1.42 1.98 3.71 3.31 4.02 0.4617100 - 17400 1.50 1.16 1.78 3.84 3.30 4.51 0.3917400 - 17700 1.24 1.06 1.55 3.46 3.15 4.14 0.3617700 - 18000 1.47 1.12 1.91 3.66 3.42 3.95 0.4018000 - 18300 1.48 1.26 1.85 3.36 3.10 3.88 0.4418300 - 18600 1.21 1.03 1.44 3.47 3.23 3.83 0.3518600 - 18900 1.49 1.21 1.83 3.93 3.69 4.19 0.3818900 - 19200 1.57 1.24 1.95 3.43 2.95 4.16 0.4619200 - 19500 1.56 1.32 1.85 3.36 3.16 3.59 0.4619500 - 19800 1.46 1.30 1.65 3.47 3.20 3.74 0.4219800 - 20100 1.63 1.38 1.93 3.62 3.18 4.03 0.4520100 - 20400 1.32 1.08 1.82 3.37 3.01 3.71 0.3920400 - 20700 1.49 1.36 1.72 3.54 3.25 3.87 0.4220700 - 21000 1.47 1.10 1.82 3.15 2.89 3.40 0.4721000 - 21300 1.15 0.91 1.50 3.07 2.80 3.33 0.37
- to be continued on next page -
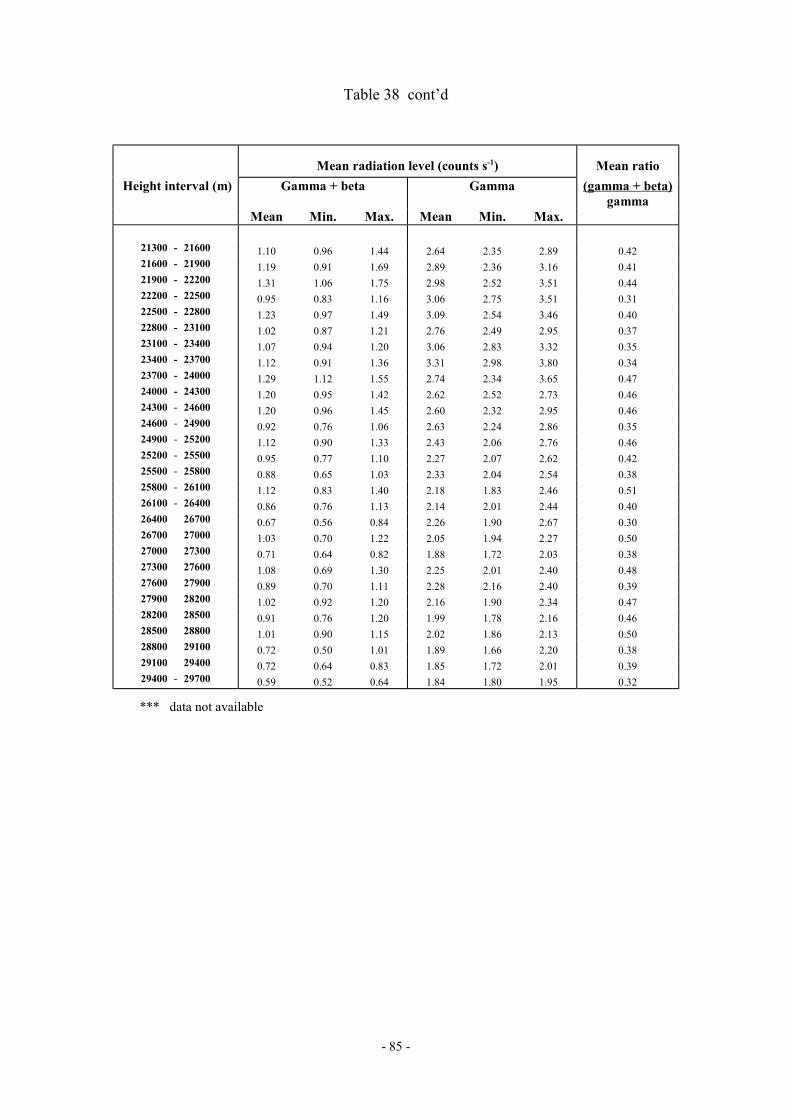
- 85 -
Table 38 cont’d
Mean radiation level (counts s-1) Mean ratio Height interval (m) Gamma + beta Gamma (gamma + beta)
gammaMean Min. Max. Mean Min. Max.
21300 - 21600 1.10 0.96 1.44 2.64 2.35 2.89 0.4221600 - 21900 1.19 0.91 1.69 2.89 2.36 3.16 0.4121900 - 22200 1.31 1.06 1.75 2.98 2.52 3.51 0.4422200 - 22500 0.95 0.83 1.16 3.06 2.75 3.51 0.3122500 - 22800 1.23 0.97 1.49 3.09 2.54 3.46 0.4022800 - 23100 1.02 0.87 1.21 2.76 2.49 2.95 0.3723100 - 23400 1.07 0.94 1.20 3.06 2.83 3.32 0.3523400 - 23700 1.12 0.91 1.36 3.31 2.98 3.80 0.3423700 - 24000 1.29 1.12 1.55 2.74 2.34 3.65 0.4724000 - 24300 1.20 0.95 1.42 2.62 2.52 2.73 0.4624300 - 24600 1.20 0.96 1.45 2.60 2.32 2.95 0.4624600 - 24900 0.92 0.76 1.06 2.63 2.24 2.86 0.3524900 - 25200 1.12 0.90 1.33 2.43 2.06 2.76 0.4625200 - 25500 0.95 0.77 1.10 2.27 2.07 2.62 0.4225500 - 25800 0.88 0.65 1.03 2.33 2.04 2.54 0.3825800 - 26100 1.12 0.83 1.40 2.18 1.83 2.46 0.5126100 - 26400 0.86 0.76 1.13 2.14 2.01 2.44 0.4026400 26700 0.67 0.56 0.84 2.26 1.90 2.67 0.3026700 27000 1.03 0.70 1.22 2.05 1.94 2.27 0.5027000 27300 0.71 0.64 0.82 1.88 1.72 2.03 0.3827300 27600 1.08 0.69 1.30 2.25 2.01 2.40 0.4827600 27900 0.89 0.70 1.11 2.28 2.16 2.40 0.3927900 28200 1.02 0.92 1.20 2.16 1.90 2.34 0.4728200 28500 0.91 0.76 1.20 1.99 1.78 2.16 0.4628500 28800 1.01 0.90 1.15 2.02 1.86 2.13 0.5028800 29100 0.72 0.50 1.01 1.89 1.66 2.20 0.3829100 29400 0.72 0.64 0.83 1.85 1.72 2.01 0.3929400 - 29700 0.59 0.52 0.64 1.84 1.80 1.95 0.32
*** data not available
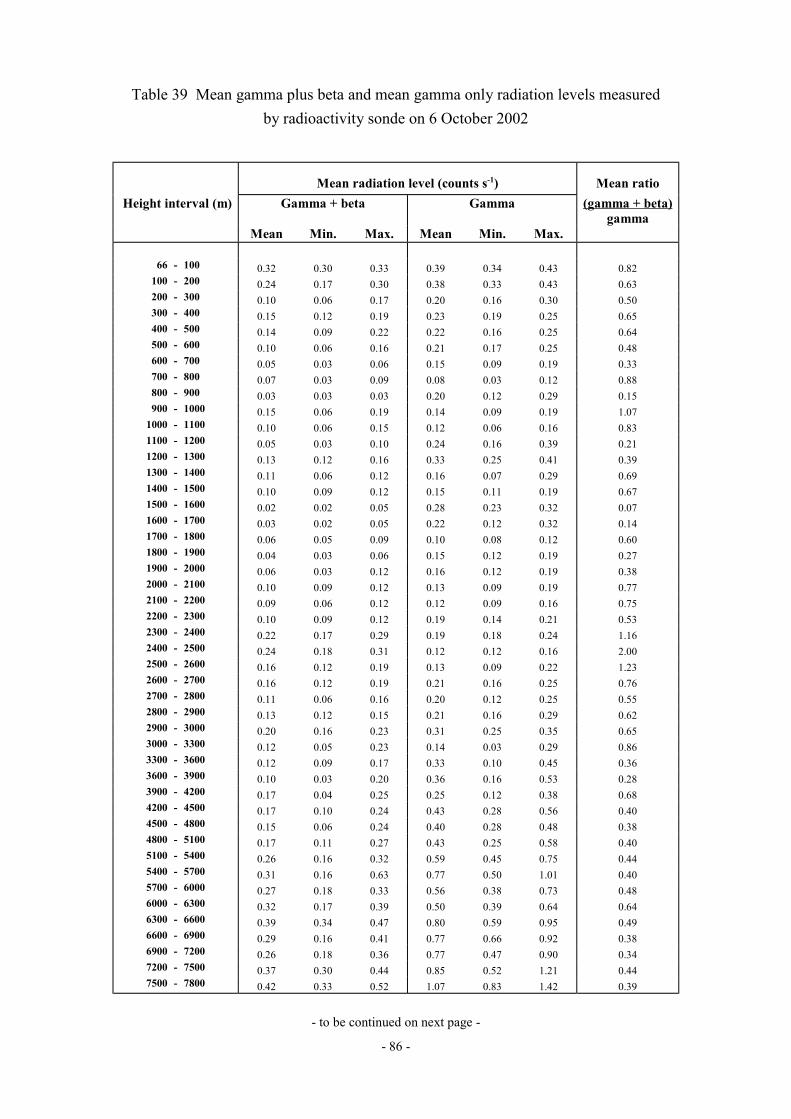
- 86 -
Table 39 Mean gamma plus beta and mean gamma only radiation levels measuredby radioactivity sonde on 6 October 2002
Mean radiation level (counts s-1) Mean ratio Height interval (m) Gamma + beta Gamma (gamma + beta)
gammaMean Min. Max. Mean Min. Max.
66 - 100 0.32 0.30 0.33 0.39 0.34 0.43 0.82100 - 200 0.24 0.17 0.30 0.38 0.33 0.43 0.63200 - 300 0.10 0.06 0.17 0.20 0.16 0.30 0.50300 - 400 0.15 0.12 0.19 0.23 0.19 0.25 0.65400 - 500 0.14 0.09 0.22 0.22 0.16 0.25 0.64500 - 600 0.10 0.06 0.16 0.21 0.17 0.25 0.48600 - 700 0.05 0.03 0.06 0.15 0.09 0.19 0.33700 - 800 0.07 0.03 0.09 0.08 0.03 0.12 0.88800 - 900 0.03 0.03 0.03 0.20 0.12 0.29 0.15900 - 1000 0.15 0.06 0.19 0.14 0.09 0.19 1.07
1000 - 1100 0.10 0.06 0.15 0.12 0.06 0.16 0.831100 - 1200 0.05 0.03 0.10 0.24 0.16 0.39 0.211200 - 1300 0.13 0.12 0.16 0.33 0.25 0.41 0.391300 - 1400 0.11 0.06 0.12 0.16 0.07 0.29 0.691400 - 1500 0.10 0.09 0.12 0.15 0.11 0.19 0.671500 - 1600 0.02 0.02 0.05 0.28 0.23 0.32 0.071600 - 1700 0.03 0.02 0.05 0.22 0.12 0.32 0.141700 - 1800 0.06 0.05 0.09 0.10 0.08 0.12 0.601800 - 1900 0.04 0.03 0.06 0.15 0.12 0.19 0.271900 - 2000 0.06 0.03 0.12 0.16 0.12 0.19 0.382000 - 2100 0.10 0.09 0.12 0.13 0.09 0.19 0.772100 - 2200 0.09 0.06 0.12 0.12 0.09 0.16 0.752200 - 2300 0.10 0.09 0.12 0.19 0.14 0.21 0.532300 - 2400 0.22 0.17 0.29 0.19 0.18 0.24 1.162400 - 2500 0.24 0.18 0.31 0.12 0.12 0.16 2.002500 - 2600 0.16 0.12 0.19 0.13 0.09 0.22 1.232600 - 2700 0.16 0.12 0.19 0.21 0.16 0.25 0.762700 - 2800 0.11 0.06 0.16 0.20 0.12 0.25 0.552800 - 2900 0.13 0.12 0.15 0.21 0.16 0.29 0.622900 - 3000 0.20 0.16 0.23 0.31 0.25 0.35 0.653000 - 3300 0.12 0.05 0.23 0.14 0.03 0.29 0.863300 - 3600 0.12 0.09 0.17 0.33 0.10 0.45 0.363600 - 3900 0.10 0.03 0.20 0.36 0.16 0.53 0.283900 - 4200 0.17 0.04 0.25 0.25 0.12 0.38 0.684200 - 4500 0.17 0.10 0.24 0.43 0.28 0.56 0.404500 - 4800 0.15 0.06 0.24 0.40 0.28 0.48 0.384800 - 5100 0.17 0.11 0.27 0.43 0.25 0.58 0.405100 - 5400 0.26 0.16 0.32 0.59 0.45 0.75 0.445400 - 5700 0.31 0.16 0.63 0.77 0.50 1.01 0.405700 - 6000 0.27 0.18 0.33 0.56 0.38 0.73 0.486000 - 6300 0.32 0.17 0.39 0.50 0.39 0.64 0.646300 - 6600 0.39 0.34 0.47 0.80 0.59 0.95 0.496600 - 6900 0.29 0.16 0.41 0.77 0.66 0.92 0.386900 - 7200 0.26 0.18 0.36 0.77 0.47 0.90 0.347200 - 7500 0.37 0.30 0.44 0.85 0.52 1.21 0.447500 - 7800 0.42 0.33 0.52 1.07 0.83 1.42 0.39
- to be continued on next page -
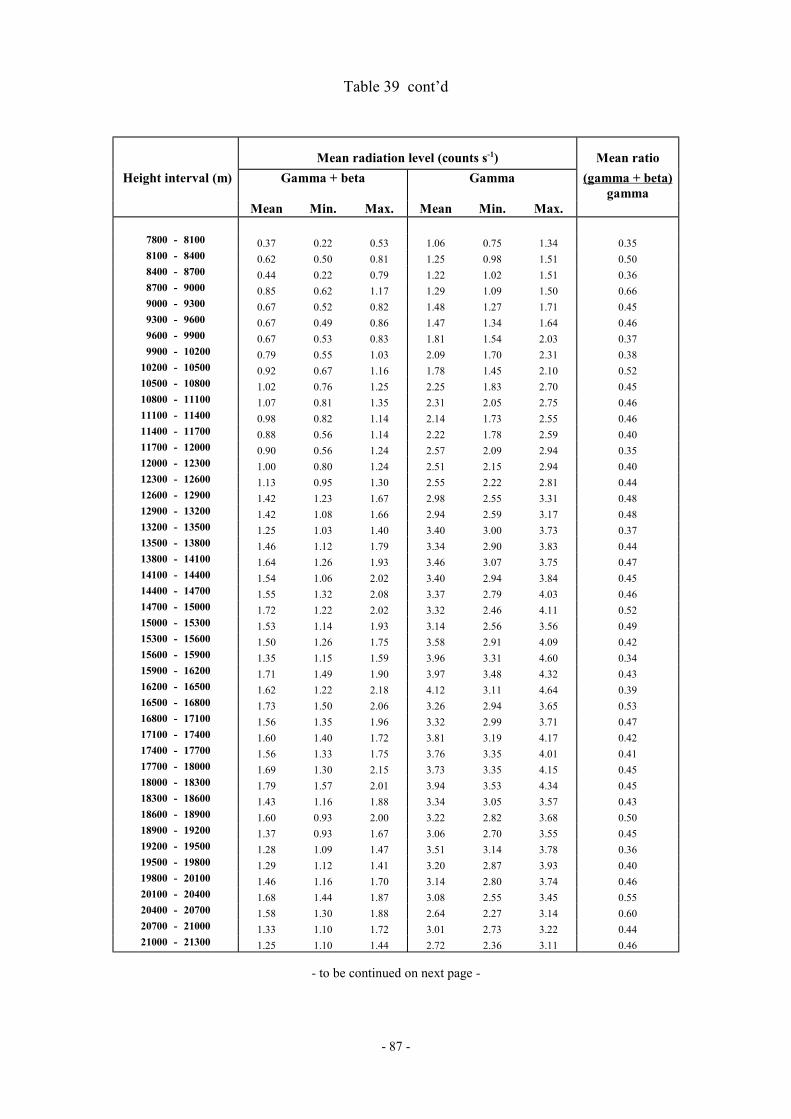
- 87 -
Table 39 cont’d
Mean radiation level (counts s-1) Mean ratio Height interval (m) Gamma + beta Gamma (gamma + beta)
gammaMean Min. Max. Mean Min. Max.
7800 - 8100 0.37 0.22 0.53 1.06 0.75 1.34 0.358100 - 8400 0.62 0.50 0.81 1.25 0.98 1.51 0.508400 - 8700 0.44 0.22 0.79 1.22 1.02 1.51 0.368700 - 9000 0.85 0.62 1.17 1.29 1.09 1.50 0.669000 - 9300 0.67 0.52 0.82 1.48 1.27 1.71 0.459300 - 9600 0.67 0.49 0.86 1.47 1.34 1.64 0.469600 - 9900 0.67 0.53 0.83 1.81 1.54 2.03 0.379900 - 10200 0.79 0.55 1.03 2.09 1.70 2.31 0.38
10200 - 10500 0.92 0.67 1.16 1.78 1.45 2.10 0.5210500 - 10800 1.02 0.76 1.25 2.25 1.83 2.70 0.4510800 - 11100 1.07 0.81 1.35 2.31 2.05 2.75 0.4611100 - 11400 0.98 0.82 1.14 2.14 1.73 2.55 0.4611400 - 11700 0.88 0.56 1.14 2.22 1.78 2.59 0.4011700 - 12000 0.90 0.56 1.24 2.57 2.09 2.94 0.3512000 - 12300 1.00 0.80 1.24 2.51 2.15 2.94 0.4012300 - 12600 1.13 0.95 1.30 2.55 2.22 2.81 0.4412600 - 12900 1.42 1.23 1.67 2.98 2.55 3.31 0.4812900 - 13200 1.42 1.08 1.66 2.94 2.59 3.17 0.4813200 - 13500 1.25 1.03 1.40 3.40 3.00 3.73 0.3713500 - 13800 1.46 1.12 1.79 3.34 2.90 3.83 0.4413800 - 14100 1.64 1.26 1.93 3.46 3.07 3.75 0.4714100 - 14400 1.54 1.06 2.02 3.40 2.94 3.84 0.4514400 - 14700 1.55 1.32 2.08 3.37 2.79 4.03 0.4614700 - 15000 1.72 1.22 2.02 3.32 2.46 4.11 0.5215000 - 15300 1.53 1.14 1.93 3.14 2.56 3.56 0.4915300 - 15600 1.50 1.26 1.75 3.58 2.91 4.09 0.4215600 - 15900 1.35 1.15 1.59 3.96 3.31 4.60 0.3415900 - 16200 1.71 1.49 1.90 3.97 3.48 4.32 0.4316200 - 16500 1.62 1.22 2.18 4.12 3.11 4.64 0.3916500 - 16800 1.73 1.50 2.06 3.26 2.94 3.65 0.5316800 - 17100 1.56 1.35 1.96 3.32 2.99 3.71 0.4717100 - 17400 1.60 1.40 1.72 3.81 3.19 4.17 0.4217400 - 17700 1.56 1.33 1.75 3.76 3.35 4.01 0.4117700 - 18000 1.69 1.30 2.15 3.73 3.35 4.15 0.4518000 - 18300 1.79 1.57 2.01 3.94 3.53 4.34 0.4518300 - 18600 1.43 1.16 1.88 3.34 3.05 3.57 0.4318600 - 18900 1.60 0.93 2.00 3.22 2.82 3.68 0.5018900 - 19200 1.37 0.93 1.67 3.06 2.70 3.55 0.4519200 - 19500 1.28 1.09 1.47 3.51 3.14 3.78 0.3619500 - 19800 1.29 1.12 1.41 3.20 2.87 3.93 0.4019800 - 20100 1.46 1.16 1.70 3.14 2.80 3.74 0.4620100 - 20400 1.68 1.44 1.87 3.08 2.55 3.45 0.5520400 - 20700 1.58 1.30 1.88 2.64 2.27 3.14 0.6020700 - 21000 1.33 1.10 1.72 3.01 2.73 3.22 0.4421000 - 21300 1.25 1.10 1.44 2.72 2.36 3.11 0.46
- to be continued on next page -
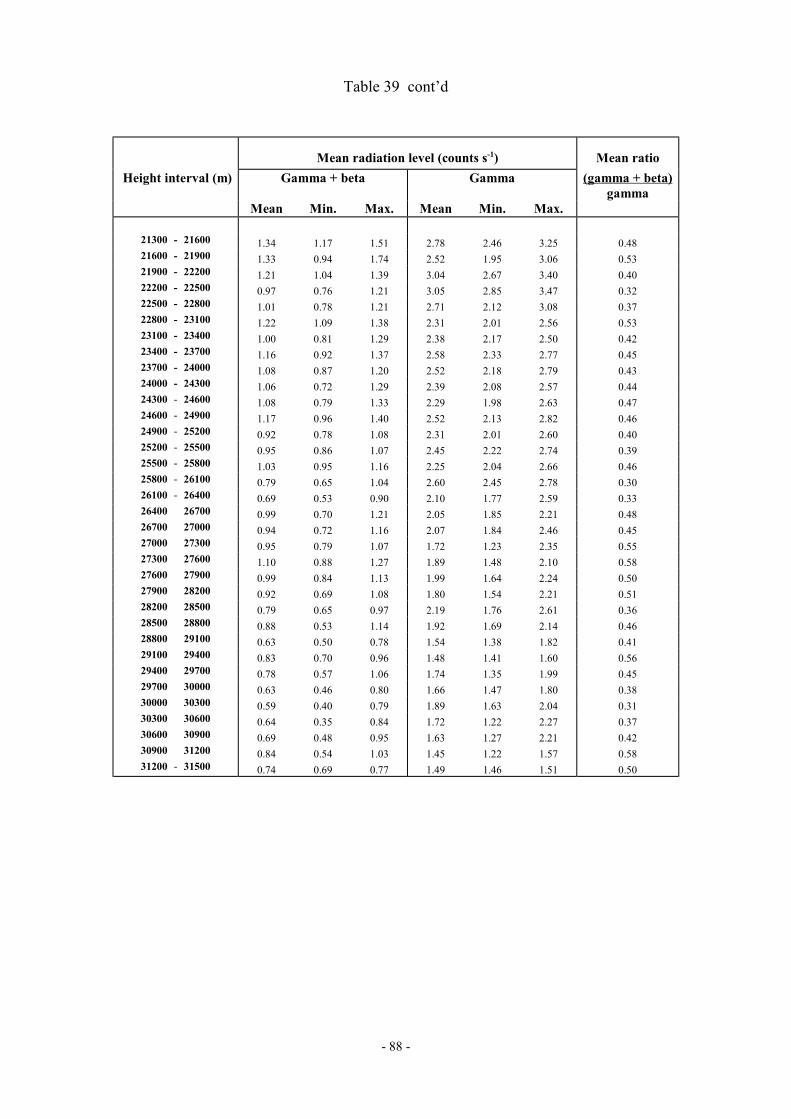
- 88 -
Table 39 cont’d
Mean radiation level (counts s-1) Mean ratio Height interval (m) Gamma + beta Gamma (gamma + beta)
gammaMean Min. Max. Mean Min. Max.
21300 - 21600 1.34 1.17 1.51 2.78 2.46 3.25 0.4821600 - 21900 1.33 0.94 1.74 2.52 1.95 3.06 0.5321900 - 22200 1.21 1.04 1.39 3.04 2.67 3.40 0.4022200 - 22500 0.97 0.76 1.21 3.05 2.85 3.47 0.3222500 - 22800 1.01 0.78 1.21 2.71 2.12 3.08 0.3722800 - 23100 1.22 1.09 1.38 2.31 2.01 2.56 0.5323100 - 23400 1.00 0.81 1.29 2.38 2.17 2.50 0.4223400 - 23700 1.16 0.92 1.37 2.58 2.33 2.77 0.4523700 - 24000 1.08 0.87 1.20 2.52 2.18 2.79 0.4324000 - 24300 1.06 0.72 1.29 2.39 2.08 2.57 0.4424300 - 24600 1.08 0.79 1.33 2.29 1.98 2.63 0.4724600 - 24900 1.17 0.96 1.40 2.52 2.13 2.82 0.4624900 - 25200 0.92 0.78 1.08 2.31 2.01 2.60 0.4025200 - 25500 0.95 0.86 1.07 2.45 2.22 2.74 0.3925500 - 25800 1.03 0.95 1.16 2.25 2.04 2.66 0.4625800 - 26100 0.79 0.65 1.04 2.60 2.45 2.78 0.3026100 - 26400 0.69 0.53 0.90 2.10 1.77 2.59 0.3326400 26700 0.99 0.70 1.21 2.05 1.85 2.21 0.4826700 27000 0.94 0.72 1.16 2.07 1.84 2.46 0.4527000 27300 0.95 0.79 1.07 1.72 1.23 2.35 0.5527300 27600 1.10 0.88 1.27 1.89 1.48 2.10 0.5827600 27900 0.99 0.84 1.13 1.99 1.64 2.24 0.5027900 28200 0.92 0.69 1.08 1.80 1.54 2.21 0.5128200 28500 0.79 0.65 0.97 2.19 1.76 2.61 0.3628500 28800 0.88 0.53 1.14 1.92 1.69 2.14 0.4628800 29100 0.63 0.50 0.78 1.54 1.38 1.82 0.4129100 29400 0.83 0.70 0.96 1.48 1.41 1.60 0.5629400 29700 0.78 0.57 1.06 1.74 1.35 1.99 0.4529700 30000 0.63 0.46 0.80 1.66 1.47 1.80 0.3830000 30300 0.59 0.40 0.79 1.89 1.63 2.04 0.3130300 30600 0.64 0.35 0.84 1.72 1.22 2.27 0.3730600 30900 0.69 0.48 0.95 1.63 1.27 2.21 0.4230900 31200 0.84 0.54 1.03 1.45 1.22 1.57 0.5831200 - 31500 0.74 0.69 0.77 1.49 1.46 1.51 0.50

- 89 -
Table 40 Specific gamma activity of airborne particulate samples
Sampling LocationSpecific Activity in µµµµBq m-3
and Sampling PeriodI-131 Cs-137
King's Park :
02-Jan-02 to 02-Feb-02 < 6 < 702-Feb-02 to 01-Mar-02 < 6 < 701-Mar-02 to 02-Apr-02 < 5 < 502-Apr-02 to 02-May-02 < 5 < 602-May-02 to 01-Jun-02 < 6 < 701-Jun-02 to 02-Jul-02 < 5 < 602-Jul-02 to 30-Jul-02 < 5 < 630-Jul-02 to 02-Sep-02 < 4 < 602-Sep-02 to 02-Oct-02 < 5 < 602-Oct-02 to 31-Oct-02 < 6 < 731-Oct-02 to 02-Dec-02 < 7 < 902-Dec-02 to 31-Dec-02 < 6 < 7
Sha Tau Kok :
02-Jan-02 to 28-Jan-02 < 11 < 1428-Jan-02 to 05-Feb-02 *** ***05-Feb-02 to 25-Feb-02 < 12 < 1325-Feb-02 to 03-Apr-02 < 7 < 803-Apr-02 to 29-Apr-02 < 10 < 1229-Apr-02 to 30-May-02 < 9 < 1230-May-02 to 02-Jul-02 < 8 < 1102-Jul-02 to 05-Jul-02 *** ***05-Jul-02 to 31-Jul-02 < 9 < 1031-Jul-02 to 02-Sep-02 < 7 < 802-Sep-02 to 02-Oct-02 < 8 < 902-Oct-02 to 31-Oct-02 < 7 < 931-Oct-02 to 19-Dec-02 ### ###19-Dec-02 to 02-Jan-03 ### ###
Yuen Ng Fan :
02-Jan-02 to 28-Jan-02 < 8 < 1028-Jan-02 to 25-Feb-02 < 11 < 1425-Feb-02 to 03-Apr-02 < 6 < 703-Apr-02 to 29-Apr-02 < 8 < 1029-Apr-02 to 30-May-02 < 8 < 930-May-02 to 02-Jul-02 < 6 < 702-Jul-02 to 31-Jul-02 < 9 < 1331-Jul-02 to 02-Sep-02 < 8 < 1102-Sep-02 to 02-Oct-02 < 9 < 1202-Oct-02 to 30-Oct-02 < 8 < 930-Oct-02 to 27-Nov-02 < 7 < 927-Nov-02 to 02-Jan-03 < 6 < 8
*** sampler under maintenance
### sampling location under civil work
Note: no other artificial gamma-emitting radionuclide was detected
in all of the samples
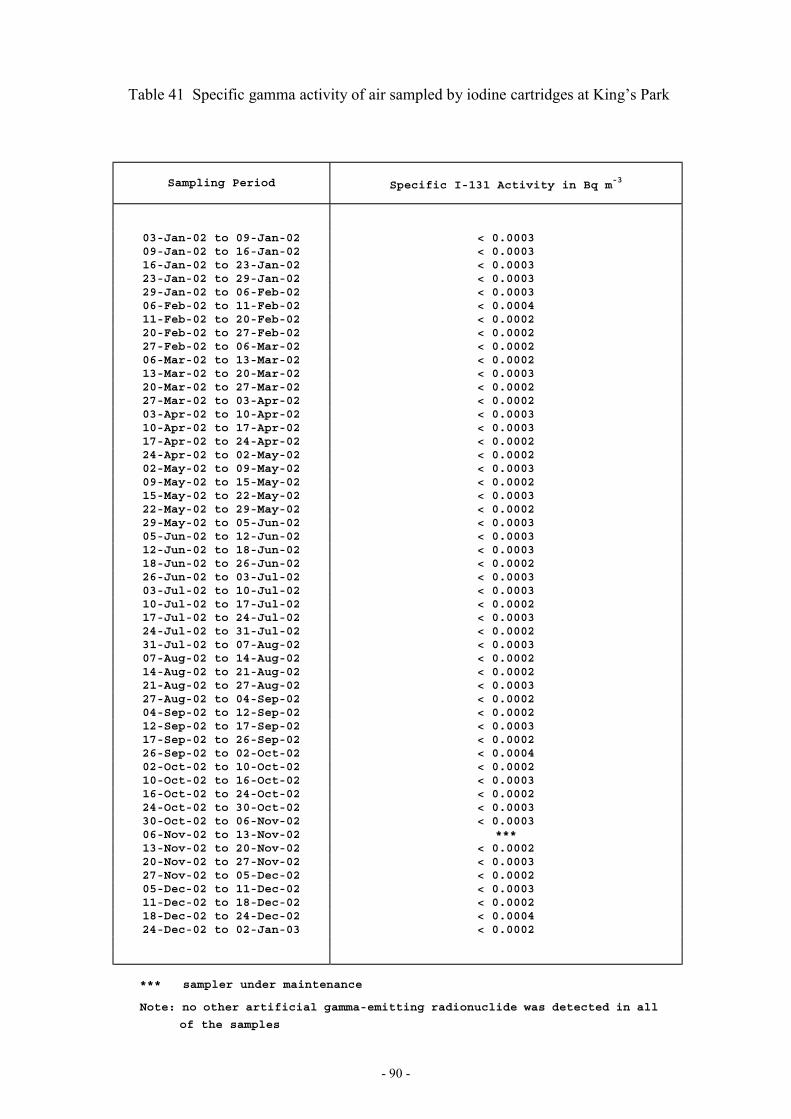
- 90 -
Table 41 Specific gamma activity of air sampled by iodine cartridges at King’s Park
Sampling Period Specific I-131 Activity in Bq m-3
03-Jan-02 to 09-Jan-02 < 0.000309-Jan-02 to 16-Jan-02 < 0.000316-Jan-02 to 23-Jan-02 < 0.000323-Jan-02 to 29-Jan-02 < 0.000329-Jan-02 to 06-Feb-02 < 0.000306-Feb-02 to 11-Feb-02 < 0.000411-Feb-02 to 20-Feb-02 < 0.000220-Feb-02 to 27-Feb-02 < 0.000227-Feb-02 to 06-Mar-02 < 0.000206-Mar-02 to 13-Mar-02 < 0.000213-Mar-02 to 20-Mar-02 < 0.000320-Mar-02 to 27-Mar-02 < 0.000227-Mar-02 to 03-Apr-02 < 0.000203-Apr-02 to 10-Apr-02 < 0.000310-Apr-02 to 17-Apr-02 < 0.000317-Apr-02 to 24-Apr-02 < 0.000224-Apr-02 to 02-May-02 < 0.000202-May-02 to 09-May-02 < 0.000309-May-02 to 15-May-02 < 0.000215-May-02 to 22-May-02 < 0.000322-May-02 to 29-May-02 < 0.000229-May-02 to 05-Jun-02 < 0.000305-Jun-02 to 12-Jun-02 < 0.000312-Jun-02 to 18-Jun-02 < 0.000318-Jun-02 to 26-Jun-02 < 0.000226-Jun-02 to 03-Jul-02 < 0.000303-Jul-02 to 10-Jul-02 < 0.000310-Jul-02 to 17-Jul-02 < 0.000217-Jul-02 to 24-Jul-02 < 0.000324-Jul-02 to 31-Jul-02 < 0.000231-Jul-02 to 07-Aug-02 < 0.000307-Aug-02 to 14-Aug-02 < 0.000214-Aug-02 to 21-Aug-02 < 0.000221-Aug-02 to 27-Aug-02 < 0.000327-Aug-02 to 04-Sep-02 < 0.000204-Sep-02 to 12-Sep-02 < 0.000212-Sep-02 to 17-Sep-02 < 0.000317-Sep-02 to 26-Sep-02 < 0.000226-Sep-02 to 02-Oct-02 < 0.000402-Oct-02 to 10-Oct-02 < 0.000210-Oct-02 to 16-Oct-02 < 0.000316-Oct-02 to 24-Oct-02 < 0.000224-Oct-02 to 30-Oct-02 < 0.000330-Oct-02 to 06-Nov-02 < 0.000306-Nov-02 to 13-Nov-02 ***13-Nov-02 to 20-Nov-02 < 0.000220-Nov-02 to 27-Nov-02 < 0.000327-Nov-02 to 05-Dec-02 < 0.000205-Dec-02 to 11-Dec-02 < 0.000311-Dec-02 to 18-Dec-02 < 0.000218-Dec-02 to 24-Dec-02 < 0.000424-Dec-02 to 02-Jan-03 < 0.0002
*** sampler under maintenance
Note: no other artificial gamma-emitting radionuclide was detected in all
of the samples
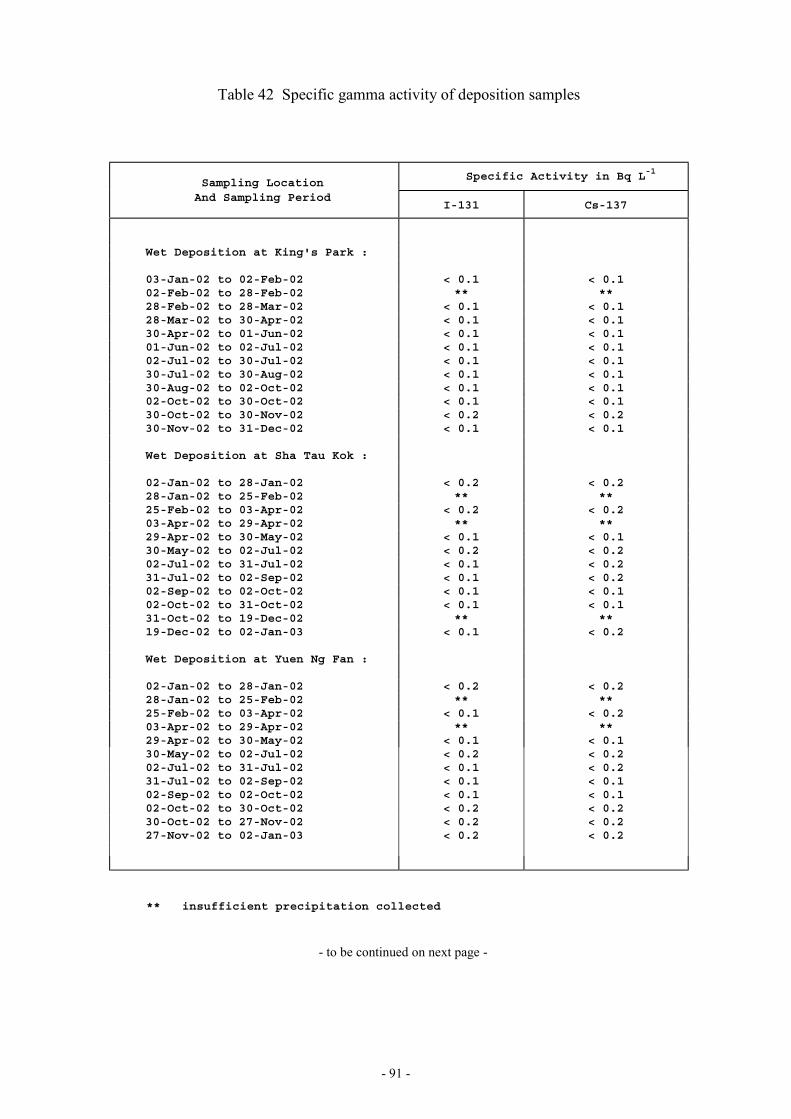
- 91 -
Table 42 Specific gamma activity of deposition samples
Sampling LocationSpecific Activity in Bq L-1
And Sampling PeriodI-131 Cs-137
Wet Deposition at King's Park :
03-Jan-02 to 02-Feb-02 < 0.1 < 0.102-Feb-02 to 28-Feb-02 ** **28-Feb-02 to 28-Mar-02 < 0.1 < 0.128-Mar-02 to 30-Apr-02 < 0.1 < 0.130-Apr-02 to 01-Jun-02 < 0.1 < 0.101-Jun-02 to 02-Jul-02 < 0.1 < 0.102-Jul-02 to 30-Jul-02 < 0.1 < 0.130-Jul-02 to 30-Aug-02 < 0.1 < 0.130-Aug-02 to 02-Oct-02 < 0.1 < 0.102-Oct-02 to 30-Oct-02 < 0.1 < 0.130-Oct-02 to 30-Nov-02 < 0.2 < 0.230-Nov-02 to 31-Dec-02 < 0.1 < 0.1
Wet Deposition at Sha Tau Kok :
02-Jan-02 to 28-Jan-02 < 0.2 < 0.228-Jan-02 to 25-Feb-02 ** **25-Feb-02 to 03-Apr-02 < 0.2 < 0.203-Apr-02 to 29-Apr-02 ** **29-Apr-02 to 30-May-02 < 0.1 < 0.130-May-02 to 02-Jul-02 < 0.2 < 0.202-Jul-02 to 31-Jul-02 < 0.1 < 0.231-Jul-02 to 02-Sep-02 < 0.1 < 0.202-Sep-02 to 02-Oct-02 < 0.1 < 0.102-Oct-02 to 31-Oct-02 < 0.1 < 0.131-Oct-02 to 19-Dec-02 ** **19-Dec-02 to 02-Jan-03 < 0.1 < 0.2
Wet Deposition at Yuen Ng Fan :
02-Jan-02 to 28-Jan-02 < 0.2 < 0.228-Jan-02 to 25-Feb-02 ** **25-Feb-02 to 03-Apr-02 < 0.1 < 0.203-Apr-02 to 29-Apr-02 ** **29-Apr-02 to 30-May-02 < 0.1 < 0.130-May-02 to 02-Jul-02 < 0.2 < 0.202-Jul-02 to 31-Jul-02 < 0.1 < 0.231-Jul-02 to 02-Sep-02 < 0.1 < 0.102-Sep-02 to 02-Oct-02 < 0.1 < 0.102-Oct-02 to 30-Oct-02 < 0.2 < 0.230-Oct-02 to 27-Nov-02 < 0.2 < 0.227-Nov-02 to 02-Jan-03 < 0.2 < 0.2
** insufficient precipitation collected
- to be continued on next page -

- 92 -
Table 42 cont’d
Sampling Location RainfallSpecific Activity in Bq m-2
and Sampling Period amount(mm)* I-131 Cs-137
Total Deposition at King's Park :
03-Jan-02 to 02-Feb-02 19.6 < 8.1 < 9.402-Feb-02 to 28-Feb-02 7.4 < 7.5 < 8.528-Feb-02 to 28-Mar-02 133.2 < 15.7 < 17.128-Mar-02 to 30-Apr-02 15.0 < 8.9 < 10.930-Apr-02 to 01-Jun-02 315.1 < 32.0 < 33.601-Jun-02 to 02-Jul-02 249.0 < 16.7 < 17.802-Jul-02 to 30-Jul-02 357.6 < 28.4 < 30.830-Jul-02 to 30-Aug-02 364.2 < 28.9 < 30.530-Aug-02 to 02-Oct-02 530.1 < 53.4 < 56.702-Oct-02 to 31-Oct-02 169.7 < 15.7 < 19.831-Oct-02 to 30-Nov-02 20.4 < 7.1 < 7.630-Nov-02 to 31-Dec-02 73.6 < 7.3 < 7.6
* 24-hour rainfall is recorded daily at 3 p.m. Hong Kong Time
Note: no other artificial gamma-emitting radionuclide was detected in all of the
samples
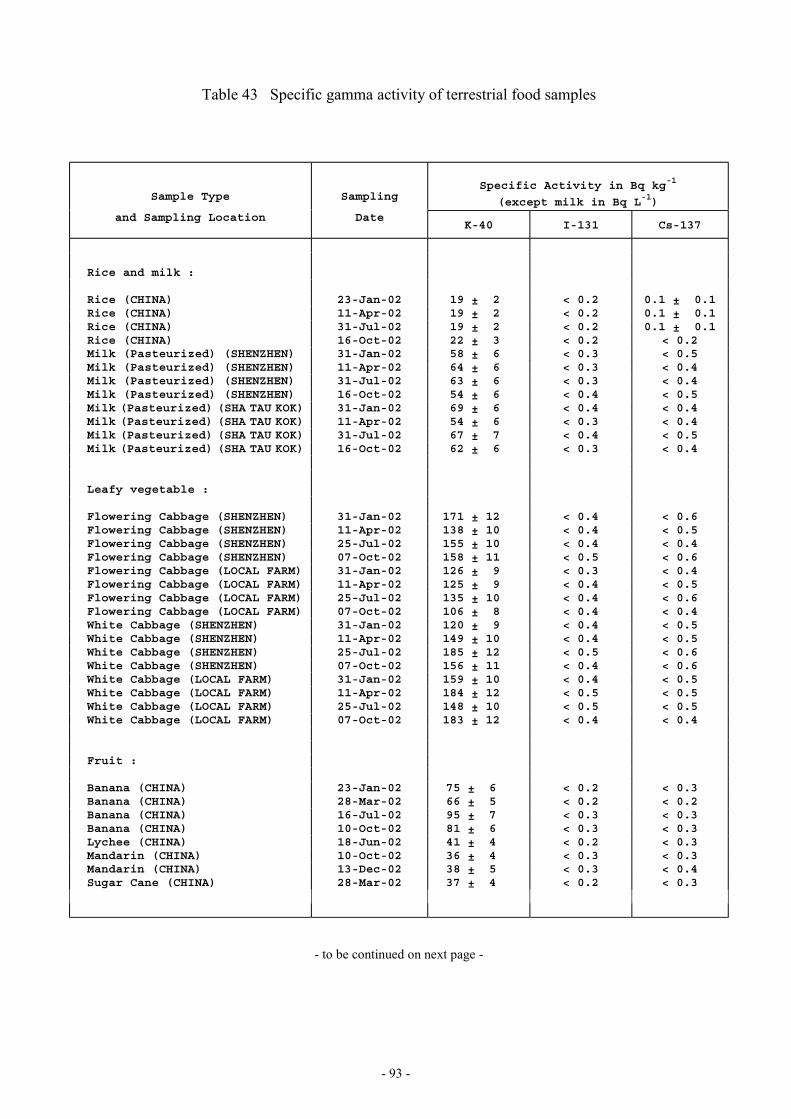
- 93 -
Table 43 Specific gamma activity of terrestrial food samples
Sample Type SamplingSpecific Activity in Bq kg-1
(except milk in Bq L-1)and Sampling Location Date
K-40 I-131 Cs-137
Rice and milk :
Rice (CHINA) 23-Jan-02 19 ± 2 < 0.2 0.1 ± 0.1Rice (CHINA) 11-Apr-02 19 ± 2 < 0.2 0.1 ± 0.1Rice (CHINA) 31-Jul-02 19 ± 2 < 0.2 0.1 ± 0.1Rice (CHINA) 16-Oct-02 22 ± 3 < 0.2 < 0.2Milk (Pasteurized) (SHENZHEN) 31-Jan-02 58 ± 6 < 0.3 < 0.5Milk (Pasteurized) (SHENZHEN) 11-Apr-02 64 ± 6 < 0.3 < 0.4Milk (Pasteurized) (SHENZHEN) 31-Jul-02 63 ± 6 < 0.3 < 0.4Milk (Pasteurized) (SHENZHEN) 16-Oct-02 54 ± 6 < 0.4 < 0.5Milk (Pasteurized) (SHA TAU KOK) 31-Jan-02 69 ± 6 < 0.4 < 0.4Milk (Pasteurized) (SHA TAU KOK) 11-Apr-02 54 ± 6 < 0.3 < 0.4Milk (Pasteurized) (SHA TAU KOK) 31-Jul-02 67 ± 7 < 0.4 < 0.5Milk (Pasteurized) (SHA TAU KOK) 16-Oct-02 62 ± 6 < 0.3 < 0.4
Leafy vegetable :
Flowering Cabbage (SHENZHEN) 31-Jan-02 171 ± 12 < 0.4 < 0.6Flowering Cabbage (SHENZHEN) 11-Apr-02 138 ± 10 < 0.4 < 0.5Flowering Cabbage (SHENZHEN) 25-Jul-02 155 ± 10 < 0.4 < 0.4Flowering Cabbage (SHENZHEN) 07-Oct-02 158 ± 11 < 0.5 < 0.6Flowering Cabbage (LOCAL FARM) 31-Jan-02 126 ± 9 < 0.3 < 0.4Flowering Cabbage (LOCAL FARM) 11-Apr-02 125 ± 9 < 0.4 < 0.5Flowering Cabbage (LOCAL FARM) 25-Jul-02 135 ± 10 < 0.4 < 0.6Flowering Cabbage (LOCAL FARM) 07-Oct-02 106 ± 8 < 0.4 < 0.4White Cabbage (SHENZHEN) 31-Jan-02 120 ± 9 < 0.4 < 0.5White Cabbage (SHENZHEN) 11-Apr-02 149 ± 10 < 0.4 < 0.5White Cabbage (SHENZHEN) 25-Jul-02 185 ± 12 < 0.5 < 0.6White Cabbage (SHENZHEN) 07-Oct-02 156 ± 11 < 0.4 < 0.6White Cabbage (LOCAL FARM) 31-Jan-02 159 ± 10 < 0.4 < 0.5White Cabbage (LOCAL FARM) 11-Apr-02 184 ± 12 < 0.5 < 0.5White Cabbage (LOCAL FARM) 25-Jul-02 148 ± 10 < 0.5 < 0.5White Cabbage (LOCAL FARM) 07-Oct-02 183 ± 12 < 0.4 < 0.4
Fruit :
Banana (CHINA) 23-Jan-02 75 ± 6 < 0.2 < 0.3Banana (CHINA) 28-Mar-02 66 ± 5 < 0.2 < 0.2Banana (CHINA) 16-Jul-02 95 ± 7 < 0.3 < 0.3Banana (CHINA) 10-Oct-02 81 ± 6 < 0.3 < 0.3Lychee (CHINA) 18-Jun-02 41 ± 4 < 0.2 < 0.3Mandarin (CHINA) 10-Oct-02 36 ± 4 < 0.3 < 0.3Mandarin (CHINA) 13-Dec-02 38 ± 5 < 0.3 < 0.4Sugar Cane (CHINA) 28-Mar-02 37 ± 4 < 0.2 < 0.3
- to be continued on next page -
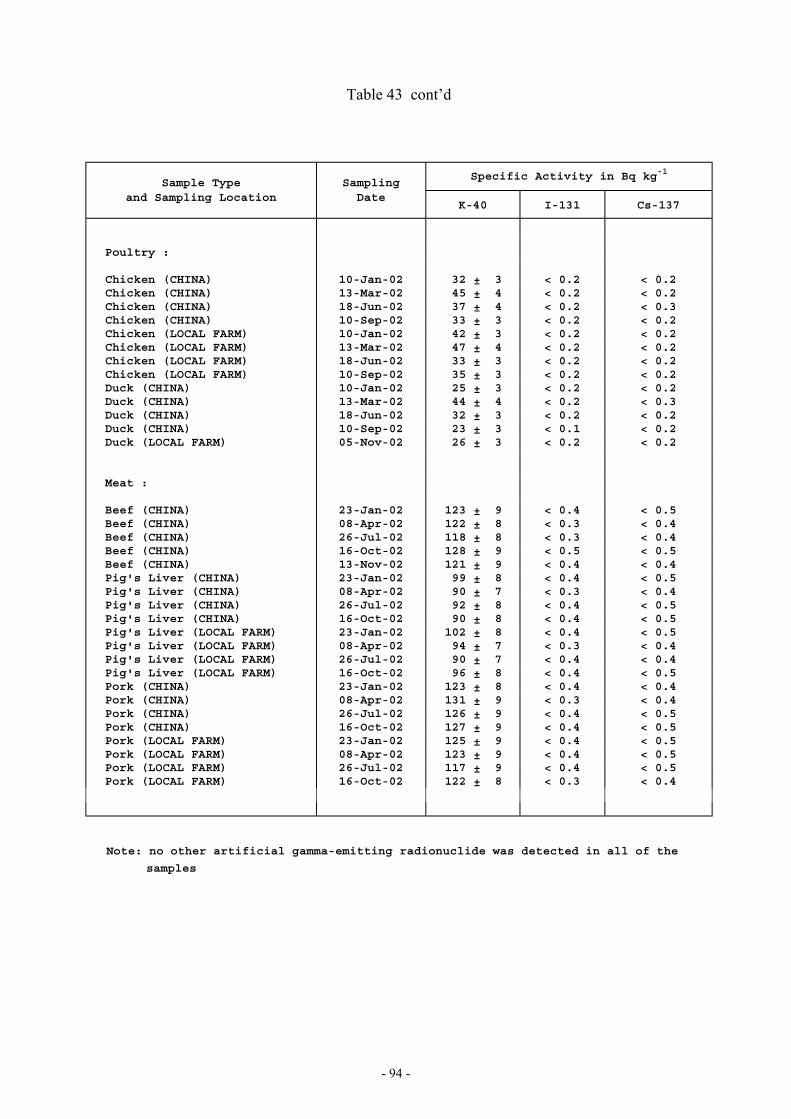
- 94 -
Table 43 cont’d
Sample Type SamplingSpecific Activity in Bq kg-1
and Sampling Location DateK-40 I-131 Cs-137
Poultry :
Chicken (CHINA) 10-Jan-02 32 ± 3 < 0.2 < 0.2Chicken (CHINA) 13-Mar-02 45 ± 4 < 0.2 < 0.2Chicken (CHINA) 18-Jun-02 37 ± 4 < 0.2 < 0.3Chicken (CHINA) 10-Sep-02 33 ± 3 < 0.2 < 0.2Chicken (LOCAL FARM) 10-Jan-02 42 ± 3 < 0.2 < 0.2Chicken (LOCAL FARM) 13-Mar-02 47 ± 4 < 0.2 < 0.2Chicken (LOCAL FARM) 18-Jun-02 33 ± 3 < 0.2 < 0.2Chicken (LOCAL FARM) 10-Sep-02 35 ± 3 < 0.2 < 0.2Duck (CHINA) 10-Jan-02 25 ± 3 < 0.2 < 0.2Duck (CHINA) 13-Mar-02 44 ± 4 < 0.2 < 0.3Duck (CHINA) 18-Jun-02 32 ± 3 < 0.2 < 0.2Duck (CHINA) 10-Sep-02 23 ± 3 < 0.1 < 0.2Duck (LOCAL FARM) 05-Nov-02 26 ± 3 < 0.2 < 0.2
Meat :
Beef (CHINA) 23-Jan-02 123 ± 9 < 0.4 < 0.5Beef (CHINA) 08-Apr-02 122 ± 8 < 0.3 < 0.4Beef (CHINA) 26-Jul-02 118 ± 8 < 0.3 < 0.4Beef (CHINA) 16-Oct-02 128 ± 9 < 0.5 < 0.5Beef (CHINA) 13-Nov-02 121 ± 9 < 0.4 < 0.4Pig's Liver (CHINA) 23-Jan-02 99 ± 8 < 0.4 < 0.5Pig's Liver (CHINA) 08-Apr-02 90 ± 7 < 0.3 < 0.4Pig's Liver (CHINA) 26-Jul-02 92 ± 8 < 0.4 < 0.5Pig's Liver (CHINA) 16-Oct-02 90 ± 8 < 0.4 < 0.5Pig's Liver (LOCAL FARM) 23-Jan-02 102 ± 8 < 0.4 < 0.5Pig's Liver (LOCAL FARM) 08-Apr-02 94 ± 7 < 0.3 < 0.4Pig's Liver (LOCAL FARM) 26-Jul-02 90 ± 7 < 0.4 < 0.4Pig's Liver (LOCAL FARM) 16-Oct-02 96 ± 8 < 0.4 < 0.5Pork (CHINA) 23-Jan-02 123 ± 8 < 0.4 < 0.4Pork (CHINA) 08-Apr-02 131 ± 9 < 0.3 < 0.4Pork (CHINA) 26-Jul-02 126 ± 9 < 0.4 < 0.5Pork (CHINA) 16-Oct-02 127 ± 9 < 0.4 < 0.5Pork (LOCAL FARM) 23-Jan-02 125 ± 9 < 0.4 < 0.5Pork (LOCAL FARM) 08-Apr-02 123 ± 9 < 0.4 < 0.5Pork (LOCAL FARM) 26-Jul-02 117 ± 9 < 0.4 < 0.5Pork (LOCAL FARM) 16-Oct-02 122 ± 8 < 0.3 < 0.4
Note: no other artificial gamma-emitting radionuclide was detected in all of the
samples
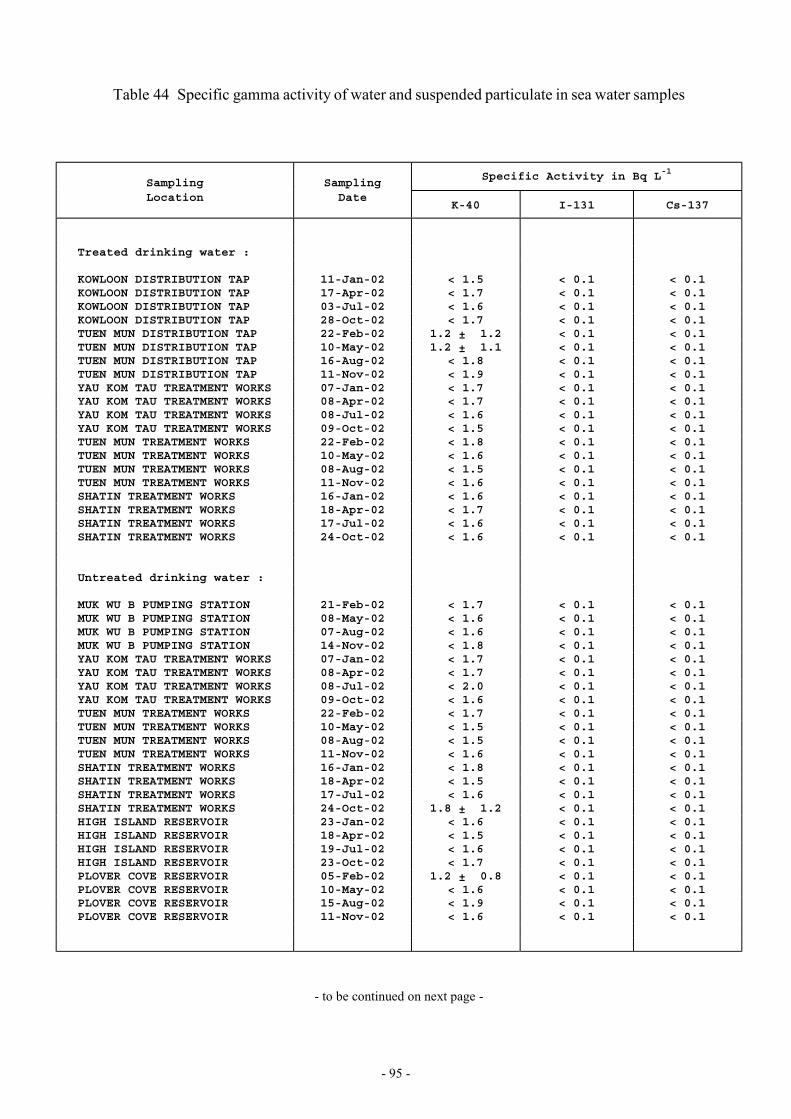
- 95 -
Table 44 Specific gamma activity of water and suspended particulate in sea water samples
Sampling SamplingSpecific Activity in Bq L-1
Location DateK-40 I-131 Cs-137
Treated drinking water :
KOWLOON DISTRIBUTION TAP 11-Jan-02 < 1.5 < 0.1 < 0.1KOWLOON DISTRIBUTION TAP 17-Apr-02 < 1.7 < 0.1 < 0.1KOWLOON DISTRIBUTION TAP 03-Jul-02 < 1.6 < 0.1 < 0.1KOWLOON DISTRIBUTION TAP 28-Oct-02 < 1.7 < 0.1 < 0.1TUEN MUN DISTRIBUTION TAP 22-Feb-02 1.2 ± 1.2 < 0.1 < 0.1TUEN MUN DISTRIBUTION TAP 10-May-02 1.2 ± 1.1 < 0.1 < 0.1TUEN MUN DISTRIBUTION TAP 16-Aug-02 < 1.8 < 0.1 < 0.1TUEN MUN DISTRIBUTION TAP 11-Nov-02 < 1.9 < 0.1 < 0.1YAU KOM TAU TREATMENT WORKS 07-Jan-02 < 1.7 < 0.1 < 0.1YAU KOM TAU TREATMENT WORKS 08-Apr-02 < 1.7 < 0.1 < 0.1YAU KOM TAU TREATMENT WORKS 08-Jul-02 < 1.6 < 0.1 < 0.1YAU KOM TAU TREATMENT WORKS 09-Oct-02 < 1.5 < 0.1 < 0.1TUEN MUN TREATMENT WORKS 22-Feb-02 < 1.8 < 0.1 < 0.1TUEN MUN TREATMENT WORKS 10-May-02 < 1.6 < 0.1 < 0.1TUEN MUN TREATMENT WORKS 08-Aug-02 < 1.5 < 0.1 < 0.1TUEN MUN TREATMENT WORKS 11-Nov-02 < 1.6 < 0.1 < 0.1SHATIN TREATMENT WORKS 16-Jan-02 < 1.6 < 0.1 < 0.1SHATIN TREATMENT WORKS 18-Apr-02 < 1.7 < 0.1 < 0.1SHATIN TREATMENT WORKS 17-Jul-02 < 1.6 < 0.1 < 0.1SHATIN TREATMENT WORKS 24-Oct-02 < 1.6 < 0.1 < 0.1
Untreated drinking water :
MUK WU B PUMPING STATION 21-Feb-02 < 1.7 < 0.1 < 0.1MUK WU B PUMPING STATION 08-May-02 < 1.6 < 0.1 < 0.1MUK WU B PUMPING STATION 07-Aug-02 < 1.6 < 0.1 < 0.1MUK WU B PUMPING STATION 14-Nov-02 < 1.8 < 0.1 < 0.1YAU KOM TAU TREATMENT WORKS 07-Jan-02 < 1.7 < 0.1 < 0.1YAU KOM TAU TREATMENT WORKS 08-Apr-02 < 1.7 < 0.1 < 0.1YAU KOM TAU TREATMENT WORKS 08-Jul-02 < 2.0 < 0.1 < 0.1YAU KOM TAU TREATMENT WORKS 09-Oct-02 < 1.6 < 0.1 < 0.1TUEN MUN TREATMENT WORKS 22-Feb-02 < 1.7 < 0.1 < 0.1TUEN MUN TREATMENT WORKS 10-May-02 < 1.5 < 0.1 < 0.1TUEN MUN TREATMENT WORKS 08-Aug-02 < 1.5 < 0.1 < 0.1TUEN MUN TREATMENT WORKS 11-Nov-02 < 1.6 < 0.1 < 0.1SHATIN TREATMENT WORKS 16-Jan-02 < 1.8 < 0.1 < 0.1SHATIN TREATMENT WORKS 18-Apr-02 < 1.5 < 0.1 < 0.1SHATIN TREATMENT WORKS 17-Jul-02 < 1.6 < 0.1 < 0.1SHATIN TREATMENT WORKS 24-Oct-02 1.8 ± 1.2 < 0.1 < 0.1HIGH ISLAND RESERVOIR 23-Jan-02 < 1.6 < 0.1 < 0.1HIGH ISLAND RESERVOIR 18-Apr-02 < 1.5 < 0.1 < 0.1HIGH ISLAND RESERVOIR 19-Jul-02 < 1.6 < 0.1 < 0.1HIGH ISLAND RESERVOIR 23-Oct-02 < 1.7 < 0.1 < 0.1PLOVER COVE RESERVOIR 05-Feb-02 1.2 ± 0.8 < 0.1 < 0.1PLOVER COVE RESERVOIR 10-May-02 < 1.6 < 0.1 < 0.1PLOVER COVE RESERVOIR 15-Aug-02 < 1.9 < 0.1 < 0.1PLOVER COVE RESERVOIR 11-Nov-02 < 1.6 < 0.1 < 0.1
- to be continued on next page -
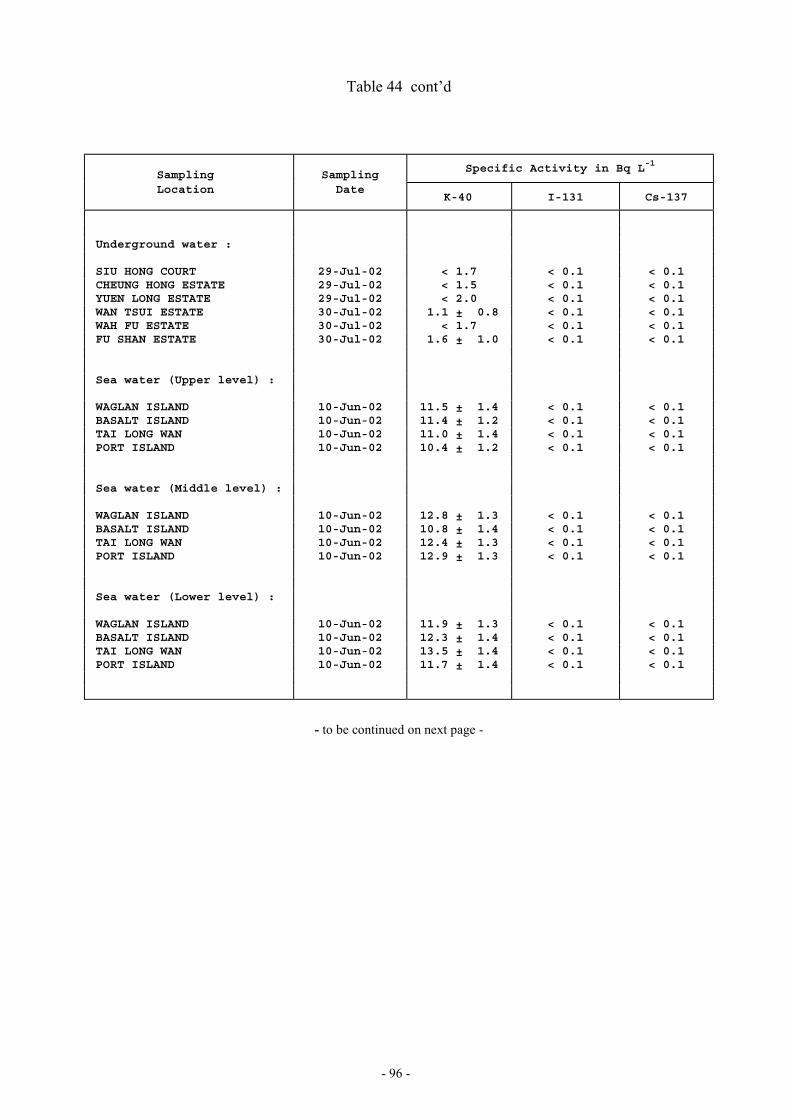
- 96 -
Table 44 cont’d
Sampling SamplingSpecific Activity in Bq L-1
Location DateK-40 I-131 Cs-137
Underground water :
SIU HONG COURT 29-Jul-02 < 1.7 < 0.1 < 0.1CHEUNG HONG ESTATE 29-Jul-02 < 1.5 < 0.1 < 0.1YUEN LONG ESTATE 29-Jul-02 < 2.0 < 0.1 < 0.1WAN TSUI ESTATE 30-Jul-02 1.1 ± 0.8 < 0.1 < 0.1WAH FU ESTATE 30-Jul-02 < 1.7 < 0.1 < 0.1FU SHAN ESTATE 30-Jul-02 1.6 ± 1.0 < 0.1 < 0.1
Sea water (Upper level) :
WAGLAN ISLAND 10-Jun-02 11.5 ± 1.4 < 0.1 < 0.1BASALT ISLAND 10-Jun-02 11.4 ± 1.2 < 0.1 < 0.1TAI LONG WAN 10-Jun-02 11.0 ± 1.4 < 0.1 < 0.1PORT ISLAND 10-Jun-02 10.4 ± 1.2 < 0.1 < 0.1
Sea water (Middle level) :
WAGLAN ISLAND 10-Jun-02 12.8 ± 1.3 < 0.1 < 0.1BASALT ISLAND 10-Jun-02 10.8 ± 1.4 < 0.1 < 0.1TAI LONG WAN 10-Jun-02 12.4 ± 1.3 < 0.1 < 0.1PORT ISLAND 10-Jun-02 12.9 ± 1.3 < 0.1 < 0.1
Sea water (Lower level) :
WAGLAN ISLAND 10-Jun-02 11.9 ± 1.3 < 0.1 < 0.1BASALT ISLAND 10-Jun-02 12.3 ± 1.4 < 0.1 < 0.1TAI LONG WAN 10-Jun-02 13.5 ± 1.4 < 0.1 < 0.1PORT ISLAND 10-Jun-02 11.7 ± 1.4 < 0.1 < 0.1
- to be continued on next page -

- 97 -
Table 44 cont’d
Sampling SamplingSpecific Activity in Bq L-1
Location DateK-40 I-131 Cs-137
Suspended particulate in sea water(Upper level) :
WAGLAN ISLAND 10-Jun-02 < 0.3 < 0.01 < 0.02BASALT ISLAND 10-Jun-02 < 0.3 < 0.01 < 0.02TAI LONG WAN 10-Jun-02 < 0.3 < 0.01 < 0.02PORT ISLAND 10-Jun-02 < 0.3 < 0.01 < 0.02
Suspended particulate in sea water(Middle level):
WAGLAN ISLAND 10-Jun-02 < 0.3 < 0.01 < 0.01BASALT ISLAND 10-Jun-02 < 0.3 < 0.01 < 0.02TAI LONG WAN 10-Jun-02 < 0.3 < 0.01 < 0.02PORT ISLAND 10-Jun-02 < 0.3 < 0.01 < 0.02
Suspended particulate in sea water(Lower level) :
WAGLAN ISLAND 10-Jun-02 < 0.3 < 0.01 < 0.02BASALT ISLAND 10-Jun-02 < 0.3 < 0.01 < 0.02TAI LONG WAN 10-Jun-02 < 0.3 < 0.02 < 0.02PORT ISLAND 10-Jun-02 < 0.3 < 0.01 < 0.02
Note: no other artificial gamma-emitting radionuclide was detected in all of the
samples

- 98 -
Table 45 Specific gamma activity of aquatic food and seaweed samples
Sample Type SamplingSpecific Activity in Bq kg-1
and Sampling Location DateK-40 I-131 Cs-137
Fish :
Freshwater Fish (AristichthysNobilis) (SHENZHEN)
30-Jan-02 38 ± 2 < 0.1 < 0.1
Freshwater Fish (AristichthysNobilis) (SHENZHEN)
09-Apr-02 38 ± 2 < 0.1 < 0.1
Freshwater Fish (AristichthysNobilis) (SHENZHEN)
16-Jul-02 37 ± 2 < 0.1 < 0.1
Freshwater Fish (AristichthysNobilis) (SHENZHEN)
10-Oct-02 43 ± 2 < 0.1 < 0.1
Freshwater Fish (AristichthysNobilis) (YUEN LONG)
30-Jan-02 41 ± 2 < 0.1 < 0.1
Freshwater Fish (AristichthysNobilis) (YUEN LONG)
09-Apr-02 43 ± 2 < 0.1 < 0.1
Freshwater Fish (AristichthysNobilis) (YUEN LONG)
16-Jul-02 36 ± 2 < 0.1 < 0.1
Freshwater Fish (AristichthysNobilis) (YUEN LONG)
10-Oct-02 40 ± 2 < 0.1 < 0.1
Marine Fish (Nemipterus Japonicus)(H.K.WATERS)
27-Aug-02 49 ± 3 < 0.1 < 0.1
Marine Fish (Nemipterus Japonicus)(H.K.WATERS)
13-Nov-02 43 ± 2 < 0.1 < 0.1
Marine Fish (Platycephalus Indicus)(H.K.WATERS)
14-Aug-02 39 ± 2 < 0.1 < 0.1
Marine Fish (Platycephalus Indicus)(H.K.WATERS)
21-Oct-02 46 ± 3 < 0.1 < 0.1
Marine Fish (Trichiurus Haumela)(H.K.WATERS)
14-Aug-02 60 ± 3 < 0.1 < 0.1
Marine Fish (Trichiurus Haumela)(H.K.WATERS)
13-Nov-02 76 ± 4 < 0.1 0.1 ± 0.1
- to be continued on next page -

- 99 -
Table 45 cont’d
Sample Type SamplingSpecific Activity in Bq kg-1
and Sampling Location DateK-40 I-131 Cs-137
Other seafood :
Crab (portunus sanguinolentus)(H.K.WATERS)
14-Aug-02 29 ± 2 < 0.1 < 0.1
Crab (portunus sanguinolentus)(H.K.WATERS)
21-Oct-02 38 ± 2 < 0.1 < 0.1
Shellfish (babylonia formosae)(H.K.WATERS)
21-Oct-02 28 ± 2 < 0.1 < 0.1
Shrimp (metapenaeopsis barbata)(H.K.WATERS)
27-Aug-02 26 ± 2 < 0.1 < 0.1
Shrimp (metapenaeopsis barbata)(H.K.WATERS)
21-Oct-02 31 ± 2 < 0.1 < 0.1
Cuttle Fish (H.K.WATERS) 27-Aug-02 44 ± 3 < 0.1 < 0.2Cuttle Fish (H.K.WATERS) 13-Nov-02 82 ± 5 < 0.1 < 0.2Squid (loligo edulis) (H.K.WATERS) 14-Aug-02 47 ± 3 < 0.2 < 0.2Squid (loligo edulis) (H.K.WATERS) 13-Nov-02 47 ± 3 < 0.1 < 0.1Shellfish (tapes philippinarum)
(TOLO)27-Aug-02 23 ± 1 < 0.1 < 0.1
Shellfish (tapes philippinarum)(TOLO)
13-Nov-02 18 ± 1 < 0.1 < 0.1
Shellfish (perna viridis)(CHEUNG CHAU)
08-Apr-02 21 ± 2 < 0.1 < 0.1
Shellfish (perna viridis)(CHEUNG CHAU)
31-Jul-02 28 ± 2 < 0.1 < 0.1
Shellfish (perna viridis)(CHEUNG CHAU)
22-Oct-02 20 ± 1 < 0.1 < 0.1
Shellfish (perna viridis) (TOLO) 14-Aug-02 20 ± 1 < 0.1 < 0.1Shellfish (perna viridis) (TOLO) 21-Oct-02 18 ± 1 < 0.1 < 0.1Shellfish (perna viridis) (DAYA BAY) 20-Aug-02 17 ± 1 < 0.1 < 0.1Shellfish (perna viridis) (DAYA BAY) 18-Nov-02 14 ± 1 < 0.1 < 0.1
- to be continued on next page -

- 100 -
Table 45 cont’d
Sample Type SamplingSpecific Activity in Bq kg-1
and Sampling Location DateK-40 I-131 Cs-137
Seaweed :
Seaweed (brown algae : sargassumhemiphyllum) (PO TOI O)
07-Feb-02 2660 ± 127 < 1.8 < 2.6
Seaweed (brown algae : sargassumhemiphyllum) (PO TOI O)
29-Apr-02 1980 ± 91 < 1.4 < 1.7
Seaweed (green algae : enteromorphaprolifera) (TOLO)
30-Jan-02 81 ± 7 < 0.4 < 0.5
Seaweed (green algae : ulva lactuca)(PO TOI O)
07-Feb-02 673 ± 46 < 1.7 < 2.2
Seaweed (green algae : ulva lactuca)(PO TOI O)
29-Apr-02 722 ± 42 < 1.2 < 1.7
Note: no other artificial gamma-emitting radionuclide was detected in all of the samples
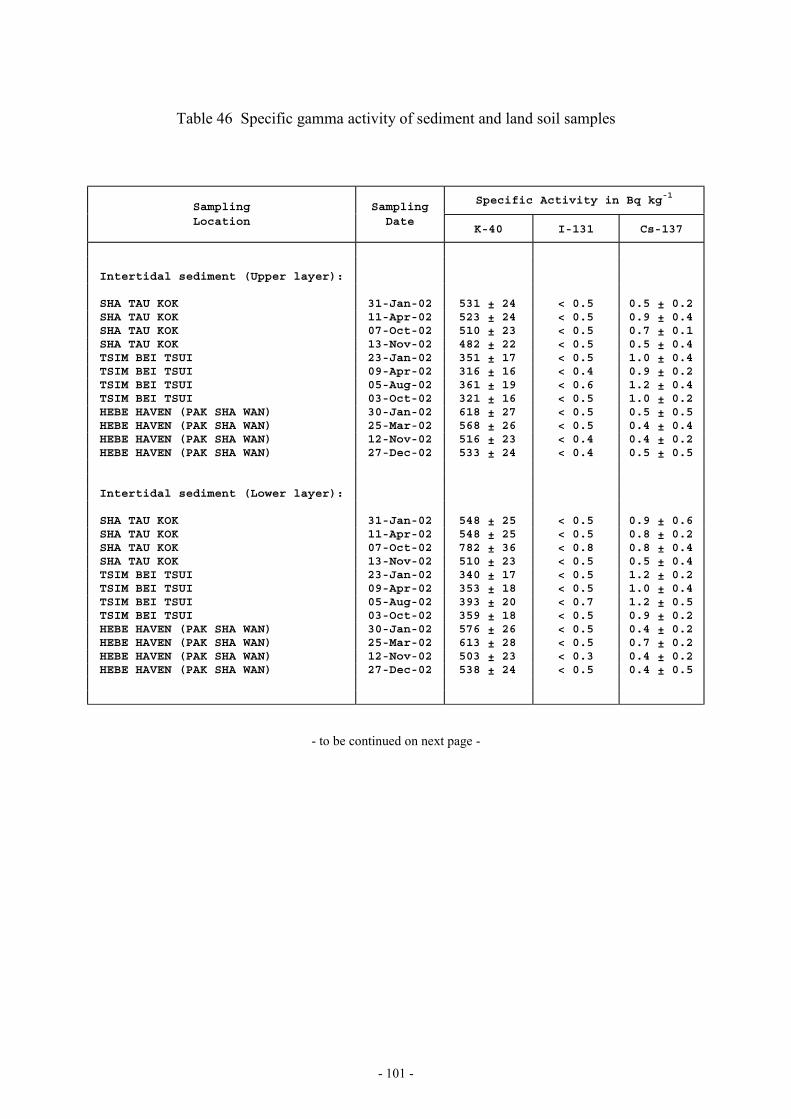
- 101 -
Table 46 Specific gamma activity of sediment and land soil samples
Sampling SamplingSpecific Activity in Bq kg-1
Location DateK-40 I-131 Cs-137
Intertidal sediment (Upper layer):
SHA TAU KOK 31-Jan-02 531 ± 24 < 0.5 0.5 ± 0.2SHA TAU KOK 11-Apr-02 523 ± 24 < 0.5 0.9 ± 0.4SHA TAU KOK 07-Oct-02 510 ± 23 < 0.5 0.7 ± 0.1SHA TAU KOK 13-Nov-02 482 ± 22 < 0.5 0.5 ± 0.4TSIM BEI TSUI 23-Jan-02 351 ± 17 < 0.5 1.0 ± 0.4TSIM BEI TSUI 09-Apr-02 316 ± 16 < 0.4 0.9 ± 0.2TSIM BEI TSUI 05-Aug-02 361 ± 19 < 0.6 1.2 ± 0.4TSIM BEI TSUI 03-Oct-02 321 ± 16 < 0.5 1.0 ± 0.2HEBE HAVEN (PAK SHA WAN) 30-Jan-02 618 ± 27 < 0.5 0.5 ± 0.5HEBE HAVEN (PAK SHA WAN) 25-Mar-02 568 ± 26 < 0.5 0.4 ± 0.4HEBE HAVEN (PAK SHA WAN) 12-Nov-02 516 ± 23 < 0.4 0.4 ± 0.2HEBE HAVEN (PAK SHA WAN) 27-Dec-02 533 ± 24 < 0.4 0.5 ± 0.5
Intertidal sediment (Lower layer):
SHA TAU KOK 31-Jan-02 548 ± 25 < 0.5 0.9 ± 0.6SHA TAU KOK 11-Apr-02 548 ± 25 < 0.5 0.8 ± 0.2SHA TAU KOK 07-Oct-02 782 ± 36 < 0.8 0.8 ± 0.4SHA TAU KOK 13-Nov-02 510 ± 23 < 0.5 0.5 ± 0.4TSIM BEI TSUI 23-Jan-02 340 ± 17 < 0.5 1.2 ± 0.2TSIM BEI TSUI 09-Apr-02 353 ± 18 < 0.5 1.0 ± 0.4TSIM BEI TSUI 05-Aug-02 393 ± 20 < 0.7 1.2 ± 0.5TSIM BEI TSUI 03-Oct-02 359 ± 18 < 0.5 0.9 ± 0.2HEBE HAVEN (PAK SHA WAN) 30-Jan-02 576 ± 26 < 0.5 0.4 ± 0.2HEBE HAVEN (PAK SHA WAN) 25-Mar-02 613 ± 28 < 0.5 0.7 ± 0.2HEBE HAVEN (PAK SHA WAN) 12-Nov-02 503 ± 23 < 0.3 0.4 ± 0.2HEBE HAVEN (PAK SHA WAN) 27-Dec-02 538 ± 24 < 0.5 0.4 ± 0.5
- to be continued on next page -
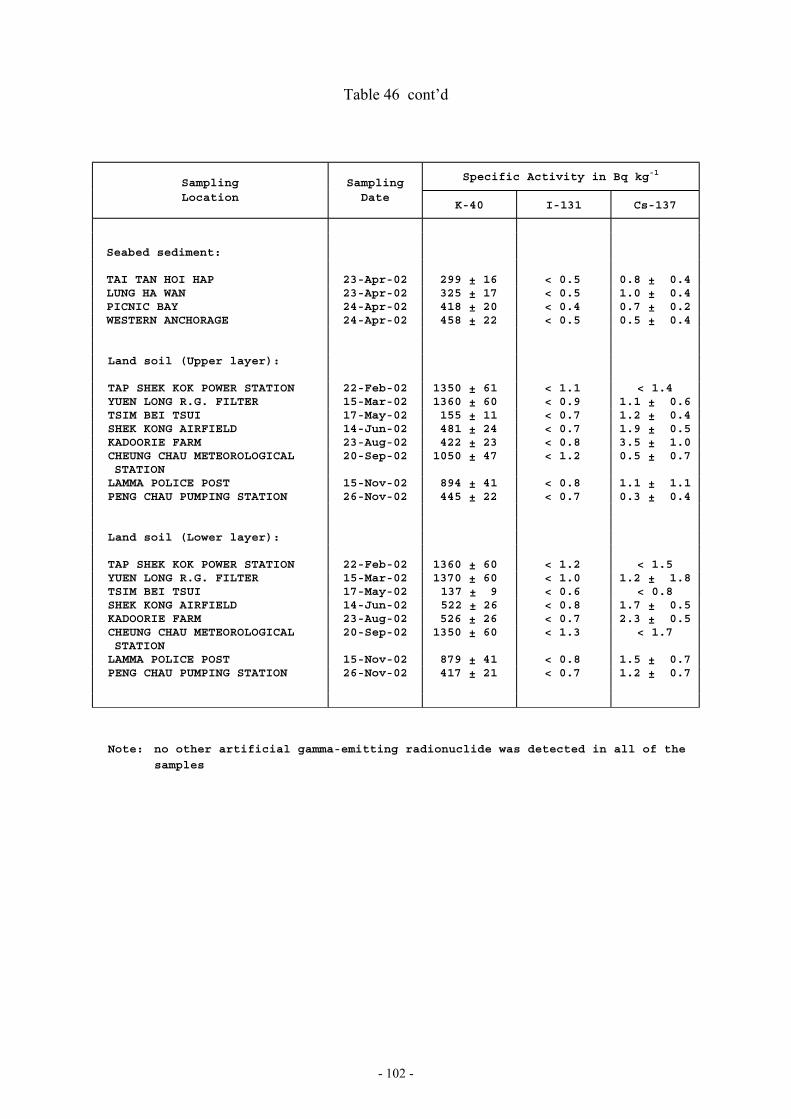
- 102 -
Table 46 cont’d
Sampling Sampling Specific Activity in Bq kg-1
Location DateK-40 I-131 Cs-137
Seabed sediment:
TAI TAN HOI HAP 23-Apr-02 299 ± 16 < 0.5 0.8 ± 0.4LUNG HA WAN 23-Apr-02 325 ± 17 < 0.5 1.0 ± 0.4PICNIC BAY 24-Apr-02 418 ± 20 < 0.4 0.7 ± 0.2WESTERN ANCHORAGE 24-Apr-02 458 ± 22 < 0.5 0.5 ± 0.4
Land soil (Upper layer):
TAP SHEK KOK POWER STATION 22-Feb-02 1350 ± 61 < 1.1 < 1.4YUEN LONG R.G. FILTER 15-Mar-02 1360 ± 60 < 0.9 1.1 ± 0.6TSIM BEI TSUI 17-May-02 155 ± 11 < 0.7 1.2 ± 0.4SHEK KONG AIRFIELD 14-Jun-02 481 ± 24 < 0.7 1.9 ± 0.5KADOORIE FARM 23-Aug-02 422 ± 23 < 0.8 3.5 ± 1.0CHEUNG CHAU METEOROLOGICALSTATION
20-Sep-02 1050 ± 47 < 1.2 0.5 ± 0.7
LAMMA POLICE POST 15-Nov-02 894 ± 41 < 0.8 1.1 ± 1.1PENG CHAU PUMPING STATION 26-Nov-02 445 ± 22 < 0.7 0.3 ± 0.4
Land soil (Lower layer):
TAP SHEK KOK POWER STATION 22-Feb-02 1360 ± 60 < 1.2 < 1.5YUEN LONG R.G. FILTER 15-Mar-02 1370 ± 60 < 1.0 1.2 ± 1.8TSIM BEI TSUI 17-May-02 137 ± 9 < 0.6 < 0.8SHEK KONG AIRFIELD 14-Jun-02 522 ± 26 < 0.8 1.7 ± 0.5KADOORIE FARM 23-Aug-02 526 ± 26 < 0.7 2.3 ± 0.5CHEUNG CHAU METEOROLOGICALSTATION
20-Sep-02 1350 ± 60 < 1.3 < 1.7
LAMMA POLICE POST 15-Nov-02 879 ± 41 < 0.8 1.5 ± 0.7PENG CHAU PUMPING STATION 26-Nov-02 417 ± 21 < 0.7 1.2 ± 0.7
Note: no other artificial gamma-emitting radionuclide was detected in all of the
samples

- 103 -
Table 47 Specific activity of tritium in deposition and airborne water vapour samples
Sampling Locationand Sampling Period
Specific Activity of H-3 in Bq L-1
Wet Deposition at King's Park :
03-Jan-02 to 02-Feb-02 ##02-Feb-02 to 28-Feb-02 **28-Feb-02 to 28-Mar-02 ##28-Mar-02 to 30-Apr-02 ##30-Apr-02 to 01-Jun-02 ##01-Jun-02 to 02-Jul-02 3.5 ± 3.202-Jul-02 to 30-Jul-02 1.3 ± 3.330-Jul-02 to 30-Aug-02 ##30-Aug-02 to 02-Oct-02 ##02-Oct-02 to 30-Oct-02 ##30-Oct-02 to 30-Nov-02 ##30-Nov-02 to 31-Dec-02 ##
Wet Deposition at Sha Tau Kok :
02-Jan-02 to 28-Jan-02 ##28-Jan-02 to 25-Feb-02 **25-Feb-02 to 03-Apr-02 0.5 ± 5.803-Apr-02 to 29-Apr-02 **29-Apr-02 to 30-May-02 ##30-May-02 to 02-Jul-02 0.8 ± 4.302-Jul-02 to 31-Jul-02 1.5 ± 4.331-Jul-02 to 02-Sep-02 ##02-Sep-02 to 02-Oct-02 ##02-Oct-02 to 31-Oct-02 ##31-Oct-02 to 19-Dec-02 **19-Dec-02 to 02-Jan-03 ##
Wet Deposition at Yuen Ng Fan :
02-Jan-02 to 28-Jan-02 ##28-Jan-02 to 25-Feb-02 **25-Feb-02 to 03-Apr-02 ##03-Apr-02 to 29-Apr-02 **29-Apr-02 to 30-May-02 ##30-May-02 to 02-Jul-02 1.8 ± 4.202-Jul-02 to 31-Jul-02 ##31-Jul-02 to 02-Sep-02 ##02-Sep-02 to 02-Oct-02 ##02-Oct-02 to 30-Oct-02 ##30-Oct-02 to 27-Nov-02 ##27-Nov-02 to 02-Jan-03 ##
** insufficient precipitation collected
## less than detection limit (Ref.: paragraph 4.4.2)
- to be continued on next page -

- 104 -
Table 47 cont’d
Sampling Locationand Sampling Period
Rainfallamount(mm)*
Specific Activity of H-3
in Bq m-2 for total deposition
and in Bq m-3 for water vapour
Total Deposition at King's Park :
03-Jan-02 to 02-Feb-02 19.6 ##02-Feb-02 to 28-Feb-02 7.4 196.0 ± 88.728-Feb-02 to 28-Mar-02 133.2 ##28-Mar-02 to 30-Apr-02 15.0 ##30-Apr-02 to 01-Jun-02 315.1 ##01-Jun-02 to 02-Jul-02 249.0 84.0 ± 413.102-Jul-02 to 30-Jul-02 357.6 183.0 ± 866.330-Jul-02 to 30-Aug-02 364.2 ##30-Aug-02 to 02-Oct-02 530.1 ##02-Oct-02 to 31-Oct-02 169.7 ##31-Oct-02 to 30-Nov-02 20.4 ##30-Nov-02 to 31-Dec-02 73.6 ##
Water vapour in air at King's Park :
16-Jan-02 to 23-Jan-02 ##19-Feb-02 to 25-Feb-02 ##08-Mar-02 to 15-Mar-02 ##22-Apr-02 to 29-Apr-02 ##22-May-02 to 30-May-02 11.2 ± 32.824-Jun-02 to 30-Jun-02 ##24-Jul-02 to 01-Aug-02 ##14-Aug-02 to 21-Aug-02 ##18-Sep-02 to 24-Sep-02 ##23-Oct-02 to 30-Oct-02 ##20-Nov-02 to 28-Nov-02 ##19-Dec-02 to 27-Dec-02 ##
* 24-hour rainfall is recorded daily at 3 p.m. Hong Kong Time
## less than detection limit (Ref.: paragraph 4.4.2)
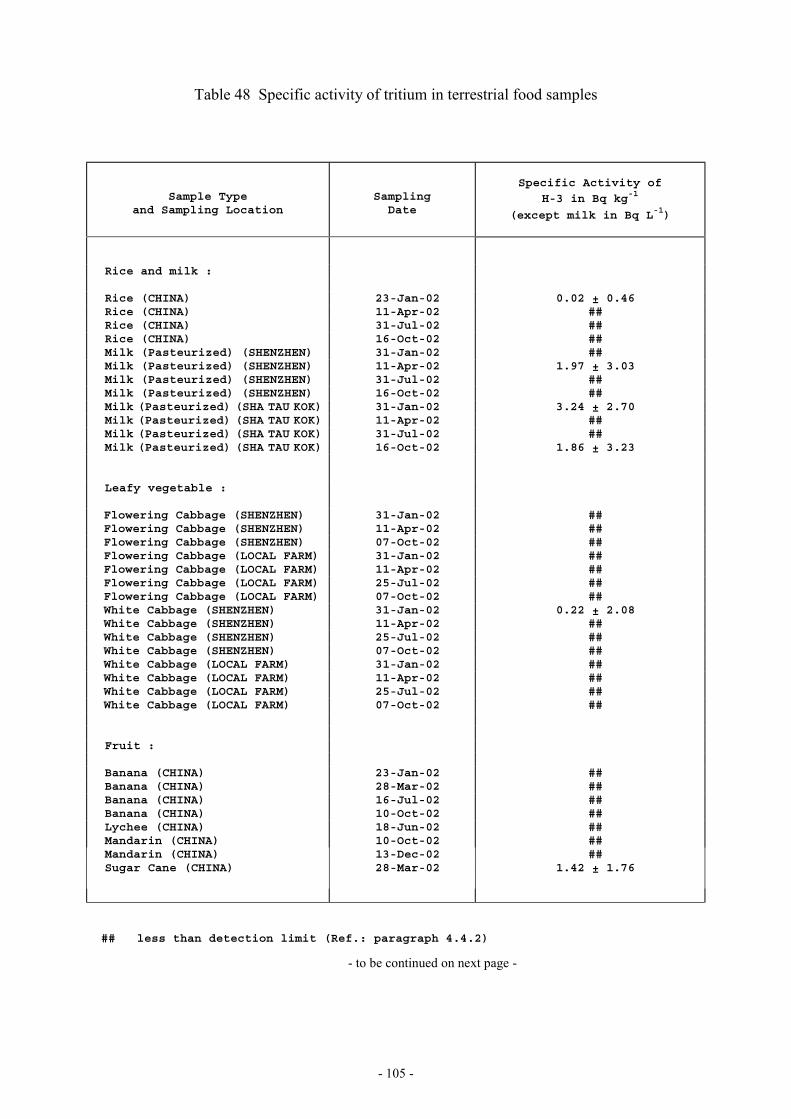
- 105 -
Table 48 Specific activity of tritium in terrestrial food samples
Sample Typeand Sampling Location
SamplingDate
Specific Activity of
H-3 in Bq kg-1
(except milk in Bq L-1)
Rice and milk :
Rice (CHINA) 23-Jan-02 0.02 ± 0.46Rice (CHINA) 11-Apr-02 ##Rice (CHINA) 31-Jul-02 ##Rice (CHINA) 16-Oct-02 ##Milk (Pasteurized) (SHENZHEN) 31-Jan-02 ##Milk (Pasteurized) (SHENZHEN) 11-Apr-02 1.97 ± 3.03Milk (Pasteurized) (SHENZHEN) 31-Jul-02 ##Milk (Pasteurized) (SHENZHEN) 16-Oct-02 ##Milk (Pasteurized) (SHA TAU KOK) 31-Jan-02 3.24 ± 2.70Milk (Pasteurized) (SHA TAU KOK) 11-Apr-02 ##Milk (Pasteurized) (SHA TAU KOK) 31-Jul-02 ##Milk (Pasteurized) (SHA TAU KOK) 16-Oct-02 1.86 ± 3.23
Leafy vegetable :
Flowering Cabbage (SHENZHEN) 31-Jan-02 ##Flowering Cabbage (SHENZHEN) 11-Apr-02 ##Flowering Cabbage (SHENZHEN) 07-Oct-02 ##Flowering Cabbage (LOCAL FARM) 31-Jan-02 ##Flowering Cabbage (LOCAL FARM) 11-Apr-02 ##Flowering Cabbage (LOCAL FARM) 25-Jul-02 ##Flowering Cabbage (LOCAL FARM) 07-Oct-02 ##White Cabbage (SHENZHEN) 31-Jan-02 0.22 ± 2.08White Cabbage (SHENZHEN) 11-Apr-02 ##White Cabbage (SHENZHEN) 25-Jul-02 ##White Cabbage (SHENZHEN) 07-Oct-02 ##White Cabbage (LOCAL FARM) 31-Jan-02 ##White Cabbage (LOCAL FARM) 11-Apr-02 ##White Cabbage (LOCAL FARM) 25-Jul-02 ##White Cabbage (LOCAL FARM) 07-Oct-02 ##
Fruit :
Banana (CHINA) 23-Jan-02 ##Banana (CHINA) 28-Mar-02 ##Banana (CHINA) 16-Jul-02 ##Banana (CHINA) 10-Oct-02 ##Lychee (CHINA) 18-Jun-02 ##Mandarin (CHINA) 10-Oct-02 ##Mandarin (CHINA) 13-Dec-02 ##Sugar Cane (CHINA) 28-Mar-02 1.42 ± 1.76
## less than detection limit (Ref.: paragraph 4.4.2)
- to be continued on next page -

- 106 -
Table 48 cont’d
Sample Typeand Sampling Location
SamplingDate
Specific Activity of
H-3 in Bq kg-1
Poultry:
Chicken (CHINA) 10-Jan-02 ##Chicken (CHINA) 13-Mar-02 ##Chicken (CHINA) 18-Jun-02 ##Chicken (CHINA) 10-Sep-02 ##Chicken (LOCAL FARM) 10-Jan-02 ##Chicken (LOCAL FARM) 13-Mar-02 ##Chicken (LOCAL FARM) 18-Jun-02 ##Chicken (LOCAL FARM) 10-Sep-02 1.52 ± 0.76Duck (CHINA) 10-Jan-02 0.86 ± 0.64Duck (CHINA) 13-Mar-02 ##Duck (CHINA) 18-Jun-02 ##Duck (CHINA) 10-Sep-02 1.89 ± 0.94Duck (LOCAL FARM) 05-Nov-02 ##
Meat:
Beef (CHINA) 23-Jan-02 ##Beef (CHINA) 08-Apr-02 5.49 ± 2.45Beef (CHINA) 26-Jul-02 5.30 ± 2.54Beef (CHINA) 16-Oct-02 0.72 ± 2.69Beef (CHINA) 13-Nov-02 ##Pig's Liver (CHINA) 23-Jan-02 ##Pig's Liver (CHINA) 08-Apr-02 ##Pig's Liver (CHINA) 26-Jul-02 1.57 ± 2.31Pig's Liver (CHINA) 16-Oct-02 ##Pig's Liver (LOCAL FARM) 23-Jan-02 0.51 ± 2.68Pig's Liver (LOCAL FARM) 08-Apr-02 ##Pig's Liver (LOCAL FARM) 26-Jul-02 2.84 ± 2.37Pig's Liver (LOCAL FARM) 16-Oct-02 ##Pork (CHINA) 23-Jan-02 1.20 ± 2.02Pork (CHINA) 08-Apr-02 1.04 ± 1.93Pork (CHINA) 26-Jul-02 1.74 ± 2.15Pork (CHINA) 16-Oct-02 ##Pork (LOCAL FARM) 23-Jan-02 1.05 ± 2.04Pork (LOCAL FARM) 08-Apr-02 ##Pork (LOCAL FARM) 26-Jul-02 ##Pork (LOCAL FARM) 16-Oct-02 ##
## less than detection limit (Ref.: paragraph 4.4.2)
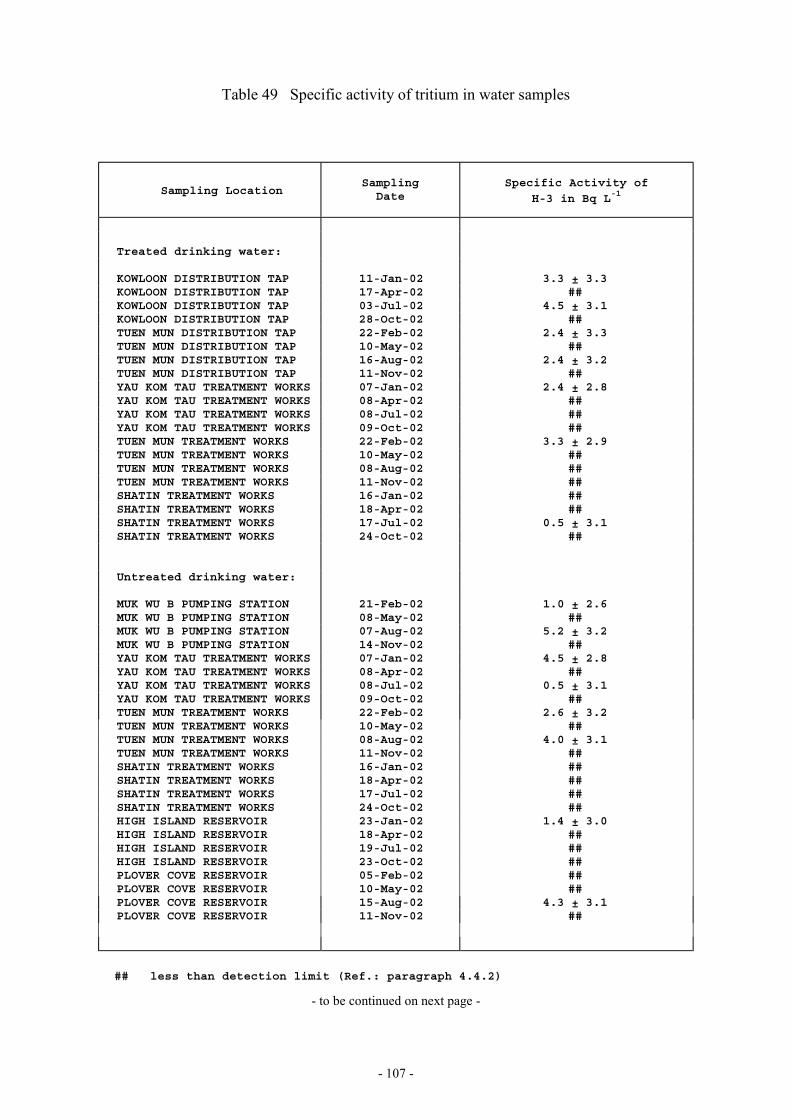
- 107 -
Table 49 Specific activity of tritium in water samples
Sampling LocationSamplingDate
Specific Activity of
H-3 in Bq L-1
Treated drinking water:
KOWLOON DISTRIBUTION TAP 11-Jan-02 3.3 ± 3.3KOWLOON DISTRIBUTION TAP 17-Apr-02 ##KOWLOON DISTRIBUTION TAP 03-Jul-02 4.5 ± 3.1KOWLOON DISTRIBUTION TAP 28-Oct-02 ##TUEN MUN DISTRIBUTION TAP 22-Feb-02 2.4 ± 3.3TUEN MUN DISTRIBUTION TAP 10-May-02 ##TUEN MUN DISTRIBUTION TAP 16-Aug-02 2.4 ± 3.2TUEN MUN DISTRIBUTION TAP 11-Nov-02 ##YAU KOM TAU TREATMENT WORKS 07-Jan-02 2.4 ± 2.8YAU KOM TAU TREATMENT WORKS 08-Apr-02 ##YAU KOM TAU TREATMENT WORKS 08-Jul-02 ##YAU KOM TAU TREATMENT WORKS 09-Oct-02 ##TUEN MUN TREATMENT WORKS 22-Feb-02 3.3 ± 2.9TUEN MUN TREATMENT WORKS 10-May-02 ##TUEN MUN TREATMENT WORKS 08-Aug-02 ##TUEN MUN TREATMENT WORKS 11-Nov-02 ##SHATIN TREATMENT WORKS 16-Jan-02 ##SHATIN TREATMENT WORKS 18-Apr-02 ##SHATIN TREATMENT WORKS 17-Jul-02 0.5 ± 3.1SHATIN TREATMENT WORKS 24-Oct-02 ##
Untreated drinking water:
MUK WU B PUMPING STATION 21-Feb-02 1.0 ± 2.6MUK WU B PUMPING STATION 08-May-02 ##MUK WU B PUMPING STATION 07-Aug-02 5.2 ± 3.2MUK WU B PUMPING STATION 14-Nov-02 ##YAU KOM TAU TREATMENT WORKS 07-Jan-02 4.5 ± 2.8YAU KOM TAU TREATMENT WORKS 08-Apr-02 ##YAU KOM TAU TREATMENT WORKS 08-Jul-02 0.5 ± 3.1YAU KOM TAU TREATMENT WORKS 09-Oct-02 ##TUEN MUN TREATMENT WORKS 22-Feb-02 2.6 ± 3.2TUEN MUN TREATMENT WORKS 10-May-02 ##TUEN MUN TREATMENT WORKS 08-Aug-02 4.0 ± 3.1TUEN MUN TREATMENT WORKS 11-Nov-02 ##SHATIN TREATMENT WORKS 16-Jan-02 ##SHATIN TREATMENT WORKS 18-Apr-02 ##SHATIN TREATMENT WORKS 17-Jul-02 ##SHATIN TREATMENT WORKS 24-Oct-02 ##HIGH ISLAND RESERVOIR 23-Jan-02 1.4 ± 3.0HIGH ISLAND RESERVOIR 18-Apr-02 ##HIGH ISLAND RESERVOIR 19-Jul-02 ##HIGH ISLAND RESERVOIR 23-Oct-02 ##PLOVER COVE RESERVOIR 05-Feb-02 ##PLOVER COVE RESERVOIR 10-May-02 ##PLOVER COVE RESERVOIR 15-Aug-02 4.3 ± 3.1PLOVER COVE RESERVOIR 11-Nov-02 ##
## less than detection limit (Ref.: paragraph 4.4.2)
- to be continued on next page -
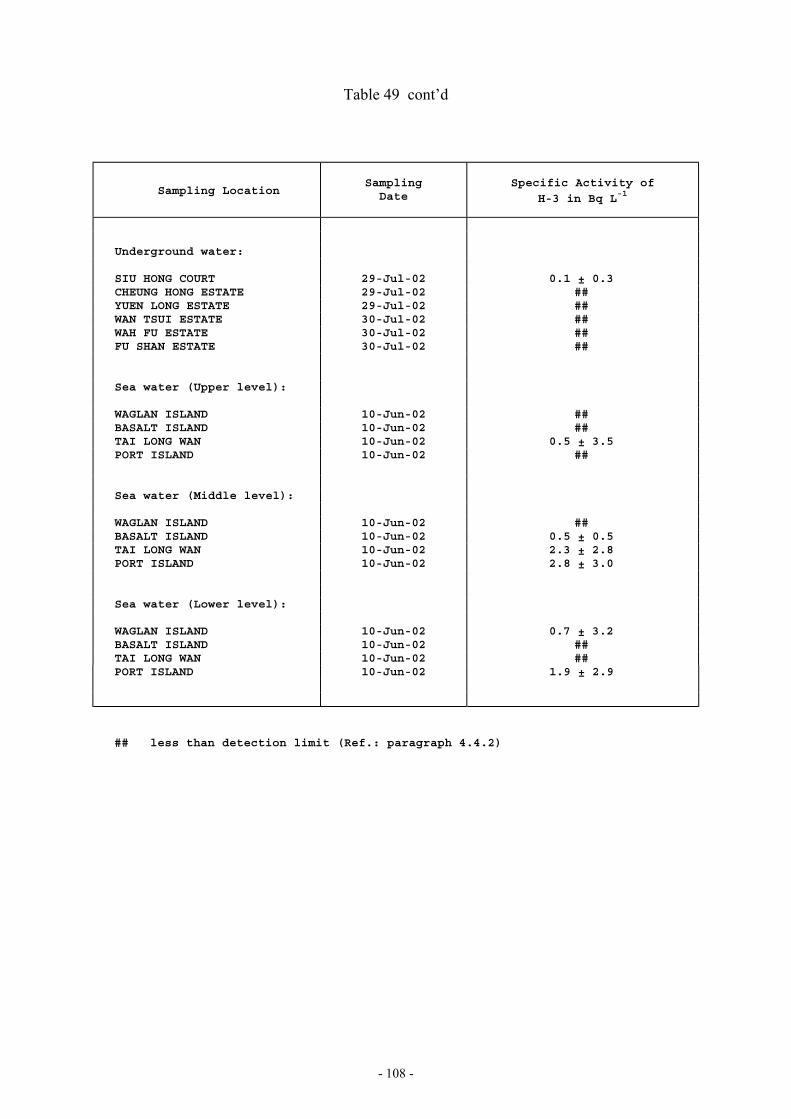
- 108 -
Table 49 cont’d
Sampling LocationSamplingDate
Specific Activity of
H-3 in Bq L-1
Underground water: SIU HONG COURT 29-Jul-02 0.1 ± 0.3 CHEUNG HONG ESTATE 29-Jul-02 ## YUEN LONG ESTATE 29-Jul-02 ## WAN TSUI ESTATE 30-Jul-02 ## WAH FU ESTATE 30-Jul-02 ## FU SHAN ESTATE 30-Jul-02 ## Sea water (Upper level): WAGLAN ISLAND 10-Jun-02 ## BASALT ISLAND 10-Jun-02 ## TAI LONG WAN 10-Jun-02 0.5 ± 3.5 PORT ISLAND 10-Jun-02 ## Sea water (Middle level): WAGLAN ISLAND 10-Jun-02 ## BASALT ISLAND 10-Jun-02 0.5 ± 0.5 TAI LONG WAN 10-Jun-02 2.3 ± 2.8 PORT ISLAND 10-Jun-02 2.8 ± 3.0 Sea water (Lower level): WAGLAN ISLAND 10-Jun-02 0.7 ± 3.2 BASALT ISLAND 10-Jun-02 ## TAI LONG WAN 10-Jun-02 ## PORT ISLAND 10-Jun-02 1.9 ± 2.9
## less than detection limit (Ref.: paragraph 4.4.2)
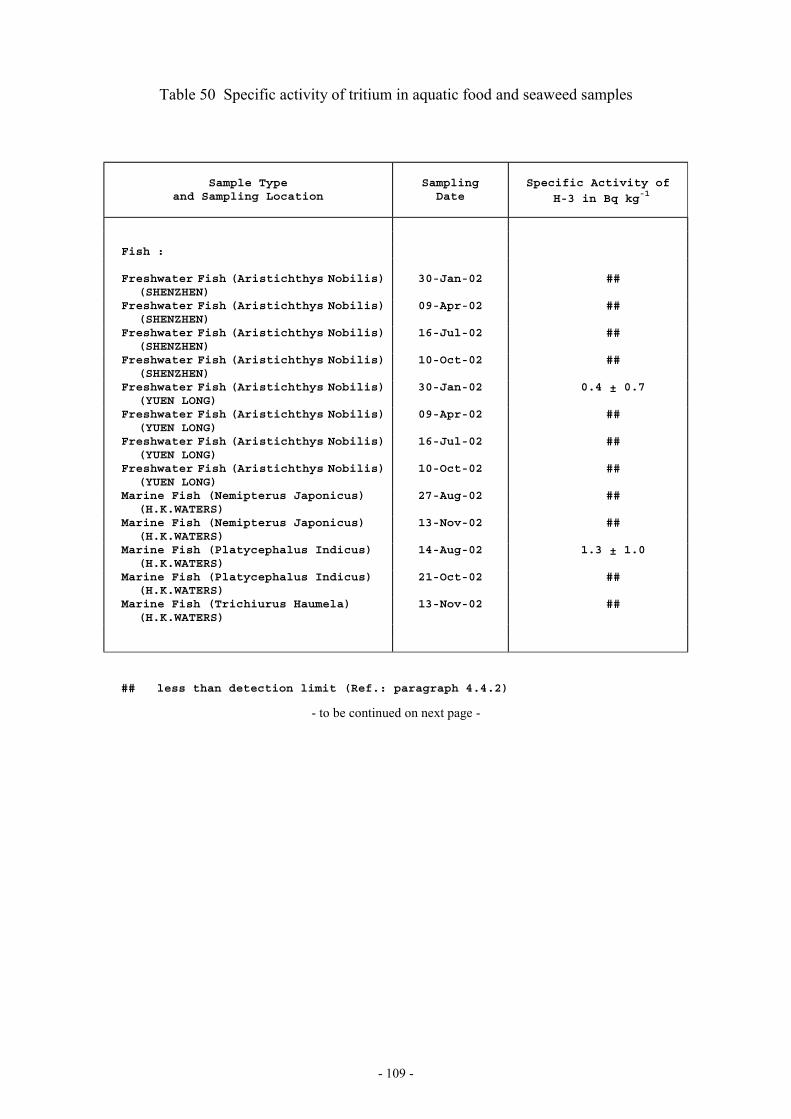
- 109 -
Table 50 Specific activity of tritium in aquatic food and seaweed samples
Sample Typeand Sampling Location
SamplingDate
Specific Activity of
H-3 in Bq kg-1
Fish : Freshwater Fish (Aristichthys Nobilis)
(SHENZHEN) 30-Jan-02 ##
Freshwater Fish (Aristichthys Nobilis)(SHENZHEN)
09-Apr-02 ##
Freshwater Fish (Aristichthys Nobilis)(SHENZHEN)
16-Jul-02 ##
Freshwater Fish (Aristichthys Nobilis)(SHENZHEN)
10-Oct-02 ##
Freshwater Fish (Aristichthys Nobilis)(YUEN LONG)
30-Jan-02 0.4 ± 0.7
Freshwater Fish (Aristichthys Nobilis)(YUEN LONG)
09-Apr-02 ##
Freshwater Fish (Aristichthys Nobilis)(YUEN LONG)
16-Jul-02 ##
Freshwater Fish (Aristichthys Nobilis)(YUEN LONG)
10-Oct-02 ##
Marine Fish (Nemipterus Japonicus)(H.K.WATERS)
27-Aug-02 ##
Marine Fish (Nemipterus Japonicus)(H.K.WATERS)
13-Nov-02 ##
Marine Fish (Platycephalus Indicus)(H.K.WATERS)
14-Aug-02 1.3 ± 1.0
Marine Fish (Platycephalus Indicus)(H.K.WATERS)
21-Oct-02 ##
Marine Fish (Trichiurus Haumela)(H.K.WATERS)
13-Nov-02 ##
## less than detection limit (Ref.: paragraph 4.4.2)
- to be continued on next page -
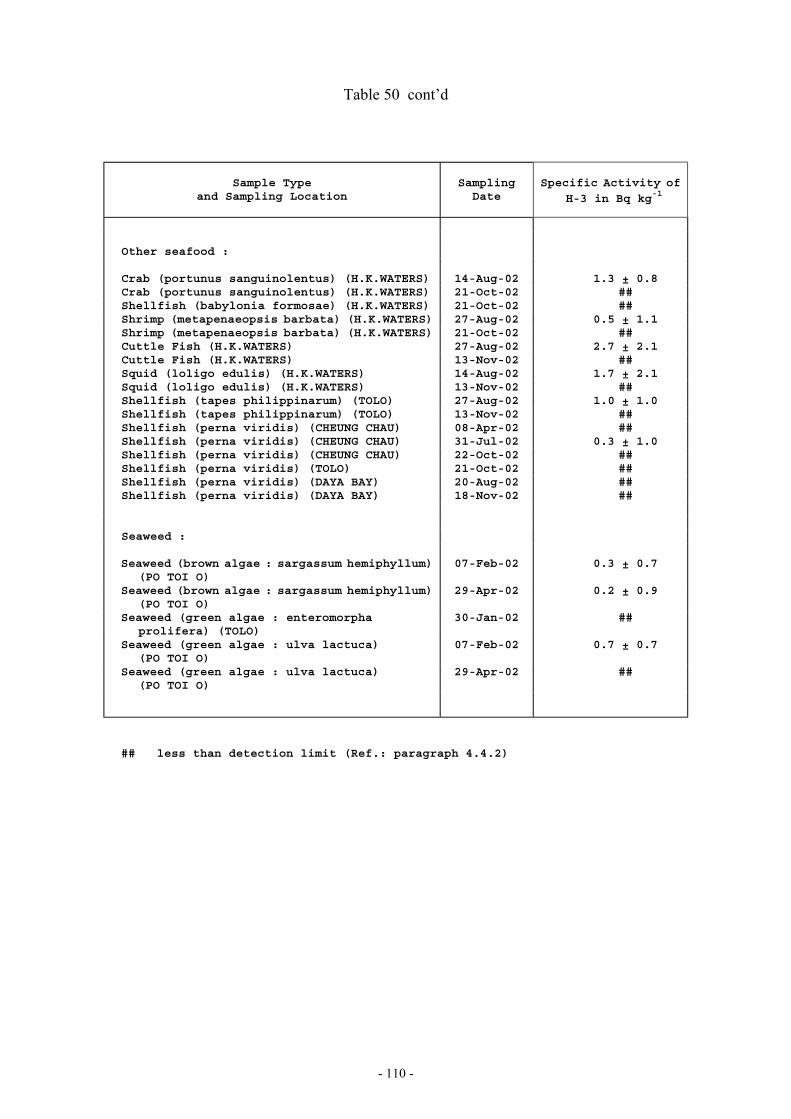
- 110 -
Table 50 cont’d
Sample Typeand Sampling Location
SamplingDate
Specific Activity of
H-3 in Bq kg-1
Other seafood : Crab (portunus sanguinolentus) (H.K.WATERS) 14-Aug-02 1.3 ± 0.8 Crab (portunus sanguinolentus) (H.K.WATERS) 21-Oct-02 ## Shellfish (babylonia formosae) (H.K.WATERS) 21-Oct-02 ## Shrimp (metapenaeopsis barbata) (H.K.WATERS) 27-Aug-02 0.5 ± 1.1 Shrimp (metapenaeopsis barbata) (H.K.WATERS) 21-Oct-02 ## Cuttle Fish (H.K.WATERS) 27-Aug-02 2.7 ± 2.1 Cuttle Fish (H.K.WATERS) 13-Nov-02 ## Squid (loligo edulis) (H.K.WATERS) 14-Aug-02 1.7 ± 2.1 Squid (loligo edulis) (H.K.WATERS) 13-Nov-02 ## Shellfish (tapes philippinarum) (TOLO) 27-Aug-02 1.0 ± 1.0 Shellfish (tapes philippinarum) (TOLO) 13-Nov-02 ## Shellfish (perna viridis) (CHEUNG CHAU) 08-Apr-02 ## Shellfish (perna viridis) (CHEUNG CHAU) 31-Jul-02 0.3 ± 1.0 Shellfish (perna viridis) (CHEUNG CHAU) 22-Oct-02 ## Shellfish (perna viridis) (TOLO) 21-Oct-02 ## Shellfish (perna viridis) (DAYA BAY) 20-Aug-02 ## Shellfish (perna viridis) (DAYA BAY) 18-Nov-02 ## Seaweed : Seaweed (brown algae : sargassum hemiphyllum)
(PO TOI O) 07-Feb-02 0.3 ± 0.7
Seaweed (brown algae : sargassum hemiphyllum)(PO TOI O)
29-Apr-02 0.2 ± 0.9
Seaweed (green algae : enteromorphaprolifera) (TOLO)
30-Jan-02 ##
Seaweed (green algae : ulva lactuca)(PO TOI O)
07-Feb-02 0.7 ± 0.7
Seaweed (green algae : ulva lactuca)(PO TOI O)
29-Apr-02 ##
## less than detection limit (Ref.: paragraph 4.4.2)
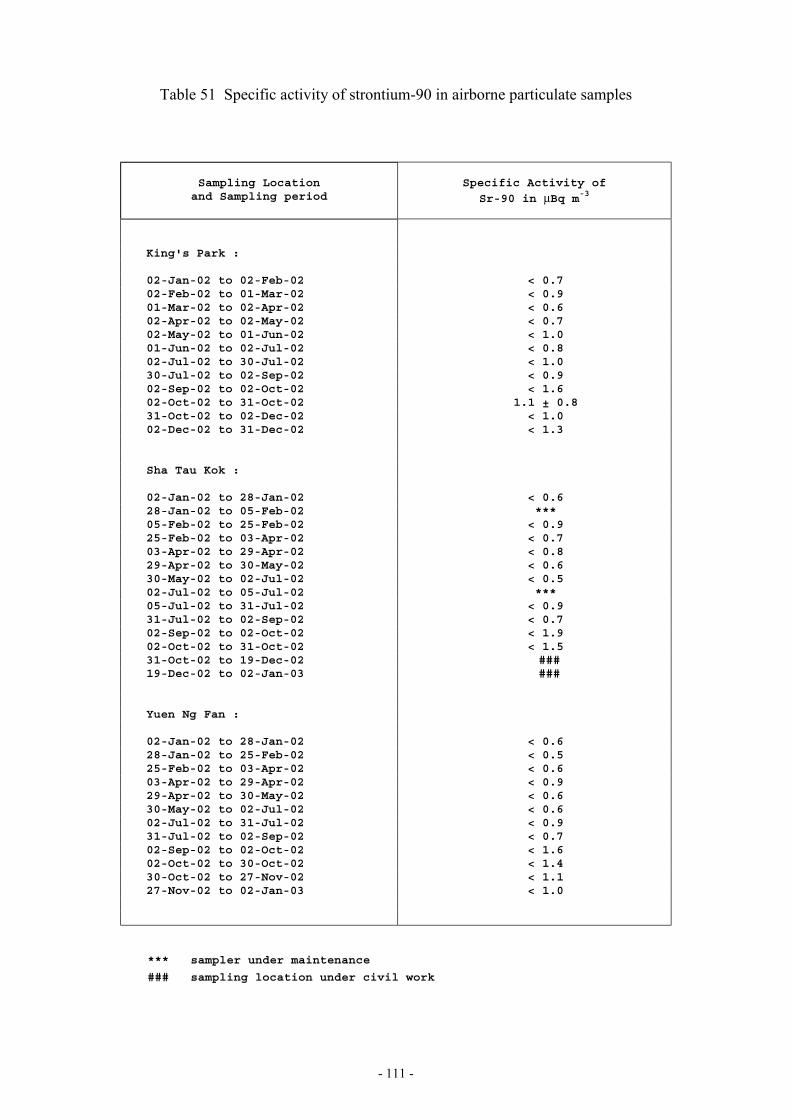
- 111 -
Table 51 Specific activity of strontium-90 in airborne particulate samples
Sampling Locationand Sampling period
Specific Activity of
Sr-90 in µBq m-3
King's Park : 02-Jan-02 to 02-Feb-02 < 0.7 02-Feb-02 to 01-Mar-02 < 0.9 01-Mar-02 to 02-Apr-02 < 0.6 02-Apr-02 to 02-May-02 < 0.7 02-May-02 to 01-Jun-02 < 1.0 01-Jun-02 to 02-Jul-02 < 0.8 02-Jul-02 to 30-Jul-02 < 1.0 30-Jul-02 to 02-Sep-02 < 0.9 02-Sep-02 to 02-Oct-02 < 1.6 02-Oct-02 to 31-Oct-02 1.1 ± 0.8 31-Oct-02 to 02-Dec-02 < 1.0 02-Dec-02 to 31-Dec-02 < 1.3 Sha Tau Kok : 02-Jan-02 to 28-Jan-02 < 0.6 28-Jan-02 to 05-Feb-02 *** 05-Feb-02 to 25-Feb-02 < 0.9 25-Feb-02 to 03-Apr-02 < 0.7 03-Apr-02 to 29-Apr-02 < 0.8 29-Apr-02 to 30-May-02 < 0.6 30-May-02 to 02-Jul-02 < 0.5 02-Jul-02 to 05-Jul-02 *** 05-Jul-02 to 31-Jul-02 < 0.9 31-Jul-02 to 02-Sep-02 < 0.7 02-Sep-02 to 02-Oct-02 < 1.9 02-Oct-02 to 31-Oct-02 < 1.5 31-Oct-02 to 19-Dec-02 ### 19-Dec-02 to 02-Jan-03 ### Yuen Ng Fan : 02-Jan-02 to 28-Jan-02 < 0.6 28-Jan-02 to 25-Feb-02 < 0.5 25-Feb-02 to 03-Apr-02 < 0.6 03-Apr-02 to 29-Apr-02 < 0.9 29-Apr-02 to 30-May-02 < 0.6 30-May-02 to 02-Jul-02 < 0.6 02-Jul-02 to 31-Jul-02 < 0.9 31-Jul-02 to 02-Sep-02 < 0.7 02-Sep-02 to 02-Oct-02 < 1.6 02-Oct-02 to 30-Oct-02 < 1.4 30-Oct-02 to 27-Nov-02 < 1.1 27-Nov-02 to 02-Jan-03 < 1.0
*** sampler under maintenance
### sampling location under civil work
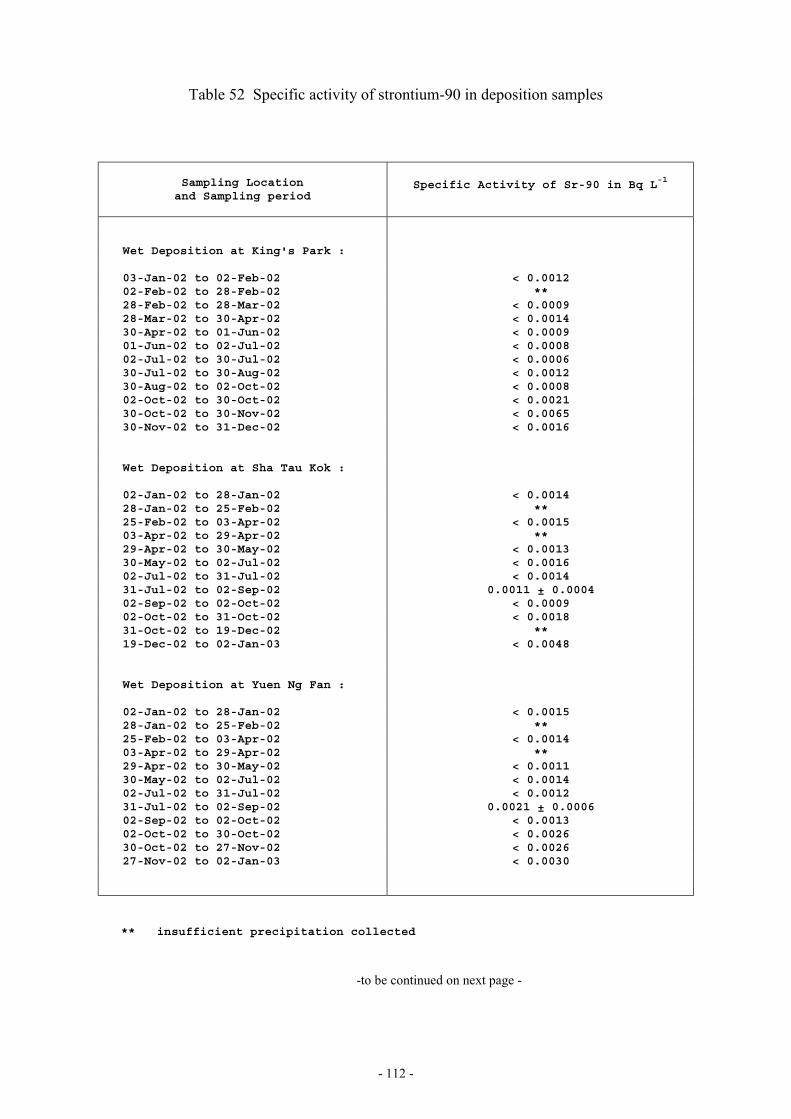
- 112 -
Table 52 Specific activity of strontium-90 in deposition samples
Sampling Locationand Sampling period
Specific Activity of Sr-90 in Bq L-1
Wet Deposition at King's Park : 03-Jan-02 to 02-Feb-02 < 0.0012 02-Feb-02 to 28-Feb-02 ** 28-Feb-02 to 28-Mar-02 < 0.0009 28-Mar-02 to 30-Apr-02 < 0.0014 30-Apr-02 to 01-Jun-02 < 0.0009 01-Jun-02 to 02-Jul-02 < 0.0008 02-Jul-02 to 30-Jul-02 < 0.0006 30-Jul-02 to 30-Aug-02 < 0.0012 30-Aug-02 to 02-Oct-02 < 0.0008 02-Oct-02 to 30-Oct-02 < 0.0021 30-Oct-02 to 30-Nov-02 < 0.0065 30-Nov-02 to 31-Dec-02 < 0.0016 Wet Deposition at Sha Tau Kok : 02-Jan-02 to 28-Jan-02 < 0.0014 28-Jan-02 to 25-Feb-02 ** 25-Feb-02 to 03-Apr-02 < 0.0015 03-Apr-02 to 29-Apr-02 ** 29-Apr-02 to 30-May-02 < 0.0013 30-May-02 to 02-Jul-02 < 0.0016 02-Jul-02 to 31-Jul-02 < 0.0014 31-Jul-02 to 02-Sep-02 0.0011 ± 0.0004 02-Sep-02 to 02-Oct-02 < 0.0009 02-Oct-02 to 31-Oct-02 < 0.0018 31-Oct-02 to 19-Dec-02 ** 19-Dec-02 to 02-Jan-03 < 0.0048 Wet Deposition at Yuen Ng Fan : 02-Jan-02 to 28-Jan-02 < 0.0015 28-Jan-02 to 25-Feb-02 ** 25-Feb-02 to 03-Apr-02 < 0.0014 03-Apr-02 to 29-Apr-02 ** 29-Apr-02 to 30-May-02 < 0.0011 30-May-02 to 02-Jul-02 < 0.0014 02-Jul-02 to 31-Jul-02 < 0.0012 31-Jul-02 to 02-Sep-02 0.0021 ± 0.0006 02-Sep-02 to 02-Oct-02 < 0.0013 02-Oct-02 to 30-Oct-02 < 0.0026 30-Oct-02 to 27-Nov-02 < 0.0026 27-Nov-02 to 02-Jan-03 < 0.0030
** insufficient precipitation collected
-to be continued on next page -

- 113 -
Table 52 cont’d
Sample Typeand Sampling Location
Rainfallamount(mm)*
Specific Activity of Sr-90 in Bq m-2
Total Deposition at King's Park :
03-Jan-02 to 02-Feb-02 19.6 < 0.18 02-Feb-02 to 28-Feb-02 7.4 < 0.15 28-Feb-02 to 28-Mar-02 133.2 < 0.17 28-Mar-02 to 30-Apr-02 15.0 < 0.18 30-Apr-02 to 01-Jun-02 315.1 0.29 ± 0.15 01-Jun-02 to 02-Jul-02 249.0 < 0.31 02-Jul-02 to 30-Jul-02 357.6 < 0.26 30-Jul-02 to 30-Aug-02 364.2 0.32 ± 0.09 30-Aug-02 to 02-Oct-02 530.1 < 0.49 02-Oct-02 to 31-Oct-02 169.7 < 0.34 31-Oct-02 to 30-Nov-02 20.4 < 0.40 30-Nov-02 to 31-Dec-02 73.6 < 0.33
* 24-hour rainfall is recorded daily at 3 p.m. Hong Kong Time
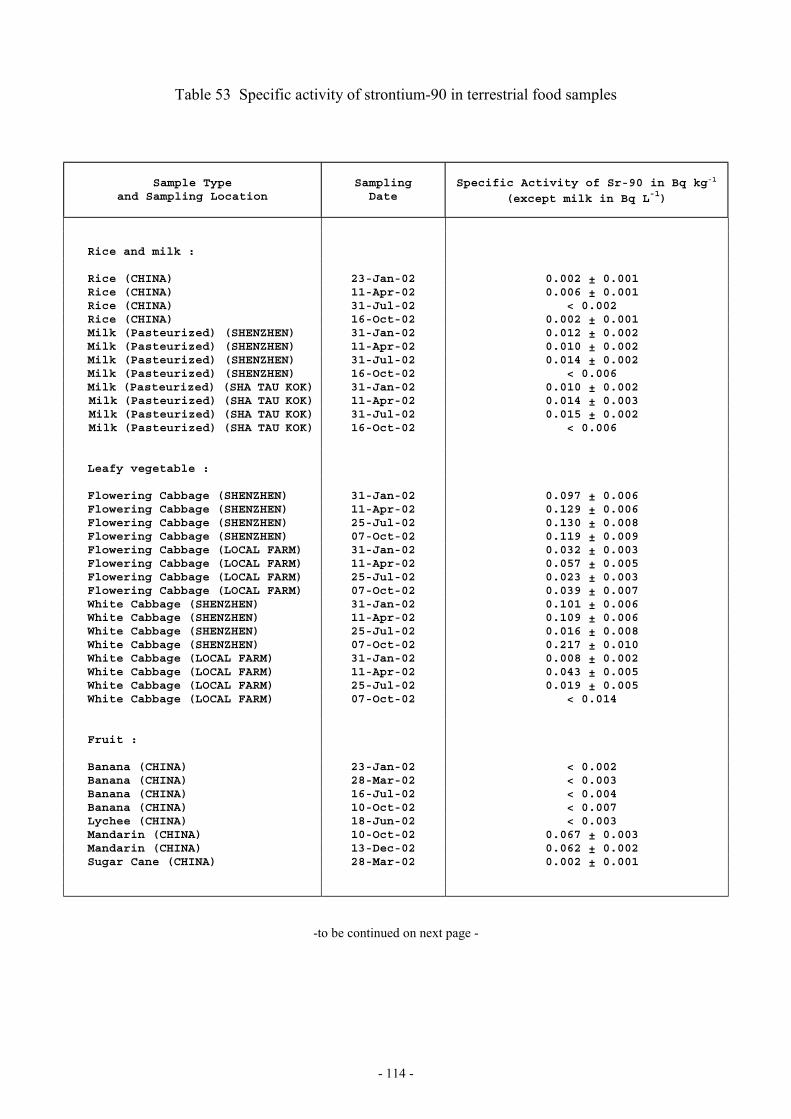
- 114 -
Table 53 Specific activity of strontium-90 in terrestrial food samples
Sample Typeand Sampling Location
SamplingDate
Specific Activity of Sr-90 in Bq kg-1
(except milk in Bq L-1)
Rice and milk : Rice (CHINA) 23-Jan-02 0.002 ± 0.001 Rice (CHINA) 11-Apr-02 0.006 ± 0.001 Rice (CHINA) 31-Jul-02 < 0.002 Rice (CHINA) 16-Oct-02 0.002 ± 0.001 Milk (Pasteurized) (SHENZHEN) 31-Jan-02 0.012 ± 0.002 Milk (Pasteurized) (SHENZHEN) 11-Apr-02 0.010 ± 0.002 Milk (Pasteurized) (SHENZHEN) 31-Jul-02 0.014 ± 0.002 Milk (Pasteurized) (SHENZHEN) 16-Oct-02 < 0.006 Milk (Pasteurized) (SHA TAU KOK) 31-Jan-02 0.010 ± 0.002 Milk (Pasteurized) (SHA TAU KOK) 11-Apr-02 0.014 ± 0.003 Milk (Pasteurized) (SHA TAU KOK) 31-Jul-02 0.015 ± 0.002 Milk (Pasteurized) (SHA TAU KOK) 16-Oct-02 < 0.006 Leafy vegetable : Flowering Cabbage (SHENZHEN) 31-Jan-02 0.097 ± 0.006 Flowering Cabbage (SHENZHEN) 11-Apr-02 0.129 ± 0.006 Flowering Cabbage (SHENZHEN) 25-Jul-02 0.130 ± 0.008 Flowering Cabbage (SHENZHEN) 07-Oct-02 0.119 ± 0.009 Flowering Cabbage (LOCAL FARM) 31-Jan-02 0.032 ± 0.003 Flowering Cabbage (LOCAL FARM) 11-Apr-02 0.057 ± 0.005 Flowering Cabbage (LOCAL FARM) 25-Jul-02 0.023 ± 0.003 Flowering Cabbage (LOCAL FARM) 07-Oct-02 0.039 ± 0.007 White Cabbage (SHENZHEN) 31-Jan-02 0.101 ± 0.006 White Cabbage (SHENZHEN) 11-Apr-02 0.109 ± 0.006 White Cabbage (SHENZHEN) 25-Jul-02 0.016 ± 0.008 White Cabbage (SHENZHEN) 07-Oct-02 0.217 ± 0.010 White Cabbage (LOCAL FARM) 31-Jan-02 0.008 ± 0.002 White Cabbage (LOCAL FARM) 11-Apr-02 0.043 ± 0.005 White Cabbage (LOCAL FARM) 25-Jul-02 0.019 ± 0.005 White Cabbage (LOCAL FARM) 07-Oct-02 < 0.014 Fruit : Banana (CHINA) 23-Jan-02 < 0.002 Banana (CHINA) 28-Mar-02 < 0.003 Banana (CHINA) 16-Jul-02 < 0.004 Banana (CHINA) 10-Oct-02 < 0.007 Lychee (CHINA) 18-Jun-02 < 0.003 Mandarin (CHINA) 10-Oct-02 0.067 ± 0.003 Mandarin (CHINA) 13-Dec-02 0.062 ± 0.002 Sugar Cane (CHINA) 28-Mar-02 0.002 ± 0.001
-to be continued on next page -
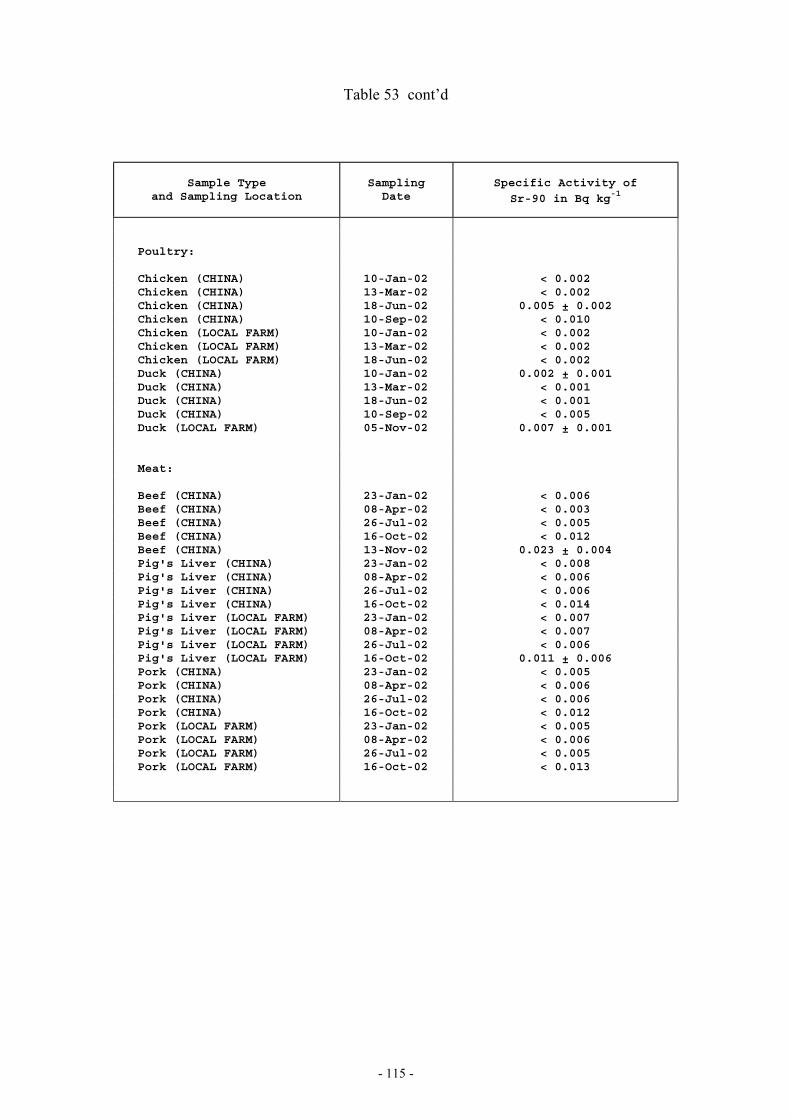
- 115 -
Table 53 cont’d
Sample Typeand Sampling Location
SamplingDate
Specific Activity of
Sr-90 in Bq kg-1
Poultry: Chicken (CHINA) 10-Jan-02 < 0.002 Chicken (CHINA) 13-Mar-02 < 0.002 Chicken (CHINA) 18-Jun-02 0.005 ± 0.002 Chicken (CHINA) 10-Sep-02 < 0.010 Chicken (LOCAL FARM) 10-Jan-02 < 0.002 Chicken (LOCAL FARM) 13-Mar-02 < 0.002 Chicken (LOCAL FARM) 18-Jun-02 < 0.002 Duck (CHINA) 10-Jan-02 0.002 ± 0.001 Duck (CHINA) 13-Mar-02 < 0.001 Duck (CHINA) 18-Jun-02 < 0.001 Duck (CHINA) 10-Sep-02 < 0.005 Duck (LOCAL FARM) 05-Nov-02 0.007 ± 0.001 Meat: Beef (CHINA) 23-Jan-02 < 0.006 Beef (CHINA) 08-Apr-02 < 0.003 Beef (CHINA) 26-Jul-02 < 0.005 Beef (CHINA) 16-Oct-02 < 0.012 Beef (CHINA) 13-Nov-02 0.023 ± 0.004 Pig's Liver (CHINA) 23-Jan-02 < 0.008 Pig's Liver (CHINA) 08-Apr-02 < 0.006 Pig's Liver (CHINA) 26-Jul-02 < 0.006 Pig's Liver (CHINA) 16-Oct-02 < 0.014 Pig's Liver (LOCAL FARM) 23-Jan-02 < 0.007 Pig's Liver (LOCAL FARM) 08-Apr-02 < 0.007 Pig's Liver (LOCAL FARM) 26-Jul-02 < 0.006 Pig's Liver (LOCAL FARM) 16-Oct-02 0.011 ± 0.006 Pork (CHINA) 23-Jan-02 < 0.005 Pork (CHINA) 08-Apr-02 < 0.006 Pork (CHINA) 26-Jul-02 < 0.006 Pork (CHINA) 16-Oct-02 < 0.012 Pork (LOCAL FARM) 23-Jan-02 < 0.005 Pork (LOCAL FARM) 08-Apr-02 < 0.006 Pork (LOCAL FARM) 26-Jul-02 < 0.005 Pork (LOCAL FARM) 16-Oct-02 < 0.013

- 116 -
Table 54 Specific activity of strontium-90 in suspended particulate in sea water samples
Sample Typeand Sampling Location
SamplingDate
Specific Activity of
Sr-90 in Bq L-1
Suspended particulate in sea water(Upper level):
WAGLAN ISLAND 10-Jun-02
< 0.002 BASALT ISLAND 10-Jun-02
< 0.003 TAI LONG WAN 10-Jun-02
< 0.002 PORT ISLAND 10-Jun-02
< 0.004 Suspended particulate in sea water
(Middle level):
WAGLAN ISLAND 10-Jun-02
< 0.002 BASALT ISLAND 10-Jun-02
< 0.002 TAI LONG WAN 10-Jun-02
< 0.002 PORT ISLAND 10-Jun-02
< 0.004 Suspended particulate in sea water
(Lower level):
WAGLAN ISLAND 10-Jun-02
< 0.002 BASALT ISLAND 10-Jun-02
< 0.002 TAI LONG WAN 10-Jun-02
< 0.003 PORT ISLAND 10-Jun-02
< 0.002
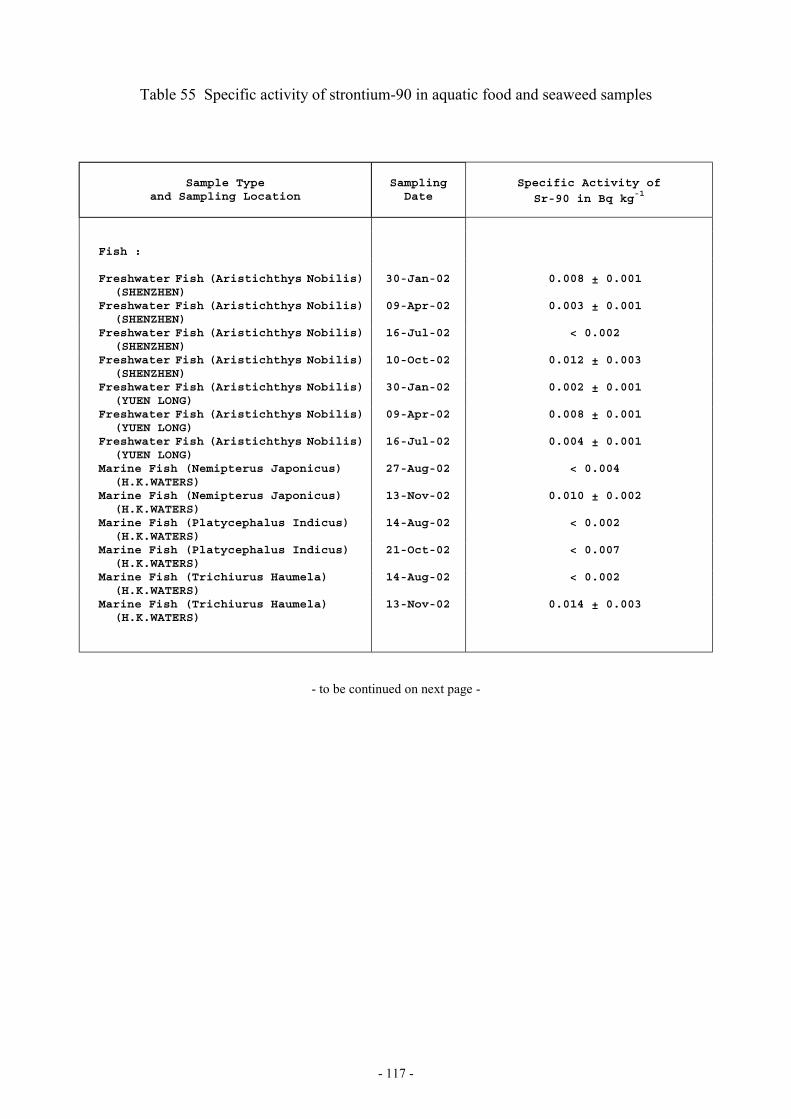
- 117 -
Table 55 Specific activity of strontium-90 in aquatic food and seaweed samples
Sample Typeand Sampling Location
SamplingDate
Specific Activity of
Sr-90 in Bq kg-1
Fish : Freshwater Fish (Aristichthys Nobilis)
(SHENZHEN) 30-Jan-02 0.008 ± 0.001
Freshwater Fish (Aristichthys Nobilis)(SHENZHEN)
09-Apr-02 0.003 ± 0.001
Freshwater Fish (Aristichthys Nobilis)(SHENZHEN)
16-Jul-02 < 0.002
Freshwater Fish (Aristichthys Nobilis)(SHENZHEN)
10-Oct-02 0.012 ± 0.003
Freshwater Fish (Aristichthys Nobilis)(YUEN LONG)
30-Jan-02 0.002 ± 0.001
Freshwater Fish (Aristichthys Nobilis)(YUEN LONG)
09-Apr-02 0.008 ± 0.001
Freshwater Fish (Aristichthys Nobilis)(YUEN LONG)
16-Jul-02 0.004 ± 0.001
Marine Fish (Nemipterus Japonicus)(H.K.WATERS)
27-Aug-02 < 0.004
Marine Fish (Nemipterus Japonicus)(H.K.WATERS)
13-Nov-02 0.010 ± 0.002
Marine Fish (Platycephalus Indicus)(H.K.WATERS)
14-Aug-02 < 0.002
Marine Fish (Platycephalus Indicus)(H.K.WATERS)
21-Oct-02 < 0.007
Marine Fish (Trichiurus Haumela)(H.K.WATERS)
14-Aug-02 < 0.002
Marine Fish (Trichiurus Haumela)(H.K.WATERS)
13-Nov-02 0.014 ± 0.003
- to be continued on next page -
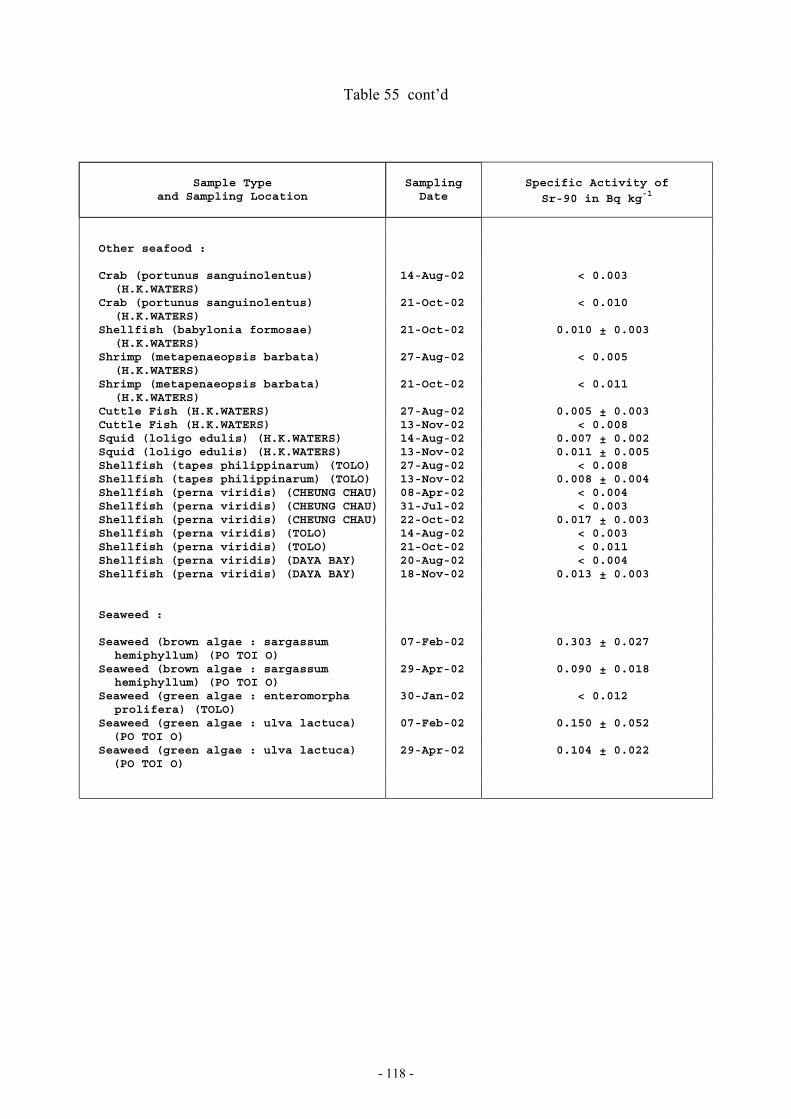
- 118 -
Table 55 cont’d
Sample Typeand Sampling Location
SamplingDate
Specific Activity of
Sr-90 in Bq kg-1
Other seafood : Crab (portunus sanguinolentus)
(H.K.WATERS) 14-Aug-02 < 0.003
Crab (portunus sanguinolentus)(H.K.WATERS)
21-Oct-02 < 0.010
Shellfish (babylonia formosae)(H.K.WATERS)
21-Oct-02 0.010 ± 0.003
Shrimp (metapenaeopsis barbata)(H.K.WATERS)
27-Aug-02 < 0.005
Shrimp (metapenaeopsis barbata)(H.K.WATERS)
21-Oct-02 < 0.011
Cuttle Fish (H.K.WATERS) 27-Aug-02 0.005 ± 0.003 Cuttle Fish (H.K.WATERS) 13-Nov-02 < 0.008 Squid (loligo edulis) (H.K.WATERS) 14-Aug-02 0.007 ± 0.002 Squid (loligo edulis) (H.K.WATERS) 13-Nov-02 0.011 ± 0.005 Shellfish (tapes philippinarum) (TOLO) 27-Aug-02 < 0.008 Shellfish (tapes philippinarum) (TOLO) 13-Nov-02 0.008 ± 0.004 Shellfish (perna viridis) (CHEUNG CHAU) 08-Apr-02 < 0.004 Shellfish (perna viridis) (CHEUNG CHAU) 31-Jul-02 < 0.003 Shellfish (perna viridis) (CHEUNG CHAU) 22-Oct-02 0.017 ± 0.003 Shellfish (perna viridis) (TOLO) 14-Aug-02 < 0.003 Shellfish (perna viridis) (TOLO) 21-Oct-02 < 0.011 Shellfish (perna viridis) (DAYA BAY) 20-Aug-02 < 0.004 Shellfish (perna viridis) (DAYA BAY) 18-Nov-02 0.013 ± 0.003 Seaweed : Seaweed (brown algae : sargassum
hemiphyllum) (PO TOI O) 07-Feb-02 0.303 ± 0.027
Seaweed (brown algae : sargassumhemiphyllum) (PO TOI O)
29-Apr-02 0.090 ± 0.018
Seaweed (green algae : enteromorphaprolifera) (TOLO)
30-Jan-02 < 0.012
Seaweed (green algae : ulva lactuca) (PO TOI O)
07-Feb-02 0.150 ± 0.052
Seaweed (green algae : ulva lactuca) (PO TOI O)
29-Apr-02 0.104 ± 0.022

- 119 -
Table 56 Specific activity of strontium-90 in land soil samples
Sample Typeand Sampling Location
SamplingDate
Specific Activity of
Sr-90 in Bq kg-1
Land soil (Upper layer) : TAP SHEK KOK POWER STATION 22-Feb-02 < 1 YUEN LONG R.G. FILTER 15-Mar-02 < 2 TSIM BEI TSUI 17-May-02 < 1 SHEK KONG AIRFIELD 14-Jun-02 < 1 CHEUNG CHAU METEOROLOGICAL STATION 20-Sep-02 < 2 LAMMA POLICE POST 15-Nov-02 < 1 PENG CHAU PUMPING STATION 26-Nov-02 < 2 Land soil (Lower layer) : TAP SHEK KOK POWER STATION 22-Feb-02 < 1 YUEN LONG R.G. FILTER 15-Mar-02 < 2 TSIM BEI TSUI 17-May-02 < 1 SHEK KONG AIRFIELD 14-Jun-02 < 1 KADOORIE FARM 23-Aug-02 < 1 CHEUNG CHAU METEOROLOGICAL STATION 20-Sep-02 < 2 LAMMA POLICE POST 15-Nov-02 < 1 PENG CHAU PUMPING STATION 26-Nov-02 < 2

- 120 -
Table 57 Specific activity of plutonium-239 in airborne particulate samples
Sampling Locationand Sampling period
Specific Activity of Pu-239 in µµµµBq m-3
King's Park : 02-Jan-02 to 02-Feb-02 < 0.08 02-Feb-02 to 01-Mar-02 < 0.02 01-Mar-02 to 02-Apr-02 < 0.08 02-Apr-02 to 02-May-02 < 0.05 02-May-02 to 01-Jun-02 < 0.13 01-Jun-02 to 02-Jul-02 < 0.09 02-Jul-02 to 30-Jul-02 < 0.02 30-Jul-02 to 02-Sep-02 < 0.08 02-Sep-02 to 02-Oct-02 < 0.09 02-Oct-02 to 31-Oct-02 < 0.06 31-Oct-02 to 02-Dec-02 < 0.09 02-Dec-02 to 31-Dec-02 < 0.02 Sha Tau Kok : 02-Jan-02 to 28-Jan-02 < 0.08 28-Jan-02 to 05-Feb-02 *** 05-Feb-02 to 25-Feb-02 < 0.07 25-Feb-02 to 03-Apr-02 < 0.07 03-Apr-02 to 29-Apr-02 < 0.14 29-Apr-02 to 30-May-02 < 0.02 30-May-02 to 02-Jul-02 < 0.06 02-Jul-02 to 05-Jul-02 *** 05-Jul-02 to 31-Jul-02 < 0.15 31-Jul-02 to 02-Sep-02 < 0.06 02-Sep-02 to 02-Oct-02 < 0.16 02-Oct-02 to 31-Oct-02 < 0.06 31-Oct-02 to 19-Dec-02 ### 19-Dec-02 to 02-Jan-03 ### Yuen Ng Fan : 02-Jan-02 to 28-Jan-02 < 0.09 28-Jan-02 to 25-Feb-02 < 0.09 25-Feb-02 to 03-Apr-02 < 0.10 03-Apr-02 to 29-Apr-02 < 0.10 29-Apr-02 to 30-May-02 < 0.05 30-May-02 to 02-Jul-02 < 0.05 02-Jul-02 to 31-Jul-02 < 0.11 31-Jul-02 to 02-Sep-02 < 0.06 02-Sep-02 to 02-Oct-02 < 0.07 02-Oct-02 to 30-Oct-02 < 0.08 30-Oct-02 to 27-Nov-02 < 0.02 27-Nov-02 to 02-Jan-03 < 0.05
*** sampler under maintenance
### sampling location under civil work
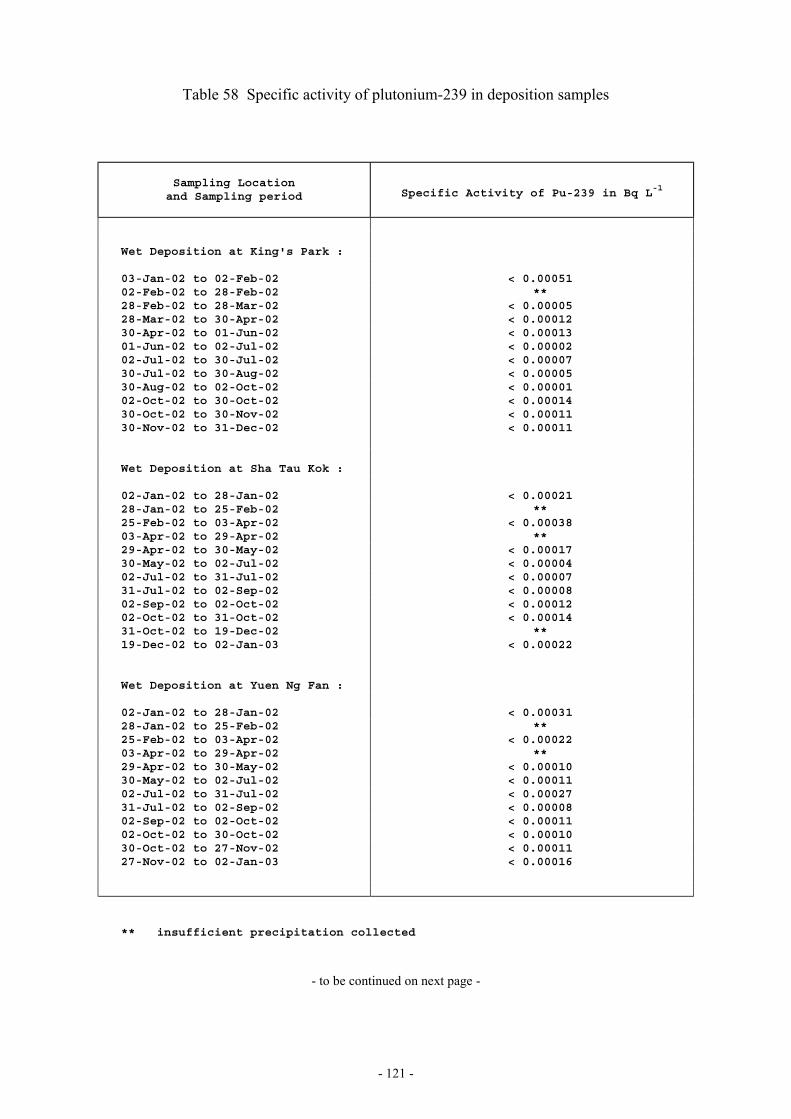
- 121 -
Table 58 Specific activity of plutonium-239 in deposition samples
Sampling Locationand Sampling period Specific Activity of Pu-239 in Bq L-1
Wet Deposition at King's Park : 03-Jan-02 to 02-Feb-02 < 0.00051 02-Feb-02 to 28-Feb-02 ** 28-Feb-02 to 28-Mar-02 < 0.00005 28-Mar-02 to 30-Apr-02 < 0.00012 30-Apr-02 to 01-Jun-02 < 0.00013 01-Jun-02 to 02-Jul-02 < 0.00002 02-Jul-02 to 30-Jul-02 < 0.00007 30-Jul-02 to 30-Aug-02 < 0.00005 30-Aug-02 to 02-Oct-02 < 0.00001 02-Oct-02 to 30-Oct-02 < 0.00014 30-Oct-02 to 30-Nov-02 < 0.00011 30-Nov-02 to 31-Dec-02 < 0.00011 Wet Deposition at Sha Tau Kok : 02-Jan-02 to 28-Jan-02 < 0.00021 28-Jan-02 to 25-Feb-02 ** 25-Feb-02 to 03-Apr-02 < 0.00038 03-Apr-02 to 29-Apr-02 ** 29-Apr-02 to 30-May-02 < 0.00017 30-May-02 to 02-Jul-02 < 0.00004 02-Jul-02 to 31-Jul-02 < 0.00007 31-Jul-02 to 02-Sep-02 < 0.00008 02-Sep-02 to 02-Oct-02 < 0.00012 02-Oct-02 to 31-Oct-02 < 0.00014 31-Oct-02 to 19-Dec-02 ** 19-Dec-02 to 02-Jan-03 < 0.00022 Wet Deposition at Yuen Ng Fan : 02-Jan-02 to 28-Jan-02 < 0.00031 28-Jan-02 to 25-Feb-02 ** 25-Feb-02 to 03-Apr-02 < 0.00022 03-Apr-02 to 29-Apr-02 ** 29-Apr-02 to 30-May-02 < 0.00010 30-May-02 to 02-Jul-02 < 0.00011 02-Jul-02 to 31-Jul-02 < 0.00027 31-Jul-02 to 02-Sep-02 < 0.00008 02-Sep-02 to 02-Oct-02 < 0.00011 02-Oct-02 to 30-Oct-02 < 0.00010 30-Oct-02 to 27-Nov-02 < 0.00011 27-Nov-02 to 02-Jan-03 < 0.00016
** insufficient precipitation collected
- to be continued on next page -

- 122 -
Table 58 cont’d
Sample Locationand Sampling Period
Rainfallamount(mm)*
Specific Activity of
Pu-239 in Bq m-2
Total Deposition at King's Park :
03-Jan-02 to 02-Feb-02 19.6 < 0.00402-Feb-02 to 28-Feb-02 7.4 < 0.01228-Feb-02 to 28-Mar-02 133.2 < 0.03328-Mar-02 to 30-Apr-02 15.0 < 0.02730-Apr-02 to 01-Jun-02 315.1 < 0.01001-Jun-02 to 02-Jul-02 249.0 < 0.00602-Jul-02 to 30-Jul-02 357.6 < 0.00530-Jul-02 to 30-Aug-02 364.2 < 0.02830-Aug-02 to 02-Oct-02 530.1 < 0.02302-Oct-02 to 31-Oct-02 169.7 < 0.02031-Oct-02 to 30-Nov-02 20.4 < 0.02930-Nov-02 to 31-Dec-02 73.6 < 0.011
* 24-hour rainfall is recorded daily at 3 p.m. Hong Kong Time
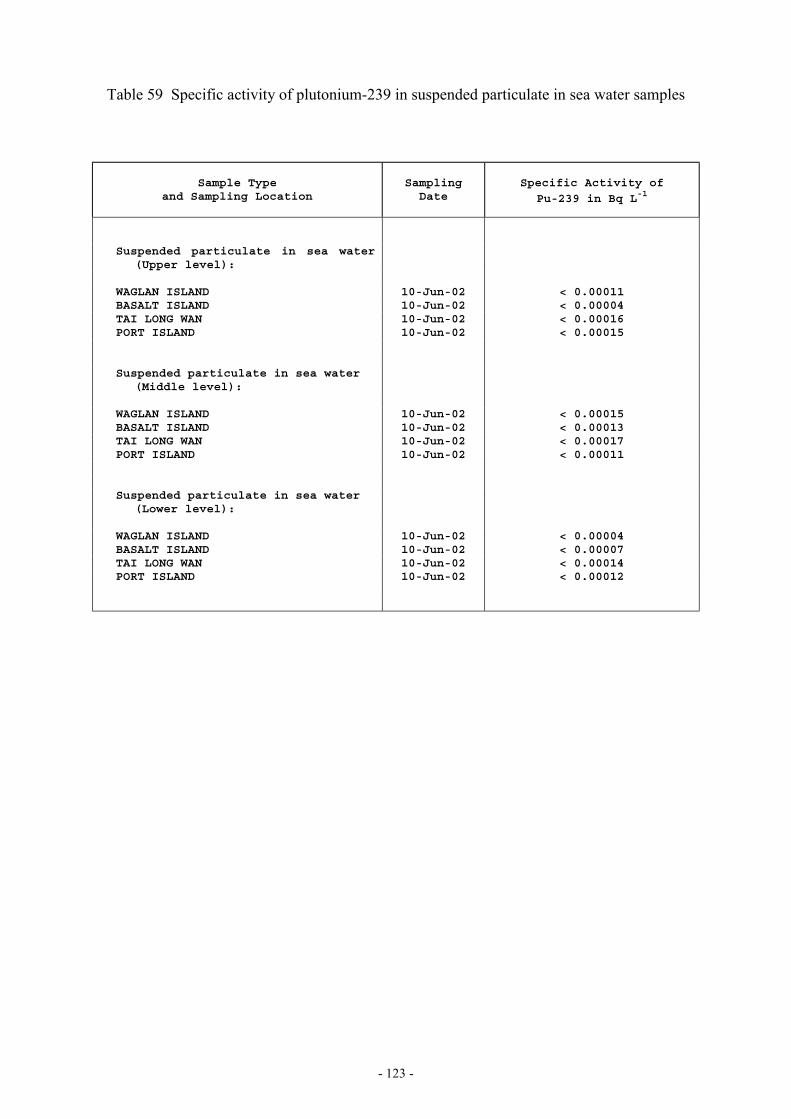
- 123 -
Table 59 Specific activity of plutonium-239 in suspended particulate in sea water samples
Sample Typeand Sampling Location
SamplingDate
Specific Activity of
Pu-239 in Bq L-1
Suspended particulate in sea water(Upper level):
WAGLAN ISLAND 10-Jun-02
< 0.00011 BASALT ISLAND 10-Jun-02
< 0.00004 TAI LONG WAN 10-Jun-02
< 0.00016 PORT ISLAND 10-Jun-02
< 0.00015 Suspended particulate in sea water
(Middle level):
WAGLAN ISLAND 10-Jun-02
< 0.00015 BASALT ISLAND 10-Jun-02
< 0.00013 TAI LONG WAN 10-Jun-02
< 0.00017 PORT ISLAND 10-Jun-02
< 0.00011 Suspended particulate in sea water
(Lower level):
WAGLAN ISLAND 10-Jun-02
< 0.00004 BASALT ISLAND 10-Jun-02
< 0.00007 TAI LONG WAN 10-Jun-02
< 0.00014 PORT ISLAND 10-Jun-02
< 0.00012
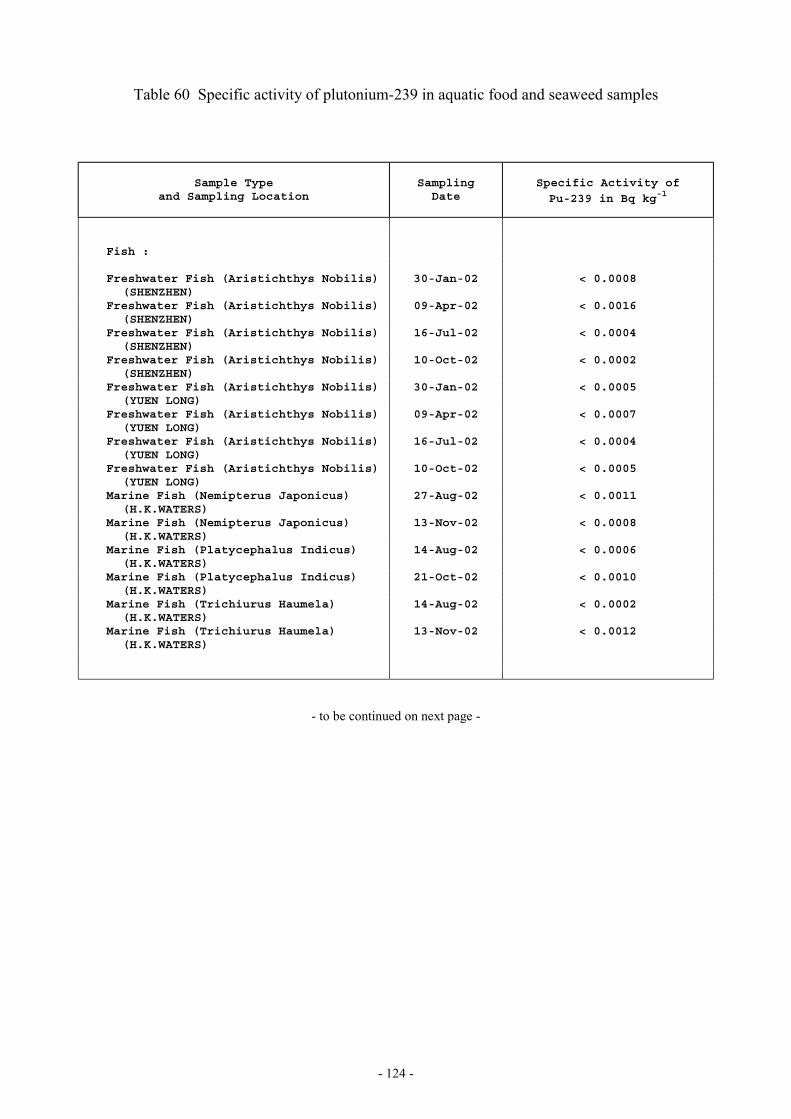
- 124 -
Table 60 Specific activity of plutonium-239 in aquatic food and seaweed samples
Sample Typeand Sampling Location
SamplingDate
Specific Activity of
Pu-239 in Bq kg-1
Fish : Freshwater Fish (Aristichthys Nobilis)
(SHENZHEN) 30-Jan-02 < 0.0008
Freshwater Fish (Aristichthys Nobilis)(SHENZHEN)
09-Apr-02 < 0.0016
Freshwater Fish (Aristichthys Nobilis)(SHENZHEN)
16-Jul-02 < 0.0004
Freshwater Fish (Aristichthys Nobilis)(SHENZHEN)
10-Oct-02 < 0.0002
Freshwater Fish (Aristichthys Nobilis)(YUEN LONG)
30-Jan-02 < 0.0005
Freshwater Fish (Aristichthys Nobilis)(YUEN LONG)
09-Apr-02 < 0.0007
Freshwater Fish (Aristichthys Nobilis)(YUEN LONG)
16-Jul-02 < 0.0004
Freshwater Fish (Aristichthys Nobilis)(YUEN LONG)
10-Oct-02 < 0.0005
Marine Fish (Nemipterus Japonicus)(H.K.WATERS)
27-Aug-02 < 0.0011
Marine Fish (Nemipterus Japonicus)(H.K.WATERS)
13-Nov-02 < 0.0008
Marine Fish (Platycephalus Indicus)(H.K.WATERS)
14-Aug-02 < 0.0006
Marine Fish (Platycephalus Indicus)(H.K.WATERS)
21-Oct-02 < 0.0010
Marine Fish (Trichiurus Haumela)(H.K.WATERS)
14-Aug-02 < 0.0002
Marine Fish (Trichiurus Haumela)(H.K.WATERS)
13-Nov-02 < 0.0012
- to be continued on next page -

- 125 -
Table 60 cont’d
Sample Typeand Sampling Location
SamplingDate
Specific Activity of
Pu-239 in Bq kg-1
Other seafood : Crab (portunus sanguinolentus)
(H.K.WATERS) 14-Aug-02 < 0.0013
Crab (portunus sanguinolentus)(H.K.WATERS)
21-Oct-02 < 0.0017
Shellfish (babylonia formosae)(H.K.WATERS)
21-Oct-02 < 0.0007
Shrimp (metapenaeopsis barbata)(H.K.WATERS)
27-Aug-02 < 0.0016
Shrimp (metapenaeopsis barbata)(H.K.WATERS)
21-Oct-02 < 0.0019
Cuttle Fish (H.K.WATERS) 27-Aug-02 < 0.0013 Cuttle Fish (H.K.WATERS) 13-Nov-02 < 0.0005 Squid (loligo edulis) (H.K.WATERS) 14-Aug-02 < 0.0003 Squid (loligo edulis) (H.K.WATERS) 13-Nov-02 < 0.0012 Shellfish (tapes philippinarum) (TOLO) 27-Aug-02 < 0.0016 Shellfish (tapes philippinarum) (TOLO) 13-Nov-02 < 0.0012 Shellfish (perna viridis) (CHEUNG CHAU) 08-Apr-02 < 0.0024 Shellfish (perna viridis) (CHEUNG CHAU) 31-Jul-02 < 0.0015 Shellfish (perna viridis) (CHEUNG CHAU) 22-Oct-02 < 0.0073 Shellfish (perna viridis) (TOLO) 14-Aug-02 < 0.0014 Shellfish (perna viridis) (TOLO) 21-Oct-02 < 0.0026 Shellfish (perna viridis) (DAYA BAY) 20-Aug-02 < 0.0010 Shellfish (perna viridis) (DAYA BAY) 18-Nov-02 < 0.0031
Seaweed : Seaweed (brown algae : sargassum
hemiphyllum) (PO TOI O) 07-Feb-02 0.031 ± 0.015
Seaweed (brown algae : sargassumhemiphyllum) (PO TOI O)
29-Apr-02 0.033 ± 0.012
Seaweed (green algae : enteromorphaprolifera) (TOLO)
30-Jan-02 < 0.002
Seaweed (green algae : ulva lactuca)(PO TOI O)
07-Feb-02 < 0.055
Seaweed (green algae : ulva lactuca)(PO TOI O)
29-Apr-02 0.014 ± 0.011
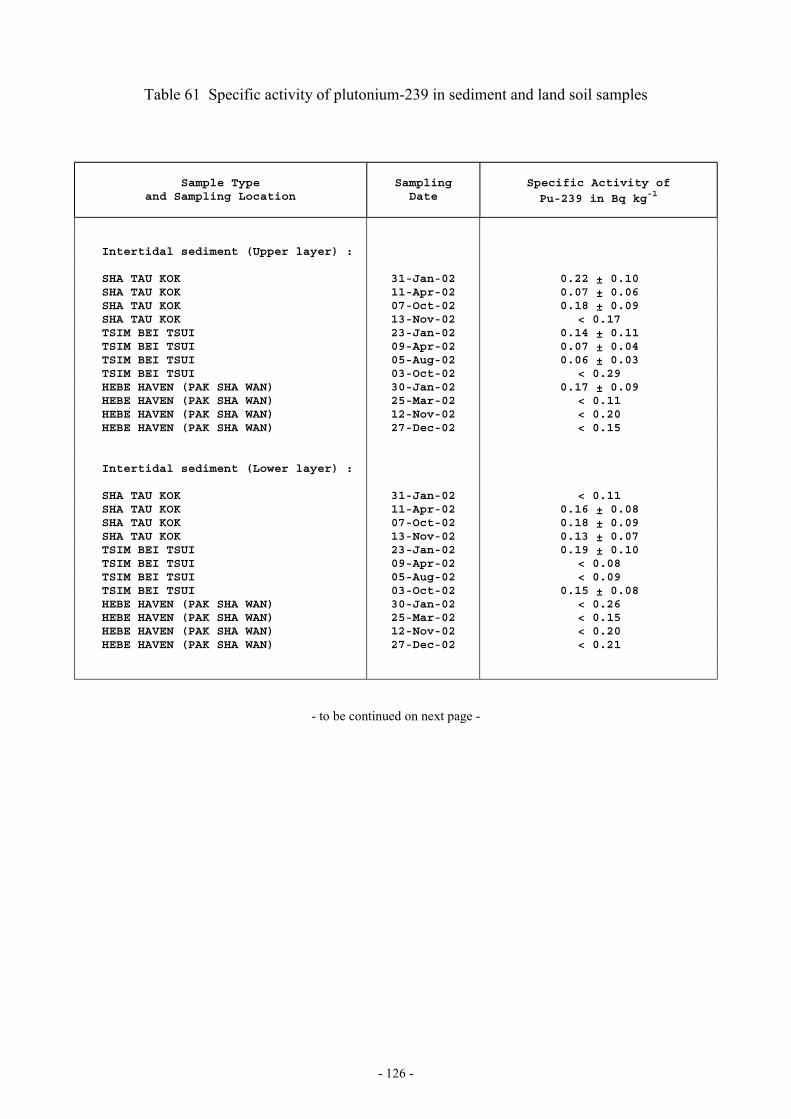
- 126 -
Table 61 Specific activity of plutonium-239 in sediment and land soil samples
Sample Typeand Sampling Location
SamplingDate
Specific Activity of
Pu-239 in Bq kg-1
Intertidal sediment (Upper layer) : SHA TAU KOK 31-Jan-02 0.22 ± 0.10 SHA TAU KOK 11-Apr-02 0.07 ± 0.06 SHA TAU KOK 07-Oct-02 0.18 ± 0.09 SHA TAU KOK 13-Nov-02 < 0.17 TSIM BEI TSUI 23-Jan-02 0.14 ± 0.11 TSIM BEI TSUI 09-Apr-02 0.07 ± 0.04 TSIM BEI TSUI 05-Aug-02 0.06 ± 0.03 TSIM BEI TSUI 03-Oct-02 < 0.29 HEBE HAVEN (PAK SHA WAN) 30-Jan-02 0.17 ± 0.09 HEBE HAVEN (PAK SHA WAN) 25-Mar-02 < 0.11 HEBE HAVEN (PAK SHA WAN) 12-Nov-02 < 0.20 HEBE HAVEN (PAK SHA WAN) 27-Dec-02 < 0.15 Intertidal sediment (Lower layer) : SHA TAU KOK 31-Jan-02 < 0.11 SHA TAU KOK 11-Apr-02 0.16 ± 0.08 SHA TAU KOK 07-Oct-02 0.18 ± 0.09 SHA TAU KOK 13-Nov-02 0.13 ± 0.07 TSIM BEI TSUI 23-Jan-02 0.19 ± 0.10 TSIM BEI TSUI 09-Apr-02 < 0.08 TSIM BEI TSUI 05-Aug-02 < 0.09 TSIM BEI TSUI 03-Oct-02 0.15 ± 0.08 HEBE HAVEN (PAK SHA WAN) 30-Jan-02 < 0.26 HEBE HAVEN (PAK SHA WAN) 25-Mar-02 < 0.15 HEBE HAVEN (PAK SHA WAN) 12-Nov-02 < 0.20 HEBE HAVEN (PAK SHA WAN) 27-Dec-02 < 0.21
- to be continued on next page -

- 127 -
Table 61 cont’d
Sample Typeand Sampling Location
SamplingDate
Specific Activity of
Pu-239 in Bq kg-1
Seabed sediment :
TAI TAN HOI HAP 23-Apr-02 0.57 ± 0.15LUNG HA WAN 23-Apr-02 0.66 ± 0.18PICNIC BAY 24-Apr-02 0.50 ± 0.15WESTERN ANCHORAGE 24-Apr-02 < 0.55
Land soil (Upper layer) :
TAP SHEK KOK POWER STATION 22-Feb-02 < 0.09YUEN LONG R.G. FILTER 15-Mar-02 < 0.22TSIM BEI TSUI 17-May-02 < 0.16SHEK KONG AIRFIELD 14-Jun-02 < 0.18KADOORIE FARM 23-Aug-02 0.16 ± 0.08CHEUNG CHAU METEOROLOGICAL STATION 20-Sep-02 < 0.13LAMMA POLICE POST 15-Nov-02 < 0.15PENG CHAU PUMPING STATION 26-Nov-02 < 0.25
Land soil (Lower layer) :
TAP SHEK KOK POWER STATION 22-Feb-02 < 0.16YUEN LONG R.G. FILTER 15-Mar-02 < 0.16TSIM BEI TSUI 17-May-02 < 0.11SHEK KONG AIRFIELD 14-Jun-02 < 0.15KADOORIE FARM 23-Aug-02 < 0.22CHEUNG CHAU METEOROLOGICAL STATION 20-Sep-02 < 0.12LAMMA POLICE POST 15-Nov-02 < 0.21PENG CHAU PUMPING STATION 26-Nov-02 < 0.20

- 128 -
Table 62 Specific activity of carbon-14 in airborne particulate, airbornecarbon dioxide, terrestrial food and aquatic food
Sample Type
and Sampling Location
Sampling Date Specific Activity of
C-14 in Bq kg-1 carbon
Airborne Particulate :
KING’S PARK 02-Jan-02 to 02-Feb-02 242 ± 202-Feb-02 to 01-Mar-0201-Mar-02 to 02-Apr-0202-Apr-02 to 02-May-0202-May-02 to 01-Jun-0201-Jun-02 to 02-Jul-0202-Jul-02 to 30-Jul-02
Carbon dioxide in air :
KING’S PARK 16-Jan-02 to 23-Jan-02 242 ± 219-Feb-02 to 25-Feb-0208-Mar-02 to 15-Mar-0222-Apr-02 to 29-Apr-0222-May-02 to 30-May-0224-Jun-02 to 30-Jun-0224-Jul-02 to 01-Aug-0214-Aug-02 to 21-Aug-0218-Sep-02 to 24-Sep-02
Terrestrial food :
Chicken (LOCAL FARM) 10-Jan-02 247 ± 313-Mar-0218-Jun-0210-Sep-02
Pork (LOCAL FARM) 23-Jan-02 252 ± 328-Apr-0226-Jul-02
Banana (CHINA) 23-Jan-02 237 ± 228-Mar-0216-Jul-02
Rice (CHINA) 23-Jan-02 242 ± 311-Apr-0231-Jul-02
Flowering Cabbage 31-Jan-02 238 ± 2(SHENZHEN) 11-Apr-02
25-Jul-02
Milk (Pasteurized) 31-Jan-02 246 ± 3(SHENZHEN) 11-Apr-02
31-Jul-02
- to be continued on next page -
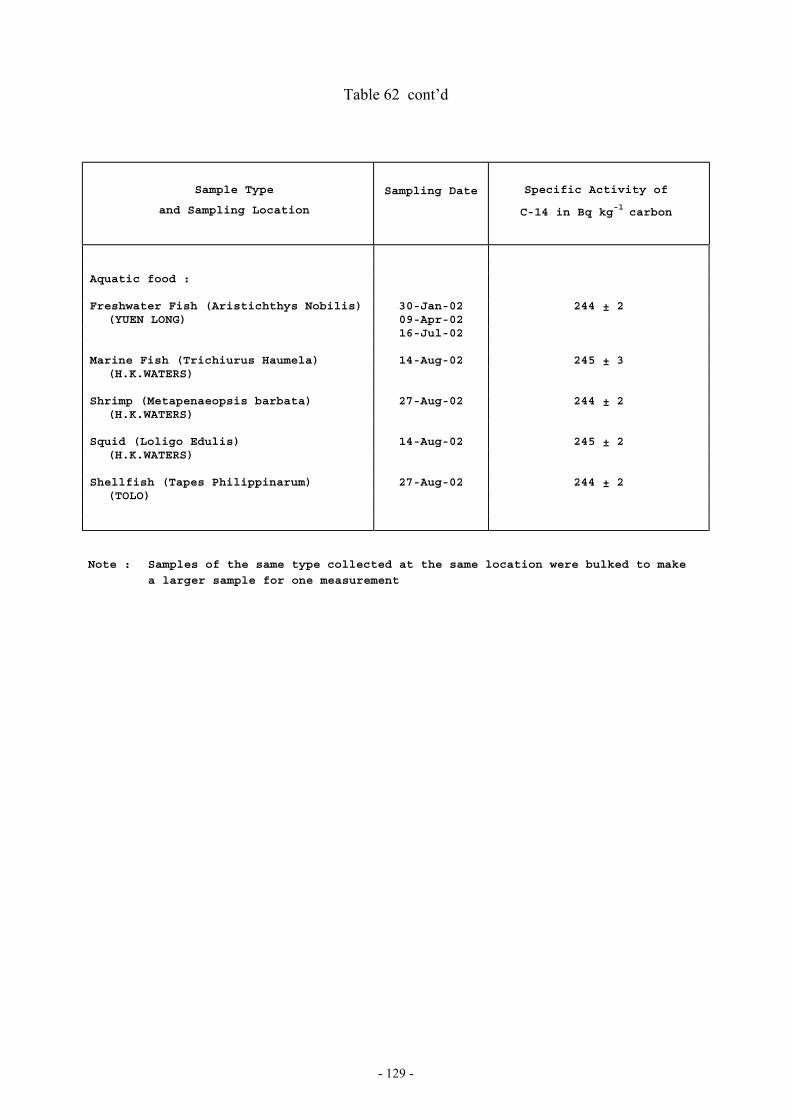
- 129 -
Table 62 cont’d
Sample Type
and Sampling Location
Sampling Date Specific Activity of
C-14 in Bq kg-1 carbon
Aquatic food :
Freshwater Fish (Aristichthys Nobilis) 30-Jan-02 244 ± 2(YUEN LONG) 09-Apr-02
16-Jul-02
Marine Fish (Trichiurus Haumela) 14-Aug-02 245 ± 3(H.K.WATERS)
Shrimp (Metapenaeopsis barbata) 27-Aug-02 244 ± 2(H.K.WATERS)
Squid (Loligo Edulis) 14-Aug-02 245 ± 2(H.K.WATERS)
Shellfish (Tapes Philippinarum) 27-Aug-02 244 ± 2(TOLO)
Note : Samples of the same type collected at the same location were bulked to make
a larger sample for one measurement
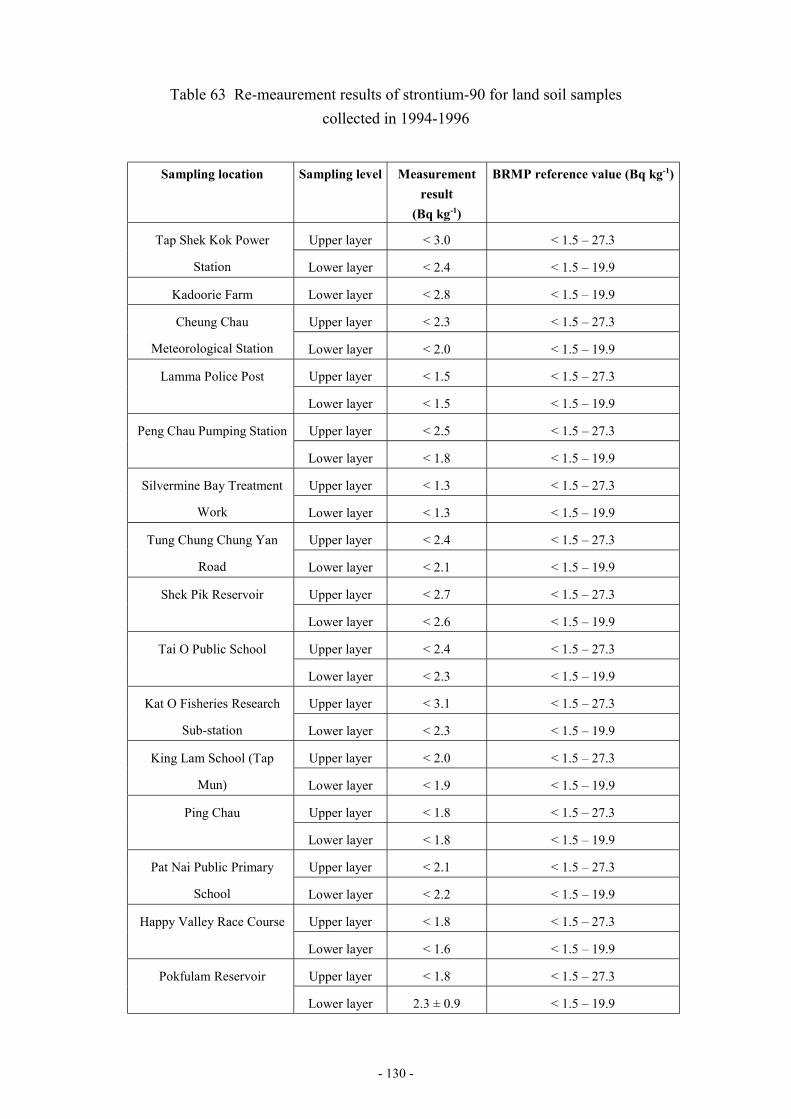
- 130 -
Table 63 Re-meaurement results of strontium-90 for land soil samplescollected in 1994-1996
Sampling location Sampling level Measurementresult
(Bq kg-1)
BRMP reference value (Bq kg-1)
Upper layer < 3.0 < 1.5 – 27.3Tap Shek Kok Power
Station Lower layer < 2.4 < 1.5 – 19.9
Kadoorie Farm Lower layer < 2.8 < 1.5 – 19.9
Upper layer < 2.3 < 1.5 – 27.3Cheung Chau
Meteorological Station Lower layer < 2.0 < 1.5 – 19.9
Upper layer < 1.5 < 1.5 – 27.3Lamma Police Post
Lower layer < 1.5 < 1.5 – 19.9
Upper layer < 2.5 < 1.5 – 27.3Peng Chau Pumping Station
Lower layer < 1.8 < 1.5 – 19.9
Upper layer < 1.3 < 1.5 – 27.3Silvermine Bay Treatment
Work Lower layer < 1.3 < 1.5 – 19.9
Upper layer < 2.4 < 1.5 – 27.3Tung Chung Chung Yan
Road Lower layer < 2.1 < 1.5 – 19.9
Upper layer < 2.7 < 1.5 – 27.3Shek Pik Reservoir
Lower layer < 2.6 < 1.5 – 19.9
Upper layer < 2.4 < 1.5 – 27.3Tai O Public School
Lower layer < 2.3 < 1.5 – 19.9
Upper layer < 3.1 < 1.5 – 27.3Kat O Fisheries Research
Sub-station Lower layer < 2.3 < 1.5 – 19.9
Upper layer < 2.0 < 1.5 – 27.3King Lam School (Tap
Mun) Lower layer < 1.9 < 1.5 – 19.9
Upper layer < 1.8 < 1.5 – 27.3Ping Chau
Lower layer < 1.8 < 1.5 – 19.9
Upper layer < 2.1 < 1.5 – 27.3Pat Nai Public Primary
School Lower layer < 2.2 < 1.5 – 19.9
Upper layer < 1.8 < 1.5 – 27.3Happy Valley Race Course
Lower layer < 1.6 < 1.5 – 19.9
Upper layer < 1.8 < 1.5 – 27.3Pokfulam Reservoir
Lower layer 2.3 ± 0.9 < 1.5 – 19.9

Table 64 Comparison of specific activity of carbon-14 in 2002 samples with those in previous years and theBackground Radiation Monitoring Programme (1987-1991)
Sample nameLocation 2002
(Bq kg-1 C)2001
(Bq kg-1 C)2000
(Bq kg-1 C)1999
(Bq kg-1 C)1998
(Bq kg-1 C)1997
(Bq kg-1 C)1996
(Bq kg-1 C)1995
(Bq kg-1 C)1994
(Bq kg-1 C)1993
(Bq kg-1 C)1992
(Bq kg-1 C)Range in BRMP
Airborne particulate King’s Park 242 ± 2 272 ± 2 266 ± 4 269 ± 4 269 ± 3 277 ± 2 267 ± 3 271 ± 2 273 ± 4 - - 275 to 298Carbon Dioxide in air King’s Park 242 ± 2 247 ± 2 245 ± 4 243 ± 3 255 ± 3 238 ± 2 252 ± 3 259 ± 3 250 ± 3 249 ± 6 - 184 to 297Beef China - - - - - - - - - 262 ± 4 - 256 to 288Pork China - - - - - - - - 254 ± 2 - - 261 to 275
Local 252 ± 3 246 ± 2 251 ± 4 257 ± 4 257 ± 3 254 ± 2 - - - 263 ± 4 - 255 to 273Pig’s liver China - - - - - - 252 ± 3 - - - - 259 to 381Chicken China - - - - - - - - - 261 ± 4 - 255 to 278
Local 247 ± 3 247 ± 2 250 ± 4 253 ± 4 257 ± 3 255 ± 2 - - 255 ± 2 258 ± 4 - 261 to 272Duck China - - - - - - - 267 ± 2 - - - 269 to 281Rice China 242 ± 3 244 ± 2 243 ± 4 249 ± 4 254 ± 3 256 ± 2 254 ± 3 255 ± 2 254 ± 2 259 ± 5 - 259 to 264Pasteurized milk Shenzhen 246 ± 3 244 ± 2 248 ± 4 254 ± 4 253 ± 3 250 ± 2 - - 260 ± 2 - - 278
Sha Tau Kok - - - - - - - 256 ± 2 - - - 274 to 291Fanling - - - - - - 258 ± 3 - - 259 ± 4 - -
Flowering cabbage Shenzhen 238 ± 2 245 ± 2 245 ± 4 243 ± 4 257 ± 3 247 ± 2 - 253 ± 2 - 254 ± 4 - 223 to 270White cabbage Shenzhen - - - - - - - - 257 ± 2 - - 238 to 267
Local - - - - - - 245 ± 3 - - - - 223 to 259Banana China 237 ± 2 237 ± 2 237 ± 3 241 ± 3 250 ± 3 256 ± 2 - 256 ± 2 254 ± 2 - - 259 to 283Lychee China - - - - - - 249 ± 2 - - - - 261 to 280Aristichthys nobilis Shenzhen - - - - - - 251 ± 2 - 245 ± 2 - - 263 to 268
Yuen Long 244 ± 2 243 ± 2 243 ± 4 239 ± 4 254 ± 3 251 ± 2 - 245 ± 2 - 257 ± 4 - 265 to 273Nemipterus japonicus H.K. West - - - - - - 251 ± 2 - - - - 227 to 261Trichiurus haumela H.K. Waters 245 ± 3 246 ± 2 244 ± 4 252 ± 4 255 ± 3 246 ± 2 - - - - - 252
H.K. West - - - - - - - 257 ± 2 - - - 248 to 263Portunus sanguinolentus H.K. West - - - - - - - - - 255 ± 4 - 225 to 256Metapenaeopsis barbata Daya Bay - - - - - - - - - - - 223 to 263
DayaBay East - - - - - - - - - - - 233 to 267H.K. Waters 244 ± 2 243 ± 2 246 ± 4 249 ± 4 252 ± 3 255 ± 2 - - - - - 259 to 260H.K. West - - - - - - 247 ± 2 - - - - 221 to 279
Loligo edulis H.K. Waters 245 ± 2 244 ± 2 244 ± 4 252 ± 4 253 ± 3 244 ± 2 - - - - - 231 to 257H.K. West - - - - - - - 253 ± 2 - - - 226 to 296
Tapes philippinarum Tolo 244 ± 2 243 ± 2 246 ± 5 250 ± 5 251 ± 3 240 ± 2 - - - - - 256 to 267Perna viridis Cheung Chau - - - - - - - - 249 ± 2 - - 223 to 264
- 131 -

- 132 -
Table 65 Comparison of specific activity of measurable artificial radionuclides in samplescollected in 2002 and those collected in the Background Radiation
Monitoring Programme (1987 - 1991)
Radionuclide Sample Type(1) Unit Range of SpecificActivity in 2002
Range of SpecificActivity in BRMP (1987 - 91)(2)
Caesium-137
Rice Bq kg-1 0.1 ± 0.1 < 0.1 to 0.9
Land Soil (Upper Level) Bq kg-1 0.3 ± 0.4 to3.5 ± 1.0
< 2.0 to 10.0
Land Soil (Lower Level) Bq kg-1 1.2 ± 1.8 to2.3 ± 0.5
< 2.0 to 4.0
Fish Bq kg-1 0.1 ± 0.1 < 0.2 to 0.2
Intertidal sediment(upper level)
Bq kg-1 0.4 ± 0.4 to 1.2 ± 0.4
< 0.5 to 2.4
Intertidal sediment(lower level)
Bq kg-1 0.4 ± 0.5 to 1.2 ± 0.5
< 0.5 to 3.1
Seabed sediment Bq kg-1 0.5 ± 0.4 to 1.0 ± 0.4
< 0.5 to 1.9
Tritium Tritiated water vapour Bq m-3 11.2 ± 32.8 < 242 Wet Deposition Bq L-1 0.5 ± 5.8 to
3.5 ± 3.2 < 8.0 to 11.6
Total Deposition Bq m-2 84.0 ± 413.1 to 196.0 ± 88.7
---
Meat Bq kg-1 0.51 ± 2.68 to 5.49 ± 2.45
< 4.0 to 5.3
Poultry Bq kg-1 0.86 ± 0.64 to 1.89 ± 0.94
< 2.0 to 3.5
Leafy vegetables Bq kg-1 0.22 ± 2.08 < 6 Fruit Bq kg-1 1.42 ± 1.76 < 2 Milk (Pasteurized) Bq L-1 1.86 ± 3.23 to
3.24 ± 2.70 < 6
Rice Bq kg-1 0.02 ± 0.46 < 1
Drinking water Bq L-1 0.5 ± 3.1 to5.2 ± 3.2
< 6
Underground Water Bq L-1 0.1 ± 0.3 < 0.4 to 2.8
Sea water Bq L-1 0.5 ± 3.5 to2.8 ± 3.0
< 6
Fish Bq kg-1 0.4 ± 0.7 to1.3 ± 1.0
< 2
Other seafood Bq kg-1 0.3 ± 1.0 to2.7 ± 2.1
< 2.0 to 4.9
Seaweed Bq kg-1 0.2 ± 0.9 to0.7 ± 0.7
< 2
- to be continued on next page -
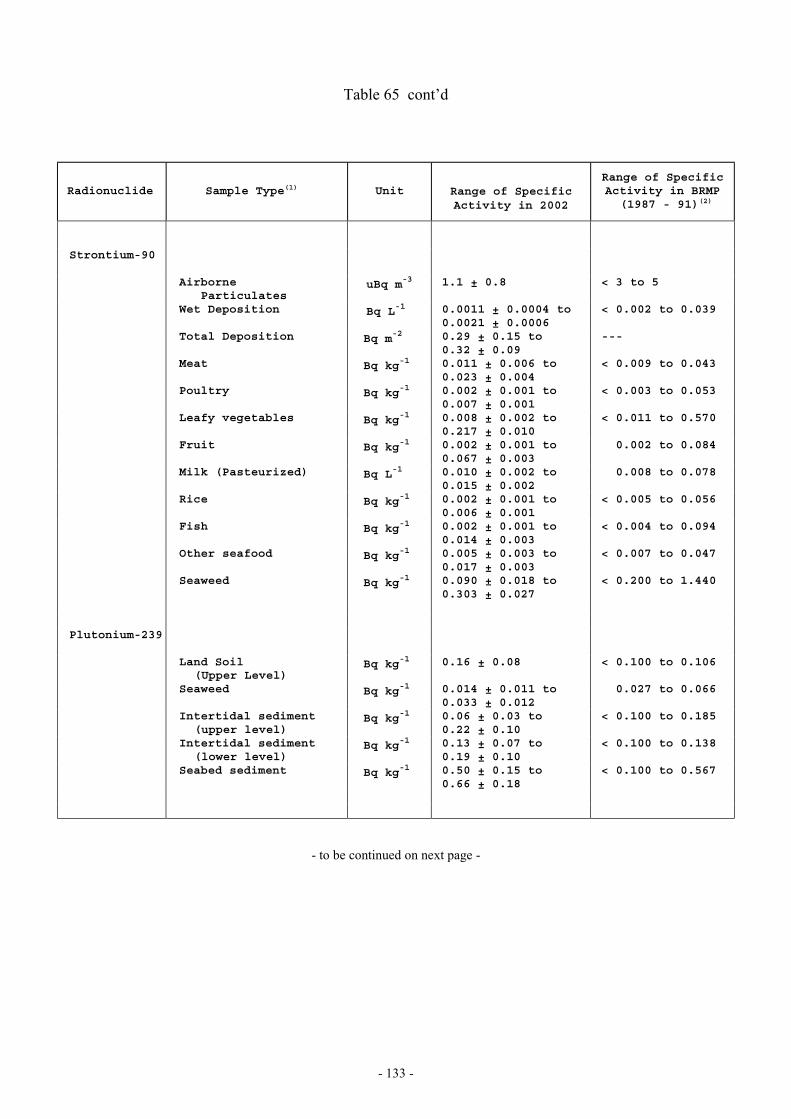
- 133 -
Table 65 cont’d
Radionuclide Sample Type(1) Unit Range of SpecificActivity in 2002
Range of SpecificActivity in BRMP (1987 - 91)(2)
Strontium-90
AirborneParticulates
uBq m-3 1.1 ± 0.8 < 3 to 5
Wet Deposition Bq L-1 0.0011 ± 0.0004 to0.0021 ± 0.0006
< 0.002 to 0.039
Total Deposition Bq m-2 0.29 ± 0.15 to0.32 ± 0.09
---
Meat Bq kg-1 0.011 ± 0.006 to0.023 ± 0.004
< 0.009 to 0.043
Poultry Bq kg-1 0.002 ± 0.001 to0.007 ± 0.001
< 0.003 to 0.053
Leafy vegetables Bq kg-1 0.008 ± 0.002 to0.217 ± 0.010
< 0.011 to 0.570
Fruit Bq kg-1 0.002 ± 0.001 to0.067 ± 0.003
0.002 to 0.084
Milk (Pasteurized) Bq L-1 0.010 ± 0.002 to0.015 ± 0.002
0.008 to 0.078
Rice Bq kg-1 0.002 ± 0.001 to0.006 ± 0.001
< 0.005 to 0.056
Fish Bq kg-1 0.002 ± 0.001 to0.014 ± 0.003
< 0.004 to 0.094
Other seafood Bq kg-1 0.005 ± 0.003 to0.017 ± 0.003
< 0.007 to 0.047
Seaweed Bq kg-1 0.090 ± 0.018 to0.303 ± 0.027
< 0.200 to 1.440
Plutonium-239
Land Soil(Upper Level)
Bq kg-1 0.16 ± 0.08 < 0.100 to 0.106
Seaweed Bq kg-1 0.014 ± 0.011 to0.033 ± 0.012
0.027 to 0.066
Intertidal sediment(upper level)
Bq kg-1 0.06 ± 0.03 to0.22 ± 0.10
< 0.100 to 0.185
Intertidal sediment(lower level)
Bq kg-1 0.13 ± 0.07 to0.19 ± 0.10
< 0.100 to 0.138
Seabed sediment Bq kg-1 0.50 ± 0.15 to0.66 ± 0.18
< 0.100 to 0.567
- to be continued on next page -
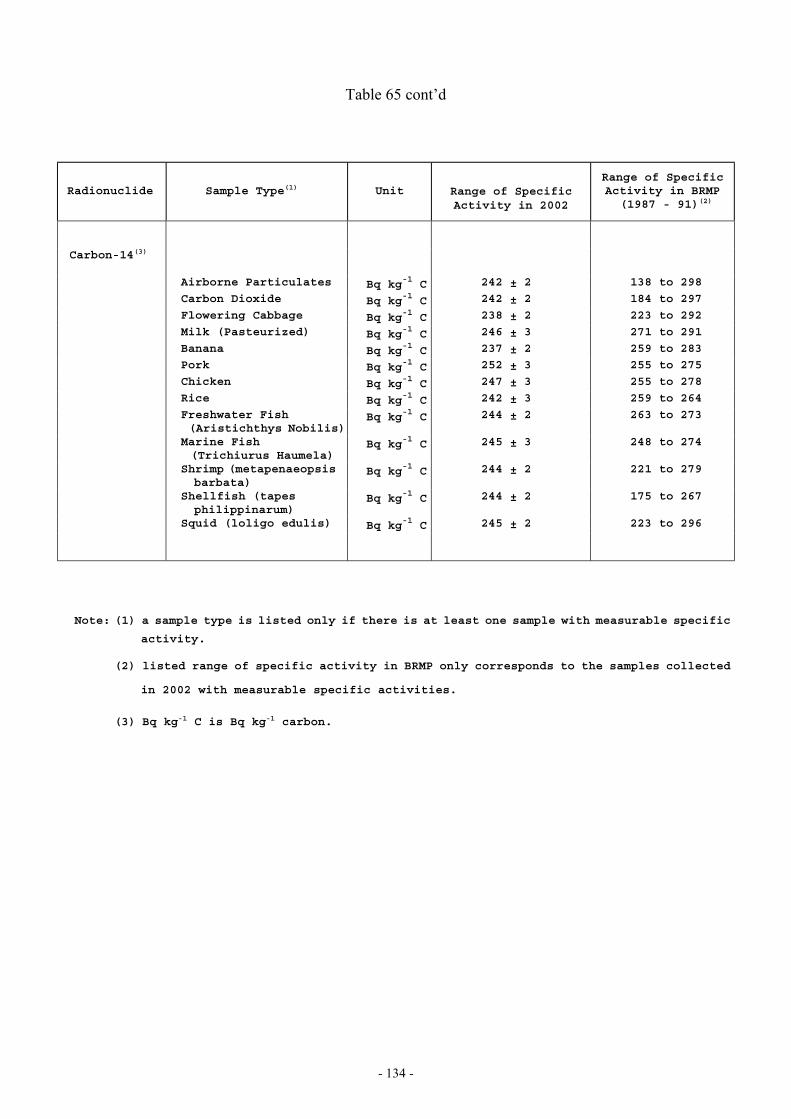
- 134 -
Table 65 cont’d
Radionuclide Sample Type(1) Unit Range of SpecificActivity in 2002
Range of SpecificActivity in BRMP (1987 - 91)(2)
Carbon-14(3)
Airborne Particulates Bq kg-1 C 242 ± 2 138 to 298
Carbon Dioxide Bq kg-1 C 242 ± 2 184 to 297
Flowering Cabbage Bq kg-1 C 238 ± 2 223 to 292
Milk (Pasteurized) Bq kg-1 C 246 ± 3 271 to 291
Banana Bq kg-1 C 237 ± 2 259 to 283
Pork Bq kg-1 C 252 ± 3 255 to 275
Chicken Bq kg-1 C 247 ± 3 255 to 278
Rice Bq kg-1 C 242 ± 3 259 to 264
Freshwater Fish(Aristichthys Nobilis)
Bq kg-1 C 244 ± 2 263 to 273
Marine Fish (Trichiurus Haumela)
Bq kg-1 C 245 ± 3 248 to 274
Shrimp (metapenaeopsisbarbata)
Bq kg-1 C 244 ± 2 221 to 279
Shellfish (tapesphilippinarum)
Bq kg-1 C 244 ± 2 175 to 267
Squid (loligo edulis) Bq kg-1 C 245 ± 2 223 to 296
Note: (1) a sample type is listed only if there is at least one sample with measurable specific
activity.
(2) listed range of specific activity in BRMP only corresponds to the samples collected
in 2002 with measurable specific activities.
(3) Bq kg-1 C is Bq kg-1 carbon.
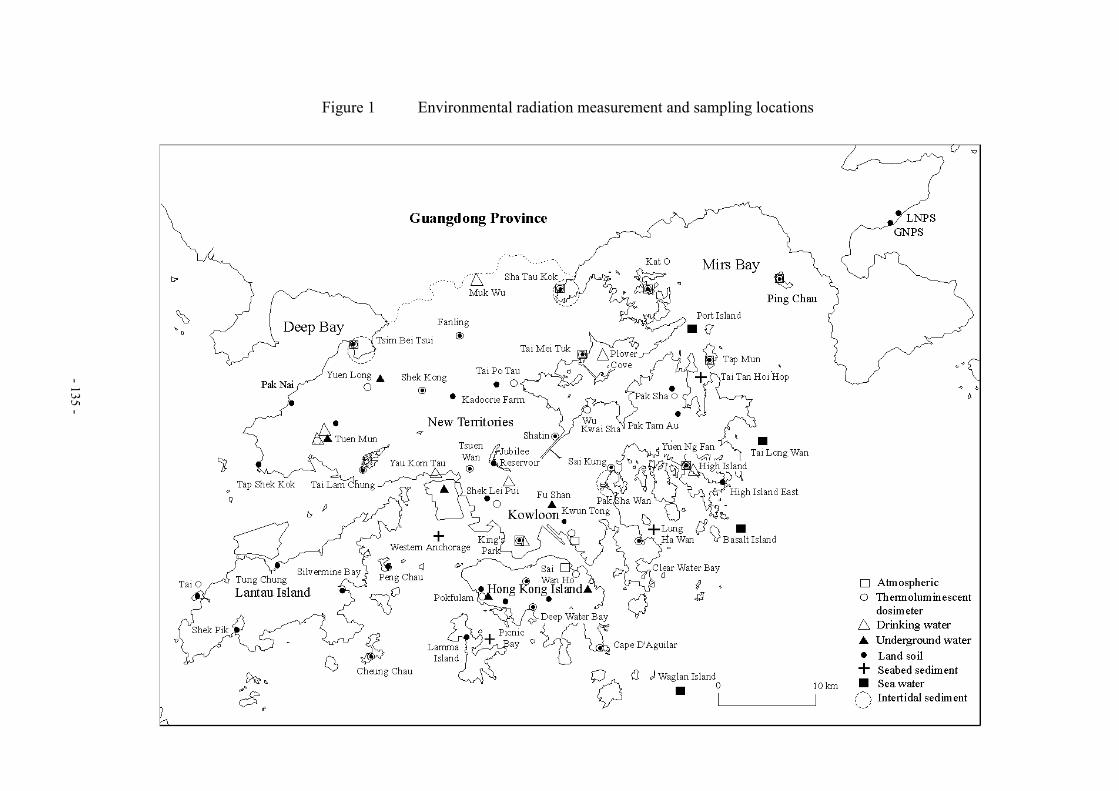
Figure 1 Environmental radiation measurement and sampling locations
- 135 -
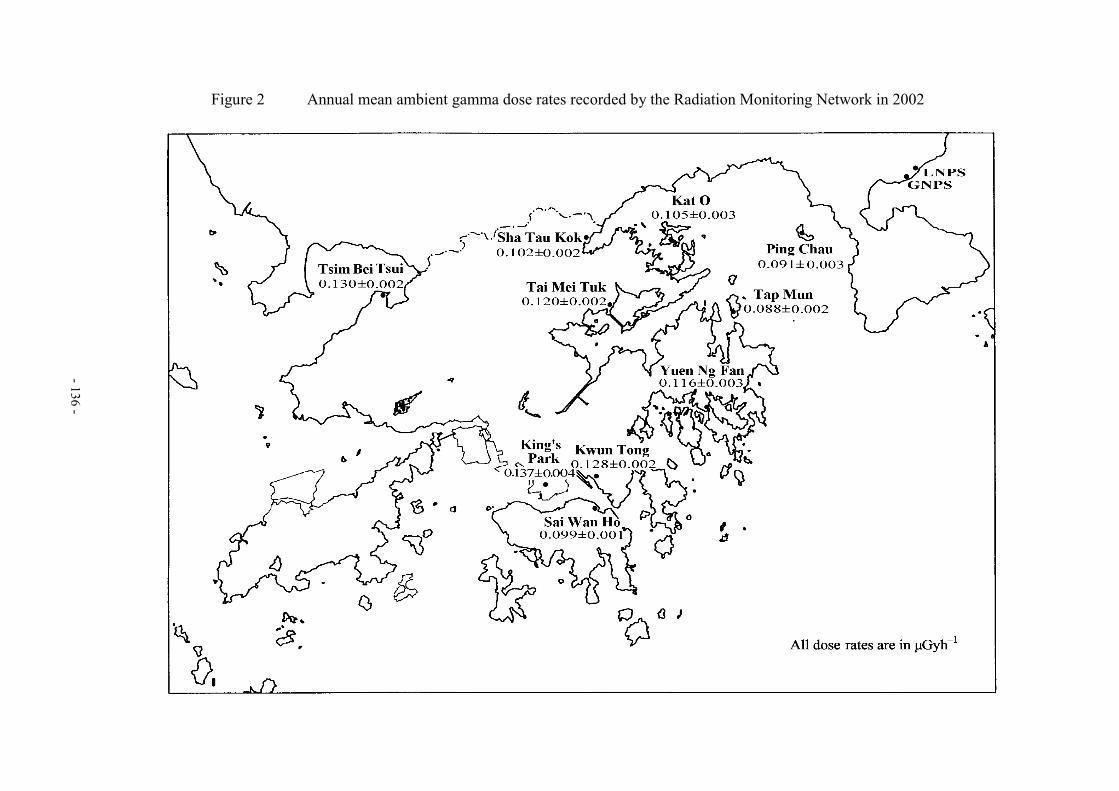
Figure 2 Annual mean ambient gamma dose rates recorded by the Radiation Monitoring Network in 2002
- 136 -
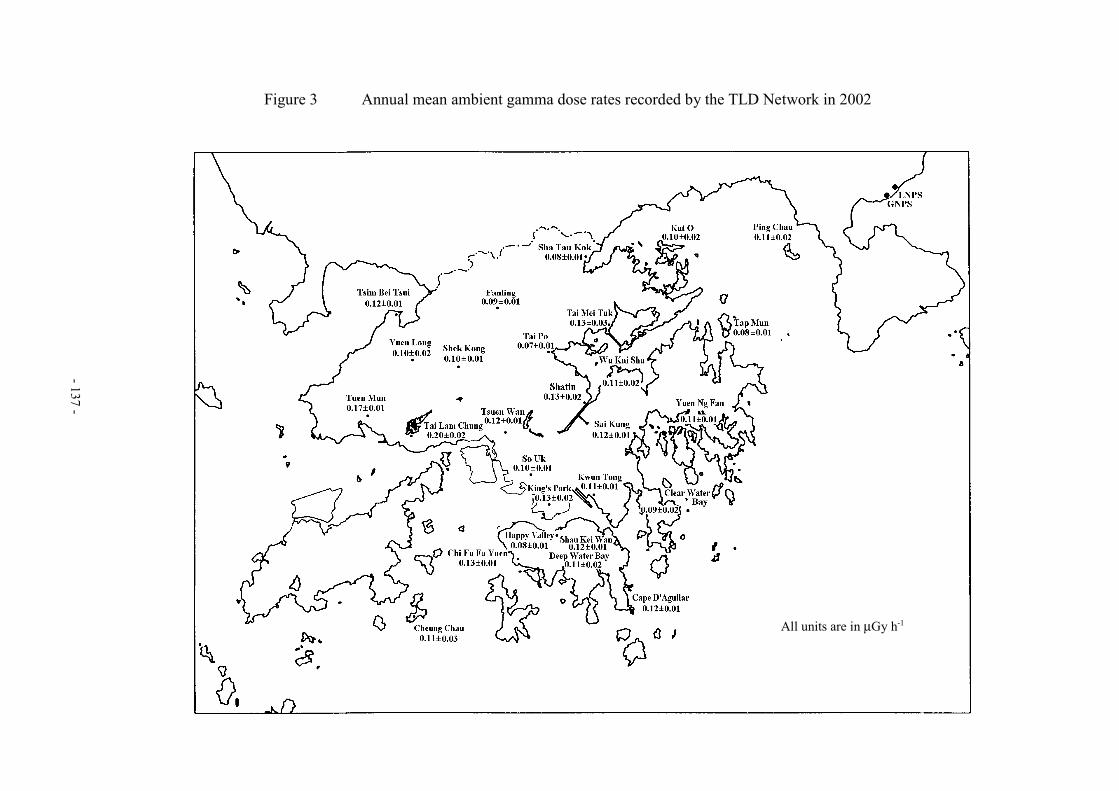
Figure 3 Annual mean ambient gamma dose rates recorded by the TLD Network in 2002
- 137 -
All units are in µGy h-1
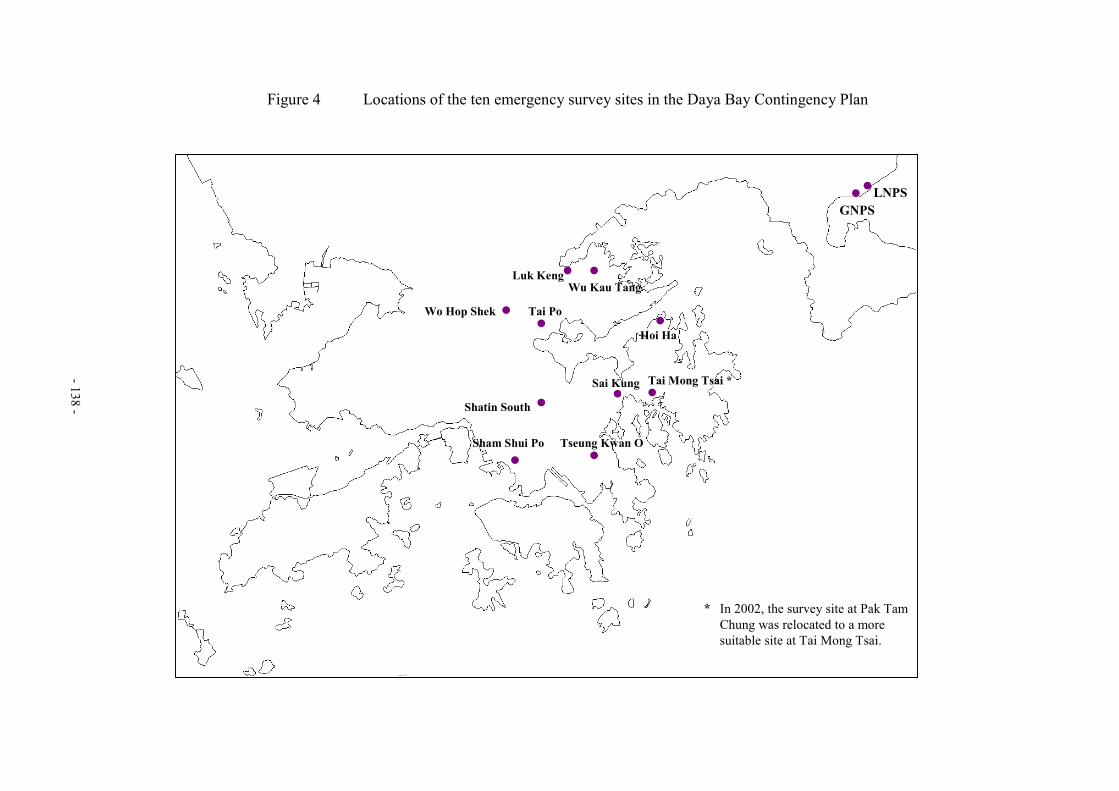
Figure 4 Locations of the ten emergency survey sites in the Daya Bay Contingency Plan
- 138 -
��
�
�
�
�
�
�
�
Luk KengWu Kau Tang
Wo Hop Shek Tai Po
Shatin South
Sham Shui Po Tseung Kwan O
Sai Kung Tai Mong Tsai *
Hoi Ha�
GNPS �
In 2002, the survey site at Pak TamChung was relocated to a moresuitable site at Tai Mong Tsai.
� LNPS
*

- 139 -
Figure 5 Daily mean ambient gamma dose rates recorded by the RadiationMonitoring Network from January to June 2002
Ping Chau
0.06
0.10
0.14
0.18
0.22
0.06
0.10
0.14
0.18
0.22
Jan Feb Mar Apr May Jun
Heavy rain
Yuen Ng Fan
0.06
0.10
0.14
0.18
0.22
0.06
0.10
0.14
0.18
0.22
Jan Feb Mar Apr May Jun
Kat O
0.06
0.10
0.14
0.18
0.22
0.06
0.10
0.14
0.18
0.22
Jan Feb Mar Apr May Jun
Tai Mei Tuk
0.06
0.10
0.14
0.18
0.22
0.06
0.10
0.14
0.18
0.22
Jan Feb Mar Apr May Jun
Tap Mun
0.06
0.10
0.14
0.18
0.22
0.06
0.10
0.14
0.18
0.22
Jan Feb Mar Apr May Jun
- to be continued on next page -
Dos
e ra
te ( µ
Gy
h-1)
Dos
e ra
te ( µ
Gy
h-1)
Dos
e ra
te ( µ
Gy
h-1)
Dos
e ra
te ( µ
Gy
h-1)
Dos
e ra
te ( µ
Gy
h-1)
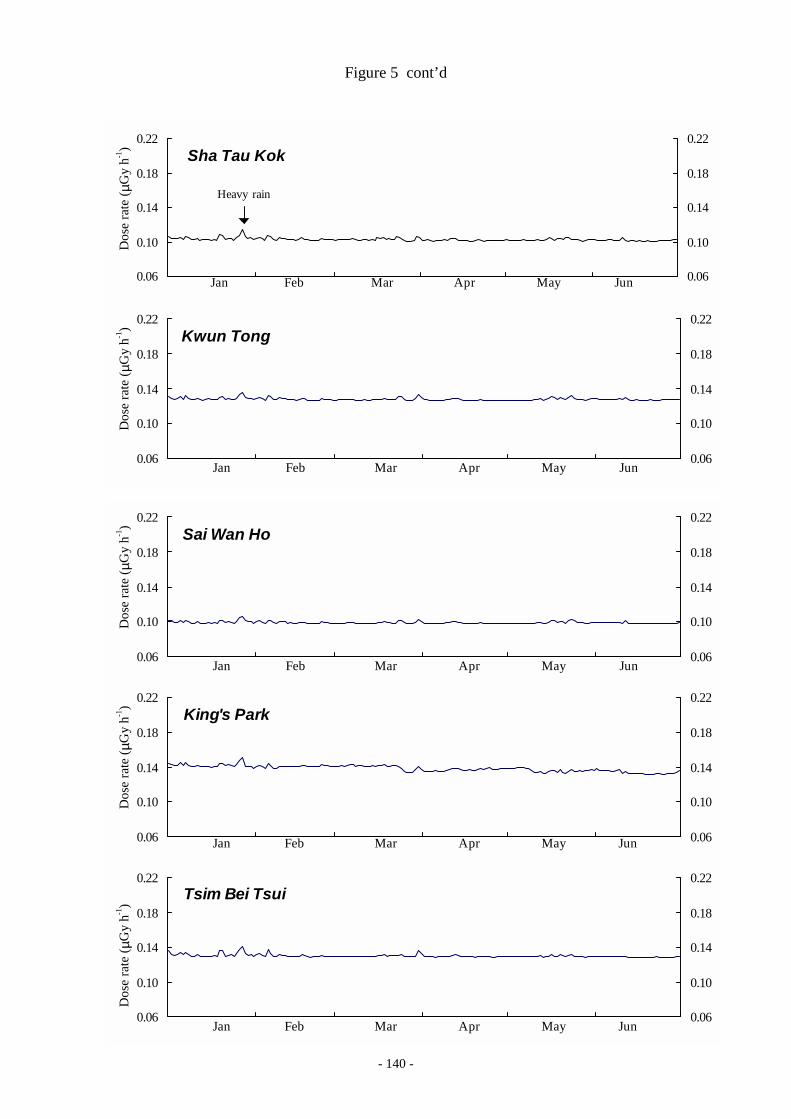
- 140 -
Figure 5 cont’d
Sha Tau Kok
0.06
0.10
0.14
0.18
0.22
0.06
0.10
0.14
0.18
0.22
Jan Feb Mar Apr May Jun
Heavy rain
Tsim Bei Tsui
0.06
0.10
0.14
0.18
0.22
0.06
0.10
0.14
0.18
0.22
Jan Feb Mar Apr May Jun
King's Park
0.06
0.10
0.14
0.18
0.22
0.06
0.10
0.14
0.18
0.22
Jan Feb Mar Apr May Jun
Sai Wan Ho
0.06
0.10
0.14
0.18
0.22
0.06
0.10
0.14
0.18
0.22
Jan Feb Mar Apr May Jun
Kwun Tong
0.06
0.10
0.14
0.18
0.22
0.06
0.10
0.14
0.18
0.22
Jan Feb Mar Apr May Jun
Dos
e ra
te ( µ
Gy
h-1)
Dos
e ra
te ( µ
Gy
h-1)
Dos
e ra
te ( µ
Gy
h-1)
Dos
e ra
te ( µ
Gy
h-1)
Dos
e ra
te ( µ
Gy
h-1)
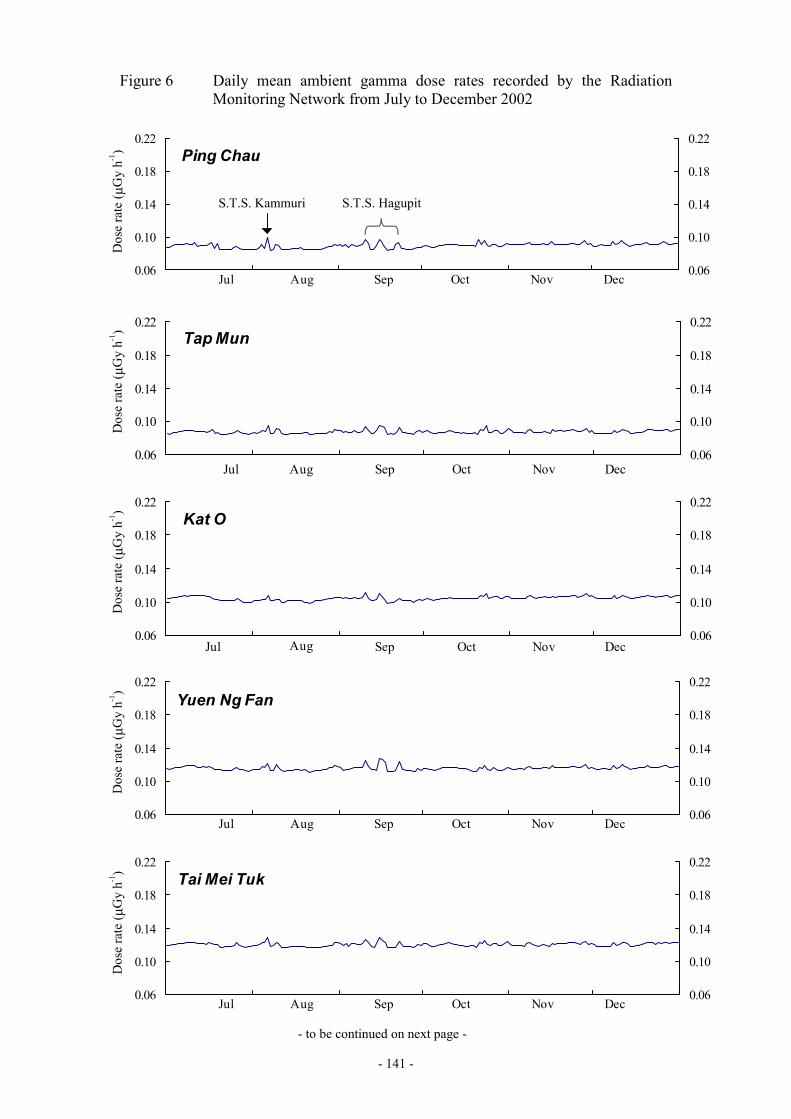
- 141 -
Figure 6 Daily mean ambient gamma dose rates recorded by the RadiationMonitoring Network from July to December 2002
Ping Chau
0.06
0.10
0.14
0.18
0.22
0.06
0.10
0.14
0.18
0.22
Jul Aug Sep Oct Nov Dec
Tai Mei Tuk
0.06
0.10
0.14
0.18
0.22
0.06
0.10
0.14
0.18
0.22
Jul Aug Sep Oct Nov Dec
Yuen Ng Fan
0.06
0.10
0.14
0.18
0.22
0.06
0.10
0.14
0.18
0.22
Jul Aug Sep Oct Nov Dec
Kat O
0.06
0.10
0.14
0.18
0.22
0.06
0.10
0.14
0.18
0.22
Jul Aug Sep Oct Nov Dec
Tap Mun
0.06
0.10
0.14
0.18
0.22
0.06
0.10
0.14
0.18
0.22
Jul Aug Sep Oct Nov Dec
- to be continued on next page -
Dos
e ra
te ( µ
Gy
h-1)
Dos
e ra
te ( µ
Gy
h-1)
Dos
e ra
te ( µ
Gy
h-1)
Dos
e ra
te ( µ
Gy
h-1)
Dos
e ra
te ( µ
Gy
h-1)
S.T.S. HagupitS.T.S. Kammuri
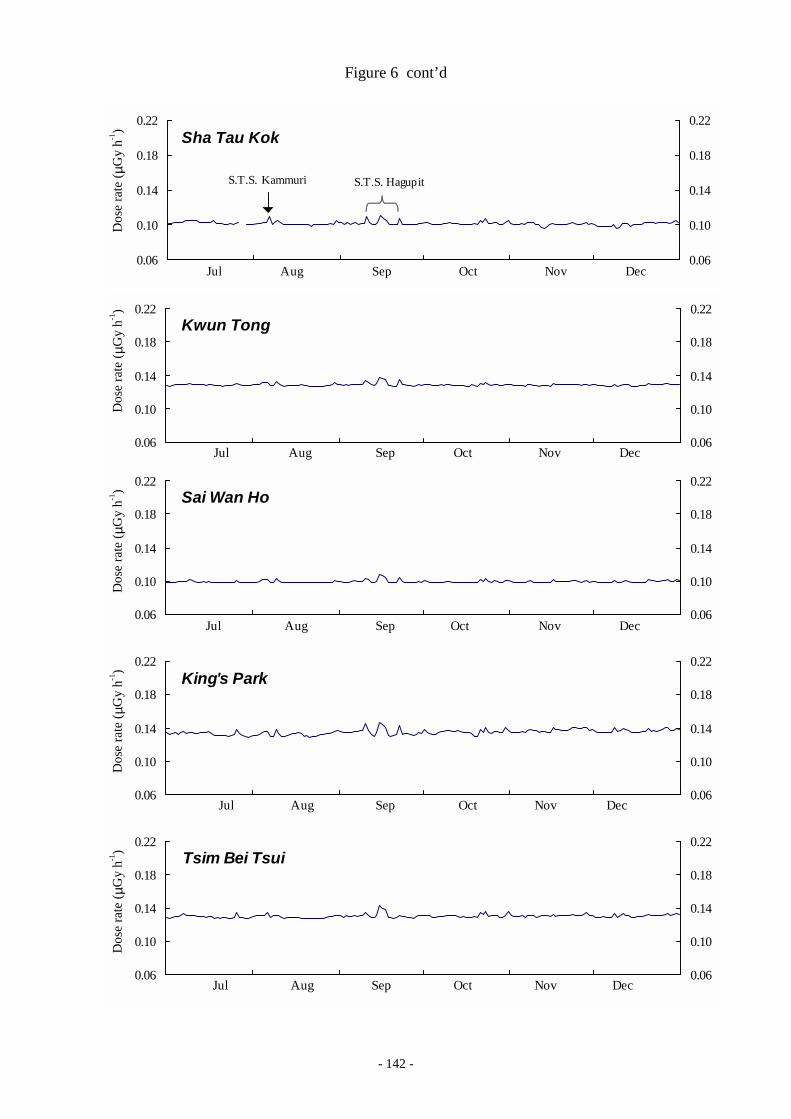
- 142 -
Tsim Bei Tsui
0.06
0.10
0.14
0.18
0.22
0.06
0.10
0.14
0.18
0.22
Jul Aug Sep Oct Nov Dec
King's Park
0.06
0.10
0.14
0.18
0.22
0.06
0.10
0.14
0.18
0.22
Jul Aug Sep Oct Nov Dec
Figure 6 cont’d
Sha Tau Kok
0.06
0.10
0.14
0.18
0.22
0.06
0.10
0.14
0.18
0.22
Jul Aug Sep Oct Nov Dec
S.T.S. Kammuri S.T.S. Hagupit
Sai Wan Ho
0.06
0.10
0.14
0.18
0.22
0.06
0.10
0.14
0.18
0.22
Jul Aug Sep Oct Nov Dec
Kwun Tong
0.06
0.10
0.14
0.18
0.22
0.06
0.10
0.14
0.18
0.22
Jul Aug Sep Oct Nov Dec
Dos
e ra
te ( µ
Gy
h-1)
Dos
e ra
te ( µ
Gy
h-1)
Dos
e ra
te ( µ
Gy
h-1)
Dos
e ra
te ( µ
Gy
h-1)
Dos
e ra
te ( µ
Gy
h-1)

Figure 7 Track of Severe Tropical Storm Hagupit (from 10 to 12 September 2002)
- 143 -
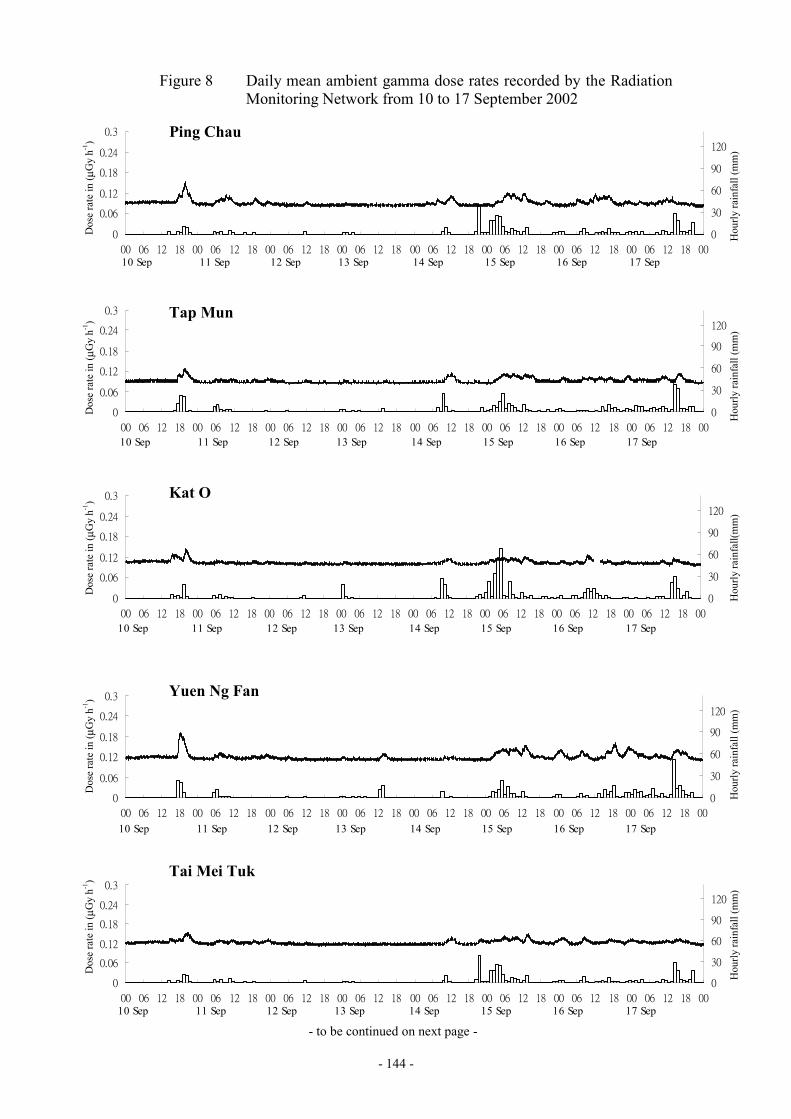
- 144 -
0
0.06
0.12
0.18
0.24
0.3
00 06 12 18 00 06 12 18 00 06 12 18 00 06 12 18 00 06 12 18 00 06 12 18 00 06 12 18 00 06 12 18 00
0
30
60
90
120
10 Sep 11 Sep 12 Sep 13 Sep 14 Sep 15 Sep 16 Sep 17 Sep
Figure 8 Daily mean ambient gamma dose rates recorded by the RadiationMonitoring Network from 10 to 17 September 2002
0
0.06
0.12
0.18
0.24
0.3
00 06 12 18 00 06 12 18 00 06 12 18 00 06 12 18 00 06 12 18 00 06 12 18 00 06 12 18 00 06 12 18 00
0
30
60
90
120
10 Sep 11 Sep 12 Sep 13 Sep 14 Sep 15 Sep 16 Sep 17 Sep
0
0.06
0.12
0.18
0.24
0.3
00 06 12 18 00 06 12 18 00 06 12 18 00 06 12 18 00 06 12 18 00 06 12 18 00 06 12 18 00 06 12 18 00
0
30
60
90
120
10 Sep 11 Sep 12 Sep 13 Sep 14 Sep 15 Sep 16 Sep 17 Sep
0
0.06
0.12
0.18
0.24
0.3
00 06 12 18 00 06 12 18 00 06 12 18 00 06 12 18 00 06 12 18 00 06 12 18 00 06 12 18 00 06 12 18 00
0
30
60
90
120
10 Sep 11 Sep 12 Sep 13 Sep 14 Sep 15 Sep 16 Sep 17 Sep
0
0.06
0.12
0.18
0.24
0.3
00 06 12 18 00 06 12 18 00 06 12 18 00 06 12 18 00 06 12 18 00 06 12 18 00 06 12 18 00 06 12 18 00
0
30
60
90
120
10 Sep 11 Sep 12 Sep 13 Sep 14 Sep 15 Sep 16 Sep 17 Sep
Hou
rly ra
infa
ll (m
m)
Dos
e ra
te in
( µG
y h-1
)
Ping Chau
Dos
e ra
te in
( µG
y h-1
)D
ose
rate
in ( µ
Gy
h-1) Tap Mun
Kat O
Dos
e ra
te in
( µG
y h-1
) Yuen Ng Fan
Dos
e ra
te in
( µG
y h-1
)
Tai Mei Tuk
- to be continued on next page -
Hou
rly ra
infa
ll (m
m)
Hou
rly ra
infa
ll(m
m)
Hou
rly ra
infa
ll (m
m)
Hou
rly ra
infa
ll (m
m)
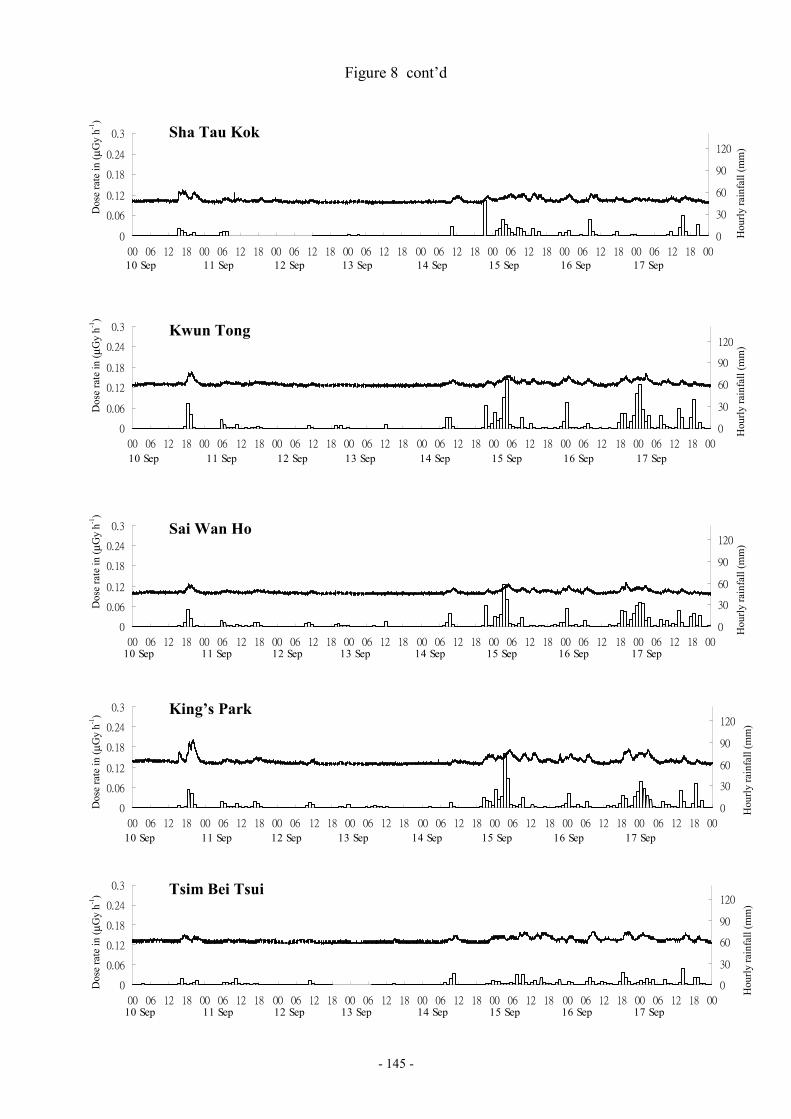
- 145 -
Figure 8 cont’d
0
0.06
0.12
0.18
0.24
0.3
00 06 12 18 00 06 12 18 00 06 12 18 00 06 12 18 00 06 12 18 00 06 12 18 00 06 12 18 00 06 12 18 00
0
30
60
90
120
10 Sep 11 Sep 12 Sep 13 Sep 14 Sep 15 Sep 16 Sep 17 Sep
0
0.06
0.12
0.18
0.24
0.3
00 06 12 18 00 06 12 18 00 06 12 18 00 06 12 18 00 06 12 18 00 06 12 18 00 06 12 18 00 06 12 18 00
0
30
60
90
120
10 Sep 11 Sep 12 Sep 13 Sep 14 Sep 15 Sep 16 Sep 17 Sep
0
0.06
0.12
0.18
0.24
0.3
00 06 12 18 00 06 12 18 00 06 12 18 00 06 12 18 00 06 12 18 00 06 12 18 00 06 12 18 00 06 12 18 00
0
30
60
90
120
10 Sep 11 Sep 12 Sep 13 Sep 14 Sep 15 Sep 16 Sep 17 Sep
0
0.06
0.12
0.18
0.24
0.3
00 06 12 18 00 06 12 18 00 06 12 18 00 06 12 18 00 06 12 18 00 06 12 18 00 06 12 18 00 06 12 18 00
0
30
60
90
120
10 Sep 11 Sep 12 Sep 13 Sep 14 Sep 15 Sep 16 Sep 17 Sep
0
0.06
0.12
0.18
0.24
0.3
00 06 12 18 00 06 12 18 00 06 12 18 00 06 12 18 00 06 12 18 00 06 12 18 00 06 12 18 00 06 12 18 00
0
30
60
90
120
10 Sep 11 Sep 12 Sep 13 Sep 14 Sep 15 Sep 16 Sep 17 Sep
Dos
e ra
te in
( µG
y h-1
)D
ose
rate
in ( µ
Gy
h-1)
Dos
e ra
te in
( µG
y h-1
)D
ose
rate
in ( µ
Gy
h-1)
Dos
e ra
te in
( µG
y h-1
)
Hou
rly ra
infa
ll (m
m)
Hou
rly ra
infa
ll (m
m)
Hou
rly ra
infa
ll (m
m)
Hou
rly ra
infa
ll (m
m)
Tsim Bei Tsui
King’s Park
Sai Wan Ho
Kwun Tong
Sha Tau Kok
Hou
rly ra
infa
ll (m
m)
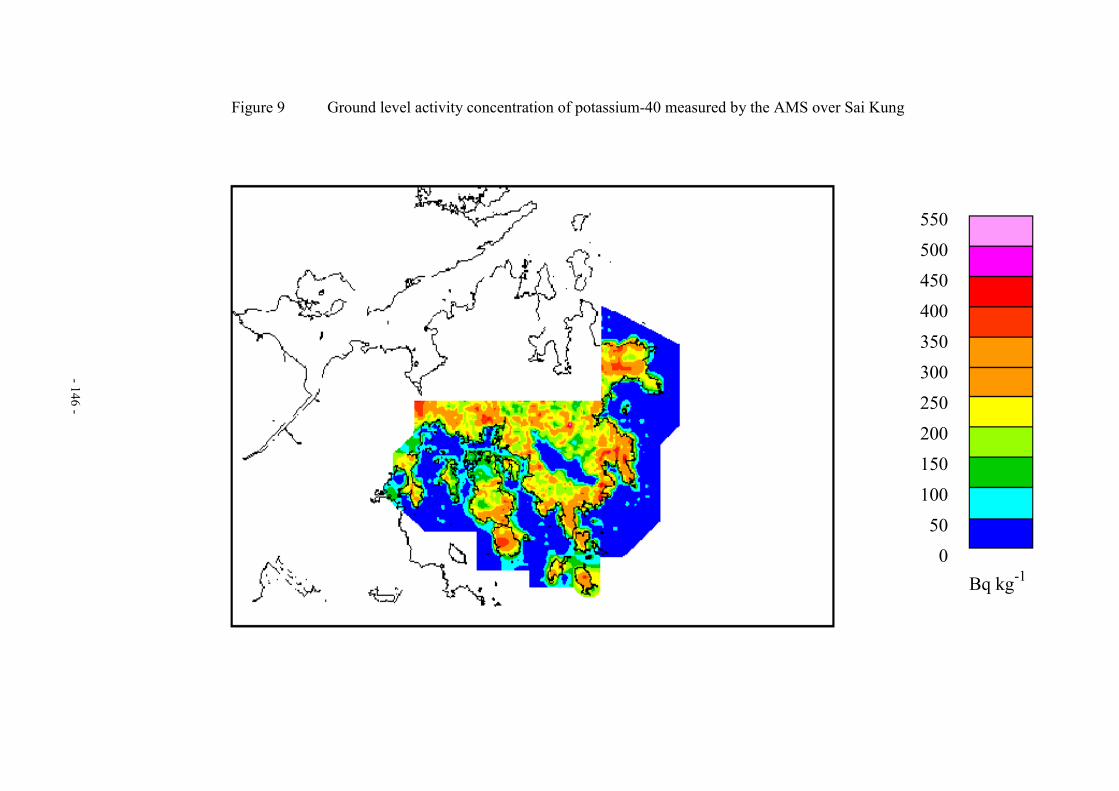
Figure 9 Ground level activity concentration of potassium-40 measured by the AMS over Sai Kung
- 146 -
55050045040035030025020015010050
0Bq kg-1

Figure 10 Ground level activity concentration of potassium-40 measured by the AMS over Soko Islands
- 147 -
Bq kg-1
55050045040035030025020015010050
0
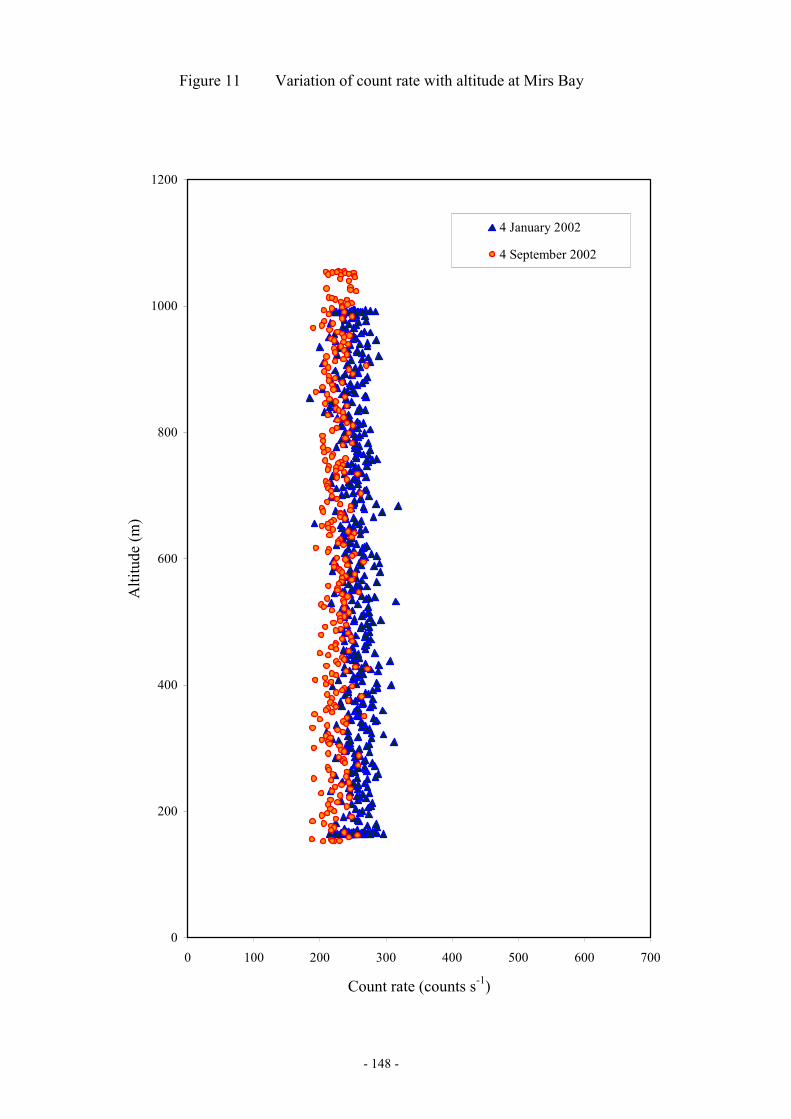
- 148 -
Figure 11 Variation of count rate with altitude at Mirs Bay
0
200
400
600
800
1000
1200
0 100 200 300 400 500 600 700
Count rate (counts s-1)
Alti
tude
(m)
4 January 2002
4 September 2002
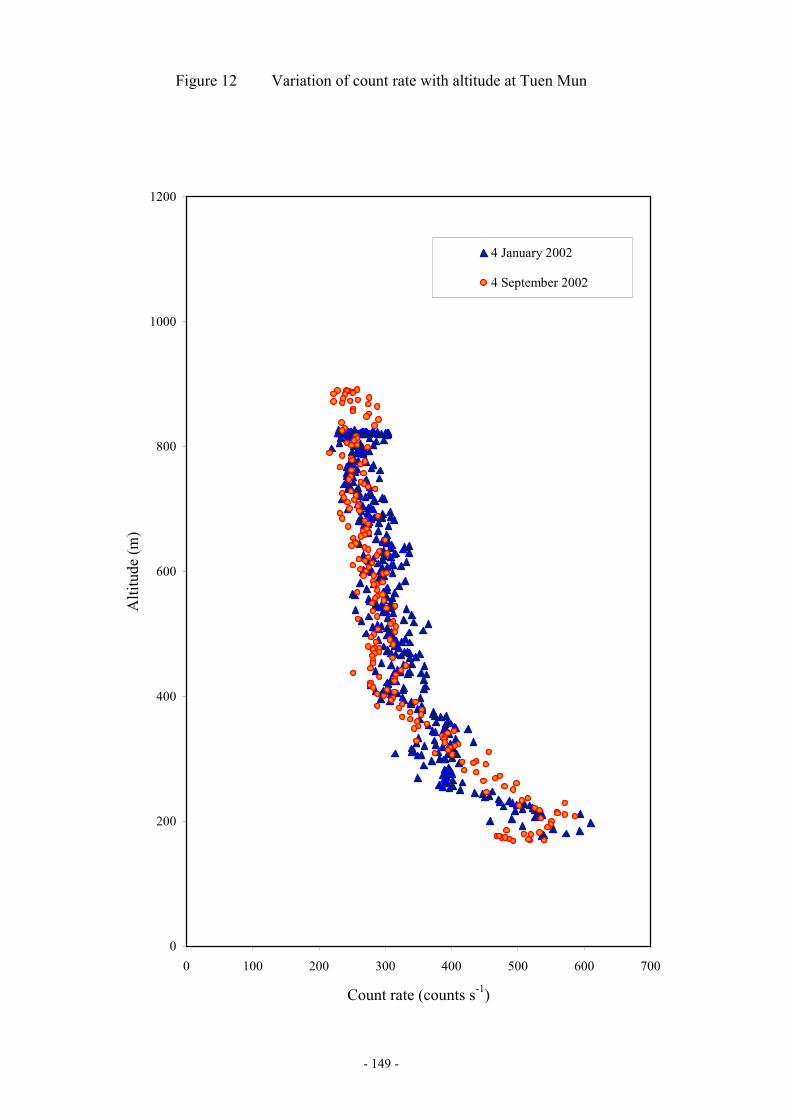
- 149 -
Figure 12 Variation of count rate with altitude at Tuen Mun
0
200
400
600
800
1000
1200
0 100 200 300 400 500 600 700
Count rate (counts s-1)
Alti
tude
(m)
4 January 2002
4 September 2002
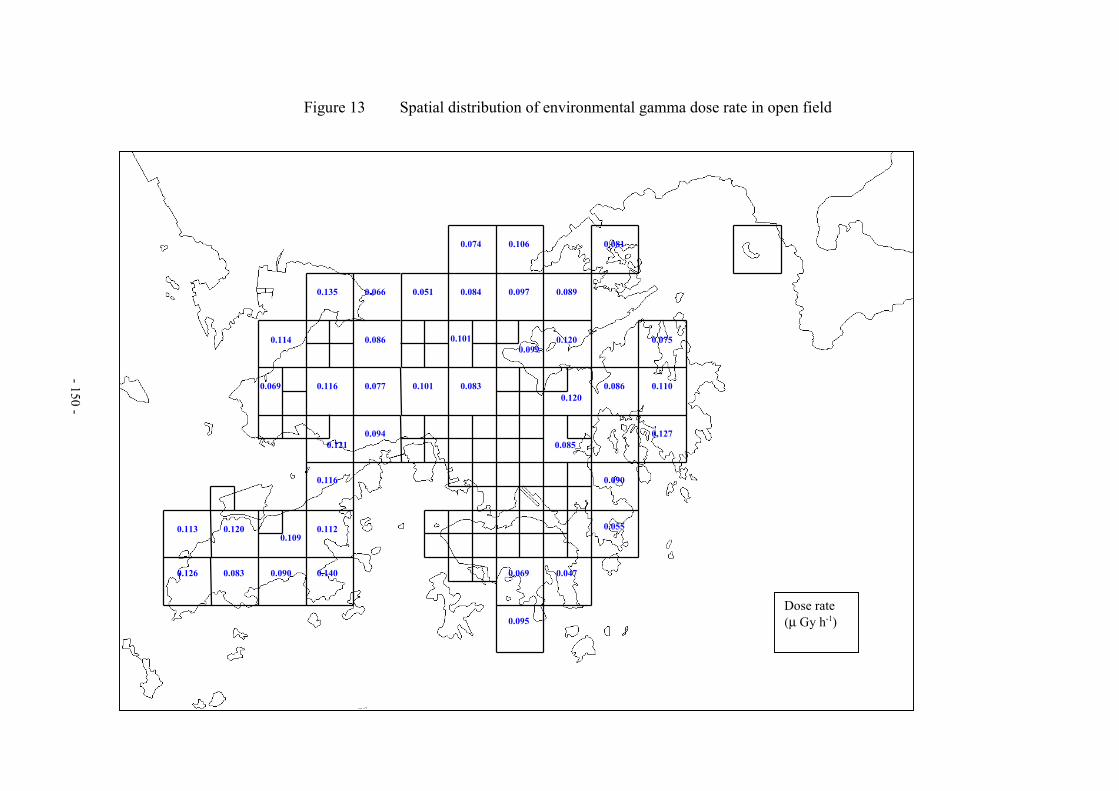
Figure 13 Spatial distribution of environmental gamma dose rate in open field
0.113
0.116
0.120
0.126 0.083 0.140
0.112
0.090
0.109
0.066
0.116 0.0860.077
0.094
0.120
0.086
0.135
0.101
0.051
0.0830.069
0.075
0.089
0.095
0.081
0.110
0.069
0.120
0.055
0.047
0.074 0.106
0.0970.084
0.114
0.121
0.1010.099
0.0850.127
0.090
Dose rate(µ Gy h-1)
- 150 -
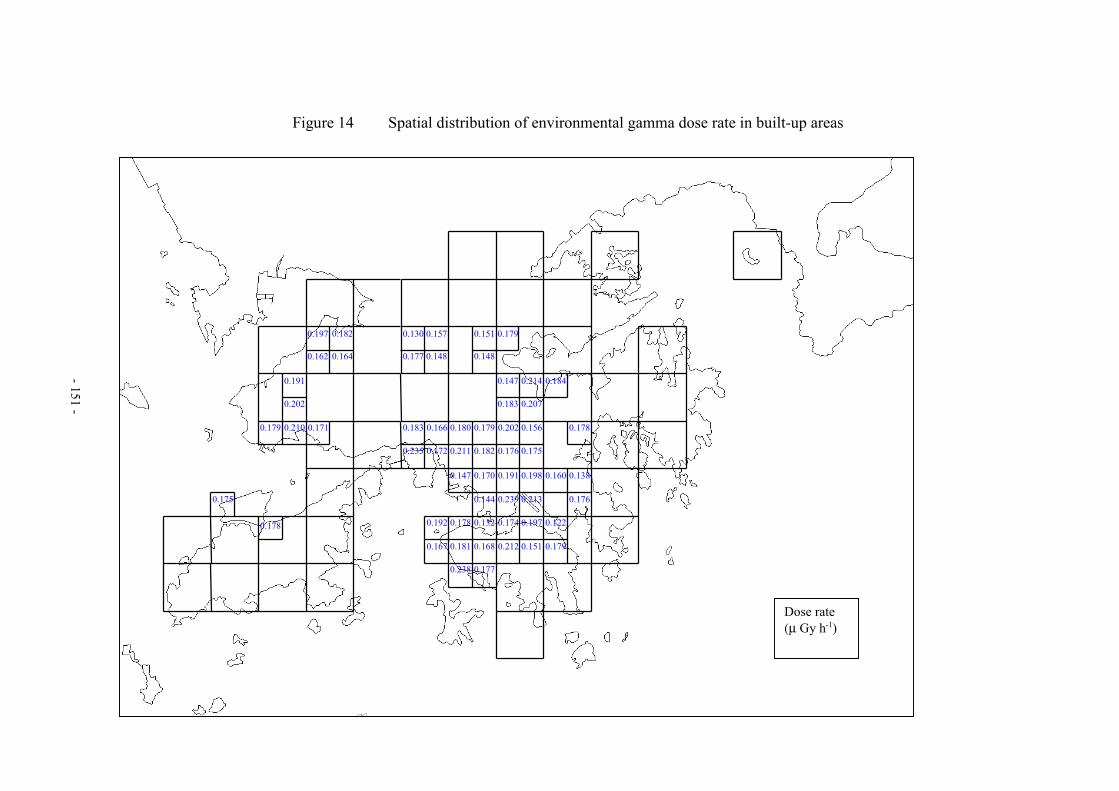
Figure 14 Spatial distribution of environmental gamma dose rate in built-up areas
0.178
0.148
0.130
0.177
0.157
0.192
0.197 0.182
0.162 0.164
0.191
0.202
0.179 0.210 0.171
0.151
0.148
0.1840.147
0.183
0.214
0.207
0.183 0.166
0.235 0.172
0.180
0.211
0.179
0.182
0.202
0.176
0.156
0.175
0.178
0.147 0.170
0.144
0.191
0.239
0.198
0.213
0.160 0.138
0.176
0.167
0.178
0.181
0.132
0.168
0.174
0.212
0.197
0.151
0.122
0.179
0.238 0.177
0.179
0.175
Dose rate(µ Gy h-1)
- 151 -
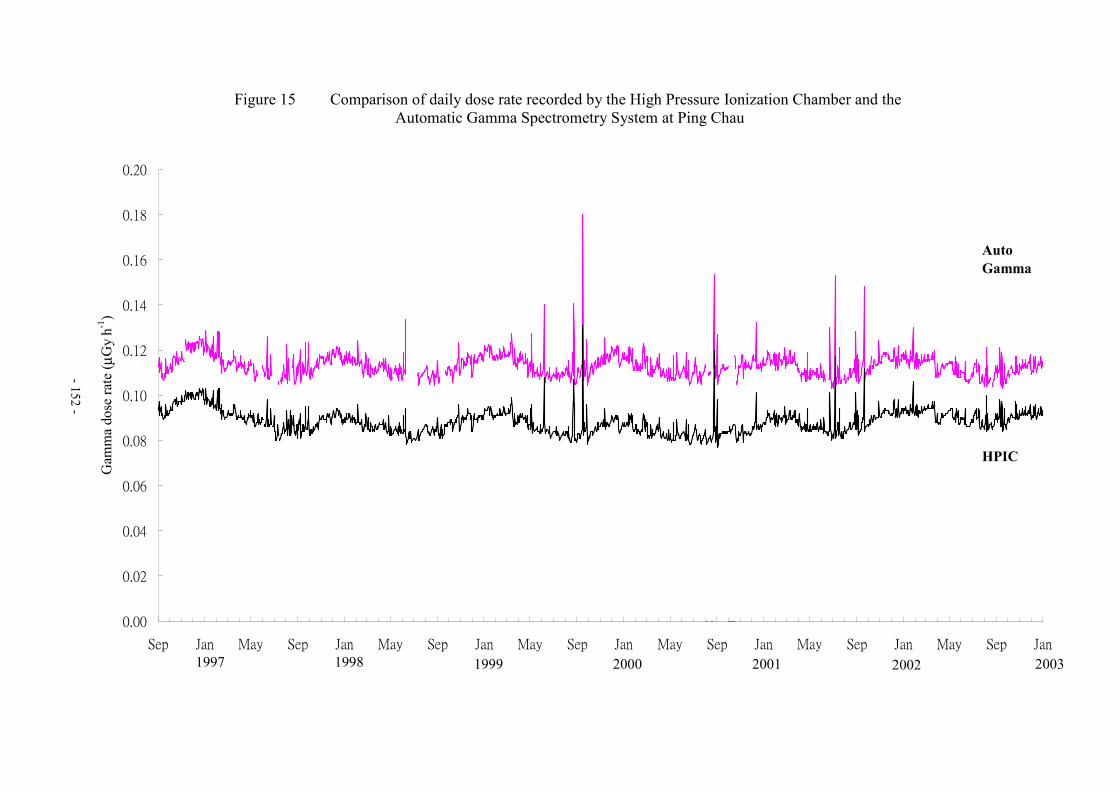
Figure 15 Comparison of daily dose rate recorded by the High Pressure Ionization Chamber and the Automatic Gamma Spectrometry System at Ping Chau
- 152 -
0.00
0.02
0.04
0.06
0.08
0.10
0.12
0.14
0.16
0.18
0.20
Sep Jan May Sep Jan May Sep Jan May Sep Jan May Sep Jan May Sep Jan May Sep Jan
Gam
ma
dose
rate
( µG
y h-1
)
1997
HPIC
AutoGamma
1998 1999 2000 2001 2002 2003
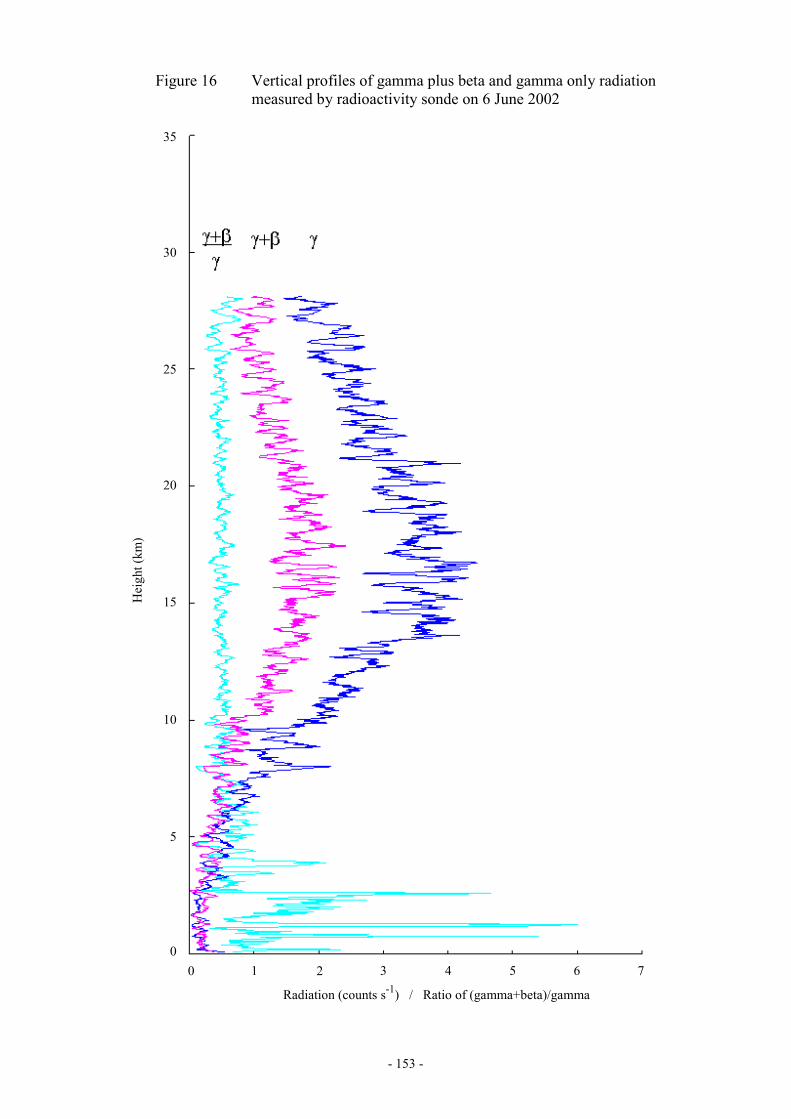
- 153 -
Figure 16 Vertical profiles of gamma plus beta and gamma only radiationmeasured by radioactivity sonde on 6 June 2002
Radiation (counts s-1) / Ratio of (gamma+beta)/gamma
35
30
25
20
15
10
5
00 1 32 4 5 6 7
Hei
ght (
km)
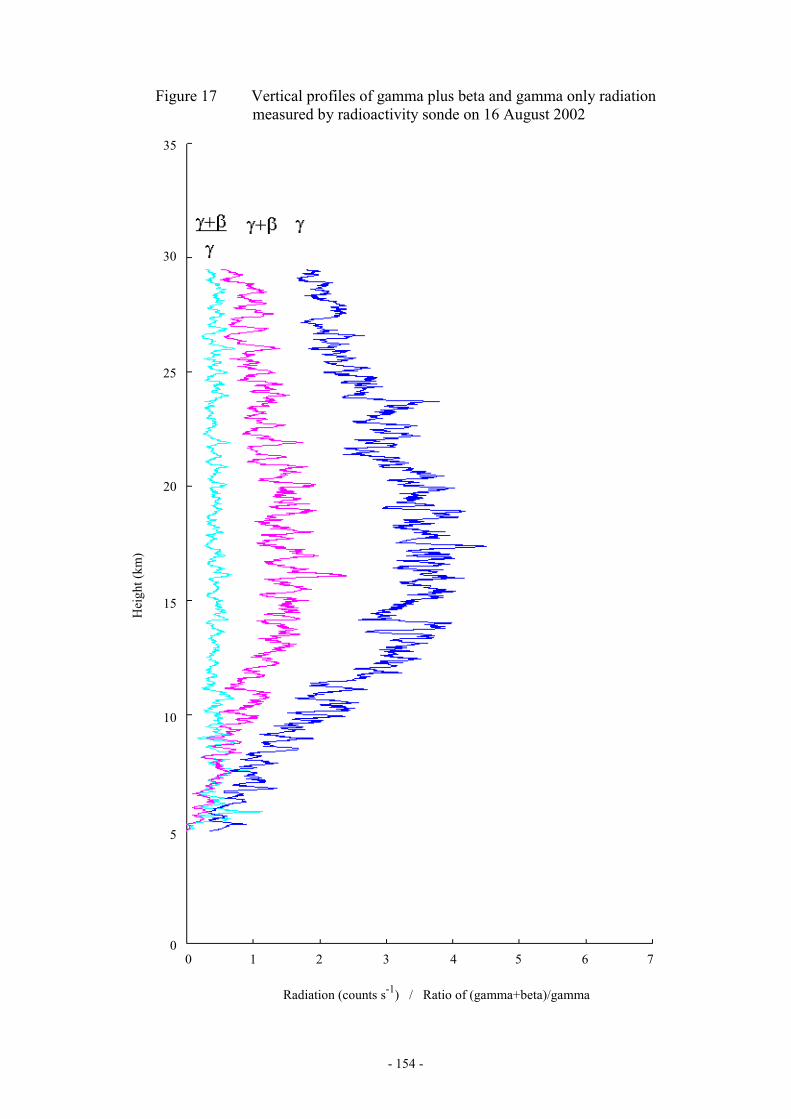
- 154 -
Figure 17 Vertical profiles of gamma plus beta and gamma only radiationmeasured by radioactivity sonde on 16 August 2002
Radiation (counts s-1) / Ratio of (gamma+beta)/gamma
Hei
ght (
km)
35
30
25
20
15
10
5
00 1 32 4 5 6 7
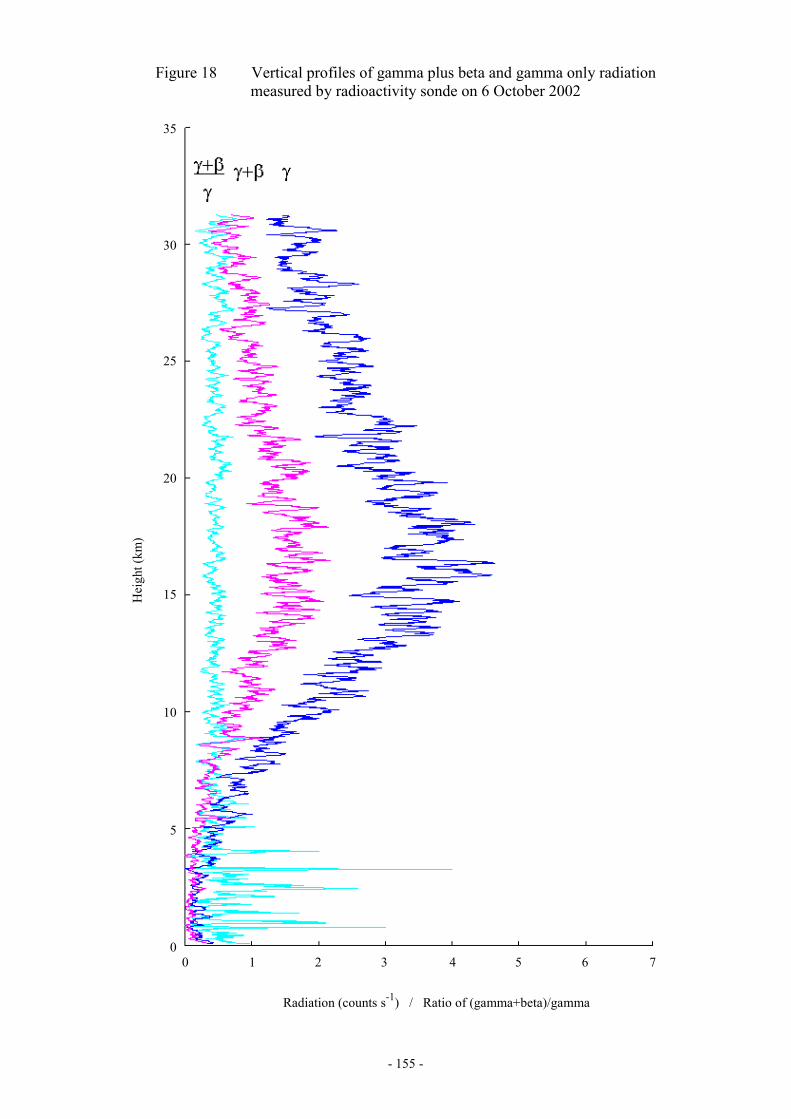
- 155 -
Figure 18 Vertical profiles of gamma plus beta and gamma only radiationmeasured by radioactivity sonde on 6 October 2002
Radiation (counts s-1) / Ratio of (gamma+beta)/gamma
Hei
ght (
km)
35
30
25
20
15
10
5
00 1 32 4 5 6 7

Figure 19 K-40 specific activity, salinity and pH for intertidal sediment in 2002
- 156 -
0
100
200
300
400
500
600
700
800
900
1 2 3 4 1 2 3 4 1 2 3 4 1 2 3 4 1 2 3 4 1 2 3 4
Spec
ific
activ
ity (B
q kg
-1)
0
5
10
15
20
25
30
35
Salin
ity, p
H
Pak Sha Wan(Upper)
Pak Sha Wan(Lower)
Sha Tau Kok(Upper)
Tsim Bei Tsui(Upper)
Sha Tau Kok(Lower)
Tsim Bei Tsui(Lower)
QuarterLocation
Level
Salinity K-40 pH

Figure 20 Scatter diagram of K-40 specific activity against salinity for intertidal sediment in 2000 – 2002
- 157 -
Correlation coefficient = 0.75Significance level > 99%
100
200
300
400
500
600
700
0 5 10 15 20 25 30 35Salinity
Spec
ific a
ctivi
ty (B
q kg
-1)
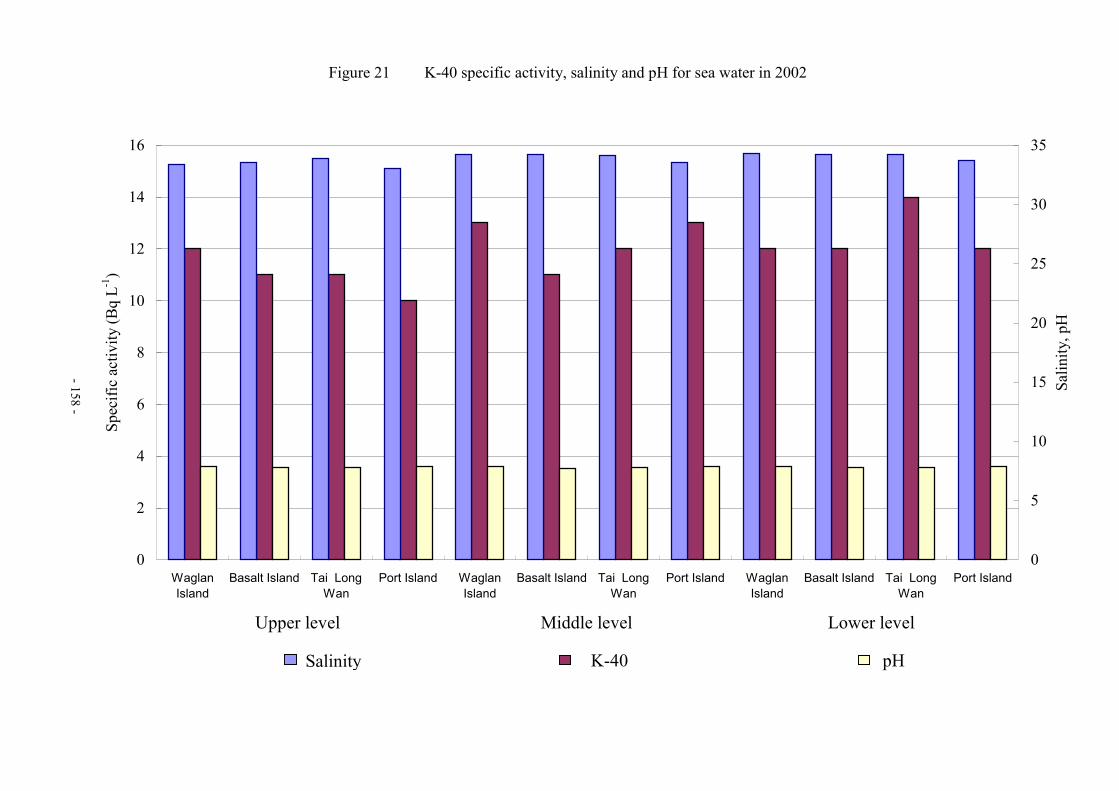
Figure 21 K-40 specific activity, salinity and pH for sea water in 2002
- 158 -
0
2
4
6
8
10
12
14
16
WaglanIsland
Basalt Island Tai LongWan
Port Island WaglanIsland
Basalt Island Tai LongWan
Port Island WaglanIsland
Basalt Island Tai LongWan
Port Island
Spec
ific
activ
ity (B
q L-1
)
0
5
10
15
20
25
30
35
Salin
ity, p
H
Upper level Middle level Lower level
Salinity K-40 pH
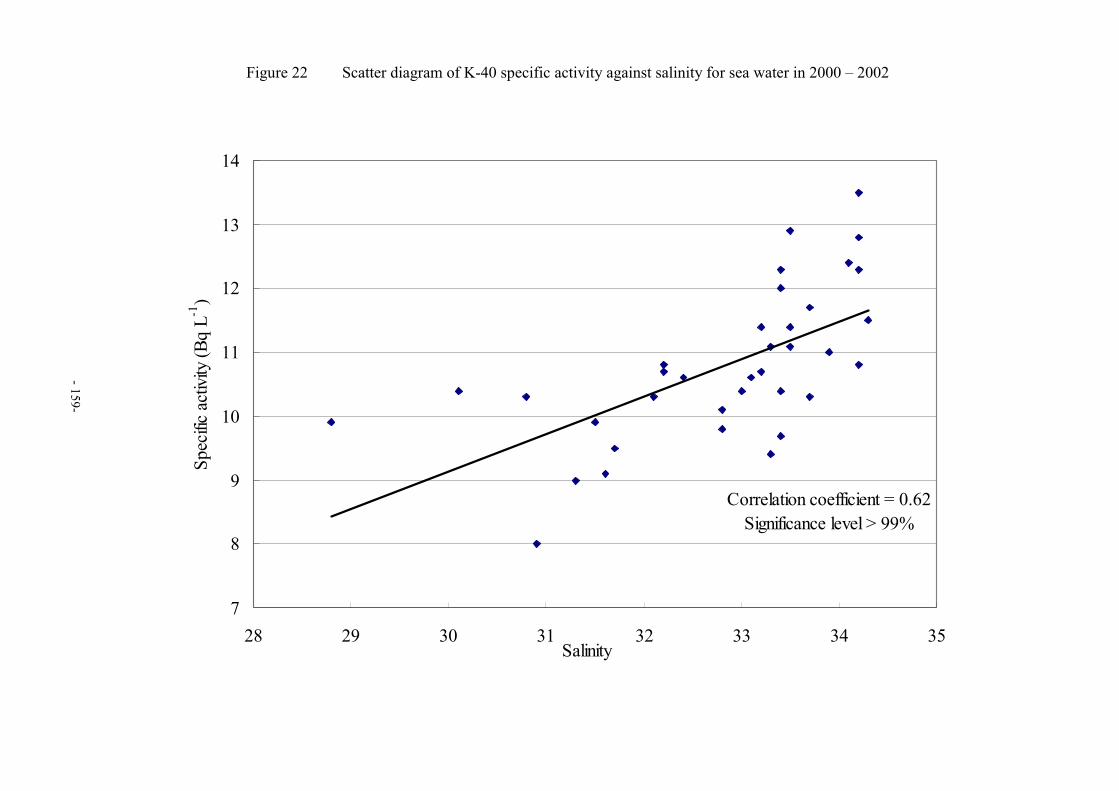
Figure 22 Scatter diagram of K-40 specific activity against salinity for sea water in 2000 – 2002
- 159-
Correlation coefficient = 0.62Significance level > 99%
7
8
9
10
11
12
13
14
28 29 30 31 32 33 34 35Salinity
Spec
ific a
ctivi
ty (B
q L-1
)
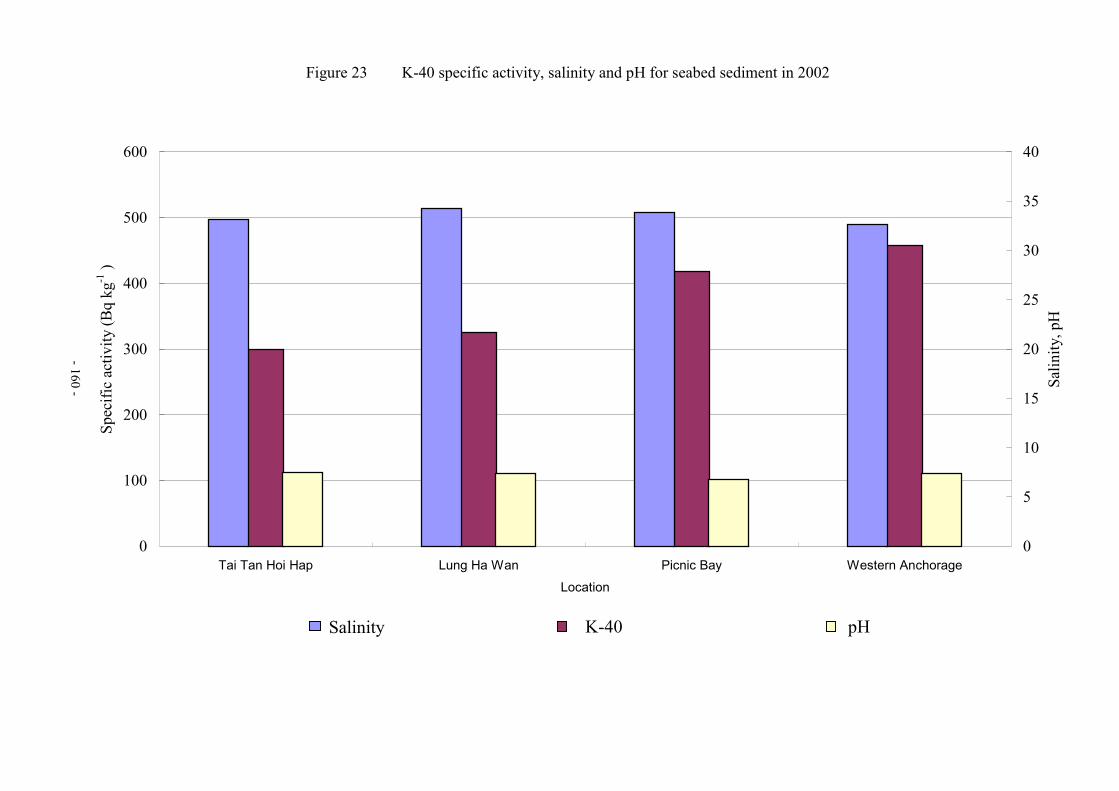
Figure 23 K-40 specific activity, salinity and pH for seabed sediment in 2002
0
100
200
300
400
500
600
Tai Tan Hoi Hap Lung Ha Wan Picnic Bay Western Anchorage
Location
Spec
ific
activ
ity (B
q kg
-1 )
0
5
10
15
20
25
30
35
40
Salin
ity, p
H
Salinity K-40 pH
- 160 -
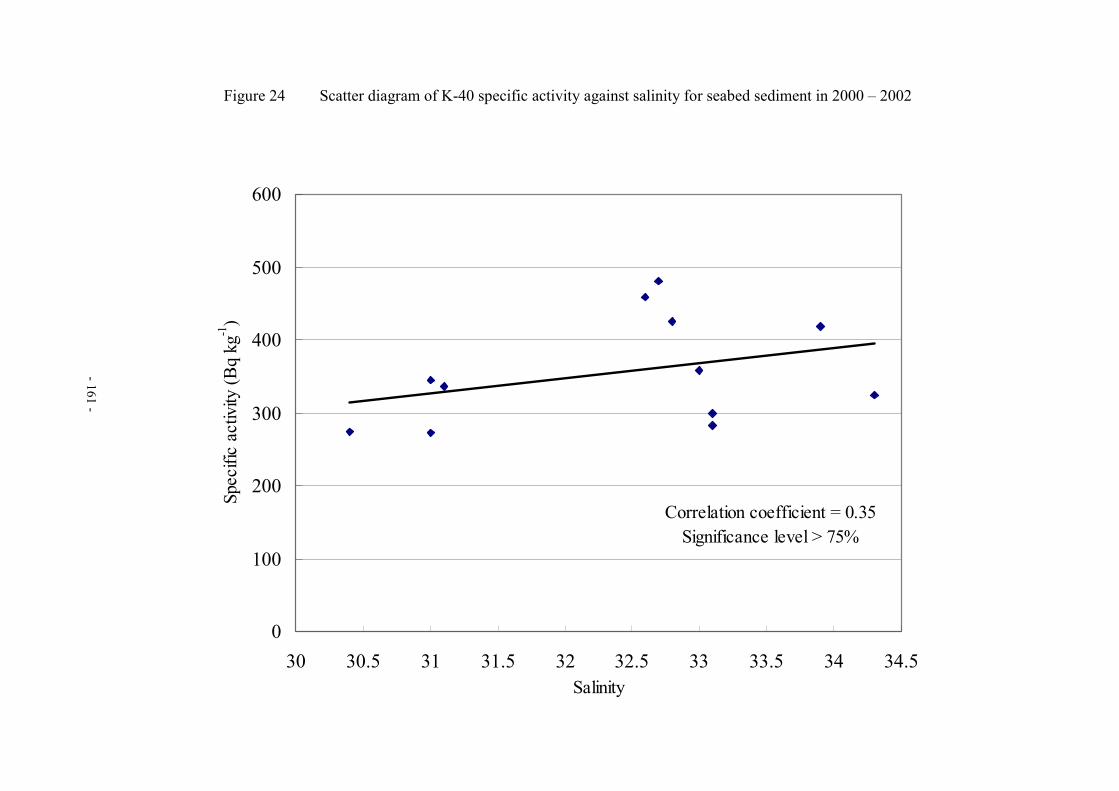
Figure 24 Scatter diagram of K-40 specific activity against salinity for seabed sediment in 2000 – 2002
Correlation coefficient = 0.35Significance level > 75%
0
100
200
300
400
500
600
30 30.5 31 31.5 32 32.5 33 33.5 34 34.5Salinity
Spec
ific
activ
ity (B
q kg
-1)
- 161 -