environmental product declaration for gib plasterboard · aqualine can be used for ceramic tiles up...
TRANSCRIPT

Environmental Product Declaration for GIB® Plasterboard
Version 1.1 of 1 March 2018
Valid until 5 December 2022
No. S-P-01000
AUSTRALASIA

About Winstone Wallboards
NATIONAL SUPPORT OFFICE
HEAD OFFICE & MANUFACTURING
37 Felix St, Penrose, Auckland 1061
PO Box 12256
Auckland 1642
Phone: +64 9 633 0100
Fax: +64 9 633 0101
THE GATE
DISTRIBUTION CENTRE
373D Neilson St
Auckland 1061
Phone: +64 9 622 3509
Fax: +64 9 622 0685
WELLINGTON
DISTRIBUTION CENTRE
8 Burnham St, Petone 5012
PO Box 36 024
Wellington 5045
Phone: +64 4 570 8450
CHRISTCHURCH
MANUFACTURING & DISTRIBUTION CENTRE
219 Opawa Rd, Hillsborough 8022
PO Box 1983
Christchurch 8140
Phone: +64 3 332 3159
Fax: +64 3 337 1014
ENVIRONMENTAL PRODUCT DECLARATION FOR GIB® PLASTERBOARD2 MARCH 2018GIB.CO.NZ FOR MORE INFO

Winstone Wallboards Ltd is New Zealand's largest manufacturer and marketer of gypsum plasterboard, drywall systems, associated products and services. The company has been operating since 1927 and manufactures plasterboard systems under the GIB® brand name. Winstone Wallboards Ltd, has facilities in Auckland, Wellington and Christchurch.
The GIB® brand is a New Zealand icon brand and
Winstone Wallboards has a proud heritage of being
a New Zealand focused and New Zealand based
company. Locally made for local conditions, the
products meet or exceed the New Zealand building
code, are BRANZ appraised and are backed by full
technical information and support to give complete
confidence in using GIB® Plasterboard Systems.
The Winstone Wallboards warranty covers GIB®
products and/or systems for a minimum of 10 years
from the date of purchase. Winstone Wallboards
warrants that GIB® products will be free from defects
caused by factory workmanship or materials and,
subject to compliance with the conditions attached,
that the product or system will perform to the extent
set out in relevant Winstone Wallboards published
literature current at the time of installation.
EPD registration number: S-P-01000
Version 1.1 of 2018-03-01
Approval date: 2017-12-05
Valid until: 2022-12-05
Geographical scope: New Zealand
PRODUCED UNDER THE AUSTRALASIAN EPD PROGRAMME IN ACCORDANCE
WITH ISO 14025 AND EN 15804
ENVIRONMENTAL PRODUCT DECLARATION FOR GIB® PLASTERBOARD 3MARCH 2018 GIB.CO.NZ FOR MORE INFO

General information
An Environmental Product Declaration, or EPD, is
a standardised and verified way of quantifying the
environmental impacts of a product based on a
consistent set of rules known as a PCR (Product
Category Rules). Environmental product declarations
within the same product category from different
programmes may not be comparable. EPDs of
construction products may not be comparable if they
do not comply with EN 15804.
Declaration owner: Winstone Wallboards Ltd
Web: www.gib.co.nz
Email: [email protected]
Post: 37 Felix Street, Penrose, Auckland 1061
EPD produced by: thinkstep Ltd
Web: www.thinkstep.com
Email: [email protected]
Post: 11 Rawhiti Road, Pukerua Bay, Wellington 5026, New Zealand
EPD programme operator: The Australasian EPD® Programme Ltd
Web: www.epd-australasia.com
Email: [email protected]
Post:c/o Kendons Chartered Accountants, 69 Rutherford Street, Hutt Central, Lower Hutt 5010,
New Zealand
CEN standard EN 15804 served as the core PCR
PCR: PCR 2012:01 Construction Products and Construction Services v2.2 (2017-05-30)
PCR review was conducted by:The Technical Committee of the International EPD® System. Chair: Massimo Marino.
Contact via [email protected]
Independent verification of the declaration
and data, according to ISO 14025:
EPD process certification (Internal)
EPD verification (External)
Third party verifier Kimberly Robertson, Catalyst Ltd
Web: www.catalystnz.co.nz
Email: [email protected]
Post: PO Box 37228, Christchurch 8245, New Zealand
Accredited or approved by: The Australasian EPD® Programme
ENVIRONMENTAL PRODUCT DECLARATION FOR GIB® PLASTERBOARD4 MARCH 2018GIB.CO.NZ FOR MORE INFO
AUSTRALASIA

Plasterboard variety GIB® Standard PlasterboardGIB Wideline®
GIB Aqualine®
GIB Braceline® GIB Noiseline®
GIB Ultraline®
GIB Fyreline®
GIB Toughline®
GIB Superline®
The GIB® performance system
6677788899
Technical informationDeclared unitIndustry classification
10
11
11
System boundariesProduct stageEnd-of-life stageConstruction stage
1213 1313
Life cycle inventory (LCI) data 13
Key assumptionsBackground dataCut off criteria
141414
Allocation 14
Environmental indicators 15
Results of assessmentGIB® Standard Plasterboard 10mm & 13mmGIB Wideline® 10mm & 13mmGIB Aqualine® 10mm & 13mmGIB Braceline® GIB Noiseline® 10mm & 13mmGIB Ultraline® 10mm & 13mmGIB Fyreline® 10mm, 13mm, 16mm & 19mmGIB Toughline® 13mmGIB Superline® 13mm
1616 & 1718 & 1920 & 2122 & 2324 & 2526 – 29
3031
Additional environmental informationGreenTag Certification
32 32 & 33
Declare 33
Homestar 33
Green Star 33
References 34
CONTENT
ENVIRONMENTAL PRODUCT DECLARATION FOR GIB® PLASTERBOARD 5MARCH 2018 GIB.CO.NZ FOR MORE INFO

GIB® Plasterboard product variety
GIB STANDARD®
GIB® Standard plasterboard is an economical lining
material available in 10mm and 13mm thicknesses.
It is suitable for multiple uses: maintains bracing
performance of GS1 and GS2 systems and ceiling
diaphragms as presented in GIB EzyBrace® Systems
2011; and can be used in GIB® Fire Rated and GIB®
Noise Control Systems. While 10mm GIB® Standard
plasterboard is suitable for walls, the thicker 13mm
GIB® Standard plasterboard is recommended for use
on ceilings for a better quality finish, especially where
wet and humid conditions mean ceiling sag can be
amplified. Used in ceilings it can withstand distributed
loads up to 3.0kg/m2 easily supporting loads such as
R5.0 insulation.
Strong, thick
paper liner
Robust, fiberglass reinforced
composite core with
honeycomb technology
— Clean score and snap means cleaner cuts and better edges.
— Low edge breakout and damage means less wastage.
— Easy screw bedding means quicker installation.
— Excellent uniformity means a consistent, quality finish.
— Great flexibility means easy sheet manoeuvrability with less risk of damage and wastage.
— Strong and rigid with low sag for easy sheet lifting and flat ceilings.
Bo
ard
Th
ickn
ess
(mm
)
Sh
eet
Wid
th
(mm
)
2400
2700
3000
3300
3600
4200
4800
6000
Max
. kg
/m
2
TE/TE 10 1200 7.0
TE/TE 13 1200 8.7
TE/TE 10 1200 7.0
GIB Wideline®
TE/SE10 1350 7.0
GIB Wideline®
TE/SE13 1350 8.7
GIB Patch-board®
10 1200 x 590 7.0
ENVIRONMENTAL PRODUCT DECLARATION FOR GIB® PLASTERBOARD6 MARCH 2018GIB.CO.NZ FOR MORE INFO
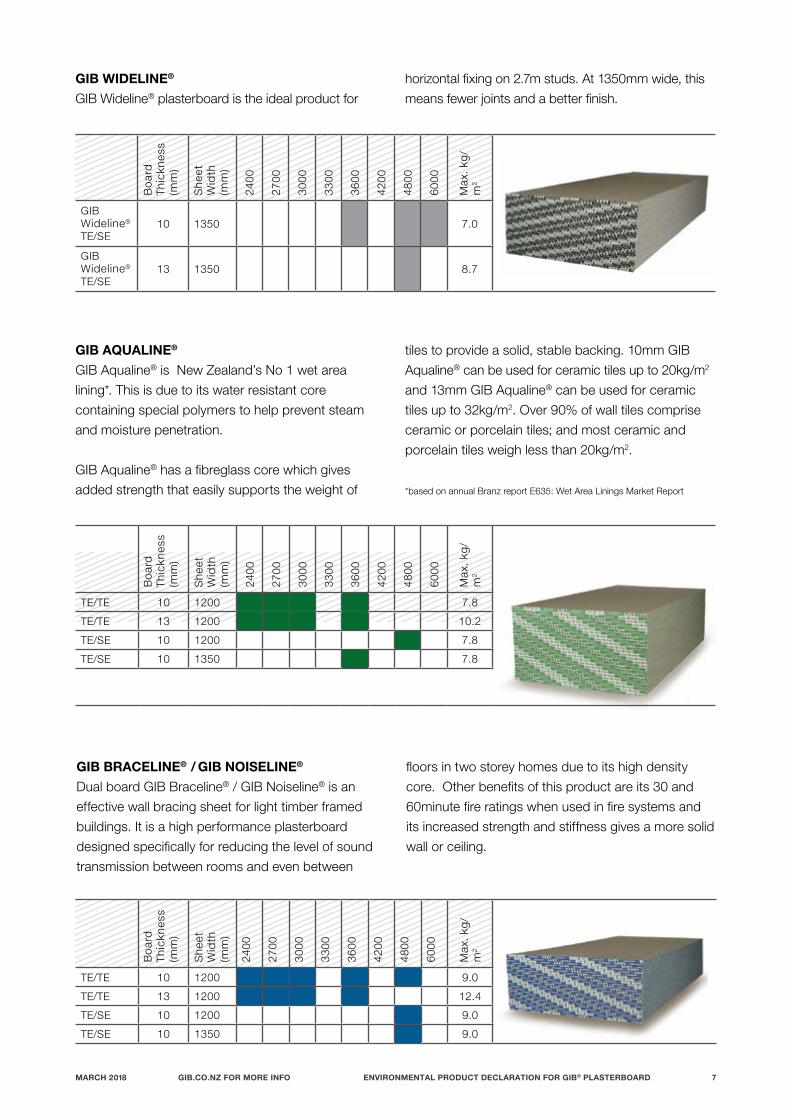
GIB AQUALINE®
GIB Aqualine® is New Zealand’s No 1 wet area
lining*. This is due to its water resistant core
containing special polymers to help prevent steam
and moisture penetration.
GIB Aqualine® has a fibreglass core which gives
added strength that easily supports the weight of
tiles to provide a solid, stable backing. 10mm GIB
Aqualine® can be used for ceramic tiles up to 20kg/m2
and 13mm GIB Aqualine® can be used for ceramic
tiles up to 32kg/m2. Over 90% of wall tiles comprise
ceramic or porcelain tiles; and most ceramic and
porcelain tiles weigh less than 20kg/m2.
*based on annual Branz report E635: Wet Area Linings Market Report
Bo
ard
Th
ickn
ess
(mm
)
Sh
eet
Wid
th
(mm
)
2400
2700
3000
3300
3600
4200
4800
6000
Max
. kg
/m
2
TE/TE 10 1200 7.8
TE/TE 13 1200 10.2
TE/SE 10 1200 7.8
TE/SE 10 1350 7.8
GIB BRACELINE® / GIB NOISELINE®
Dual board GIB Braceline® / GIB Noiseline® is an
effective wall bracing sheet for light timber framed
buildings. It is a high performance plasterboard
designed specifically for reducing the level of sound
transmission between rooms and even between
floors in two storey homes due to its high density
core. Other benefits of this product are its 30 and
60minute fire ratings when used in fire systems and
its increased strength and stiffness gives a more solid
wall or ceiling.
Bo
ard
Th
ickn
ess
(mm
)
Sh
eet
Wid
th
(mm
)
2400
2700
3000
3300
3600
4200
4800
6000
Max
. kg
/m
2
TE/TE 10 1200 9.0
TE/TE 13 1200 12.4
TE/SE 10 1200 9.0
TE/SE 10 1350 9.0
GIB WIDELINE®
GIB Wideline® plasterboard is the ideal product for
horizontal fixing on 2.7m studs. At 1350mm wide, this
means fewer joints and a better finish.
Bo
ard
Th
ickn
ess
(mm
)
Sh
eet
Wid
th
(mm
)
2400
2700
3000
3300
3600
4200
4800
6000
Max
. kg
/m
2
GIB Wideline®
TE/SE10 1350 7.0
GIB Wideline®
TE/SE13 1350 8.7
ENVIRONMENTAL PRODUCT DECLARATION FOR GIB® PLASTERBOARD 7MARCH 2018 GIB.CO.NZ FOR MORE INFO

GIB TOUGHLINE®
GIB Toughline® is a high performance plasterboard designed specifically for use in areas requiring improved
impact resistance. GIB Toughline® is a 13mm thick high density plasterboard. A continuous fiberglass mesh is
embedded inside the back face of the board. This gives the board increased impact resistance and reduces
repair costs. GIB Toughline® is ideal for high traffic areas such as hallways, classrooms, patient rooms and offices.
Boa
rd
Thic
knes
s (m
m)
She
et W
idth
(m
m)
2400
2700
3000
3300
3600
4200
4800
6000
Max
. kg/
m2
TE/TE 13 1200 11.4
GIB ULTRALINE®
GIB Ultraline®’s special Pearlcoat coated white surface paper has a finer, smoother texture, and a special mix
of plaster and fibreglass reinforcing in its core. These features make it more solid and rigid than 10mm GIB®
standard plasterboard and result in an enhanced finish quality. GIB Ultraline® is suitable for areas of a home which
are seen most often by visitors and those living in house including entranceways, lounges and dining rooms.B
oard
Th
ickn
ess
(mm
)
She
et W
idth
(m
m)
2400
2700
3000
3300
3600
4200
4800
6000
Max
. kg/
m2
TE/TE 10 1200 7.2
TE/SE 10 1200 7.2
TE/SE 10 1350 7.2
TE/TE 13 1200 9.1
GIB FYRELINE®
GIB Fyreline® is a high performance fire resistant board with pink face paper. Its high density, modified core
resists exposure to fire longer than standard plasterboard. GIB Fyreline® systems provide from 1/2 hour to 4
hours fire protection on standard 600mm timber or steel frames.
Boa
rd
Thic
knes
s (m
m)
She
et W
idth
(m
m)
2400
2700
3000
3300
3600
4200
4800
6000
Max
. kg/
m2
TE/TE 10 1200 7.0
TE/TE 13 1200 10.7
TE/TE 16 1200 13.7
TE/TE 19 1200 16.5
ENVIRONMENTAL PRODUCT DECLARATION FOR GIB® PLASTERBOARD8 MARCH 2018GIB.CO.NZ FOR MORE INFO

GIB SUPERLINE®
The 5-in-1 GIB® Plasterboard, specially developed for situations that require multi-performance including
impact and water resistance.
GIB Superline® is ideal for: wet areas that require a higher level of durability and toughness; high traffic/wear
and tear areas that could also benefit from some water resistance; and specifying more broadly across a
project to generally improve the level of wall performance.
GIB Superline® plasterboard also features built-in anti-microbial performance- specifically included to help
ensure a cleaner, healthier environment in specialised high-hygiene environments such as hospitals.
GIB Superline® can be ordered pre-cut to match specific length or height requirements. The maximum sheet
length for a special length is 3000mm and a minimum quantity of 100 sheets applies.
Bo
ard
Th
ickn
ess
(mm
)
Sh
eet
Wid
th
(mm
)
2400
2700
3000
3300
3600
4200
4800
6000
Max
. kg
/m
2
TE/TE 13 1200 11.4
THE GIB® PERFORMANCE SYSTEM
The New Zealand Building Code (NZBC), architectural, and owner requirements can often dictate multiple
functionality for a given space. For example, bathroom walls may need wet area linings as well as provide noise
and fire separation between tenancies.
GIB Superline® has been specially developed to deliver wet area performance, noise control, as well as impact,
fire and bracing resistance.
ENVIRONMENTAL PRODUCT DECLARATION FOR GIB® PLASTERBOARD 9MARCH 2018 GIB.CO.NZ FOR MORE INFO

Table 1: Plasterboard products included in the EPD and Product componentsP
rod
uc
t
Bo
ard
we
igh
t
[kg
/m2]
Pla
ste
r
Pa
pe
r
Gyp
su
m
Sta
rch
Ve
rmic
uli
te
Cre
ne
tte
Oth
er
ma
teri
al
Calculated value
GIB® Standard10mm
6.70 90.8% 6.0% 1.9% 0.5% 0.0% 0.0% 0.9%
GIB® Standard13mm
8.76 93.2% 4.4% 1.2% 0.5% 0.0% 0.0% 0.7%
GIB Wideline®
10mm6.70 90.8% 6.0% 1.9% 0.5% 0.0% 0.0% 0.9%
GIB Wideline®
13mm8.76 93.2% 4.4% 1.2% 0.5% 0.0% 0.0% 0.7%
GIB Braceline® GIB Noiseline® 10mm
9.04 93.3% 4.1% 1.4% 0.4% 0.0% 0.0% 0.8%
GIB Braceline® GIB Noiseline®
13mm12.45 91.8% 3.0% 0.5% 0.4% 3.7% 0.0% 0.8%
GIB Aqualine®
10mm7.76 91.0% 4.9% 1.4% 0.5% 0.0% 0.0% 2.3%
GIB Aqualine®
13mm10.17 88.7% 3.7% 1.2% 0.5% 4.6% 0.0% 1.4%
GIB Ultraline®
10mm7.20 91.7% 5.3% 1.6% 0.5% 0.0% 0.0% 1.0%
GIB Ultraline®
13mm9.16 93.4% 4.1% 1.0% 0.5% 0.0% 0.0% 0.9%
GIB Toughline®
13mm12.45 83.9% 3.0% 0.5% 0.4% 3.9% 7.5% 0.8%
GIB Fyreline®
10mm7.20 91.9% 5.3% 1.6% 0.5% 0.0% 0.0% 0.7%
GIB Fyreline®
13mm10.12 89.1% 3.7% 1.1% 0.5% 4.6% 0.0% 1.0%
GIB Fyreline®
16mm14.11 90.8% 2.7% 0.4% 0.4% 4.3% 0.0% 1.4%
GIB Fyreline®
19mm16.95 89.3% 2.3% 0.4% 0.4% 6.2% 0.0% 1.4%
GIB Superline®
13mm12.44 83.5% 3.3% 0.5% 0.0% 3.8% 7.6% 1.3%
TECHNICAL INFORMATION
ENVIRONMENTAL PRODUCT DECLARATION FOR GIB® PLASTERBOARD10 MARCH 2018GIB.CO.NZ FOR MORE INFO

This EPD covers the different plasterboard products
listed in Table 1. No differentiation is made between
different edge finishes (TE/TE, both tapered; TE/SE,
1 tapered, 1 square edge) as production processes
are similar.
Table 1 lists the calculated average board weight for
the 2015/16 financial year. This calculated value may
differ slightly from GIB® specifications. It also lists
components included in the product.
None of the products in this EPD contain any
materials included on the Candidate List of
substances of very high concern under the
European REACH Regulation (EC 1907 / 2006) at a
concentration greater than 0.1% weight/weight.
All plasterboard products comply with the standard
“AS/NZS 2588 Gypsum Plasterboard” and from a
quality management perspective with ISO 9001.
Declared Unit
The declared unit is 1m2 of installed plasterboard
according to PCR 2012:01 Construction Products and
Construction Services v2.2 (2017-05-30).
As a buyer of GIB® plasterboard cannot choose which
factory it comes from, all results are presented as a
sales-weighted average from Winstone Wallboards’
two production sites (Auckland and Christchurch) in
the financial year 1 July 2015 to 30 June 2016.
Industry classification
All covered plasterboard types can be classified as
can be seen in the following table.
Classification Code Category
UN CPC Ver.2 37530
Articles of plaster or of
compositions based
on plaster
ANZSIC 2006 C203200Plaster and gypsum
product manufacturing
Table 2: Classification of plasterboard
ENVIRONMENTAL PRODUCT DECLARATION FOR GIB® PLASTERBOARD 11MARCH 2018 GIB.CO.NZ FOR MORE INFO

SYSTEM BOUNDARIES
This EPD is of the ‘cradle-to-gate’ type with options,
as shown in Table 3. The options include transport to
customer (module A4), installation (module A5) and
end-of-life processing (modules C2 and C4). Other life
cycle stages (modules B1-B7, C1, C3 and D) are either
not relevant or dependent on particular scenarios and
best modelled at the building level. The full life cycle of
GIB® plasterboard is presented in Figure 1.
Table 3: Modules included in the scope of the EPD (X = included in the EPD; MND = module not declared (such a declaration shall not be regarded as an indicator result of zero))
Pro
du
ct
sta
ge
Co
ns
tru
cti
on
pro
ce
ss
sta
ge
Us
e s
tag
e
En
d o
f li
fe s
tag
e
Be
ne
fits
an
d
loa
ds
be
yon
d t
he
sys
tem
bo
un
da
ry
Raw
mat
eria
l sup
ply
Tran
spor
t of r
aw m
ater
ials
Man
ufac
turin
g
Tran
spor
t to
cust
omer
Con
stru
ctio
n /
Inst
alla
tion
Use
Mai
nten
ance
Rep
air
Rep
lace
men
t
Ref
urbi
shm
ent
Ope
ratio
nal e
nerg
y us
e
Ope
ratio
nal w
ater
use
Dec
onst
ruct
ion
/ de
mol
ition
Tran
spor
t to
was
te p
roce
ssin
g
Was
te p
roce
ssin
g
Dis
posa
l
Reu
se-
Rec
over
y-R
ecyc
ling-
pote
ntia
l
A1 A2 A3 A4 A5 B1 B2 B3 B4 B5 B6 B7 C1 C2 C3 C4 D
X X X X X MND MND MND MND MND MND MND MND X MND X MND
Figure 1: Life cycle stages of GIB® plasterboard
Primary Energy
Resources
Water
Additives
Paper
Transport
Transport
Gypsum
Plaster
Emission
Waste
Wastewater
Plaster mill
Board plant
Gypsum mining
Distribution
Installation
End-of/life
GIB® plasterboard production
A1 A2
A3
A1
A4
A5
CZ+4
System boundary
ENVIRONMENTAL PRODUCT DECLARATION FOR GIB® PLASTERBOARD12 MARCH 2018GIB.CO.NZ FOR MORE INFO

PRODUCTION STAGE
Plasterboard is manufactured by heating gypsum in a
plaster mill (known as calcination) to remove moisture
and produce Plaster of Paris. The dry plaster powder
is then mixed with water and additives to give each
board its desired properties. The mixture is rolled out
to a uniform thickness and paper is added to the top
and bottom faces. The board is then dried, converting
the plaster back to gypsum, and cut to size ready for
distribution to the customer.
Module A1 (raw material supply) includes the
mining of gypsum in Australia, production of paper
in Australia, production of additives, generation
and transmission of electricity in New Zealand, and
generation of thermal energy from natural gas and LPG.
Module A2 (transportation) includes transport
of gypsum via rail to port and shipping in a bulk
carrier to Auckland (for the Auckland production site)
and Lyttleton (for the Christchurch production site).
Transport from port to production plant is via truck.
Transport for paper and all other additives is a mixture
of truck and sea freight.
Module A3 (manufacturing) includes production of
ancillary materials and the composting, recycling and
landfill of manufacturing waste.
CONSTRUCTION STAGE
Module A4 (distribution) includes distribution from
Winstone Wallboards manufacturing sites in Auckland
and Christchurch through its distribution centres.
GIB® plasterboard is distributed through builder’s
merchants and direct delivery to construction sites.
Module A5 (installation) includes the materials
used to install the plasterboard (plaster, jointing tape,
screws and water) and the production and disposal
of offcuts from installation, including a combination of
composting and landfill.
END-OF-LIFE STAGE
Module C2 (transport to end-of-life) includes
transport of waste plasterboard to landfill after
demolition of the wall or building where it was used.
Module C4 (disposal) includes plasterboard end-of-
life in landfill.
LIFE CYCLE INVENTORY (LCI) DATA
The Life Cycle Inventory data used in this EPD
has been collected and applied according to EN
15804:2012+A1:2013, ISO 14025 and PCR 2012:01
Construction Products and Construction Services
v2.2 (2017-05-30) of the International EPD® System.
Primary data were used for all manufacturing
operations up to the factory gate, including plaster mill
and plasterboard plant. Most of the data represent the
financial year 2015/16 (1 July 2015 to 30 June 2016),
with some additional data for substances occurring in
small volumes dated to 2012/13.
The GaBi Professional software system for life cycle
engineering developed by thinkstep AG has been
used (thinkstep 2017). All relevant background
datasets are taken from GaBi Databases 2017 and
documented online (at http://www.gabi-software.com/
support/gabi/gabi-database-2017-lci-documentation).
Most datasets have a reference year between 2013
and 2016 and all fall within the 10-year limit allowable
for generic data under EN 15804.
ENVIRONMENTAL PRODUCT DECLARATION FOR GIB® PLASTERBOARD 13MARCH 2018 GIB.CO.NZ FOR MORE INFO

KEY ASSUMPTIONS
Background data:
The following background data was used for relevant electricity grid mixes, thermal energy:
— NZ: Electricity grid mix, thinkstep, reference year 2013 — AU: Electricity grid mix, thinkstep, reference year 2013 (for operations in Australia e.g. gypsum mining)
— NZ: Thermal energy from natural gas, thinkstep, reference year 2013
— EU-27: Thermal energy from LPG, thinkstep, reference year 2013 (no NZ-specific dataset was available)
Installation (module A5)
During installation, 15% of the plasterboard is assumed to be lost as offcuts. 25% of these offcuts are sent to industrial composting and 75% to landfill. The transport distance to landfill and composting is assumed to be 50 km with capacity utilisation of 50%. The consumables shown in Table 4 are assumed based on GIB® installation guidelines.
End of life (module C2 and C4)
100% of plasterboard waste and the waste from installation materials is assumed to be sent to landfill (i.e. worst case). Plasterboard is assumed to be disposed of in a municipal landfill rather than an inert demolition waste landfill as plasterboard is not required to be separated from other waste in New Zealand. The assumed transport distance is 50 km with capacity utilisation of 50%.
Cut off criteria
Environmental impacts relating to personnel, infrastructure, and production equipment not directly consumed in the process are excluded from the system boundary as per the PCR (IEPDS 2017, section 7.5.4). All other reported data was incorporated and modelled using the best available life cycle inventory data. Only pallets for final delivery to customer were excluded from the study due to very high reuse rates.
ALLOCATION
Upstream data: For refinery products, allocation
is done by mass and net calorific value. Inventories
for electricity and thermal energy generation include
allocation by economic value for some by-products
(e.g. gypsum, boiler ash and fly ash). Allocation by
energy is applied for co-generation of heat and power.
For materials and chemicals, the allocation rule most
suitable for the product is applied (see thinkstep 2017).
Manufacturing: The share of inputs used per product
were based on bills of materials. Allocation of all inputs
in the plasterboard plant was done on a mass basis,
except for electricity which was done on an area basis
(i.e. per square metre of board).
Material recycling (cut-off approach): Any open
scrap inputs into manufacturing remain unconnected.
The system boundary at end of life is drawn after
scrap collection to account for the collection rate,
which generates an open scrap output for the product
system. The processing and recycling of the scrap is
associated with the subsequent product system and
is not considered in this study.
Energy recovery from landfill (cut-off approach):
The system boundary includes the waste incineration
and landfilling processes following the polluter-pays-
principle. In cases where materials are sent to landfills,
they are linked to an inventory that accounts for waste
composition, regional leakage rates, landfill gas capture
as well as utilisation rates (flaring vs. power production).
No credits for power or heat production are given.
RESULTS OF ASSESSMENTAn introduction to each environmental indicator is provided below. The best-known effect of each indicator is listed to the right of its name. Note: All indicators represent the potential to cause
environmental impacts; they do not predict if specific environmental thresholds, safety margins or risks will be exceeded. The actual impacts on the environment typically depend upon local, regional and/or global conditions.
Amount per m2 of plasterboard Unit
Jointing compound 0.1924 kg
Jointing tape 0.0108 kg
Screws (8 screws, each 2.6 g) 0.0208 kg
Water 0.1202 L
Table 4: Consumables assumed for installation
ENVIRONMENTAL PRODUCT DECLARATION FOR GIB® PLASTERBOARD14 MARCH 2018GIB.CO.NZ FOR MORE INFO

Global Warming Potential (GWP) -> Climate Change
A measure of greenhouse gas emissions, such as carbon dioxide and methane. These emissions increase absorption of radiation emitted by the earth, intensifying the natural greenhouse effect.
Ozone Depletion Potential (ODP) -> Ozone Hole
A measure of air emissions that contribute to the depletion of the stratospheric ozone layer, causing higher levels of ultraviolet B (UVB) to reach the earth’s surface with detrimental effects on humans, animals and plants.
Acidification Potential (AP) -> Acid Rain
A measure of emissions that cause acidifying effects to the environment. Acidification potential is a measure of a molecule’s capacity to increase the hydrogen ion (H+) concentration in the presence of water, thus decreasing the pH value. Potential effects include fish mortality, forest decline and the deterioration of building materials.
Eutrophication Potential (EP) -> Algal Blooms
A measure of nutrient enrichment that may cause an undesirable shift in species composition and elevated biomass production in both aquatic and terrestrial ecosystems. It includes potential impacts of excessively high levels of macronutrients, the most important of which are nitrogen (N) and phosphorus (P).
Photochemical Ozone Creation Potential (POCP) -> Smog
A measure of emissions of precursors that contribute to ground level smog formation (mainly ozone O3), produced by the reaction of volatile organic compounds (VOCs) and carbon monoxide in the presence of nitrogen oxides under the influence of UV light. Ground level ozone may be harmful to human and ecosystem health and may also damage crops.
Abiotic Depletion Potential (ADP) -> Resource Consumption
The consumption of non-renewable resources leads to a decrease in the future availability of the functions supplied by these resources. Depletion of mineral resource elements (ADPE) and non-renewable fossil energy resources (ADPF) are reported separately.
ENVIRONMENTAL PRODUCT DECLARATION FOR GIB® PLASTERBOARD 15MARCH 2018 GIB.CO.NZ FOR MORE INFO

GIB® STANDARD 10MM
Production Distribution Installation End-of-life
Environmental impact Unit A1-A3 A4 A5 C2 C4
Global warming potential (total) kg CO2-eq. 1.08E+00 1.73E-01 5.505E-01 3.14E-02 1.85E+00
Global warming potential (fossil) kg CO2-eq. 1.87E+00 1.68E-01 5.090E-01 3.05E-02 5.74E-01
Global warming potential (biogenic) kg CO2-eq. -7.91E-01 4.77E-03 4.15E-02 8.93E-04 1.28E+00
Depletion potential of the stratospheric ozone layer kg CFC11-eq. 1.27E-11 1.85E-15 3.125E-12 3.03E-16 2.87E-13
Acidification potential of land and water kg SO2-eq. 7.28E-03 6.47E-04 1.984E-03 1.35E-04 1.82E-03
Eutrophication potential kg PO43--eq. 1.10E-03 1.50E-04 3.119E-04 3.22E-05 4.06E-04
Photochemical ozone creation potential kg C2H4-eq. 5.74E-04 -2.55E-04 1.408E-04 -5.70E-05 3.98E-04
Abiotic depletion potential – elements kg Sb-eq. 9.06E-07 4.52E-09 4.855E-07 4.38E-10 4.35E-08
Abiotic depletion potential – fossil fuels MJ 2.73E+01 2.34E+00 7.153E+00 4.26E-01 8.21E+00
Resource use Unit A1-A3 A4 A5 C2 C4
Renewable primary energy as energy carrier MJ 1.19E+01 1.88E-01 2.18E+00 7.67E-03 7.93E-01
Renewable primary energy resources as material utilisation MJ 8.40E+00 0.00E+00 1.323E+00 0.00E+00 0.00E+00
Total use of renewable primary energy resources MJ 2.03E+01 1.88E-01 3.507E+00 7.67E-03 7.93E-01
Non-renewable primary energy as energy carrier MJ 2.77E+01 2.34E+00 7.29E+00 4.26E-01 8.37E+00
Non-renewable primary energy as material utilisation MJ 0.00E+00 0.00E+00 0.00E+00 0.00E+00 0.00E+00
Total use of non-renewable primary energy resources MJ 2.77E+01 2.34E+00 7.286E+00 4.26E-01 8.37E+00
Use of secondary material kg 0.00E+00 0.00E+00 0.00E+00 0.00E+00 0.00E+00
Use of renewable secondary fuels MJ 0.00E+00 0.00E+00 0.00E+00 0.00E+00 0.00E+00
Use of non-renewable secondary fuels MJ 0.00E+00 0.00E+00 0.00E+00 0.00E+00 0.00E+00
Use of net fresh water m3 1.98E-02 4.175E-04 4.113E-03 4.14E-06 7.45E-04
Waste categories and output flows Unit A1-A3 A4 A5 C2 C4
Hazardous waste disposed kg 8.41E-07 1.97E-10 1.553E-07 2.94E-11 1.49E-08
Non-hazardous waste disposed kg 3.67E-02 4.23E-05 7.178E-01 2.13E-06 5.65E+00
Radioactive waste disposed kg 1.23E-04 5.13E-08 5.258E-05 6.94E-09 6.35E-05
Components for re-use kg 0.00E+00 0.00E+00 0.00E+00 0.00E+00 0.00E+00
Materials for recycling kg 1.50E-01 0.00E+00 3.220E-01 0.00E+00 0.00E+00
Materials for energy recovery kg 0.00E+00 0.00E+00 0.00E+00 0.00E+00 0.00E+00
Exported electrical energy MJ 0.00E+00 0.00E+00 0.00E+00 0.00E+00 0.00E+00
Exported thermal energy MJ 0.00E+00 0.00E+00 0.00E+00 0.00E+00 0.00E+00
RELATIVE CONTRIBUTIONS Production Distribution Installation End-of-life
Environmental impact A1-A3 A4 A5 C2 C4
Global warming potential (total) 29.3% 4.7% 14.9% 0.9% 50.2%
Global warming potential (fossil) 59.3% 5.3% 16.2% 1.0% 18.2%
Global warming potential (biogenic) -148.4% 0.9% 7.8% 0.2% 239.6%
Depletion potential of the stratospheric ozone layer 78.8% 0.0% 19.4% 0.0% 1.8%
Acidification potential of land and water 61.3% 5.5% 16.7% 1.1% 15.3%
Eutrophication potential 55.0% 7.5% 15.6% 1.6% 20.3%
Photochemical ozone creation potential 71.7% -31.9% 17.6% -7.1% 49.7%
Abiotic depletion potential – elements 62.9% 0.3% 33.7% 0.0% 3.0%
Abiotic depletion potential – fossil fuels 60.1% 5.1% 15.7% 0.9% 18.1%
ENVIRONMENTAL PRODUCT DECLARATION FOR GIB® PLASTERBOARD16 MARCH 2018GIB.CO.NZ FOR MORE INFO

GIB® STANDARD 13MM
Production Distribution Installation End-of-life
Environmental impact Unit A1-A3 A4 A5 C2 C4
Global warming potential (total) kg CO2-eq. 1.57E+00 2.26E-01 6.694E-01 4.07E-02 2.02E+00
Global warming potential (fossil) kg CO2-eq. 2.36E+00 2.20E-01 6.273E-01 3.95E-02 7.39E-01
Global warming potential (biogenic) kg CO2-eq. -7.92E-01 6.24E-03 4.20E-02 1.15E-03 1.28E+00
Depletion potential of the stratospheric ozone layer kg CFC11-eq. 1.36E-11 2.42E-15 3.306E-12 3.92E-16 3.69E-13
Acidification potential of land and water kg SO2-eq. 9.23E-03 8.46E-04 2.430E-03 1.75E-04 2.31E-03
Eutrophication potential kg PO43--eq. 1.37E-03 1.96E-04 3.769E-04 4.17E-05 4.71E-04
Photochemical ozone creation potential kg C2H4-eq. 7.49E-04 -3.34E-04 1.633E-04 -7.37E-05 4.43E-04
Abiotic depletion potential – elements kg Sb-eq. 1.15E-06 5.92E-09 5.299E-07 5.66E-10 5.60E-08
Abiotic depletion potential – fossil fuels MJ 3.44E+01 3.06E+00 8.847E+00 5.52E-01 1.06E+01
Resource use Unit A1-A3 A4 A5 C2 C4
Renewable primary energy as energy carrier MJ 1.25E+01 2.46E-01 2.32E+00 9.92E-03 1.02E+00
Renewable primary energy resources as material utilisation MJ 8.40E+00 0.00E+00 1.323E+00 0.00E+00 0.00E+00
Total use of renewable primary energy resources MJ 2.08E+01 2.46E-01 3.647E+00 9.92E-03 1.02E+00
Non-renewable primary energy as energy carrier MJ 3.48E+01 3.06E+00 8.99E+00 5.52E-01 1.08E+01
Non-renewable primary energy as material utilisation MJ 0.00E+00 0.00E+00 0.00E+00 0.00E+00 0.00E+00
Total use of non-renewable primary energy resources MJ 3.48E+01 3.06E+00 8.990E+00 5.52E-01 1.08E+01
Use of secondary material kg 0.00E+00 0.00E+00 0.00E+00 0.00E+00 0.00E+00
Use of renewable secondary fuels MJ 0.00E+00 0.00E+00 0.00E+00 0.00E+00 0.00E+00
Use of non-renewable secondary fuels MJ 0.00E+00 0.00E+00 0.00E+00 0.00E+00 0.00E+00
Use of net fresh water m3 2.35E-02 5.464E-04 4.824E-03 5.35E-06 9.12E-04
Waste categories and output flows Unit A1-A3 A4 A5 C2 C4
Hazardous waste disposed kg 1.06E-06 2.58E-10 1.941E-07 3.80E-11 1.92E-08
Non-hazardous waste disposed kg 4.70E-02 5.53E-05 9.512E-01 2.75E-06 7.40E+00
Radioactive waste disposed kg 1.31E-04 6.71E-08 5.634E-05 8.98E-09 8.16E-05
Components for re-use kg 0.00E+00 0.00E+00 0.00E+00 0.00E+00 0.00E+00
Materials for recycling kg 1.99E-01 0.00E+00 4.218E-01 0.00E+00 0.00E+00
Materials for energy recovery kg 0.00E+00 0.00E+00 0.00E+00 0.00E+00 0.00E+00
Exported electrical energy MJ 0.00E+00 0.00E+00 0.00E+00 0.00E+00 0.00E+00
Exported thermal energy MJ 0.00E+00 0.00E+00 0.00E+00 0.00E+00 0.00E+00
RELATIVE CONTRIBUTIONS Production Distribution Installation End-of-life
Environmental impact A1-A3 A4 A5 C2 C4
Global warming potential (total) 34.7% 5.0% 14.8% 0.9% 44.6%
Global warming potential (fossil) 59.2% 5.5% 15.7% 1.0% 18.5%
Global warming potential (biogenic) -147.6% 1.2% 7.8% 0.2% 238.3%
Depletion potential of the stratospheric ozone layer 78.8% 0.0% 19.1% 0.0% 2.1%
Acidification potential of land and water 61.6% 5.6% 16.2% 1.2% 15.4%
Eutrophication potential 55.9% 8.0% 15.3% 1.7% 19.2%
Photochemical ozone creation potential 79.1% -35.3% 17.3% -7.8% 46.8%
Abiotic depletion potential – elements 65.9% 0.3% 30.5% 0.0% 3.2%
Abiotic depletion potential – fossil fuels 59.9% 5.3% 15.4% 1.0% 18.4%
ENVIRONMENTAL PRODUCT DECLARATION FOR GIB® PLASTERBOARD 17MARCH 2018 GIB.CO.NZ FOR MORE INFO

GIB WIDELINE® 10MM
Production Distribution Installation End-of-life
Environmental impact Unit A1-A3 A4 A5 C2 C4
Global warming potential (total) kg CO2-eq. 1.08E+00 1.73E-01 5.508E-01 3.14E-02 1.85E+00
Global warming potential (fossil) kg CO2-eq. 1.87E+00 1.68E-01 5.093E-01 3.05E-02 5.74E-01
Global warming potential (biogenic) kg CO2-eq. -7.91E-01 4.77E-03 4.15E-02 8.93E-04 1.28E+00
Depletion potential of the stratospheric ozone layer kg CFC11-eq. 1.27E-11 1.85E-15 3.125E-12 3.03E-16 2.87E-13
Acidification potential of land and water kg SO2-eq. 7.28E-03 6.47E-04 1.985E-03 1.35E-04 1.82E-03
Eutrophication potential kg PO43--eq. 1.10E-03 1.50E-04 3.118E-04 3.22E-05 4.06E-04
Photochemical ozone creation potential kg C2H4-eq. 5.75E-04 -2.55E-04 1.409E-04 -5.70E-05 3.98E-04
Abiotic depletion potential – elements kg Sb-eq. 9.06E-07 4.52E-09 4.855E-07 4.38E-10 4.35E-08
Abiotic depletion potential – fossil fuels MJ 2.74E+01 2.34E+00 7.155E+00 4.26E-01 8.21E+00
Resource use Unit A1-A3 A4 A5 C2 C4
Renewable primary energy as energy carrier MJ 1.19E+01 1.88E-01 2.18E+00 7.67E-03 7.93E-01
Renewable primary energy resources as material utilisation MJ 8.40E+00 0.00E+00 1.323E+00 0.00E+00 0.00E+00
Total use of renewable primary energy resources MJ 2.03E+01 1.88E-01 3.507E+00 7.67E-03 7.93E-01
Non-renewable primary energy as energy carrier MJ 2.77E+01 2.34E+00 7.29E+00 4.26E-01 8.37E+00
Non-renewable primary energy as material utilisation MJ 0.00E+00 0.00E+00 0.00E+00 0.00E+00 0.00E+00
Total use of non-renewable primary energy resources MJ 2.77E+01 2.34E+00 7.288E+00 4.26E-01 8.37E+00
Use of secondary material kg 0.00E+00 0.00E+00 0.00E+00 0.00E+00 0.00E+00
Use of renewable secondary fuels MJ 0.00E+00 0.00E+00 0.00E+00 0.00E+00 0.00E+00
Use of non-renewable secondary fuels MJ 0.00E+00 0.00E+00 0.00E+00 0.00E+00 0.00E+00
Use of net fresh water m3 1.98E-02 4.175E-04 4.114E-03 4.14E-06 7.45E-04
Waste categories and output flows Unit A1-A3 A4 A5 C2 C4
Hazardous waste disposed kg 8.41E-07 1.97E-10 1.553E-07 2.94E-11 1.49E-08
Non-hazardous waste disposed kg 3.68E-02 4.23E-05 7.178E-01 2.13E-06 5.65E+00
Radioactive waste disposed kg 1.23E-04 5.13E-08 5.260E-05 6.94E-09 6.35E-05
Components for re-use kg 0.00E+00 0.00E+00 0.00E+00 0.00E+00 0.00E+00
Materials for recycling kg 1.50E-01 0.00E+00 3.220E-01 0.00E+00 0.00E+00
Materials for energy recovery kg 0.00E+00 0.00E+00 0.00E+00 0.00E+00 0.00E+00
Exported electrical energy MJ 0.00E+00 0.00E+00 0.00E+00 0.00E+00 0.00E+00
Exported thermal energy MJ 0.00E+00 0.00E+00 0.00E+00 0.00E+00 0.00E+00
RELATIVE CONTRIBUTIONS Production Distribution Installation End-of-life
Environmental impact A1-A3 A4 A5 C2 C4
Global warming potential (total) 29.3% 4.7% 14.9% 0.9% 50.2%
Global warming potential (fossil) 59.3% 5.3% 16.2% 1.0% 18.2%
Global warming potential (biogenic) -148.4% 0.9% 7.8% 0.2% 239.6%
Depletion potential of the stratospheric ozone layer 78.8% 0.0% 19.4% 0.0% 1.8%
Acidification potential of land and water 61.4% 5.5% 16.7% 1.1% 15.3%
Eutrophication potential 55.0% 7.5% 15.6% 1.6% 20.3%
Photochemical ozone creation potential 71.7% -31.9% 17.6% -7.1% 49.7%
Abiotic depletion potential – elements 62.9% 0.3% 33.7% 0.0% 3.0%
Abiotic depletion potential – fossil fuels 60.1% 5.1% 15.7% 0.9% 18.1%
ENVIRONMENTAL PRODUCT DECLARATION FOR GIB® PLASTERBOARD18 MARCH 2018GIB.CO.NZ FOR MORE INFO

GIB WIDELINE® 13MM
Production Distribution Installation End-of-life
Environmental impact Unit A1-A3 A4 A5 C2 C4
Global warming potential (total) kg CO2-eq. 1.62E+00 2.26E-01 6.774E-01 4.07E-02 2.02E+00
Global warming potential (fossil) kg CO2-eq. 2.41E+00 2.20E-01 6.353E-01 3.95E-02 7.39E-01
Global warming potential (biogenic) kg CO2-eq. -7.92E-01 6.24E-03 4.21E-02 1.15E-03 1.28E+00
Depletion potential of the stratospheric ozone layer kg CFC11-eq. 1.37E-11 2.42E-15 3.318E-12 3.92E-16 3.69E-13
Acidification potential of land and water kg SO2-eq. 9.34E-03 8.46E-04 2.449E-03 1.75E-04 2.31E-03
Eutrophication potential kg PO43--eq. 1.37E-03 1.96E-04 3.758E-04 4.17E-05 4.71E-04
Photochemical ozone creation potential kg C2H4-eq. 7.70E-04 -3.34E-04 1.671E-04 -7.37E-05 4.43E-04
Abiotic depletion potential – elements kg Sb-eq. 1.15E-06 5.92E-09 5.305E-07 5.66E-10 5.60E-08
Abiotic depletion potential – fossil fuels MJ 3.48E+01 3.06E+00 8.914E+00 5.52E-01 1.06E+01
Resource use Unit A1-A3 A4 A5 C2 C4
Renewable primary energy as energy carrier MJ 1.25E+01 2.46E-01 2.33E+00 9.92E-03 1.02E+00
Renewable primary energy resources as material utilisation MJ 8.40E+00 0.00E+00 1.324E+00 0.00E+00 0.00E+00
Total use of renewable primary energy resources MJ 2.09E+01 2.46E-01 3.656E+00 9.92E-03 1.02E+00
Non-renewable primary energy as energy carrier MJ 3.52E+01 3.06E+00 9.06E+00 5.52E-01 1.08E+01
Non-renewable primary energy as material utilisation MJ 0.00E+00 0.00E+00 0.00E+00 0.00E+00 0.00E+00
Total use of non-renewable primary energy resources MJ 3.52E+01 3.06E+00 9.058E+00 5.52E-01 1.08E+01
Use of secondary material kg 0.00E+00 0.00E+00 0.00E+00 0.00E+00 0.00E+00
Use of renewable secondary fuels MJ 0.00E+00 0.00E+00 0.00E+00 0.00E+00 0.00E+00
Use of non-renewable secondary fuels MJ 0.00E+00 0.00E+00 0.00E+00 0.00E+00 0.00E+00
Use of net fresh water m3 2.37E-02 5.464E-04 4.845E-03 5.35E-06 9.12E-04
Waste categories and output flows Unit A1-A3 A4 A5 C2 C4
Hazardous waste disposed kg 1.06E-06 2.58E-10 1.941E-07 3.80E-11 1.92E-08
Non-hazardous waste disposed kg 4.96E-02 5.53E-05 9.517E-01 2.75E-06 7.40E+00
Radioactive waste disposed kg 1.34E-04 6.71E-08 5.693E-05 8.98E-09 8.16E-05
Components for re-use kg 0.00E+00 0.00E+00 0.00E+00 0.00E+00 0.00E+00
Materials for recycling kg 2.02E-01 0.00E+00 4.224E-01 0.00E+00 0.00E+00
Materials for energy recovery kg 0.00E+00 0.00E+00 0.00E+00 0.00E+00 0.00E+00
Exported electrical energy MJ 0.00E+00 0.00E+00 0.00E+00 0.00E+00 0.00E+00
Exported thermal energy MJ 0.00E+00 0.00E+00 0.00E+00 0.00E+00 0.00E+00
RELATIVE CONTRIBUTIONS Production Distribution Installation End-of-life
Environmental impact A1-A3 A4 A5 C2 C4
Global warming potential (total) 35.3% 4.9% 14.8% 0.9% 44.1%
Global warming potential (fossil) 59.6% 5.4% 15.7% 1.0% 18.3%
Global warming potential (biogenic) -147.4% 1.2% 7.8% 0.2% 238.2%
Depletion potential of the stratospheric ozone layer 78.8% 0.0% 19.1% 0.0% 2.1%
Acidification potential of land and water 61.7% 5.6% 16.2% 1.2% 15.3%
Eutrophication potential 55.8% 8.0% 15.3% 1.7% 19.2%
Photochemical ozone creation potential 79.2% -34.4% 17.2% -7.6% 45.6%
Abiotic depletion potential – elements 66.0% 0.3% 30.4% 0.0% 3.2%
Abiotic depletion potential – fossil fuels 60.1% 5.3% 15.4% 1.0% 18.2%
ENVIRONMENTAL PRODUCT DECLARATION FOR GIB® PLASTERBOARD 19MARCH 2018 GIB.CO.NZ FOR MORE INFO

GIB AQUALINE® 10MM
Production Distribution Installation End-of-life
Environmental impact Unit A1-A3 A4 A5 C2 C4
Global warming potential (total) kg CO2-eq. 1.40E+00 2.00E-01 6.028E-01 3.62E-02 1.79E+00
Global warming potential (fossil) kg CO2-eq. 2.15E+00 1.95E-01 5.641E-01 3.52E-02 5.74E-01
Global warming potential (biogenic) kg CO2-eq. -7.51E-01 5.53E-03 3.88E-02 1.03E-03 1.21E+00
Depletion potential of the stratospheric ozone layer kg CFC11-eq. 1.26E-11 2.14E-15 3.121E-12 3.49E-16 2.86E-13
Acidification potential of land and water kg SO2-eq. 8.58E-03 7.49E-04 2.235E-03 1.56E-04 1.83E-03
Eutrophication potential kg PO43--eq. 1.27E-03 1.73E-04 3.448E-04 3.71E-05 3.99E-04
Photochemical ozone creation potential kg C2H4-eq. 6.91E-04 -2.96E-04 1.529E-04 -6.56E-05 3.88E-04
Abiotic depletion potential – elements kg Sb-eq. 2.00E-06 5.24E-09 6.782E-07 5.04E-10 4.33E-08
Abiotic depletion potential – fossil fuels MJ 3.16E+01 2.71E+00 7.979E+00 4.91E-01 8.21E+00
Resource use Unit A1-A3 A4 A5 C2 C4
Renewable primary energy as energy carrier MJ 1.19E+01 2.18E-01 2.21E+00 8.83E-03 7.89E-01
Renewable primary energy resources as material utilisation MJ 7.97E+00 0.00E+00 1.267E+00 0.00E+00 0.00E+00
Total use of renewable primary energy resources MJ 1.99E+01 2.18E-01 3.478E+00 8.83E-03 7.89E-01
Non-renewable primary energy as energy carrier MJ 3.20E+01 2.71E+00 8.13E+00 4.91E-01 8.37E+00
Non-renewable primary energy as material utilisation MJ 0.00E+00 0.00E+00 0.00E+00 0.00E+00 0.00E+00
Total use of non-renewable primary energy resources MJ 3.20E+01 2.71E+00 8.126E+00 4.91E-01 8.37E+00
Use of secondary material kg 0.00E+00 0.00E+00 0.00E+00 0.00E+00 0.00E+00
Use of renewable secondary fuels MJ 0.00E+00 0.00E+00 0.00E+00 0.00E+00 0.00E+00
Use of non-renewable secondary fuels MJ 0.00E+00 0.00E+00 0.00E+00 0.00E+00 0.00E+00
Use of net fresh water m3 2.13E-02 4.838E-04 4.385E-03 4.76E-06 7.35E-04
Waste categories and output flows Unit A1-A3 A4 A5 C2 C4
Hazardous waste disposed kg 1.15E-06 2.28E-10 2.092E-07 3.38E-11 1.48E-08
Non-hazardous waste disposed kg 4.69E-02 4.90E-05 8.426E-01 2.45E-06 6.58E+00
Radioactive waste disposed kg 1.55E-04 5.94E-08 5.815E-05 7.99E-09 6.31E-05
Components for re-use kg 0.00E+00 0.00E+00 0.00E+00 0.00E+00 0.00E+00
Materials for recycling kg 1.73E-01 0.00E+00 3.728E-01 0.00E+00 0.00E+00
Materials for energy recovery kg 0.00E+00 0.00E+00 0.00E+00 0.00E+00 0.00E+00
Exported electrical energy MJ 0.00E+00 0.00E+00 0.00E+00 0.00E+00 0.00E+00
Exported thermal energy MJ 0.00E+00 0.00E+00 0.00E+00 0.00E+00 0.00E+00
RELATIVE CONTRIBUTIONS Production Distribution Installation End-of-life
Environmental impact A1-A3 A4 A5 C2 C4
Global warming potential (total) 34.8% 5.0% 15.0% 0.9% 44.4%
Global warming potential (fossil) 61.1% 5.5% 16.0% 1.0% 16.3%
Global warming potential (biogenic) -147.5% 1.1% 7.6% 0.2% 238.6%
Depletion potential of the stratospheric ozone layer 78.8% 0.0% 19.4% 0.0% 1.8%
Acidification potential of land and water 63.3% 5.5% 16.5% 1.2% 13.5%
Eutrophication potential 57.1% 7.8% 15.5% 1.7% 17.9%
Photochemical ozone creation potential 79.4% -34.0% 17.6% -7.5% 44.6%
Abiotic depletion potential – elements 73.3% 0.2% 24.9% 0.0% 1.6%
Abiotic depletion potential – fossil fuels 62.0% 5.3% 15.6% 1.0% 16.1%
ENVIRONMENTAL PRODUCT DECLARATION FOR GIB® PLASTERBOARD20 MARCH 2018GIB.CO.NZ FOR MORE INFO

GIB AQUALINE® 13MM
Production Distribution Installation End-of-life
Environmental impact Unit A1-A3 A4 A5 C2 C4
Global warming potential (total) kg CO2-eq. 2.14E+00 2.62E-01 7.712E-01 4.69E-02 1.98E+00
Global warming potential (fossil) kg CO2-eq. 2.91E+00 2.55E-01 7.305E-01 4.56E-02 7.39E-01
Global warming potential (biogenic) kg CO2-eq. -7.70E-01 7.24E-03 4.07E-02 1.33E-03 1.25E+00
Depletion potential of the stratospheric ozone layer kg CFC11-eq. 1.43E-11 2.81E-15 3.420E-12 4.52E-16 3.68E-13
Acidification potential of land and water kg SO2-eq. 1.42E-02 9.82E-04 3.333E-03 2.02E-04 2.34E-03
Eutrophication potential kg PO43--eq. 1.96E-03 2.27E-04 4.858E-04 4.81E-05 4.70E-04
Photochemical ozone creation potential kg C2H4-eq. 1.09E-03 -3.88E-04 2.134E-04 -8.51E-05 4.39E-04
Abiotic depletion potential – elements kg Sb-eq. 2.43E-06 6.86E-09 7.564E-07 6.54E-10 5.57E-08
Abiotic depletion potential – fossil fuels MJ 4.21E+01 3.55E+00 1.030E+01 6.36E-01 1.06E+01
Resource use Unit A1-A3 A4 A5 C2 C4
Renewable primary energy as energy carrier MJ 1.35E+01 2.85E-01 2.53E+00 1.14E-02 1.02E+00
Renewable primary energy resources as material utilisation MJ 8.17E+00 0.00E+00 1.293E+00 0.00E+00 0.00E+00
Total use of renewable primary energy resources MJ 2.17E+01 2.85E-01 3.824E+00 1.14E-02 1.02E+00
Non-renewable primary energy as energy carrier MJ 4.27E+01 3.55E+00 1.05E+01 6.36E-01 1.08E+01
Non-renewable primary energy as material utilisation MJ 0.00E+00 0.00E+00 0.00E+00 0.00E+00 0.00E+00
Total use of non-renewable primary energy resources MJ 4.27E+01 3.55E+00 1.049E+01 6.36E-01 1.08E+01
Use of secondary material kg 0.00E+00 0.00E+00 0.00E+00 0.00E+00 0.00E+00
Use of renewable secondary fuels MJ 0.00E+00 0.00E+00 0.00E+00 0.00E+00 0.00E+00
Use of non-renewable secondary fuels MJ 0.00E+00 0.00E+00 0.00E+00 0.00E+00 0.00E+00
Use of net fresh water m3 2.60E-02 6.339E-04 5.277E-03 6.18E-06 9.05E-04
Waste categories and output flows Unit A1-A3 A4 A5 C2 C4
Hazardous waste disposed kg 1.24E-06 2.99E-10 2.255E-07 4.39E-11 1.91E-08
Non-hazardous waste disposed kg 6.37E-02 6.42E-05 1.123E+00 3.18E-06 8.68E+00
Radioactive waste disposed kg 2.39E-04 7.78E-08 7.546E-05 1.04E-08 8.12E-05
Components for re-use kg 0.00E+00 0.00E+00 0.00E+00 0.00E+00 0.00E+00
Materials for recycling kg 2.29E-01 0.00E+00 4.891E-01 0.00E+00 0.00E+00
Materials for energy recovery kg 0.00E+00 0.00E+00 0.00E+00 0.00E+00 0.00E+00
Exported electrical energy MJ 0.00E+00 0.00E+00 0.00E+00 0.00E+00 0.00E+00
Exported thermal energy MJ 0.00E+00 0.00E+00 0.00E+00 0.00E+00 0.00E+00
RELATIVE CONTRIBUTIONS Production Distribution Installation End-of-life
Environmental impact A1-A3 A4 A5 C2 C4
Global warming potential (total) 41.1% 5.0% 14.8% 0.9% 38.1%
Global warming potential (fossil) 62.2% 5.4% 15.6% 1.0% 15.8%
Global warming potential (biogenic) -146.7% 1.4% 7.8% 0.3% 237.3%
Depletion potential of the stratospheric ozone layer 79.0% 0.0% 18.9% 0.0% 2.0%
Acidification potential of land and water 67.4% 4.7% 15.8% 1.0% 11.1%
Eutrophication potential 61.4% 7.1% 15.2% 1.5% 14.7%
Photochemical ozone creation potential 85.8% -30.6% 16.8% -6.7% 34.6%
Abiotic depletion potential – elements 74.8% 0.2% 23.3% 0.0% 1.7%
Abiotic depletion potential – fossil fuels 62.7% 5.3% 15.3% 0.9% 15.7%
ENVIRONMENTAL PRODUCT DECLARATION FOR GIB® PLASTERBOARD 21MARCH 2018 GIB.CO.NZ FOR MORE INFO

GIB BRACELINE® GIB NOISELINE® 10MM
Production Distribution Installation End-of-life
Environmental impact Unit A1-A3 A4 A5 C2 C4
Global warming potential (total) kg CO2-eq. 1.62E+00 2.33E-01 6.458E-01 4.19E-02 1.77E+00
Global warming potential (fossil) kg CO2-eq. 2.36E+00 2.27E-01 6.078E-01 4.07E-02 5.75E-01
Global warming potential (biogenic) kg CO2-eq. -7.40E-01 6.44E-03 3.80E-02 1.19E-03 1.20E+00
Depletion potential of the stratospheric ozone layer kg CFC11-eq. 1.23E-11 2.50E-15 3.054E-12 4.04E-16 2.85E-13
Acidification potential of land and water kg SO2-eq. 9.51E-03 8.73E-04 2.426E-03 1.81E-04 1.86E-03
Eutrophication potential kg PO43--eq. 1.39E-03 2.02E-04 3.721E-04 4.29E-05 4.00E-04
Photochemical ozone creation potential kg C2H4-eq. 7.51E-04 -3.45E-04 1.548E-04 -7.60E-05 3.87E-04
Abiotic depletion potential – elements kg Sb-eq. 1.18E-06 6.10E-09 5.344E-07 5.83E-10 4.31E-08
Abiotic depletion potential – fossil fuels MJ 3.47E+01 3.15E+00 8.615E+00 5.68E-01 8.23E+00
Resource use Unit A1-A3 A4 A5 C2 C4
Renewable primary energy as energy carrier MJ 1.20E+01 2.54E-01 2.24E+00 1.02E-02 7.86E-01
Renewable primary energy resources as material utilisation MJ 7.85E+00 0.00E+00 1.250E+00 0.00E+00 0.00E+00
Total use of renewable primary energy resources MJ 1.98E+01 2.54E-01 3.487E+00 1.02E-02 7.86E-01
Non-renewable primary energy as energy carrier MJ 3.51E+01 3.15E+00 8.75E+00 5.68E-01 8.39E+00
Non-renewable primary energy as material utilisation MJ 0.00E+00 0.00E+00 0.00E+00 0.00E+00 0.00E+00
Total use of non-renewable primary energy resources MJ 3.51E+01 3.15E+00 8.755E+00 5.68E-01 8.39E+00
Use of secondary material kg 0.00E+00 0.00E+00 0.00E+00 0.00E+00 0.00E+00
Use of renewable secondary fuels MJ 0.00E+00 0.00E+00 0.00E+00 0.00E+00 0.00E+00
Use of non-renewable secondary fuels MJ 0.00E+00 0.00E+00 0.00E+00 0.00E+00 0.00E+00
Use of net fresh water m3 2.26E-02 5.636E-04 4.639E-03 5.51E-06 7.30E-04
Waste categories and output flows Unit A1-A3 A4 A5 C2 C4
Hazardous waste disposed kg 1.08E-06 2.66E-10 1.976E-07 3.92E-11 1.48E-08
Non-hazardous waste disposed kg 4.79E-02 5.71E-05 9.842E-01 2.84E-06 7.65E+00
Radioactive waste disposed kg 1.38E-04 6.92E-08 5.524E-05 9.25E-09 6.28E-05
Components for re-use kg 0.00E+00 0.00E+00 0.00E+00 0.00E+00 0.00E+00
Materials for recycling kg 2.01E-01 0.00E+00 4.343E-01 0.00E+00 0.00E+00
Materials for energy recovery kg 0.00E+00 0.00E+00 0.00E+00 0.00E+00 0.00E+00
Exported electrical energy MJ 0.00E+00 0.00E+00 0.00E+00 0.00E+00 0.00E+00
Exported thermal energy MJ 0.00E+00 0.00E+00 0.00E+00 0.00E+00 0.00E+00
RELATIVE CONTRIBUTIONS Production Distribution Installation End-of-life
Environmental impact A1-A3 A4 A5 C2 C4
Global warming potential (total) 37.6% 5.4% 15.0% 1.0% 41.0%
Global warming potential (fossil) 62.0% 5.9% 15.9% 1.1% 15.1%
Global warming potential (biogenic) -147.3% 1.3% 7.6% 0.2% 238.2%
Depletion potential of the stratospheric ozone layer 78.6% 0.0% 19.6% 0.0% 1.8%
Acidification potential of land and water 64.0% 5.9% 16.3% 1.2% 12.5%
Eutrophication potential 57.8% 8.4% 15.4% 1.8% 16.6%
Photochemical ozone creation potential 86.1% -39.5% 17.7% -8.7% 44.4%
Abiotic depletion potential – elements 66.9% 0.3% 30.3% 0.0% 2.4%
Abiotic depletion potential – fossil fuels 62.8% 5.7% 15.6% 1.0% 14.9%
ENVIRONMENTAL PRODUCT DECLARATION FOR GIB® PLASTERBOARD22 MARCH 2018GIB.CO.NZ FOR MORE INFO

GIB BRACELINE® GIB NOISELINE® 13MM
Production Distribution Installation End-of-life
Environmental impact Unit A1-A3 A4 A5 C2 C4
Global warming potential (total) kg CO2-eq. 2.57E+00 3.21E-01 8.564E-01 5.71E-02 1.97E+00
Global warming potential (fossil) kg CO2-eq. 3.33E+00 3.12E-01 8.163E-01 5.55E-02 7.42E-01
Global warming potential (biogenic) kg CO2-eq. -7.58E-01 8.87E-03 4.01E-02 1.62E-03 1.23E+00
Depletion potential of the stratospheric ozone layer kg CFC11-eq. 1.39E-11 3.44E-15 3.351E-12 5.50E-16 3.66E-13
Acidification potential of land and water kg SO2-eq. 1.58E-02 1.20E-03 3.662E-03 2.46E-04 2.39E-03
Eutrophication potential kg PO43--eq. 2.19E-03 2.78E-04 5.364E-04 5.86E-05 4.76E-04
Photochemical ozone creation potential kg C2H4-eq. 1.21E-03 -4.75E-04 2.191E-04 -1.04E-04 4.41E-04
Abiotic depletion potential – elements kg Sb-eq. 1.62E-06 8.40E-09 6.135E-07 7.96E-10 5.55E-08
Abiotic depletion potential – fossil fuels MJ 4.84E+01 4.34E+00 1.157E+01 7.75E-01 1.06E+01
Resource use Unit A1-A3 A4 A5 C2 C4
Renewable primary energy as energy carrier MJ 1.38E+01 3.49E-01 2.59E+00 1.39E-02 1.01E+00
Renewable primary energy resources as material utilisation MJ 8.04E+00 0.00E+00 1.276E+00 0.00E+00 0.00E+00
Total use of renewable primary energy resources MJ 2.18E+01 3.49E-01 3.869E+00 1.39E-02 1.01E+00
Non-renewable primary energy as energy carrier MJ 4.90E+01 4.34E+00 1.18E+01 7.75E-01 1.08E+01
Non-renewable primary energy as material utilisation MJ 0.00E+00 0.00E+00 0.00E+00 0.00E+00 0.00E+00
Total use of non-renewable primary energy resources MJ 4.90E+01 4.34E+00 1.175E+01 7.75E-01 1.08E+01
Use of secondary material kg 0.00E+00 0.00E+00 0.00E+00 0.00E+00 0.00E+00
Use of renewable secondary fuels MJ 0.00E+00 0.00E+00 0.00E+00 0.00E+00 0.00E+00
Use of non-renewable secondary fuels MJ 0.00E+00 0.00E+00 0.00E+00 0.00E+00 0.00E+00
Use of net fresh water m3 2.86E-02 7.762E-04 5.747E-03 7.52E-06 8.99E-04
Waste categories and output flows Unit A1-A3 A4 A5 C2 C4
Hazardous waste disposed kg 1.47E-06 3.67E-10 2.671E-07 5.34E-11 1.90E-08
Non-hazardous waste disposed kg 6.56E-02 7.86E-05 1.378E+00 3.87E-06 1.06E+01
Radioactive waste disposed kg 2.11E-04 9.53E-08 7.052E-05 1.26E-08 8.07E-05
Components for re-use kg 0.00E+00 0.00E+00 0.00E+00 0.00E+00 0.00E+00
Materials for recycling kg 2.80E-01 0.00E+00 5.988E-01 0.00E+00 0.00E+00
Materials for energy recovery kg 0.00E+00 0.00E+00 0.00E+00 0.00E+00 0.00E+00
Exported electrical energy MJ 0.00E+00 0.00E+00 0.00E+00 0.00E+00 0.00E+00
Exported thermal energy MJ 0.00E+00 0.00E+00 0.00E+00 0.00E+00 0.00E+00
RELATIVE CONTRIBUTIONS Production Distribution Installation End-of-life
Environmental impact A1-A3 A4 A5 C2 C4
Global warming potential (total) 44.5% 5.6% 14.8% 1.0% 34.1%
Global warming potential (fossil) 63.4% 5.9% 15.5% 1.1% 14.1%
Global warming potential (biogenic) -146.0% 1.7% 7.7% 0.3% 236.3%
Depletion potential of the stratospheric ozone layer 78.9% 0.0% 19.0% 0.0% 2.1%
Acidification potential of land and water 67.8% 5.2% 15.7% 1.1% 10.2%
Eutrophication potential 61.9% 7.9% 15.2% 1.7% 13.4%
Photochemical ozone creation potential 93.7% -36.8% 17.0% -8.0% 34.2%
Abiotic depletion potential – elements 70.5% 0.4% 26.7% 0.0% 2.4%
Abiotic depletion potential – fossil fuels 63.9% 5.7% 15.3% 1.0% 14.0%
ENVIRONMENTAL PRODUCT DECLARATION FOR GIB® PLASTERBOARD 23MARCH 2018 GIB.CO.NZ FOR MORE INFO

GIB ULTRALINE® 10MM
Production Distribution Installation End-of-life
Environmental impact Unit A1-A3 A4 A5 C2 C4
Global warming potential (total) kg CO2-eq. 1.23E+00 1.86E-01 5.708E-01 3.37E-02 1.79E+00
Global warming potential (fossil) kg CO2-eq. 1.98E+00 1.81E-01 5.320E-01 3.27E-02 5.74E-01
Global warming potential (biogenic) kg CO2-eq. -7.54E-01 5.13E-03 3.88E-02 9.57E-04 1.22E+00
Depletion potential of the stratospheric ozone layer kg CFC11-eq. 1.22E-11 1.99E-15 3.051E-12 3.25E-16 2.87E-13
Acidification potential of land and water kg SO2-eq. 7.84E-03 6.96E-04 2.093E-03 1.45E-04 1.82E-03
Eutrophication potential kg PO43--eq. 1.16E-03 1.61E-04 3.239E-04 3.45E-05 3.99E-04
Photochemical ozone creation potential kg C2H4-eq. 6.19E-04 -2.75E-04 1.440E-04 -6.11E-05 3.88E-04
Abiotic depletion potential – elements kg Sb-eq. 9.67E-07 4.86E-09 4.964E-07 4.69E-10 4.34E-08
Abiotic depletion potential – fossil fuels MJ 2.91E+01 2.51E+00 7.495E+00 4.57E-01 8.22E+00
Resource use Unit A1-A3 A4 A5 C2 C4
Renewable primary energy as energy carrier MJ 1.17E+01 2.02E-01 2.16E+00 8.22E-03 7.91E-01
Renewable primary energy resources as material utilisation MJ 8.01E+00 0.00E+00 1.271E+00 0.00E+00 0.00E+00
Total use of renewable primary energy resources MJ 1.97E+01 2.02E-01 3.435E+00 8.22E-03 7.91E-01
Non-renewable primary energy as energy carrier MJ 2.94E+01 2.51E+00 7.63E+00 4.57E-01 8.38E+00
Non-renewable primary energy as material utilisation MJ 0.00E+00 0.00E+00 0.00E+00 0.00E+00 0.00E+00
Total use of non-renewable primary energy resources MJ 2.94E+01 2.51E+00 7.631E+00 4.57E-01 8.38E+00
Use of secondary material kg 0.00E+00 0.00E+00 0.00E+00 0.00E+00 0.00E+00
Use of renewable secondary fuels MJ 0.00E+00 0.00E+00 0.00E+00 0.00E+00 0.00E+00
Use of non-renewable secondary fuels MJ 0.00E+00 0.00E+00 0.00E+00 0.00E+00 0.00E+00
Use of net fresh water m3 2.03E-02 4.490E-04 4.208E-03 4.43E-06 7.37E-04
Waste categories and output flows Unit A1-A3 A4 A5 C2 C4
Hazardous waste disposed kg 8.88E-07 2.12E-10 1.637E-07 3.15E-11 1.49E-08
Non-hazardous waste disposed kg 4.02E-02 4.55E-05 7.769E-01 2.28E-06 6.10E+00
Radioactive waste disposed kg 1.29E-04 5.51E-08 5.357E-05 7.44E-09 6.33E-05
Components for re-use kg 0.00E+00 0.00E+00 0.00E+00 0.00E+00 0.00E+00
Materials for recycling kg 1.62E-01 0.00E+00 3.463E-01 0.00E+00 0.00E+00
Materials for energy recovery kg 0.00E+00 0.00E+00 0.00E+00 0.00E+00 0.00E+00
Exported electrical energy MJ 0.00E+00 0.00E+00 0.00E+00 0.00E+00 0.00E+00
Exported thermal energy MJ 0.00E+00 0.00E+00 0.00E+00 0.00E+00 0.00E+00
RELATIVE CONTRIBUTIONS Production Distribution Installation End-of-life
Environmental impact A1-A3 A4 A5 C2 C4
Global warming potential (total) 32.3% 4.9% 15.0% 0.9% 47.0%
Global warming potential (fossil) 60.1% 5.5% 16.1% 1.0% 17.4%
Global warming potential (biogenic) -148.0% 1.0% 7.6% 0.2% 239.1%
Depletion potential of the stratospheric ozone layer 78.6% 0.0% 19.6% 0.0% 1.8%
Acidification potential of land and water 62.2% 5.5% 16.6% 1.2% 14.5%
Eutrophication potential 55.9% 7.7% 15.6% 1.7% 19.2%
Photochemical ozone creation potential 75.9% -33.7% 17.7% -7.5% 47.6%
Abiotic depletion potential – elements 64.0% 0.3% 32.8% 0.0% 2.9%
Abiotic depletion potential – fossil fuels 60.9% 5.3% 15.7% 1.0% 17.2%
ENVIRONMENTAL PRODUCT DECLARATION FOR GIB® PLASTERBOARD24 MARCH 2018GIB.CO.NZ FOR MORE INFO

GIB ULTRALINE® 13MM
Production Distribution Installation End-of-life
Environmental impact Unit A1-A3 A4 A5 C2 C4
Global warming potential (total) kg CO2-eq. 1.61E+00 2.36E-01 6.747E-01 4.24E-02 1.99E+00
Global warming potential (fossil) kg CO2-eq. 2.39E+00 2.30E-01 6.340E-01 4.12E-02 7.39E-01
Global warming potential (biogenic) kg CO2-eq. -7.75E-01 6.52E-03 4.07E-02 1.20E-03 1.25E+00
Depletion potential of the stratospheric ozone layer kg CFC11-eq. 1.34E-11 2.53E-15 3.266E-12 4.09E-16 3.69E-13
Acidification potential of land and water kg SO2-eq. 9.69E-03 8.84E-04 2.519E-03 1.83E-04 2.32E-03
Eutrophication potential kg PO43--eq. 1.46E-03 2.05E-04 3.924E-04 4.35E-05 4.68E-04
Photochemical ozone creation potential kg C2H4-eq. 7.52E-04 -3.49E-04 1.607E-04 -7.69E-05 4.39E-04
Abiotic depletion potential – elements kg Sb-eq. 1.20E-06 6.18E-09 5.398E-07 5.91E-10 5.59E-08
Abiotic depletion potential – fossil fuels MJ 3.54E+01 3.19E+00 9.053E+00 5.75E-01 1.06E+01
Resource use Unit A1-A3 A4 A5 C2 C4
Renewable primary energy as energy carrier MJ 1.24E+01 2.57E-01 2.32E+00 1.03E-02 1.02E+00
Renewable primary energy resources as material utilisation MJ 8.21E+00 0.00E+00 1.298E+00 0.00E+00 0.00E+00
Total use of renewable primary energy resources MJ 2.06E+01 2.57E-01 3.614E+00 1.03E-02 1.02E+00
Non-renewable primary energy as energy carrier MJ 3.58E+01 3.19E+00 9.20E+00 5.75E-01 1.08E+01
Non-renewable primary energy as material utilisation MJ 0.00E+00 0.00E+00 0.00E+00 0.00E+00 0.00E+00
Total use of non-renewable primary energy resources MJ 3.58E+01 3.19E+00 9.201E+00 5.75E-01 1.08E+01
Use of secondary material kg 0.00E+00 0.00E+00 0.00E+00 0.00E+00 0.00E+00
Use of renewable secondary fuels MJ 0.00E+00 0.00E+00 0.00E+00 0.00E+00 0.00E+00
Use of non-renewable secondary fuels MJ 0.00E+00 0.00E+00 0.00E+00 0.00E+00 0.00E+00
Use of net fresh water m3 2.39E-02 5.709E-04 4.886E-03 5.58E-06 9.08E-04
Waste categories and output flows Unit A1-A3 A4 A5 C2 C4
Hazardous waste disposed kg 1.10E-06 2.70E-10 2.009E-07 3.96E-11 1.92E-08
Non-hazardous waste disposed kg 4.72E-02 5.78E-05 9.965E-01 2.87E-06 7.75E+00
Radioactive waste disposed kg 1.43E-04 7.01E-08 5.854E-05 9.37E-09 8.15E-05
Components for re-use kg 0.00E+00 0.00E+00 0.00E+00 0.00E+00 0.00E+00
Materials for recycling kg 2.01E-01 0.00E+00 4.395E-01 0.00E+00 0.00E+00
Materials for energy recovery kg 0.00E+00 0.00E+00 0.00E+00 0.00E+00 0.00E+00
Exported electrical energy MJ 0.00E+00 0.00E+00 0.00E+00 0.00E+00 0.00E+00
Exported thermal energy MJ 0.00E+00 0.00E+00 0.00E+00 0.00E+00 0.00E+00
RELATIVE CONTRIBUTIONS Production Distribution Installation End-of-life
Environmental impact A1-A3 A4 A5 C2 C4
Global warming potential (total) 35.4% 5.2% 14.8% 0.9% 43.7%
Global warming potential (fossil) 59.2% 5.7% 15.7% 1.0% 18.3%
Global warming potential (biogenic) -147.6% 1.2% 7.7% 0.2% 238.3%
Depletion potential of the stratospheric ozone layer 78.7% 0.0% 19.2% 0.0% 2.2%
Acidification potential of land and water 62.1% 5.7% 16.2% 1.2% 14.9%
Eutrophication potential 56.8% 8.0% 15.3% 1.7% 18.3%
Photochemical ozone creation potential 81.3% -37.8% 17.4% -8.3% 47.4%
Abiotic depletion potential – elements 66.6% 0.3% 29.9% 0.0% 3.1%
Abiotic depletion potential – fossil fuels 60.2% 5.4% 15.4% 1.0% 18.0%
ENVIRONMENTAL PRODUCT DECLARATION FOR GIB® PLASTERBOARD 25MARCH 2018 GIB.CO.NZ FOR MORE INFO

GIB FYRELINE® 10MM
Production Distribution Installation End-of-life
Environmental impact Unit A1-A3 A4 A5 C2 C4
Global warming potential (total) kg CO2-eq. 1.19E+00 1.86E-01 5.631E-01 3.37E-02 1.79E+00
Global warming potential (fossil) kg CO2-eq. 1.94E+00 1.80E-01 5.242E-01 3.27E-02 5.74E-01
Global warming potential (biogenic) kg CO2-eq. -7.55E-01 5.12E-03 3.89E-02 9.56E-04 1.22E+00
Depletion potential of the stratospheric ozone layer kg CFC11-eq. 1.23E-11 1.99E-15 3.053E-12 3.24E-16 2.87E-13
Acidification potential of land and water kg SO2-eq. 7.67E-03 6.95E-04 2.064E-03 1.45E-04 1.82E-03
Eutrophication potential kg PO43--eq. 1.16E-03 1.61E-04 3.227E-04 3.45E-05 3.99E-04
Photochemical ozone creation potential kg C2H4-eq. 6.02E-04 -2.74E-04 1.411E-04 -6.11E-05 3.88E-04
Abiotic depletion potential – elements kg Sb-eq. 9.61E-07 4.86E-09 4.954E-07 4.69E-10 4.34E-08
Abiotic depletion potential – fossil fuels MJ 2.83E+01 2.51E+00 7.364E+00 4.57E-01 8.21E+00
Resource use Unit A1-A3 A4 A5 C2 C4
Renewable primary energy as energy carrier MJ 1.16E+01 2.02E-01 2.16E+00 8.21E-03 7.91E-01
Renewable primary energy resources as material utilisation MJ 8.02E+00 0.00E+00 1.273E+00 0.00E+00 0.00E+00
Total use of renewable primary energy resources MJ 1.96E+01 2.02E-01 3.430E+00 8.21E-03 7.91E-01
Non-renewable primary energy as energy carrier MJ 2.87E+01 2.51E+00 7.50E+00 4.57E-01 8.37E+00
Non-renewable primary energy as material utilisation MJ 0.00E+00 0.00E+00 0.00E+00 0.00E+00 0.00E+00
Total use of non-renewable primary energy resources MJ 2.87E+01 2.51E+00 7.497E+00 4.57E-01 8.37E+00
Use of secondary material kg 0.00E+00 0.00E+00 0.00E+00 0.00E+00 0.00E+00
Use of renewable secondary fuels MJ 0.00E+00 0.00E+00 0.00E+00 0.00E+00 0.00E+00
Use of non-renewable secondary fuels MJ 0.00E+00 0.00E+00 0.00E+00 0.00E+00 0.00E+00
Use of net fresh water m3 2.02E-02 4.487E-04 4.194E-03 4.43E-06 7.37E-04
Waste categories and output flows Unit A1-A3 A4 A5 C2 C4
Hazardous waste disposed kg 8.87E-07 2.12E-10 1.635E-07 3.15E-11 1.49E-08
Non-hazardous waste disposed kg 3.85E-02 4.54E-05 7.756E-01 2.28E-06 6.09E+00
Radioactive waste disposed kg 1.23E-04 5.51E-08 5.254E-05 7.43E-09 6.33E-05
Components for re-use kg 0.00E+00 0.00E+00 0.00E+00 0.00E+00 0.00E+00
Materials for recycling kg 1.60E-01 0.00E+00 3.458E-01 0.00E+00 0.00E+00
Materials for energy recovery kg 0.00E+00 0.00E+00 0.00E+00 0.00E+00 0.00E+00
Exported electrical energy MJ 0.00E+00 0.00E+00 0.00E+00 0.00E+00 0.00E+00
Exported thermal energy MJ 0.00E+00 0.00E+00 0.00E+00 0.00E+00 0.00E+00
RELATIVE CONTRIBUTIONS Production Distribution Installation End-of-life
Environmental impact A1-A3 A4 A5 C2 C4
Global warming potential (total) 31.5% 4.9% 15.0% 0.9% 47.7%
Global warming potential (fossil) 59.7% 5.5% 16.1% 1.0% 17.6%
Global warming potential (biogenic) -148.1% 1.0% 7.6% 0.2% 239.3%
Depletion potential of the stratospheric ozone layer 78.6% 0.0% 19.6% 0.0% 1.8%
Acidification potential of land and water 61.9% 5.6% 16.6% 1.2% 14.7%
Eutrophication potential 55.8% 7.8% 15.6% 1.7% 19.2%
Photochemical ozone creation potential 75.7% -34.5% 17.7% -7.7% 48.8%
Abiotic depletion potential – elements 63.9% 0.3% 32.9% 0.0% 2.9%
Abiotic depletion potential – fossil fuels 60.5% 5.4% 15.7% 1.0% 17.5%
ENVIRONMENTAL PRODUCT DECLARATION FOR GIB® PLASTERBOARD26 MARCH 2018GIB.CO.NZ FOR MORE INFO

GIB FYRELINE® 13MM
Production Distribution Installation End-of-life
Environmental impact Unit A1-A3 A4 A5 C2 C4
Global warming potential (total) kg CO2-eq. 2.06E+00 2.61E-01 7.587E-01 4.67E-02 1.99E+00
Global warming potential (fossil) kg CO2-eq. 2.84E+00 2.54E-01 7.177E-01 4.54E-02 7.39E-01
Global warming potential (biogenic) kg CO2-eq. -7.75E-01 7.21E-03 4.10E-02 1.33E-03 1.25E+00
Depletion potential of the stratospheric ozone layer kg CFC11-eq. 1.40E-11 2.80E-15 3.370E-12 4.50E-16 3.67E-13
Acidification potential of land and water kg SO2-eq. 1.40E-02 9.78E-04 3.306E-03 2.01E-04 2.34E-03
Eutrophication potential kg PO43--eq. 1.94E-03 2.26E-04 4.820E-04 4.79E-05 4.71E-04
Photochemical ozone creation potential kg C2H4-eq. 1.04E-03 -3.86E-04 2.053E-04 -8.48E-05 4.41E-04
Abiotic depletion potential – elements kg Sb-eq. 1.38E-06 6.83E-09 5.704E-07 6.51E-10 5.57E-08
Abiotic depletion potential – fossil fuels MJ 4.10E+01 3.53E+00 1.010E+01 6.34E-01 1.06E+01
Resource use Unit A1-A3 A4 A5 C2 C4
Renewable primary energy as energy carrier MJ 1.34E+01 2.84E-01 2.51E+00 1.14E-02 1.02E+00
Renewable primary energy resources as material utilisation MJ 8.22E+00 0.00E+00 1.300E+00 0.00E+00 0.00E+00
Total use of renewable primary energy resources MJ 2.17E+01 2.84E-01 3.812E+00 1.14E-02 1.02E+00
Non-renewable primary energy as energy carrier MJ 4.16E+01 3.53E+00 1.03E+01 6.34E-01 1.08E+01
Non-renewable primary energy as material utilisation MJ 0.00E+00 0.00E+00 0.00E+00 0.00E+00 0.00E+00
Total use of non-renewable primary energy resources MJ 4.16E+01 3.53E+00 1.029E+01 6.34E-01 1.08E+01
Use of secondary material kg 0.00E+00 0.00E+00 0.00E+00 0.00E+00 0.00E+00
Use of renewable secondary fuels MJ 0.00E+00 0.00E+00 0.00E+00 0.00E+00 0.00E+00
Use of non-renewable secondary fuels MJ 0.00E+00 0.00E+00 0.00E+00 0.00E+00 0.00E+00
Use of net fresh water m3 2.57E-02 6.311E-04 5.222E-03 6.15E-06 9.06E-04
Waste categories and output flows Unit A1-A3 A4 A5 C2 C4
Hazardous waste disposed kg 1.23E-06 2.98E-10 2.240E-07 4.37E-11 1.91E-08
Non-hazardous waste disposed kg 6.00E-02 6.39E-05 1.116E+00 3.16E-06 8.64E+00
Radioactive waste disposed kg 2.26E-04 7.75E-08 7.320E-05 1.03E-08 8.12E-05
Components for re-use kg 0.00E+00 0.00E+00 0.00E+00 0.00E+00 0.00E+00
Materials for recycling kg 2.27E-01 0.00E+00 4.866E-01 0.00E+00 0.00E+00
Materials for energy recovery kg 0.00E+00 0.00E+00 0.00E+00 0.00E+00 0.00E+00
Exported electrical energy MJ 0.00E+00 0.00E+00 0.00E+00 0.00E+00 0.00E+00
Exported thermal energy MJ 0.00E+00 0.00E+00 0.00E+00 0.00E+00 0.00E+00
RELATIVE CONTRIBUTIONS Production Distribution Installation End-of-life
Environmental impact A1-A3 A4 A5 C2 C4
Global warming potential (total) 40.3% 5.1% 14.8% 0.9% 38.9%
Global warming potential (fossil) 61.8% 5.5% 15.6% 1.0% 16.1%
Global warming potential (biogenic) -147.0% 1.4% 7.8% 0.3% 237.6%
Depletion potential of the stratospheric ozone layer 78.9% 0.0% 19.0% 0.0% 2.1%
Acidification potential of land and water 67.3% 4.7% 15.9% 1.0% 11.2%
Eutrophication potential 61.2% 7.1% 15.2% 1.5% 14.9%
Photochemical ozone creation potential 85.6% -31.8% 16.9% -7.0% 36.3%
Abiotic depletion potential – elements 68.5% 0.3% 28.4% 0.0% 2.8%
Abiotic depletion potential – fossil fuels 62.3% 5.4% 15.3% 1.0% 16.1%
ENVIRONMENTAL PRODUCT DECLARATION FOR GIB® PLASTERBOARD 27MARCH 2018 GIB.CO.NZ FOR MORE INFO

GIB FYRELINE® 16MM
Production Distribution Installation End-of-life
Environmental impact Unit A1-A3 A4 A5 C2 C4
Global warming potential (total) kg CO2-eq. 3.19E+00 3.64E-01 1.005E+00 6.46E-02 2.20E+00
Global warming potential (fossil) kg CO2-eq. 3.99E+00 3.54E-01 9.616E-01 6.27E-02 9.07E-01
Global warming potential (biogenic) kg CO2-eq. -8.01E-01 1.01E-02 4.38E-02 1.83E-03 1.30E+00
Depletion potential of the stratospheric ozone layer kg CFC11-eq. 1.60E-11 3.90E-15 3.731E-12 6.22E-16 4.48E-13
Acidification potential of land and water kg SO2-eq. 1.99E-02 1.36E-03 4.480E-03 2.78E-04 2.88E-03
Eutrophication potential kg PO43--eq. 2.63E-03 3.15E-04 6.312E-04 6.62E-05 5.49E-04
Photochemical ozone creation potential kg C2H4-eq. 1.50E-03 -5.38E-04 2.660E-04 -1.17E-04 4.98E-04
Abiotic depletion potential – elements kg Sb-eq. 1.92E-06 9.53E-09 6.687E-07 8.99E-10 6.81E-08
Abiotic depletion potential – fossil fuels MJ 5.74E+01 4.92E+00 1.356E+01 8.75E-01 1.30E+01
Resource use Unit A1-A3 A4 A5 C2 C4
Renewable primary energy as energy carrier MJ 1.53E+01 3.96E-01 2.88E+00 1.57E-02 1.24E+00
Renewable primary energy resources as material utilisation MJ 8.49E+00 0.00E+00 1.336E+00 0.00E+00 0.00E+00
Total use of renewable primary energy resources MJ 2.38E+01 3.96E-01 4.215E+00 1.57E-02 1.24E+00
Non-renewable primary energy as energy carrier MJ 5.82E+01 4.92E+00 1.38E+01 8.75E-01 1.32E+01
Non-renewable primary energy as material utilisation MJ 0.00E+00 0.00E+00 0.00E+00 0.00E+00 0.00E+00
Total use of non-renewable primary energy resources MJ 5.82E+01 4.92E+00 1.380E+01 8.75E-01 1.32E+01
Use of secondary material kg 0.00E+00 0.00E+00 0.00E+00 0.00E+00 0.00E+00
Use of renewable secondary fuels MJ 0.00E+00 0.00E+00 0.00E+00 0.00E+00 0.00E+00
Use of non-renewable secondary fuels MJ 0.00E+00 0.00E+00 0.00E+00 0.00E+00 0.00E+00
Use of net fresh water m3 3.29E-02 8.799E-04 6.549E-03 8.49E-06 1.08E-03
Waste categories and output flows Unit A1-A3 A4 A5 C2 C4
Hazardous waste disposed kg 1.66E-06 4.16E-10 3.013E-07 6.03E-11 2.33E-08
Non-hazardous waste disposed kg 9.52E-02 8.91E-05 1.572E+00 4.37E-06 1.20E+01
Radioactive waste disposed kg 3.29E-04 1.08E-07 9.362E-05 1.43E-08 9.91E-05
Components for re-use kg 0.00E+00 0.00E+00 0.00E+00 0.00E+00 0.00E+00
Materials for recycling kg 3.21E-01 0.00E+00 6.794E-01 0.00E+00 0.00E+00
Materials for energy recovery kg 0.00E+00 0.00E+00 0.00E+00 0.00E+00 0.00E+00
Exported electrical energy MJ 0.00E+00 0.00E+00 0.00E+00 0.00E+00 0.00E+00
Exported thermal energy MJ 0.00E+00 0.00E+00 0.00E+00 0.00E+00 0.00E+00
RELATIVE CONTRIBUTIONS Production Distribution Installation End-of-life
Environmental impact A1-A3 A4 A5 C2 C4
Global warming potential (total) 46.7% 5.3% 14.7% 0.9% 32.3%
Global warming potential (fossil) 63.6% 5.6% 15.3% 1.0% 14.5%
Global warming potential (biogenic) -145.5% 1.8% 8.0% 0.3% 235.4%
Depletion potential of the stratospheric ozone layer 79.2% 0.0% 18.5% 0.0% 2.2%
Acidification potential of land and water 68.8% 4.7% 15.5% 1.0% 10.0%
Eutrophication potential 62.8% 7.5% 15.0% 1.6% 13.1%
Photochemical ozone creation potential 93.2% -33.6% 16.6% -7.3% 31.0%
Abiotic depletion potential – elements 72.0% 0.4% 25.1% 0.0% 2.6%
Abiotic depletion potential – fossil fuels 64.0% 5.5% 15.1% 1.0% 14.5%
ENVIRONMENTAL PRODUCT DECLARATION FOR GIB® PLASTERBOARD28 MARCH 2018GIB.CO.NZ FOR MORE INFO
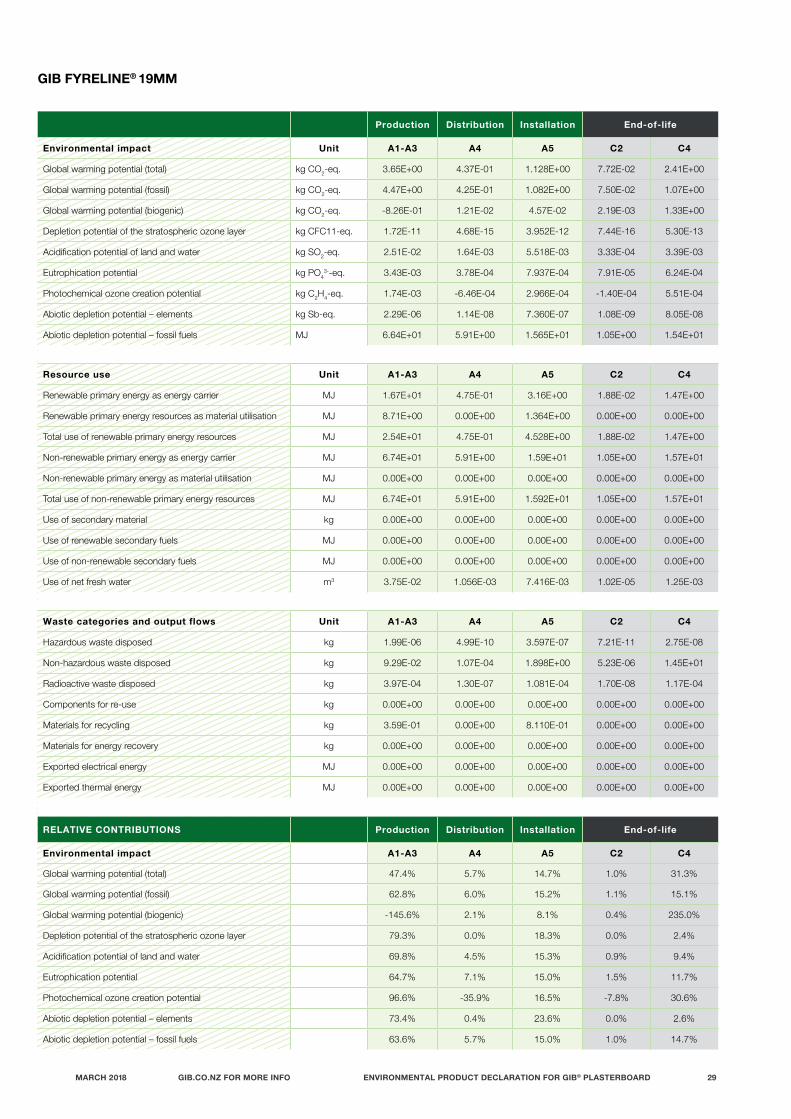
GIB FYRELINE® 19MM
Production Distribution Installation End-of-life
Environmental impact Unit A1-A3 A4 A5 C2 C4
Global warming potential (total) kg CO2-eq. 3.65E+00 4.37E-01 1.128E+00 7.72E-02 2.41E+00
Global warming potential (fossil) kg CO2-eq. 4.47E+00 4.25E-01 1.082E+00 7.50E-02 1.07E+00
Global warming potential (biogenic) kg CO2-eq. -8.26E-01 1.21E-02 4.57E-02 2.19E-03 1.33E+00
Depletion potential of the stratospheric ozone layer kg CFC11-eq. 1.72E-11 4.68E-15 3.952E-12 7.44E-16 5.30E-13
Acidification potential of land and water kg SO2-eq. 2.51E-02 1.64E-03 5.518E-03 3.33E-04 3.39E-03
Eutrophication potential kg PO43--eq. 3.43E-03 3.78E-04 7.937E-04 7.91E-05 6.24E-04
Photochemical ozone creation potential kg C2H4-eq. 1.74E-03 -6.46E-04 2.966E-04 -1.40E-04 5.51E-04
Abiotic depletion potential – elements kg Sb-eq. 2.29E-06 1.14E-08 7.360E-07 1.08E-09 8.05E-08
Abiotic depletion potential – fossil fuels MJ 6.64E+01 5.91E+00 1.565E+01 1.05E+00 1.54E+01
Resource use Unit A1-A3 A4 A5 C2 C4
Renewable primary energy as energy carrier MJ 1.67E+01 4.75E-01 3.16E+00 1.88E-02 1.47E+00
Renewable primary energy resources as material utilisation MJ 8.71E+00 0.00E+00 1.364E+00 0.00E+00 0.00E+00
Total use of renewable primary energy resources MJ 2.54E+01 4.75E-01 4.528E+00 1.88E-02 1.47E+00
Non-renewable primary energy as energy carrier MJ 6.74E+01 5.91E+00 1.59E+01 1.05E+00 1.57E+01
Non-renewable primary energy as material utilisation MJ 0.00E+00 0.00E+00 0.00E+00 0.00E+00 0.00E+00
Total use of non-renewable primary energy resources MJ 6.74E+01 5.91E+00 1.592E+01 1.05E+00 1.57E+01
Use of secondary material kg 0.00E+00 0.00E+00 0.00E+00 0.00E+00 0.00E+00
Use of renewable secondary fuels MJ 0.00E+00 0.00E+00 0.00E+00 0.00E+00 0.00E+00
Use of non-renewable secondary fuels MJ 0.00E+00 0.00E+00 0.00E+00 0.00E+00 0.00E+00
Use of net fresh water m3 3.75E-02 1.056E-03 7.416E-03 1.02E-05 1.25E-03
Waste categories and output flows Unit A1-A3 A4 A5 C2 C4
Hazardous waste disposed kg 1.99E-06 4.99E-10 3.597E-07 7.21E-11 2.75E-08
Non-hazardous waste disposed kg 9.29E-02 1.07E-04 1.898E+00 5.23E-06 1.45E+01
Radioactive waste disposed kg 3.97E-04 1.30E-07 1.081E-04 1.70E-08 1.17E-04
Components for re-use kg 0.00E+00 0.00E+00 0.00E+00 0.00E+00 0.00E+00
Materials for recycling kg 3.59E-01 0.00E+00 8.110E-01 0.00E+00 0.00E+00
Materials for energy recovery kg 0.00E+00 0.00E+00 0.00E+00 0.00E+00 0.00E+00
Exported electrical energy MJ 0.00E+00 0.00E+00 0.00E+00 0.00E+00 0.00E+00
Exported thermal energy MJ 0.00E+00 0.00E+00 0.00E+00 0.00E+00 0.00E+00
RELATIVE CONTRIBUTIONS Production Distribution Installation End-of-life
Environmental impact A1-A3 A4 A5 C2 C4
Global warming potential (total) 47.4% 5.7% 14.7% 1.0% 31.3%
Global warming potential (fossil) 62.8% 6.0% 15.2% 1.1% 15.1%
Global warming potential (biogenic) -145.6% 2.1% 8.1% 0.4% 235.0%
Depletion potential of the stratospheric ozone layer 79.3% 0.0% 18.3% 0.0% 2.4%
Acidification potential of land and water 69.8% 4.5% 15.3% 0.9% 9.4%
Eutrophication potential 64.7% 7.1% 15.0% 1.5% 11.7%
Photochemical ozone creation potential 96.6% -35.9% 16.5% -7.8% 30.6%
Abiotic depletion potential – elements 73.4% 0.4% 23.6% 0.0% 2.6%
Abiotic depletion potential – fossil fuels 63.6% 5.7% 15.0% 1.0% 14.7%
ENVIRONMENTAL PRODUCT DECLARATION FOR GIB® PLASTERBOARD 29MARCH 2018 GIB.CO.NZ FOR MORE INFO

GIB TOUGHLINE® 13MM
Production Distribution Installation End-of-life
Environmental impact Unit A1-A3 A4 A5 C2 C4
Global warming potential (total) kg CO2-eq. 4.55E+00 3.21E-01 1.211E+00 5.71E-02 2.00E+00
Global warming potential (fossil) kg CO2-eq. 5.33E+00 3.12E-01 1.169E+00 5.55E-02 7.42E-01
Global warming potential (biogenic) kg CO2-eq. -7.73E-01 8.87E-03 4.22E-02 1.62E-03 1.26E+00
Depletion potential of the stratospheric ozone layer kg CFC11-eq. 1.77E-11 3.44E-15 4.030E-12 5.50E-16 3.66E-13
Acidification potential of land and water kg SO2-eq. 3.05E-02 1.20E-03 6.261E-03 2.46E-04 2.39E-03
Eutrophication potential kg PO43--eq. 3.20E-03 2.78E-04 7.150E-04 5.86E-05 4.79E-04
Photochemical ozone creation potential kg C2H4-eq. 2.17E-03 -4.75E-04 3.893E-04 -1.04E-04 4.47E-04
Abiotic depletion potential – elements kg Sb-eq. 2.50E-06 8.40E-09 7.699E-07 7.96E-10 5.55E-08
Abiotic depletion potential – fossil fuels MJ 7.83E+01 4.34E+00 1.684E+01 7.75E-01 1.06E+01
Resource use Unit A1-A3 A4 A5 C2 C4
Renewable primary energy as energy carrier MJ 1.80E+01 3.49E-01 3.33E+00 1.39E-02 1.01E+00
Renewable primary energy resources as material utilisation MJ 8.24E+00 0.00E+00 1.302E+00 0.00E+00 0.00E+00
Total use of renewable primary energy resources MJ 2.62E+01 3.49E-01 4.629E+00 1.39E-02 1.01E+00
Non-renewable primary energy as energy carrier MJ 8.11E+01 4.34E+00 1.74E+01 7.75E-01 1.08E+01
Non-renewable primary energy as material utilisation MJ 0.00E+00 0.00E+00 0.00E+00 0.00E+00 0.00E+00
Total use of non-renewable primary energy resources MJ 8.11E+01 4.34E+00 1.742E+01 7.75E-01 1.08E+01
Use of secondary material kg 0.00E+00 0.00E+00 0.00E+00 0.00E+00 0.00E+00
Use of renewable secondary fuels MJ 0.00E+00 0.00E+00 0.00E+00 0.00E+00 0.00E+00
Use of non-renewable secondary fuels MJ 0.00E+00 0.00E+00 0.00E+00 0.00E+00 0.00E+00
Use of net fresh water m3 3.80E-02 7.762E-04 7.418E-03 7.52E-06 9.03E-04
Waste categories and output flows Unit A1-A3 A4 A5 C2 C4
Hazardous waste disposed kg 1.49E-06 3.67E-10 2.709E-07 5.34E-11 1.90E-08
Non-hazardous waste disposed kg 2.51E-01 7.86E-05 1.430E+00 3.87E-06 1.07E+01
Radioactive waste disposed kg 1.10E-03 9.53E-08 2.271E-04 1.26E-08 8.07E-05
Components for re-use kg 0.00E+00 0.00E+00 0.00E+00 0.00E+00 0.00E+00
Materials for recycling kg 2.83E-01 0.00E+00 5.992E-01 0.00E+00 0.00E+00
Materials for energy recovery kg 0.00E+00 0.00E+00 0.00E+00 0.00E+00 0.00E+00
Exported electrical energy MJ 0.00E+00 0.00E+00 0.00E+00 0.00E+00 0.00E+00
Exported thermal energy MJ 0.00E+00 0.00E+00 0.00E+00 0.00E+00 0.00E+00
RELATIVE CONTRIBUTIONS Production Distribution Installation End-of-life
Environmental impact A1-A3 A4 A5 C2 C4
Global warming potential (total) 55.9% 3.9% 14.9% 0.7% 24.6%
Global warming potential (fossil) 70.0% 4.1% 15.4% 0.7% 9.8%
Global warming potential (biogenic) -144.3% 1.7% 7.9% 0.3% 234.5%
Depletion potential of the stratospheric ozone layer 80.1% 0.0% 18.2% 0.0% 1.7%
Acidification potential of land and water 75.1% 3.0% 15.4% 0.6% 5.9%
Eutrophication potential 67.6% 5.9% 15.1% 1.2% 10.1%
Photochemical ozone creation potential 89.4% -19.6% 16.0% -4.3% 18.4%
Abiotic depletion potential – elements 75.0% 0.3% 23.1% 0.0% 1.7%
Abiotic depletion potential – fossil fuels 70.6% 3.9% 15.2% 0.7% 9.6%
ENVIRONMENTAL PRODUCT DECLARATION FOR GIB® PLASTERBOARD30 MARCH 2018GIB.CO.NZ FOR MORE INFO

GIB SUPERLINE® 13MM
Production Distribution Installation End-of-life
Environmental impact Unit A1-A3 A4 A5 C2 C4
Global warming potential (total) kg CO2-eq. 4.33E+00 3.21E-01 1.169E+00 5.71E-02 1.98E+00
Global warming potential (fossil) kg CO2-eq. 5.10E+00 3.12E-01 1.128E+00 5.55E-02 7.43E-01
Global warming potential (biogenic) kg CO2-eq. -7.61E-01 8.86E-03 4.09E-02 1.62E-03 1.24E+00
Depletion potential of the stratospheric ozone layer kg CFC11-eq. 1.47E-11 3.44E-15 3.489E-12 5.50E-16 3.66E-13
Acidification potential of land and water kg SO2-eq. 2.98E-02 1.20E-03 6.139E-03 2.46E-04 2.39E-03
Eutrophication potential kg PO43--eq. 3.13E-03 2.78E-04 7.034E-04 5.85E-05 4.77E-04
Photochemical ozone creation potential kg C2H4-eq. 2.08E-03 -4.75E-04 3.727E-04 -1.04E-04 4.43E-04
Abiotic depletion potential – elements kg Sb-eq. 3.52E-06 8.40E-09 9.500E-07 7.95E-10 5.55E-08
Abiotic depletion potential – fossil fuels MJ 7.67E+01 4.34E+00 1.657E+01 7.74E-01 1.06E+01
Resource use Unit A1-A3 A4 A5 C2 C4
Renewable primary energy as energy carrier MJ 1.78E+01 3.49E-01 3.30E+00 1.39E-02 1.01E+00
Renewable primary energy resources as material utilisation MJ 8.15E+00 0.00E+00 1.291E+00 0.00E+00 0.00E+00
Total use of renewable primary energy resources MJ 2.60E+01 3.49E-01 4.594E+00 1.39E-02 1.01E+00
Non-renewable primary energy as energy carrier MJ 7.95E+01 4.34E+00 1.71E+01 7.74E-01 1.08E+01
Non-renewable primary energy as material utilisation MJ 0.00E+00 0.00E+00 0.00E+00 0.00E+00 0.00E+00
Total use of non-renewable primary energy resources MJ 7.95E+01 4.34E+00 1.714E+01 7.74E-01 1.08E+01
Use of secondary material kg 0.00E+00 0.00E+00 0.00E+00 0.00E+00 0.00E+00
Use of renewable secondary fuels MJ 0.00E+00 0.00E+00 0.00E+00 0.00E+00 0.00E+00
Use of non-renewable secondary fuels MJ 0.00E+00 0.00E+00 0.00E+00 0.00E+00 0.00E+00
Use of net fresh water m3 3.37E-02 7.758E-04 6.656E-03 7.51E-06 9.01E-04
Waste categories and output flows Unit A1-A3 A4 A5 C2 C4
Hazardous waste disposed kg 1.51E-06 3.66E-10 2.731E-07 5.33E-11 1.90E-08
Non-hazardous waste disposed kg 2.40E-01 7.85E-05 1.429E+00 3.87E-06 1.08E+01
Radioactive waste disposed kg 1.10E-03 9.52E-08 2.273E-04 1.26E-08 8.08E-05
Components for re-use kg 0.00E+00 0.00E+00 0.00E+00 0.00E+00 0.00E+00
Materials for recycling kg 2.63E-01 0.00E+00 5.955E-01 0.00E+00 0.00E+00
Materials for energy recovery kg 0.00E+00 0.00E+00 0.00E+00 0.00E+00 0.00E+00
Exported electrical energy MJ 0.00E+00 0.00E+00 0.00E+00 0.00E+00 0.00E+00
Exported thermal energy MJ 0.00E+00 0.00E+00 0.00E+00 0.00E+00 0.00E+00
RELATIVE CONTRIBUTIONS Production Distribution Installation End-of-life
Environmental impact A1-A3 A4 A5 C2 C4
Global warming potential (total) 55.2% 4.1% 14.9% 0.7% 25.2%
Global warming potential (fossil) 69.5% 4.3% 15.4% 0.8% 10.1%
Global warming potential (biogenic) -144.9% 1.7% 7.8% 0.3% 235.1%
Depletion potential of the stratospheric ozone layer 79.2% 0.0% 18.8% 0.0% 2.0%
Acidification potential of land and water 74.9% 3.0% 15.4% 0.6% 6.0%
Eutrophication potential 67.4% 6.0% 15.1% 1.3% 10.2%
Photochemical ozone creation potential 89.7% -20.5% 16.1% -4.5% 19.1%
Abiotic depletion potential – elements 77.6% 0.2% 20.9% 0.0% 1.2%
Abiotic depletion potential – fossil fuels 70.4% 4.0% 15.2% 0.7% 9.7%
ENVIRONMENTAL PRODUCT DECLARATION FOR GIB® PLASTERBOARD 31MARCH 2018 GIB.CO.NZ FOR MORE INFO

ADDITIONAL ENVIRONMENTAL INFORMATION
Winstone Wallboards is committed to pursuing high
standards of environmental performance and have
identified a number of practical ways to contribute to
more sustainable construction.
These include:
— Promoting architectural trends and practices to
encourage the design of healthy and sustainable
buildings
— Developing products and services to support
better use of existing materials, reuse and
recycling (e.g. local manufacture in Auckland and
Christchurch, GIB® cut-to-length service to reduce
waste and composting plasterboard waste)
— Preventing health risks related to products for
construction workers and end users
GIB® plasterboard is made up of naturally occurring
gypsum, 100% recycled paper, and a small quantity
of other ingredients (which includes approved glues
and additives required to improve the quality of the
finished board).
Our plasterboard manufacturing plants in Auckland
and Christchurch have put in place measures to
reduce their environmental impacts by:
— Controlling discharges to water including
suspended solids
— Removing CFC/halons in the production process
— Not using solvents containing halogenated
hydrocarbons
— Implementing an effective energy management
policy
— Reducing greenhouse gas emissions by 20% over
the past 15 years
— Minimising waste and diverting all plasterboard
production waste away from landfill into compost
GREENTAG
In recognition of our efforts to continuously improve
the sustainability of our products, we’re thrilled to
have received GreenTag certification for our GIB®
plasterboards 13mm or greater in thickness.
GreenTag labelling applies to the following range of
GIB® plasterboard products:
— 10mm and 13mm GIB® Standard
— 10mm and 13mm GIB® Wideline
— 10mm and 13mm GIB Braceline® GIB Noiseline®
— 10mm, 13mm, 16mm and 19mm GIB Fyreline®
— 13mm GIB Toughline®
GIB® plasterboard is compostable and can be spread
directly onto land as a soil conditioner, helping to
reduce waste to landfill. Our plasterboard is well
suited for this purpose due to its low percentage of
binders, additives and surface treatments1. Gypsum
is a natural fertiliser and soil conditioner (Shainberg
et al. 1989). Returning ground plasterboard to soil
can provide similar benefits due to its high gypsum
content (Naeth & Wilkinson 2013).
Winstone Wallboards works with industrial
composters who blend plasterboard waste with
their compost and return it to soils throughout the
country. We also supply information on suitable paint
types to be used with GIB® plasterboard that don't
compromise its ability to be composted.
We already divert a large share of plasterboard waste
from landfill to industrial composting:
— 100% of plasterboard waste from Winstone
Wallboards’ manufacturing plants
— 25% of offcuts from installation of GIB®
plasterboard
You can help us to do even better. On larger projects,
waste plasterboard can be separated on site and
diverted to approved composting operations. For
smaller projects, it can be ground up and spread
around the building site reducing the volumes of
construction waste going to landfill.
GIB® plasterboard contributes to a healthier living
environment in a number of important ways:
— No toxins - consisting largely of natural gypsum
and 100% recycled paper, GIB® plasterboard does
not contain the toxins inherent to a number of
other manufactured building products
1 GIB Toughline® and GIB Superline® include fibreglass mesh reinforcing for strength. Industrial composters can remove this
mesh. Where industrial composting is not available, Winstone Wallboards recommends that these products be sent to landfill.
ENVIRONMENTAL PRODUCT DECLARATION FOR GIB® PLASTERBOARD32 MARCH 2018GIB.CO.NZ FOR MORE INFO

— Thermally responsive - the nature of GIB®
plasterboard composite allows it to respond
quickly to heating and cooling effects
— Fire safety - the chemical composition of
plasterboard makes it an ideal material for use in
fire resisting construction. GIB Fyreline® is widely
used in fire-rated walls and ceilings
— Acoustic properties - GIB Noiseline® is used to
reduce noise levels within residential and commercial
buildings for the comfort of building occupants.
DECLARE
Declare is a database of non-toxic, sustainably
sourced building products that meet the stringent
requirements of the International Living Future
Institute’s Living Building Challenge.
Considered the most advanced sustainability
certification in the built environment, Declare is like
a nutritional label for building products, offering
specifiers, contractors and building users insight into
the ingredients used in the manufacture of building
products.
The following products have all achieved Red List
Free status (the highest Declare status possible),
meaning that these products meet the strict Declare
materials standards:
— GIB Aqualine®
— GIB Fyreline®
— GIB® Standard
— GIB Toughline®
— GIB Braceline® GIB Noiseline®
GIB® plasterboard is 100% recyclable as well as
having Declare status and can positively contribute to
Green Star certification.
HOMESTAR
Homestar is New Zealand’s environmental and energy
efficiency rating for both new and existing homes. It’s
a voluntary rating system developed by BRANZ and
the New Zealand Green Building Council (NZGBC).
The Homestar rating scale goes from 1 (for very poor)
through to 10 (world class). A typical house built to
the New Zealand building code would achieve a 3 – 4
Homestar. To achieve a high Homestar rating beyond the
standard building code, engage a Homestar Assessor
before you get your plans agreed by your local council.
Within the Homestar tool, GIB® can contribute to
achieving points in the following areas out of a total
100 available points.
GREEN STAR
Green Star is the NZGBC’s rating tool for commercial
buildings. Green Star v3 has an Innovation Challenge
for Environmental Product Declarations.
Points for EPDs: 1 point is available where 2 different
products hold current EPDs. 2 points are available
where 6 or more different products hold current EPDs.
This EPD meets NZGBC’s requirements of being
“a product-specific, third-party EPD” issued in
accordance with ISO 14025 and EN 15804.
Homestar CreditMaximum Points Available in Credit
GIB®
EHC-9 Sound Insulation 2 pointsContributing to improved sound insulation in ceilings and
internal walls.
WST-1 ConstructionWaste Management
3 pointsWaste minimisation and recycling strategies written into a
REBRI compliant site waste management plan
WST-2 ConstructionWaste Reduction
3 points Achievement of waste minimisation or recycling strategies.
MAT-1 MaterialsSelection
9 points GreenTag certification of GIB® is recognised and awarded
MAT-2 VOCs & Toxic Materials
3 pointsLow VOC adhesives such as GIBFix® One are eligible for
points as a dry wall adhesive.
ENVIRONMENTAL PRODUCT DECLARATION FOR GIB® PLASTERBOARD 33MARCH 2018 GIB.CO.NZ FOR MORE INFO

REFERENCESEN 15804:2012+A1:2013. Sustainability of construction works — Environmental product declarations — Core rules for the product category of construction products. Brussels: European Committee for Standardization.
IEPDS (2017). PCR 2012:01 Construction Products and Construction Services v2.2 (2017-05-30) Stockholm: The International EPD® System.
ISO 14040:2006. Environmental management – Life cycle assessment – Principles and framework. Geneva: International Organization for Standardization.
ISO 14044:200.; Environmental management – Life cycle assessment – Requirements and guidelines. Geneva: International Organization for Standardization.
ISO 14025:2006. Environmental labels and declarations — Type III environmental declarations — Principles and procedures. Geneva: International Organization for Standardization.
Naeth, M. A., and S. R. Wilkinson (2013). Can we build better compost? Use of waste drywall to enhance plant growth on reclamation sites. Journal of Environmental Management, 129, pp. 503-509.
Shainberg, I., M. E. Sumner, W. P. Miller, M. P. W. Farina, M. A. Pavan, and M. V. Fey (1989). Use of Gypsum on Soils: A Review. In: B. A. Stewart (Ed.), Advances in Soil Science, Vol. 9 (pp. 1-111). New York, NY: Springer-Verlag.
thinkstep (2017). GaBi Database 2017 Life Cycle Inventory Documentation. Leinfelden-Echterdingen, Germany: thinkstep AG. Available: www.gabi-software.com/support/gabi/gabi-database-2017-lci-documentation.
VERSION HISTORY
V1.0: Initial release.
V1.1: Results updated to correct an error in allocation
of thermal energy, leading to a reduction in impacts of
between 0% and 11%, depending on the product and
indicator.
ENVIRONMENTAL PRODUCT DECLARATION FOR GIB® PLASTERBOARD34 MARCH 2018GIB.CO.NZ FOR MORE INFO

ENVIRONMENTAL PRODUCT DECLARATION FOR GIB® PLASTERBOARD 35MARCH 2018 GIB.CO.NZ FOR MORE INFO

FOR MORE INFORMATION VISIT
gib.co.nz