environmental problems and society - sagepub.com · 1 without self-understanding we cannot hope for...
TRANSCRIPT

1
Without self-understanding we cannothope for enduring solutions to envi-ronmental problems, which are funda-mentally human problems.
—Yi-Fu Tuan, 1974
“Pass the hominy please.”It was a lovely brunch, with fruit salad, home-
made coffee cake, a great pan of scrambled eggs,bread, butter, jam, coffee, tea—and hominy grits.Our friends Dan and Sarah had invited my wifeand me and our son over that morning to meetsome friends of theirs. The grown-ups sat aroundthe dining room table, and the kids (four in all)careened from their own table in the kitchen tothe pile of toys in the living room, and often intoeach other. Each family had contributed some-thing to the feast before us. It was all good food,but for some reason the hominy grits (which I hadnever had before) was the most popular.
There was a pleasant mix of personalities, andthe adults soon got into one of those excitedchats that leads in an irreproducible way from
one topic to another, as unfamiliar people seek toget to know each other a bit better. Eventually theinevitable question came my way: “So what doyou do?”
“I’m an environmental sociologist.”“Environmental sociology. That’s interesting.
I’ve never heard of it. What does sociology haveto do with the environment?”
The point of this book is to answer thatquestion—a question I’m often asked—and in amore complete way than the 2-minute answersthe dynamics of casual conversation generallyallow. But let me begin with the 2-minute answer.
Environmental sociology is the study of com-munity in the largest possible sense. People, otheranimals, land, water, air—all of these are closelyinterconnected. Together they form a kind ofsolidarity, what we have come to call ecology. Asin any community, there are also conflicts in themidst of the interconnections. Environmentalsociology studies this largest of communitieswith an eye to understanding the origins of, andproposing solutions to, these all-too-real socialand biophysical conflicts.
Environmental problems are not only prob-lems of technology and industry, of ecology and
CHAPTER 1
EnvironmentalProblems and Society
01-Bell.qxd 5/18/04 3:18 PM Page 1

biology, of pollution control and pollutionprevention. They are also social problems.Environmental problems are problems forsociety—problems that threaten our existingpatterns of social organization. Environmentalproblems are as well problems of society—problems that challenge us to change thosepatterns of organization. It is people who createenvironmental problems, and it is people whomust resolve them. And for that we need, amongother disciplines, sociology.
One of sociology’s most basic contributions tothe study of environmental problems is to pointout the pivotal role of social inequality. Not onlyare the effects of environmental problems distri-buted unequally across the human community,social inequality is deeply involved in causing thoseproblems. Social inequality is both a product and aproducer of pollution, overconsumption, resourcedepletion, habitat loss, risky technology, and rapidpopulation growth. As well, social inequalityinfluences how we envision what our environmen-tal problems are. And most fundamentally, it caninfluence how we envision nature itself, forinequality shapes our social experiences, and oursocial experiences shape all our experience.
Which returns us to the question of commu-nity. Social inequality cannot be understood apartfrom the communities in which it takes place. Weneed, then, to make the study of community thecentral task of environmental sociology. Ecologyis often described as the study of natural commu-nities. Sociology is often described as the study ofhuman communities. Environmental sociology isthe study of both together, the single commons ofthe Earth we humans share, sometimes grudg-ingly, with others—other people, other forms oflife, and the rocks and water and soil and air thatsupport all life. Environmental sociology is thestudy of this, the biggest community of all.
A Panorama of the Book
That’s the 2-minute answer. But clearly the topicof environmental sociology is vast. Not even a
book the length of this one can cover all of it, atleast not in any detail. In the pages to come, wewill take a series of field trips into this vast land-scape, pausing here and there for a closer look atvarious significant features of the terrain. Ratherthan attempting some sort of sociological aerialphotography, the book intensively investigates afew topics on the ground and occasionally scales ahigh overlook for a panoramic view. Such anapproach, I believe, will lead to the most balancedunderstanding of environmental sociology.
For the most part, this first chapter presentsseveral such panoramic views—of environmen-tal sociology, of the environmental predicament,and, in this section, of the book itself. After thisintroduction, the book falls into three parts:
The Material: How consumption, the economy,technology, development, population, and thehealth of our bodies shape our environmentalsituation
The Ideal: How culture, ideology, moral values,risk, knowledge, and social experience influencethe way we think about and act toward theenvironment
The Practical: How we might better resolve envi-ronmental conflicts, taking both the material andthe ideal into account.
Of course, it is not possible to fully separatethese three topics. The deep union of the mater-ial, the ideal, and the practical is one of the mostimportant truths that environmental sociologyhas to offer. The parts of the book representonly a sequence of emphases, not rigid conceptualboundaries. A number of themes runningthroughout the book help unite the parts:
• The dialogic, or interactive and unfinished,character of causality in environmentalsociology
• The interplay of material and ideal factors• The connections between the local and the
global
2——AN INVITATION TO ENVIRONMENTAL SOCIOLOGY
01-Bell.qxd 5/18/04 3:18 PM Page 2

• The central role of social inequality inenvironmental conflicts
• The power of the metaphor of communityfor understanding these social and ecolo-gical dynamics
• The important influence of democraticinstitutions and commitments in ourenvironmental practices
By approaching environmental sociology inthis way, I hope to bridge a long-standing disputeamong scholars about the relationship betweenenvironment and society. Realists argue thatenvironmental problems cannot be understoodapart from the threats posed by society’s currentecologic relations. They believe that social scien-tists can ill afford to ignore the material truth ofenvironmental problems. Constructionists do notnecessarily disagree, but they emphasize theinfluence of social life in how we conceptualizethose threats, or the lack of those threats. Con-structionists focus on the ideological origins ofenvironmental problems—including their verydefinition as problems (or as non-problems). Arealist might say, for example, that the ozone holeis a dangerous consequence of how we currentlyorganize social life. A constructionist might saythat in order to recognize the danger—or eventhe existence—of the ozone hole, we must wearthe appropriate conceptual and ideological eye-glasses. Simply put, realists and constructionistsdisagree over whether the purpose of environ-mental sociology is to understand environmentalproblems or environmental “problems.”1
Fundamentally, the realist-constructionistdebate is over materialist versus idealist explana-tions of social life. (I mean “materialist” herein the philosophical sense of emphasizing thematerial conditions of life, not in the sense ofmaterial acquisitiveness. And I similarly mean“idealist” in the philosophical sense of emphasiz-ing the role of ideas, not in the sense of what isthe best or highest.) The tension between materi-alist and idealist explanations is itself a centuries-old philosophical dispute, one that perhaps allcultural traditions have grappled with in one way
or another. An ancient fable from India expressesthe tension well. A group of blind peopleencounters an elephant for the first time. Oneperson grabs the elephant’s tail and says, “Anelephant is like a snake!” Another grabs a leg andsays, “An elephant is like a tree!” A third grabs anear and says, “An elephant is like a big leaf!” Tothe materialist, the fable shows how misinformedall three blind people are, for a sighted personcan plainly see how the “snake,” “tree,” and “bigleaf” connect together into what an elephantreally is. To the idealist, the fable says that we allhave our ideological blindnesses, and there isno fully sighted person who can see the wholeelephant—that we are all blind people wildlygrasping at the elusive truth of the world.
The approach to this ancient debate I take isthat the material and the ideal dimensions of theenvironment depend upon and interact witheach other. What we believe depends on what wesee and feel, and what we see and feel depends onwhat we believe. It is not a matter of either/or;rather, it is a matter of both-together. Each sidehelps constitute and reconstitute the other, in aprocess that will never, we must hope, finish. Iterm this mutual and unfinalizable interdepen-dence ecological dialogue.2 Throughout the bookI consider the interplay, the constant conversa-tion, between the material and ideal dimensionsof this never-ending dialogue. (See Figure 1.1.)
Let me also make it clear that this book takesan activist position with regard to environmentalproblems and the way we think about them. Weoften look to scholars to provide an unbiasedperspective on issues that concern us, and wesometimes regard an active commitment to apolitical position as cause for suspicion aboutjust how scientific that perspective is. Yet, asmany have argued, it is not possible to escapepolitical implications.3 Everyone has concerns forand interests in the condition of our world andour society. Such concerns and interests are whatguide us all every day, and scholars are no differ-ent from anyone else in this regard. Nor shouldthey be any different. Such concerns and interestsare not necessarily a problem for scholarship.
Environmental Problems and Society——3
01-Bell.qxd 5/18/04 3:18 PM Page 3

On the contrary, they are the whole reason forscholarship.
This does not mean that anything goes—thatany perspective is just as academically valid asany other because all knowledge is only opinionand we are all entitled to our own opinions.Scholarship is opinion, of course, but it is aspecial kind of opinion. What scholarship meansis being critical, careful, honest, open, straight-forward, and responsible in one’s opinions—inwhat one claims is valid knowledge. One needs toreason critically and carefully, to be honest aboutthe reasons one suggests to others, to be open tothe reasons others suggest, to be straightforwardabout one’s political reasons, and to be responsi-ble in the kinds of reasons one promotes. Beinghonest, open, and straightforward with eachother about our careful, critical reasons is theonly academically responsible thing to do.4
Therefore, it is best for me to be straightfor-ward about why I think environmental sociologyis an important topic of study: I believe there are
serious environmental problems that needconcerted attention, and soon. And I believeenvironmental issues are closely intertwined witha host of social issues, most of them at least inpart manifestations of social inequality and thechallenges inequality poses for community.Addressing these intertwinings, manifestations,and challenges is in everyone’s interests. We willall benefit, I believe, by reconsidering the presentstate of ecological dialogue.
My perspective, particularly the focus onsocial inequality, coincides more closely with thecurrent politics of the left than the right. Yetissues of the environment cut across traditionalpolitical boundaries, as Chapter 8 discusses.The evidence and arguments that I offer in thisbook should be of interest to anyone committedto careful, critical reasoning. In any event, weshould not let political differences stop us fromengaging in dialogue about ecological dialogue.
Nevertheless, you, the reader, should be awarethat I indeed have a moral and political perspective
4——AN INVITATION TO ENVIRONMENTAL SOCIOLOGY
Figure 1.1 Ecological dialogue.
01-Bell.qxd 5/18/04 3:18 PM Page 4

and that it unavoidably informs what I havewritten here. Keep that in mind as you carefullyand critically evaluate what is in this book. But itis also your scholarly responsibility to be open tothe reasoning I present and to have honestreasons for disagreeing.
The EnvironmentalPredicament
Let us now turn to some of the reasons that leadmany people to believe there is cause for consid-erable concern about the current condition ofecological dialogue: the challenges to sustainabil-ity, environmental justice, and the rights andbeauty of nature. These, the three central envi-ronmental issues, will already be well known tosome readers. Still, it is appropriate to pause andreview them here, as these considerations under-lie the rest of the book.
Sustainability
How long can we keep doing what we’redoing? This is the essential question of sustain-ability. The length of the list of threats to envi-ronmental sustainability is, at the very least,unnerving. True, much is unknown, and somehave exaggerated the dangers we face. Conse-quently, there is considerable controversy aboutthe long-term consequences of humanity’s con-tinuing transformation of the Earth, as Chapter 9discusses in some detail. But much relevantevidence has been gathered, and some haveunderestimated the dangers involved. It is there-fore prudent that we all pay close attention to thepotential challenges to sustainability.
Global Warming. Perhaps the greatest uncertainty(and controversy) surrounds an issue that posesone of the greatest potential environmentalthreats: global warming. There is considerableevidence that the world is heating up. Whenaverages are calculated for the entire globe, the
10 warmest years on record (through 2003) haveall occurred since 1990.5 And the trend isupward: The 1970s were hotter than the 1960s,the 1980s were hotter than the 1970s, the 1990swere still hotter, and the 2000s are looking to behotter yet. (See Figure 1.2.) At this writing, thehottest five years on record are, in descendingorder, 1998, 2002, 2003, 2001, and 1997.6 In everyyear since 1977, the annual average world tem-perature has been at least 14 degrees Celsius(57 degrees Fahrenheit), a level hardly ever reachedin the past 200 years.7
These weather records show that there was agrain of truth to an earlier generation’s storiesabout having to walk to school through 3 feet ofchilling snow, barefoot and uphill both ways.Eighteenth- and nineteenth-century images ofthe whole town out for a skating party or of HansBrinker and his silver skates on the frozen canalsof the Netherlands are more than merely roman-tic. It really was colder back then. Winters werelonger, blizzards were stronger, and glaciers usedto come down farther out of the mountains. 1963was the last year Dutch canals froze enoughthat the “Tour of Eleven Towns,” once an annualevent with thousands of participants, could beskated—until it was moved to the northern coastof Finland in 1977.8 There are reports that LongIsland Sound, the body of salt water betweenLong Island and the Connecticut coast, used tofreeze over some winters and people would drive15 miles across the ice with a team and wagon.That hasn’t happened in 150 years.9
It’s not warming up everywhere. Differentplaces are experiencing different changes, whichis why the issue is often called “global climatechange” rather than “global warming.” But over-all, the heat is on, globally. If this warming trendcontinues over the next 100 years, say most cli-matologists and oceanographers, we will seesome major environmental changes. Climaticzones will shift, rainfall patterns will change, andweather conditions will become more variable. Inaddition, average sea level will rise 1–2 feet—andpossibly higher—as glaciers and the ice caps meltand as ocean water heats up and expands.10
Environmental Problems and Society——5
01-Bell.qxd 5/18/04 3:18 PM Page 5

(Ocean water will not heat up and expand bymuch, but the incredible volume of water in theoceans means that even a slight expansion leadsto a considerable rise in sea level.)
The predicted consequences would be dra-matic, to say the least. Some forests may die offbecause of newly unfavorable growing condi-tions. Some urban areas will experience increaseddrinking water shortages and heat waves. Warmertemperatures and changes in rainfall patternscould increase the incidence of disease, as the newconditions would likely be more hospitable tomosquitoes, ticks, rodents, bacteria, and viruses.The incidence of damaging storms is also likely toincrease. Extensive regions of low-lying coastalland (where much of the world’s human popula-tion lives) would be in grave danger of floodingduring storm surges—or even under water. It isnot inconceivable that whole countries, such asthe low-lying Pacific Island nations of Tuvalu andKiribati, could in time be washed away. In view ofthe threat, the New Zealand government hasalready made plans for accepting immigrantsdisplaced from Tuvalu.11
The consequences for agriculture would becomplex. Some prime agricultural areas will
likely be stricken with drier conditions. Forexample, farmers in Iowa, the leading corn-producing region in the United States, might haveto switch over to wheat and drought-tolerantcorn varieties, which would mean overalldeclines in food production per acre.12 On theother hand, some regions will likely receive morerain. Yet many of these regions do not have thesame quality of soil as, say, Iowa. To add to thecomplexity, carbon dioxide (the gas implicated asthe principal cause of global warming, as I discussin a moment) can stimulate growth in some cropplants; one study has found a 17 percent yieldboost in soybeans.13 However, this stimulationmay not result in actual increased crop yieldsbecause of other limiting factors, such as lowrainfall, poor soil conditions, and the existence ofother pollutants in the air.14
No one knows exactly what the overall effectswould be. Nevertheless, it’s scary stuff. Indeed,the predictions seem to be coming true already.For instance, meteorologists worry that we areseeing an increase in heat waves and resultingfatalities: The spell of four days that peakedaround 100 degrees Fahrenheit between July 12and 15, 1995, blamed for 739 deaths in Chicago.15
6——AN INVITATION TO ENVIRONMENTAL SOCIOLOGY
1860
−0.8
−0.6
−0.4
−0.2
0
0.2
0.4
0.6
0.8
Global Air Temperature
1880 1900 1920 1940 1960 1980 2000
Diff
eren
ce fr
om 1
961-
1990
(°C
)
Temperature anomalySmoothed with abinomial filter
Figure 1.2 A warming world: Average global air temperature, 1866–2002.
01-Bell.qxd 5/18/04 3:18 PM Page 6
The 2002 heat wave from April to May in India,which killed 1,000 people.16 The even more hor-rific 2003 heat wave in Europe estimated to havekilled an astounding 14,802 people in France,plus many dozens in other European countries.17
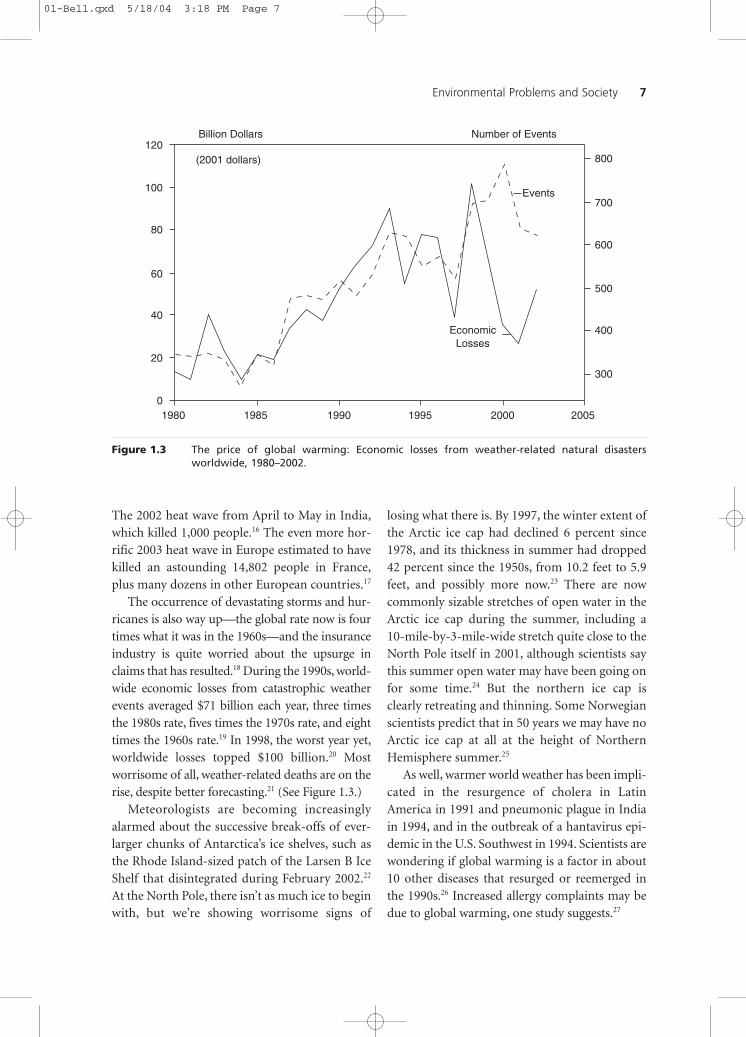
The occurrence of devastating storms and hur-ricanes is also way up—the global rate now is fourtimes what it was in the 1960s—and the insuranceindustry is quite worried about the upsurge inclaims that has resulted.18 During the 1990s, world-wide economic losses from catastrophic weatherevents averaged $71 billion each year, three timesthe 1980s rate, fives times the 1970s rate, and eighttimes the 1960s rate.19 In 1998, the worst year yet,worldwide losses topped $100 billion.20 Mostworrisome of all, weather-related deaths are on therise, despite better forecasting.21 (See Figure 1.3.)
Meteorologists are becoming increasinglyalarmed about the successive break-offs of ever-larger chunks of Antarctica’s ice shelves, such asthe Rhode Island-sized patch of the Larsen B IceShelf that disintegrated during February 2002.22
At the North Pole, there isn’t as much ice to beginwith, but we’re showing worrisome signs of
losing what there is. By 1997, the winter extent ofthe Arctic ice cap had declined 6 percent since1978, and its thickness in summer had dropped42 percent since the 1950s, from 10.2 feet to 5.9feet, and possibly more now.23 There are nowcommonly sizable stretches of open water in theArctic ice cap during the summer, including a10-mile-by-3-mile-wide stretch quite close to theNorth Pole itself in 2001, although scientists saythis summer open water may have been going onfor some time.24 But the northern ice cap isclearly retreating and thinning. Some Norwegianscientists predict that in 50 years we may have noArctic ice cap at all at the height of NorthernHemisphere summer.25
As well, warmer world weather has been impli-cated in the resurgence of cholera in LatinAmerica in 1991 and pneumonic plague in Indiain 1994, and in the outbreak of a hantavirus epi-demic in the U.S. Southwest in 1994. Scientists arewondering if global warming is a factor in about10 other diseases that resurged or reemerged inthe 1990s.26 Increased allergy complaints may bedue to global warming, one study suggests.27
Environmental Problems and Society——7
0
20
40
60
80
100
120Billion Dollars Number of Events
Events
(2001 dollars) 800
700
600
500
400
300
1980 1985 1990 1995 2000
EconomicLosses
2005
Figure 1.3 The price of global warming: Economic losses from weather-related natural disastersworldwide, 1980–2002.
01-Bell.qxd 5/18/04 3:18 PM Page 7
On a possibly more positive note, regionsnorth of 45 degrees north latitude turned greenerbetween 1981 and 1991. These areas are greeningup about a week earlier in spring, staying green afew days longer in the fall, and experiencingabout a 10 percent increase in plant growth, per-haps helping crops by lengthening the growingseason.28 But the existence of this effect is yetmore evidence that the world is indeed warming.
Not all climatologists agree that we are seeingthe first stages of human-induced global warm-ing, though almost all do.29 George W. Bush’sadministration was famously (some say infa-mously) doubtful about its reality at first, andcreated worldwide controversy when it decidedto pull the United States from the Kyoto Protocolfor reducing global warming; 178 other nationsnevertheless signed on in July 2001. But in June2002, the Bush Administration released a reportthat called global warming due to human activi-ties “very likely.” The report also suggested that“some of the goods and services lost through thedisappearance or fragmentation of naturalecosystems are likely to be costly or impossible toreplace.”30
But even among critics, there hasn’t beenmuch doubt for a while that the world is heatingup.31 The questions most dissenters have askedare Why?, Will it continue?, and Does it matter?Perhaps such variations in world climate are nor-mal processes of nature. More sun spots. Changesin the Earth’s orbit. Changes in the amount ofreflective particles in the atmosphere, maybebecause of more (or less) volcanism. Perhaps.Indeed, these processes undoubtedly are impor-tant influences on climate trends. But there is nownearly global agreement with the United NationsIntergovernmental Panel on Climate Change,which wrote in 1996 that “the balance of evidencesuggests a discernable human influence on globalclimate.”32 In 2002, that same panel concludedthat “there is new and stronger evidence that mostof the warming observed over the last 50 years isattributable to human activities.”33
The biggest culprit: the release of extra carbondioxide into the atmosphere. Like a greenhouse,
extra carbon dioxide traps more heat that wouldotherwise radiate away—about 1.4 watts ofenergy per square meter over the past 150 years.34
Here’s how it works: The energy we get from thesun travels here in the form of light, not heat.When sunlight reaches the Earth’s surface, someof that energy is absorbed and converted intoheat. This heat then radiates back out. Ouratmosphere lets much of this radiant heat energypass into outer space, but, like the glass on agreenhouse, blocks the passage of some of it. Noproblem here. The greenhouse-like effect of theatmosphere keeps the world in its usual temper-ature range of 0 to 100 degrees Fahrenheit. If ouratmosphere didn’t trap some heat, the Earthwould be as cold as the moon. But heat does notpass through carbon dioxide as easily as it passesthrough some of the other constituents of theatmosphere. Thus, extra carbon dioxide increasesthe amount of heat trapped by the atmosphericgreenhouse, as if someone had closed off thevents at the apex of the greenhouse roof.
Carbon dioxide is not the only “greenhousegas,” however, nor is it pound for pound theworst. Methane adds another climate “forcing,”as climatologists say, of about 0.7 watts persquare meter over the past 150 years. Chloro-fluorocarbons (CFCs) contribute a forcing of0.35 watts per square meter, even though a farsmaller amount of CFCs than carbon dioxidehave been released into the atmosphere. Thereare other human-caused forcings, too. Nitrousoxide adds a 0.15 watt forcing, and ozone in thelower atmosphere adds 0.5 watts.
Then there’s what climatologists call “blackcarbon”—more prosaically known as soot. Blackcarbon is not exactly a gas. But it packs a 0.8 wattclimate forcing, number two after carbon diox-ide. It absorbs the sun’s incoming rays, ratherthan blocking radiation on the way back out, andit makes snow dirtier, so it reflects less of thesun’s energy back into space. The dirtier snowalso melts faster because of soot’s absorption oflight energy, again lessening the ability of snow toreflect away the sun’s rays. In fact, one recentstudy concludes that black carbon is the number
8——AN INVITATION TO ENVIRONMENTAL SOCIOLOGY
01-Bell.qxd 5/18/04 3:18 PM Page 8

one culprit in global warming, even ahead ofcarbon dioxide, because the concentration of itseffects in the snowy high latitudes lends more“efficacy” to its forcing.35 All told, then, theseother forcings add up to two times as much ascarbon dioxide—and perhaps three times asmuch, when we take into account the climaticefficacy of black carbon.36 (See Figure 1.4.)
And they’ve all been on the rise. For example,carbon dioxide is up to 368 parts per million inthe atmosphere from 270 in the mid-eighteenthcentury. Methane now registers 1,750 parts perbillion, up from about 700.37 Why are they on therise? The jump in these gases closely correlateswith the acceleration of the Industrial Revolutionaround 1850, when we started burning fossilfuels and clearing forests at a huge rate. (SeeFigure 1.5.) Fossil fuels and trees are great banksof carbon, and burning them is a process of oxi-dization that releases energy. The energy movesthe machines of an industrialized world, and theoxidized carbon—that’s carbon dioxide—joinsthe atmosphere. Large amounts of nitrous oxide,smog, and black carbon particulates go with it.By now, we have pumped many an oil and gasfield dry, mined out many a coal seam, and dugout many a peat bog, all to stoke the fires ofindustrial technology. And we have cleared muchof the world’s forest land, usually by burning, togrow crops for a rapidly expanding population.
Then add in CFCs from refrigerants, aerosolcans, and certain industrial processes, andmethane from a variety of sources including thedecomposition of our vast garbage mounds andthe digestive tracks of our livestock.
Plus there is evidence that the changes in thelandscape wrought by both agriculture andurbanization are having a big impact on theglobal climate. Ever wonder why the downtownsof cities seem so hot at night, even after the sunhas gone down? The lack of trees and the abun-dance of blacktop creates what climatologists callthe “urban heat island” effect. As well, agriculturehas changed the land surface such that more ofthe sun’s energy is absorbed. According to onepreliminary study, half of global warming mightbe due to land use changes alone.38
The good news is that, as Figure 1.5 shows, therate of growth in greenhouse gas climate forcingshas been declining since 1990—in part becauseof international environmental cooperation, butalso because of the collapse of the economies ofthe former Eastern bloc countries, reducing theircarbon dioxide emissions. Still, this graph is ofthe rate of growth in forcings, not the amount offorcings. We continue to force the climate, andpush our luck, more and more every year.
You could think of these various climate forc-ings as acting like extra blankets on a warmnight, gradually stifling the planet. I say “on a
Environmental Problems and Society——9
Greenhouse Gases
(indirect viastratospheric
ozone)
CO2CarbonDioxide
CH4Methane
(indirect viaozone (O3) &stratosphericwater vapor
(H2O))
(indirect viaozone (O2))
(semi-direct,dirty cloud &snow effects)
Other Anthropogenic Forcings Natural Forcings
−2
−1
0
1
2
For
cing
in w
atts
per
met
er s
quar
ed (
W/m
2 )Climate Forcings (W/m2): 1850-2000
Tropo-sphericOzone
Tropospheric Aerosols
SulfateOrganicNitrate
Sun
VolcanicAerosols(range ofdecadalmean)
LandCoverAlter.
ForcedCloud
Changes
SoilDustReflective
Aerosols
BlackCarbon
(0.2, −0.5)−0.2±0.2−0.1±0.2
−1.3±0.5
−0.1±0.1
0.7±0.2CFCs
0.35±0.05
NitrousOxideN2O
0.15±0.05
1.4±0.2
0.4±0.2
0.8±0.4
0.5±0.2
−1±0.5
Figure 1.4 The contributions of various “climate forcings” to global climate change.
01-Bell.qxd 5/18/04 3:18 PM Page 9

warm night” because solar radiation is also onthe rise (but at a smaller rate than early critics ofglobal warming claimed), adding in a 0.4 wattper square meter forcing. All told, the roughly1,000 scientists from 120 countries that comprisethe Intergovernmental Panel on Climate Changeestimate that average temperatures will rise 1.4 to5.8 degrees Celsius by the year 2100. This is anenormous average increase when you considerthat an average drop of 6 degrees Celsius causedthe ice ages, covering much of the northern lati-tudes with a mile-thick sheet of ice.39 Climate is atouchy thing. A few degrees average change oneway or the other can make quite a difference. Inthis case, we could be on the verge of many cen-turies of generally lousy sleeping weather—andcircumstances much more ominous than that.
At the very least, the connection betweenglobal warming and the various climate forcingsis something to think about on a hot summerevening as you ponder whether you should crankthe air conditioner up another notch, causingyour local utility to burn just that much morecarbon-based fuel, and to release that muchmore smog and soot to generate the necessaryelectricity.40 You could be making matters worse.
The Two Ozone Problems. There are several otherthreats to our atmosphere. While perhaps notquite as drastic in their potential consequences asglobal warming, they are plenty drastic enough
for considerable concern. Two of these threatsinvolve ozone, although in quite different ways.
Ozone forms when groups of three oxygenatoms bond together into single molecules,which chemists signify as O3. Most atmosphericoxygen is in the form of two bonded oxygenatoms, or O2, but a vital layer of O3 in the upperatmosphere helps protect life on the Earth’s sur-face from the effects of the sun’s ultraviolet radi-ation. Ultraviolet light can cause skin cancer,promote cataracts, damage immune systems, anddisrupt ecosystems. Were there no ozone layer inthe upper atmosphere, life on Earth would haveevolved in quite different ways—if indeed it hadbegun at all. In any event, current life forms arenot equipped to tolerate much more ultravioletradiation than the surface of the Earth currentlyreceives. We badly need the upper atmosphereozone layer.
In 1974, two chemists, Mario Molina andSherwood Rowland, proposed that chlorofluoro-carbons—which, as we have seen, are also a potentglobal warming forcer—could be reacting withthe ozone layer and breaking it down. Molina andRowland predicted that CFCs could ultimatelymake their way into the upper atmosphere andattack the integrity of the ozone layer. In 1985,scientists poring over satellite imagery of theatmosphere over Antarctica discovered (almostaccidentally) that the ozone layer over the SouthPole had, in fact, grown dangerously depleted.
10——AN INVITATION TO ENVIRONMENTAL SOCIOLOGY
1900
NitrousOxideN2O
MethaneCH4
Chlorofluorocarbons“CFCs”
18500
1
2
3
4
5
1950 2000
Cha
nges
in F
orci
ngs
(W/m
2 /ce
ntur
y)Growth Rates of Greenhouse Gas Forcing
Carbon DioxideCO2
Figure 1.5 Greenhouse gases on the rise: Increases in the rate of growth in atmospheric additions ofgreenhouse gases.
01-Bell.qxd 5/18/04 3:18 PM Page 10
Many studies later, we now know that this“ozone hole,” as it has come to be called, is grow-ing in overall size. We also know that it changesin size with the seasons, has a much smaller mateover the North Pole, and stretches to some degreeeverywhere on the planet except the tropics. Infact, it’s really not a hole. It is more accurate tosay that, outside the tropics, the ozone layer isdepleted, particularly over the South Pole. Attimes, the layer depletes to as low as 25 percent ofthe levels observed in the 1970s.41 Most worri-some is that the area of high depletion mightspread to heavily populated areas. In 2000, as ofthis writing the year of the biggest ozone deple-tion event, the high depletion area passed overthe tip of South America for nine days. It nearlygot there again in 2003, as of this writing the yearwith the second worst ozone “hole.” Australiansand New Zealanders have yet to experience this,but they’re plenty worried. Levels of depletionthere are already worse than in other populatedregions, skin cancer rates are the highest in theworld, and classes in “sun health” have becomean essential feature of the school curriculum.42
And in Punta Arena, Chile, the world’s mostsoutherly city, skin cancer rates shot up 66 percentbetween 1994 and 2001.43
Just as there is no “proof” that increasedatmospheric carbon dioxide causes global warm-ing, there is also no proof that CFCs are causingthe depletion of the ozone layer. But the drama ofRowland’s and Molina’s prediction (althougheven they had underestimated the degree ofdepletion), the seriousness of the likely conse-quences, and measurements that consistentlyshow ultraviolet radiation on the increase havegalvanized the world into unusually cooperativeaction.44 In 1987, the major industrial countriessigned the first of a series of agreements, knownas the Montreal Protocol, to reduce the produc-tion of CFCs. As a result of these agreements,CFC production for use in these countries endedon December 31, 1995, and will end throughoutthe world after 2010. By 1996, annual CFC pro-duction had already fallen to about 150,000tons—down from more than 1,000,000 tons in
late 1980s—although it has declined only slightlysince then.45 (See Figure 1.5.)
It will be many decades until the depletion isrepaired, however. The ozone-damaging chlorinethat CFCs contain remains resident in the atmos-phere for some time, and the HCFCs (hydro-chlorofluorocarbons) industrial countries firstturned to as a substitute also damage the ozonelayer to some extent. Plus, like CFCs, HCFCs area potent greenhouse gas. Chlorine-free “green-freeze” refrigerants do not damage the upperatmosphere ozone layer and don’t contribute toglobal warming. Greenfreeze technology nowdominates the refrigerator market in Europe andis taking hold in South America, Japan, China,and elsewhere. But greenfreeze is just now reach-ing the North American market, and at thiswriting is not yet available in its refrigerators.Meanwhile, an extensive black market in CFCshas arisen in North America.46 Thus, the currentexpert view is that ozone depletion will be withus until the middle of the century at least.47
But the reduction of CFC production is nev-ertheless an astounding success story—not leastfor Rowland and Molina, who received the 1995Nobel Prize in chemistry for their work, alongwith Paul Crutzen for his important earlierstudies of the ozone layer. Given the unusual levelof international cooperation that led to theMontreal Protocol, it is particularly appropriatethat this Nobel Prize went to a Mexican(Molina), an American (Rowland), and a Dutchscientist (Crutzen).
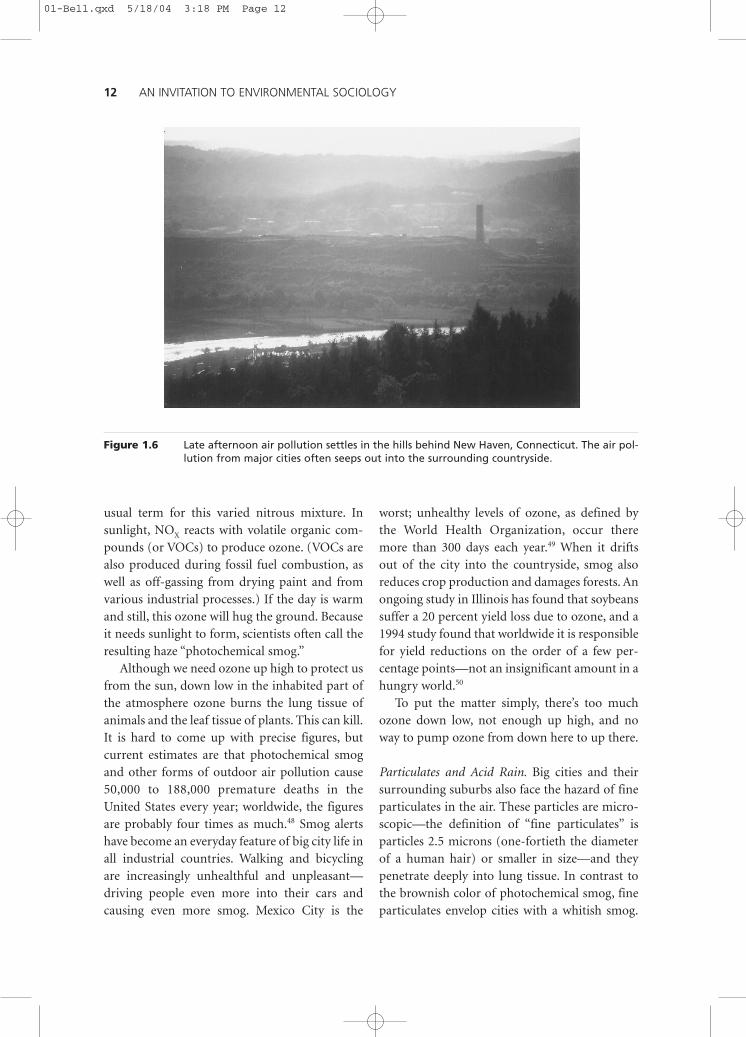
Much less progress, however, has been madeon resolving the other ozone problem: ozone atground level. Hardly a city in the world is free ofa frequent brown haze above which only thetallest buildings rise. (See Figure 1.6.) Ozone isthe principal component of this brown smog thathas become an unpleasantly familiar feature ofmodern urban life.
Ground-level ozone forms when sunlightglares down on a city’s dirty air. As a result of fos-sil fuel combustion, cars and factories dischargelarge volumes of a whole array of nitrogen oxidecompounds. NOX (pronounced “knocks”) is the
Environmental Problems and Society——11
01-Bell.qxd 5/18/04 3:18 PM Page 11
usual term for this varied nitrous mixture. Insunlight, NOX reacts with volatile organic com-pounds (or VOCs) to produce ozone. (VOCs arealso produced during fossil fuel combustion, aswell as off-gassing from drying paint and fromvarious industrial processes.) If the day is warmand still, this ozone will hug the ground. Becauseit needs sunlight to form, scientists often call theresulting haze “photochemical smog.”
Although we need ozone up high to protect usfrom the sun, down low in the inhabited part ofthe atmosphere ozone burns the lung tissue ofanimals and the leaf tissue of plants. This can kill.It is hard to come up with precise figures, butcurrent estimates are that photochemical smogand other forms of outdoor air pollution cause50,000 to 188,000 premature deaths in theUnited States every year; worldwide, the figuresare probably four times as much.48 Smog alertshave become an everyday feature of big city life inall industrial countries. Walking and bicyclingare increasingly unhealthful and unpleasant—driving people even more into their cars andcausing even more smog. Mexico City is the
worst; unhealthy levels of ozone, as defined bythe World Health Organization, occur theremore than 300 days each year.49 When it driftsout of the city into the countryside, smog alsoreduces crop production and damages forests. Anongoing study in Illinois has found that soybeanssuffer a 20 percent yield loss due to ozone, and a1994 study found that worldwide it is responsiblefor yield reductions on the order of a few per-centage points—not an insignificant amount in ahungry world.50
To put the matter simply, there’s too muchozone down low, not enough up high, and noway to pump ozone from down here to up there.
Particulates and Acid Rain. Big cities and theirsurrounding suburbs also face the hazard of fineparticulates in the air. These particles are micro-scopic—the definition of “fine particulates” isparticles 2.5 microns (one-fortieth the diameterof a human hair) or smaller in size—and theypenetrate deeply into lung tissue. In contrast tothe brownish color of photochemical smog, fineparticulates envelop cities with a whitish smog.
12——AN INVITATION TO ENVIRONMENTAL SOCIOLOGY
Figure 1.6 Late afternoon air pollution settles in the hills behind New Haven, Connecticut. The air pol-lution from major cities often seeps out into the surrounding countryside.
01-Bell.qxd 5/18/04 3:18 PM Page 12

About half of these particulates are basically dust,mainly released because of poor fuel combustionin cars, trucks, power plants, wood stoves, andoutdoor burning, or kicked up by traffic, con-struction, and wind erosion from farms. Most ofthe rest are tiny pieces and droplets of sulfates,nitrates, and VOCs formed in the atmosphere fol-lowing the burning of fossil fuels, such as the coalused for electric generation—what are called “sec-ondary” particulates.51 Ammonium and ammo-nium compounds also contribute significantly tosecondary fine particulate pollution, mainly dueto emissions from livestock and fertilizers.
According to a 1996 study by the NaturalResources Defense Council, some 64,000Americans a year suffer premature death becauseof fine particulates; a 1991 study by the U.S.Environmental Protection Agency found a similarresult.52 Another study found that in Americancities with the most fine particulates, residents are15 to 17 percent more likely to die prematurely.53
Fine particulates smaller than 10 microns indiameter are the most dangerous ones.
And then there’s acid rain. This is an issue thathas largely dropped from sight, after a flurry ofconcern in the 1970s and early 1980s over sharpdeclines in the populations of some fish andfrogs and extensive signs of stress and die-back inmany forests. But acid rain is still falling from thesky, despite substantial efforts to reduce acidify-ing emissions of sulfur dioxide and NOX (whichalso have other dangerous impacts, as we haveseen). These pollutants combine with water inthe atmosphere to acidify rain, resulting in directdamage to plant tissues, as well the leaching ofnutrients from soil and the acidification of lakewaters, which in turn affect most wildlife—par-ticularly in areas with normally acidic condi-tions, where ecosystems have less capacity tobuffer the effects of acid fallout. When things getbad enough, lakes die and trees refuse to grow,like the miles of blasted heath that surround theold nickel smelters in Sudbury, Ontario. The sit-uation is especially severe in northern Europe,where more than 90 percent of natural ecosys-tems have been damaged by acid rain, and where
a year 2000 survey by the European Union foundthat 22 percent of all trees in Europe have lost 25percent or more of their leaves.54 Conditions arealso quite worrisome in much of Canada and inthe forests of the northeastern United States.
In fact, the situation seems to be gettingworse. Between 1992 and 1999, the condition oftrees in Europe did improve in 15 percent of thetest sites, but deteriorated in a further 30 per-cent.55 Similarly in the United States, a 2000review of the scientific literature by the federalgovernment’s General Accounting Office foundthat the condition of lakes in New Englandand the Adirondack Mountains of New Yorkwas either stable or getting worse, but noneseemed to be improving.56 Some 43 percent ofAdirondack lakes are expected to be acidic by2040—up from the 19 percent observed to beacidic in 1984.57 In Taiwan, the Central WeatherBureau has registered increasingly severe acidrain events in recent years.58 There does, however,seem to be some slight improvement in the con-dition of Canadian lakes and forests—but onlyslight.59
Why after so many years of effort does acidrain still threaten? Technological improvements,international treaties, and domestic legislationhave all contributed to a sharp decline in sulfuremissions in most countries. But we have madelittle overall progress in reducing nitrogen emis-sions. Industry’s nitrogen emissions have beenreduced, but these advances have been over-whelmed by increased emissions from automo-biles and trucks as the world comes to rely evermore on these highly polluting forms of trans-portation.60 Plus there is evidence that the abilityof sensitive ecosystems to handle acid rain hasbeen damaged such that slight improvement inthe acidity of rain often does not result in anyimprovement in the condition of lakes andforests.61
Acid rain is still a big problem.
Threats to Land and Water. There’s a well-knownsaying about land: They aren’t making any moreof it. The same is true of water. And in a way,
Environmental Problems and Society——13
01-Bell.qxd 5/18/04 3:18 PM Page 13

there is less of both each year as the expansion ofindustry, agriculture, and development erodesand pollutes what we have, reducing the world’scapacity to sustain life.
Consider soil erosion in the United States. Soilerodes from American cropland 16 times fasterthan it can form anew through ecologicalprocesses.62 Despite decades of work in reducingsoil erosion, largely in response to the lessons ofthe Dust Bowl, it still takes a bushel of soil erosionto grow a bushel of corn.63 The ConservationReserve Program, implemented by the U.S.Congress in 1985 and reauthorized in 1996,resulted in significant improvements by offeringfarmers 10-year contracts to take the most erod-able land out of production. Many farmers havealso switched to much less erosive cropping prac-tices. Consequently, soil lost to water erosiondropped from 1,700 million tons each year to1,150 million tons, and soil lost to wind erosiondropped from 12 tons per hectare to 11 tons.64
But those numbers are still way too high, mostobservers in and out of agriculture agree.
Elsewhere, the situation is equally grim. Soilerosion exceeds replacement rates on a thirdof the world’s agricultural land.65 Worldwide,almost a quarter—23 percent—of the world’scropland, pasture lands, forests, and woodlandshave been become degraded.66 True, fertilizerscan make up for some of the production lossesthat come from eroded soils, at least in the shortterm, but only at increased cost to farmers andwith increased energy use from the production offertilizer and the application of it to fields—andincreased water pollution as the fertilizer washesoff into streams, rivers, and groundwater.
Soil erosion is only one of many seriousthreats to farmland. Much of the twentieth cen-tury’s gains in crop production was due to irriga-tion. But irrigation can also salinize soils. Becausemost irrigation occurs in parched regions, theabundant sunlight of dry climates evaporatesmuch of the water away, leaving salts behind. InChina, nearly half of the cropland is irrigated,and 15 percent of the irrigated land is affectedby salinization. In the United States, only about
10 percent of cropland is irrigated, but almost aquarter of it has experienced salinization. InEgypt, virtually 100 percent of cropland is irri-gated, and almost a third of it is affected bysalinization.67
Irrigation can also waterlog poorly drainedsoils. Clearing of land is doing the same thing inAustralia. Once the land is cleared of its nativewoodland and bush, rates of transpiration—thepumping of water through the leaves of plants,enabling plants to “breathe”—slow down. Watertables in the dry wheat belt of western Australiaare rising by up to 1 meter a year, waterloggingthese poorly drained soils. This in turn can leadto salinization as waterlogged soils bake in thesun. One estimate suggests that 33 millionhectares of land have been degraded by saliniza-tion in Australia, resulting in an annual loss of$200 million (in Australian dollars) worth offarm production.68 Thus over-irrigation can turnsoils both swampy and salty at the same time.
Irrigation of cropland, combined with thegrowing thirst of cities, is leading to an evenmore fundamental problem: a lack of water. TheGlobal Water Policy Project categorizes 36 nationsaround the world as “water-stressed”—that is,they do not have sufficient water resources toprovide for their population’s agricultural,industrial, and residential needs.69 How do theysurvive? Mainly by importing food, a strategythat leaves them dependent on world markets.Even in countries not classified as water-stressed,the situation is increasingly dire. Take the UnitedStates and Mexico. By the time it reaches theocean in the Gulf of California, the Colorado isprobably the world’s most famous non-river, fornot a running drop remains after the farms andcities of the United States and Mexico have drunktheir fill. Further development in the regionsdependent on the Colorado River will requirewater from other sources—and it is not obviouswhere those generally dry territories can easilyfind other sources—or greatly improved effi-ciency in current water use.
In the Murray-Darling Basin of Australia, thecountry’s richest agricultural region, the story is
14——AN INVITATION TO ENVIRONMENTAL SOCIOLOGY
01-Bell.qxd 5/18/04 3:18 PM Page 14

much the same. Now only a fifth of the waterthat enters the basin’s rivers is still there by thetime the Murray reaches the sea, and the compara-tive trickle of water that remains is salty and proneto bacterial blooms and fish kills.70 Perhaps themost dramatic example of overuse of watersources is the Aral Sea in central Asia—once theworld’s fourth largest lake. Diversion for irrigationhas reduced the Aral’s surface area by 60 percentand its water volume by nearly 80 percent. Salinityhas quadrupled, former fishing ports lie milesinland, thousands of square miles of lake bottomhave turned to desert, the original fish are gone(as well as half the bird and mammal species), andthe region’s economy has collapsed.71
Not only surface water, but groundwater too isbeing rapidly depleted. Over-irrigation can leadto rising water tables and the waterlogging ofsoils in some regions, but the more general prob-lem is falling water tables from the depletion ofgroundwater stocks. Around the world, extrac-tion of groundwater for cities and farms isexceeding replenishment rates. Recent produc-tion gains in agriculture in India have reliedheavily on irrigation from groundwater, but now,because of what one observer has called a “raceto the bottom of the aquifer,” local villagers arebeing forced to pump from as deep as 700 feet.72
Water levels are dropping in some 90 percent ofwells in the Indian state of Gujarat.73 In the dryGreat Plains of the United States, farmers pumpthe famous Ogallala Aquifer far faster than itrecharges from precipitation, endangering 15 per-cent of U.S. corn and wheat production and25 percent of U.S. cotton production. Nearly afifth of the Ogallala’s water reserves have alreadybeen pumped out, and the taps have had to beturned off in many places.74 In the north Chinaplain, a major grain-producing area, water tableshave been dropping at the rate of 3–5 feet eachyear, due to overdraw for irrigation.75 In someregions, the lowering of water tables is causingmajor land subsidence. Downtown Mexico Cityhas dropped nearly 25 feet.76 Some parts of theCentral Valley of California have dropped asmuch.77 Venice has dropped just 10 centimeters
because of pumping of the freshwater aquiferbeneath it, but for a city at the water line that isan alarming figure.78
Overextraction can degrade the quality of thegroundwater that remains. The main threat hereagain is salinization, either through the overap-plication of irrigated water applied to the land’ssurface or through the invasion of seawater intoshrinking groundwater aquifers. Ten percent ofwells in Israel have already been abandonedbecause of seawater invasion, and many morewill soon have to be given up.79 In the Indianstate of Gujarat, half the hand-pumped wells arenow salty.80 When irrigated water is overapplied,the salinization of the soil can be carried downinto the aquifer, as the water percolates downpast crop roots. In many areas, only some 30–40percent of irrigated water actually reaches crops,with the rest being lost through evaporation andpercolation, promoting salinization of ground-water. In the lower Indus River Valley of Indiaand Pakistan, the situation is so bad that engi-neers have installed an expensive system ofpumps and surface drains to carry some of thesalinized groundwater away to the sea.81
Much of the freshwater that remains isbadly polluted. “The amount of water madeunusable by pollution,” Donella Meadows, DenisMeadows, and Jorgen Randers have noted, “isalmost as great as the amount actually used bythe human economy.”82 In fact, we are very closeto using, or making unusable, all the easily acces-sible freshwater—freshwater that is close towhere people live (as opposed to rivers in theArctic, say) and that can be stored in rivers, lakes,and aquifers (as opposed to the huge amounts offreshwater lost to the sea during seasonal floods,which cannot be easily stored).83 The remainingmargin for growth in freshwater use is disturb-ingly narrow.
Cleaning up water pollution is one way toincrease that vital margin, and industrial waterpollution has diminished in many areas, particu-larly in the wealthier countries. We have alsomade progress in controlling agricultural waterpollution. But we still have a long way to go. Since
Environmental Problems and Society——15
01-Bell.qxd 5/18/04 3:18 PM Page 15

1950, farmers across the world have upped theiruse of commercial fertilizers eightfold and theiruse of pesticides thirty-two-fold, although trendshave been leveling off and even dropping some-what recently.84 In the United States, the develop-ment of stronger pesticides for a number of yearsled to substantial drops in the number of poundsof pesticides farmers applied. But since the late1980s, the U.S. trend has been up once again,with about a 10 percent increase since that time.85
The resulting runoff continues to threaten thesafety of many drinking water supplies and hashad severe impacts on the ecological viability ofmany lakes, rivers, and streams. We all needsomething to eat and something to drink, butour efforts at maintaining food productionthrough the use of agricultural chemicals areputting us in the untenable position of tradingone for the other: food to eat for water to drink.
Or are we trading them both away? In addi-tion to the threats to agricultural productioncaused by soil erosion, salinization, waterlogging,and water shortages, we are losing considerableamounts of productive farmland to the expan-sion of roads and suburbs, particularly in thewealthiest nations. Cities need food; thus, thesensible place to build a city is in the midst ofproductive agricultural land. And that is justwhat people have done for centuries. But thecoming of the automobile has made possible(although not inevitable) the sprawling forms oflow-density development so characteristic of themodern city. The result is that cities now gobbleup not only food but also the best land for grow-ing it. The problem is worst in the United States,which has both a large proportion of the world’sbest agricultural land and also some of theworld’s most land-consuming patterns of devel-opment. Some 86 percent of fruit and vegetableproduction and 63 percent of dairy productioncomes from urban counties or from countiesadjacent to urban counties. Each year, some 1.2million acres of agricultural land was lost todevelopment between 1992 and 1997, an area thesize of Delaware.86 Given that the United Stateshas almost a billion acres of agricultural land,
this may not seem worth worrying about. But inmost cases, it is our best land that we are losing,and in the places where we most need it: close towhere people live.
Then factor into the calculation the effects ofglobal warming, photochemical smog, and acidrain on crop production. Add some major issuesI have not even mentioned: increased resistanceof pests to pesticides, declining response of cropsto fertilizer increases, the tremendous energyinputs of modern agriculture, loss of geneticdiversity, desertification due to overgrazing, pes-ticide residues in food. No wonder that increasesin agricultural production have been fallingbehind increases in human population. Totalgrain production has flattened out since 1996;the peak year was 1998.87 Plus there are morepeople to feed. The result is that, after decades ofsteady increases, world grain production per per-son per year has declined from the historical highof 346 kilograms in 1984 to 294 kilograms in2002, the first year below 300 kilograms since1972.88
The land fares ill, and there is less to eat andless to drink.
Environmental Justice
On the morning of January 4, 1993, 300,000Ogoni rallied together. The protesters wavedgreen twigs as they listened to speeches by KenSaro-Wiwa, a famous Ogoni writer, and others.With such a huge turnout, the Ogoni—a smallAfrican ethnic group, numbering only half a mil-lion in all—hoped that finally someone wouldpay attention to the mess that Shell Oil Companyhas made of their section of Nigeria. Leakingpipelines. Oil blow-outs that shower on nearbyvillages. Disrupted field drainage systems. (Muchof Ogoniland has to be drained to be farmed.)Fish kills. Gas flares that foul the air. Water sopolluted that even wearing clothes washed in itcauses rashes. Acid rain from the gas flares sobad that the zinc roofs people in the area favorfor their houses corrode away after a year.
16——AN INVITATION TO ENVIRONMENTAL SOCIOLOGY
01-Bell.qxd 5/18/04 3:18 PM Page 16

Meanwhile, the profits have flowed overseas toShell and to the notoriously corrupt Nigeriangovernment. The Ogoni have gotten only thepollution.89
Such open protest by the relatively powerless isa courageous act. And for the Ogoni, the conse-quences were swift and severe. During the nexttwo years, Nigerian soldiers oversaw the ransack-ing of Ogoni villages, the killing of about 2,000Ogoni people, and the torture and displacementof thousands more.90 Much of the terror wascarried out by people from neighboring regionswhom the soldiers forced or otherwise enticedinto violence so that the government could por-tray the repression as ethnic rivalry.91 The armyalso sealed the borders of Ogoniland, and no onewas let in or out without government permission.Ken Saro-Wiwa and other Ogoni leaders wererepeatedly arrested and interrogated. Finally, thegovernment trumped up a murder charge againstSaro-Wiwa and eight others and, despite a stormof objection from the rest of the world, executedthem on November 10, 1995.92 The torture andkilling of protestors continues, for example withthe shooting by police of Friday Nwiido on June15, 2001, a few weeks after Nwiido had led apeaceful protest against the April 29, 2001, oilblow-out that rained Shell’s crude onto thesurrounding countryside for nine days.93
The Ogoni experience is a vivid example of acommon worldwide pattern: Those with the leastpower get the most pollution.
The Ogoni experience is also an outrage, asvirtually the entire world (aside from Nigeria’srulers) agrees.94 This outrage is a reminder ofanother of the three central issues of environ-mentalism: the frequent and tragic challengesto environmental justice. There is a strikingunevenness in the distribution of environmentalbenefits and environmental costs—in the distri-bution of what might be termed environmentalgoods and environmental bads.95 Global warming,sea level rises, ozone depletion, photochemicalsmog, fine particulate smog, acid rain, soil ero-sion, salinization, waterlogging, desertification,loss of genetic diversity, loss of farmland to
development, water shortages, water pollution—these have a potential impact on everyone’s lives.But the well-to-do and well-connected are gener-ally in a better position to avoid the worst conse-quences of environmental problems—and, often,to avoid the consequences entirely.
Who Gets the Bads? Take the hazardous waste cri-sis, for instance. Wealthy countries are now find-ing that there is more to disposing of garbagethan simply putting it in a can on the curb. Oneresponse has been to pay others to take it. Wenow have a lively international trade, much of itillegal, in waste too hazardous for rich countriesto dispose of at home.
There has been considerable protest aboutthis practice. In 1988, Nigeria even went so far asto commandeer an Italian freighter with theintent of loading it up with thousands of barrelsof toxics that had arrived from Italy under suspi-cious circumstances and shipping it back toEurope. After a heated diplomatic dispute, thewaste—which in fact turned out to originate in10 European countries and the United States—was loaded on board the Karin B., a WestGerman ship, and sent back to Italy. But harborofficials in Ravenna, Italy, where the waste wassupposed to go, refused the load because of vig-orous local opposition to it. The Karin B. waslater refused entry in Cadiz, Spain, and bannedfrom French and British ports, where it also triedto land. Months later it was finally accepted intoItaly.96
In 1989, in response to diplomatic crises likethese, 105 countries signed the Basel Convention,which is supposed to control international toxicshipments. Yet loopholes are large enough, andenforcement lax enough, that these shipmentsstill go on. Nor do international conventionscontrol domestic companies like COINTERN ofMexico, which dumped 20,000 tons of illegalwaste near the Mexican town of Guadalcazarbetween 1989 and 1993. Nor do internationalconventions stop foreign companies from merelyrelocating their most hazardous productionpractices to poorer countries—like Metalclad,
Environmental Problems and Society——17
01-Bell.qxd 5/18/04 3:18 PM Page 17

Inc., of Illinois, which purchased the Guadalcazarsite, promising to clean up the dump, but only ifthe Mexican government would allow Metalcladto reopen the dump afterward.97 When localpeople and government officials tried to stopthem, Metalclad filed a successful suit in interna-tional court, using a provision of the NorthAmerican Free Trade Agreement. They were evenawarded $16.7 million in damages.98
Toxic wastes are typically local in their effects,and it is typically the local communities thatare least politically empowered—whether becauseof class, race, ethnicity, nationality, or rurallocation—that receive the bulk of them.99 So toofor the siting of hazardous industrial facilities.These are realities painfully well known to thepeople of Bhopal, Minamata, Toulouse, and LoveCanal, and the thousands of communities sub-jected to lesser-known local toxic disasters.Although individually smaller, these disasters arecollectively just as significant as the better-knownones, and perhaps more significant.100
Toxic wastes have an impact not only wherepeople live but also where they work. Considerthe cumulative effects of pesticides and toxicchemicals on those who work with them everyday. Many of our industrial practices exposeworkers—generally those on the production line,as opposed to those in the front office—to envi-ronmental hazards. Increasingly, the wealthycountries are exporting these kinds of jobs over-seas, where workers have less choice over theirconditions of employment, and then importingthe goods back home (but still scooping up theprofit in between). Exporting hazardous jobsdoes not lessen the degree of environmentalinequality involved, however. Indeed, the inequa-lity often increases because of lax environmentalregulation in poorer countries.
But all this seems to take the place far away—until a toxic disaster happens in your owncommunity. The growing placelessness of themarketplace makes it easy to overlook the devas-tating impact untempered industrialism canhave on the daily lives of the farm worker apply-ing alachlor in the field and the factory worker
running a noisy machine on a dirty and dangerousassembly line. When we shop, we meet a prod-uct’s retailers, not the people who made it, andthe products themselves tell no tales.
Who Gets the Goods? Environmental justice alsoconcerns patterns of inequality in the distributionof environmental goods. These patterns areusually closely associated with inequality in thedistribution of wealth. Thus, those who are con-cerned about environmental justice often point tothe huge inequalities in average income betweencountries. Here are the numbers, based on grossdomestic product (GDP) per capita in 2001 inU.S. dollars.101
The average annual income in the world is$5,120. In contrast, the average income in theworld’s 24 wealthiest countries is $26,510. In theUnited States, it is $34,280—and the UnitedStates is not the world’s richest country. Thatdistinction goes to Luxembourg at $39,840 percapita, and $48,560 in per capita buying powerwhen we take into account the lower cost ofliving there. (The United States ranks as the secondrichest country in the world in per capita buyingpower.)
With all that income flowing up top, hardlyany is left for those on the bottom. The people ofthe 49 poorest nations average just $430 percapita per year—hardly more than a dollar a day.The 53 million people of the DemocraticRepublic of the Congo have the lowest average:just $80 per capita per year. The situation ishardly better for the people of Ethiopia andBurundi: just $100. In Sierra Leone it’s $140.True, the cost of living is unusually low in thosecountries. That $80 annual income in Congobuys about what $630 buys in the United States.But even $630 is not very much. And becauseSierra Leone’s cost of living is higher than theDemocratic Republic of the Congo’s, a $140annual income in Sierra Leone buys only aboutwhat $460 buys in the United States, makingSierra Leone the world’s poorest nation, accord-ing to these figures—still hardly more than adollar a day.102 Imagine living on so little.
18——AN INVITATION TO ENVIRONMENTAL SOCIOLOGY
01-Bell.qxd 5/18/04 3:18 PM Page 18

Moreover, despite the many advances intechnology and the change to a more market-oriented world economy, income inequality hasdramatically increased in recent decades. In1960, the fifth of the world’s people living in itsrichest countries commanded 30 times as muchof the world’s income as the fifth of people livingin the poorest countries—a figure that, in mostpeople’s view, was bad enough.103 Roughly 100years earlier, in 1879, it was 7 to 1.104 But today,that richest fifth commands 68 times as much ofthe world’s income as the poorest fifth.105
These figures are all based on the populationsof whole countries. But there are also substantiallevels of inequality within countries. Typically,the income differential between the richest20 percent and poorest 20 percent within a countryis 6 to 1 or less.106 In many poor and middleincome countries, however, the numbers are farhigher. The situation is most extreme in SierraLeone, where the richest fifth command 57.6times the income of the poorest fifth. In anotherhalf-dozen countries, such as Brazil and SouthAfrica, the ratio is 30 to 1 or higher.107 In 13 othercountries, it is 15 to 1 or higher.
Although there is usually less inequality inwealthy countries, some do exceed the worldnorm. In Germany, the ratio of richest to poorest20 percent is 8 to 1. In the United States, it is 9to 1. Interestingly, the situation in the UnitedStates represents a historical reversal. In the1920s (the first decade for which these figures areavailable), the United States was one of the mosteconomically egalitarian countries, givingAmerica the image of the land of opportunity. Incomparison, most European countries, such asBritain, were more wealth stratified at the time.Today European countries are all less stratified,in most cases much less so—such as the 4 to 1figures for the Scandinavian countries and the5 to 1 and 6 to 1 figures for France, Belgium,Switzerland, Spain, and the Netherlands.108 Thelowest figure in the world is for Japan, 3.4 to 1.109
Inequality within countries means that the 68to 1 ratio of income between the fifth of peopleliving in the richest countries and the fifth living
in the poorest understates the level of globalinequality. If the richest fifth of the world populationfrom all countries, rich and poor, were puttogether, their income would likely total 150 timesthat of the poorest fifth of the world’s popula-tion.110 (See Figure 1.7.)
Consequently, taking the world’s populationas a whole, the number of very poor people isstaggering. Some 1.2 billion live on less than $1 aday. Some 2.8 billion—nearly half the world—live on less than $2 a day.111 One could try to putthe matter in more positive terms and point outthat the percentage of the world’s populationnow living on less than $1 a day is smaller than itwas in the 1980s—24 percent versus 28 percent.But the number of people living in povertyremains about the same, and the differencebetween top and bottom has continued to widen,as we have seen.112 And if we compare today with1960, the percentage has remained quite similarwhile the number has roughly doubled.113
The wealth of the world’s richest people isequally staggering. During the peak of the late1990s’ economic expansion, in 1999, the wealth ofthe 200 richest people in the world hit about $1trillion. That’s a cool $5 billion each, about dou-ble what they had in 1994. Now consider thewealth of the 582 million people living in theworld’s 43 poorest countries. As their assets are sominimal, we can roughly speaking consider theirannual income the same as their wealth. Thatincome for all of them together amounts to $156billion, less than a sixth of the wealth of the 200richest.114 Now let’s make a simple (and generous)assumption about the 2.8 billion living on lessthan $2 a day—that they each make the full $2 aday, giving them a combined annual income(and, again, roughly speaking a combined wealth)of $1.022 trillion. Two hundred people, as wealthyas 2.8 billion. In fact, the assets of the three wealth-iest people in the world exceed $146 billion.115
Three people, wealthier than 582 million.While only one of them is Bill Gates, the
wealth of the average person in the rich countriesleads to a substantial global consumption gap. Theaverage person in the rich countries consumes
Environmental Problems and Society——19
01-Bell.qxd 5/18/04 3:18 PM Page 19

three times as much grain, fish, and freshwater;six times as much meat; 10 times as much energyand timber; 13 times as much iron and steel; and14 times as much paper as the average resident ofa developing country. And that average personfrom a rich country uses 18 times as much inchemicals along the way.116 These consumptionfigures are lower than the 68 to 1 income differ-ential because the comparison here is betweenthe roughly 20 percent of the world that lives inindustrial countries and the roughly 80 percentwho don’t—not the richest fifth of countries andthe poorest fifth. If the 60 percent in the middle
were removed from the calculations, theconsumption gap for many of these items wouldprobably reach or exceed the 68 to 1 ratio ofwealth. (For some items, however, it would not—even a very wealthy person can eat only so muchgrain, fish, and meat.)117
Along with the consumption gap comes anequally significant pollution gap. The wealthy ofthe world create far more pollution per capitathan do the poor. For example, in the rich coun-tries, per capita emissions of carbon dioxide are12 times higher than in poor countries.118
Moreover, the rich countries are also more able to
20——AN INVITATION TO ENVIRONMENTAL SOCIOLOGY
Poorest fifth
Distribution of world income based on persons:Richest fifth receives 150 times the poorest fifth
Distribution of world incomebased on countries:Richest fifth receives
68 times the poorest fifth
Richest fifth
Figure 1.7 The champagne glass of world wealth distribution. The fifth of world population from theworld’s richest countries receives about 68 times the income of the fifth of world populationfrom the poorest countries. When calculated on the basis of the richest fifth of persons fromall countries versus the poorest fifth from all countries, the ratio of income disparity likelyrises to 150 to 1.
01-Bell.qxd 5/18/04 3:18 PM Page 20

arrange their circumstances such that effects ofthe pollution they cause are not as significantlyfelt locally, as with the export of toxic wastes.
The consequences of these differentials areserious indeed. Roughly 900 million people in thelow- and middle-income countries suffer malnu-trition, about 14 percent of the total world popu-lation.119 Thirty-four percent of the children in thedeveloping countries are underweight for theirage, a figure that reaches as high as 66 percent inBangladesh, one of the world’s poorest nations.Because of rampant malnourishment, adults facea reduced capacity to work and children grow upsmaller, have trouble learning, and experience life-long damage to their mental capacities.120
Many of the world’s poor find it difficult toprotect themselves from environmental bads. Alltold, 1 billion people do not have shelter thatadequately protects them from such environ-mental hazards as rain, snow, heat, cold, filth, andrats and other pests. One hundred million haveno shelter at all.121 Moreover, the world’s poor aremore likely to live on steep slopes and in low-lying areas that are prone to landslides andfloods. More than a billion lack access to safedrinking water.122 Two and a half billion do nothave adequate sanitation.123 The poor are alsotypically relegated to the least productive farm-land, undermining their capacity to providethemselves with sufficient food (as well asincome). Compounding the situation are thecommon associations between poor communi-ties and increased levels of pollution and toxicwaste and between poverty and environmentallyhazardous working conditions.
It is also possible to have too much of thegood things in life. The world over, 1 billionpeople—and counting—are overweight, more thanthe number who do not have enough food. Some300 million people are obese.124 And the diseasesassociated with too much food are increasing aswell: diabetes (especially type II), hypertension,heart disease, stroke, and many forms of cancer.In the United Kingdom, two-thirds of men andhalf of women are either overweight or obese.The prevalence of obesity in the United Kingdom
tripled between 1980 and 1998 to 21 percent ofwomen and 17 percent of men.125 The situationin the United States is even worse, with some65 percent of all adults overweight or obese in2000. Obesity in the United States has doubledsince 1980 to 31 percent.126 Other wealthy coun-tries have experienced weight rises as lifestyleshave become more sedentary and calorie intakehas increased.
But the problem of overweight is not limitedto the wealthy nations. Weight problems areincreasing dramatically in poorer nations, aspeople increasingly take up more sedentary livesthere, and as food consumption shifts more intothe marketplace and away from home produc-tion, making healthier foods less readily availablefor the poor. The problem is particularly pro-nounced in urban areas. In urban Samoa, 75 per-cent of adults are obese—not just overweight,but obese. In some cities in China, 20 percent ormore are obese.127 Yet the world’s wealthy aregenerally better able to protect themselves fromthe consequences of high weight. Medical treat-ments for diabetes, circulation problems, andcancer are far less accessible for the poor.
Considering these stark facts, it comes as nosurprise that people in the wealthy countries livean average of almost 28 years longer than thosein the poor countries, despite great advances inthe availability of medical care—78.1 years ver-sus 50.4 years.128 In 14 very poor countries, theaverage person has no better than a 50 percentchance of reaching age 40.129 In the least devel-oped countries, 24 percent won’t even make it toage 5.130
Within-country differences in income have asubstantial impact on the quality of life of thepoor, even in rich countries. In the United States,some three and half million Americans experi-ence a period of homelessness during the year,about a third of them children, according to a2000 study.131 A 2001 survey of 27 cities by theU.S. Council of Mayors found that requests foremergency shelter services were up in 22 ofthem.132 Although conditions have substantiallyimproved in the European Union since the
Environmental Problems and Society——21
01-Bell.qxd 5/18/04 3:18 PM Page 21

mid-1990s, some 390,000 people in Germany arestill homeless, plus about 200,000 in Italy andabout 165,000 in the United Kingdom, accordingto a 2002 study.133 Thirty million Americans—about 11 percent of the U.S. population—livein conditions of “food insecurity,” the U.S.Department of Agriculture’s term for householdsthat face difficulty meeting basic food needs forall its members. About a third of these householdsreported experiencing involuntary hunger atsome point during the year. Rates of food insecu-rity are twice as high for black and Hispanichouseholds as they are for white households. Andas of 2001, the trend is getting worse, not better.134
A 2001 study revealed that 7 million Americansreceive food assistance from emergency foodpantries and other sources in any given week.135
Almost 60 percent of food assistance agencies inthat study reported that the number of peopleusing their services is going up.136
Food, shelter, longevity—these are the mostbasic of benefits we can expect from our envi-ronment. And yet people’s capabilities to attainthem are highly unequal. As Tom Anthanasiouhas observed, ours is a “divided planet.”137
The Rights and Beauty of Nature
“A thing is right when it tends to preserve theintegrity, stability, and beauty of the biotic com-munity. It is wrong when it tends otherwise.”138
These are probably the most famous lines everwritten by Aldo Leopold, one of the most impor-tant figures in the history of the environmentalmovement. His words direct our attention to abroader sense of our community and, in a way, toa broader sense of equality and inequality.Understood in this way, environmental justiceconcerns not only the rights of humans but therights of nonhumans—of animals, plants, and eventhe land. Leopold also directs our attention to aword that is certainly one of the hardest of all todefine but is no less significant for that difficulty:beauty. (Indeed, the difficulty of defining beautymay be much of what makes it so significant.)
Threats to the integrity, stability, and beautyof the biotic community are manifold. Take theloss of species. (See Figure 1.8.) For example, ofthe 9,800 known species of birds, two-thirds arein decline.139 Some 12 percent are threatenedwith extinction, and another 8 percent seemlikely to become so soon.140 Many have alreadygone; the passenger pigeon, the dodo, the ivory-billed woodpecker, and the 11 species of moa areonly some of the best known. Since 1800, 103have gone extinct.141 With its moa and otherspecies that developed without pressure frommammalian predators, New Zealand has perhapsbeen the hardest hit; about half the bird speciesof the North and South Islands have disappearedin the past 800 years.142
Estimates of extinction rates for all speciesvary widely because we still do not have a goodcount of how many there are, or ever were. Manyspecies are still unknown or survive in such lownumbers that they are hard to study. But even thelow estimates are staggering. Perhaps the mostwidely regarded account, based entirely onindividual assessments for each species, is the “RedList” of the World Conservation Union, a 140-nation organization. The 2003 Red List currentlyregisters 12,257 species of plants and animals asthreatened with extinction. In addition to the12 percent of bird species, the list includes 24 percentof mammal species, 3 percent of fish, 4 percent ofreptiles, and 3 percent of amphibians. But whileinformation is available on all bird and almost allmammal species, only a fraction of the knownspecies of fish, reptiles, and amphibians have beenassessed by the World Conservation Union—lessthan 6 percent. Of those that have been assessed,some 49 percent of fish, 62 percent of reptiles, and39 percent of amphibians show up on the 2003Red List. Very few of the world’s 298,000 identifiedplant and lichen species and 1,190,000 identifiedinvertebrate species have been assessed—just3 percent of the plants and lichens and 0.3 ofthe invertebrates—so it is very hard to calculatereliable extinction figures for them.143
The overall extinction rate is thus in the realmof educated guesswork, given the spotty data we
22——AN INVITATION TO ENVIRONMENTAL SOCIOLOGY
01-Bell.qxd 5/18/04 3:18 PM Page 22

have. Richard Leakey, the famous paleontologist,is one who has made a try. He suggests that wecould lose as many as 50 percent of all species onEarth in the next 100 years, largely because ofvery high rates of extinction among inverte-brates, the group we know the least about. (Forexample, some 72 percent of the insect speciesthat the IUCN has assessed are threatened.) IfLeakey’s anywhere near right, that would put thecurrent period of extinction on the same scale asthe one that did in most dinosaurs and much ofeverything else 65 million years ago, and fourearlier ones that had a similar effect on theEarth’s biota. That’s why Leakey and Roger Lewincall the current period the “sixth extinction.”144
Some biologists have placed the current rate ofextinction for all species at between 4,000 and36,000 each year, somewhere between one every10 minutes and one every 90 minutes.145 If so,that means it is likely that another species wentextinct since you began reading this chapter.When we add in the extinction of subspecies andvarieties, the decreasing diversity of planetary lifeis even more dramatic.
Of course, species have always come and gone,as Charles Darwin famously observed in his
theory of natural selection. But the rate of theselosses has greatly increased since the beginning ofthe Industrial Revolution. Some have disap-peared because of habitat loss, as forestlands havebeen cleared, grasslands plowed, and wetlandsdrained and filled. Some have suffered frompollution. Some have found themselves with nodefenses against animals, plants, and diseases thathumans have brought, often unintentionally,from other regions of the world. The Earth is asingle, gigantic preserve for life, and we have notbeen honoring its boundaries and protecting itsinhabitants.
The loss of species is an instrumental issue ofsustainability. The leaking global gene poolmeans a declining genetic resource base for thedevelopment of new crops, drugs, and chemicals.In addition, most ecologists suspect that decrea-sed diversity destabilizes ecosystems, ecosystemsthat we too need to survive. But the ethical andaesthetic impact of the loss of so many forms oflife may be as great, if not greater.
The loss is not only one of forms of life butalso forms of landscape. Take deforestation, anissue that has received much attention recently.The world has lost about half of its original
Environmental Problems and Society——23
Per
cent
age
of s
peci
es th
reat
ened
Fis
h
25
20
15
5
0
10P
lant
s
Rep
tiles
Am
phib
ians
Mam
mal
s
Bird
s
Figure 1.8 The hole in the gene pool: Percentage of known species threatened in the United States.
01-Bell.qxd 5/18/04 3:18 PM Page 23

forestland. Substantial degradation and fragmen-tation aff licts another 30 percent.146 Some 4.2 per-cent of the world’s forests were lost between 1990and 2000 alone, 94 percent in the tropics.147
Indonesia has lost 40 percent of its forests since1950. Rwanda and Burundi each lost 39 percentbetween 1990 and 2000 alone.148 (See Figure 1.9.)
Deforestation presents a challenge for sustain-ability. The loss of trees promotes global warm-ing as trees are converted into atmosphericcarbon dioxide and forest habitat is convertedinto agricultural land. Yet deforestation also hasan aesthetic impact, destroying the beauty offorests and the spiritual value of wooded wilder-ness. Forests can regrow, of course, but the mostrecent data finds that is only happening at about22 percent of the rate of deforestation.149 Forestscan also be replanted, but here again the rate isfar below the rate of loss. Some 161 million acresof natural forest were cut down in the 1990s, and31 million acres were replanted. Half of thatreplanting was on land where the natural forestswere cut down to make way for trees more desiredby the timber industry.150 These replanted forestsare poor substitutes for the woods they replace, atleast in terms of biodiversity—the ecological
equivalent of exchanging the paintings in theLouvre for a permanent display of engineeringblueprints.
There’s another loss too—the disappearanceof a kind of quiet intimacy with the Earth, thesense of being connected to the land and to eachother through land. (See Figure 1.10.) It is a com-mon complaint that modern technology removesus from contact with a greater, wilder, and some-how realer reality. This removal, it should be said,has been the whole point of modern technology,but some have come to wonder whether our livesare emptier because of it. A romantic concern,perhaps. But do we want a world withoutromance?
And finally, there’s the question of our right tomake such great transformations in the world.Nothing lasts forever, of course. Over millions ofyears, even a mountain is worn away by erosion.Wind, rain, ice, and changes in temperature con-stantly sculpt the land, and the shape of Earth’ssurface constantly changes as a result. But geo-logists now recognize humans to be the mostsignificant erosive force on the planet.151 Agri-culture, forest cutting, road building, mining,construction, landscaping, and the weathering
24——AN INVITATION TO ENVIRONMENTAL SOCIOLOGY
0
10
20
30
40
50
60
70
80
90
100
AR
GE
NT
INA
62%
ZA
IRE
10%
RU
SS
IA 1
2%
VE
NE
ZU
ELA
25%
PH
ILIP
PIN
ES
36%
UN
ITE
D S
TAT
ES
45%
SU
DA
N 5
2%
SPA
IN 6
0%
IND
IA 6
5% BA
NG
LAD
ES
H 8
1%
%
Figure 1.9 The human footprint in 10 countries: Percentage of land area converted from naturalecosystems.
01-Bell.qxd 5/18/04 3:18 PM Page 24

effects of acid rain—all these have resulted inenormous increases in the amount of sedimentthat rivers carry into the oceans. We wield thebiggest sculptor’s chisel now. Perhaps it is ourright. If so, then it is also our responsibility.
Although I have not covered the question ofthe rights and beauty of nature in much detail, letme conclude here. These issues are certainly noless worthy of our consideration than those ofsustainability and environmental justice, it seemsto me. But I’m exhausted just thinking about theothers, and I imagine you are too. Maybe that’sthe most difficult environmental problem of all.There are so many of them.
The Social Organizationof Environmental Problems
These matters seemed quite remote at that lovelybrunch as we loaded up our plates with fruitsalad, coffee cake, scrambled eggs, bread, butter,and those great hominy grits. Remote but ironic.Here I was amid a group of three families whoseincomes, although not unusually high by
Western standards, are sufficient to command abrunch that two centuries ago would have beenseen as lavish even by royalty. And what was Idoing? Once I had finished explaining environ-mental sociology, I was reaching for seconds.
My point is not that there is something wrongwith pigging out every once in a while. Nor is itthat consumption is necessarily a bad thing. (Tolive is to consume.) Rather, I tell this storyto highlight how social circumstances can lead tothe sidelining of concern and action about envi-ronmental consequences.
Everything we do has environmental implica-tions, as responsible citizens recognize today. Theadults at the brunch were genuinely interested inmy explanation of environmental sociology forjust that reason. But the currents of social lifequickly washed over the momentary island ofrecognition and concern that my explanationhad created. (One does not dwell long on anytopic at a party.) Soon we were all reaching formore of the eggs from chicken-factory hens; thefruit salad with its bananas raised on deforestedland and picked by laborers poorly protectedfrom pesticides; the coffee cake made with butter
Environmental Problems and Society——25
Figure 1.10 The beauty of nature: Sunset on the Connecticut coast.
01-Bell.qxd 5/18/04 3:18 PM Page 25

and milk from a dairy herd likely hundreds ofenergy-consuming miles away; the grits madefrom corn grown on an Iowa farm at the price ofone bushel of soil erosion for one bushel of grain.Meanwhile, the conversation moved on to othermatters. And soon we guests would be gettinginto our cars and driving home, spewing smogand greenhouse gases all along the way.
A completely ordinary brunch. But do yourefuse to invite friends over because you cannoteasily get environmentally friendly ingredientsfor the dishes you know how to prepare? Do yourefuse a host’s food because it was produced in adamaging and unjust manner? And do you refusean invitation to brunch because the buses don’trun very regularly on a Sunday morning, becausea 20-minute ride in the bike trailer in below-freezing weather seems too harsh and long foryour 5-year-old, and because no one nearbyenough to carpool with is coming to the party?Do you refuse, especially when you have yourown car sitting in the driveway, as is almostcertainly the case in the United States?
Likely not.What leads to this sidelining of environmental
concern and action is the same thing that manu-factures environmental problems to begin with:the social organization of daily life—how we as ahuman community institute the many structuresand motivations that pattern our days. Caught inthe flow of society, we carry on and carry on andcarry on, perhaps pausing when we can to get aview of where we’re eventually headed, but in themain just trying to keep afloat, to be sociable, andto get to where we want to go on time. Our livesare guided by the possibilities our social situation
presents to us and by our vision of what thosepossibilities are—that vision itself being guidedin particular directions by our social situation.That is to say, it is a matter of the social organi-zation of both our material conditions and theideas we bring to bear upon them. Yet the envi-ronmental implications of those conditions andthose ideas are seldom a prominent part of howwe socially organize our situation. Instead, thatorganization typically depends most on a moreimmediate presence in our lives: Other people.
We need, I believe, to consider the environ-ment as an equally immediate (and more social)presence in our lives. That does not mean we needto be always thinking about the environmentalconsequences of what we do. As an environmen-tal sociologist, I cannot expect this—especiallywhen I don’t always think about environmentalconsequences myself. People have lots and lotsof other concerns. Nor should it be necessaryto think constantly about environmental conse-quences. Rather, what is necessary is to think care-fully about how we as a community organize thecircumstances in which people make environ-mentally significant decisions. What is necessaryis to create social situations in which people takethe environmentally appropriate action, evenwhen, as will often be the case, they are not at thatmoment consciously considering the environ-mental consequences of those actions. What isnecessary is to reorganize ourselves so what wedaily find ourselves doing compromises neitherour social nor our environmental life.
The challenge of environmental sociology isto illuminate the issues such a reorganizationmust consider.
26——AN INVITATION TO ENVIRONMENTAL SOCIOLOGY
01-Bell.qxd 5/18/04 3:18 PM Page 26