environmental impact comparison conventional road
TRANSCRIPT
Life cycle analysis Environmental impact comparison
conventional road construction and RoadCem constructions
RoadCem construction N 227, province of Utrecht


project 27.054: LCA Environmental impact comparison conventional road construction and RoadCem constructions
Client: PowerCem Technologies BV Plaza 24 4782 SK Moerdijk (T) 0168-409440 (E) [email protected] website: www.powercem.com
Contractor: Dutch Institute for Building Biology and Ecology, NIBE BV
Bussummergrindweg 1B 1406 NZ Bussum (T) 035-6948233 (E) [email protected] website: www.nibe.org
document: 27.054.17.08.006 version: final 1.1 date: September 2017 order manager: Drs. Ing. Rick Scholtes project team: Ir. Jörg Blass
© 2017 Dutch Institute for Building Biology and Ecology, NIBE Research bv All rights reserved. No part of this publication may be reproduced and/or published by means of print, photocopy, microfilm or otherwise without prior permission from the Dutch Institute for Building Biology and Ecology. Without prior written permission from the Dutch Institute for Building Biology and Ecology, it is not permitted to: a) fully or partly publish a report issued by the Dutch Institute for Building Biology and Ecology or make it public in any other way; b) fully or partly use a report issued by the Dutch Institute for Building Biology and Ecology for the benefit of lodging claims, for conducting
legal proceedings and for the benefit of advertising or comparative advertising; c) use the name and/or logo of the Dutch Institute for Building Biology and Ecology, in whatever connection, when making public a part
or parts of a report issued by the Dutch Institute for Building Biology and Ecology and/or for one of the objectives stated in sub. b. Providing the report drawn up by the Dutch Institute for Building Biology and Ecology to directly interested parties for inspection is permitted.

27.054.17.08.006 – NIBE Research bv 5
CONTENTS 1. Introduction ............................................................................................................................................. 9
Background ................................................................................................................................. 9 Objective, target group and application ..................................................................................... 9 Methods and databases .............................................................................................................. 9
2. The study ............................................................................................................................................... 10 Introduction .............................................................................................................................. 10 Calculation unit ......................................................................................................................... 11 Description of the constructions ............................................................................................... 11 System boundaries .................................................................................................................... 13 Preconditions ............................................................................................................................ 14
3. Inventory ............................................................................................................................................... 15 Processes of applications in all constructions ........................................................................... 16 Processes applicable in all simulations of the Conventional construction ................................ 16 Processes applicable in all simulations of the RoadCem (1.6 kg/m³) construction ................... 17 Processes applicable in all simulations of the RoadCem (1.4 kg/m³) construction ................... 18 Transport distances for disposal of raw materials to the construction site (A5) ...................... 19 Transport distances for supply of raw materials to the construction site (A4) ......................... 19 Waste scenarios ........................................................................................................................ 24
4. Results ................................................................................................................................................... 26 Shadow costs Simulation 1 ........................................................................................................ 26 Shadow costs Simulation 2 ........................................................................................................ 27 Shadow costs Simulation 3 ........................................................................................................ 29 Shadow costs Simulation 4 ........................................................................................................ 30 Shadow costs Simulation 5 ........................................................................................................ 32 Comparison shadow costs simulations and road constructions ............................................... 33
5. Conclusion ............................................................................................................................................. 37
6. Sources .................................................................................................................................................. 41
6 27.054.17.08.006 – NIBE Research bv
Overview of tables Table 1 - Simulation distances ............................................................................................................................... 10 Table 2 - Points of departure for calculating the road constructions .................................................................... 15 Table 3 - Processes for the bituminous sub-layer + adhesive layer ....................................................................... 16 Table 4 - Processes for the disposal of soil ............................................................................................................ 16 Table 5 - Processes for the asphalt layer for the conventional construction ........................................................ 16 Table 6 - Processes for the AGRAC layer for the conventional construction ......................................................... 17 Table 7 - Processes for the sand layer for the conventional construction ............................................................ 17 Table 8 - Processes for the asphalt layer for the RoadCem (1.6 kg/m³) construction ........................................... 17 Table 9 - Processes for the RoadCem/cement for the RoadCem (1.6 kg/m³) construction .................................. 18 Table 10 - Processes for the asphalt layer for the RoadCem (1.4 kg/m³) construction ......................................... 18 Table 11 - Processes for the RoadCem/cement for the RoadCem (1.4 kg/m³) construction ................................ 18 Table 12 - Transport for disposal of raw materials (all constructions and all simulations) ................................... 19 Table 13 - Transport to construction site - conventional construction - simulation 1 .......................................... 19 Table 14 - Transport to construction site – RoadCem (1.6 kg/m³) construction - simulation 1 ............................ 19 Table 15 - Transport to construction site - RoadCem (1.4 kg/m³) construction - simulation 1 ............................. 20 Table 16 - Transport to construction site - conventional construction - simulation 2 .......................................... 20 Table 17 - Transport to construction site – RoadCem (1.6 kg/m³) construction - simulation 2 ............................ 20 Table 18 - Transport to construction site - RoadCem (1.4 kg/m³) construction - simulation 2 ............................. 21 Table 19 - Transport to construction site - conventional construction - simulation 3 .......................................... 21 Table 20 - Transport to construction site - RoadCem (1.6 kg/m³) construction - simulation 3 ............................. 21 Table 21 - Transport to construction site - RoadCem (1.4 kg/m³) construction - simulation 3 ............................. 22 Table 22 - Transport to construction site - conventional construction - simulation 4 .......................................... 22 Table 23 - Transport to construction site – RoadCem (1.6 kg/m³) construction - simulation 4 ............................ 22 Table 24 - Transport to construction site - RoadCem (1.4 kg/m³) construction - simulation 4 ............................. 23 Table 25 - Transport to construction site - conventional construction - simulation 5 .......................................... 23 Table 26 - Transport to construction site - RoadCem (1.6 kg/m³) construction - simulation 5 ............................. 23 Table 27 - Transport to construction site - RoadCem (1.4 kg/m³) construction - simulation 5 ............................. 24 Table 28 - Total transport distances truck and ship in the different simulations .................................................. 24 Table 29 - Waste scenarios for the materials ........................................................................................................ 24 Table 30 - amount of waste per construction ....................................................................................................... 25 Table 31 - transport distance from construction site to processing ...................................................................... 25 Table 32 - Shadow costs per phase - Conventional - simulation 1 ........................................................................ 26 Table 33 - Shadow costs per phase - RoadCem (1.6 kg/m³) - simulation 1 ........................................................... 26 Table 34 - Shadow costs per phase - RoadCem (1.4 kg/m³) - simulation 1 ........................................................... 27 Table 35 - Shadow costs per phase - Conventional - simulation 2 ........................................................................ 27 Table 36 - Shadow costs per phase - RoadCem (1.6 kg/m³) - simulation 2 ........................................................... 28 Table 37 - Shadow costs per phase - RoadCem (1.4 kg/m³) - simulation 2 ........................................................... 28 Table 38 - Shadow costs per phase - Conventional - simulation 3 ........................................................................ 29 Table 39 - Shadow costs per phase - RoadCem (1.6 kg/m³) - simulation 3 ........................................................... 29 Table 40 - Shadow costs per phase - RoadCem (1.4 kg/m³) - simulation 3 ........................................................... 30 Table 41 - Shadow costs per phase - Conventional - simulation 4 ........................................................................ 30 Table 42 - Shadow costs per phase - RoadCem (1.6 kg/m³) - simulation 4 ........................................................... 31 Table 43 - Shadow costs per phase - RoadCem (1.4 kg/m³) - simulation 4 ........................................................... 31 Table 44 - Shadow costs per phase - Conventional - simulation 5 ........................................................................ 32 Table 45 - Shadow costs per phase - RoadCem (1.6 kg/m³) - simulation 5 ........................................................... 32 Table 46 - Shadow costs per phase - RoadCem (1.4 kg/m³) - simulation 5 ........................................................... 33 Table 47 - Overview of shadow costs of different constructions and simulations per phase ............................... 34 Table 48 - Total overview shadow costs - per simulation (totals phases) ............................................................. 37
27.054.17.08.006 – NIBE Research bv 7
Table 49 - Total overview greenhouse effect - per simulation (totals phases) ..................................................... 39 Table 50 - Total overview human toxicity - per simulation (totals phases)........................................................... 40
Overview of graphs Graph 1 - Comparison constructions - simulation 1 .............................................................................................. 34 Graph 2 - Comparison constructions - simulation 2 .............................................................................................. 34 Graph 3 - Comparison constructions - simulation 3 .............................................................................................. 35 Graph 4 - Comparison constructions - simulation 4 .............................................................................................. 35 Graph 5 - Comparison constructions - simulation 5 .............................................................................................. 36 Graph 6 - Total shadow costs per simulation ........................................................................................................ 37 Graph 7 - Comparison of all constructions and simulations .................................................................................. 38 Graph 8- Total for greenhouse effect per simulation ............................................................................................ 39 Graph 9 - Total for greenhouse effect per simulation ........................................................................................... 40

27.054.17.08.006 – NIBE Research bv 9
1. Introduction
Background
There is a growing demand for environmental information about building materials at end users. Since 1992, NIBE has been assessing the environmental load of building materials on the basis of life cycle analyses (LCA). In the past two decades, the method used by NIBE has developed from a mainly qualitative assessment to a widely supported quantitative assessment. For this, NIBE uses the most current environmental data from different databases. The most important database is the Ecoinvent database that forms the basis for the Dutch environmental database that was harmonised in 2010. Based on the accompanying Determination Method [1] and databases, NIBE draws up environmental comparisons between building materials, whereby the eventual environmental load is expressed in shadow costs. PowerCem Technologies asked NIBE b.v. to make an environmental comparison between a conventional paving construction and a RoadCem construction developed by PowerCem Technologies, based on a life cycle analysis by means of which the environmental impact of both paving constructions is calculated. RoadCem is a product that makes it possible to bind non-bonded materials to create a durably bonded material. Due to the product's method of application and the strength of the bond of the product, an ecological, sustainable and economical construction is obtained. In this study, the ecological nature was tested on the basis of assumptions based on research reports from, for instance, TUDelft [2], Radboud University [3] and ARCADIS [4]. RoadCem is a fine powdery substance that was developed for applications in road building and hydraulic engineering. With RoadCem, in-situ materials such as clay, sand and peat can be transformed into a durable bonded material. In this way, RoadCem extends the structural life span of the pavements.
Objective, target group and application
The objective of the study is to determine the environmental impact of a conventional construction compared to a RoadCem construction, under the same structural conditions (subsoil bearing capacity, traffic load, climatological conditions). The impact is also simulated in relation to changing transport distances and dosages. This will make it possible to establish the difference in an indicative way.
Methods and databases
LCA Method: NMD
LCA Software: Simapro 8.2.3
Characterisation and monetisation method:
SBK Determination Method, 20 September 2016 (NMD 2.0)
LCA database profiles National Environmental Database SBK version 2.0 / EcoInvent version 3.3
Product maps database DuboCalc 4.01.2 Library version: 4.03.04062015
10
2. The study
Introduction
In this study, the environmental impacts of a conventional construction and RoadCem construction were determined. The data of the constructions were determined and supplied by PowerCem. For the calculation we used the method and databases stated in section 1.3. The following environmental effect categories were calculated:
1 abiotic depletion, non-fuel (AD)
2 abiotic depletion, fuel (AD)
4 global warming (GWP)
5 ozone layer depletion (ODP)
6 photochemical oxidation (POCP)
7 acidification (AP)
8 eutrophication (EP)
9 human toxicity (HT)
10 Eco toxicity, fresh water (FAETP)
12 Eco toxicity, marine water (MAETP)
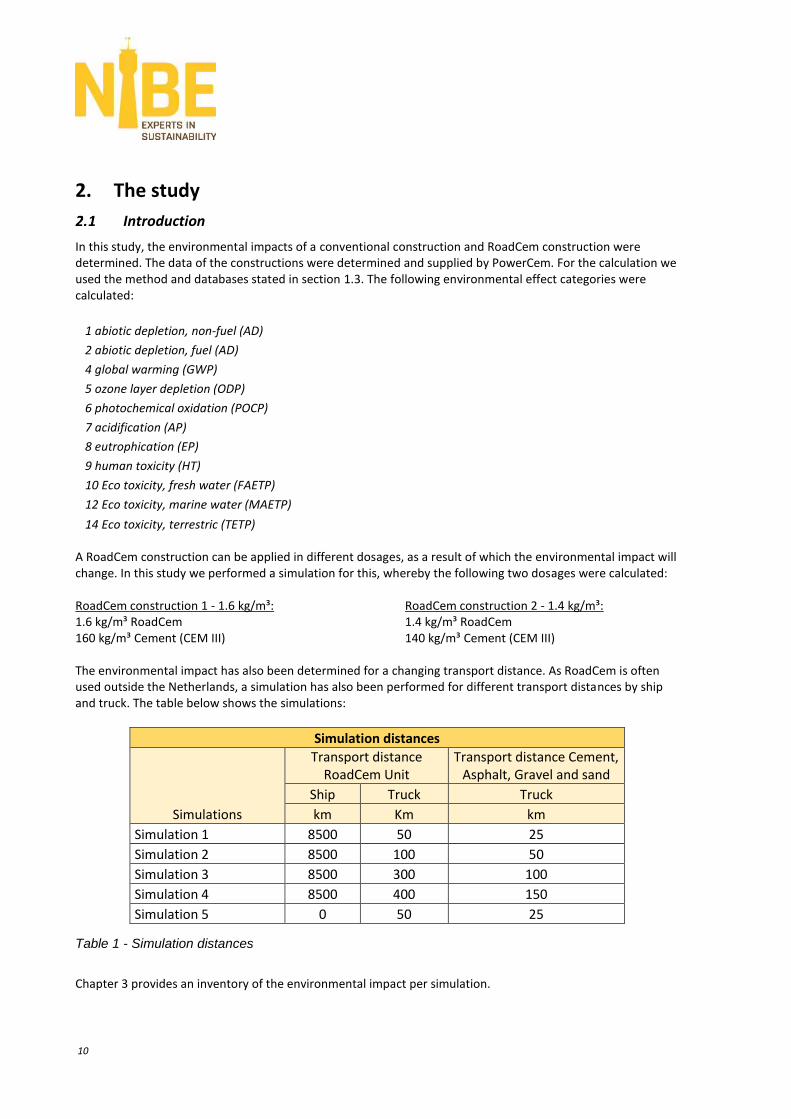
14 Eco toxicity, terrestric (TETP) A RoadCem construction can be applied in different dosages, as a result of which the environmental impact will change. In this study we performed a simulation for this, whereby the following two dosages were calculated: RoadCem construction 1 - 1.6 kg/m³: RoadCem construction 2 - 1.4 kg/m³: 1.6 kg/m³ RoadCem 1.4 kg/m³ RoadCem 160 kg/m³ Cement (CEM III) 140 kg/m³ Cement (CEM III) The environmental impact has also been determined for a changing transport distance. As RoadCem is often used outside the Netherlands, a simulation has also been performed for different transport distances by ship and truck. The table below shows the simulations:
Simulation distances
Simulations
Transport distance RoadCem Unit
Transport distance Cement, Asphalt, Gravel and sand
Ship Truck Truck
km Km km
Simulation 1 8500 50 25
Simulation 2 8500 100 50
Simulation 3 8500 300 100
Simulation 4 8500 400 150
Simulation 5 0 50 25
Table 1 - Simulation distances
Chapter 3 provides an inventory of the environmental impact per simulation.
27.054.17.08.006 – NIBE Research bv 11
Calculation unit
The basis for the performance of a life cycle analysis is the calculation unit. The calculation unit can be a functional unit or a product unit. A product unit provides a quantity of product of which the specific application is not stated. In that case, the use phase will not be included in the life cycle analysis. In a functional unit it is established what function the product should perform during which period. For this study, the following functional unit was defined:
1 m² road paving of an averagely burdened road (city access road), including foundation. The considered period is 75 years. The maximum allowed speed on the road is 60km/h. Every 24 hours the road is burdened by 250 trucks, a 2% truck traffic increase was used. The road is located on ground level on a soil of 9 metres of weak layers in the River Area.
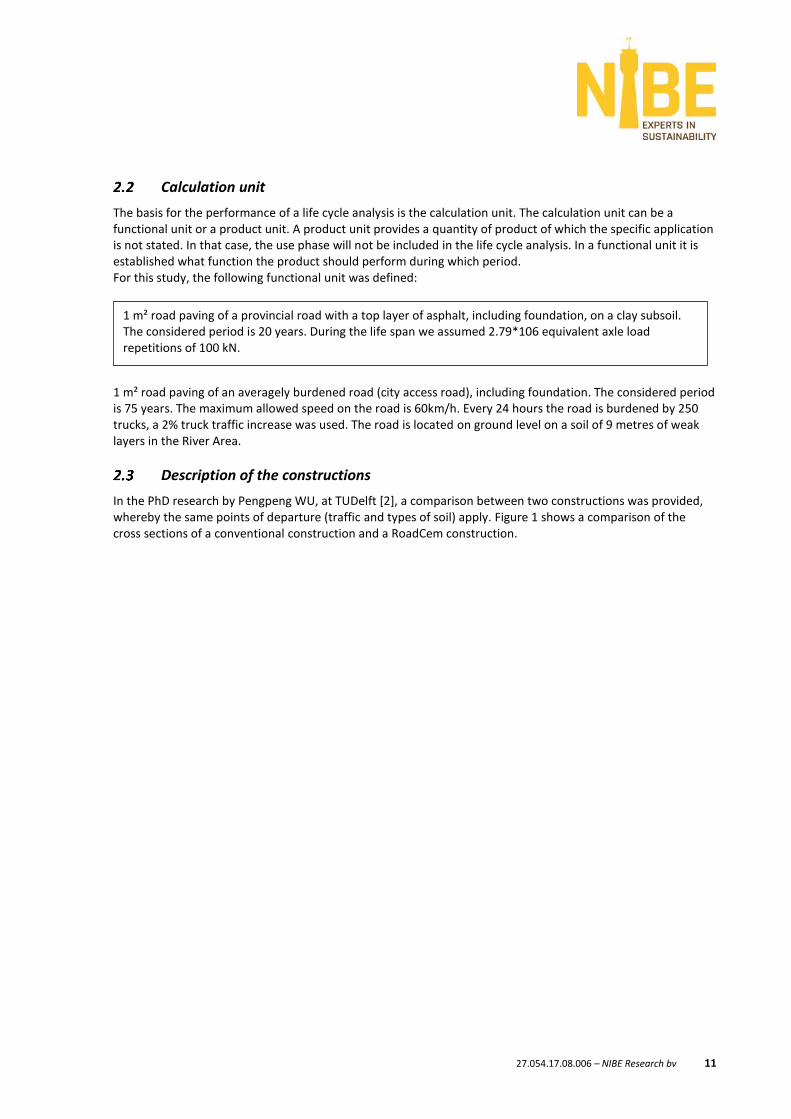
Description of the constructions
In the PhD research by Pengpeng WU, at TUDelft [2], a comparison between two constructions was provided, whereby the same points of departure (traffic and types of soil) apply. Figure 1 shows a comparison of the cross sections of a conventional construction and a RoadCem construction.
1 m² road paving of a provincial road with a top layer of asphalt, including foundation, on a clay subsoil. The considered period is 20 years. During the life span we assumed 2.79*106 equivalent axle load repetitions of 100 kN.
12
Figure 1 - Comparison cross sections conventional construction and RoadCem construction
Asphalt Stiffness:
Edyn ≈ 6000 MPa
180mm
Concrete granulate Stiffness:
Edyn ≈ 600 MPa
300mm
Sand sub-base Stiffness:
Edyn ≈ 100 MPa
700mm
RoadCem Stiffness:
Edyn ≈ 3500 MPa
250mm
40mm Asphalt wearing course
Total thickness structure: 1180mm
Subsoil: Clay
Stiffness:
Edyn≈ 25MPa
Total thickness structure: 290 mm
Subsoil: Clay
Stiffness:
Edyn≈ 25MPa
27.054.17.08.006 – NIBE Research bv 13
System boundaries
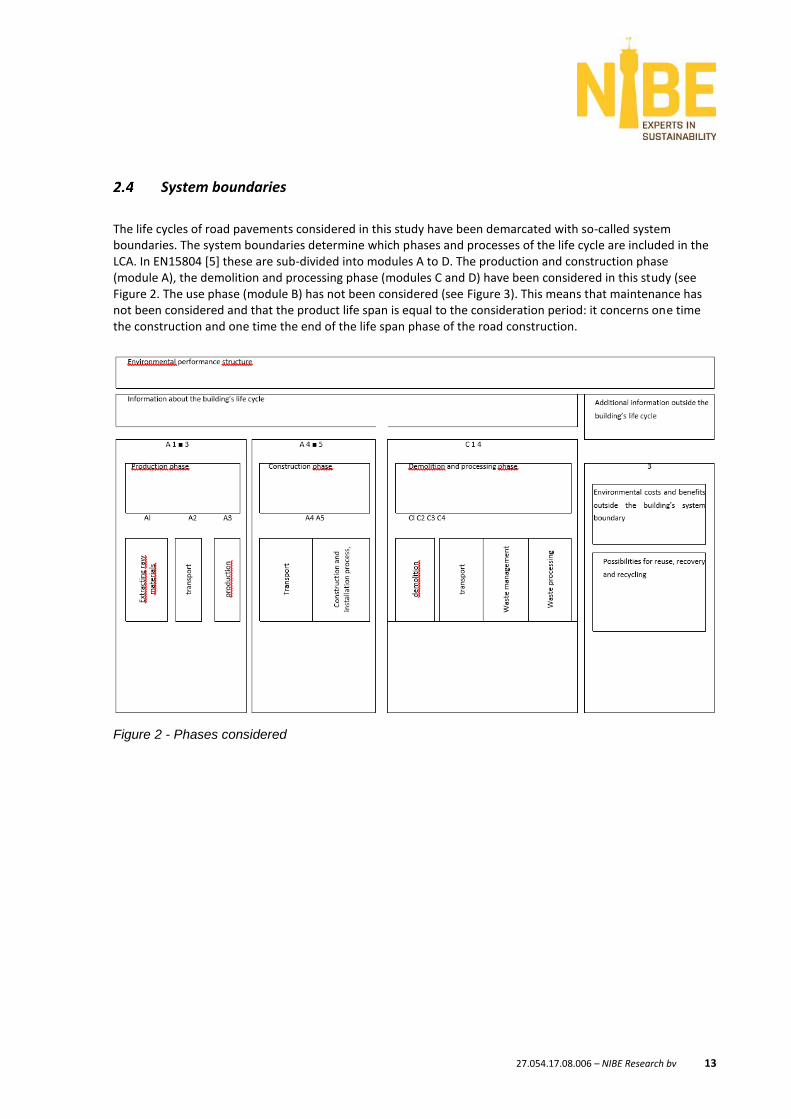
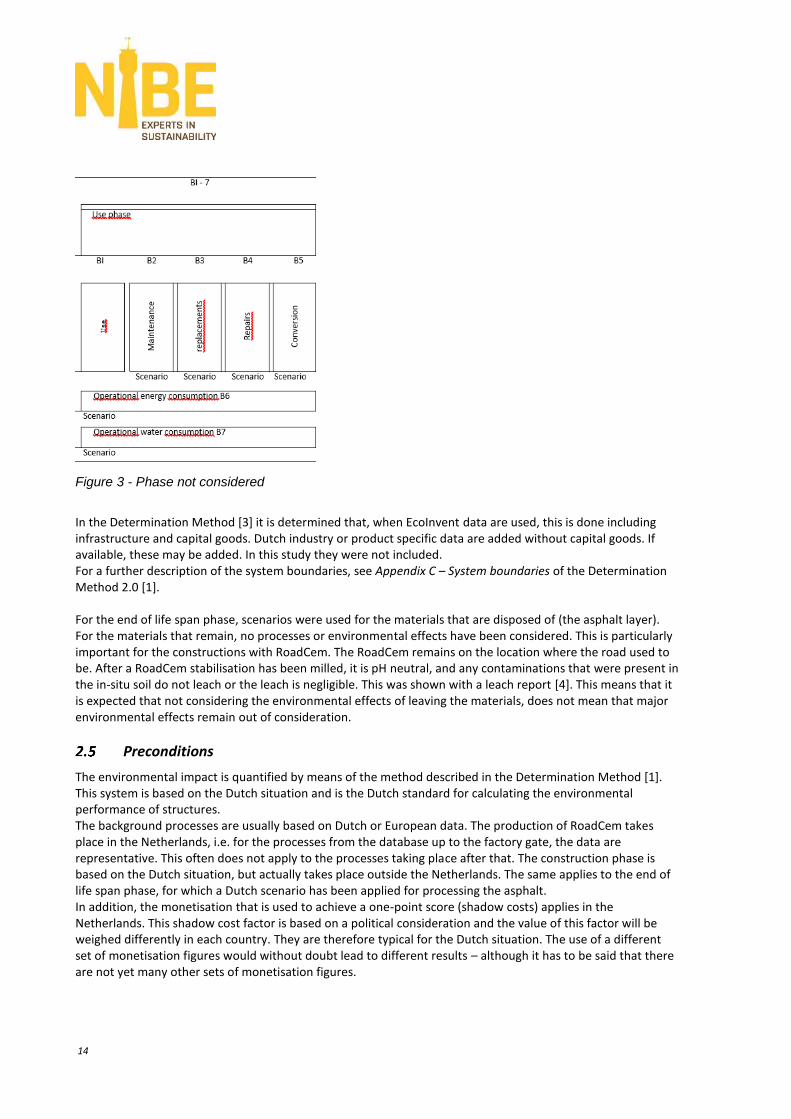
The life cycles of road pavements considered in this study have been demarcated with so-called system boundaries. The system boundaries determine which phases and processes of the life cycle are included in the LCA. In EN15804 [5] these are sub-divided into modules A to D. The production and construction phase (module A), the demolition and processing phase (modules C and D) have been considered in this study (see Figure 2. The use phase (module B) has not been considered (see Figure 3). This means that maintenance has not been considered and that the product life span is equal to the consideration period: it concerns one time the construction and one time the end of the life span phase of the road construction.
Figure 2 - Phases considered
14
Figure 3 - Phase not considered
In the Determination Method [3] it is determined that, when EcoInvent data are used, this is done including infrastructure and capital goods. Dutch industry or product specific data are added without capital goods. If available, these may be added. In this study they were not included. For a further description of the system boundaries, see Appendix C – System boundaries of the Determination Method 2.0 [1]. For the end of life span phase, scenarios were used for the materials that are disposed of (the asphalt layer). For the materials that remain, no processes or environmental effects have been considered. This is particularly important for the constructions with RoadCem. The RoadCem remains on the location where the road used to be. After a RoadCem stabilisation has been milled, it is pH neutral, and any contaminations that were present in the in-situ soil do not leach or the leach is negligible. This was shown with a leach report [4]. This means that it is expected that not considering the environmental effects of leaving the materials, does not mean that major environmental effects remain out of consideration.
Preconditions
The environmental impact is quantified by means of the method described in the Determination Method [1]. This system is based on the Dutch situation and is the Dutch standard for calculating the environmental performance of structures. The background processes are usually based on Dutch or European data. The production of RoadCem takes place in the Netherlands, i.e. for the processes from the database up to the factory gate, the data are representative. This often does not apply to the processes taking place after that. The construction phase is based on the Dutch situation, but actually takes place outside the Netherlands. The same applies to the end of life span phase, for which a Dutch scenario has been applied for processing the asphalt. In addition, the monetisation that is used to achieve a one-point score (shadow costs) applies in the Netherlands. This shadow cost factor is based on a political consideration and the value of this factor will be weighed differently in each country. They are therefore typical for the Dutch situation. The use of a different set of monetisation figures would without doubt lead to different results – although it has to be said that there are not yet many other sets of monetisation figures.
27.054.17.08.006 – NIBE Research bv 15
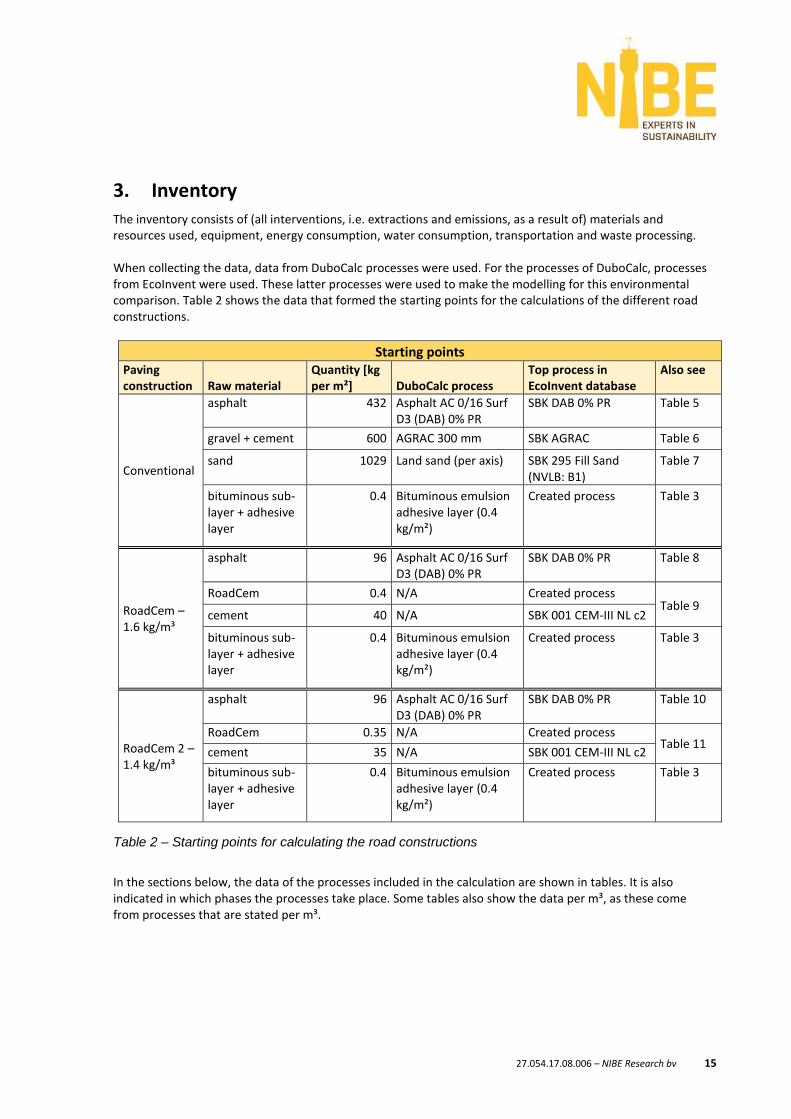
3. Inventory The inventory consists of (all interventions, i.e. extractions and emissions, as a result of) materials and resources used, equipment, energy consumption, water consumption, transportation and waste processing. When collecting the data, data from DuboCalc processes were used. For the processes of DuboCalc, processes from EcoInvent were used. These latter processes were used to make the modelling for this environmental comparison. Table 2 shows the data that formed the starting points for the calculations of the different road constructions.
Starting points Paving construction Raw material
Quantity [kg per m²] DuboCalc process
Top process in EcoInvent database
Also see
Conventional
asphalt 432 Asphalt AC 0/16 Surf D3 (DAB) 0% PR
SBK DAB 0% PR Table 5
gravel + cement 600 AGRAC 300 mm SBK AGRAC Table 6
sand 1029 Land sand (per axis) SBK 295 Fill Sand (NVLB: B1)
Table 7
bituminous sub-layer + adhesive layer
0.4 Bituminous emulsion adhesive layer (0.4 kg/m²)
Created process Table 3
RoadCem – 1.6 kg/m³
asphalt 96 Asphalt AC 0/16 Surf D3 (DAB) 0% PR
SBK DAB 0% PR Table 8
RoadCem 0.4 N/A Created process Table 9
cement 40 N/A SBK 001 CEM-III NL c2
bituminous sub-layer + adhesive layer
0.4 Bituminous emulsion adhesive layer (0.4 kg/m²)
Created process Table 3
RoadCem 2 – 1.4 kg/m³
asphalt 96 Asphalt AC 0/16 Surf D3 (DAB) 0% PR
SBK DAB 0% PR Table 10
RoadCem 0.35 N/A Created process Table 11
cement 35 N/A SBK 001 CEM-III NL c2
bituminous sub-layer + adhesive layer
0.4 Bituminous emulsion adhesive layer (0.4 kg/m²)
Created process Table 3
Table 2 – Starting points for calculating the road constructions
In the sections below, the data of the processes included in the calculation are shown in tables. It is also indicated in which phases the processes take place. Some tables also show the data per m³, as these come from processes that are stated per m³.

16
Processes of applications in all constructions
The application of the bituminous sub-layer + adhesive layer is used in all constructions and is the same for all constructions.
Bituminous sub-layer + adhesive layer
Process Phase Unit Per m²
Bituminous emulsion intermediate layer A1-A3 ton 0.4
Spray truck (average) A5 h 0.001333
Transport bulk (over the road) A5 tonkm 0.0004
Table 3 - Processes for the bituminous sub-layer + adhesive layer
Processes applicable in all simulations of the Conventional construction
The disposal of soil only applies in the case of the conventional construction (for the RoadCem constructions the soil does not have to be disposed of).
Soil disposal - 1800 kg/m²
Process Phase Unit Per m²
Exc.mach.hydr. (average) A5 h 0.01584
Table 4 - Processes for the disposal of soil
Conventional - SBK DAB 0% PR - 0.18m - 2400 kg/m³
Process Phase Unit Per ton Per m²
Asphalt (DAB) 0% PR A1-A3 ton 1 0.432
Finish machine asphalt (average per type) A5 h 0.0133 0.00575
Asphalt vehicle 16t: 240 kW: 6x4 A5 h 0.0133 0.00575
Company vehicle (average) A5 h 0.0133 0.00575
Resources asphalt (average) A5 kg 0.0133 0.00575
Spray truck (average) A5 h 0.00665 0.00287
Compactor (average) A5 h 0.0133 0.00575
Compactor (average) A5 h 0.0133 0.00575
Cold milling machine (average, per type) C1 ton 1 0.432
Truck cleaning - sweep/vac 6-8m³ C1 h 0.025 0.0108
Table 5 - Processes for the asphalt layer for the conventional construction
27.054.17.08.006 – NIBE Research bv 17
Conventional - AGRAC - 0.30m
Process Phase Unit Per m²
AGRAC A1-A3 ton 0.6
Grader (average) A5 h 0.004
Compactor (average) A5 h 0.004
Wheeled loader A5 h 0.040
Wheeled loader C1 h 0.00175
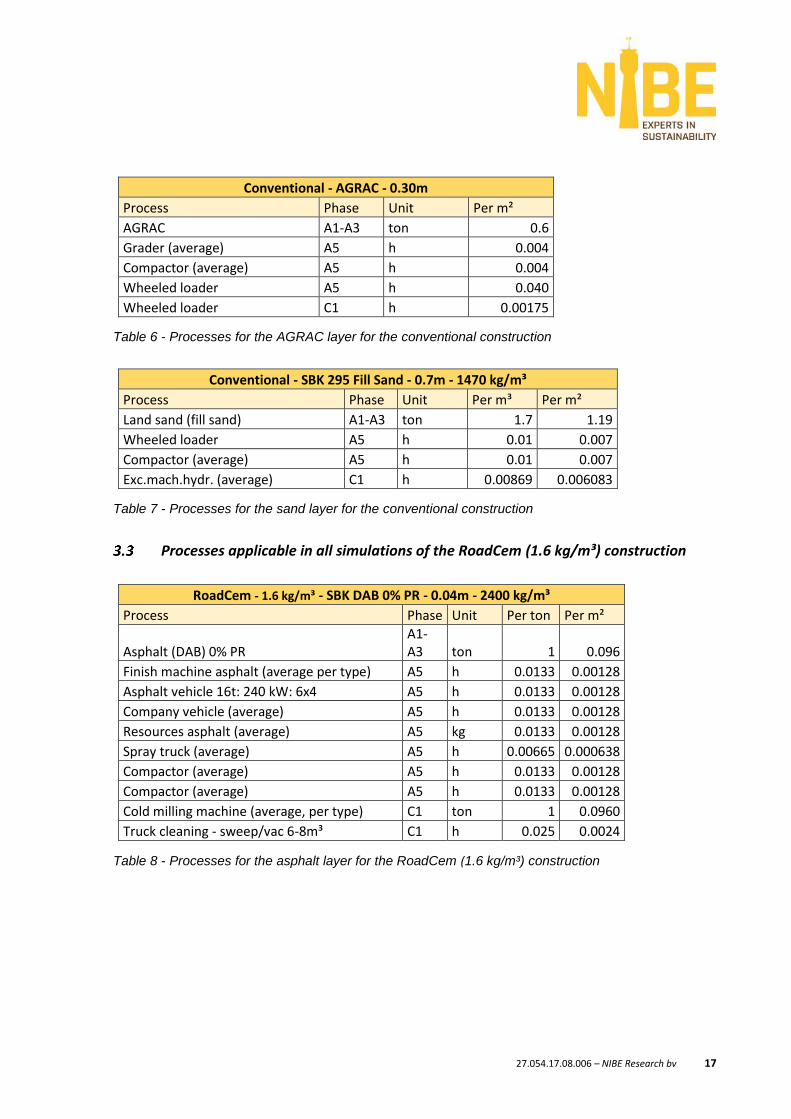
Table 6 - Processes for the AGRAC layer for the conventional construction
Conventional - SBK 295 Fill Sand - 0.7m - 1470 kg/m³
Process Phase Unit Per m³ Per m²
Land sand (fill sand) A1-A3 ton 1.7 1.19
Wheeled loader A5 h 0.01 0.007
Compactor (average) A5 h 0.01 0.007
Exc.mach.hydr. (average) C1 h 0.00869 0.006083
Table 7 - Processes for the sand layer for the conventional construction
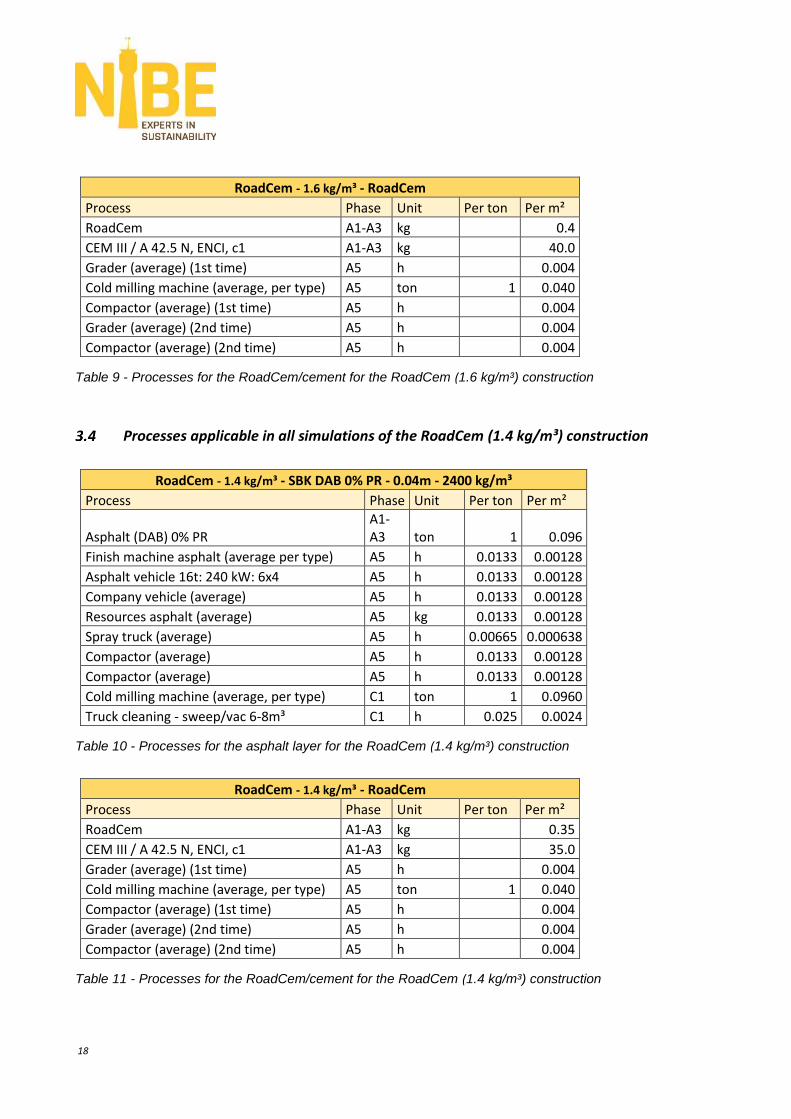
Processes applicable in all simulations of the RoadCem (1.6 kg/m³) construction
RoadCem - 1.6 kg/m³ - SBK DAB 0% PR - 0.04m - 2400 kg/m³
Process Phase Unit Per ton Per m²
Asphalt (DAB) 0% PR A1-A3 ton 1 0.096
Finish machine asphalt (average per type) A5 h 0.0133 0.00128
Asphalt vehicle 16t: 240 kW: 6x4 A5 h 0.0133 0.00128
Company vehicle (average) A5 h 0.0133 0.00128
Resources asphalt (average) A5 kg 0.0133 0.00128
Spray truck (average) A5 h 0.00665 0.000638
Compactor (average) A5 h 0.0133 0.00128
Compactor (average) A5 h 0.0133 0.00128
Cold milling machine (average, per type) C1 ton 1 0.0960
Truck cleaning - sweep/vac 6-8m³ C1 h 0.025 0.0024
Table 8 - Processes for the asphalt layer for the RoadCem (1.6 kg/m³) construction
18
RoadCem - 1.6 kg/m³ - RoadCem
Process Phase Unit Per ton Per m²
RoadCem A1-A3 kg 0.4
CEM III / A 42.5 N, ENCI, c1 A1-A3 kg 40.0
Grader (average) (1st time) A5 h 0.004
Cold milling machine (average, per type) A5 ton 1 0.040
Compactor (average) (1st time) A5 h 0.004
Grader (average) (2nd time) A5 h 0.004
Compactor (average) (2nd time) A5 h 0.004
Table 9 - Processes for the RoadCem/cement for the RoadCem (1.6 kg/m³) construction
Processes applicable in all simulations of the RoadCem (1.4 kg/m³) construction
RoadCem - 1.4 kg/m³ - SBK DAB 0% PR - 0.04m - 2400 kg/m³
Process Phase Unit Per ton Per m²
Asphalt (DAB) 0% PR A1-A3 ton 1 0.096
Finish machine asphalt (average per type) A5 h 0.0133 0.00128
Asphalt vehicle 16t: 240 kW: 6x4 A5 h 0.0133 0.00128
Company vehicle (average) A5 h 0.0133 0.00128
Resources asphalt (average) A5 kg 0.0133 0.00128
Spray truck (average) A5 h 0.00665 0.000638
Compactor (average) A5 h 0.0133 0.00128
Compactor (average) A5 h 0.0133 0.00128
Cold milling machine (average, per type) C1 ton 1 0.0960
Truck cleaning - sweep/vac 6-8m³ C1 h 0.025 0.0024
Table 10 - Processes for the asphalt layer for the RoadCem (1.4 kg/m³) construction
RoadCem - 1.4 kg/m³ - RoadCem
Process Phase Unit Per ton Per m²
RoadCem A1-A3 kg 0.35
CEM III / A 42.5 N, ENCI, c1 A1-A3 kg 35.0
Grader (average) (1st time) A5 h 0.004
Cold milling machine (average, per type) A5 ton 1 0.040
Compactor (average) (1st time) A5 h 0.004
Grader (average) (2nd time) A5 h 0.004
Compactor (average) (2nd time) A5 h 0.004
Table 11 - Processes for the RoadCem/cement for the RoadCem (1.4 kg/m³) construction
27.054.17.08.006 – NIBE Research bv 19
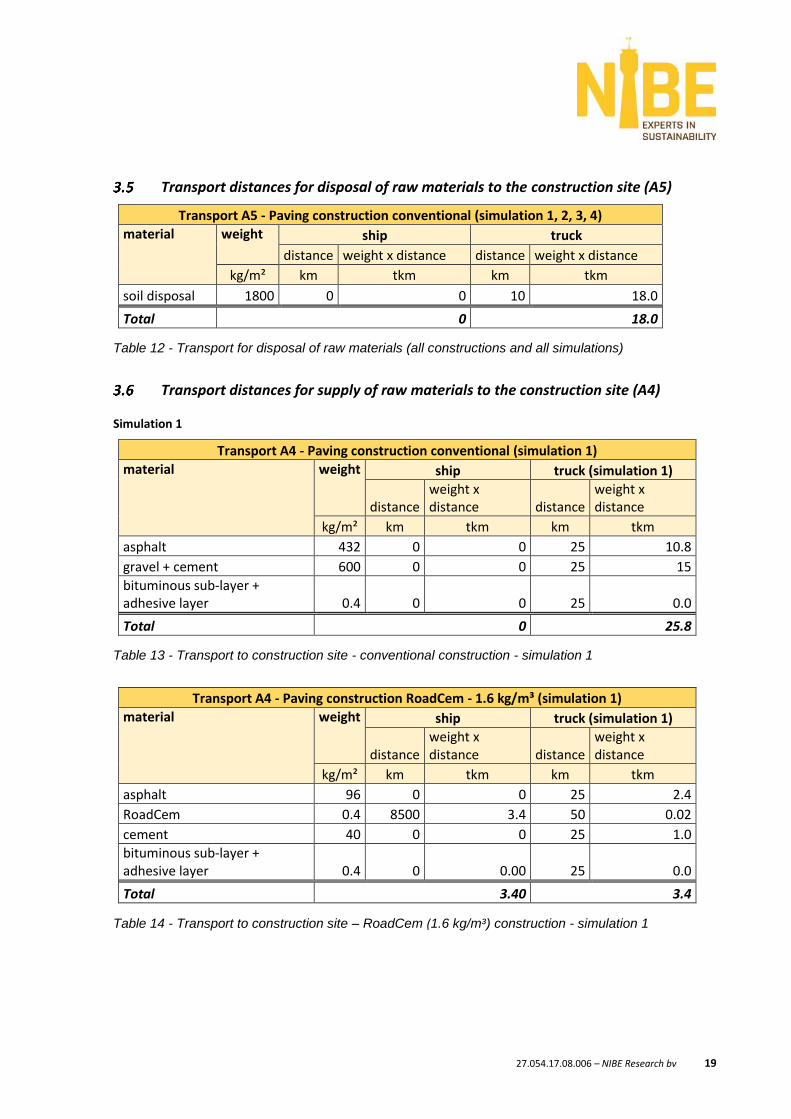
Transport distances for disposal of raw materials to the construction site (A5)
Transport A5 - Paving construction conventional (simulation 1, 2, 3, 4)
material weight ship truck
distance weight x distance distance weight x distance
kg/m² km tkm km tkm
soil disposal 1800 0 0 10 18.0
Total 0 18.0
Table 12 - Transport for disposal of raw materials (all constructions and all simulations)
Transport distances for supply of raw materials to the construction site (A4)
Simulation 1
Transport A4 - Paving construction conventional (simulation 1)
material weight ship truck (simulation 1)
distance weight x distance distance
weight x distance
kg/m² km tkm km tkm
asphalt 432 0 0 25 10.8
gravel + cement 600 0 0 25 15
bituminous sub-layer + adhesive layer 0.4 0 0 25 0.0
Total 0 25.8
Table 13 - Transport to construction site - conventional construction - simulation 1
Transport A4 - Paving construction RoadCem - 1.6 kg/m³ (simulation 1)
material weight ship truck (simulation 1)
distance weight x distance distance
weight x distance
kg/m² km tkm km tkm
asphalt 96 0 0 25 2.4
RoadCem 0.4 8500 3.4 50 0.02
cement 40 0 0 25 1.0
bituminous sub-layer + adhesive layer 0.4 0 0.00 25 0.0
Total 3.40 3.4
Table 14 - Transport to construction site – RoadCem (1.6 kg/m³) construction - simulation 1
20
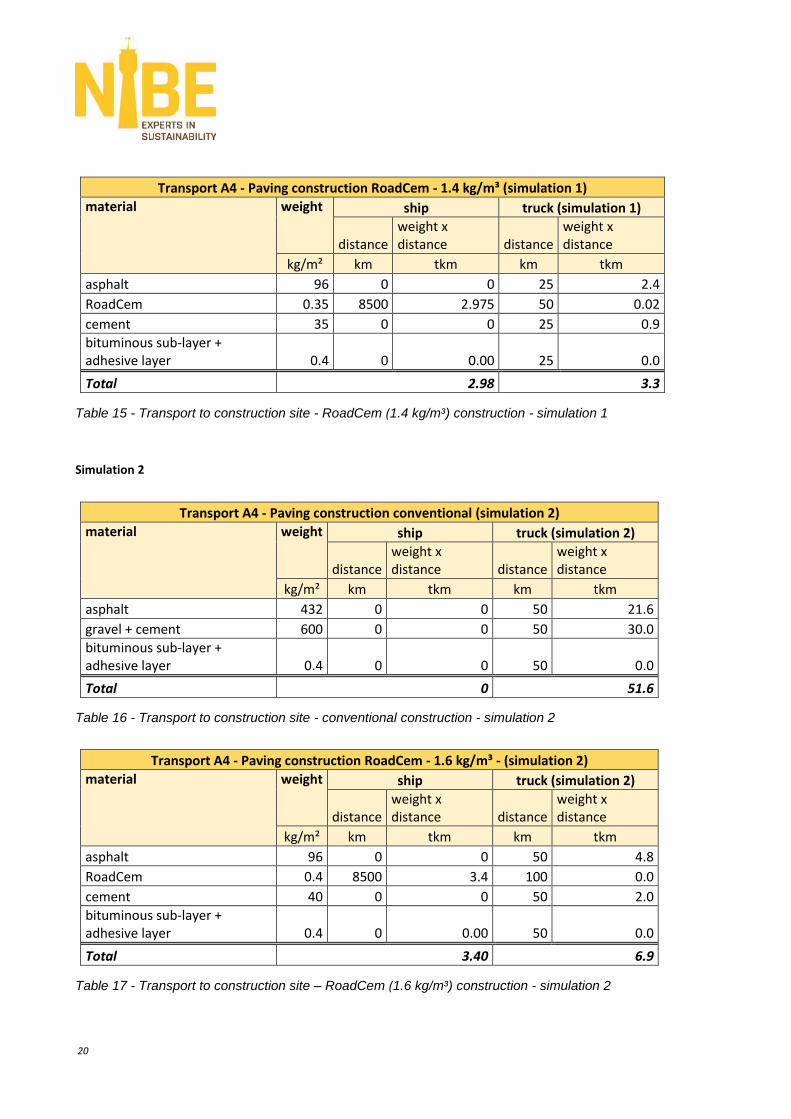
Transport A4 - Paving construction RoadCem - 1.4 kg/m³ (simulation 1)
material weight ship truck (simulation 1)
distance weight x distance distance
weight x distance
kg/m² km tkm km tkm
asphalt 96 0 0 25 2.4
RoadCem 0.35 8500 2.975 50 0.02
cement 35 0 0 25 0.9
bituminous sub-layer + adhesive layer 0.4 0 0.00 25 0.0
Total 2.98 3.3
Table 15 - Transport to construction site - RoadCem (1.4 kg/m³) construction - simulation 1
Simulation 2
Transport A4 - Paving construction conventional (simulation 2)
material weight ship truck (simulation 2)
distance weight x distance distance
weight x distance
kg/m² km tkm km tkm
asphalt 432 0 0 50 21.6
gravel + cement 600 0 0 50 30.0
bituminous sub-layer + adhesive layer 0.4 0 0 50 0.0
Total 0 51.6
Table 16 - Transport to construction site - conventional construction - simulation 2
Transport A4 - Paving construction RoadCem - 1.6 kg/m³ - (simulation 2)
material weight ship truck (simulation 2)
distance weight x distance distance
weight x distance
kg/m² km tkm km tkm
asphalt 96 0 0 50 4.8
RoadCem 0.4 8500 3.4 100 0.0
cement 40 0 0 50 2.0
bituminous sub-layer + adhesive layer 0.4 0 0.00 50 0.0
Total 3.40 6.9
Table 17 - Transport to construction site – RoadCem (1.6 kg/m³) construction - simulation 2
27.054.17.08.006 – NIBE Research bv 21
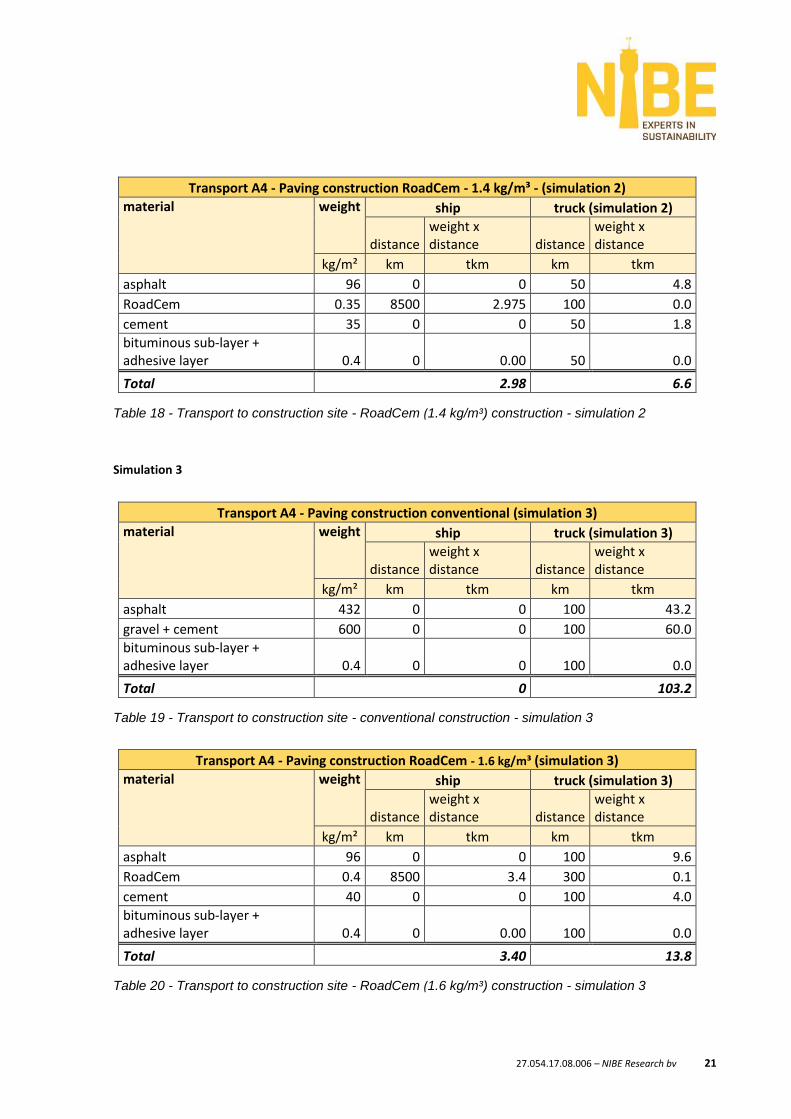
Transport A4 - Paving construction RoadCem - 1.4 kg/m³ - (simulation 2)
material weight ship truck (simulation 2)
distance weight x distance distance
weight x distance
kg/m² km tkm km tkm
asphalt 96 0 0 50 4.8
RoadCem 0.35 8500 2.975 100 0.0
cement 35 0 0 50 1.8
bituminous sub-layer + adhesive layer 0.4 0 0.00 50 0.0
Total 2.98 6.6
Table 18 - Transport to construction site - RoadCem (1.4 kg/m³) construction - simulation 2
Simulation 3
Transport A4 - Paving construction conventional (simulation 3)
material weight ship truck (simulation 3)
distance weight x distance distance
weight x distance
kg/m² km tkm km tkm
asphalt 432 0 0 100 43.2
gravel + cement 600 0 0 100 60.0
bituminous sub-layer + adhesive layer 0.4 0 0 100 0.0
Total 0 103.2
Table 19 - Transport to construction site - conventional construction - simulation 3
Transport A4 - Paving construction RoadCem - 1.6 kg/m³ (simulation 3)
material weight ship truck (simulation 3)
distance weight x distance distance
weight x distance
kg/m² km tkm km tkm
asphalt 96 0 0 100 9.6
RoadCem 0.4 8500 3.4 300 0.1
cement 40 0 0 100 4.0
bituminous sub-layer + adhesive layer 0.4 0 0.00 100 0.0
Total 3.40 13.8
Table 20 - Transport to construction site - RoadCem (1.6 kg/m³) construction - simulation 3
22
Transport A4 - Paving construction RoadCem - 1.4 kg/m³ (simulation 3)
material weight ship truck (simulation 3)
distance weight x distance distance
weight x distance
kg/m² km tkm km tkm
asphalt 96 0 0 100 9.6
RoadCem 0.35 8500 2.975 300 0.1
cement 35 0 0 100 3.5
bituminous sub-layer + adhesive layer 0.4 0 0.00 100 0.0
Total 2.98 13.2
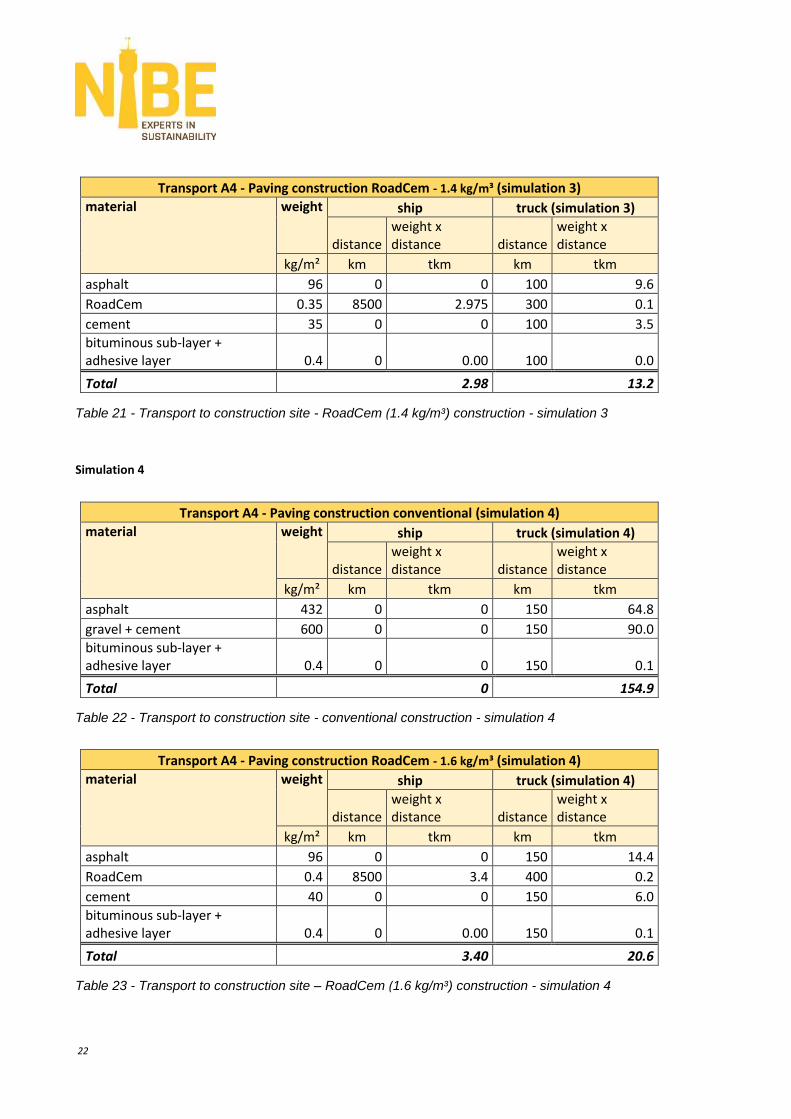
Table 21 - Transport to construction site - RoadCem (1.4 kg/m³) construction - simulation 3
Simulation 4
Transport A4 - Paving construction conventional (simulation 4)
material weight ship truck (simulation 4)
distance weight x distance distance
weight x distance
kg/m² km tkm km tkm
asphalt 432 0 0 150 64.8
gravel + cement 600 0 0 150 90.0
bituminous sub-layer + adhesive layer 0.4 0 0 150 0.1
Total 0 154.9
Table 22 - Transport to construction site - conventional construction - simulation 4
Transport A4 - Paving construction RoadCem - 1.6 kg/m³ (simulation 4)
material weight ship truck (simulation 4)
distance weight x distance distance
weight x distance
kg/m² km tkm km tkm
asphalt 96 0 0 150 14.4
RoadCem 0.4 8500 3.4 400 0.2
cement 40 0 0 150 6.0
bituminous sub-layer + adhesive layer 0.4 0 0.00 150 0.1
Total 3.40 20.6
Table 23 - Transport to construction site – RoadCem (1.6 kg/m³) construction - simulation 4
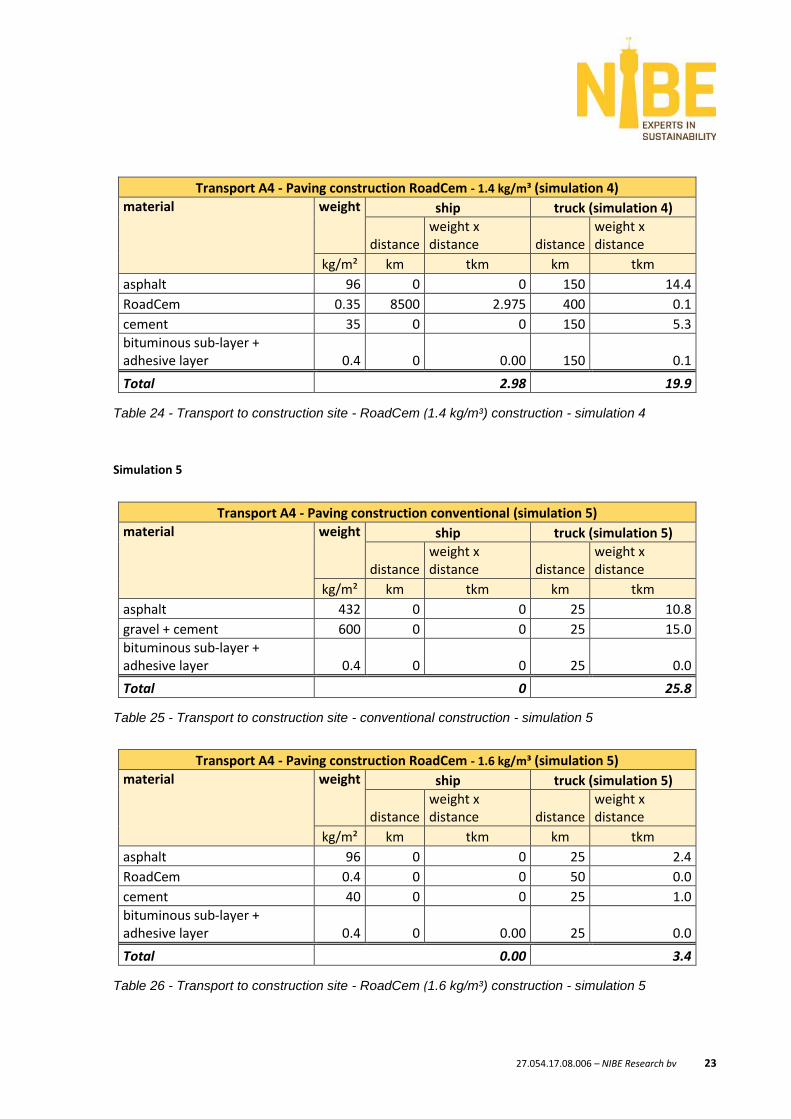
27.054.17.08.006 – NIBE Research bv 23
Transport A4 - Paving construction RoadCem - 1.4 kg/m³ (simulation 4)
material weight ship truck (simulation 4)
distance weight x distance distance
weight x distance
kg/m² km tkm km tkm
asphalt 96 0 0 150 14.4
RoadCem 0.35 8500 2.975 400 0.1
cement 35 0 0 150 5.3
bituminous sub-layer + adhesive layer 0.4 0 0.00 150 0.1
Total 2.98 19.9
Table 24 - Transport to construction site - RoadCem (1.4 kg/m³) construction - simulation 4
Simulation 5
Transport A4 - Paving construction conventional (simulation 5)
material weight ship truck (simulation 5)
distance weight x distance distance
weight x distance
kg/m² km tkm km tkm
asphalt 432 0 0 25 10.8
gravel + cement 600 0 0 25 15.0
bituminous sub-layer + adhesive layer 0.4 0 0 25 0.0
Total 0 25.8
Table 25 - Transport to construction site - conventional construction - simulation 5
Transport A4 - Paving construction RoadCem - 1.6 kg/m³ (simulation 5)
material weight ship truck (simulation 5)
distance weight x distance distance
weight x distance
kg/m² km tkm km tkm
asphalt 96 0 0 25 2.4
RoadCem 0.4 0 0 50 0.0
cement 40 0 0 25 1.0
bituminous sub-layer + adhesive layer 0.4 0 0.00 25 0.0
Total 0.00 3.4
Table 26 - Transport to construction site - RoadCem (1.6 kg/m³) construction - simulation 5
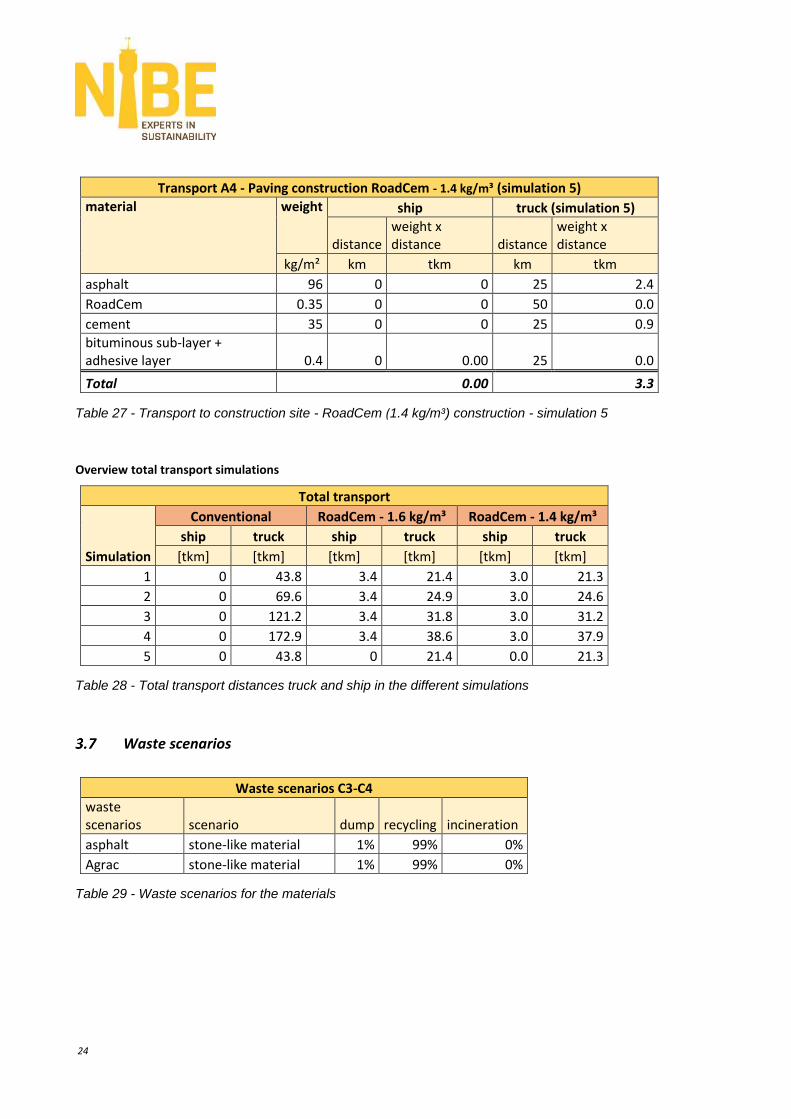
24
Transport A4 - Paving construction RoadCem - 1.4 kg/m³ (simulation 5)
material weight ship truck (simulation 5)
distance weight x distance distance
weight x distance
kg/m² km tkm km tkm
asphalt 96 0 0 25 2.4
RoadCem 0.35 0 0 50 0.0
cement 35 0 0 25 0.9
bituminous sub-layer + adhesive layer 0.4 0 0.00 25 0.0
Total 0.00 3.3
Table 27 - Transport to construction site - RoadCem (1.4 kg/m³) construction - simulation 5
Overview total transport simulations
Total transport
Simulation
Conventional RoadCem - 1.6 kg/m³ RoadCem - 1.4 kg/m³
ship truck ship truck ship truck
[tkm] [tkm] [tkm] [tkm] [tkm] [tkm]
1 0 43.8 3.4 21.4 3.0 21.3
2 0 69.6 3.4 24.9 3.0 24.6
3 0 121.2 3.4 31.8 3.0 31.2
4 0 172.9 3.4 38.6 3.0 37.9
5 0 43.8 0 21.4 0.0 21.3
Table 28 - Total transport distances truck and ship in the different simulations
Waste scenarios
Waste scenarios C3-C4
waste scenarios scenario dump recycling incineration
asphalt stone-like material 1% 99% 0%
Agrac stone-like material 1% 99% 0%
Table 29 - Waste scenarios for the materials
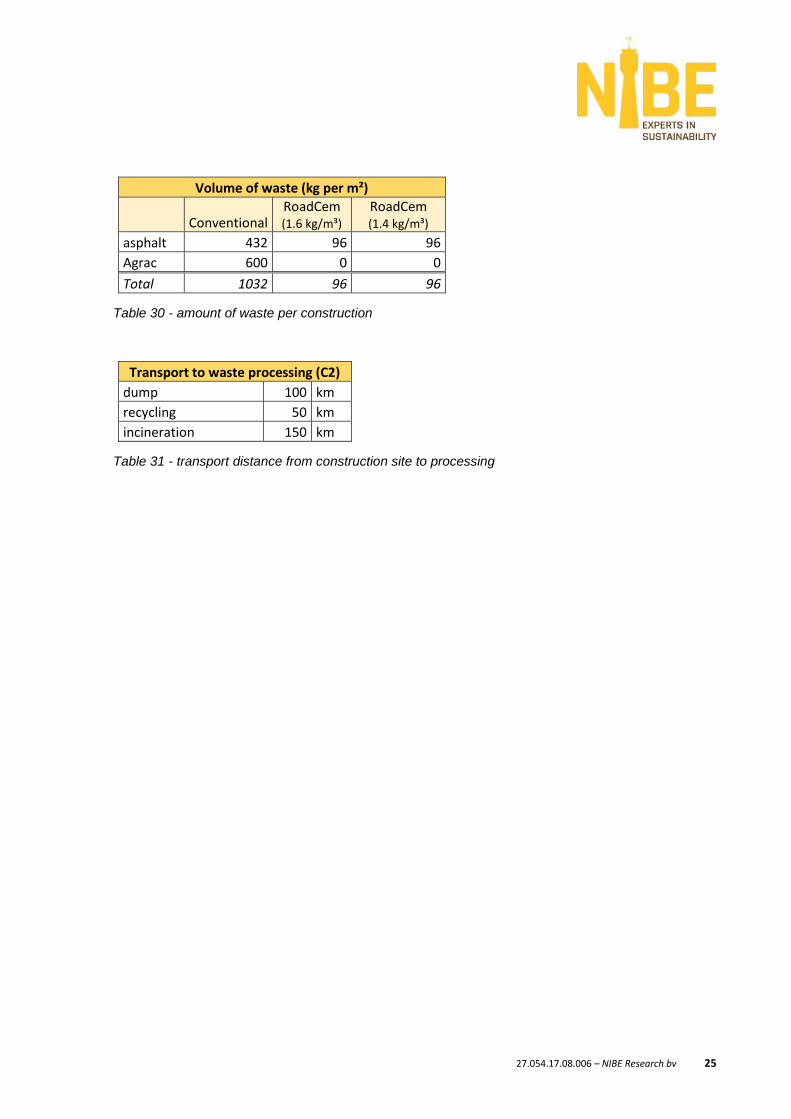
27.054.17.08.006 – NIBE Research bv 25
Volume of waste (kg per m²)
Conventional RoadCem (1.6 kg/m³)
RoadCem (1.4 kg/m³)
asphalt 432 96 96
Agrac 600 0 0
Total 1032 96 96
Table 30 - amount of waste per construction
Transport to waste processing (C2)
dump 100 km
recycling 50 km
incineration 150 km
Table 31 - transport distance from construction site to processing
26
4. Results
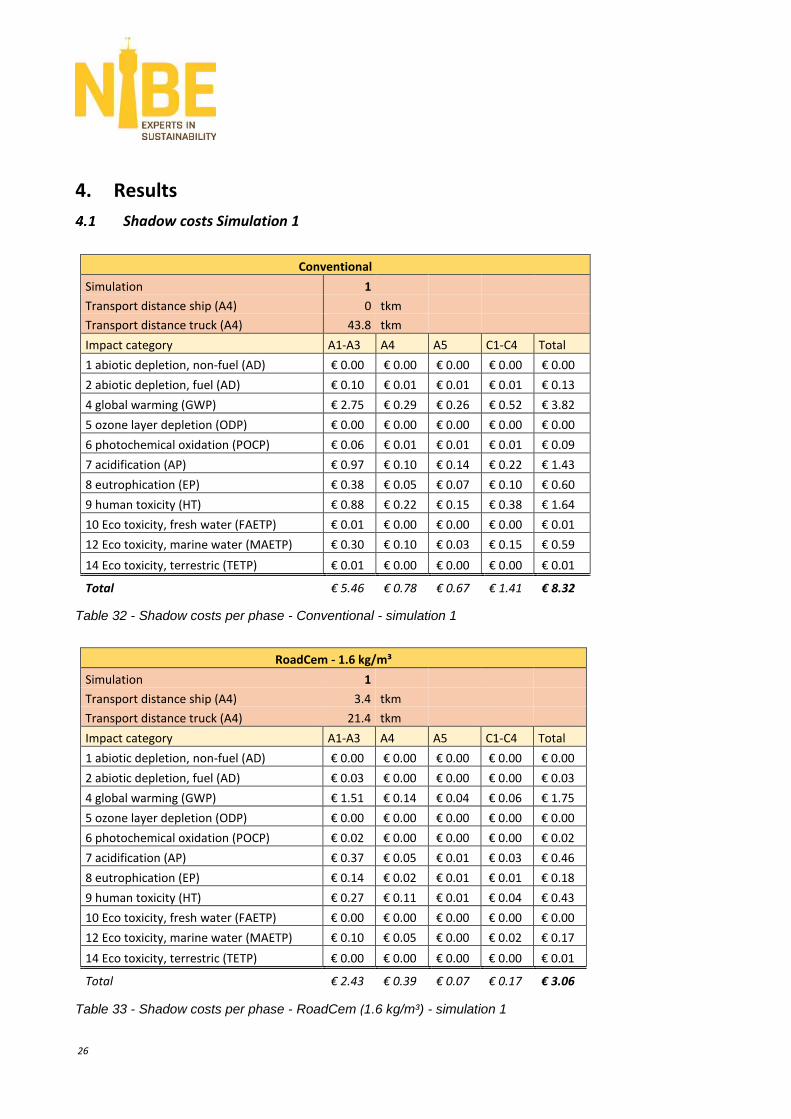
Shadow costs Simulation 1
Conventional
Simulation 1
Transport distance ship (A4) 0 tkm
Transport distance truck (A4) 43.8 tkm
Impact category A1-A3 A4 A5 C1-C4 Total
1 abiotic depletion, non-fuel (AD) € 0.00 € 0.00 € 0.00 € 0.00 € 0.00
2 abiotic depletion, fuel (AD) € 0.10 € 0.01 € 0.01 € 0.01 € 0.13
4 global warming (GWP) € 2.75 € 0.29 € 0.26 € 0.52 € 3.82
5 ozone layer depletion (ODP) € 0.00 € 0.00 € 0.00 € 0.00 € 0.00
6 photochemical oxidation (POCP) € 0.06 € 0.01 € 0.01 € 0.01 € 0.09
7 acidification (AP) € 0.97 € 0.10 € 0.14 € 0.22 € 1.43
8 eutrophication (EP) € 0.38 € 0.05 € 0.07 € 0.10 € 0.60
9 human toxicity (HT) € 0.88 € 0.22 € 0.15 € 0.38 € 1.64
10 Eco toxicity, fresh water (FAETP) € 0.01 € 0.00 € 0.00 € 0.00 € 0.01
12 Eco toxicity, marine water (MAETP) € 0.30 € 0.10 € 0.03 € 0.15 € 0.59
14 Eco toxicity, terrestric (TETP) € 0.01 € 0.00 € 0.00 € 0.00 € 0.01
Total € 5.46 € 0.78 € 0.67 € 1.41 € 8.32
Table 32 - Shadow costs per phase - Conventional - simulation 1
RoadCem - 1.6 kg/m³
Simulation 1
Transport distance ship (A4) 3.4 tkm
Transport distance truck (A4) 21.4 tkm
Impact category A1-A3 A4 A5 C1-C4 Total
1 abiotic depletion, non-fuel (AD) € 0.00 € 0.00 € 0.00 € 0.00 € 0.00
2 abiotic depletion, fuel (AD) € 0.03 € 0.00 € 0.00 € 0.00 € 0.03
4 global warming (GWP) € 1.51 € 0.14 € 0.04 € 0.06 € 1.75
5 ozone layer depletion (ODP) € 0.00 € 0.00 € 0.00 € 0.00 € 0.00
6 photochemical oxidation (POCP) € 0.02 € 0.00 € 0.00 € 0.00 € 0.02
7 acidification (AP) € 0.37 € 0.05 € 0.01 € 0.03 € 0.46
8 eutrophication (EP) € 0.14 € 0.02 € 0.01 € 0.01 € 0.18
9 human toxicity (HT) € 0.27 € 0.11 € 0.01 € 0.04 € 0.43
10 Eco toxicity, fresh water (FAETP) € 0.00 € 0.00 € 0.00 € 0.00 € 0.00
12 Eco toxicity, marine water (MAETP) € 0.10 € 0.05 € 0.00 € 0.02 € 0.17
14 Eco toxicity, terrestric (TETP) € 0.00 € 0.00 € 0.00 € 0.00 € 0.01
Total € 2.43 € 0.39 € 0.07 € 0.17 € 3.06
Table 33 - Shadow costs per phase - RoadCem (1.6 kg/m³) - simulation 1
27.054.17.08.006 – NIBE Research bv 27
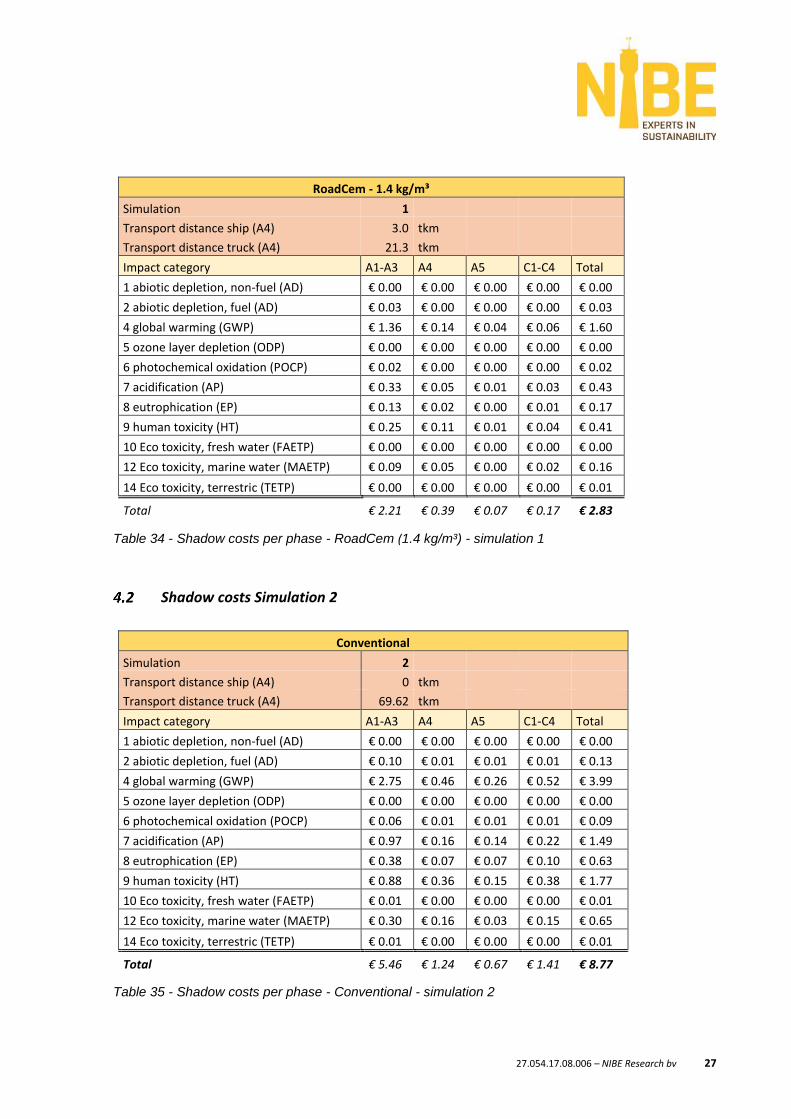
RoadCem - 1.4 kg/m³
Simulation 1
Transport distance ship (A4) 3.0 tkm
Transport distance truck (A4) 21.3 tkm
Impact category A1-A3 A4 A5 C1-C4 Total
1 abiotic depletion, non-fuel (AD) € 0.00 € 0.00 € 0.00 € 0.00 € 0.00
2 abiotic depletion, fuel (AD) € 0.03 € 0.00 € 0.00 € 0.00 € 0.03
4 global warming (GWP) € 1.36 € 0.14 € 0.04 € 0.06 € 1.60
5 ozone layer depletion (ODP) € 0.00 € 0.00 € 0.00 € 0.00 € 0.00
6 photochemical oxidation (POCP) € 0.02 € 0.00 € 0.00 € 0.00 € 0.02
7 acidification (AP) € 0.33 € 0.05 € 0.01 € 0.03 € 0.43
8 eutrophication (EP) € 0.13 € 0.02 € 0.00 € 0.01 € 0.17
9 human toxicity (HT) € 0.25 € 0.11 € 0.01 € 0.04 € 0.41
10 Eco toxicity, fresh water (FAETP) € 0.00 € 0.00 € 0.00 € 0.00 € 0.00
12 Eco toxicity, marine water (MAETP) € 0.09 € 0.05 € 0.00 € 0.02 € 0.16
14 Eco toxicity, terrestric (TETP) € 0.00 € 0.00 € 0.00 € 0.00 € 0.01
Total € 2.21 € 0.39 € 0.07 € 0.17 € 2.83
Table 34 - Shadow costs per phase - RoadCem (1.4 kg/m³) - simulation 1
Shadow costs Simulation 2
Conventional
Simulation 2
Transport distance ship (A4) 0 tkm
Transport distance truck (A4) 69.62 tkm
Impact category A1-A3 A4 A5 C1-C4 Total
1 abiotic depletion, non-fuel (AD) € 0.00 € 0.00 € 0.00 € 0.00 € 0.00
2 abiotic depletion, fuel (AD) € 0.10 € 0.01 € 0.01 € 0.01 € 0.13
4 global warming (GWP) € 2.75 € 0.46 € 0.26 € 0.52 € 3.99
5 ozone layer depletion (ODP) € 0.00 € 0.00 € 0.00 € 0.00 € 0.00
6 photochemical oxidation (POCP) € 0.06 € 0.01 € 0.01 € 0.01 € 0.09
7 acidification (AP) € 0.97 € 0.16 € 0.14 € 0.22 € 1.49
8 eutrophication (EP) € 0.38 € 0.07 € 0.07 € 0.10 € 0.63
9 human toxicity (HT) € 0.88 € 0.36 € 0.15 € 0.38 € 1.77
10 Eco toxicity, fresh water (FAETP) € 0.01 € 0.00 € 0.00 € 0.00 € 0.01
12 Eco toxicity, marine water (MAETP) € 0.30 € 0.16 € 0.03 € 0.15 € 0.65
14 Eco toxicity, terrestric (TETP) € 0.01 € 0.00 € 0.00 € 0.00 € 0.01
Total € 5.46 € 1.24 € 0.67 € 1.41 € 8.77
Table 35 - Shadow costs per phase - Conventional - simulation 2
28
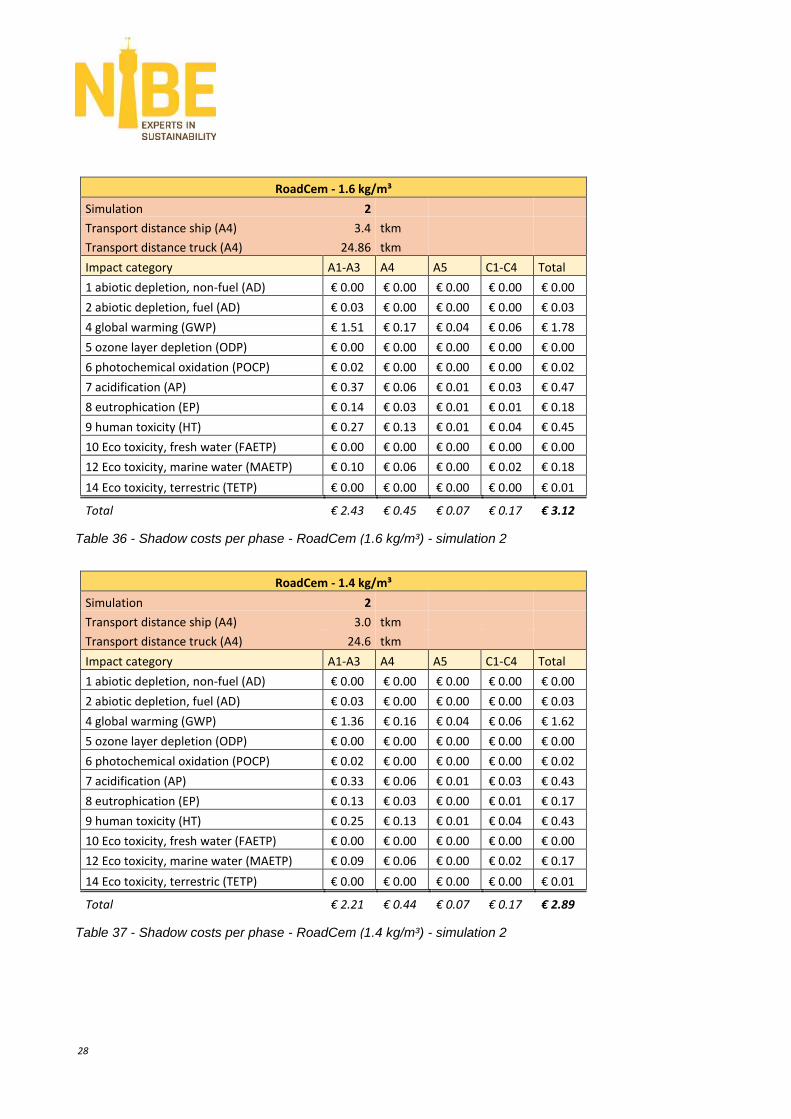
RoadCem - 1.6 kg/m³
Simulation 2
Transport distance ship (A4) 3.4 tkm
Transport distance truck (A4) 24.86 tkm
Impact category A1-A3 A4 A5 C1-C4 Total
1 abiotic depletion, non-fuel (AD) € 0.00 € 0.00 € 0.00 € 0.00 € 0.00
2 abiotic depletion, fuel (AD) € 0.03 € 0.00 € 0.00 € 0.00 € 0.03
4 global warming (GWP) € 1.51 € 0.17 € 0.04 € 0.06 € 1.78
5 ozone layer depletion (ODP) € 0.00 € 0.00 € 0.00 € 0.00 € 0.00
6 photochemical oxidation (POCP) € 0.02 € 0.00 € 0.00 € 0.00 € 0.02
7 acidification (AP) € 0.37 € 0.06 € 0.01 € 0.03 € 0.47
8 eutrophication (EP) € 0.14 € 0.03 € 0.01 € 0.01 € 0.18
9 human toxicity (HT) € 0.27 € 0.13 € 0.01 € 0.04 € 0.45
10 Eco toxicity, fresh water (FAETP) € 0.00 € 0.00 € 0.00 € 0.00 € 0.00
12 Eco toxicity, marine water (MAETP) € 0.10 € 0.06 € 0.00 € 0.02 € 0.18
14 Eco toxicity, terrestric (TETP) € 0.00 € 0.00 € 0.00 € 0.00 € 0.01
Total € 2.43 € 0.45 € 0.07 € 0.17 € 3.12
Table 36 - Shadow costs per phase - RoadCem (1.6 kg/m³) - simulation 2
RoadCem - 1.4 kg/m³
Simulation 2
Transport distance ship (A4) 3.0 tkm
Transport distance truck (A4) 24.6 tkm
Impact category A1-A3 A4 A5 C1-C4 Total
1 abiotic depletion, non-fuel (AD) € 0.00 € 0.00 € 0.00 € 0.00 € 0.00
2 abiotic depletion, fuel (AD) € 0.03 € 0.00 € 0.00 € 0.00 € 0.03
4 global warming (GWP) € 1.36 € 0.16 € 0.04 € 0.06 € 1.62
5 ozone layer depletion (ODP) € 0.00 € 0.00 € 0.00 € 0.00 € 0.00
6 photochemical oxidation (POCP) € 0.02 € 0.00 € 0.00 € 0.00 € 0.02
7 acidification (AP) € 0.33 € 0.06 € 0.01 € 0.03 € 0.43
8 eutrophication (EP) € 0.13 € 0.03 € 0.00 € 0.01 € 0.17
9 human toxicity (HT) € 0.25 € 0.13 € 0.01 € 0.04 € 0.43
10 Eco toxicity, fresh water (FAETP) € 0.00 € 0.00 € 0.00 € 0.00 € 0.00
12 Eco toxicity, marine water (MAETP) € 0.09 € 0.06 € 0.00 € 0.02 € 0.17
14 Eco toxicity, terrestric (TETP) € 0.00 € 0.00 € 0.00 € 0.00 € 0.01
Total € 2.21 € 0.44 € 0.07 € 0.17 € 2.89
Table 37 - Shadow costs per phase - RoadCem (1.4 kg/m³) - simulation 2
27.054.17.08.006 – NIBE Research bv 29
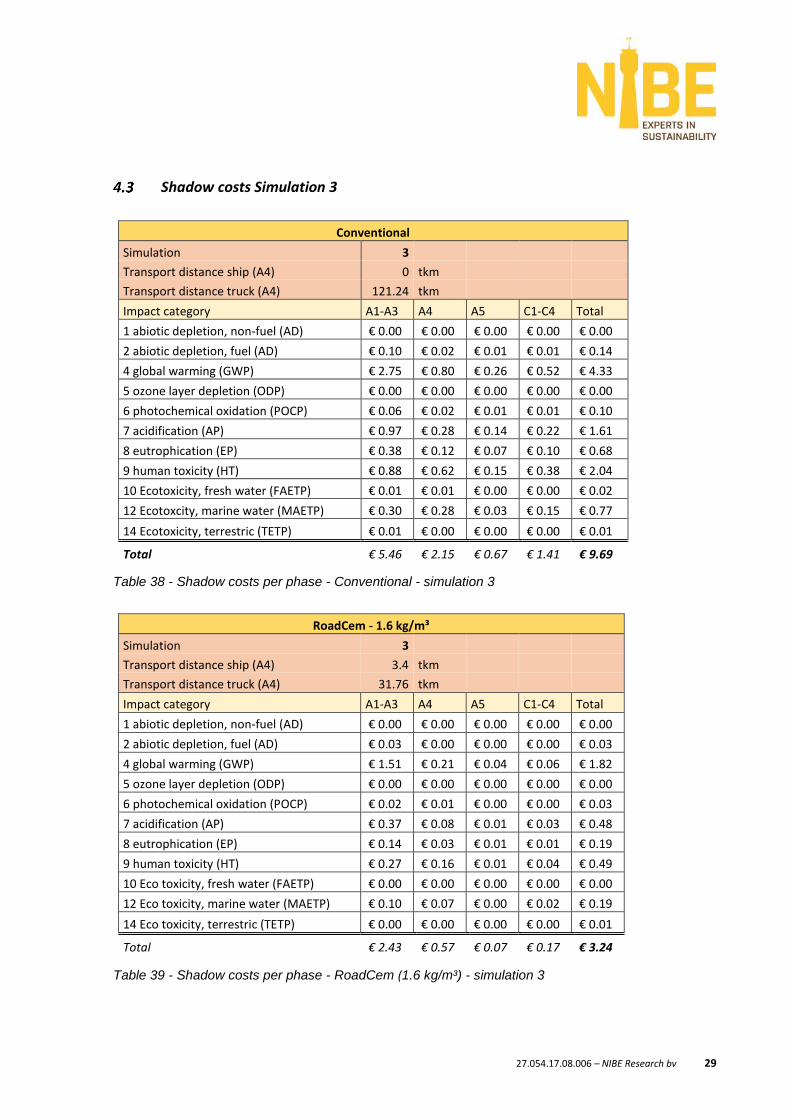
Shadow costs Simulation 3
Conventional
Simulation 3
Transport distance ship (A4) 0 tkm
Transport distance truck (A4) 121.24 tkm
Impact category A1-A3 A4 A5 C1-C4 Total
1 abiotic depletion, non-fuel (AD) € 0.00 € 0.00 € 0.00 € 0.00 € 0.00
2 abiotic depletion, fuel (AD) € 0.10 € 0.02 € 0.01 € 0.01 € 0.14
4 global warming (GWP) € 2.75 € 0.80 € 0.26 € 0.52 € 4.33
5 ozone layer depletion (ODP) € 0.00 € 0.00 € 0.00 € 0.00 € 0.00
6 photochemical oxidation (POCP) € 0.06 € 0.02 € 0.01 € 0.01 € 0.10
7 acidification (AP) € 0.97 € 0.28 € 0.14 € 0.22 € 1.61
8 eutrophication (EP) € 0.38 € 0.12 € 0.07 € 0.10 € 0.68
9 human toxicity (HT) € 0.88 € 0.62 € 0.15 € 0.38 € 2.04
10 Ecotoxicity, fresh water (FAETP) € 0.01 € 0.01 € 0.00 € 0.00 € 0.02
12 Ecotoxcity, marine water (MAETP) € 0.30 € 0.28 € 0.03 € 0.15 € 0.77
14 Ecotoxicity, terrestric (TETP) € 0.01 € 0.00 € 0.00 € 0.00 € 0.01
Total € 5.46 € 2.15 € 0.67 € 1.41 € 9.69
Table 38 - Shadow costs per phase - Conventional - simulation 3
RoadCem - 1.6 kg/m³
Simulation 3
Transport distance ship (A4) 3.4 tkm
Transport distance truck (A4) 31.76 tkm
Impact category A1-A3 A4 A5 C1-C4 Total
1 abiotic depletion, non-fuel (AD) € 0.00 € 0.00 € 0.00 € 0.00 € 0.00
2 abiotic depletion, fuel (AD) € 0.03 € 0.00 € 0.00 € 0.00 € 0.03
4 global warming (GWP) € 1.51 € 0.21 € 0.04 € 0.06 € 1.82
5 ozone layer depletion (ODP) € 0.00 € 0.00 € 0.00 € 0.00 € 0.00
6 photochemical oxidation (POCP) € 0.02 € 0.01 € 0.00 € 0.00 € 0.03
7 acidification (AP) € 0.37 € 0.08 € 0.01 € 0.03 € 0.48
8 eutrophication (EP) € 0.14 € 0.03 € 0.01 € 0.01 € 0.19
9 human toxicity (HT) € 0.27 € 0.16 € 0.01 € 0.04 € 0.49
10 Eco toxicity, fresh water (FAETP) € 0.00 € 0.00 € 0.00 € 0.00 € 0.00
12 Eco toxicity, marine water (MAETP) € 0.10 € 0.07 € 0.00 € 0.02 € 0.19
14 Eco toxicity, terrestric (TETP) € 0.00 € 0.00 € 0.00 € 0.00 € 0.01
Total € 2.43 € 0.57 € 0.07 € 0.17 € 3.24
Table 39 - Shadow costs per phase - RoadCem (1.6 kg/m³) - simulation 3
30
RoadCem - 1.4 kg/m³
Simulation 3
Transport distance ship (A4) 3.0 tkm
Transport distance truck (A4) 31.2 tkm
Impact category A1-A3 A4 A5 C1-C4 Total
1 abiotic depletion, non-fuel (AD) € 0.00 € 0.00 € 0.00 € 0.00 € 0.00
2 abiotic depletion, fuel (AD) € 0.03 € 0.00 € 0.00 € 0.00 € 0.03
4 global warming (GWP) € 1.36 € 0.21 € 0.04 € 0.06 € 1.66
5 ozone layer depletion (ODP) € 0.00 € 0.00 € 0.00 € 0.00 € 0.00
6 photochemical oxidation (POCP) € 0.02 € 0.01 € 0.00 € 0.00 € 0.02
7 acidification (AP) € 0.33 € 0.08 € 0.01 € 0.03 € 0.45
8 eutrophication (EP) € 0.13 € 0.03 € 0.00 € 0.01 € 0.18
9 human toxicity (HT) € 0.25 € 0.16 € 0.01 € 0.04 € 0.46
10 Eco toxicity, fresh water (FAETP) € 0.00 € 0.00 € 0.00 € 0.00 € 0.00
12 Eco toxicity, marine water (MAETP) € 0.09 € 0.07 € 0.00 € 0.02 € 0.18
14 Eco toxicity, terrestric (TETP) € 0.00 € 0.00 € 0.00 € 0.00 € 0.01
Total € 2.21 € 0.56 € 0.07 € 0.17 € 3.01
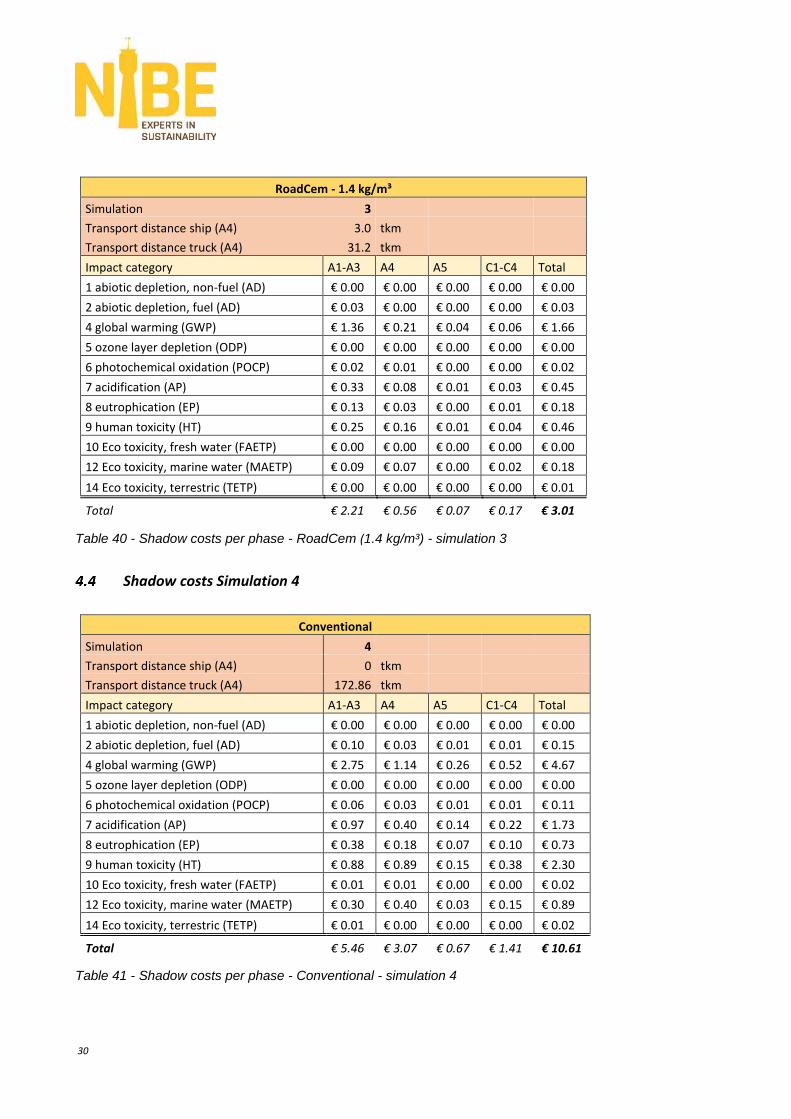
Table 40 - Shadow costs per phase - RoadCem (1.4 kg/m³) - simulation 3
Shadow costs Simulation 4
Conventional
Simulation 4
Transport distance ship (A4) 0 tkm
Transport distance truck (A4) 172.86 tkm
Impact category A1-A3 A4 A5 C1-C4 Total
1 abiotic depletion, non-fuel (AD) € 0.00 € 0.00 € 0.00 € 0.00 € 0.00
2 abiotic depletion, fuel (AD) € 0.10 € 0.03 € 0.01 € 0.01 € 0.15
4 global warming (GWP) € 2.75 € 1.14 € 0.26 € 0.52 € 4.67
5 ozone layer depletion (ODP) € 0.00 € 0.00 € 0.00 € 0.00 € 0.00
6 photochemical oxidation (POCP) € 0.06 € 0.03 € 0.01 € 0.01 € 0.11
7 acidification (AP) € 0.97 € 0.40 € 0.14 € 0.22 € 1.73
8 eutrophication (EP) € 0.38 € 0.18 € 0.07 € 0.10 € 0.73
9 human toxicity (HT) € 0.88 € 0.89 € 0.15 € 0.38 € 2.30
10 Eco toxicity, fresh water (FAETP) € 0.01 € 0.01 € 0.00 € 0.00 € 0.02
12 Eco toxicity, marine water (MAETP) € 0.30 € 0.40 € 0.03 € 0.15 € 0.89
14 Eco toxicity, terrestric (TETP) € 0.01 € 0.00 € 0.00 € 0.00 € 0.02
Total € 5.46 € 3.07 € 0.67 € 1.41 € 10.61
Table 41 - Shadow costs per phase - Conventional - simulation 4
27.054.17.08.006 – NIBE Research bv 31
RoadCem - 1.6 kg/m³
Simulation 4
Transport distance ship (A4) 3.4 tkm
Transport distance truck (A4) 38.62 tkm
Impact category A1-A3 A4 A5 C1-C4 Total
1 abiotic depletion, non-fuel (AD) € 0.00 € 0.00 € 0.00 € 0.00 € 0.00
2 abiotic depletion, fuel (AD) € 0.03 € 0.01 € 0.00 € 0.00 € 0.04
4 global warming (GWP) € 1.51 € 0.26 € 0.04 € 0.06 € 1.87
5 ozone layer depletion (ODP) € 0.00 € 0.00 € 0.00 € 0.00 € 0.00
6 photochemical oxidation (POCP) € 0.02 € 0.01 € 0.00 € 0.00 € 0.03
7 acidification (AP) € 0.37 € 0.09 € 0.01 € 0.03 € 0.50
8 eutrophication (EP) € 0.14 € 0.04 € 0.01 € 0.01 € 0.20
9 human toxicity (HT) € 0.27 € 0.20 € 0.01 € 0.04 € 0.52
10 Eco toxicity, fresh water (FAETP) € 0.00 € 0.00 € 0.00 € 0.00 € 0.00
12 Eco toxicity, marine water (MAETP) € 0.10 € 0.09 € 0.00 € 0.02 € 0.21
14 Eco toxicity, terrestric (TETP) € 0.00 € 0.00 € 0.00 € 0.00 € 0.01
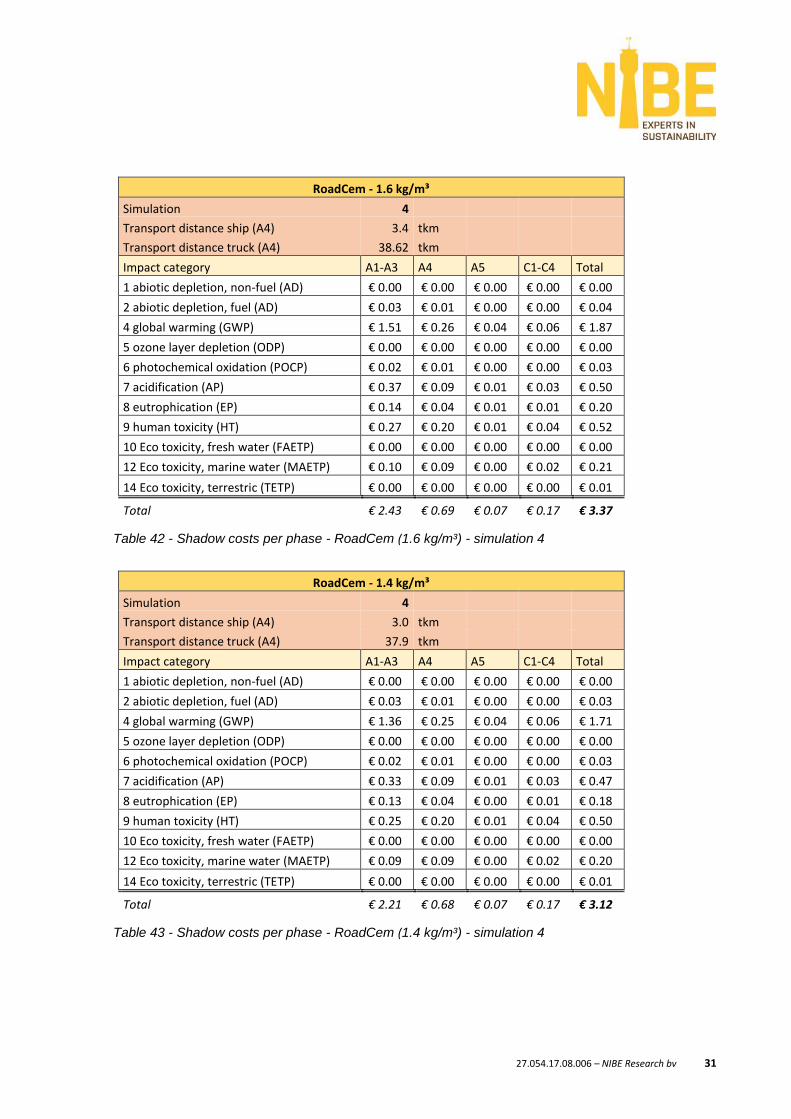
Total € 2.43 € 0.69 € 0.07 € 0.17 € 3.37
Table 42 - Shadow costs per phase - RoadCem (1.6 kg/m³) - simulation 4
RoadCem - 1.4 kg/m³
Simulation 4
Transport distance ship (A4) 3.0 tkm
Transport distance truck (A4) 37.9 tkm
Impact category A1-A3 A4 A5 C1-C4 Total
1 abiotic depletion, non-fuel (AD) € 0.00 € 0.00 € 0.00 € 0.00 € 0.00
2 abiotic depletion, fuel (AD) € 0.03 € 0.01 € 0.00 € 0.00 € 0.03
4 global warming (GWP) € 1.36 € 0.25 € 0.04 € 0.06 € 1.71
5 ozone layer depletion (ODP) € 0.00 € 0.00 € 0.00 € 0.00 € 0.00
6 photochemical oxidation (POCP) € 0.02 € 0.01 € 0.00 € 0.00 € 0.03
7 acidification (AP) € 0.33 € 0.09 € 0.01 € 0.03 € 0.47
8 eutrophication (EP) € 0.13 € 0.04 € 0.00 € 0.01 € 0.18
9 human toxicity (HT) € 0.25 € 0.20 € 0.01 € 0.04 € 0.50
10 Eco toxicity, fresh water (FAETP) € 0.00 € 0.00 € 0.00 € 0.00 € 0.00
12 Eco toxicity, marine water (MAETP) € 0.09 € 0.09 € 0.00 € 0.02 € 0.20
14 Eco toxicity, terrestric (TETP) € 0.00 € 0.00 € 0.00 € 0.00 € 0.01
Total € 2.21 € 0.68 € 0.07 € 0.17 € 3.12
Table 43 - Shadow costs per phase - RoadCem (1.4 kg/m³) - simulation 4
32
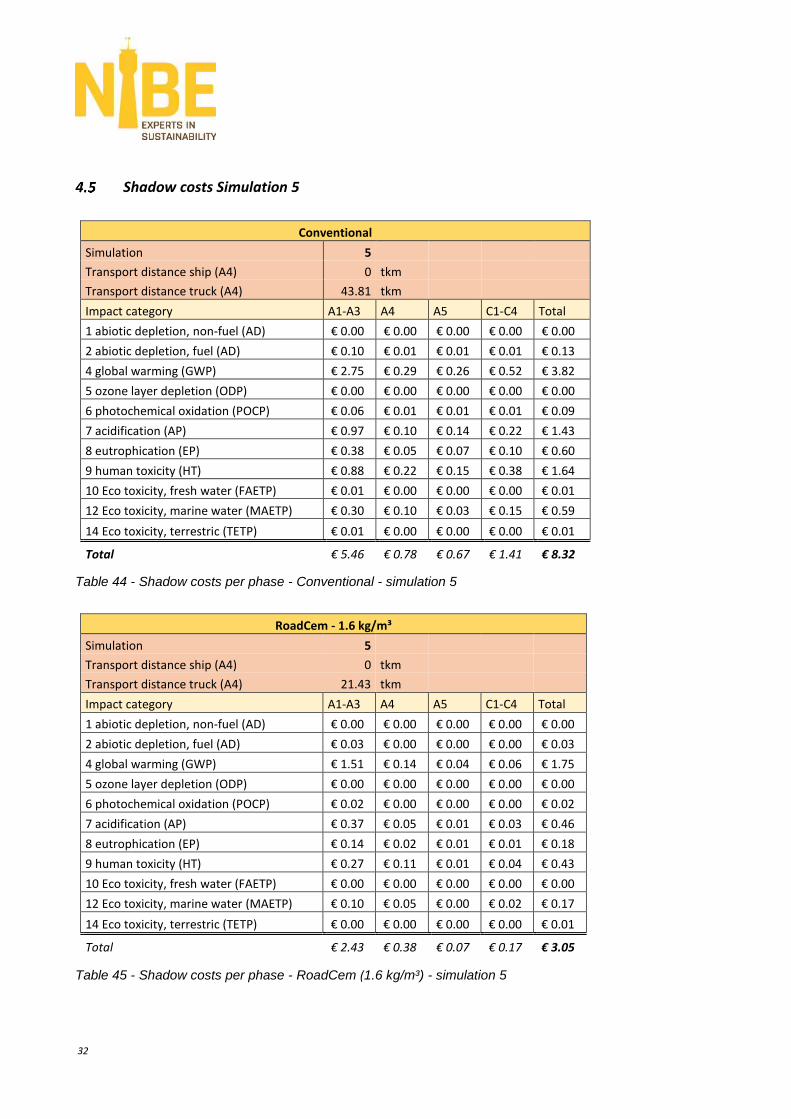
Shadow costs Simulation 5
Conventional
Simulation 5
Transport distance ship (A4) 0 tkm
Transport distance truck (A4) 43.81 tkm
Impact category A1-A3 A4 A5 C1-C4 Total
1 abiotic depletion, non-fuel (AD) € 0.00 € 0.00 € 0.00 € 0.00 € 0.00
2 abiotic depletion, fuel (AD) € 0.10 € 0.01 € 0.01 € 0.01 € 0.13
4 global warming (GWP) € 2.75 € 0.29 € 0.26 € 0.52 € 3.82
5 ozone layer depletion (ODP) € 0.00 € 0.00 € 0.00 € 0.00 € 0.00
6 photochemical oxidation (POCP) € 0.06 € 0.01 € 0.01 € 0.01 € 0.09
7 acidification (AP) € 0.97 € 0.10 € 0.14 € 0.22 € 1.43
8 eutrophication (EP) € 0.38 € 0.05 € 0.07 € 0.10 € 0.60
9 human toxicity (HT) € 0.88 € 0.22 € 0.15 € 0.38 € 1.64
10 Eco toxicity, fresh water (FAETP) € 0.01 € 0.00 € 0.00 € 0.00 € 0.01
12 Eco toxicity, marine water (MAETP) € 0.30 € 0.10 € 0.03 € 0.15 € 0.59
14 Eco toxicity, terrestric (TETP) € 0.01 € 0.00 € 0.00 € 0.00 € 0.01
Total € 5.46 € 0.78 € 0.67 € 1.41 € 8.32
Table 44 - Shadow costs per phase - Conventional - simulation 5
RoadCem - 1.6 kg/m³
Simulation 5
Transport distance ship (A4) 0 tkm
Transport distance truck (A4) 21.43 tkm
Impact category A1-A3 A4 A5 C1-C4 Total
1 abiotic depletion, non-fuel (AD) € 0.00 € 0.00 € 0.00 € 0.00 € 0.00
2 abiotic depletion, fuel (AD) € 0.03 € 0.00 € 0.00 € 0.00 € 0.03
4 global warming (GWP) € 1.51 € 0.14 € 0.04 € 0.06 € 1.75
5 ozone layer depletion (ODP) € 0.00 € 0.00 € 0.00 € 0.00 € 0.00
6 photochemical oxidation (POCP) € 0.02 € 0.00 € 0.00 € 0.00 € 0.02
7 acidification (AP) € 0.37 € 0.05 € 0.01 € 0.03 € 0.46
8 eutrophication (EP) € 0.14 € 0.02 € 0.01 € 0.01 € 0.18
9 human toxicity (HT) € 0.27 € 0.11 € 0.01 € 0.04 € 0.43
10 Eco toxicity, fresh water (FAETP) € 0.00 € 0.00 € 0.00 € 0.00 € 0.00
12 Eco toxicity, marine water (MAETP) € 0.10 € 0.05 € 0.00 € 0.02 € 0.17
14 Eco toxicity, terrestric (TETP) € 0.00 € 0.00 € 0.00 € 0.00 € 0.01
Total € 2.43 € 0.38 € 0.07 € 0.17 € 3.05
Table 45 - Shadow costs per phase - RoadCem (1.6 kg/m³) - simulation 5
27.054.17.08.006 – NIBE Research bv 33
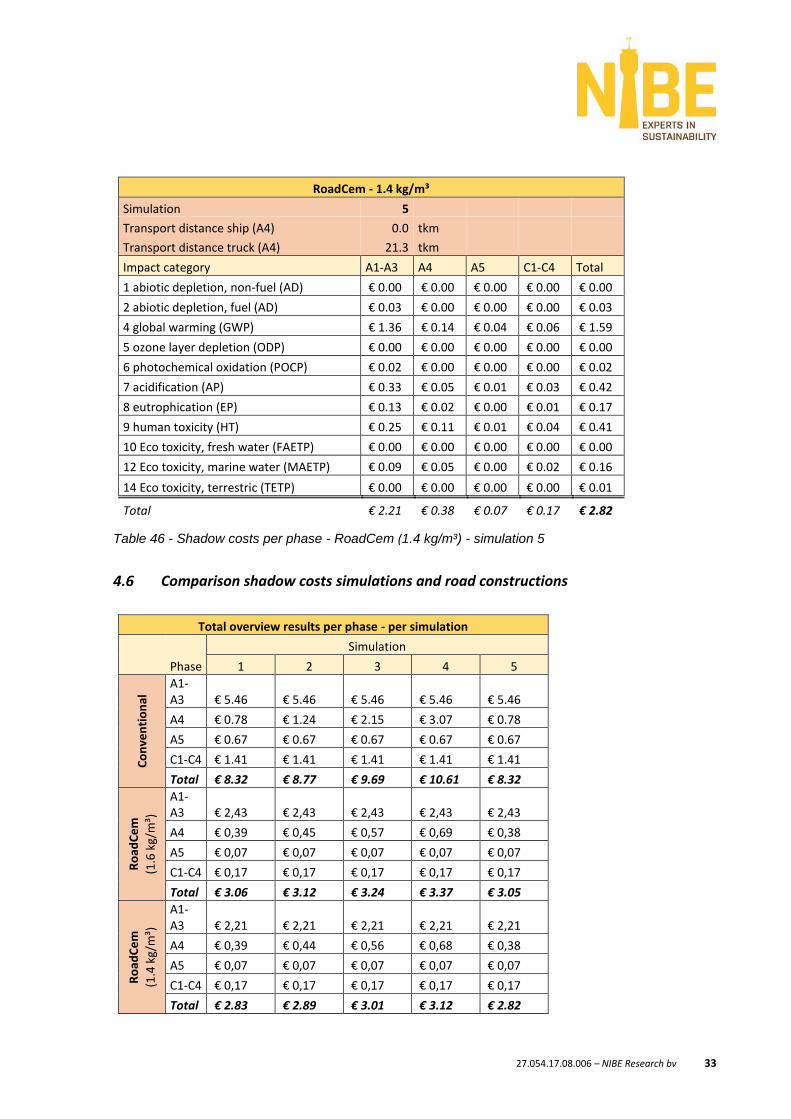
RoadCem - 1.4 kg/m³
Simulation 5
Transport distance ship (A4) 0.0 tkm
Transport distance truck (A4) 21.3 tkm
Impact category A1-A3 A4 A5 C1-C4 Total
1 abiotic depletion, non-fuel (AD) € 0.00 € 0.00 € 0.00 € 0.00 € 0.00
2 abiotic depletion, fuel (AD) € 0.03 € 0.00 € 0.00 € 0.00 € 0.03
4 global warming (GWP) € 1.36 € 0.14 € 0.04 € 0.06 € 1.59
5 ozone layer depletion (ODP) € 0.00 € 0.00 € 0.00 € 0.00 € 0.00
6 photochemical oxidation (POCP) € 0.02 € 0.00 € 0.00 € 0.00 € 0.02
7 acidification (AP) € 0.33 € 0.05 € 0.01 € 0.03 € 0.42
8 eutrophication (EP) € 0.13 € 0.02 € 0.00 € 0.01 € 0.17
9 human toxicity (HT) € 0.25 € 0.11 € 0.01 € 0.04 € 0.41
10 Eco toxicity, fresh water (FAETP) € 0.00 € 0.00 € 0.00 € 0.00 € 0.00
12 Eco toxicity, marine water (MAETP) € 0.09 € 0.05 € 0.00 € 0.02 € 0.16
14 Eco toxicity, terrestric (TETP) € 0.00 € 0.00 € 0.00 € 0.00 € 0.01
Total € 2.21 € 0.38 € 0.07 € 0.17 € 2.82
Table 46 - Shadow costs per phase - RoadCem (1.4 kg/m³) - simulation 5
Comparison shadow costs simulations and road constructions
Total overview results per phase - per simulation
Phase
Simulation
1 2 3 4 5
Co
nve
nti
on
al
A1-A3 € 5.46 € 5.46 € 5.46 € 5.46 € 5.46
A4 € 0.78 € 1.24 € 2.15 € 3.07 € 0.78
A5 € 0.67 € 0.67 € 0.67 € 0.67 € 0.67
C1-C4 € 1.41 € 1.41 € 1.41 € 1.41 € 1.41
Total € 8.32 € 8.77 € 9.69 € 10.61 € 8.32
Ro
adC
em
(1.6
kg/
m³)
A1-A3 € 2,43 € 2,43 € 2,43 € 2,43 € 2,43
A4 € 0,39 € 0,45 € 0,57 € 0,69 € 0,38
A5 € 0,07 € 0,07 € 0,07 € 0,07 € 0,07
C1-C4 € 0,17 € 0,17 € 0,17 € 0,17 € 0,17
Total € 3.06 € 3.12 € 3.24 € 3.37 € 3.05
Ro
adC
em
(1.4
kg/
m³)
A1-A3 € 2,21 € 2,21 € 2,21 € 2,21 € 2,21
A4 € 0,39 € 0,44 € 0,56 € 0,68 € 0,38
A5 € 0,07 € 0,07 € 0,07 € 0,07 € 0,07
C1-C4 € 0,17 € 0,17 € 0,17 € 0,17 € 0,17
Total € 2.83 € 2.89 € 3.01 € 3.12 € 2.82
34
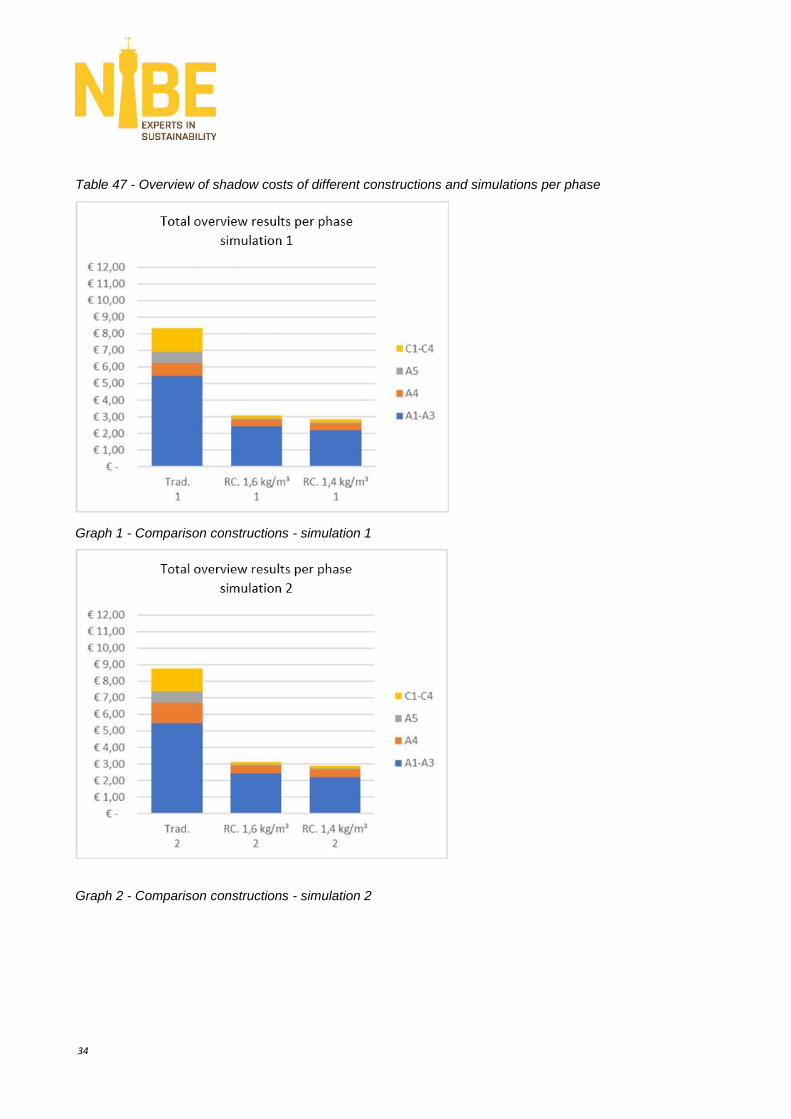
Table 47 - Overview of shadow costs of different constructions and simulations per phase
Graph 1 - Comparison constructions - simulation 1
Graph 2 - Comparison constructions - simulation 2
27.054.17.08.006 – NIBE Research bv 35
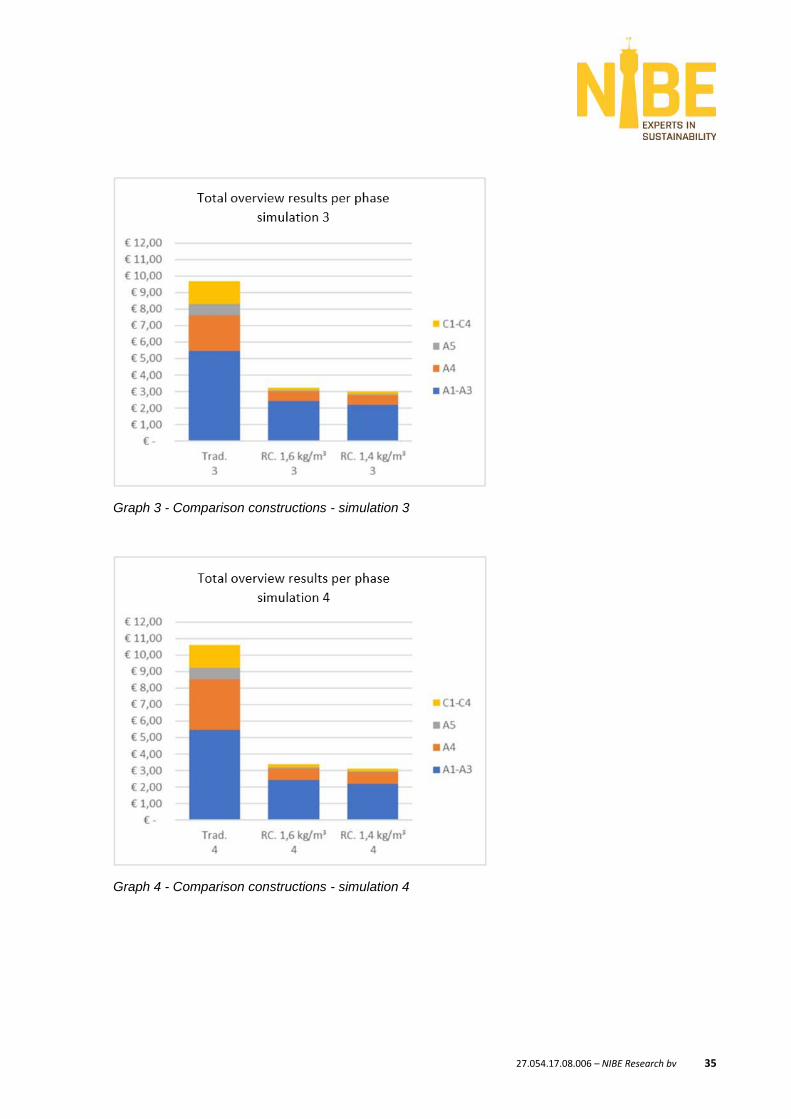
Graph 3 - Comparison constructions - simulation 3
Graph 4 - Comparison constructions - simulation 4
36
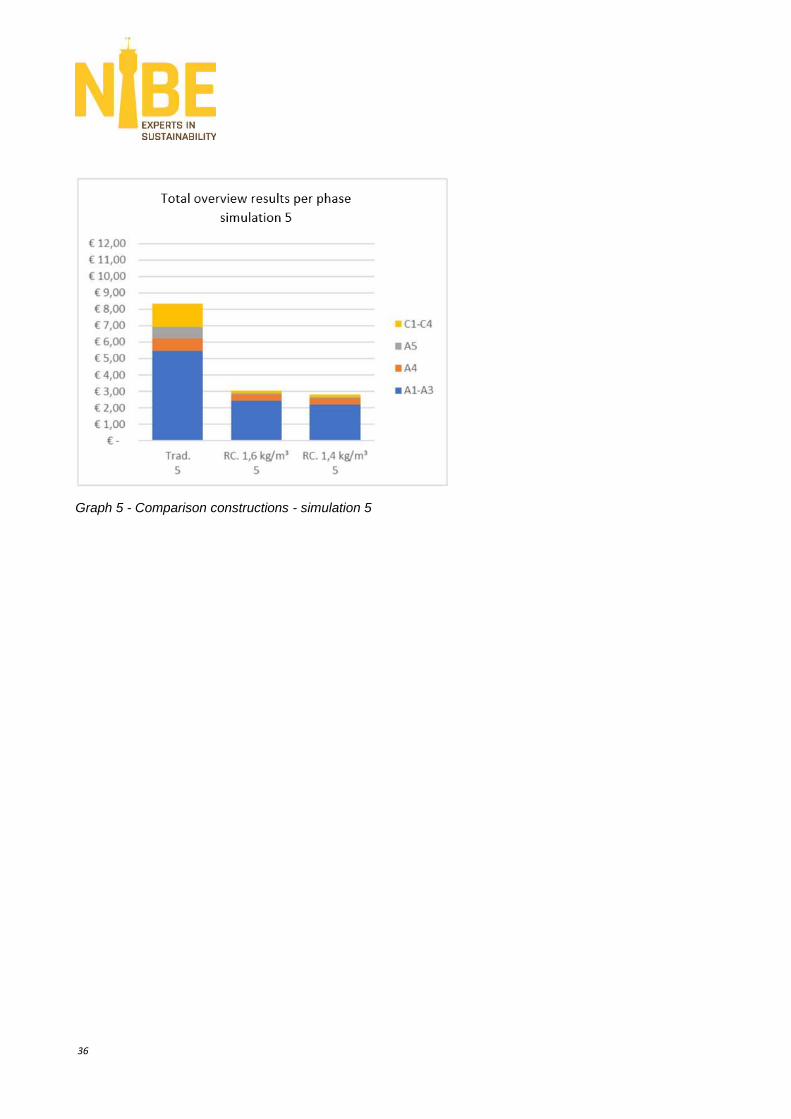
Graph 5 - Comparison constructions - simulation 5
27.054.17.08.006 – NIBE Research bv 37
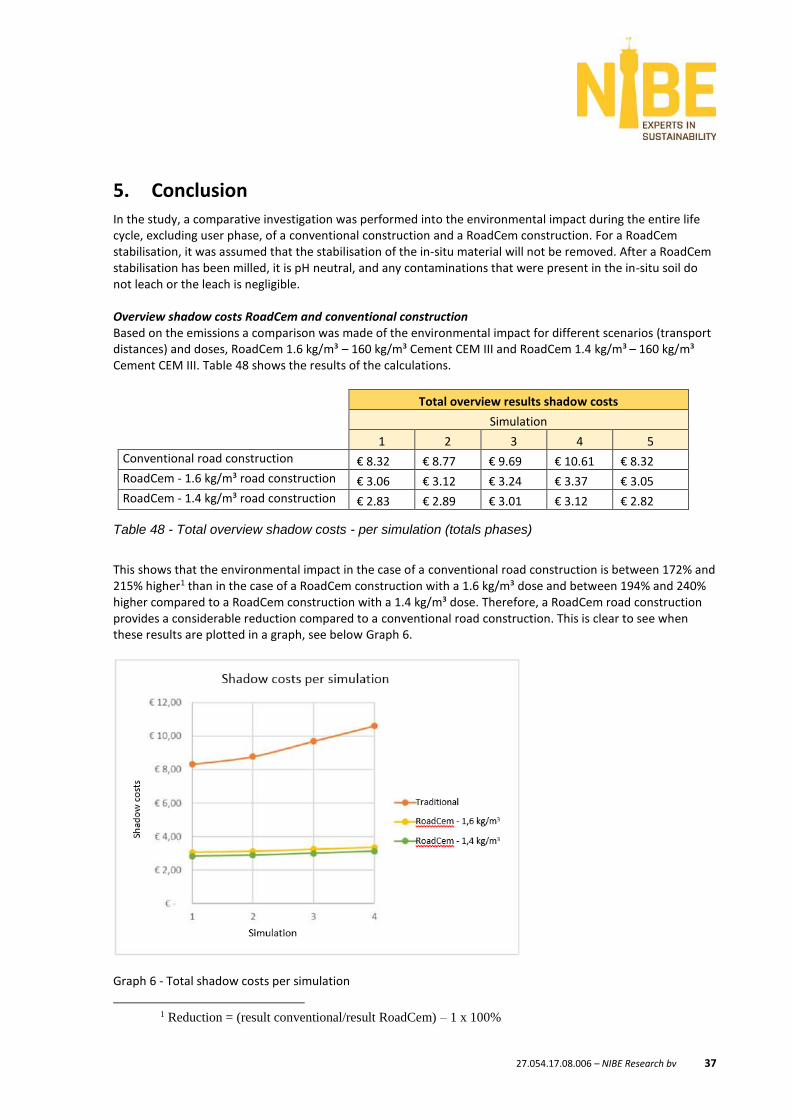
5. Conclusion In the study, a comparative investigation was performed into the environmental impact during the entire life cycle, excluding user phase, of a conventional construction and a RoadCem construction. For a RoadCem stabilisation, it was assumed that the stabilisation of the in-situ material will not be removed. After a RoadCem stabilisation has been milled, it is pH neutral, and any contaminations that were present in the in-situ soil do not leach or the leach is negligible. Overview shadow costs RoadCem and conventional construction Based on the emissions a comparison was made of the environmental impact for different scenarios (transport distances) and doses, RoadCem 1.6 kg/m³ – 160 kg/m³ Cement CEM III and RoadCem 1.4 kg/m³ – 160 kg/m³ Cement CEM III. Table 48 shows the results of the calculations.
Total overview results shadow costs
Simulation
1 2 3 4 5
Conventional road construction € 8.32 € 8.77 € 9.69 € 10.61 € 8.32
RoadCem - 1.6 kg/m³ road construction € 3.06 € 3.12 € 3.24 € 3.37 € 3.05
RoadCem - 1.4 kg/m³ road construction € 2.83 € 2.89 € 3.01 € 3.12 € 2.82
Table 48 - Total overview shadow costs - per simulation (totals phases)
This shows that the environmental impact in the case of a conventional road construction is between 172% and 215% higher1 than in the case of a RoadCem construction with a 1.6 kg/m³ dose and between 194% and 240% higher compared to a RoadCem construction with a 1.4 kg/m³ dose. Therefore, a RoadCem road construction provides a considerable reduction compared to a conventional road construction. This is clear to see when these results are plotted in a graph, see below Graph 6.
Graph 6 - Total shadow costs per simulation
1 Reduction = (result conventional/result RoadCem) – 1 x 100%
38
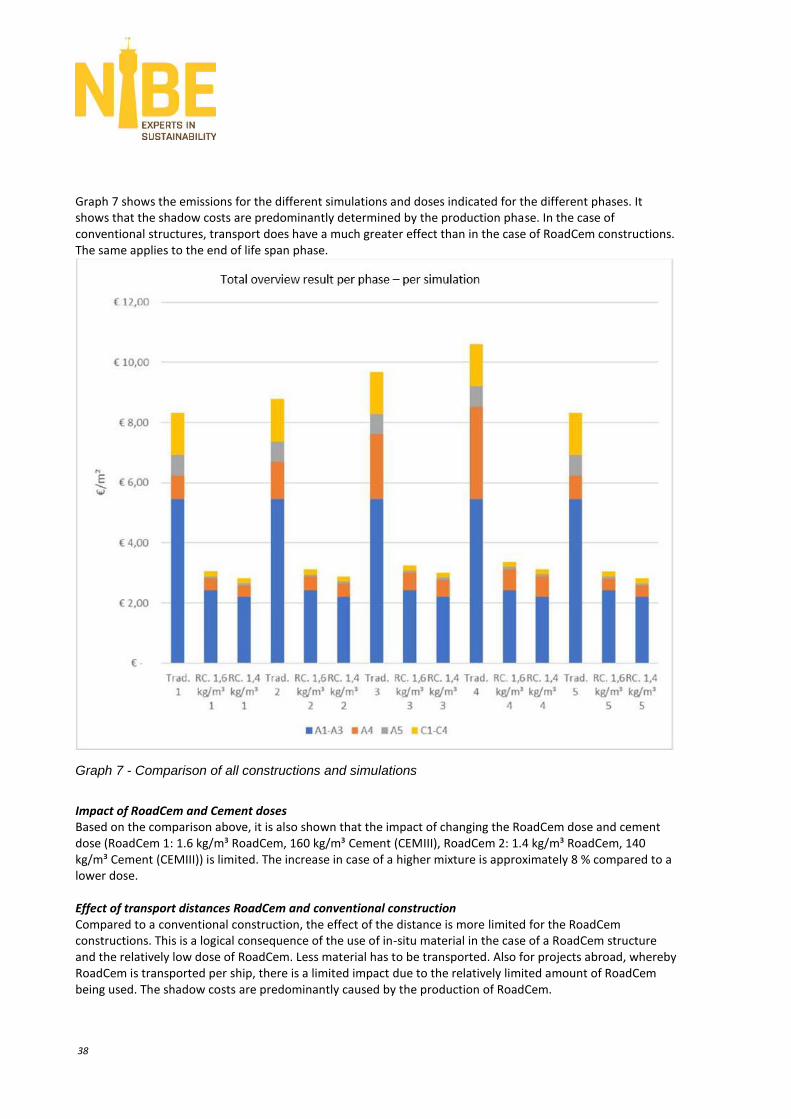
Graph 7 shows the emissions for the different simulations and doses indicated for the different phases. It shows that the shadow costs are predominantly determined by the production phase. In the case of conventional structures, transport does have a much greater effect than in the case of RoadCem constructions. The same applies to the end of life span phase.
Graph 7 - Comparison of all constructions and simulations
Impact of RoadCem and Cement doses Based on the comparison above, it is also shown that the impact of changing the RoadCem dose and cement dose (RoadCem 1: 1.6 kg/m³ RoadCem, 160 kg/m³ Cement (CEMIII), RoadCem 2: 1.4 kg/m³ RoadCem, 140 kg/m³ Cement (CEMIII)) is limited. The increase in case of a higher mixture is approximately 8 % compared to a lower dose. Effect of transport distances RoadCem and conventional construction Compared to a conventional construction, the effect of the distance is more limited for the RoadCem constructions. This is a logical consequence of the use of in-situ material in the case of a RoadCem structure and the relatively low dose of RoadCem. Less material has to be transported. Also for projects abroad, whereby RoadCem is transported per ship, there is a limited impact due to the relatively limited amount of RoadCem being used. The shadow costs are predominantly caused by the production of RoadCem.
27.054.17.08.006 – NIBE Research bv 39
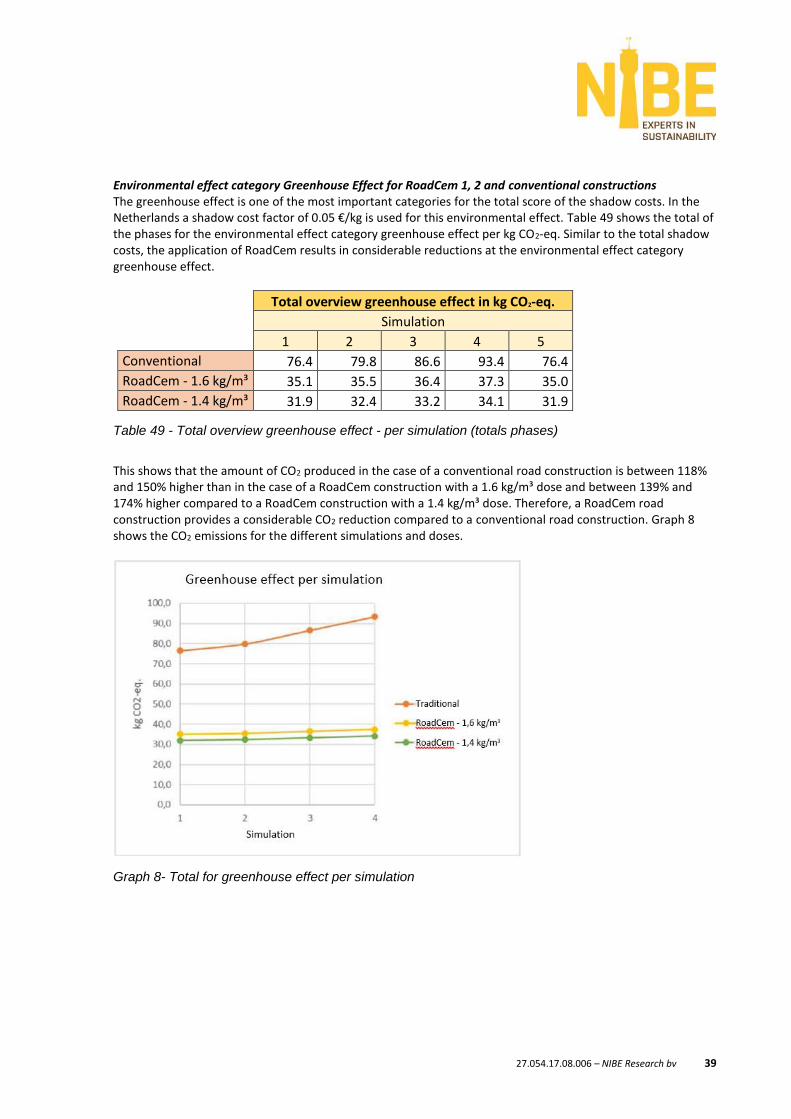
Environmental effect category Greenhouse Effect for RoadCem 1, 2 and conventional constructions The greenhouse effect is one of the most important categories for the total score of the shadow costs. In the Netherlands a shadow cost factor of 0.05 €/kg is used for this environmental effect. Table 49 shows the total of the phases for the environmental effect category greenhouse effect per kg CO2-eq. Similar to the total shadow costs, the application of RoadCem results in considerable reductions at the environmental effect category greenhouse effect.
Total overview greenhouse effect in kg CO2-eq.
Simulation
1 2 3 4 5
Conventional 76.4 79.8 86.6 93.4 76.4
RoadCem - 1.6 kg/m³ 35.1 35.5 36.4 37.3 35.0
RoadCem - 1.4 kg/m³ 31.9 32.4 33.2 34.1 31.9
Table 49 - Total overview greenhouse effect - per simulation (totals phases)
This shows that the amount of CO2 produced in the case of a conventional road construction is between 118% and 150% higher than in the case of a RoadCem construction with a 1.6 kg/m³ dose and between 139% and 174% higher compared to a RoadCem construction with a 1.4 kg/m³ dose. Therefore, a RoadCem road construction provides a considerable CO2 reduction compared to a conventional road construction. Graph 8 shows the CO2 emissions for the different simulations and doses.
Graph 8- Total for greenhouse effect per simulation
40
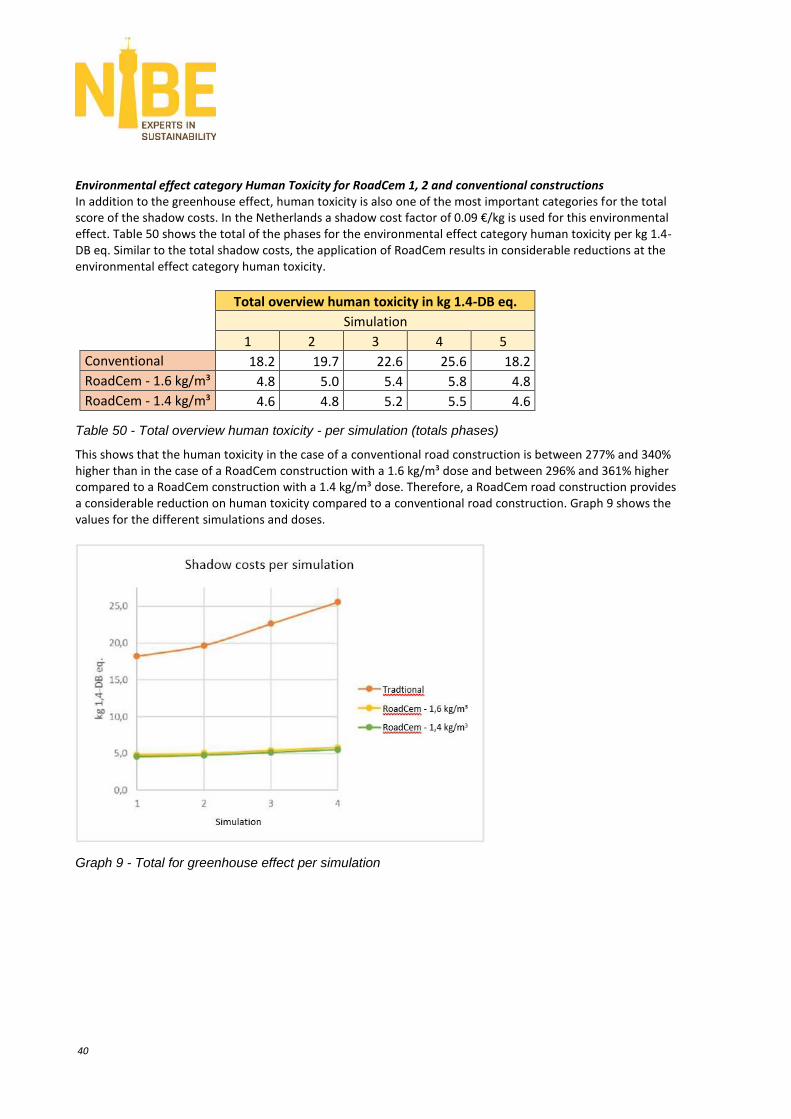
Environmental effect category Human Toxicity for RoadCem 1, 2 and conventional constructions In addition to the greenhouse effect, human toxicity is also one of the most important categories for the total score of the shadow costs. In the Netherlands a shadow cost factor of 0.09 €/kg is used for this environmental effect. Table 50 shows the total of the phases for the environmental effect category human toxicity per kg 1.4-DB eq. Similar to the total shadow costs, the application of RoadCem results in considerable reductions at the environmental effect category human toxicity.
Total overview human toxicity in kg 1.4-DB eq.
Simulation
1 2 3 4 5
Conventional 18.2 19.7 22.6 25.6 18.2
RoadCem - 1.6 kg/m³ 4.8 5.0 5.4 5.8 4.8
RoadCem - 1.4 kg/m³ 4.6 4.8 5.2 5.5 4.6
Table 50 - Total overview human toxicity - per simulation (totals phases)
This shows that the human toxicity in the case of a conventional road construction is between 277% and 340% higher than in the case of a RoadCem construction with a 1.6 kg/m³ dose and between 296% and 361% higher compared to a RoadCem construction with a 1.4 kg/m³ dose. Therefore, a RoadCem road construction provides a considerable reduction on human toxicity compared to a conventional road construction. Graph 9 shows the values for the different simulations and doses.
Graph 9 - Total for greenhouse effect per simulation
27.054.17.08.006 – NIBE Research bv 41
6. Sources [1] Determination method buildings and civil engineering works 2.0, Stichting Bouwkwaliteit,
Rijswijk, November 2014. Including 'modification sheet transfer to ecoinvent v3.3 dated 1 June 2017' and 'modification sheet "Instruction concerning which constructions and installations should be considered for determining the environmental performance of a use function" dated. 1 August 2017".
[2] Cement-bound road base materials, Delft, July 2011, TUDelft, reference 7-11-218-1 [3] Nano scale research, Nijmegen, July 2011, Radboud University , reference: He/Rr/PCT/lfMaM-
2011 [4] Outcome of comparison of analytical data of building material samples treated with and without
ImmoCem, ‘s Hertogenbosch, January 2012, ARCADIS, reference 076261876:0.1 [5] NEN-EN 15804:2012, Durability of structures – Environmental declarations of products –
Fundamental rules for the product group building products