environmental impact assessment and hazop study of …2.1 process description drilling cuttings...
TRANSCRIPT

Environmental impact assessment and HazOp study of the drilling cuttings confinement process into non-productive wells in marine platforms in Campeche, Mexico
M. Muriel-García1, J. G. Cerón2 & R. M. Cerón 2
1Instituto Mexicano del Petróleo, México 2Universidad Autónoma del Carmen, México
Abstract
Potential risk and environmental impacts associated with the cuttings re-injection process as an alternative method for drilling wastes disposal were identified and assessed in two marine platforms facilities located in Campeche, Mexico. Environmental impacts were identified and assessed on physicochemical, biological-ecological, socio-cultural and economical elements using the Rapid Impact Assessment Matrix (RIAM). Drilling cuttings re-injection can cause negative effects with light changes. Most of negative impacts were on the physicochemical and biological-ecological elements, whereas positive impacts were on the socio-cultural and economical elements. The most critical negative impacts were: effects due to extreme events, persistent substances presence, effects on aquatic fauna, and changes in biodiversity. The most important positive impacts were those that generated changes in the regional and local economy. By applying the correct mitigation measures it would be possible to decrease the impacts, and in some cases, to eliminate them. Risks were evaluated using the HazOp methodology, deviations in the process were analyzed, recommendations were provided and each risk analyzed was categorized as tolerable or non-tolerable. Consequences analysis from an accidental spill of slurry and/or cuttings was carried out by the YAXUM-3D mathematical model. The results of the consequences analysis showed that even the concentrations in the discharge point exceed the recommended criteria for protection of marine life and marine water quality; the spill is rapidly dispersed complying with the permitted levels in a period of 8 h as a maximum. Keywords: environmental assessment, HazOp, drilling cuttings disposal,re-injection, platforms.
www.witpress.com, ISSN 1743-3541 (on-line) WIT Transactions on Ecology and the Environment, Vol 126, © 2009 WIT Press
Coastal Processes 213
doi:10.2495/CP090191

1 Introduction
Most industries generate pollutants; their volumes and risk level depend on the nature of activities, and on the interactions of these pollutants with the environment. Until 2004, drilling wastes from offshore drilling platforms were sent to Dos Bocas Port located in Tabasco, Mexico and then they were transported within containers by land to a thermal desorption plant. This process constitutes an expensive option to dispose of drilling wastes. A more efficient and economical alternative is the drilling wastes confinement by re-injection in non-productive wells. At beginning of 2004, one offshore facility in the Mexican Gulf implemented this method showing good results: a safer elimination of drilling wastes, a decrease in the current costs related to disposal of wastes, marine logistic activities and holding times in drilling equipments using oil based fluids. The Mexican Oil Industry decided to apply this methodology to other facilities located in the northeast of the Campeche Sonda. Cuttings injected by this process only come from wells using drilling fluids that are water, oil or polymeric based, because it is prohibited to inject drilling cuttings or residual mud containing inverse emulsion fluids. To comply with Mexican legislation [1], in order to implement this process it is necessary to carry out an environmental assessment and a risk analysis to identify impacts on environmental factors and risks derived from the drilling cuttings reinjection process into non-productive wells. This study used a Rapid Impact Assessment Matrix (RIAM) to identify and assess environmental impacts. HazOp methodology was used to identify and evaluate risks related to this process.
2 Methodology
2.1 Process description
Drilling cuttings disposal by re-injection involves the following stages: 1) Mechanical grinding of drilling cuttings until one obtains a slurry or a proper semi-liquid phase to be injected; 2) Treatment of this slurry by adding and diluting chemicals to keep the proper characteristics of density, viscosity and rheology; 3) Injection of cuttings slurry into a proper formation through the surfacing piping or drilling piping; and, 4) Ensuring the long term confinement of the injected wastes to avoid a future escape toward the surface. Each one of these stages involves an inherent risk related to operation of any mechanical equipment, possible human errors and environmental impacts. An undesirable event is a possible accidental spill of cuttings slurry and/or drilling cuttings, for this reason, in this study spill transport in marine water was modeled. The confinement stage was not considered due to the following reasons: 1) the injection process is not carried out within the annular section and 2) the injection is carried out into a non-productive well, which has been previously characterized so that its stability over the long term can be assured.
www.witpress.com, ISSN 1743-3541 (on-line) WIT Transactions on Ecology and the Environment, Vol 126, © 2009 WIT Press
214 Coastal Processes

Table 1: Specific coordinates of both Offshore Platforms (A and B).
Platform Geographic Coordinates
Platform A 19º12´0” N; 92º13´9” W
Platform B 19º10´6” N; 92º12’1’’W
2.2 Study site location
The offshore facilities considered in this study are located in the Campeche Sonda, 65 km NW from the Carmen City coast in Campeche, Mexico. The specific location of these facilities is shown in table 1.
2.3 Environmental impact assessment
To define the environmental impacts generated from the Project we used the Rapid Impact Assessment Matrix (RIAM) proposed by Pastakia [2]. This methodology uses a scoring system in a matrix format. Generated impacts from the activities of the project are assessed against the environmental components, which are designed with a specific punctuation that provides a measure of the expected impact for each component. The analysis is carried out based on criteria that are divided into two groups (A) and (B), and four environmental areas (physicochemical, biological-ecological, socio-cultural and economic/ operational).
2.3.1 Criteria (A) criteria are related to the importance of the condition (they can cause changes in the obtained score in an individual level), and (B) criteria are related to the importance of the situation (they cannot change the obtained score). Both groups, (A) and (B), are constituted by different criteria, which are defined as shown in table 2. Values assigned to any of these groups are determined by the following equations, where: (a1) and (a2) are the criteria individual score for group (A); (b1) and (b3) are the criteria individual score for group (B); aT is the result of multiplying the criteria score of group (A); bT is the result of adding the criteria score of group (B); and VA is the final score for the condition analysis.
(a1) x (a2) = aT for Group (A) (1)
(b1) + (b2) + (b3) = bT for Group (B) (2)
(aT) x (bT) = VA Condition Final Result (3)
2.3.2 Environmental components
In table 3 the different environmental categories used in this method are shown. A matrix is generated where each of the environmental components and its criterion are listed. In table 4 the individual criterion (VA) is shown, grouped into categories (VC), which can be compared to each other. Categories are
www.witpress.com, ISSN 1743-3541 (on-line) WIT Transactions on Ecology and the Environment, Vol 126, © 2009 WIT Press
Coastal Processes 215

Table 2: Criteria description used in RIAM matrix.
Criteria Description Values Scale A1 Condition importance. - This
criterion is evaluated against a space limit or human interests that could be affected
(4) Importance at an international/national level; (3) importance at a national/regional level; (2) importance at immediate areas outside of the local condition; (1) importance only at the local condition; and (0) not important.
A2 Change magnitude/effect. - Magnitude is defined as a measure of the benefit/loss caused by an impact or condition
(+3) greater positive benefit; (+2) significant improvement of the current status; (+1) improvement of the current status; (0) no change/current status; (-1) negative change of the current status; (-2) loss or significant negative change; and (-3) greater change/loss.
B1 Permanent. - Defines if a condition is temporal or permanent and it must only be a measure of the condition temporal status
(1) no change/it does not apply; (2) temporal; and (3) permanent.
B2 Reversibility. - Defines if the condition can be changed and it is a measure of the control over the condition effect
(1) no change/it does not apply; (2) reversible; and (3) irreversible.
B3 Cumulative. - A measure of either the simple direct impact or cumulative effect over time
(1) no change/it does not apply; (2) no cumulative/simple; and (3) cumulative/ synergistic.
Note: Positive and negative impacts can be assessed by a values scale considering negative and positive values for group (A). A zero value means that “there is no change” or “it is not important”. For group (B), a zero value is not considered because if all criteria were zero, the final result of VA would be zero. This condition cannot occur even if the group (A) criteria show a condition importance that could be considered; to avoid this, a value of “1” is used to define the situation “without change/or not important”.
defined by conditions that act as markers showing a change in the (A) group score combined with the highest or lowest (B) group score. These conditions have been defined in an interval of + 5 and each value describes a generated impact derived from the project. Limits of the categories are showed in table 4 with numerical and alphabetic values.
2.4 HazOp analysis
HazOp analysis involves two stages: 1) identification of the risk involved, and 2) ranking of these risks. The most feasible event is the accidental spill of drilling cuttings and/or slurry to the ocean. Risks were evaluated using the procedure to determine the tolerable risk level in the northeast marine region facilities [3]. A hazard is identified when a deviation in the normal operation state exists. The Risk Analysis Group identified the existent protections and if these were not enough to neutralize the hazard or mitigate its consequences, they proposed specific actions to accomplish that. First, study nodes are selected (process lines, vessels and/or process equipment) according to the process flow and considering auxiliary services; then the design intention of each equipment is defined; after, a guide word is selected in combination with a process parameter to develop the
www.witpress.com, ISSN 1743-3541 (on-line) WIT Transactions on Ecology and the Environment, Vol 126, © 2009 WIT Press
216 Coastal Processes
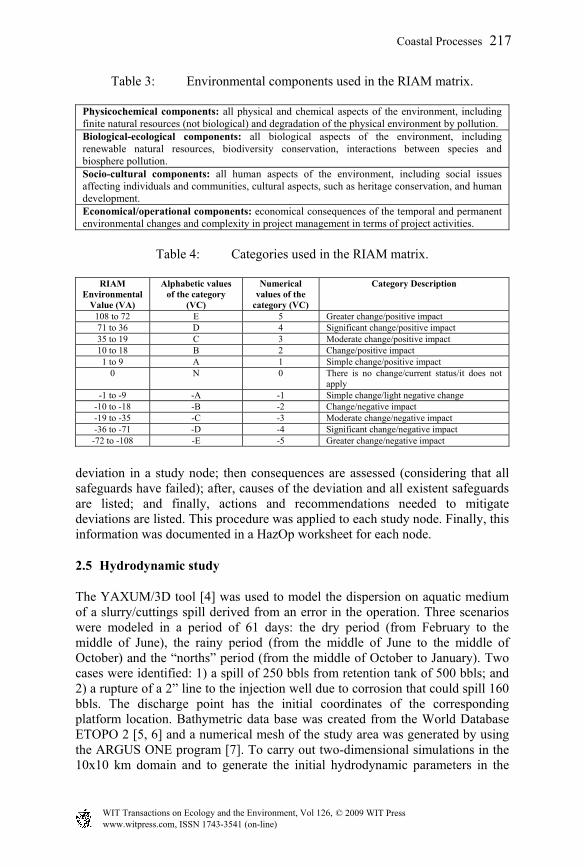
Table 3: Environmental components used in the RIAM matrix.
Physicochemical components: all physical and chemical aspects of the environment, including finite natural resources (not biological) and degradation of the physical environment by pollution. Biological-ecological components: all biological aspects of the environment, including renewable natural resources, biodiversity conservation, interactions between species and biosphere pollution. Socio-cultural components: all human aspects of the environment, including social issues affecting individuals and communities, cultural aspects, such as heritage conservation, and human development. Economical/operational components: economical consequences of the temporal and permanent environmental changes and complexity in project management in terms of project activities.
Table 4: Categories used in the RIAM matrix.
RIAM Environmental
Value (VA)
Alphabetic values of the category
(VC)
Numerical values of the
category (VC)
Category Description
108 to 72 E 5 Greater change/positive impact 71 to 36 D 4 Significant change/positive impact 35 to 19 C 3 Moderate change/positive impact 10 to 18 B 2 Change/positive impact 1 to 9 A 1 Simple change/positive impact
0 N 0 There is no change/current status/it does not apply
-1 to -9 -A -1 Simple change/light negative change -10 to -18 -B -2 Change/negative impact -19 to -35 -C -3 Moderate change/negative impact -36 to -71 -D -4 Significant change/negative impact -72 to -108 -E -5 Greater change/negative impact
deviation in a study node; then consequences are assessed (considering that all safeguards have failed); after, causes of the deviation and all existent safeguards are listed; and finally, actions and recommendations needed to mitigate deviations are listed. This procedure was applied to each study node. Finally, this information was documented in a HazOp worksheet for each node.
2.5 Hydrodynamic study
The YAXUM/3D tool [4] was used to model the dispersion on aquatic medium of a slurry/cuttings spill derived from an error in the operation. Three scenarios were modeled in a period of 61 days: the dry period (from February to the middle of June), the rainy period (from the middle of June to the middle of October) and the “norths” period (from the middle of October to January). Two cases were identified: 1) a spill of 250 bbls from retention tank of 500 bbls; and 2) a rupture of a 2” line to the injection well due to corrosion that could spill 160 bbls. The discharge point has the initial coordinates of the corresponding platform location. Bathymetric data base was created from the World Database ETOPO 2 [5, 6] and a numerical mesh of the study area was generated by using the ARGUS ONE program [7]. To carry out two-dimensional simulations in the 10x10 km domain and to generate the initial hydrodynamic parameters in the
www.witpress.com, ISSN 1743-3541 (on-line) WIT Transactions on Ecology and the Environment, Vol 126, © 2009 WIT Press
Coastal Processes 217

3x3 km domain, it was necessary to process the marine current velocities (different harmonics were obtained for different ports of the Gulf of Mexico), wind intensities [5, 8, 9] and variation of tides [8, 10–12]. Velocity vectors for currents in a sequence of 15 days were determined for each climatic period, finding a predominant current direction from the east to the west with a light deviation toward the north-west quadrant for the three periods. The dispersion study was limited to the liquid phase, as the solid phase does not have an important effect on the water column due a short residence time (including metals and total hydrocarbons of petroleum (THPs)).
3 Results and discussion
3.1 Environmental assessment
When the maximum confinement capacity of wastes into a non-productive well is reached, this will be plugged and process equipment will be re-installed in another well/facility. Activities are limited to installing the re-injection process equipment. Construction activities are not required because the project is located in existent facilities, so the environmental impact assessment was only focused on the operation/maintenance stage. Effects on different environmental components are showed in table 5. In table 6, environmental assessment results are shown for each group of effects. Most of the physicochemical impacts were classified as Simple Change/ Light Negative Impact (F/Q1, F/Q3, F/Q7, F/Q8 and F/Q9). F/Q4 causes a negative impact, although even persistent substances can be quickly dispersed. In table 6 it can be observed that B/E2 and B/E4 are classified as Simple Change/ Light Negative Impact, whereas B/E3 and B/E1 are classified as Negative Impacts. Socio-cultural impacts were classified as follows: S/C3 and S/C4 were assigned within the Simple Change/Light Negative Impact category, and S/C1 and S/C2 were considered as Simple Change/Positive Impact. Regarding economical-operational impacts, there was a Simple Change/Positive Impact related to O/E2 and there was a Significant Change/Positive Impact related to O/E1. The drilling cuttings re-injection process will produce light negative impacts, most of which affect physicochemical and biological-ecological components, whereas positive impacts are caused on socio-cultural and economical-operational components. During the installation, operation and maintenance stages, there will be positive and negative changes that will affect the regional economy and ecological environment. Twelve negative impacts were identified against four positive impacts and three impacts that do not generate any change. Most critical negative impacts were those that affect F/Q2, F/Q4, B/E1, and B/E3 environmental components. The most important positive impact was that affecting the E/O1 component. Positive impacts with a minor importance were those that cause simple changes on S/C1, S/C2 and O/E2.
www.witpress.com, ISSN 1743-3541 (on-line) WIT Transactions on Ecology and the Environment, Vol 126, © 2009 WIT Press
218 Coastal Processes

Table 5: Environmental components assessment.
Physicochemical Biological-ecological Socio-cultural Economical/ Operational
F/Q1: Water quality (eventual discharges from shipments, sanitary residual water and process effluents)
B/E1: Fauna (a spill could have effects on the zooplankton development due toxic substances, and a temporal migration of nektonic and benthic species could happen due to noise emissions)
S/C1: Employment (during installation and removal stages of equipment, permanent employment will be minimal, but temporal employment will be important)
O/E 1: Changes in local/regional economy (there will be a strengthening of the state economy in Campeche and Tabasco)
F/Q2: Extreme events (tropical storms and norths could affect process operation) F/Q3: Navigation (tug boats, boats for transportation of equipment and materials, and launches for the relocation of workers are typical of the area of platforms; fishing boats could be affected in a temporal way on a minor scale due to there being a restricted area for boating activities and fishing) F/Q4: Persistent Substances (A spill could impact the marine water, however, changes will depend on meteorological conditions, prevent and control measures applied to contain it, and the presence and concentration of the persistent substances into the spilled material) F/Q5: Landscape alteration (this project will be located in existent facilities, for this reason, landscape is not going to be altered) F/Q6: Emissions from wastewater (Domestic wastewater will be generated and will be sent to treatment plants. Treated waters will be spilled into the sea water if they comply with the established limits (NOM-001-ECOL-1996)
B/E2: Marine vegetation (a spill could have effects on the fitoplankton development due toxic substances)
S/C2: Auxiliary services (some services will be temporarily required: rent of machinery and equipment, food, boat, and accommodation services, and logistic support)
O/E2: Operation and maintenance costs (some activities related to the installation and operation of the re-injection equipment and services, such as food, accommodation, logistic support, and transport, will be required
F/Q7: Emissions of hazardous and non-hazardous wastes (domestic materials and industrial wastes will be managed according to the corresponding legislation) F/Q8: Gas and particles emissions (CO, SO2, NOx particles and unburned hydrocarbons will be generated from the internal combustion process of tug boats and cranes, and process equipment located in the platforms, but these emissions do not exceed the permissible limits) F/Q9: Noise emissions (Noise emissions from ship and crane engines during the transfer of equipment and during drilling cuttings and containers stowed during operations could affect the marine environment, however, noise sources will be into confined and isolated sites located at 25 or 30 m over sea level, decreasing the impact from these noise emissions. Besides they will comply with the legislation (NOM-080-STPS-1993))
B/E 3: Changes in biodiversity (in case of a spill, marine flora and fauna biodiversity could be affected in a punctual and temporal way at the discharge point)
S/C3: Solid wastes (solid wastes will be generated during some project stages and a collection and disposal system will be required)
B/E 4: Eutrophication (a spill of wastewater and industrial effluents without treatment under some climatic and biological conditions could cause water eutrophication)
S/C4: Sewage treatment (sewage and sanitary residual waters will be produced, for this reason a sewage treatment system will be required)
www.witpress.com, ISSN 1743-3541 (on-line) WIT Transactions on Ecology and the Environment, Vol 126, © 2009 WIT Press
Coastal Processes 219

Table 6: Environmental impact assessment results.
Component
Criterion (A)
Criterion (B)
Group A
Group B
Condition result
Category numeric
Value
Category alphabetic
value
Description a1 a2 b1 b2 b3 At Bt VA VC VCA
F/Q 1 1 -1 2 2 2 -1 6 -6 -1 (-A) Simple Change/ Light negative impact
F/Q 2 3 -1 2 1 1 -3 4 -12 -2 (-B) Change/ Negative Impact
F/Q 3 1 0 2 2 2 0 6 0 0 (N) There is no change/Current Status
F/Q 4 1 -2 2 2 3 -2 7 -14 -2 (-B) Change /Negative Impact
F/Q 5 0 0 2 2 1 0 5 0 0 (N) There is no change/ Current Status
F/Q 6 1 0 1 1 1 0 3 0 0 (N) There is no change/Current Status
F/Q 7 1 -1 2 2 2 -1 6 -6 -1 (-A) Simple Change/ Light negative impact
F/Q 8 1 -1 2 2 2 -1 6 -6 -1 (-A) Simple Change/ Light negative impact
F/Q 9 1 -1 3 3 1 -1 7 -7 -1 (-A) Simple Change/ Light negative impact
B/E 1 1 -1 2 2 3 -1 7 -7 -1 (-A) Simple Change/ Light negative impact
B/E 2 1 -1 3 3 3 -1 9 -9 -1 (-A) Simple Change/ Light negative impact
B/E 3 1 -1 3 3 3 -1 9 -9 -1 (-A) Simple Change/ Light negative impact
B/E 4 1 -1 3 3 1 -1 7 -7 -1 (-A) Simple Change/ Light negative impact
S/C 1 2 1 2 1 1 2 4 8 1 (A) Simple Change/Positive impact
S/C 2 2 1 2 1 1 2 4 8 1 (A) Simple Change/ Positive impact
S/C 3 1 -1 2 2 2 -1 6 -6 -1 (-A) Simple Change/ Light negative impact
S/C 4 1 -1 2 2 2 -1 6 -6 -1 (-A) Simple Change/ Light negative impact
O/E 1 3 3 2 2 3 9 7 63 4 (D) Significant Change/Positive Impact
O/E 2 2 1 2 1 1 2 4 8 1 (A) Simple Change/ Positive impact
www.witpress.com, ISSN 1743-3541 (on-line) WIT Transactions on Ecology and the Environment, Vol 126, © 2009 WIT Press
220 Coastal Processes

a1)
26 5 1 1 1 1 1
2
a2)
13 8 1
3 10 1
1 1
b1) 23 2 3 4 1 1 1 1
2
b2) 13 8 1 3 4 6
1 1 1
c1) 26 5 1
1 1 1 1 2
c2) 13
8 1 3 10 1 1 1
d1)
32
2 1 1 2
d2) 13 8 1 3 10
1 2
Intolerable Risk
ALARP Risk Zone
Tolerable Risk
F E Q U E N C Y
123456
1 2 3 4 5 6
F E Q U E N C Y
123456
F E Q U E N C Y
123456
1 2 3 4 5 6
F E Q U E N C Y
123456
F E Q U E N C Y
123456
1 2 3 4 5 6
F E Q U E N C Y
123456
F E Q U E N C Y
123456
F E Q U E N C Y
123456
1 means curent conditions; 2 means expected risk reduction if recommendations are applied
1 2 3 4 5 6
1 2 3 4 5 6
1 2 3 4 5 6
1 2 3 4 5 6 1 2 3 4 5 6
Figure 1: Risk matrixes: a) for damage to personnel, b) for environmental impacts, c) for damage/losses in production, and d) for damage to facilities.
3.2 HazOp results
Each identified risk was evaluated considering damage to personnel and population, environmental impacts, economical and production losses according to the procedure described in the methodology section. These results are used to create the risk matrix, which contains the number of sceneries corresponding to each combination of the frequency/consequence ratio (figure 1). These matrixes show the expected risk reduction as soon as the recommendations are
www.witpress.com, ISSN 1743-3541 (on-line) WIT Transactions on Ecology and the Environment, Vol 126, © 2009 WIT Press
Coastal Processes 221

Table 7: Categorization of risk scenarios resulting from a spill.
Category
Parameter
Time required to reach the marine water quality criteria
Worst scenario
Platform A
Platform B
Platform A Platform B
1 Fe WQC: 1000 ug/l
5 h
8 h NP DPS: 2 h MC: 8 330.14 ug/l
DP DPS: 5 h MC: 38 680.82 ug/l
1 Be WQC: 130 ug/l
5h
5 h
NP DPS: 2 h MC: 530.16 ug/l
NP DPS: 2 h MC: 1752.72 ug/l
1 Al WQC: 750 ug/l
5 h
5 h
NP DPS: 2 h MC: 2 637 ug/l
RP DPS: 2 h MC: 34 943.01 ug/l
2 Ba WQC: 50 000 ug/l
15 min
15 min
MPC is reached in 15 min
MPC is reached in 15 min
3 Ca A criterion does not exist to protect the marine life
A criterion does not exist to protect the marine life
It is not considered as a toxic metal, even though MC values were high
It is not considered as a toxic metal, even though MC values were high
3 Na A criterion does not exist to protect the marine life
A criterion does not exist to protect the marine life
It is not considered as a toxic metal, even though MC values were high
It is not considered as a toxic metal, even though MC values were high
Note: NP: Norths Period; DP: Dry Period; RP: Rainy Period DPS: Scenario Duration Period; WQC: Water Quality Criteria; MC: Maximum Concentration; MPC: Maximum Permissible Concentration.
implemented. The risk matrix shows the different levels of risk for each deviation, detects unacceptable events and helps to identify deviations that require opportune mitigation actions. These categories were assigned according to toxicity criteria in the aquatic life [13–16], concentrations found in analyzed samples and the time required to disperse and to reach permissible concentrations. For platform B, the concentrations of metals and THPs were greater than those found for platform A. The Worst scenario column shows the climatic period where maximum concentrations exceeded the permissible values to protect marine life and to meet the water quality requirements, indicating the maximum duration of this scenario. Platform A for all climatic periods showed concentrations of THPs greater than the value reported for marine water quality (374 016 g/l) after 30 minutes. After 2 hr, permissible concentrations were reached for three sceneries modeled. Dispersion is not good in the dry period; for this reason this scenario was assigned as category 1, sceneries modeled for the rainy and norths periods were assigned as category 2, as their effects can be mitigated in 2 h by actuation of the spill control system.
www.witpress.com, ISSN 1743-3541 (on-line) WIT Transactions on Ecology and the Environment, Vol 126, © 2009 WIT Press
222 Coastal Processes

In Platform B for all climatic periods, concentrations were about twice the criteria value for marine water quality (202 971.36 g/l) after 30 minutes. In the rainy and norths periods, permissible concentrations were reached after 2 hr. In the dry season, the concentration remained at 202 971.36 g/l after 2 hr and permissible concentrations were reached after 8 hr. The worst scenario in platform B was obtained in the dry season and it was assigned as category 1, the modeled sceneries in the norths and rainy periods were assigned as category 2 as their effects can be mitigated in 2 hr by actuation of the spill control system.
4 Conclusions
Environmental impact assessment results show that negative impacts identified on the natural environment can be decreased by applying proper mitigation measures, and it is even possible to eliminate some of them. It is possible to infer that the drilling cuttings re-injection project is feasible and viable for carrying out disposal of wastes into non-productive wells in both platforms. From the HazOp Analysis a total of 63 recommendations were made, some of the most important are the following: to use only and exclusively the fire fighting moto-pumps according to the NFPA 2031; to install the firefighting network and cabinet in the housing platform; to provide enough lifeboats according to the maximum number of people allowed on the platforms; to install audible and visible alarms in the presence of fire, smoke and gas in the housing platform and to install toxic gas detection equipment and self-contained breathing equipment in the operations area; and to meet the maintenance programs for the firefighting network and monitors on the platforms and for crane and auxiliary services. The simulation results for a slurry spill scenario showed that the risk level is tolerable, even though concentrations at the discharge point exceeded recommended criteria to protect marine life and marine water quality. The spill is dispersed quickly, reaching permissible levels in a period from 5 to 8 hr; this means that these concentrations are diluted to tolerable levels before spill control equipment arrives on the site.
References
[1] Ley General de Equilibrio Ecológico y Protección al Ambiente. SEMARNAT, 1996.
[2] Jensen, Kurt. Environmental Impact Assessment using the Rapid Impact Assessment Matrix (RIAM). Olsen & Olsen-Fredensborg. ISBN: 87-85215-32-5, 1998.
[3] PEMEX-PEP-RMNE. Lineamiento para la Determinación del Nivel de Riesgo Tolerable en las Instalaciones de la Región Marina Noreste, clave 250-22100-SI-212-0001, version 1, Enero 2003.
[4] Casulli, V. & Cheng, R.T; Semi-implicit finite difference methods for three dimensional shallow water flow. International Journal for numerical methods in fluids, (15), pp. 629-648, 1992.
www.witpress.com, ISSN 1743-3541 (on-line) WIT Transactions on Ecology and the Environment, Vol 126, © 2009 WIT Press
Coastal Processes 223

[5] World Data Base ETOPO 2 from the National Center for Atmospheric Research, USA.
[6] Instituto Nacional de Estadística, Geografía e Informática (INEGI), http://www.inegi.org.mx
[7] ARGUS ONE, http://www.argusint.com/ [8] González, S. R. Modelación numérica de circulación de corrientes
oceánicas para el Golfo de México. Generación de escenarios hidrodinámicos, Tesis de Maestría en Ciencias, Instituto Politécnico Nacional, México D. F., 2005.
[9] Barrios, P. H. Modelación baroclínica y dispersión de partículas en medios marinos. Aplicación al Golfo de México. Tesis de Maestría en Ciencias, Instituto Politécnico Nacional, México D. F., 2005.
[10] Salas, D. L. D., y Monreal, G. M. Mareas y circulación residual en el Golfo de México. Contribuciones a la oceanografía física en México, Monografía No. 3, Unión Geofísica Mexicana, 1997.
[11] Gómez, R. E., y Vélez, M. H. Medición de corrientes con perfilador acústico doppler, Reporte Análisis de Datos, Universidad Autónoma Metropolitana, Unidad Iztapalapa, México D. F., 2004.
[12] CICESE, http://oceanografia.cicese. [13] 3 CFR Ch. 1 (7-1-97-Edition) Document EPA 151.11. [14] Current National Recommended Water Quality Criteria,
http://www.epa.gov/waterscience/criteria/wqcriteria.html. [15] Quality Criteria for Water, 1986. EPA 440/5-86-001. [16] NOM-001-Semarnat-1993. Norma Oficial Mexicana que establece los
límites máximos permisibles de contaminantes en las descargas de aguas residuales en aguas y bienes nacionales. DOF, México. 23 de abril de 2003.
www.witpress.com, ISSN 1743-3541 (on-line) WIT Transactions on Ecology and the Environment, Vol 126, © 2009 WIT Press
224 Coastal Processes