environmental corporation - us epa · on july 12,1990 personnel from ramcon environmental...
TRANSCRIPT

ENVIRONMENTAL CORPORATION
RAMCON BUILDING, 223 SCOTT STREET, MEMPHIS, TENNESSEE 38112 TELEPHONE 800/458.4567 IN TENNESSEE 901/45&7000 FAX 901-458-3868
ENVIRONMENTAL CORPORATION
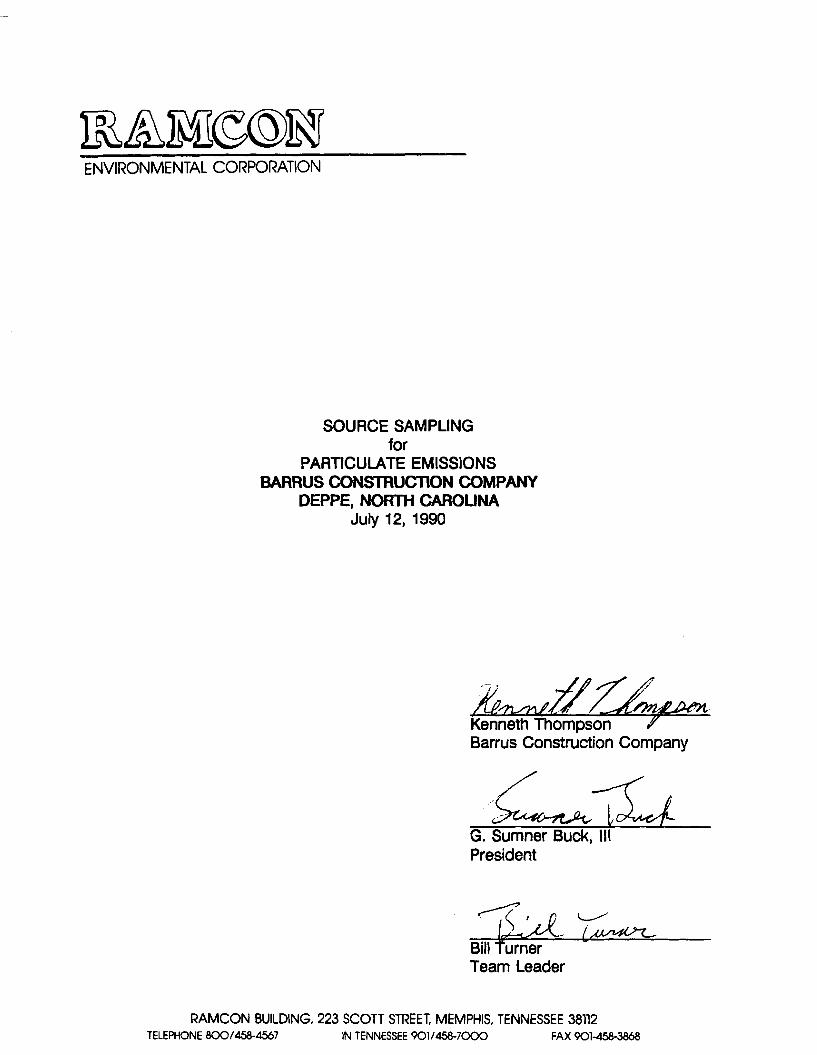
SOURCE SAMPLING for
PARTICULATE EMISSIONS BARRUS CONSTRUCllON COMPANY
DEPPE, NORTH CAROLINA July 12, 1990
Kenneth Thompson Barrus Construction Company
1w G. Sumner Buck, Ill President
w i m
Bill "urner Team Leader
RAMCON BUILDING, 223 SCOTT STREET, MEMPHIS, TENNESSEE 38112 TELEPHONE 800/45&4567 IN TENNESSEE 901/458-7000 FAX 901-458-3868
ENVIRONMENTAL CORPORATION
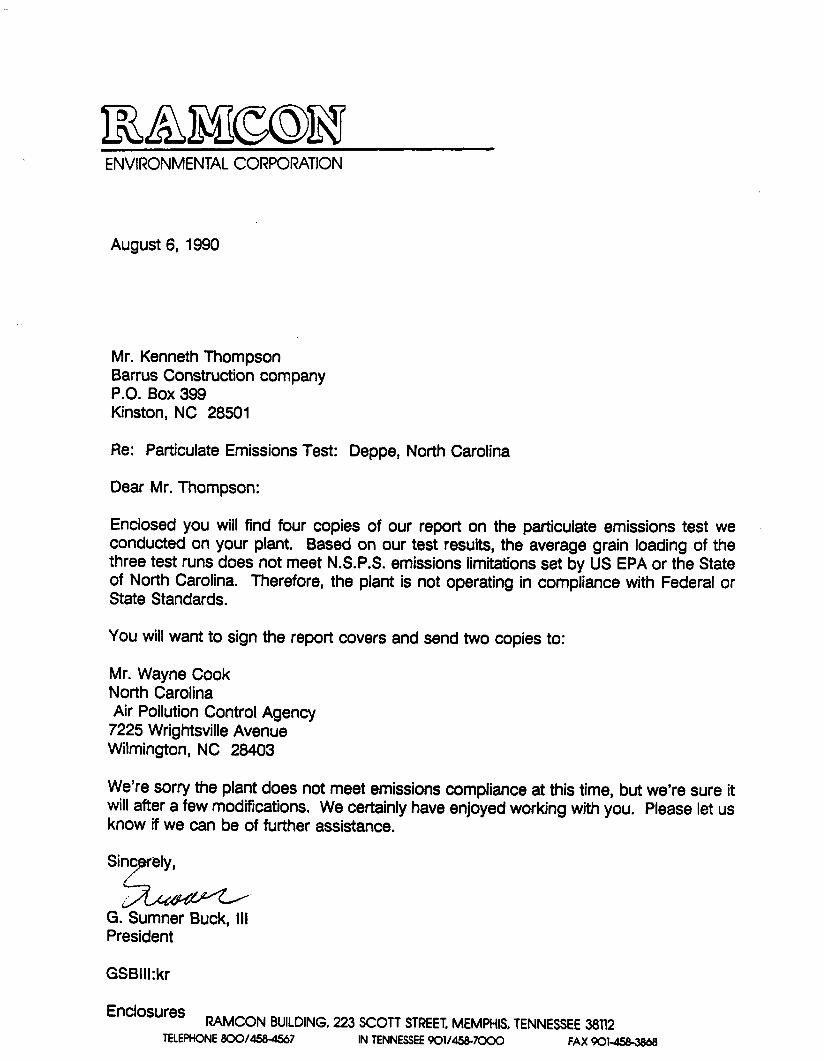
August 6, 1990
Mr. Kenneth Thompson Barrus Construction company P.O. Box 399 Kinston, NC 28501
Re: Particulate Emissions Test: Deppe, North Carolina
Dear Mr. Thompson:
Enclosed you will find four copies of our report on the particulate emissions test we conducted on your plant. Based on our test results, the average grain loading of the three test runs does not meet N.S.P.S. emissions limitations set by US EPA or the State of North Carolina. Therefore, the plant is not operating in compliance with Federal or State Standards.
You will want to sign the report covers and send two copies to:
Mr. Wayne Cook North Carolina Air Pollution Control Agency
7225 Wrightsville Avenue Wilmington, NC 28403
We're sorry the plant does not meet emissions compliance at this time, but we're sure it will after a few modifications. We certainly have enjoyed working with you. Please let us know if we can be of further assistance.
Sincyely,
b. G. Sumner Buck, 111 President
RAMCON BUILDING, 223 SCOTT STREET, MEMPHIS TENNESSEE 38112 TELEPHONE 800/4586567 IN TENNESSEE 901/456-7000 FAX 9016583868
TABLE OF CONTENTS
1.
11.
111.
IV.
v.
VI.
VlI.
VIII.
IX.
X
INTRODUCTION
TEST RESULTS
TEST PROCEDURES
THE SOURCE
EQUIPMENT USED
LABORATORY PROCEDURES 8 RESULTS 11
CALCuLAnONS 16
FIELD DATA 2 7
CAUBRATJONS 33
RAMCON PERSONNEL 4 0
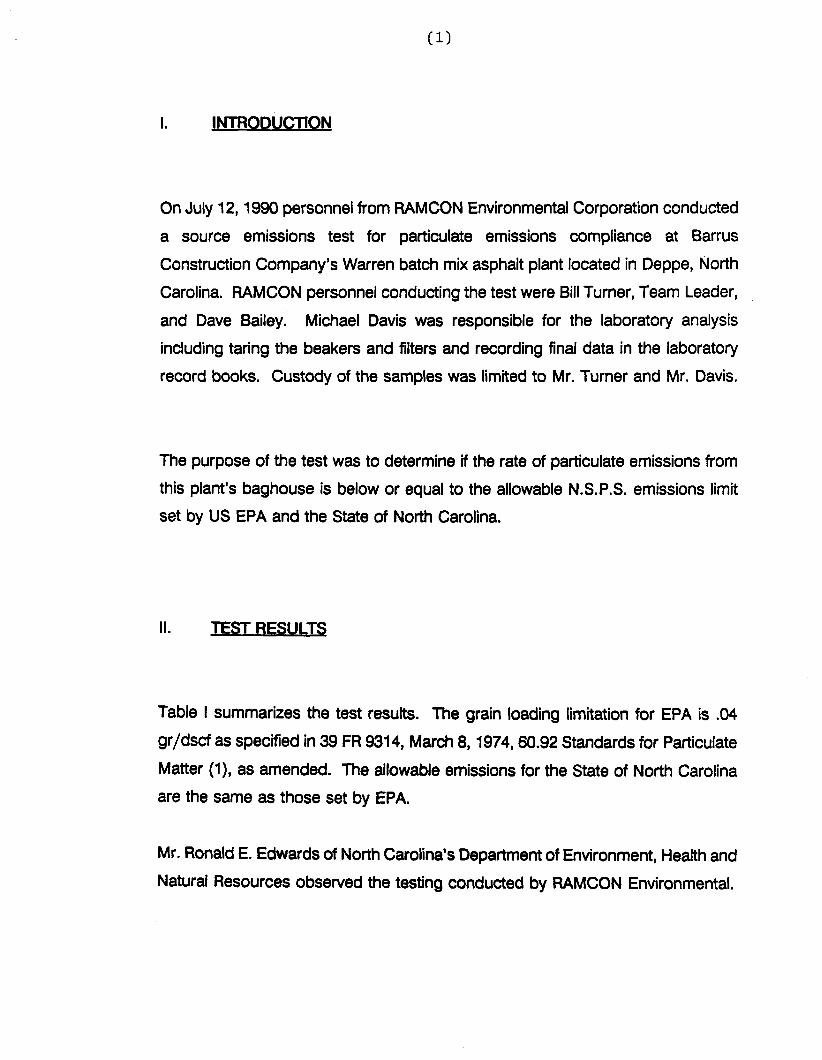
On July 12,1990 personnel from RAMCON Environmental Corporation conducted
a source emissions test for particulate emissions compliance at Barrus
Construction Company's Warren batch mix asphalt plant located in Deppe, North
Carolina. RAMCON personnel conducting the test were Bill Turner, Team Leader,
and Dave Bailey. Michael Davis was responsible for the laboratory analysis
including taring the beakers and filters and recording final data in the laboratory
record books. Custody of the samples was limited to Mr. Turner and Mr. Davis.
The purpose of the test was to determine if the rate of particulate emissions from
this plant's baghouse is below or equal to the allowable N.S.P.S. emissions limit
set by US EPA and the State of North Carolina.
II. ST RESULTS
Table I summarizes the test resutts. The grain loading limitation for EPA is .04
gr/dscf as specified in 39 FR 9314, March 8, 1974,60.92 Standards for Particulate
Matter (I), as amended. The allowable emissions for the State of North Carolina
are the same as those set by EPA.
Mr. Ronald E. Edwards of North Carolina's Department of Environment, Health and
Natural Resources observed the testing conducted by RAMCON Environmental.
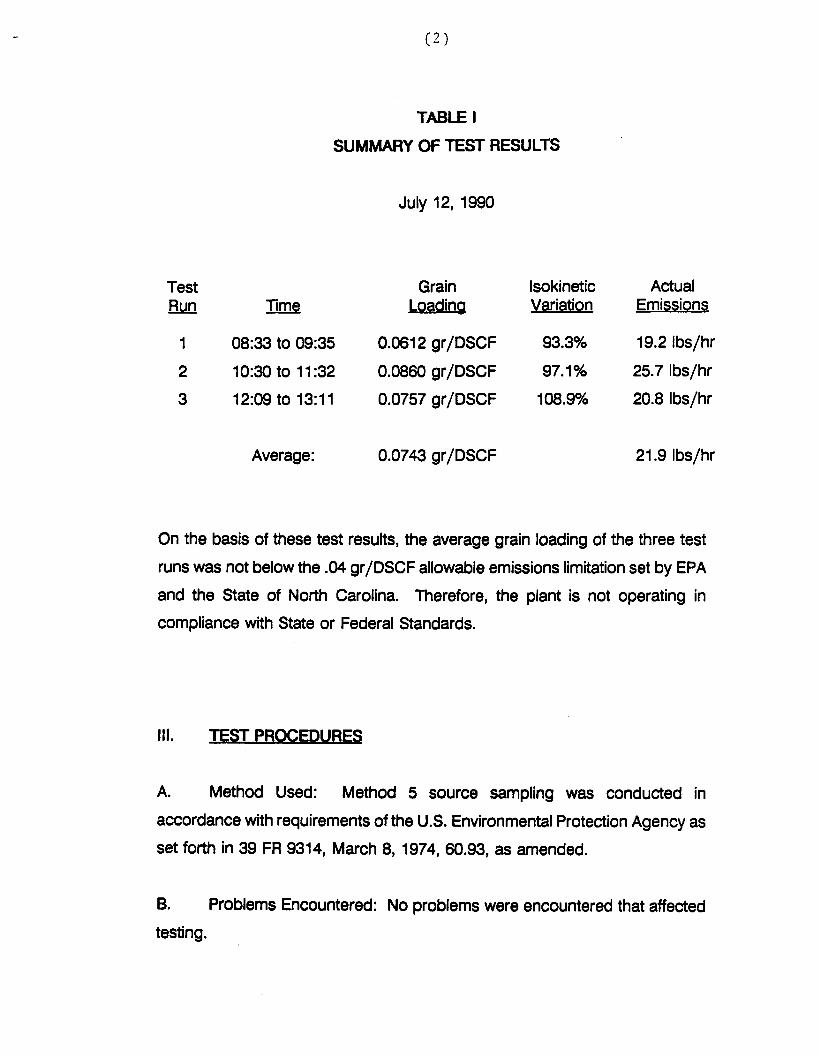
TABLE I
SUMMARY OF TEST RESULTS
July 12, 1990
Test Grain lsokinetic Actual Bm Time Loadina Variation Emissions
Average: 0.0743 gr/DSCF 21.9 Ibs/hr
On the basis of these test results, the average grain loading of the three test
runs was not below the .04 gr/DSCF allowable emissions limitation set by EPA
and the State of North Carolina. Therefore, the plant is not operating in
compliance with State or Federal Standards.
111. ST PROCEDURES
A. Method Used: Method 5 source sampling was conducted in
accordance with requirements of the U.S. Environmental Protection Agency as
set forth in 39 FR 9314, March 8, 1974, 60.93, as amended.
B. Problems Encountered: No problems were encountered that affected
testing.

C. Sampling Site: The emissions test was conducted after a baghouse on a
round stack with a diameter of 56". The sampling ports were placed 30" down
(0.5 diameters upstream) from the top of the stack and 327" up (5.8 diameters
downstream) from the last flow disturbance. Twenty four points were sampled,
twelve through each traverse for 2.5 minutes each for a total testing time of 60
minutes.
Points on a Probe
Diameter Mark
*Measurements include a 5" standoff.
N. THE SOURCE

IV. THESOURCE
Barrus Construction Company employs a Warren batch mix asphalt plant which is used to manufacture hot mix asphalt for road pavement. The process consists of blending prescribed portions of cold feed materials (sand, gravel, screenings, chips, etc.) uniformly and adding sufficient hot asphalt oil to bind the mixture together. After the hot asphalt mix is manufactured at the plant, it is transported to the location where it is to be applied. The hot asphalt mix is spread evenly over the surface with a paver then compacted with a heavy roller to produce the final product.
The following to a general description of the plant's manufacturing process: The cold feed materials (aggregate) are dumped into four separate bins which in turn feed a common continuous conveyor. The aggregate is dispensed from the bins in accordance with the desired formulation onto the cold feed system conveyor, to an inclined weigh conveyor, then to a rotating drum for continuous mixing and drying at approximately 300'~. The dried aggregate is pulled by a bucket elevator to the top of a gradation control unit which separates and stores the aggregate by size. The required amount of each aggregate is dispensed into a weigh-hopper and from there into a pugmill where the hot liquid asphalt pavement is mixed thoroughly with the aggregate. The hot asphalt mix is then discharged from the storage silo through a slide gate into waiting dump trucks which transports the material to a final destination for spreading. The rated capacity of the plant will vary with each aggregate mix and moisture content with a 5% surface moisture removal.
The mixer uses a burner fired with #2 fuel oil to heat air to dry the aggregate. The air is drawn into the system via an exhaust fan. After passing through the gas burner, the air passes through a baghouse. The baghouse is manufactured by Aeropulse. The exhaust gas is drawn through the baghouse and discharged to the atmosphere through the stack. The design pressure drop across the tube sheet is 2 - 6 inches of water. The particulate matter, which is removed by the baghouse, is reinjected into the pugmill.

WEIGHING PROCEDURE - SARTORIUS ANALYTlCAL BALANCE
The Sartorius balance is accurate to 0.1 mg and has a maximum capacity of 200 grams. The balance precision (standard deviation) is 0.05 mg. Before weighing an item, the balance should first be zeroed. This step should be taken before every series of weighings. To do this, the balance should have all weight adjustments at the "zero" position. The beam arrest lever (on the lower left hand side toward the rear of the balance) is then slowly pressed downward to the full release position. The lighted vernier scale on the front of the cabinet should align with the "zero' with the mark on the cabinet. If it is not so aligned, the adjustment knob on the right hand side (near the rear of the cabinet) should be turned carefully until the marks align. Now return the beam arrest to the horizontal arrest position. The balance is now "zeroed".
To weigh an item, it is first placed on the pan. And the sliding doors are closed to avoid air current disturbance. The weight adjustment knob on the right hand side must be at "zero". The beam arrest is then slowly turned upward. The lighted scale at the front of the cabinet will now indicate the weight of the item in grams. If the scale goes past the divided area, the item then exceeds 100 g weight (about 3 112 ounces) and it is necessary to arrest the balance (beam arrest lever) and move the lever for 100 g weight away from you. It is located on the left hand side of the cabinet near the front, and is the knob closest to the side of the cabinet. The balance will not weigh items greater than 200 grams in mass, and trying to do this might harm the balance. Remember, this is a delicate precision instrument.
After the beam is arrested in either weight range, the procedure is the same. When the weight of the item in grams is found, "dial in" that amount with the two knobs on the left hand side (near the 100 g lever) color coded yellow and green. As you dial the weight, the digits will appear on the front of the cabinet. When the proper amount is dialed, carefully move the arrest lever down with a slow, steady turn of the wrist. The lighted dial will appear, and the right hand side knob (front of cabinet) is turned to align the mark with the lower of the two lighted scale divisions which the mark appears between. when these marks are aligned, the two lighted digits along with the two indicated on the right hand window on the cabinet front are fractional weight in grams (the decimal would appear before the lighted digits) and the whole number of grams weight is the amount "dialed in* on the left.
In general, be sure that the beam is in 'arrestu position before placing weight on or taking weight off of the pan. Don't 'dial inH weight unless the beam is arrested. The balance is sensitive to even a hand on the table near the balance, so be careful and painstaking in every movement while weighing.
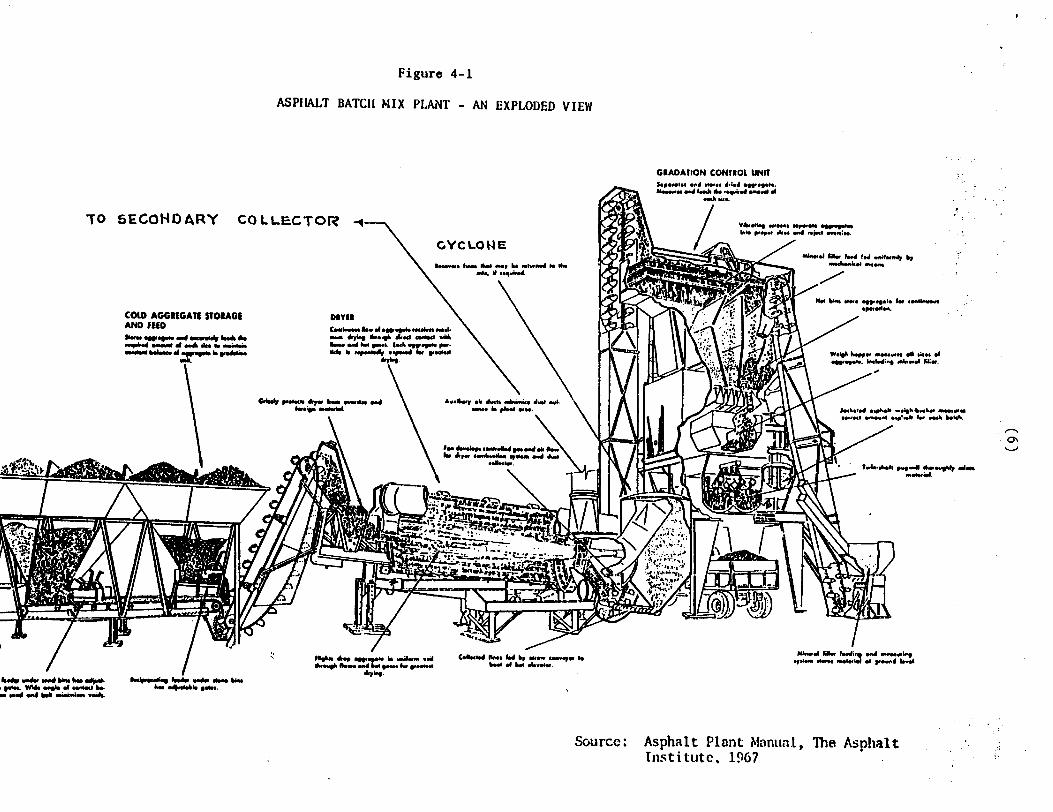
Figure 4 -1
ASPIIALT BATCH MIX PLANT - AN EXPLODED VIEW
GRADAIION CONlROL UNIT
, . ,
y*** fib b.d t d ."i#"II)1 b, rrb"k* m,..r
COU, AGGIEGAff STORAGE
m n r u . ~ .I JI.~ .I Wine And lira.
re.+ .L AM r***,. AM .,A I r r e * .rr. kb.1.d .vhJ, -.Ch.brbn -rr
u r r t --I .*'-h 4- 4 b H
t*lhmh ,",4 oh...* rim -.*.a
h . ( * r J r r J Y r * r J i r C W r " . & . u Y w ~ ) . k r m ( . ~ . I ~ b m . -4- #-- I rJ .I)( H rjrini." ..a.
S ~ u r c c : Asphalt Plant Manitn.1, The Aspllal t Institute, 1967

DATA SUMMARY 8d STACK BONG TESTED
AGGREGATE . .
I
- . . Name/type of mix 1.
2 Name/type of 2nd mix (if used)
4. Sieve/Screening analysis: % Passing;
1st mix / 2nd ma Is tmk/2nd mix 1st mix / 2nd mix
CONTROL SYSTEM
Manufacturer o ~ v l r ~ ~&e04/0&fi3& ---
1. pas f lac!ufd$rofbags @o s 4 . ~ o f b a g s ~ / h 7 7 / Type of bags
2 Air to doth ratio Designd A C W ~ .. 4 / 00 '
3. Type of cleaning - pulse jet & reverse air plenum Pm-. other
A6 J
4. Cleaning cyde t i m e u f o nterval between cleaning q d e c P C O ~
5. Pulse pressure on cleaning cycle psi #
1. Type - Ventwi Wet Washer
Spray Booth Other
2 . Gallons per minute through system . . . . . -
Water sowce fie.. porrd. lagoon. e) - 3.
4. Number of spray nozzles
. .
Company Name -. Date
Company Representative .


V. EQUIPMENT USED
EQUIPMENT USED
Equipment used on conducting the particulate emissions test
was:
The Lear Siegler PM-100 stack sampler with appropriate
auxiliary equipment and glassware. The train was set up
according to the schematic on the nex page.
An Airguide Instruments Model 2 11-B (uncorrected) aneroid
barometer was used to check the barometric pressure.
Weston dial thermometers are used to check meter tem-
peratures. An Analogic Model 2572 Digital Thermocouple is
used for stack temperatures.
A Hays 621 Analyzer was used to measure the oxygen, carbon
dioxide and carbon monoxide content of the stack gases. For
non-com bustion sources, A Bacharach Instrument Company
Fyrite is used for the gas analysis.
~ i l t e r s are mady by Schleicher and Schuell and are type 1-HV
with a porosity of .03 microns.
The acetone is reagent grade or ACS grade with a residue of
6 .001. -
Form #REC-07
VI. LABORATORY PROCEDURES & RESULTS
(11)
LABORATORY PROCEDURFS FOR PARTICULATE SAMPLING
1. Field Preparation
A. FILTERS: Fiberglass 4" sampling filters are prepared as follows:
Filters are removed from their box and numbered on the back side with a felt pen. The numbering system is continuous from job to job. The filters are placed in a desiccator to dry for at least 24 hours. Clean plastic petri dishes, also numbered, top and bottom, are placed in the desiccator with the filters. After desiccation, the filters are removed, one at a time, and weighed on the Sartorius analytical balance then placed in the correspondingly numbered petri dish. Weights are then recorded in the lab record books. Three filters are used for each complete particulate source emissions test and there should be several extra filters included as spares.
B. SILICA GEL: Silica Gel used for the test is prepared as follows:
Approximately 200 g of silica gel is placed in a wide mouth "Mason" type jar and dried in an oven at 175OC for two hours. The open jars are removed and placed in a desiccator until cool for two hours and then tightly sealed. The jars are then numbered and weighed on the triple beam balance to the closest tenth of a gram. ihis weight is recorded for each sealed jar. The number of silica gel jars used is the same as the number of filters. Silica gel should be indicating type, 6-16 mesh.
11. Post - Testing Lab Analysis
A. FILTERS: The filters are returned to the lab in their sealed petri dishes. In the lab, the dishes are opened and placed into a desiccator for at least 24 hours. Then the filters are weighed continuously every six hours until a constant weight is achieved. All data is recorded on the laboratory forms that will be bound in the test report.
B. SILICA GEL: The silica gel used in the stack test is returned to the appropriate mason jar and sealed for transport to the laboratory where it is reweighed to a constant weight on a triple beam balance to the nearest tenth of a gram.

C. PROBE RINSINGS: In ail tests where a probe washout analysis is
necessary, this is accomplished in accordance with procedures specified in "EPA Reference Method 5". These samples are returned to the lab in sealed mason jars for analysis. The front half of the filter holder is washed in accordance with the same procedures and included with the probe wash. Reagent or ACS grade acetone is used as the solvent. The backhalf of the filter holder is washed with deionized water into the impinger catch for appropriate analysis.
D. IMPINGER CATCH: In some testing cases, the liquid collected in the impingers must be analyzed for solid content. This involves a similar procedure to the probe wash solids determination, except that the liquid is deionized water.
E. ACETONE: A blank analysis of acetone is conducted from the one gallon glass container used in the field preparation. This acetone was used in the field for rinsing the probe, nozzle, and top half of the filter holder. A blank analysis is performed prior to testing on all new containers of acetone received from the manufacturer to insure that the quality of the acetone used will be exceed the .001% residual purity standard.
SPECIAL NOTE
When sampling sources high in moisture content, (such as asphalt plants) the filter paper sometimes sticks to the filter holder. When removing the filter, it may tear. In order to maintain control of any small pieces of filter paper which may be easily lost, they are washed with acetone into the probe washing. This makes the filter weight light (sometimes negative) and the probe wash correspondingly heavier. this laboratory procedure is taught by EPA in the "Quality Assurance for Source Emissions Workshop" at Research Triangle Park and is approved by EPA.

Form REC#8
plant ~ocation 6 A R R 4 5 Relative humidity in lab 5 % 4
sample ~ocation & " Density of Acetone (pa) .7857mg/irJ I
Blank volume (Val 2 5 I& Date/~ime w t . blank 7 -2 4-90 i 3 : m Grosswt. i O 3 8 8 2 9 "9
Date/Time w t . blank 7- 2 Y -90 ; 3 . 0 0 PM Gross w t . /03.%73/ -A mq
Ave.Gr0ss w t . / o ? . ~ ~ ? T o rg
Tare wt. /c7, g C 0 3 m q Weight of blank ~7.0017 mg
Acetone blank residue concentration (Ca) (Ca) = (M&) / (Val (pa) = 6.0~~0137 W / g )
Weight of residue i n acetone wash: Wa = Ca V a d - = bo~ad37) (LC'& ) b ,7?C7) = 6 ~ 0 0 2 7 ~
Acetone rinse volume (vaw) Date/Time of w t 7-a'l -"ot, 2 . cn PPI GrOSS w t
Date/Time of w t 7-2s-90 ; 3;m p y ~ G~OSS w t
Average Gross wt
Tare w t
Less acetone blank w t (Wa)
W t of particulate in acetone rinse (ma)
Filter Numbers Date/Time of w t 7- 3q -aa : 760 FPI Gross w t
Date/Time of wt 7-25 - 40 : 393 Gross W t
Average Gross wt
Tare wt
Wei*t of particulate on f i l t e r s ( s ) (mf) Weight of particulate i n acetone rinse Total weight of particulate (w)
Note: In no case should a blank residue greater than 0.01 mg/g (or 0.001% of the blank weight) be subtracted fran the sample weight.
A
Signature of d y s t h?uJf&w; Signature of -reviewr I

ASH TEST
BEFORE ASHING
AFTER ASHING
RUN li
Gross Weight
-tare weight
Net Weight of Particulate
I
&,S6!S
\ ' I 6% n, ./
Gross wt. after ash 1 6 1 . 8 2 / 2 I 1 5 9 . 7 0 0 y I 1 Z L / . / 9 8 7 n
-tag weight
CALCULATIONS NON-VOLATILES I I 1 2 I 3
2
'5% 87f'
O - 2 0 3 9
Weight of non-vo~ati~es
3
/ Z L / d 3822 / 6 / . g / 5 0 . 1 5 0 , ~ 6 9 4 /
0 . la 7 0
/6/. S/ 5 0
/ 2 v 0 1952
0 . 0 0 6 z
Weight of Non-vola tiles
5 9 , 6%//
* Net weight of Particulate
CALCULATIONS VOLATlLES N # I I I 2 I 3
/ r% / C / 52
0.006 3
0.. 0062
X 100%
Weight percent of non-vo~ati~es
0 . 0 0 3 5
0. /"/bV
0 . 0 0 6 3
100%
yo22
-Weight percent of non-vo~a t iles
-Weight r t of votati es
0 . 0 0 3 5
O I Z O ~ Y 0.1870 100%
3 , O Y
2 2
75-7r
roo%
. 87
3.09
7 6 . L i /
/ 8 7
78. 13

Company Name 742 -70
Date
IZEFEMSN~ NETBOD 3: GAS ANALYSIS BY PYRITE
WOOD BARK ANTHRACITE BITUMINOUS
PROPANE BUTANE
RUN #I:
RUN #2:
RUN # 3
RUN 1: co, 2.0 CO, . 2.5 2.5 AvG* J.3
N2% N2% N2% AVG. 79.9
RUN 2: C& 2 . 5 C% 2 .3 AVG. 2- q *2% O n O2% AVG. /z 7 N2% N2% Ha AVG . 79.9
RUN 3: co, 2. '0 2 a 3 AVG. d- / --
O2% O2% O2% AVG . ~ 2 % ~ z x ~n AvG 79.8

VII. CALCULATIONS
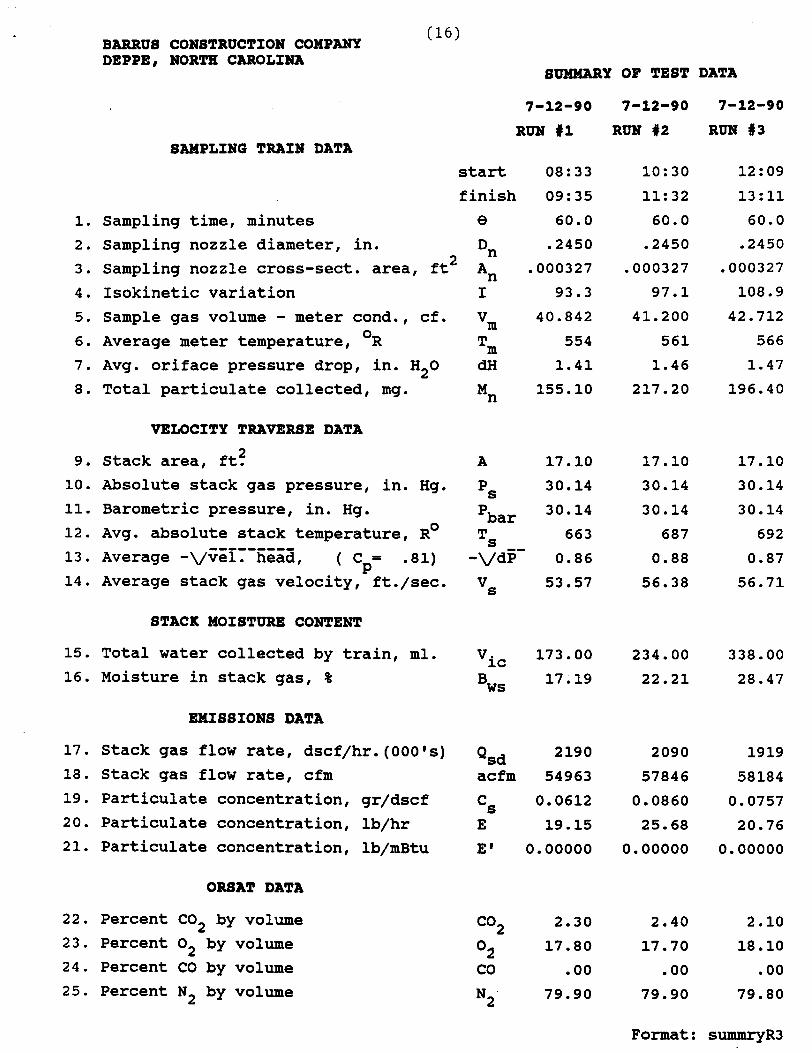
BARRUS CONSTRUCTION COMPANY (16)
DEPPE, NORTH CAROLINA SUMMARY OF TEST DATA
SAMPLING TRAIN DATA RUN #l RUN #2 RUN #3
start 08:33 10: 30 12 : 09
finish 09:35 11: 32 13:ll
1. Sampling time, minutes 8 60.0 60.0 60.0
2. Sampling nozzle diameter, in. Dn .2450 .2450 .2450
3. Sampling nozzle cross-sect. area, it2 An .000327 .000327 .000327
4. Isokinetic variation I 93.3 97.1 108.9
5. Sample gas volume - meter cond., cf. Vm 40.842 41.200 42.712
6. Average meter temperature, OR Tm 554 561 566
7. Avg. oriface pressure drop, in. H20 dH 1.41 1.46 1.47
8. Total particulate collected, mg. Mn 155.10 217.20 196.40
VELOCITY TRAVERSE DATA
9. Stack area, ft? 10. Absolute stack gas pressure, in. Hg. Ps 30.14 30.14 30.14
11. Barometric pressure, in. Hg. 'bar 30.14 30.14 30.14
12. Avg. absolute stack temperature, RO Ts 663 687 692 --------- - 13. Average -Vvel. head, ( C,= .81) -vdP- 0.86 0.88 0.87
* 14. Average stack gas velocity, ft./sec.
STACK MOISTURE CONTENT
15. Total water collected by train, ml.
16. Moisture in stack gas, %
EMISSIONS DATA
17. Stack gas flow rate, dscf/hr.(OOO's)
18. Stack gas flow rate, cfm 19. Particulate concentration, gr/dscf
20. Particulate concentration, lb/hr 21. Particulate concentration, lb/mBtu
ORSAT DATA
22. Percent C02 by volume 23. Percent O2 by volume 24. Percent CO by volume
25. Percent N2 by volume
Qsd 2190
acfm 54963
Format : summryR3

BARRUS CONSTRUCTION COMPANY 1 1 7 ) DEPPE, NORTH CAROLINA
Dry Gas Volume
Where :
'm (std) = Dry Gas Volume through meter at standard conditions, cu. it.
'rn = Dry Gas Volume measured by meter, cu. it.
'bar = Barometric pressure at oriiace meter, in. Hg.
Pstd = Standard absolute pres~ure~(29.92 in. Hg.).
Tm = Absolute temperature at meter OR.
Tstd = Standard absolute temperature ( 528O~).
dH = Average pressure drop across oriface meter, in. H20.
Y = Dry gas meter calibration factor.
13.6 = Inches water per inches Hg.
RUN 1:
RUN 2:
= (17.64) ( .992) ( 40.842)
RUN 3:
1.41 (30014) + 13.6
554
'm (std) = (17.64)( .992)( 41.200)
(30.14) + 13.6
'rn (std) = (17.64) ( .992) ( 42.712) 1 566 "1 = 39.943 d ~ c f
= 39.016 dscf
Format: dgmR3
1.46 (30014) + 13.6
561 = 38.872 dscf

BARRUS CONSTRUCTION COMPANY (18) DEPPE, NORTH CAROLINA
Total Contaminants by Weight: GRAIN LOADING
I Particulate concentration Cs gr./dscf.
Where:
= Concentration of particulate matter in stack gas, dry basis, corrected to standard conditions,gr./dscf.
Mn = Total amount of particulate matter collected, mg.
'm(std) = Dry gas volume through meter at standard conditions,
cu. ft.
Run 1:
Run 2:
Run 3:
Format: csR3

BARRUS CONSTRUCTION COMPANY C 1 9 1
DEPPE , NORTH CAROLINA Dry Molecular Weight
Where :
Md = Dry molecular weight,lb./lb.-mole.
%C02 = Percent carbon dioxide by volume (dry basis).
%O2 = Percent oxygen by volume (dry basis).
%N2 = Percent nitrogen by volume (dry basis).
%CO = Percent carbon monoxide by volume (dry basis).
0.264 = Ratio of O2 to N2 in air, v/v.
0.28 = Molecular weight of N2 or CO, divided by 100.
0.32 = Molecular weight of O2 divided by 100.
0.44 = Molecular weight of C02 divided by 100.
Run 1:
Md = 0.44( 2.30%) + 0.32(17.80%) + 0.28( .00% + 79.90%) = 29.08 Ib lb-mole
Run 2:
Md = 0.44( 2.40%) + 0.32(17.70%) + 0.28( .00% + 79.90%) = 29.09 lb lb-mole
Run 3:
Md = 0.44( 2.10%) + 0.32(18.10%) + 0.28( -00% + 79.80%) = 29.06 lb lb-mole
Format: mdR3
BARRUS CONSTRUCTION COMPANY ( 2 0 ) DEPPE, NORTH CAROLINA
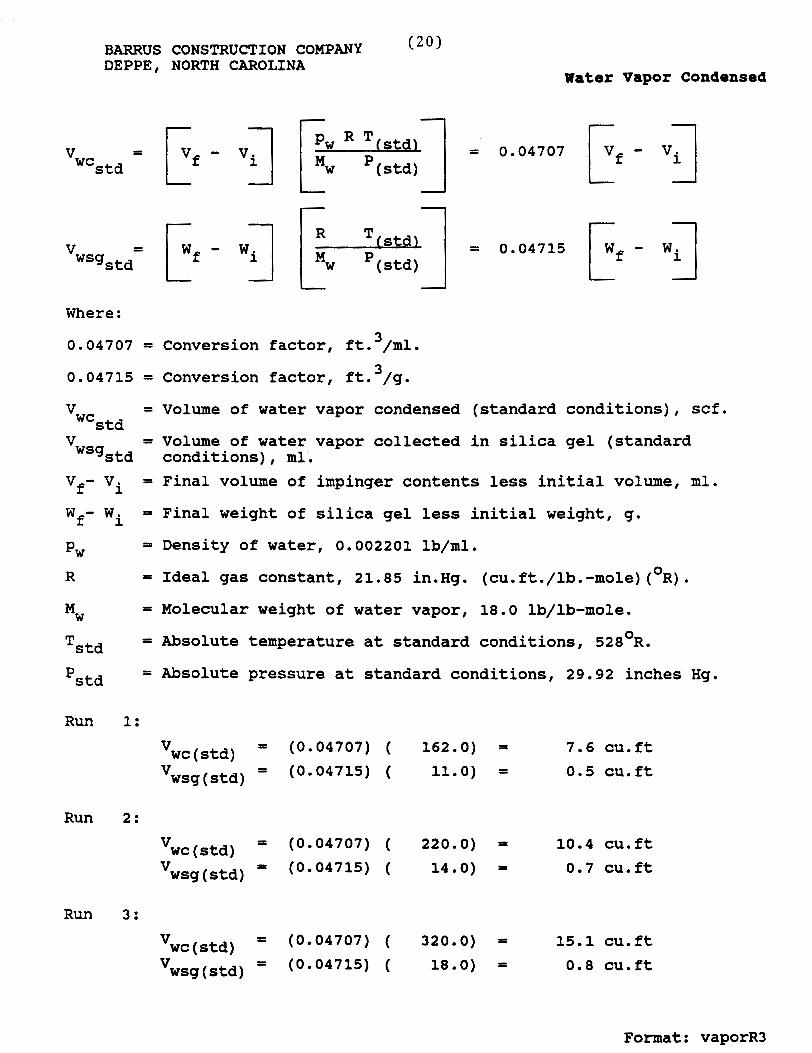
Water Vapor Condensed
Where :
3 0.04707 = Conversion factor, ft. /ml.
3 0.04715 = Conversion factor, ft. /g.
= Volume of water vapor condensed (standard conditions), scf.
V = Volume of water vapor collected in silica gel (standard Wsgstd conditions) , ml . Vf- Vi = Final volume of impinger contents less initial volume, ml.
Wf- Wi = Final weight of silica gel less initial weight, g.
pw = Density of water, 0.002201 lb/ml.
R = Ideal gas constant, 21.85 in.Hg. (cu.ft./lb.-mole) (OR).
Mw = Molecular weight of water vapor, 18.0 lb/lb-mole.
Tstd = Absolute temperature at standard conditions, 528OR.
'std = Absolute pressure at standard conditions, 29.92 inches Hg.
Run 1:
VWC (Std) = (0.04707) ( 162.0) = 7.6 cu.ft
Vwsg (std) = (0.04715) ( 11.0) = 0.5 cu.ft
Run 2:
Vwc (std) = (0.04707) ( 220.0) = 10.4 cu.ft
'WS~ (btd) = (0.04715) ( 14.0) = 0.7 cu.ft
Run 3:
Vwc (std) = (0.04707) ( 320.0) = 15.1 cu.ft
V ~ ~ g (btd) = (0.04715) ( 18.0) = 0.8 cu.ft
Format: vaporR3
BARRUS CONSTRUCTION COMPANY ( 2 1 )
DEPPE, NORTH CAROLINA Moisture Content of Stack Gases
Where :
Bws = Proportion of water vapor, by volume, in the gas stream.
= Dry gas volume measured by dry gas meter,(dcf).
= Volume of water vapor condensed corrected to standard '~~std conditions (scf) . V = Volume of water vapor collected in silica gel corrected to WSg~td standard conditions (scf) .
Run 1:
Run 2:
Run 3:
Format: bwsR3
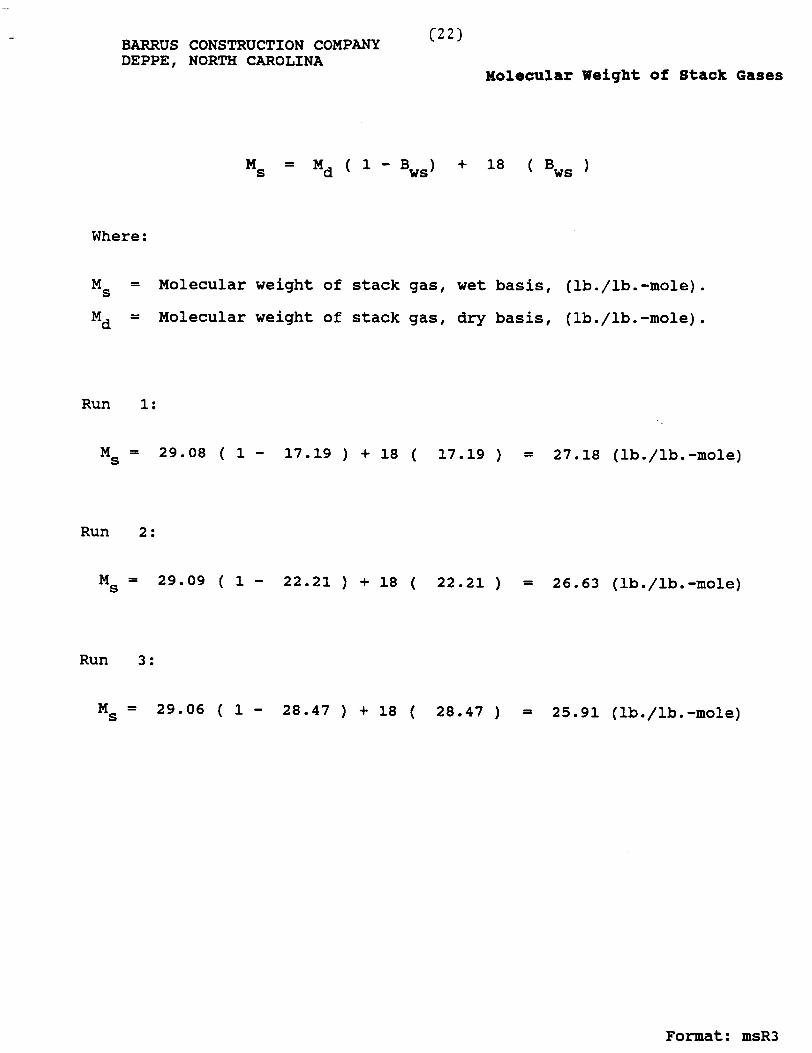
BARRUS CONSTRUCTION COMPANY C221
DEPPE , NORTH CAROLINA Molecular Weight of s tack Gases
Where :
Ms = Molecular weight of stack gas, wet basis, (lb./lb.-mole).
Md = Molecular weight of stack gas, dry basis, (lb./lb.-mole).
Run 1:
Ms = 29.08 ( 1 - 17.19 ) + 18 ( 17.19 ) = 27.18 (lb./lb.-mole)
Run 2:
Ms = 29.09 ( 1 - 22.21 ) + 18 ( 22.21 ) = 26.63 (lb./lb.-mole)
Run 3:
Ms = 29.06 ( 1 - 28.47 ) + 18 ( 28.47 ) = 25.91 (lb./lb.-mole)
Format: msR3
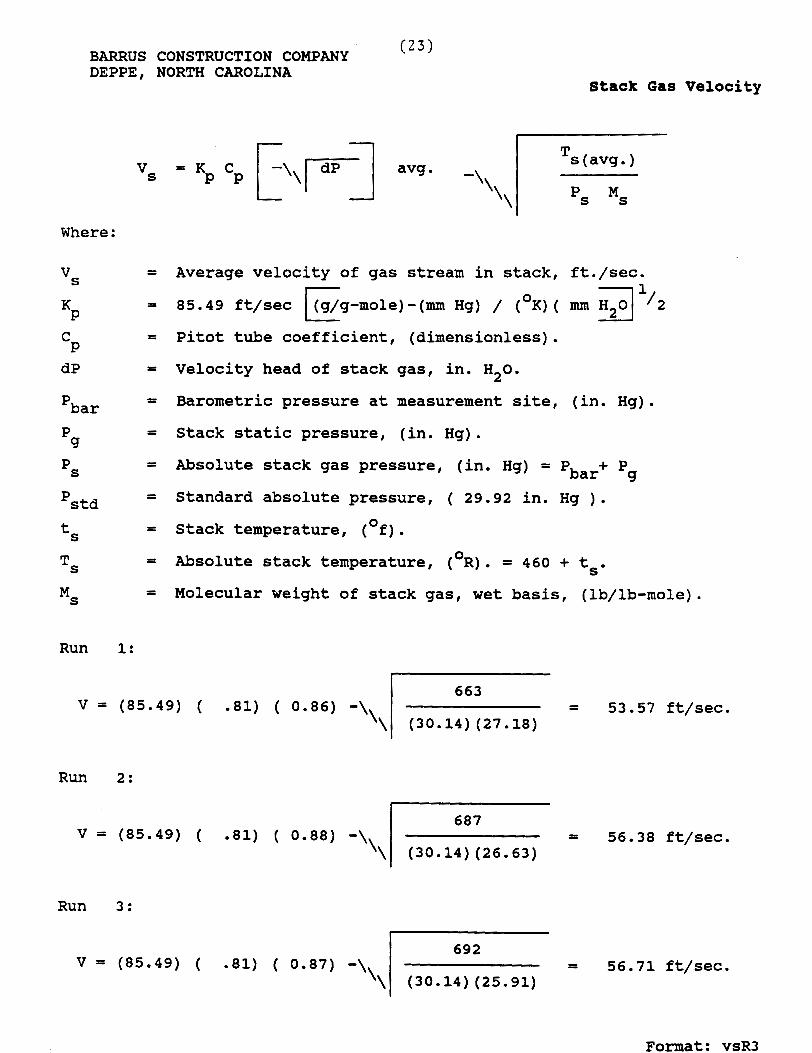
BARRUS CONSTRUCTION COMPANY ( 2 3 ) DEPPE , NORTH CAROLINA
stack Gas Velocity
vs = Kp cp E\ F] avg. -,\
\\
Where :
vs = Average velocity of gas stream in stack, ft./sec.
K P = 85.49 ft/sec C (g/g-mole) - (mm Hg) / (OK) ( mm 1 12
C P
= Pitot tube coefficient, (dimensionless).
dP = Velocity head of stack gas, in. H20.
'bar = Barometric pressure at measurement site, (in. Hg).
P 9
= Stack static pressure, (in. Hg).
Ps = Absolute stack gas pressure, (in. Hg) = Pbar+ P g
'std = Standard absolute pressure, ( 29.92 in. Hg ) .
ts = Stack temperature, (Of).
Ts = Absolute stack temperature, (OR). = 460 + t ~ -
Ms = Molecular weight of stack gas, wet basis, (lb/lb-mole).
Run 1:
Run 2:
Run 3:
Format: vsR3
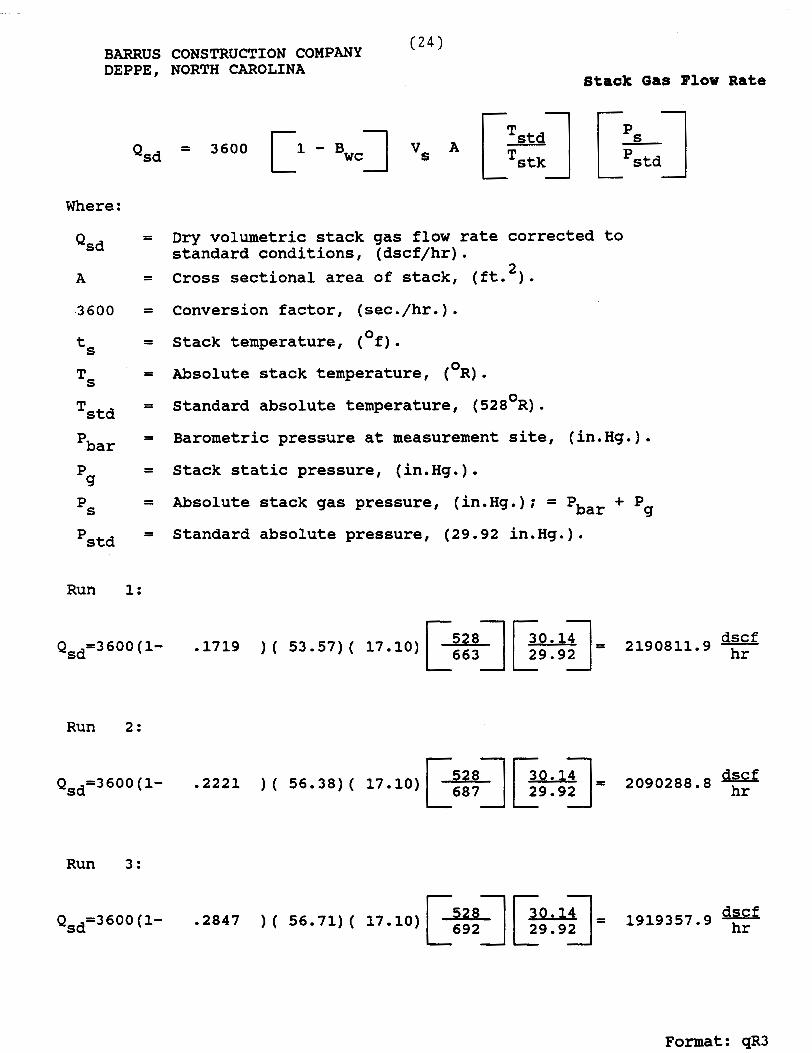
BARRUS CONSTRUCTION COMPANY ( 2 4 1 DEPPE, NORTH CAROLINA
stack Gas Flow R a t e
Where:
Qsd Dry volumetric stack gas flow rate corrected to standard conditions, (dscf/hr) .
2 Cross sectional area of stack, (it. ) .
conversion factor, (sec. /hr . ) . Stack temperature, (Of).
Absolute stack temperature, (OR).
Standard absolute temperature, (528OR) . Barometric pressure at measurement site, (in.Hg.).
Stack static pressure, (in.Hg.).
Absolute stack gas pressure, (in.Hg.); = Pbar + P g
Standard absolute pressure, (29.92 in.Hg.).
Run 1:
Qsd=3600(1- .I719 ) ( 53.57) ( 17.10) L A = 2190811.9 dscf
Run 2:
dscf Qsd=3600(1- .2221 ) ( 56.38) ( 17.10) 1 1 = 2 0 9 0 2 8 8 . 8 F
Run 3:
dscf Qsd=3600 (1- -2847 ) ( 56 71) ( 17.10)
Format: qR3

BARRUS CONSTRUCTION COMPANY I L s J
DEPPE, NORTH CAROLINA Emissions Rate from Stack
- ( C,) ( Qsd) E - = lb. / hr.
Where:
E = Emissions rate, lb/hr.
Cs = Concentration of particulate matter in stack gas, dry basis, corrected to standard conditions, gr/dscf.
= Dry volumetric stack gas flow rate corrected to Qsd standard conditions, dscf/hr.
Run 1:
E - - - - 19.15 lb. / hr. 7000
Run 2:
E - - - - 25.68 lb. / hr. 7.000
Run 3:
E - - - - 20.76 lb. / hr. 7000
Format: eR3
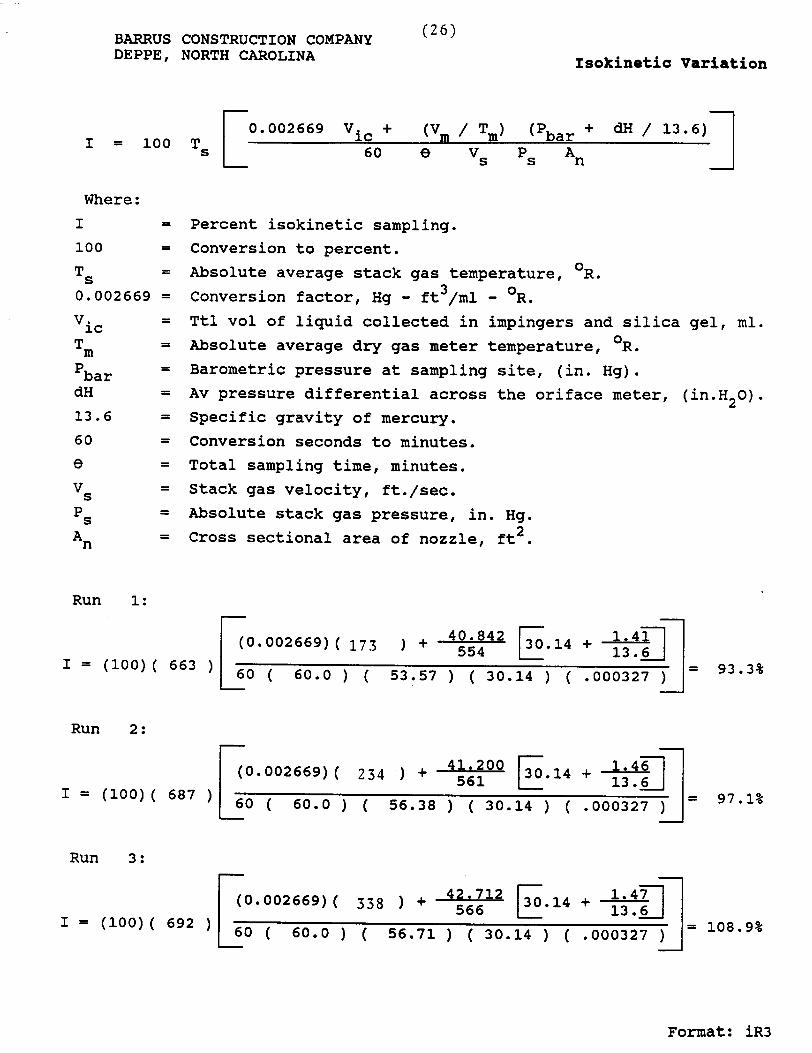
BARRUS CONSTRUCTION COMPANY ( 2 6 ) DEPPE , NORTH CAROLINA sok kinetic Variation
Where :
Percent isokinetic sampling.
Conversion to percent.
Absolute average stack gas temperature, OR. 3 Conversion factor, Hg - it /ml - OR.
Ttl vol of liquid collected in impingers and silica gel, ml.
Absolute average dry gas meter temperature, OR.
~arometric pressure at sampling site, (in. Hg).
Av pressure differential across the oriface meter, (in.H20).
Specific gravity of mercury.
Conversion seconds to minutes,
Total sampling time, minutes.
Stack gas velocity, ft./sec.
Absolute stack gas pressure, in. Hg.
Cross sectional area of nozzle, it2.
Run 1: I
Run 2:
Run 3: I -
Format: iR3


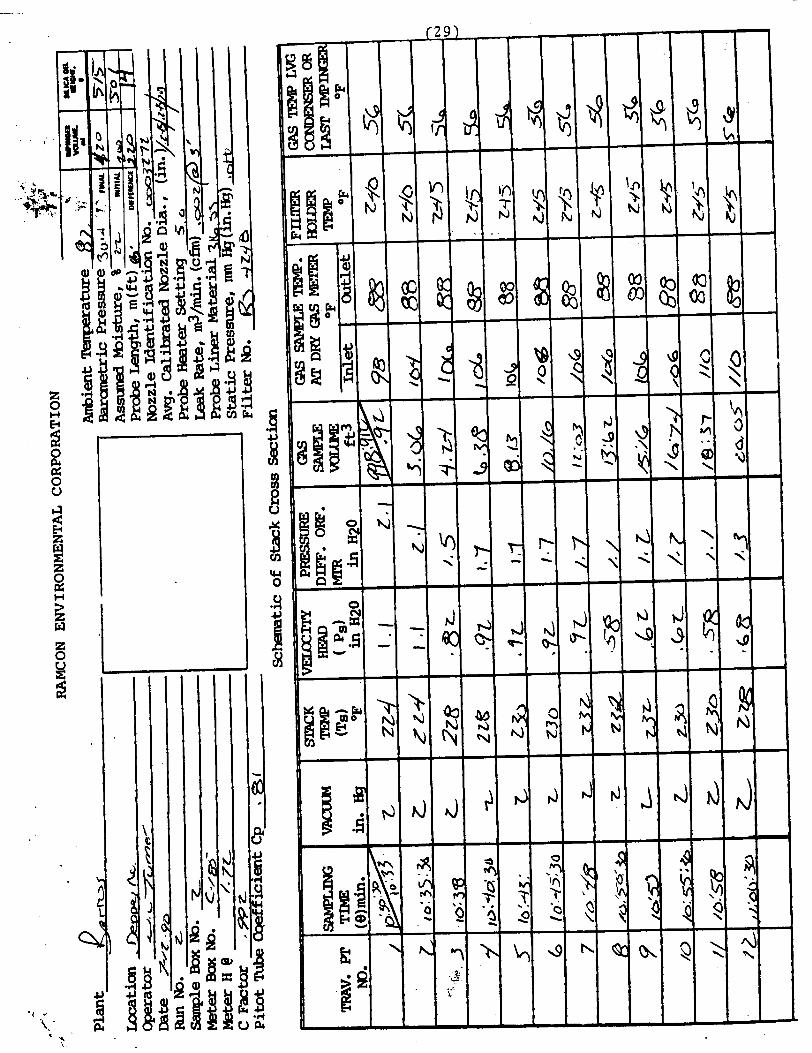


I . . Form #REC-06 -- --_- --.-.--- . - - - . -__ __ -.- - ,7
I , - r i i ) ' RAMCON eois5ims tes t log sheet , cont . IIA7'E 7/7'Pb L ~ T I O N * , /'Q TEST NO. L
JMPIWCER TEMP
(*f 1
k-
b2
6 t
. - b t - -- b~
b t
6 s
&I- n W
br. h) -
b ~ -
i ! a ~
6 L
, .
SAUPLt 801 TtMP.
( * f 1
253
C s
7.55
755- _
255
cg:?
2 s
t fr Z S
~
-5 Z s S
GAS VOLUME
V1n(1t! 1
4, 'b
0baC41
bf3: 76
701oc)
71: 77
75.b~ z
76'2:~
ORfICE Dlff. PRESSURE
AH (in.tI201
/, 7
/, j-
I# 5
) a L
/, 5
// 5
I O L
- / . 3
I I I I -
I
S l ACH TEMP
Is ('f
Eh
z ~ L
Z3 L
7325
2 5 7 .
zw z3 I,
23 22
v ~ c m = Hg (in. Hg)
b
lU~tR$f PO1111
7
I
I
#
v~LOCITY HfAD Atr (ln.H20)
.8C
Z
. B E
l b S
2 3 '
$ 8 G s '
. 7 ~
S ~ M P L I M C TIME
m (031n
CAS SAMPLE - in
//G
//8
1.70
/ zo
/ 20
/ r z /rt
/zL
/Z=
1 1 I
I ! I
9
. I
L
3
4
5
6 7
8
TEMP.f'f )
out
96
9~ 96
96 - - ?&
96
5%
96 -- 232 6 8
/6
I'
'
: +
1,
SO
/r,*rC/P
Iz;sL's /z:s-~
03&-50
~z;J-?
/:QI,&,
7 3 0
2%
z30
96 86 96
I
4
A/
$/
./ c/
4 7'
'/r3
/#J /, 4
b 7L
7C
a 75
1
/ ,*66Yo
,#a7
1, : 3
4 -
812 - : 2 6
R3,'8/Z
/ z r
'22-


l u . O a U c
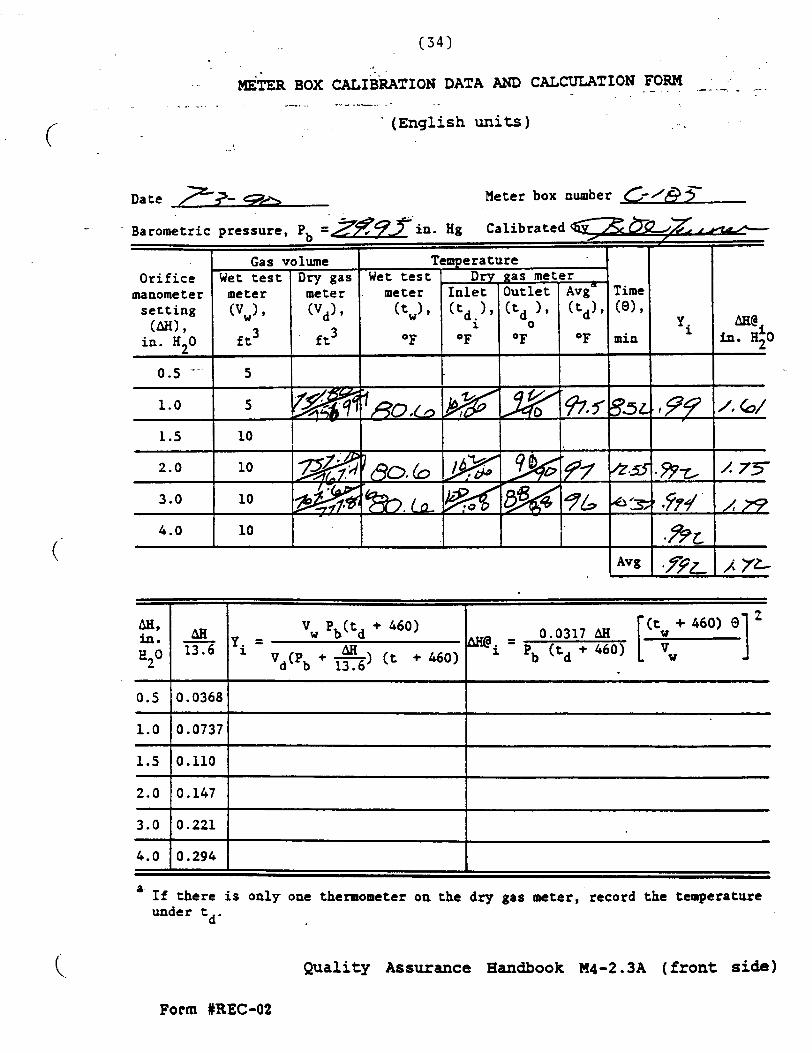
-- -" - .__._ . (English uni ts )
- 0ate 3 - 9jb Meter box number FA-/& 3
-
a If there is only one thermometer on the dry gas meter, record the temperature under td .
Quality Assurance Handbook M4-2.3A ( f ron t side)
in.
E2°
0.5
1 . 0
1 .5
2 .0
3.0
4 . 0
Form #REG02
An - 13.6
0.0368
0.0737
0.110
0.147
0.221
0.294
Vw Pb(td + 460) - *i - AH
Vd(Pb + 13.6) (t + 460)
(t + 460) 8 2
- - 0.0317 AH i P b ( t d + 4 6 0 ) [ ]

RAMCON
Lear Siegler Stack Sampler
Heating Probe Calibration
Probe No. Probe Length
Date of Calibration Signature S- T L Name of Company to be tested
Note: 3 f t . probe - 5 min. warmup 6 f t . probe - 15 min. warmup 10 f t . probe - 30 min. warmup Calibration flow rate = .7S CFM
Farm No- EEn-17-7


Dace S n cure t s o Nozzle No. Average Diameter Nozzle No. Average Diameter
1 7 2 8 3 9 4 10 5 11 6 12
- Pltot Tube Calibration (S Type)
Plroc Tube Ideatlficaclon No. 6 Dace - 4 -90 Calibrated by: t I
# I
~ p ( a ~ = cp(8t& VZZr Forp No. EEI)-17-1 48
"A" SIDE ~ALIBUTION
I zp (SIDE 0 I , $&
P 61
1
Cp (8)
/ 80 I 010
, * I
AP (8) cm Hz0 (in. H 2 0 )
3 4 1 8 b
4 b y
Run No.
1
2
3
DeVUTION
% (.)-& (B)
Q , W ~
0 . ~ 7 0 , 0 0 s /
Ap etd CP H20 (in. H20)
$,o 5
1.0 5
I 4 X
$ (SIDE B)
Run NO.
1
2
1 3
i
DEVIATION
cP (.I sp (A)
~ . s a 6 0.003
0.003
, Bog
A P ( ~ em as in. H 2 0 )
3.a ! ,425 4 9
& std CPI 820 (in. H f l )
d,os l .OX
,44
a
%(a)
,807
0 8 - r 7 f ,
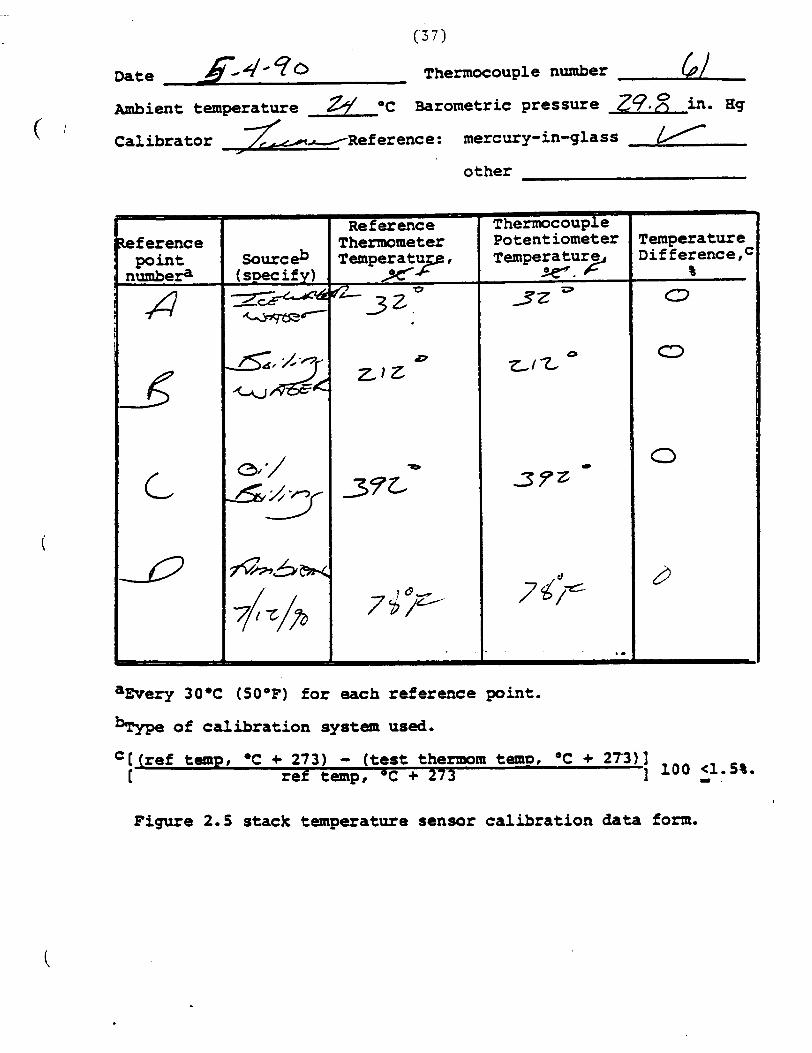
D a t e 5 4 J - ? ~ Thermocouplenumber f$/ Ambient temperature W O C Barometric pressure 29.2 in. Hg
( ; Calibrator /f--Reterence: mercury-in-glass
other
aEvery 30°C (50°F) for each reference point.
%ype of calibration system used.
[ (ref temp, O C + 273) - (test thermom t e m ~ , O C + 2 1 3 ) 1 1 ref temp, OC + 273 ] 100 <l.S%. = .
Temperature ~ i f f e r e n c e , ~
%
(3
C?
0
D
F i v e 2.5 stack temperature sensor calibration data form.
Thermocouple Potentiometer Temperature
se.. / 3 2 =
t l Z *
0
3 9 2
1.
Thermometer
0. */ C
70m5.m
37L-
7 0 4 7 3 /-
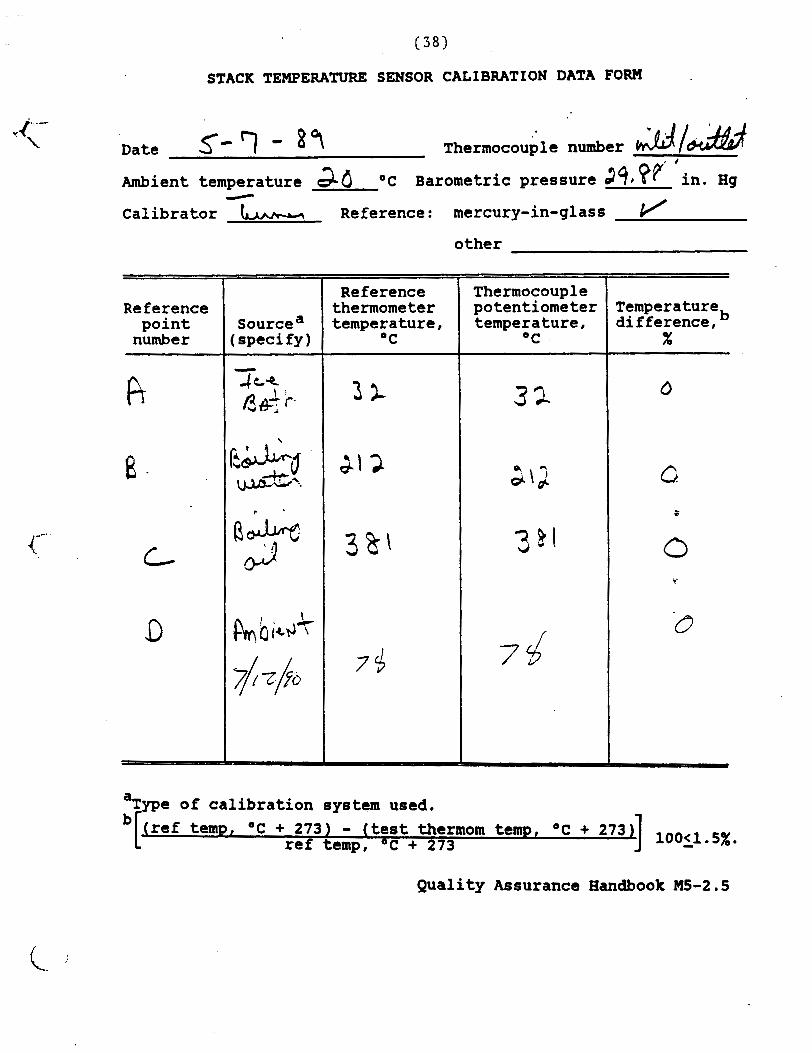
STACK TEMPERATURe SENSOR CALIBRATION DATA FORM
s- 7 - 87 Date ~hermocoup 1 e number , )
Ambient temperature ad "C Barometric pressure 340 ?r in. Hg #
Calibrator Reference : mercury-in-glass J other
Reference point number
sourcea : specify)
Reference thermometer temperature,
"C
Thermocouple potentiometer temperature, "C
Temperature difference,
%
a Type of calibration system used.
b b r e f temp, "C + 273) - (test thermom temp, "E + 273q 10011.5X. ref temp, O C + 273
Quality Assurance Handbook M5-2.5

STACK TEMPERATVRE SENSOR CALIBRATION DATA FORM
5- 7 - t 4 Date Thermocouple number \-bt Ambient temperature &O O C ~arornetric pressure P'i t ff in. ag
#
Calibrator (- Reference: mercury-in-glass I/
other
a Type of calibration system used.
b[(ref tern. O C + 1731 - (test thermom temp, O C + 27311 10011.52. ref temp, O C + 273
Quality Assurance Handbook M5-2.5

X RAMCON PERSONNEL

C4 0 1
PAMCON Environmental Sack Test Team
Sumner Bud< - President
Sumner Buck is the President of RAMCON Environmental Corporation. He is a
graduate of the EPA 450 "Source Sampling for Particulate Pollutant's' course and
the 474 "Continuous Emissions Monitoringn course all given at RTP. Mr. Buck is
a certified V.E. reader with current certification. Mr. Buck has personally sampled
over 400 stacks including over 300 asphalt plants. He is 47 years old and a
graduate of the University of Mississippi with graduate studies at Memphis State
University and State Technical Institute of Memphis.
William Turner - Team Leader
Bill Turner has been employed by RAMCON for two years. He has undergone
extensive training in Method 1 through 9. He is qualified as a team leader and
is currently certified as a V.E. reader.