environmental control of spring phenology in mature
TRANSCRIPT
Environmental control of springphenology in mature temperate trees
INAUGURALDISSERTATION
zur
Erlangung der Würde eines Doktors der Philosophie
vorgelegt der
PHILOSOPHISCH-NATURWISSENSCHAFTLICHEN FAKULTÄT
der Universität Basel
von
David Jonas Basleraus Zofingen/Uerkheim, Aargau
Basel, 2015
Original document stored on the publication server of the University of Baseledoc.unibas.ch.
This work is licensed under the Creative CommonsAttribution-NonCommercial-NoDerivatives 4.0 International License.

Genehmigt von der Philosophisch-Naturwissenschaftlichen Fakultätauf Antrag von
Prof. Dr. Christian Körner
Prof. Dr. Ansgar Kahmen
Basel, den 25. März 2014
Prof. Dr. Jörg SchiblerDekan


compiled in LATEX

Acknowledgements
First and foremost I would like to thank Christian Körner, for the guidanceand motivation he provided, for his enthusiasm towards this project, forproof-reading of many manuscripts and the opportunity to do a PhD in hisgroup.
Thanks to Ansgar Kahmen for co-examining my thesis.Special thanks to Yann Vitasse for the very good and successful collabo-
ration, Georges Grun for the technical support during the growth chamberexperiments, and Susanna Riedl for sourcing many of my odd literaturerequests.
I am happy to thank Tobias Bühlman, Riccarda Caprez, Günter Hoch,Nicole Inauen, Armando Lenz and Daniel Scherrer for valuable adviceon data analysis, statistics and for stimulating discussions. Also thanksto everybody else from the Botanical Institute for creating an inspiringworking environment.
This project was funded by Velux-Foundation (grant 499) and was sup-ported by NCCR-climate of the Swiss Science Foundation.
Finally, many thanks to Nathaline Château-Basler for the support pro-vided during these years, for being patient when I was complaining andfor listening and encouraging me when things did not go well. And thanksto my parents, they supported me in nearly all I have ever done.
v

Contents
1 General Introduction . . . . . . . . . . . . . . . . . . . . . . . . . . . . . . . . 1David Basler
Part I Main studies
2 Photoperiod sensitivity of bud burst in 14 temperate foresttree species . . . . . . . . . . . . . . . . . . . . . . . . . . . . . . . . . . . . . . . . . 11David Basler, Christian Körner
3 Photoperiod and temperature responses of bud swellingand bud burst in four temperate forest tree species . . . . . . . 39David Basler, Christian Körner
4 Evaluating phenological models for the prediction ofleaf-out dates in six temperate tree species across centralEurope . . . . . . . . . . . . . . . . . . . . . . . . . . . . . . . . . . . . . . . . . . . . 69David Basler
Part II Further studies and reviews
5 Phenology under global warming . . . . . . . . . . . . . . . . . . . . . . 103Christian Körner, David Basler
vii

viii Contents
6 What role for photoperiod in the bud burst phenology ofEuropean beech . . . . . . . . . . . . . . . . . . . . . . . . . . . . . . . . . . . . . 109Yann Vitasse, David Basler
7 Is the use of cuttings a good proxy to explore phenologicalresponses of temperate forests in warming andphotoperiod experiments? . . . . . . . . . . . . . . . . . . . . . . . . . . . . 127Yann Vitasse, David Basler
Part III Summary and conclusions
8 Summary and general conclusions . . . . . . . . . . . . . . . . . . . . . 155David Basler

Chapter 1General Introduction
David Basler
Seasonality in plants
Extra-tropical climates are characterized by temperature-related season-ality. Long time survival and species persistence is based on the abil-ity to cope with unfavorable and possibly fatal climatic conditions. Dur-ing active phase plants are commonly less resistant to environmentalstresses, such as freezing temperatures and water shortage. With higherlatitude or elevation the growing season length for plants shortens, andperennial plants have to temporary suspend growth to withstand the coldtemperatures in winter. Dormancy, characterized by suspended growthand correlated with increased stress tolerance, allows the plants to sur-vive potentially harmful seasonal environmental conditions. Hence, dur-ing the course of a year, plants undergo a series of developmental changes,which are also reflected by their appearance. The study of the timing ofre-occurring, visible development stages is named phenology (from theGreek phaino, ‘cause to appear’, and -logia, ‘study of’).
Dormancy
The rhythm of plant life in the annual cycle is the evolutive result of arisk minimization in interaction with climate (Larcher 2003). In humid
1

2 Chapter 1
extra tropical regions, the cold winter temperature bears the risk of tissuedamage in actively growing tissues. The timing of dormancy induction hasto take place before the first possibly fatal temperatures occur. Likewise,dormancy should not be released when the risk for freezing damage is stillhigh. The timing of the phenophases defining the growing season (budburst and leaf unfolding in spring, bud set in autumn) is thus a trade-offbetween maximizing the growing season length and minimizing the riskof freezing damage.
To adjust their phenology to the local climatic conditions, plants haveto relay to environmental signals indicating the progression of seasons.Two main environmental factors are controlling dormancy in temperatetrees: temperature and daylength (photoperiod). The role of temperatureis twofold: the experience of a certain amount of low temperatures makeplants receptive to warmer conditions as spring is approaching (‘chilling’:non freezing temperatures in the range of 2-7 ◦C), while warm tempera-tures are directly affecting the rates of development (‘forcing’) once theinternal disposition is established. While the course of late winter or springtemperature is strongly variable from year to year, photoperiod is a reli-able astronomic environmental signal for the progression of the season.Beside the importance for the timing of dormancy, photoperiodism is alsoimportant for reproductive events, including synchronous flowering thatassures gene flow among the individuals of often scattered plant popu-lations (Jackson 2009; Keller and Körner 2003; Thomas and Vince-Prue1997). Photoperiod is recognized by photoreceptor systems, such as thephytochrome system, and functions as a dose-independent signal, i.e. assoon as a certain (very low) threshold of light intensity is passed, plantsrecognize the signal ‘day-on’.
In most tree species, the shortening photoperiods in autumn (perceivedin the leaves) induce dormancy, which becomes apparent in the forma-tion of winter bud. The period of dormancy may be separated into threedistinct phases (Lang et al. 1987): (1) paradormancy, where (hormonal)signals from other plant organs induce dormancy in the buds, (2) en-dodormancy, where physiological conditions within the bud inhibit growthand development and (3) ecodormancy, where environmental conditions(e.g. low temperature) suppress growth in the bud. In the first stage ofdormancy (paradormacy) plants may readily resume growth when trans-ferred to long-day conditions. Under the influence of low temperatures,the paradormant state develops into endodormancy. Once endodormancy

1 General Introduction 3
is fully established, plants will not resume growth even under favorableconditions. The autumnal leaf coloring and leaf fall are coincident pheno-logical events, but do not reflect the status of bud dormancy, which nor-mally precedes the leaf coloration. Temperatures may modulate the induc-tion of dormancy, with warm temperatures either fastening or delaying thedormancy induction. Exposure to low temperatures (chilling) makes plantsreceptive to warmer conditions. After the chilling requirement is fulfilled,endodormancy is released and plant may enter a phase of ecodormancy,where growth is resumed as soon as the environmental conditions allow.Chilling, forcing and photoperiod are part of complex interactions, e.g., alack of chilling may lead to increased requirement of forcing temperaturesfor budburst, but may also be substituted by long daylength (Heide 1993a;Heide 1993b).
Species-specific differences
The transition between the different phases of dormancy is gradual andspecies or even ecotypes may differ in their environmental requirementsfor dormancy induction and release (Körner 2007; see Fig. 1.1; Perry1971). Ecological life strategy and successional status of a species maydetermine the response to warm temperatures in early spring. Opportunis-tic species will more likely respond to temperature only, although the po-tential risk of freezing damage may be larger. Long-lived late successionalspecies will more likely adopt a more conservative strategy, relying moreon photoperiod to decrease the risk of freezing damage.
As is known in forestry for at least a century (Langlet 1971; Vaartaja1959), trees of late successional species are genetically calibrated to thelatitude or elevation they live in, explaining for instance the failure of lowelevation genotypes planted at high elevation (e.g. Holzer 1967). Commongarden experiments have evidenced this provenance differentiation.

4 Chapter 1
Fig. 1.1: A schematic representation of the interaction of temperature and photoperi-odism in photoperiod-sensitive species from cool temperate climates. Boxes illustratethe photoperiod-driven windows that permit development, the speed of which is con-trolled by the actual temperature. A depicts a triple control of bud burst, B a doublecontrol (no spring photoperiod effect), C an opportunistic behavior (only actual tem-perature matters), with A-C still adopting a photoperiod control of timely senescenceor dormancy introduction in a seasonal climate. D represents a tropical ecotype with noregular threshold controls of phenology (but there may be other triggers). From Körner(2007)
Responses to climate warming
During the last years, phenology has received increased interest in thelight of global warming and many studies observed a shift in phenolog-ical phases during the last decades, Due to the recent climate warming,phenological spring events advanced globally on average by 2.3 days perdecade (1971-2000; Parmesan 2006). In Europe, spring events advancedby 2.5 days per decade over the same period, corresponding to 2.5 daysper ◦C (Menzel et al. 2006). However, phenological responses to warmingis non-linear, and increased warming can even delay spring phenology, aswas observed for example in steppe and meadow vegetation of the Tibetan
1 General Introduction 5
Plateau (Yu et al. 2010). The changing appearance of plants during thecourse of a year is based on environmental influences as well as on theirinternal disposition (genetic/hormonal). As an observational method, phe-nology may not distinguish between both influences. The internal disposi-tion to react to favorable conditions are thus often overlooked and linkedto the concurrent weather conditions. Whether the start of the growing sea-son is able to track the temperatures in spring depends on the extent of theautonomous developmental control. With increasing warming, underlyingphotoperiodic thresholds or chilling fulfillment may become an issue anddecelerate or even reverse the trend towards earlier phenology.
Aims of this work
In this thesis, I aimed at
1. Screening a representative set of temperate forest trees for their pho-toperiod sensitivity (Chapter 2).
2. Investigate the effect of temperature and photoperiod on the rate ofdevelopment prior to bud burst (Chapter 3).
3. Evaluate, whether the integration of photoperiod sensitivity into com-monly used phenological models increases their accuracy and appli-cability (Chapter 4).
The responses of bud burst to temperature and photoperiod (Chap-ter 2, 3) was investigated experimentally under controlled conditions usingcuttings (cut twigs from mature trees, Fig. 1.2) of 14 tree species sampledat two elevations and replicated across two regions of Switzerland. Thevalidity of using cuttings as proxy for mature tree phenology, rather thanseedlings, was tested by comparing cutting phenology and adult tree phe-nology in-situ (Chapter 7).
With a continued rise of temperature a further advancement of springphenology has been projected using linear models. ‘Process-based’ phe-nological models are designed to simulate the response to environmentaldrivers and should, if the underlying assumptions are true, yield more re-alistic predictions of phenological onset dates. I compared and analyzed aset of over 30 existing models (and combinations thereof) using long-termobservation and phenological data derived from experiments (Chapter 4).

6 Chapter 1
Fig. 1.2: Watered cuttings used to investigate the response of spring phenology to dif-ferent combinations of photoperiod and temperature under controlled conditions (seeChapter 2 and 3).
Even though a photoperiod effect on spring phenology has been docu-mented since decades it was not widely acknowledged by the phenologycommunity. The extensive literature search for this thesis lead to a sum-mary on photoperiod control of tree phenology in general (Chapter 5) andfor Fagus sylvatica, specifically (Chapter 6).
1 General Introduction 7
List of publications
The chapters of this thesis have been published in peer-reviewed journals:
Ch. 2 Basler D, Körner C (2012) Photoperiod sensitivity of bud burst in14 temperate forest tree species.Agricultural and Forest Meteorology 165:73-81
Ch. 3 Basler D, Körner C (2014) Photoperiod and temperature responsesof bud swelling and bud burst in four temperate forest tree species.Tree Physiology 34:377-88
Ch. 4 Basler D (2016) Evaluating phenological models for the predictionof leaf-out dates in six temperate tree species across central Europe.Agricultural and Forest Meteorology 217:10-21
Ch. 5 Körner C, Basler D (2010) Phenology under global warming.Science 327:1461-1462
Ch. 6 Vitasse Y, Basler D (2013) What role for photoperiod in the budburst phenology of European beech.European Journal of Forest Research 132:1-8
Ch. 7 Vitasse Y, Basler D (2014) Is the use of cuttings a good proxy to ex-plore phenological responses of temperate forests in warming andphotoperiod experiments?Tree Physiology 34: 174-183
References
Heide OM (1993a) Daylength and thermal time responses of budburst during dormancyrelease in some northern deciduous trees. Physiol. Plant. 88: 531–540.
Heide OM (1993b) Dormancy release in beech buds (Fagus sylvatica) requires bothchilling and long days. Physiol. Plant. 89: 187–191.
Holzer K (1967) Das Wachstum des Baumes in seiner Anpassung an zunehmende See-höhe. Mitt. Forstl. Bundes-Vers. anst. Wien 75: 427–456.
Jackson SD (2009) Plant responses to photoperiod. New Phytol. 181: 517–531.Keller F, Körner C (2003) The role of photoperiodism in alpine plant development.
Arct. Antarct. Alp. Res. 35(3): 361–368.Körner C (2007) Significance of temperature in plant life. In: Morison JIL, Morecroft
MD (Eds.), Plant Growth and Climate Change. Blackwell Publishing Ltd., Oxford,pp. 48–69.

8 Chapter 1
Lang GA, Early JD, Martin GC, Darnell RL (2002) Endo-, para-, and ecodormancy:physiological terminology and classification for dormancy research. HortScience 22(3): 371–377.
Langlet O (1971) Two hundred years genecology. Taxon 20: 653–721.Larcher W (2003) Physiological Plant Ecology: Ecophysiology and Stress Physiology
of Functional Groups, 4th ed. Springer, Berlin, New York.Menzel A, Sparks TH, Estrella N, Koch E, Aasa A, Ahas R, Alm-Kubler K, Bissolli P,
Braslavska O, Briede A, Chmielewski FM, Crepinšek Z, Curnel Y, Dahl A, DefilaC, Donnelly A, Filella Y, Jatcza K , Mage F, Mestre A, Nordli O, Penuelas J, PirinenP, Remisova V, Scheifinger H, Striz M, Susnik A, Van Vliet AJH, Wielgolaski FE,Zach S, Zust A (2006) European phenological response to climate change matchesthe warming pattern. Glob. Change Biol. 12: 1969–1976.
Parmesan C (2006) Ecological and evolutionary responses to recent climate change.Annu. Rev. Ecol. Syst. 37: 637–669.
Perry TO (1971) Dormancy of trees in winter. Science 171: 29–36Thomas B, Vince-Prue D (1997) Photoperiodism in plants, 2nd edn. Academic Press,
London.Vaartaja O (1959) Evidence of photoperiodic ecotypes in trees. Ecol. Monogr. 29 (2):
91–111.Yu H, Luedeling E, Xu J (2010) Winter and spring warming result in delayed spring
phenology on the Tibetan Plateau. Proc. Natl. Acad. Sci. 107: 22151–22156

Part IMain studies


Chapter 2Photoperiod sensitivity of bud burst in 14temperate forest tree species
David Basler, Christian Körner
Abstract The timing of spring phenology of trees reflects a trade-offbetween a longer growing season and a lower risk for damage by latefreezing events. Temperature is driving rates of development directly, butgiven the high inter-annual variability in weather, it is a poor environ-mental cue for the progression of the season and thus, the period withlow freezing risk. In contrast, photoperiod is a reliable and weather in-dependent signal of the progression of the season. Using growth chamberexperiments we assessed the photoperiod sensitivity of bud burst under ar-tificial spring conditions in cuttings of 14 common European tree speciesthat belong to different life-strategy types (pioneers or exotic species vs.native late-successional species; 3 conifers/11 broadleaved). Fully chilledtwigs were sampled from populations along two elevational gradients inthe Swiss Alps. Applying realistic contrasts in photoperiod, short photope-riods delayed bud burst in five late successional species to variable degree,whereas no distinct photoperiod sensitivity was observed in early succes-sional species. In Picea abies, the photoperiod response was additionallyinfluenced by elevation of origin, whereas in Quercus petraea and Abiesalba regional differences in the photoperiod response were observed. Forlate successional species, photoperiod is thus an important environmen-tal signal that will constrain responses to climatic warming because risingtemperatures will drive phenology toward the species specific photoperiodthreshold.
Original article published in Agricultural and Forest Meteorology 165:73-81
11

12 Chapter 2
Key words: Spring phenology, Daylength, Temperature, Development,Season
Introduction
The precise timing of phenological events (bud burst, flowering, bud set)is a key factor for long-term survival, successful reproduction and speciesestablishment (Larcher 2003). To survive the harsh winter conditions inhigh latitude seasonal climates, trees go through a period of dormancyand enhanced freezing resistance during winter. The timing of the induc-tion and the release from dormancy is closely linked to three componentsof local climate conditions, with the amount of low temperatures experi-enced (chilling), photoperiod and (forcing) temperature acting as the mainenvironmental drivers in humid extra tropical regions (Körner 2007).
The autumnal growth cessation and the induction of dormancy, includ-ing freezing resistance, is largely a photoperiodic response to the longernights (shorter daylength) in autumn (Klebs 1903, 1914, Vaartaja 1959,Thomas and Vince-Prue 1997), although, concurrent temperatures aremodulating this response (Heide 2003, Kalcsits et al. 2009). Unlike ac-tual weather, the astronomically defined photoperiod is a most reliableindicator for the progression of the season and thus, the photoperiodic in-duction of dormancy ensures that trees are ready to cope with freezingtemperatures well before the first freezing events occur (Körner 2007).The period of dormancy may then be separated into the three main phases(1) predormancy, (2) endodormancy, and (3) ecodormancy, based on thedepth of silencing of metabolic activity (Samish, 1954). The transitionfrom endodormancy to ecodormancy is jointly controlled by the fulfill-ment of chilling requirement and by photoperiod, where chilling tempera-tures describe a rather vaguely defined range of cool, non-freezing temper-atures below 10 ◦C (Battey 2000), with the range of 2-5 ◦C being the mosteffective for most species (Cannell 1989). During ecodormancy (warm)temperatures accelerate bud development until bud burst marks the startof a new growing season. The transitions between the different phases ofdormancy are gradual, with species or even genotypes differing in theirrequirements for these environmental triggers (Perry, 1971).
2 Photoperiod sensitivity of bud burst in temperate tree species 13
The timing of dormancy induction and its release always reflect a trade-off between the length of the active period (‘growing season’) and therisk of damage by freezing temperatures, both in early autumn and inspring (Larcher 2003, Bennie et al. 2010). The dissimilar phenological re-sponses of different species may thus be linked to the species life-history.While opportunistic pioneer species adopt a more ‘risky’, often even tem-peratureonly driven dormancy release, late successional species generallyshow a more ‘conservative’, more complex response, with a large chillingrequirement and enhanced photoperiod sensitivity (Körner 2007, Caffarraand Donnelly 2010, Körner and Basler 2010). Also nutrition influencesthis trade-off, with species that have high nutrient access, such as Alnus sp.(with N2-fixing symbionts) employing a more risky foliage life historythan species operating at more restricted nutrient supply (Tateno 2003).Within species, genetic adaptation to local climate conditions, such as thedifferentiation into latitudinal and elevational ecotypes, is common (Mor-genstern 1996, Thomas and Vince-Prue 1997).
The warming temperatures in the last decades are facilitating a longergrowing season, especially an earlier onset of spring, which has been ob-served across many scales and taxa (Parmesan and Yohe 2003, Menzelet al. 2006). However, such a response will follow a nonlinear trend in aneven warmer future, given that some species will hit their genetically fixedphotoperiod or chilling constraints as warmer temperatures facilitate po-tential earlier leafing (Körner and Basler 2010, Morin et al. 2010). Thus,photoperiod sensitivity of bud burst may prevent some species from track-ing the earlier onset of warm weather in spring as the climate gets warmer.As the timing of bud burst has a strong heritable component (Engler 1905,Burger 1926, Morgenstern 1996), a re-adaptation may take several gener-ations (Langlet 1971, Nienstaedt 1974), which means centuries in the caseof trees.
Photoperiodic responses of spring phenology were assessed in severaltree species, most prominently in Fagus sylvatica (Wareing 1953, Falusiand Calamassi 1990, Heide 1993b, Caffarra and Donnelly 2010), but alsoin a few other tree species (e.g. Nienstaedt 1967, Worrall 1975, Heide1993a, Myking and Heide 1995, Caffarra et al. 2011). However, these re-sults are often contradictory or challenging to interpret, given the complexinteractions of the three drivers, chilling photoperiod and actual tempera-ture forcing. In addition, genotypes (provenances) of a species may also
14 Chapter 2
differ in their photoperiod responses, as was observed in Betula (Heide1993b, Myking and Heide 1995).
Any experimental research targeted at revealing mechanisms of treephenology, is facing severe methodological constrains, since whole treescannot be undertaken photoperiod manipulation in situ (e.g. shorteningdaylength while simulating warming). Seedlings or cuttings (cut twigs)of mature trees may be used as substitute in growth chambers, howeverthe phenology of seedlings is known to differ from that of mature trees,whereas cuttings are per se disconnected from (potential) whole-tree sig-nals affecting bud burst. The way experimental treatments are performed,using different fixed rather than fluctuating temperatures (Campbell andSugano 1975, Erez and Couvillon 1987, Myking 1997, Partanen et al.1998, Saxe et al. 2001) and constant vs. gradually lengthening photoperi-ods (Partanen et al. 1998), may further influence bud burst.
Given the diverse results in the literature, and aware of potential method-ological limitations we made an effort to assess the basic photoperiodsensitivity of bud burst in a multi-species approach, including elevation-ally separated populations from geographically distinct regions. We con-ducted growth chamber experiments with cuttings of 14 temperate for-est tree species, including species with differing leaf duration (decidu-ous vs. evergreen), whole tree life strategy (early- vs. late successional),bio-geographic origin (native vs. exotic), and in some species, differentprovenances from populations along two elevational gradients in the SwissAlps. To our knowledge, no study has yet assessed the contemporary pho-toperiod sensitivity of bud burst in a wide range of temperate forest treespecies after extensive chilling during winter under dynamic photoperi-ods. Given the above mentioned limitations, results will be conservative,that is, we may not be able to detect the full strength of in situ photoperiodcontrol under such experimental conditions. Distinct photoperiod sensitiv-ity is expected in late successional species.

2 Photoperiod sensitivity of bud burst in temperate tree species 15
Methods
Study sites
Three distinct sampling sites were defined along each of the two el-evational gradients in the region of Chur (46◦51′ N/9◦32′ E, hereafternamed ‘eastern transect’) and Lavey (46◦12′ N/7◦02′ E, ‘western tran-sect’), Switzerland. Temperature loggers (TidBit v2, Onset Computer Cor-poration, Bourne, MA, USA) were placed at the three different sites alongeach transect inside the forest in order to track the local air temperatures(2 m above ground, shaded) and to provide a link to long term temper-ature records from nearby weather stations. In order to avoid confusionbetween temperatures (◦C) and temperature differences, we join other au-thors in adopting K (for Kelvin) for all differences in temperature. Bothslopes are facing west and are covered by near natural forest stands (his-torical management could not be excluded).
Sampling
Sampling of the cuttings took place on 2 and 3 March 2009: according tospecies distribution along the gradients, each species was sampled fromtwo out of the three sites per gradient, a high and a low elevation site (Ta-ble 2.1). The elevational difference between the high and low samplingsites was between 400 and 500 m, which corresponds to a mean temper-ature difference of around 3 K. On each sampling site, dormant twigs offive individual trees per occurring species were sampled from the lowercanopy (5–6 m above ground; 4 twigs per tree) using a 4 m tree pruner(Fiskars, Helsinki, Finland). The twigs were immediately labeled, wa-tered, and transported to the Institute of Botany within 6 h where theywere stored at 2 ◦C in the dark until the start of the experiments, once allsamples had been collected (i.e. after 2 days, 4 March 2009). Tilia cordataand Prunus avium were sampled on the western transect only (no suitabletrees in the eastern transect). Additionally, we sampled (as a reference) twoexotic ornamental tree species, horse chestnut (Aesculus hippocastanum)and lilac (Syringa vulgaris), which are known to be photoperiod insen-

16 Chapter 2
sitive and thus, are closely tracking temperature (Defila and Clot 2001,Larcher 2007; both species sampled from low elevation only). In the fol-lowing we refer to species by their genus name.
Table 2.1: Species and number of sampled trees per species along two elevational gra-dients in the Swiss Alps. Each species was sampled from a high and a low elevation siteper gradient, according to species distribution along the gradient. A total of 960 twigswere cut from 240 trees.
western transect eastern transect
500 m 1000 m 1450 m 700 m 1100 m 1520 m
early successional native speciesAcer pseudoplatanus L. 5 5 5 5Betula pendula Roth 5 5 5 5Corylus avellana L. 5 5 5 5Fraxinus excelsior L. 5 5 5 5Larix decidua Mill. 5 5 5 5Prunus avium (L.) L. 5 5Sorbus aucuparia L. 5 5 5 5
late successional native speciesAbies alba Mill. 5 5 5 5Fagus sylvatica L. 5 5 5 5Picea abies L. 5 5 5 5Quercus petraea (Mattuschka) Liebl. 5 5 5 5Tilia cordata Mill. 5 5 - -
exotic, ornamental speciesAesculus hippocastanum L. 5 - 5 -Syringa vulgaris L. 5 - 5 -
Closest weather station data (1981-2010): West (Aigle, 381 m a.s.l.): 1010 mm annualprecipitation , 10.1 ◦C mean annual T, duration of the growing season (Tm>= 5 ◦C)262 d. East (Chur 556 m a.s.l.): 860 mm annual precipitation, 9.7 ◦C mean annual T,duration of the growing season (Tm>= 5 ◦C) 255 d. Data provided by MeteoSwiss(The Swiss Federal Office of Meteorology and Climatology)

2 Photoperiod sensitivity of bud burst in temperate tree species 17
Sample treatment
Before the start of the experiment, the sampled twigs were recut to a lengthof around 30–40 cm. The number of buds per twig was species dependentand ranged from 2 in Aesculus up to around 40 buds in Larix. The twigswere then half dipped into a disinfectant sodium hypochlorite solutionfor 30 s (200 ppm active chlorine), recut a second time underwater at asteep angle using a sterile hand pruner, and finally placed into 0.5 l glassbottles filled with 0.4 l cool tap water. For Fraxinus and Quercus, the waterwas additionally treated with the broad-spectrum antibiotics gentamicinsulfate (40 µ g/l; Sigma–Aldrich, Germany; Larcher et al. 2010) since thexylem of these ring-porous species tends to become jammed by growingbacteria. During the experiment, the water was changed weekly and at thesame time twigs were re-cut another 1–3 cm in order to assure good watersupply.
Growth chamber conditions
The photoperiod sensitivity of spring phenology in a future climate wasassessed with the assumption that warm temperatures will occur earlier inthe season and thus, will coincide with a shorter photoperiod. Hence, weprogrammed fully automatic phytotron units to match such realistic dy-namic climate scenarios. We defined two similar temperature treatmentsin combination with either long or short photoperiods (9.5 h at start of ex-periment resp. 11 h at start of experiment; Fig. 2.1). Temperature was setto cycle ∼5 K around the daily mean temperature, which was increasedby 0.5 K every five days, simulating temperatures increase as spring pro-gresses. The photoperiod in all treatments consisted of 8 h high intensitylight from metal halide lamps (MF400LS/U, EYE Iwasaki Electric Co.,Japan) providing 506± 30µmol m−2 s−1 PFD (photosynthetically activephoton flux density; Red:Far Red 4.2) at plant level and a low intensityextensions using incandescent lamps (Classic A 100 W, Osram AG, Mu-nich, Germany) providing 42± 6µmol m−2 s−1 PFD (Red:Far Red 0.8).The length of the photoperiod was extended daily using time switches,set to follow the natural (astronomical) daylength extension at the sam-pling latitude (∼47◦ N) of around 3–4 min per day. The short photope-

18 Chapter 2
Fig. 2.1: Experimental variation of photoperiod and temperature during the simulatedlate winter/spring conditions. Long day (LD; starting daylength as of 1 March) andshort day (SD; starting daylength as of 1 February) treatments were continuously ad-justed to simulate progression of season at a distance of ca. 90 min. Both photoperiodtreatments were combined with similar stepwise-increases in temperature (Tm for dailymean) in order to simulate the natural progression of spring weather at 47◦ N.
riod treatment thereby corresponded to the daylengths from February toApril at this latitude, whereas the long photoperiod treatment simulateddaylengths of March to May. The two treatments were replicated and ran-domly assigned to four of these computer controlled growth cabinets (each253 cm ×120 cm × 195 cm, Weiss Klimatechnik GmbH, Germany).
Every second day sample positions within each chamber were ran-domized and every 5 days the samples and photoperiod treatments wereswitched between the chambers, to minimize potential chamber effects.The chambers were constantly well ventilated to maintain a homogenoustemperature distribution within the chamber. The set point temperatureduring the light period was adjusted to compensate for the heat emissionof the lamps. Temperature, humidity as well as light conditions at plantlevel were monitored using data loggers (HOBO Temperature/RH resp.HOBO Light On/Off, Onset Computer Corporation, Bourne, MA, USA).

2 Photoperiod sensitivity of bud burst in temperate tree species 19
Observations
Given the large number of samples (in total 960 twigs of 240 trees; 4 twigsper tree; Table 2.1), observations had to be split over two day (on eachday, half of the cuttings were visually inspected for bud development).The status of the uppermost buds was rated using a four stage scale, asdefined by (Murray et al. 1989): (1) bud dormant, (2) bud swollen, (3) budburst (first green leaf tip showing), (4) leaf unfolding (leaf stalk visible).For efficient observation, each bottle was bar-coded and the bud status wasassigned by a bar-coded reference table using a barcode-reader.
Statistical analysis
Bud burst data was analyzed using split–split plot ANOVAs for eachspecies. The two replicates were used as blocking factor, the photoperiodtreatment was applied to whole plots (chambers), and the cuttings withineach chamber were treated as elevational samples nested in their region oforigin.
Temperatures at the sampling sites (elevations) before sampling werecalculated using the linear regressions of the temperature data loggedon-site after sampling with temperatures from nearest weather stations(R2 always > 0.95, weather station data provided by the Swiss FederalOffice of Meteorology and Climatology MeteoSwiss). The degree-daysat bud burst were calculated from the reconstructed daily mean tempera-tures at the sampling site (from 1 January until sampling) and the dailymean treatment temperatures (from sampling until bud burst), using 0 ◦Cas base temperature for degree-day accumulation, as recommended byHeide (1993a). Chilling days were calculated according to Murray et al.(1989) and reflect the number of days since 1 November with daily meantemperature 5 5 ◦C. Since species differ in their individual temperatureresponse, the absolute degree-day value calculated here should assist inexplaining the influence of the climatic conditions before sampling andpossible ecotypic responses.
For all data processing, statistical analysis and graphics R 2.11.1 (RDevelopment Core Team 2010) were used. All the values mentioned aremean ± standard deviation, unless noted otherwise.
20 Chapter 2
Results
Climatic conditions
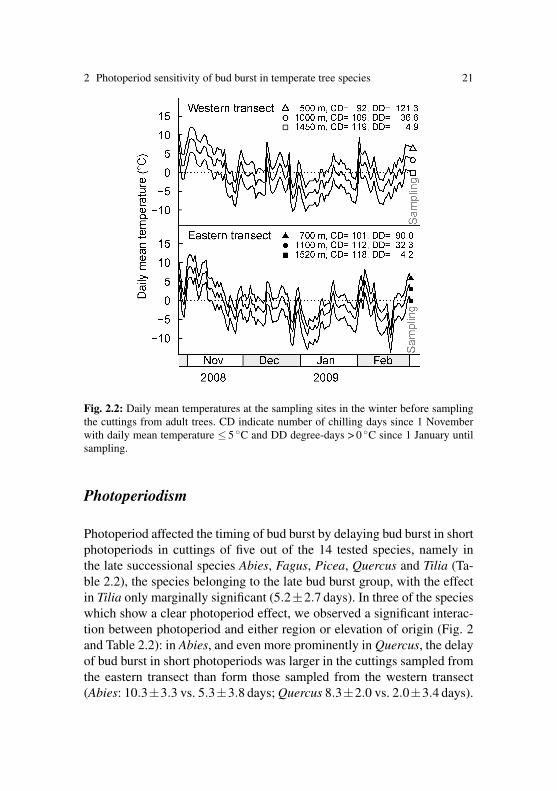
The twigs were sampled as late as early March, to ensure trees were suffi-ciently chilled. Naturally, buds from lower elevation will have experiencedless chilling and consequently also warmer temperatures during the pre-vious winter than those from high elevation (Fig. 2.2). According to thedegree-days and the number of chilling days, the winter before the ex-periment was slightly warmer along the eastern transect than along thewestern transect, however the thermal differences among the three sam-pling sites per transect were quite similar on both transects. During theexperiment, the temperatures among the four chambers were similar, withonly minute deviations between chambers (SD of daily mean tempera-tures always 5 0.3 K). Mean relative humidity inside the chambers waskept constant at 71±8%.
Sequence of bud burst among species
We observed bud burst under our experimental conditions on all cuttingsuntil the end of the experiment after 70 days (100% bud burst). The budburst in all cuttings, even under the shorter photoperiods, is thus an indi-cation of successful chilling, given that lack of chilling would have sig-nificantly reduced the fraction of bursting buds or delayed bud burst incuttings (Heide 1993a). The species required different time to bud burstand were following approximately the natural order of early to late flush-ing species, as commonly found by field observations in Switzerland (De-fila,1991). The earliest species, Prunus, started to flush already after 17days, followed by Larix, Sorbus, Betula, Aesculus, Syringa, Corylus, Acer,Fraxinus, Fagus, Picea, Quercus, Abies in that sequence, and finally aftermore than 60 days of exposure to the treatment conditions, Tilia. The gen-eral order of species’ bud burst remained similar in both photoperiod treat-ments. Within-population variation in the time of bud burst was generallylow.
2 Photoperiod sensitivity of bud burst in temperate tree species 21
Fig. 2.2: Daily mean temperatures at the sampling sites in the winter before samplingthe cuttings from adult trees. CD indicate number of chilling days since 1 Novemberwith daily mean temperature ≤ 5 ◦C and DD degree-days > 0 ◦C since 1 January untilsampling.
Photoperiodism
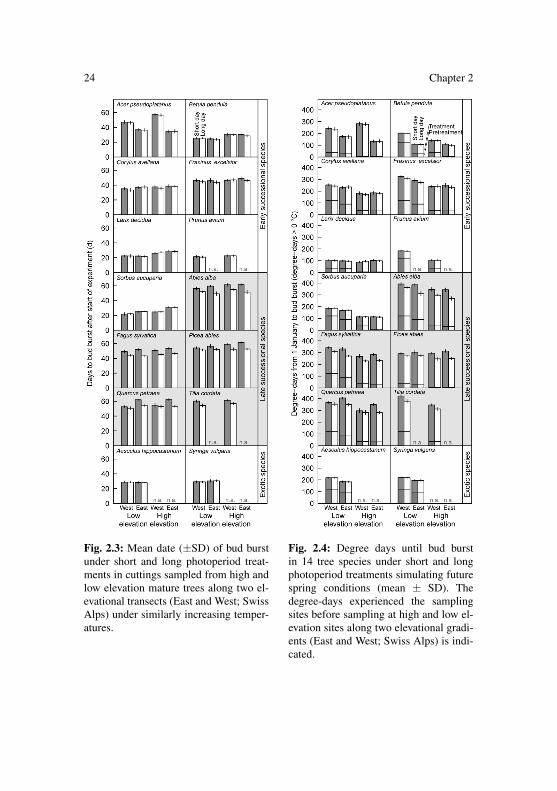
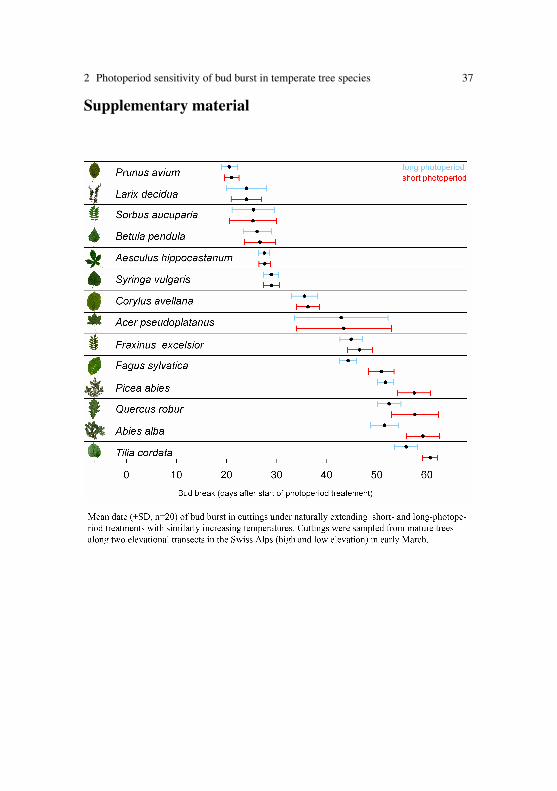
Photoperiod affected the timing of bud burst by delaying bud burst in shortphotoperiods in cuttings of five out of the 14 tested species, namely inthe late successional species Abies, Fagus, Picea, Quercus and Tilia (Ta-ble 2.2), the species belonging to the late bud burst group, with the effectin Tilia only marginally significant (5.2±2.7 days). In three of the specieswhich show a clear photoperiod effect, we observed a significant interac-tion between photoperiod and either region or elevation of origin (Fig. 2and Table 2.2): in Abies, and even more prominently in Quercus, the delayof bud burst in short photoperiods was larger in the cuttings sampled fromthe eastern transect than form those sampled from the western transect(Abies: 10.3±3.3 vs. 5.3±3.8 days; Quercus 8.3±2.0 vs. 2.0±3.4 days).

22 Chapter 2
Table 2.2: Results of the split-split plot ANOVAs for the number of days to bud burstin the 14 tree species included in the experiment. The table shows p-values of F-tests,bold values are statistically significant (p < 0.05).
Species Photoperiod Region P×R Elevation P×E R×E P×R×E
early successional native speciesAcer 0.468 0.001 0.621 0.001 0.731 <0.001 0.961Betula 0.322 0.082 0.243 <0.001 0.381 0.459 0.315Corylus 0.344 0.032 0.152 0.009 0.451 0.344 0.514Fraxinus 0.182 0.893 0.256 0.016 0.346 0.242 0.242Larix 0.758 0.146 0.184 <0.001 0.203 0.020 0.203Prunus 0.617 - - 0.075 0.563 - -Sorbus 0.732 0.003 0.809 <0.001 0.371 0.005 0.557
late successional native speciesAbies 0.034 0.222 0.027 0.002 0.316 0.089 0.206Fagus 0.032 0.047 0.061 0.007 0.499 0.252 0.126Picea 0.045 0.066 0.160 0.002 0.006 0.770 0.684Quercus 0.050 0.006 0.016 0.127 0.352 0.027 0.406Tilia 0.064 - - 0.076 0.315 - -
exotic, ornamental speciesAesculus 0.818 0.220 0.617 - - - -Syringa 0.927 0.090 0.763 - - - -
P: photoperiod, R: region, E: elevation
Finally, in Picea the delay of bud burst in short photoperiods was influ-enced by elevation: the delay was more pronounced in samples from high(7.8±2.4 days) compared to low elevation (3.5±2.7 days). No photope-riod effect was observed in the cuttings early successional species (Acer,Betula, Corylus, Fraxinus, Larix, Prunus and Sorbus) and in the two or-namental, exotic species Aesculus and Syringa.
Ecotypic responses
Irrespective of photoperiod, the elevation of cutting origin had an delayingeffect on the time of bud burst in almost all studied species (Fig. 2 and Ta-ble 2.2): except for Abies sampled on the western transect, and Acer sam-pled on the eastern transect, we observed significantly earlier bud burst inthe cuttings from low elevation than in those from high elevation. How-

2 Photoperiod sensitivity of bud burst in temperate tree species 23
ever, this effect was quite small, mostly two to four days. In most of thesespecies, this elevational delay of bud burst was additionally influenced bythe cutting’s region of origin, although the direction of the region effectwas not consistent: in Larix, Sorbus and Quercus, the elevational delay ofbud burst was larger in the cuttings from the eastern transect, whereas inAbies and Acer this difference was larger in the samples from the west-ern transect. In four species (Acer, Corylus, Quercus, Sorbus) the regionaldifferences found were fairly consistent: cuttings sampled at the easterntransect flushed a few days later than those originating from the westerntransect, although a significant region effect, in the absence of an interac-tion with elevation, was only present in Corylus.
Degree-days until bud burst
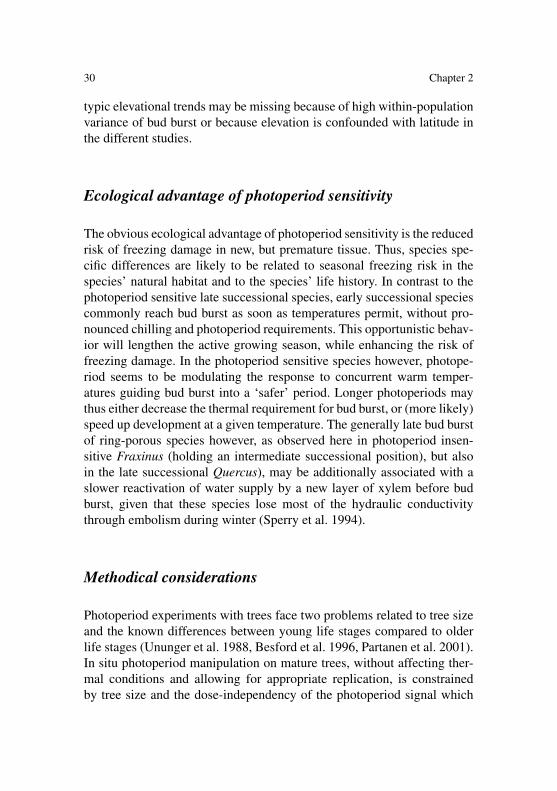
In the five photoperiod sensitive species, longer photoperiods acceleratedbud burst and thus, we also found reduced degreedays at bud burst un-der longer photoperiods (Table 2.3 and Fig. 2.4). Additionally, the degree-days at bud burst were influenced by elevation and/or region of cutting ori-gin in all species assessed here. As described in the preceding section, budburst of high elevation cuttings was, with few exceptions, later than in cut-tings from low elevations under our simulated spring temperatures. Con-sequently, the high elevation cuttings experienced more degree-days untilbud burst during the experiment. However, by including the pre-samplingtemperatures since 1 January at the sampling sites into the degree day cal-culation, we found that the high elevation cuttings of all species (exceptAcer and Larix) opened their buds after less degree-days than the low el-evation cuttings. No clear elevational pattern was found in Acer, whichexhibited opposite responses to elevation among regions, both, in termsof days to bud burst and degree-days at bud burst. In Larix, elevation oforigin had no significant effect on the degree-days at bud burst, despitethe highly significant effect on the time of bud burst. Similarly, the re-gional differences in the time of bud burst in Corylus were not reflectedin the degree-days at bud burst of this species. Should the different pop-ulations have similar thermal requirements for bud burst, the differencesin the time of bud burst observed are thus most likely associated with thepre-sampling in situ temperatures.
24 Chapter 2
Fig. 2.3: Mean date (±SD) of bud burstunder short and long photoperiod treat-ments in cuttings sampled from high andlow elevation mature trees along two el-evational transects (East and West; SwissAlps) under similarly increasing temper-atures.
Fig. 2.4: Degree days until bud burstin 14 tree species under short and longphotoperiod treatments simulating futurespring conditions (mean ± SD). Thedegree-days experienced the samplingsites before sampling at high and low el-evation sites along two elevational gradi-ents (East and West; Swiss Alps) is indi-cated.

2 Photoperiod sensitivity of bud burst in temperate tree species 25
Table 2.3: Results of the split-split plot ANOVAs for the degree-days until bud burst(temperature sum > 0 ◦C since 1 January) for the 14 tree species included in the ex-periment. The table shows p-values of F-tests, bold values are statistically significant(p < 0.05).
Species Photoperiod Region P×R Elevation P×E R×E P×R×E
early successional native speciesAcer 0.410 0.001 0.526 0.880 0.732 <0.001 0.963Betula 0.404 0.001 0.239 <0.001 0.344 <0.001 0.286Corylus 0.316 0.212 0.157 <0.001 0.411 0.011 0.510Fraxinus 0.171 0.036 0.250 <0.001 0.346 0.006 0.244Larix 0.961 0.483 0.177 0.061 0.224 0.008 0.196Prunus 0.451 - - 0.001 0.534 - -Sorbus 0.907 0.018 0.846 <0.001 0.400 0.003 0.537
late successional native speciesAbies 0.034 0.018 0.029 <0.001 0.208 0.090 0.207Fagus 0.033 0.094 0.061 <0.001 0.612 0.002 0.142Picea 0.043 0.094 0.139 0.032 0.005 0.651 0.585Quercus 0.048 0.018 0.014 <0.001 0.347 0.252 0.420Tilia 0.062 - - 0.003 0.365 - -
exotic, ornamental speciesAesculus 0.588 0.003 0.607 - - - -Syringa 0.783 0.011 0.761 - - - -
P: photoperiod, R: region, E: elevation
Discussion
This screening for interactive responses of bud burst to photoperiod, tem-perature and provenance, using cuttings of adult trees revealed both, ge-netic as well as environment induced effects. Applying as realistic as pos-sible combinations of dynamic temperature and photoperiod conditions,the study permitted a clear ranking of species in terms of photoperiod con-trol of spring development (as opposed to temperature-only control). In thefollowing we will discuss the observed photoperiod and non-photoperiodrelated responses and their implication for phenology in a warmer climatein future.

26 Chapter 2
Photoperiod sensitive species
A delayed bud burst in response to a short photoperiod was observed herein the five late successional species A. alba, P. abies, F. sylvatica, Q. pe-traea and T. cordata. In these species, photoperiod influenced bud burstdespite a high degree of preceding chilling. Our results thereby confirmthe photoperiod sensitivity of fully chilled buds, as was previously evi-denced only in seedlings and cuttings of Fagus (Kramer 1936, Wareing1953, Heide 1993b, Caffarra and Donnelly 2010) and seedlings of Picea(Partanen et al. 1998), while such photoperiod sensitivity has not yet beendescribed in A. alba and Q. petraea. In Quercus, photoperiod sensitivitywas observed previously in seedlings of the deciduous Q. faginea, but notin the co-occurring, evergreen Q. ilex subsp. ballota in Spain (Sanz-Perezet al. 2009). In Tilia, the marginally significant trend to earlier bud burstof fully chilled buds under our dynamic long photoperiods, challengesthe earlier finding that photoperiod sensitivity of this species is limitedto insufficiently chilled plants, as was observed in rooted cuttings underconstant long photoperiod (16 h vs. 8 h; Caffarra and Donnelly 2010).
Photoperiod insensitive species
As expected, neither of the two species of exotic origin, Aesculus and Sy-ringa, was found to be photoperiod sensitive. Also cuttings of early suc-cessional (Acer, Betula, Corylus, Larix, Prunus, Sorbus) and intermediatesuccessional species (Fraxinus) revealed no measurable photoperiod re-sponse. Our finding for Sorbus are consistent with those by Heide (1993a)and suggest a general, photoperiod independent control of dormancy forthis species, given that this species also shows a weak photoperiod in-fluence on autumnal dormancy induction (Wareing 1956, Heide 2011).In the fully chilled cuttings of Betula, the absence of a photoperiod ef-fect under our treatment conditions matches observations by Myking andHeide (1995) and Caffarra et al. (2011). These authors reported photope-riod sensitivity in Betula when chilling was incomplete. Our findings inCorylus, also belong to the Betulaceae, and Prunus however, are inconsis-tent with previous observations: in cuttings of Corylus, a 24 h photoperiodadvanced bud burst by 2–3 days compared to an 8 h photoperiod, even af-

2 Photoperiod sensitivity of bud burst in temperate tree species 27
ter extensive chilling until mid March and treatment conditions of 21 ◦C,which may be considered as rather extreme test conditions (Heide 1993a).In Prunus, a 16 h photoperiod advanced bud burst in rooted cuttings frommature trees compared to seedlings, whereas no such difference was foundin a 12 h photoperiod (Besford et al. 1996). We were not able to detect aphotoperiod effect under our realistically small contrasts in photoperiod(ca. 90 min only), indicating that such an effect, is too weak to materializeunder daylength and temperature conditions as they actually occur at oursampling latitude in spring. However, it cannot be excluded that our initialshort photoperiod of 9.5 h was already beyond a potential short photope-riod threshold to break endodormancy under the temperatures employed,nor exclude that cuttings do not reveal the full response (Section 4.5).
Ecotypic responses
Ecotypic photoperiod responses
Strong heritability of the timing of dormancy release and a considerablevariation among provenances of a species under common growing condi-tions, as observed here, has been frequently evidenced in broad forest treetransplant experiments (e.g., Engler 1905, Burger 1926, but see reviewsby Langlet 1971, Morgenstern 1996 and references therein). In contrast,some common garden (Vitasse et al. 2009b)/modelling studies (Chuine etal. 2000) arrived at similar temperature sensitivity of spring phenophasesin seedlings of geographically separated populations from low temperatelatitudes (southern France), which led the authors to conclude that localadaptation plays only a minor role for phenology under climate warming.
While common garden experiments are excellent tools to assess overallprovenance responses under a common climate, it remains difficult to sep-arate thermal responses from photoperiodic responses because both maybe ecotypic. For the induction of dormancy, photoperiod ecotypes havebeen evidenced in many species (Klebs 1914, Vaartaja 1959, Thomas andVince-Prue 1997, Li et al. 2003, Böhlenius et al. 2006), hence, photope-riod ecotypes may also be expected in dormancy release, although the con-trols of dormancy release are much more complex. However, among thephotoperiod sensitive species examined here, such an ecotypic photope-

28 Chapter 2
riod effect with elevation was found in Picea only. This species showedlater bud burst under short photoperiods in the high elevation cuttingscompared to those from low elevation. In the cuttings of Abies and Quer-cus the more pronounced photoperiod responses in the eastern prove-nances may relate to selective effects of the extreme ‘foehn’ wind in thisarea, causing exceptionally warm episodes in late winter/early spring, of-ten followed by late freezing. In Fagus and Tilia however, we found a sim-ilar photoperiod effect across the different regions and elevations. For Fa-gus, this is in agreement with the similar responses to photoperiod in fourlatitudinal ecotypes (47◦ 59′ N) observed by Heide (1993b), who testedcuttings sampled from four regions in mid March with constant photope-riods between 8 and 16 h and under a warm 21 ◦C temperature regime.Given that Fagus has been shown to have a very large chilling require-ment (Murray et al. 1989), the actual weight of photoperiod and chillingfor the response to follow-up warm temperatures may depend on localweather conditions.
Ecotypic thermal responses
Besides photoperiod ecotypes, provenances may also exhibit heritablethermal responses, the current experiment was not primarily designedto assess. Such provenance-specific thermal responses are most promi-nently demonstrated by the remarkable elevation-independent (and hencetemperature-pre-history independent) variation of bud burst observed herein the photoperiod insensitive species Acer pseudoplatanus (Fig. 2.4), aspecies known for its strong provenance variation in the time of bud burst(Engler 1905, Vitasse et al. 2009a). In most other species assessed here,the high elevation cuttings opened their buds later than the low elevationcuttings under similar temperature and photoperiod conditions (Fig. 2.3).However, contrary to classical common garden experiments, the cuttingsused here have not experienced the whole period of dormancy under sim-ilar climatic conditions, hence our results may also reflect the contrastingnatural pre-history in the field. Obviously, the low elevation trees haveexperienced higher temperatures before sampling than the high elevationtrees (Fig. 2.2). Although the buds appeared dormant (unswollen) at sam-pling, buds from low elevation might still have been at a slightly advanceddevelopmental stage, in favor of an earlier bud burst. Hence, similar re-

2 Photoperiod sensitivity of bud burst in temperate tree species 29
sponses under the same controlled conditions under otherwise substan-tially different natural pre-history may mask differences that might havebeen seen when provenances had been exposed to an identical pre-history,as irrelevant this would be from an ecological point of view.
Under our treatment conditions, high elevation cuttings open their budslater, however, at less of degree-days than low elevation cuttings (degree-days in situ since 1 January to sampling and treatment degree-days untilbud burst; Fig. 2.4). Similarly, a lower thermal requirement for bud burstof high elevation provenances has also been found in common gardensexperiments with Fagus (Hjelmqvist 1940, von Wuehlisch et al. 1995,Chmura and Rozkowski 2002, Vitasse et al. 2009a) and Picea (Engler1905, Burger 1926, Worrall 1983) and some other species (Acevedo- Ro-driguez et al. 2006). Consequently, a lower thermal threshold for bud burst,as was also observed here, was suggested for high elevation provenancesof these species (Worrall 1983, von Wuehlisch et al. 1995). In Piceahowever, seemingly inconsistent results have been found in common gar-den experiments: Burger (1926) observed consistent earlier bud burst ofyoung trees (9–15 years) from high elevation grown at 380 m, 670 m and1880 m a.s.l., with a more pronounced difference in higher elevation gar-dens. In a large provenance trial at low elevation (226 m a.s.l.) however,no such trend were observed in Picea seedlings, whereas even a reversedtrend was observed in young trees (> 9 years; Holzer and Nather 1974).These differences may have been introduced by the enhanced photope-riod sensitivity of the high elevation ecotypes of this species as observedhere. The reverse trend, that is earlier bud burst of low elevation prove-nances (and thus at less degree-days) was also found in seedlings of P.avium (Besford et al. 1996) and Q. petraea (Vitasse et al. 2009a, Albertoet al. 2011). Our observed opposite elevational pattern in the degree-daysat bud burst in these species may also have been caused by species specifictemperature thresholds for the progression of development, which may behigher than the 0 ◦C daily base temperature used here for degree day cal-culation. Higher thresholds would reduce the weight of the mostly coolpre-sampling temperatures in situ (Fig. 2.2) and may thus counterbalancethe elevational effects on the degree-days observed here. However, also incommon garden studies the presence or direction of elevational tends ofbud burst under similar climatic conditions seems to be strongly speciesspecific and may be influenced by age of the plant material used (seedlingvs. mature tree) and climate (elevation) of the garden. Furthermore, eco-
30 Chapter 2
typic elevational trends may be missing because of high within-populationvariance of bud burst or because elevation is confounded with latitude inthe different studies.
Ecological advantage of photoperiod sensitivity
The obvious ecological advantage of photoperiod sensitivity is the reducedrisk of freezing damage in new, but premature tissue. Thus, species spe-cific differences are likely to be related to seasonal freezing risk in thespecies’ natural habitat and to the species’ life history. In contrast to thephotoperiod sensitive late successional species, early successional speciescommonly reach bud burst as soon as temperatures permit, without pro-nounced chilling and photoperiod requirements. This opportunistic behav-ior will lengthen the active growing season, while enhancing the risk offreezing damage. In the photoperiod sensitive species however, photope-riod seems to be modulating the response to concurrent warm temper-atures guiding bud burst into a ‘safer’ period. Longer photoperiods maythus either decrease the thermal requirement for bud burst, or (more likely)speed up development at a given temperature. The generally late bud burstof ring-porous species however, as observed here in photoperiod insen-sitive Fraxinus (holding an intermediate successional position), but alsoin the late successional Quercus), may be additionally associated with aslower reactivation of water supply by a new layer of xylem before budburst, given that these species lose most of the hydraulic conductivitythrough embolism during winter (Sperry et al. 1994).
Methodical considerations
Photoperiod experiments with trees face two problems related to tree sizeand the known differences between young life stages compared to olderlife stages (Ununger et al. 1988, Besford et al. 1996, Partanen et al. 2001).In situ photoperiod manipulation on mature trees, without affecting ther-mal conditions and allowing for appropriate replication, is constrainedby tree size and the dose-independency of the photoperiod signal which

2 Photoperiod sensitivity of bud burst in temperate tree species 31
would require absolute light-tight darkening of whole trees during theearly/late parts of the day, should the effect of warmer temperature betested at shorter photoperiods. Alternatively, growth chamber experimentsare always limiting plant size, such that only small saplings or cuttings(cut twigs) of mature trees can be used. While saplings, in contrast to ma-ture trees, are known to exhibit a more opportunistic behavior concerningbud burst (understory trees flush before canopy trees, utilizing light beforethe canopy closes; Uemura 1994, Augspurger and Bartlett 2003, Richard-son and O’Keefe 2009), cuttings are, per definition, disconnected fromwhole-tree (hormonal) signals potentially affecting bud burst. In some treespecies cuttings may respond quite autonomously and thus, can serve as anappropriate substitute for mature trees in growth chamber studies, whereasin other (unknown) cases, cuttings will not reflect whole tree responses.The direction of artifact is unpredictable, but delays in phenology may beexpected in processes related to xylem pressure and tissue turgor and rootplus whole crown hormonal signals. We assume that the sum of these lim-itations leads to a conservative picture of photoperiod signals in cuttingscompared to whole tree responses. Hence many of the observed patternsmay indicate direction, rather than the full signal strength that would onlybe seen in a whole tree approach.
Conclusions
The observed photoperiod sensitivity in late successional tree species,demonstrates that spring phenology of most of the observed late succes-sional tree species is not driven by temperature alone, even after expe-riencing substantial (natural) chilling. In a future climate with warmersprings, photoperiod will become an increasingly important factor for con-straining the timing of spring phenology when warmer weather conditionsare accelerating development (earlier bud burst) toward genetic photope-riod thresholds. Combined with reduced chilling in milder, low elevationwinters, some late successional species are likely not to continue track-ing the actual (warmer) temperatures as they currently still do. Our re-sults evidence the considerable photoperiod influence on bud burst at oth-erwise weak indications for ecotypic differentiation. Our results suggestthat photoperiod plays only a minor role in early successional species.
32 Chapter 2
Since phenology of trees can be expected to have been selected for ef-ficient use of the growing-season, different photoperiod and temperaturesensitivities among species or genotypes are likely to affect the successof species in a warmer climate. The selection for new photoperiod geno-types will take several tree-generations (> 100 years). The results obtainedhere in cuttings of adult trees are likely to underestimate the actual signif-icance of photoperiod for spring phenology. Taken together, the exper-imental evidence for spring phenology presented here, warns at scalingtrends observed in the recent past into a warmer future by accountingfor temperature only. Such extrapolations need to account for tempera-ture× photoperiod interactions in mature, late successional trees.
Acknowledgements We would like to thank Georges Grun for the technical supportduring the growth chamber experiment.
This project was funded by Velux-Foundation and supported by NCCR-climate ofthe Swiss Science Foundation.
References
Acevedo-Rodriguez R, Vargas-Hernandez JJ, Lopez-Upton J, Mendoza JV (2006) Ef-fect of geographic origin and nutrition on shoot phenology of Mexican Douglas-fir(Pseudotsuga sp.) seedlings. Agrociencia 40 (1): 125–137.
Alberto F (2011) Adaptive responses for seed and leaf phenology in natural populationsof sessile oak along an altitudinal gradient. J. Evol. Biol. 24 (7): 1442–1454.
Augspurger CK, Bartlett EA (2003) Differences in leaf phenology between juvenileand adult trees in a temperate deciduous forest. Tree Physiol. 23 (8): 517–525.
Battey NH (2000) Aspects of seasonality. J. Exp. Bot. 51 (352): 1769–1780.Bennie J, Kubin E, Wiltshire A, Huntley B, Baxter R (2010) Predicting spatial and
temporal patterns of bud-burst and spring frost risk in north-west Europe: the impli-cations of local adaptation to climate. Glob. Change Biol. 16 (5): 1503–1514.
Besford RT, Hand P, Richardson CM, Peppitt SD (1996) Photoperiod effect on budburst in Prunus is phase dependent: significance for early photosynthetic develop-ment. Tree Physiol. 16 (5): 491–496.
Böhlenius H, Huang T, Charbonnel-Campaa L, Brunner AM, Jansson S, Strauss SH,Nilsson O (2006) CO/FT regulatory module controls timing of flowering and sea-sonal growth cessation in trees. Science 312 (5776): 1040–1043.
Burger H (1926) Untersuchungen über das Höhenwachstum verschiedener Holzarten.Mitt. Schweiz. Centralanstalt Forstl. Versuchswesen 14 (1): 29–158.
2 Photoperiod sensitivity of bud burst in temperate tree species 33
Caffarra A, Donnelly A (2010) The ecological significance of phenology in four differ-ent tree species: effects of light and temperature on bud burst. Int. J. Biometeorol.55 (5): 711–721.
Caffarra A, Donnelly A, Chuine I, Jones MB (2011) Modelling the timing of Betulapubescens budburst. I. Temperature and photoperiod: a conceptual model. Clim.Res. 46 (2): 147–157.
Campbell RK, Sugano, AI (1975) Phenology of bud burst in Douglas-fir related toprovenance, photoperiod, chilling, and flushing temperature. Bot. Gaz. 136 (3): 290–298.
Cannell MGR (1989) Chilling, thermal time and the date of flowering of trees. In:Wright CJ (Ed.), Manipulation of Fruiting. Butterworths, London, UK, pp. 99–113.
Chmura DJ, Rozkowski R (2002) Variability of beech provenances in spring and au-tumn phenology. Silvae Genet. 51 (2-3): 123–127.
Chuine I, Belmonte J, Mignot A (2000) A modelling analysis of the genetic variationof phenology between tree populations. J. Ecol. 88 (4): 561–570.
Defila C (1991) Pflanzenphänologie der Schweiz. Veröffentlichungen der Schweiz. Me-teorologischen Anstalt 50, Schweizerische Meteorologische Anstalt, Zürich.
Defila C, Clot B (2001) Phytophenological trends in Switzerland. Int. J. Biometeorol.45 (4): 203–207.
Engler A (1905) Einfluss der Provenienz des Samens auf die Eigenschaften der forst-lichen Holzgewächse. Mitt. Schweiz. Centralanstalt Forstl. Versuchswesen 8: 81–236.
Erez A, Couvillon GA (1987) Characterization of the influence of moderate tempera-tures on rest completion in Peach. J. Am. Soc. Hort. Sci. 112 (4): 677–680.
Falusi M, Calamassi R (1990) Bud dormancy in beech (Fagus sylvatica L.). effect ofchilling and photoperiod on dormancy release of beech seedlings. Tree Physiol. 6(4): 429–438.
Heide OM (1993a) Daylength and thermal time responses of budburst during dormancyrelease in some northern deciduous trees. Physiol. Plant. 88 (4): 531–540.
Heide OM (1993b) Dormancy release in beech buds (Fagus sylvatica) requires bothchilling and long days. Physiol. Plant. 89 (1): 187–191.
Heide OM (2003) High autumn temperature delays spring bud burst in boreal trees,counterbalancing the effect of climatic warming. Tree Physiol. 23 (13): 931–936.
Heide OM (2011) Temperature rather than photoperiod controls growth cessation anddormancy in Sorbus species. J. Exp. Bot. 62 (15): 5397–5404.
Hjelmqvist H (1940) Studien über die Abhängigkeit der Baumgrenzen von den Tem-peraturverhältnissen unter besonderer Berücksichtigung der Buche und ihrer Kli-marassen. Carl Bloms Buchdruckerei, Lund.
Holzer K, Nather J (1974) The identification of forest reproductive material. In: 100Jahre Forstliche Versuchsanstalt. Forstliche Bundesversuchsanstalt, Wien, pp. 13–42.
Kalcsits LA, Silim S, Tanino K (2009) Warm temperature accelerates short photo-period-induced growth cessation and dormancy induction in hybrid poplar (Populus× spp.). Trees-Struct. Funct. 23 (5): 971–979.

34 Chapter 2
Klebs G (1903) Willkürliche Entwickelungsänderungen bei Pflanzen. Gustav FischerVerlag, Jena.
Klebs G (1914) Über das Treiben der einheimischen Bäume, speziell der Buche. Ab-handl. der Heidelberger Akad.d. Wiss. (Math. Nat. Kl) 3 (1).
Körner C (2007) Significance of temperature in plant life. In: Morison JIL, MorecroftMD (Eds.), Plant Growth and Climate Change. Blackwell Publishing Ltd., Oxford,pp. 48–69.
Körner C, Basler D (2010) Phenology under global warming. Science 327 (5972):1461–1462.
Kramer PJ (1936) Effect of variation in length of day on growth and dormancy of trees.Plant Physiol. 11 (1): 127–137.
Langlet O. (1971) Two hundred years genecology. Taxon 20 (5/6): 653–721.Menzel A, Sparks TH, Estrella N, Koch E, Aasa A, Ahas R, Alm-Kubler K, Bissolli P,
Braslavska O, Briede A, Chmielewski FM, Crepinšek Z, Curnel Y, Dahl A, DefilaC, Donnelly A, Filella Y, Jatcza K , Mage F, Mestre A, Nordli O, Penuelas J, PirinenP, Remisova V, Scheifinger H, Striz M, Susnik A, Van Vliet AJH, Wielgolaski FE,Zach S, Zust A (2006) European phenological response to climate change matchesthe warming pattern. Glob. Change Biol. 12: 1969–1976.
Larcher W (2006) Altitudinal variation in flowering time of lilac (Syringa vulgaris L.)in the Alps in relation to temperatures. Sitzber. Anzeiger Math.-Nat. Kl. Jg. 212:3–18.
Larcher W, Kainmueller C, Wagner J (2010) Survival types of high mountain plantsunder extreme temperatures. Flora 205 (1): 3–18.
Li CY, Junttila O, Ernstsen A, Heino P, Palva ET (2003) Photoperiodic control ofgrowth, cold acclimation and dormancy development in silver birch (Betula pen-dula) ecotypes. Physiol. Plant. 117 (2): 206–212.
Menzel A (2006) European phenological response to climate change matches thewarming pattern. Glob. Change Biol. 12 (10): 1969–1976.
Morgenstern EK (1996) Geographic Variation in Forest Trees: Genetic Basis and Ap-plication of Knowledge in Silviculture. UBC Press, Vancouver.
Morin X, Roy J, Sonie L, Chuine I (2010) Changes in leaf phenology of three Europeanoak species in response to experimental climate change. New Phytol. 186 (4): 900–910.
Murray MB, Cannell MGR, Smith RI (1989) Date of budburst of 15 tree species inBritain following climatic warming. J. Appl. Ecol. 26 (2): 693–700.
Myking T (1997) Effects of constant and fluctuating temperature on time to budburstin Betula pubescens and its relation to bud respiration. Trees-Struct. Funct. 12 (2):107–112.
Myking T, Heide OM (1995) Dormancy release and chilling requirement of buds oflatitudinal ecotypes of Betula pendula and B. pubescens. Tree Physiol. 15 (11): 697–704.
Nienstaedt H (1967) Chilling requirements in seven Picea species. Silvae Genet. 16:65–68.

2 Photoperiod sensitivity of bud burst in temperate tree species 35
Nienstaedt H (1974) Degree day requirements for bud flushing in white spruce: vari-ation and inheritance. In: Proceedings, 8th Central States Forest Tree ImprovementConference Aug 1972. Univ. of Missouri, Columbia, pp. 28–32.
Parmesan C, Yohe G (2003) A globally coherent fingerprint of climate change impactsacross natural systems. Nature 421 (6918): 37–42.
Partanen J, Koski V, Hänninen H. (1998) Effects of photoperiod and temperature on thetiming of bud burst in Norway spruce (Picea abies). Tree Physiol. 18 (12): 811–816.
Partanen J, Leinonen I, Repo T (2001) Effect of accumulated duration of the lightperiod on bud burst in Norway spruce (Picea abies) of varying ages. Silva Fenn. 35(1): 111–117.
Perry TO (1971) Dormancy of trees in winter. Science 171 (3966): 29–36.R Development Core Team (2010) R: A Language and Environment for Statistical
Computing. R Foundation for Statistical Computing, Vienna, Austria.Richardson AD, O’Keefe J (2009). Phenological differences between understory and
overstory: a case study using the long-term Harvard Forest records. In: Noormets A(Ed.), Phenology of Ecosystem Processes, Springer, New York, pp. 87–117.
Samish RM (1954) Dormancy in woody plants. Annu. Rev. Plant Physiol. Plant Mol.Biol. 5: 183–204.
Sanz-Perez V, Castro-Diez P, Valladares F (2009) Differential and interactive effects oftemperature and photoperiod on budburst and carbon reserves in two co-occurringMediterranean oaks. Plant Biol. 11 (2): 142–151.
Saxe H, Cannell MGR, Johnsen B, Ryan MG, Vourlitis G (2001) Tree and forest func-tioning in response to global warming. New Phytol. 149 (3): 369–399.
Sperry JS, Nichols KL, Sullivan JEM, Eastlack SE (1994) Xylem embolism in ring-porous, diffuse-porous, and coniferous trees of northern Utah and interior Alaska.Ecology 75 (6): 1736–1752.
Tateno M (2003) Benefit to N2-fixing alder of extending growth period at the cost ofleaf nitrogen loss without resorption. Oecologia 137 (3): 338–343.
Thomas B, Vince-Prue D (1997) Photoperiodism in Plants. Academic Press, London.Uemura S (1994) Patterns of leaf phenology in forest understory. Can J. Bot.-Rev. Can.
Bot. 72 (4): 409–414.Ununger J, Ekberg I, Kang H (1988). Genetic control and age-related changes of juve-
nile growth characters in Picea abies. Scand. J. Forest Res. 3 (1–4): 55–66.Vaartaja O (1959). Evidence of photoperiodic ecotypes in trees. Ecol. Monogr. 29 (2):
91–111.Vitasse Y, Delzon S, Bresson CC, Michalet R, Kremer A (2009a) Altitudinal differen-
tiation in growth and phenology among populations of temperate-zone tree speciesgrowing in a common garden. Can. J. For. Res.-Rev. Can. Rech. For. 39 (7): 1259–1269.
Vitasse Y. (2009b) Leaf phenology sensitivity to temperature in European trees: dowithin-species populations exhibit similar responses? Agric. For. Meteorol. 149 (5):735–744.

36 Chapter 2
von Wuehlisch G, Krusche D, Muhs HJ (1995) Variation in temperature sum require-ment for flushing of beech provenances. Silvae Genet. 44 (5/6), 343–346.
Wareing PF (1953) Growth studies in woody species. 5. Photoperiodism in dormantbuds of Fagus sylvatica L. Physiol. Plant. 6 (4): 692–706.
Wareing PF (1956) Photoperiodism in woody plants. Annu. Rev. Plant Physiol. PlantMol. Biol. 7: 191–214.
Worrall J (1975) Provenance and clonal variation in phenology and wood properties ofNorway spruce. Silvae Genet. 24 (1): 2–5.
Worrall J (1983) Temperature–bud-burst relationships in amabilis and subalpine firprovenance tests replicated at different elevations. Silvae Genet. 32 (5/6): 203–209.
2 Photoperiod sensitivity of bud burst in temperate tree species 37
Supplementary material


Chapter 3Photoperiod and temperature responses ofbud swelling and bud burst in fourtemperate forest tree species
David Basler, Christian Körner
Abstract Spring phenology of temperate forest trees is optimized to max-imise the length of the growing season while minimizing the risk for freez-ing damage. The release from winter dormancy is environmentally medi-ated by species-specific responses to temperature and photoperiod. Weinvestigated the response of early spring phenology to temperature andphotoperiod at different stages of dormancy release in cuttings from fourtemperate tree species in controlled environments. By tracking bud devel-opment, we were able to identify the onset of bud swelling and bud growthin Acer pseudoplatanus L., Fagus sylvatica L., Quercus petraea (Mat-tuschka) Liebl. and Picea abies (L.) H. Karst. At a given early stage ofdormancy release, the onset and duration of the bud swelling prior to budburst is driven by concurrent temperature and photoperiod, while the max-imum growth rate is temperature dependent only, except for Fagus, wherelong photoperiods also increased bud growth rates. Similarly, the later budburst was controlled by temperature and photoperiod (in the photoperiodsensitive species Fagus, Quercus and Picea). We conclude that photope-riod is involved in the release of dormancy during the ecodormancy phaseand may influence bud burst in trees that experienced sufficient chilling.This study explored and documented the early bud swelling period thatprecedes and defines later phenological stages such as canopy greening inconventional phenological works. It is the early bud growth resumptionthat needs to be understood in order to arrive at a causal interpretation
Original article published in Tree Physiology 34:377-88
39
40 Chapter 3
and modelling of tree phenology at large scale. Classical spring phenol-ogy events mark visible endpoints of a cascade of processes as evidencedhere.
Key words: Day length, Deciduous trees, Development, Phenology,Warming
Introduction
Trees in temperate and boreal climates undergo a period of dormancy andenhanced freezing resistance to withstand the harsh climate conditionsduring winter. The phenological events that coincide with induction andrelease of dormancy (bud set and bud burst) are finely tuned to the sea-sonality of the tree’s environment, minimizing the risk of potentially fatalfreezing damage in autumn and spring, while maximising the length of thegrowing season. A well timed phenology is crucial for long-term survival,successful reproduction and species persistence (Larcher 2003).
Plant dormancy is characterized by suspension of growth and develop-ment (Samish 1954) that is, suppressed cell division and a strongly re-duced metabolism. Three different states of dormancy are distinguished(Lang et al. 1987): (1) endodormancy, an internal, (genetically controlled)set state of inactivity, (2) ecodormancy, a state of inactivity imposed byunfavourable environmental conditions and (3) paradormancy, a state ofspecific bud dormancy maintained due to physiological factors outside thedormant meristems (e.g. correlative inhibition and apical dominance). Thephenological changes that occur when plants perceive the environmentalsignals for the induction and release of dormancy are associated with phys-iological responses including phytohormones, phytochrome, and carbo-hydrates (Chao et al. 2007). The gradual transitions between the differentphases of dormancy involve numerous genetic, biochemical, physiologicaland anatomical alterations (Faust et al. 1997, Rinne et al. 1997, Horvath2010, Cooke et al. 2012). During the winter months, bud scales may growminutely (Perry 1971) and cell division in the apical meristems may con-tinue at low rates, but elongation growth is absent due to an inhibition ofthe sub-apical tissue (Romberger 1963).

3 Photoperiod and temperature responses of bud swelling and bud burst 41
In humid extra-tropical climates the induction and release of seasonaldormancy is triggered by environmental signals, mainly temperature andphotoperiod. In most temperate and boreal trees dormancy is induced bythe decreasing length of the photoperiod in autumn and cool temperatures,resulting in growth cessation and the formation of winter buds (Wareing1956, Vaartaja 1959, Thomas and Vince-Prue 1997). The astronomicallydefined photoperiod serves as a reliable environmental signal for the pro-gression of the season and may thus indicate the period with higher riskof freezing events in autumn before trees are actually exposed to suchtemperatures. Photoperiod and low temperature may induce dormancythrough independent pathways (Welling et al. 2002) and in a few species,low temperatures alone seem to be sufficient to induce endodormancy(Heide and Prestrud 2005, Heide 2011).
Once established, endodormancy ensures that growth will not be re-sumed during warm spells in winter. In tree species adapted to cool cli-mates, endodormancy is generally released after sufficiently long expo-sure to cool, non-freezing temperatures (‘chilling’; Perry 1971, Sarvas1974). Yet, the actual range of effective temperatures for chilling are onlyvaguely known for forest trees, and cool, non-freezing temperatures upto 10 ◦C, most likely between 2 and 4 ◦C are expected to be most effec-tive (Battey 2000). Higher temperatures may even negate previous chilling(Perry 1971), while lower (sub-zero) temperatures are generally consid-ered to be ineffective for the fulfilment of the chilling requirement, pre-sumably because very low temperatures prevent a physiological integra-tion of signals (too low metabolic activity). Once the chilling requirementis fulfilled, metabolic activity increases, hydrolytic enzymes are activatedand carbohydrate reserves gradually become mobilized. As a first visuallyidentifiable clue, the onset of bud swelling indicates that the transitionfrom endodormancy to ecodormancy has occurred (Saure 1985, Pallardy2008). The bud water content rises (Essiamah and Eschrich 1986) and thebuds are becoming increasingly susceptible to freezing. The subsequentrelease of ecodormancy is modulated by favourable environmental condi-tions. Bud burst of many short lived and pioneer species is then mediatedby warm temperatures only and buds burst occurs, when the accumulatedtemperature sum exceeds a genotype-specific threshold (forcing require-ment; degree days; Nienstaedt 1967, Perry 1971). Photoperiod sensitivityis most pronounced in Fagus sylvatica L. (Klebs 1914, Wareing 1953,Heide 1993b), but was also observed in other tree species (Heide 1993a,

42 Chapter 3
Partanen et al. 1998, Caffarra et al. 2011, Basler and Körner 2012). Al-ready 120 years ago, Jost (1894) observed a failure or major delay ofbud burst in Fagus on twigs subjected to complete darkness in-situ. Pho-toperiod controls of spring phenology were adopted mainly by long-lived,late successional tree species (Caffarra and Donnelly 2010, Körner andBasler 2010). Photoperiod may interact at different stages of dormancyrelease, e.g., long photoperiods are likely to substitute for a lack of chill-ing (Downs and Borthwick 1956, Wareing 1969, Heide 1993a) and a de-crease the thermal requirement for bud burst (Myking and Heide 1995,Caffarra et al. 2011). However, photoperiodic responses in spring phe-nology are highly species dependent and still not widely acknowledged,mostly due to the fact that species commonly operate within a photoperiod‘window’ in which temperature has an overwhelming effect, particularlyin cool years (Körner 2007). In a nutshell, the three potential environmen-tal drivers (chilling, photoperiod and temperature) of spring phenologyinteract in complex, species-specific ways, that await to be clearly disen-tangled.
In photoperiod-sensitive species, a delayed bud burst under short pho-toperiods may relate to a later onset of bud development or to slowerrates of bud development. In this study, we assessed the responses ofearly spring phenological phases (bud swelling and bud burst) to photope-riod at different temperatures during release from endodormancy in threephotoperiod-sensitive species (European beech Fagus sylvatica L., ses-sile oak Quercus petraea (Mattuschka) Liebl. and Norway spruce Piceaabies (L.) H.Karst.) and an assumingly photoperiod-insensitive species(sycamore maple Acer pseudoplatanus L.). We conducted growth cham-ber experiments using cuttings from mature trees after three consecutivesampling dates (presumed states of dormancy release) in late winter andearly spring. To account for possible ecotypic differentiation we sampledeach species in populations from two elevations and across two regions.We expected an earlier dormancy release and bud burst in warm temper-atures and a distinct delay of bud burst under shorter photoperiods in thelate successional species (Fagus, Quercus, Picea) assessed here.

3 Photoperiod and temperature responses of bud swelling and bud burst 43
Methods
Sampling Region
High and a low elevation sampling sites were defined along two el-evational gradients in the region of Chur (46.51 ◦N/9.51 ◦E, hereafternamed ‘eastern transect’) and Lavey (46.12 ◦N/7.02 ◦E, ‘western tran-sect’), Switzerland (for further details see Basler and Körner 2012). Theelevational difference between the high and low sampling sites was around500 m, which corresponds to a mean temperature difference of around 3 Kon both transects. In the year preceding the experiment, temperature log-gers (TidBit v2, Onset Computer Corporation, Bourne MA, USA) wereplaced at the sampling sites inside the forest in order to track the local airtemperatures (2 m above ground, shaded). The two regions were treatedas replicates of the elevational sampling for all further analysis (no cli-matic contrast based on our records). In order to avoid confusion betweentemperatures (◦C) and temperature differences, we join other authors inadopting K (for Kelvin) for all differences in temperature.
Sampling
During late winter/early spring 2010 cuttings of four species (Acer pseu-doplatanus L., Fagus sylvatica L., Quercus petraea (Mattuschka) Liebl.and Picea abies (L.) H.Karst.; in the following we refer to species by theirgenus name) were sampled three times (26/27 January, 1/2 March, 30/31March) on each of the four sampling sites. On each site, dormant twigsof five individual trees per species were sampled from the lower canopy(5 to 6 meters above ground, 5 twigs per tree) using a 4 m tree pruner(Fiskars, Helsinki, Finland). The twigs were immediately labelled, wa-tered, and transported to the Institute of Botany within 6 hours where theywere stored at 2 ◦C in the dark until sample preparation on the followingday (28 January, 3 March, 1 April).
44 Chapter 3
Sample treatment
Sample preparation was done according to the method described in Baslerand Körner (2012): the twigs were cut to a length of 30–40 cm, the lowerpart dipped into a disinfectant chlorine solution, re-cut a second time un-derwater at a steep angle using sterile branch scissors, and placed into 0.5 lglass bottles filled with 0.4 l cool, chlorine free tap water. During the ex-periment, the water was changed weekly and at the same time twigs werere-cut another 1–3 cm in order to assure good water supply.
Treatments
The treatments consisted of a fully reciprocal design of two temperaturestreatments (6 ◦C versus 9 ◦C daily mean temperature with a diurnal cy-cle with a 10 K amplitude, ±5 K day cycle) and photoperiods (initially9.2 h (SD) versus 10.8 h (LD), increased daily by the natural daily increaseof photoperiod at 46.5◦ N) assigned to four computer controlled growthcabinets (each 253 cm × 120 cm ×195 cm, Weiss Klimatechnik GmbH,Germany). The initial photoperiod resembled the natural photoperiod of25 January (SD) and 25 February (LD) at the sampling sites. The pho-toperiod in all treatments consisted of 8 hours high intensity light frommetal halide lamps (MF400LS/U, EYE Iwasaki Electric Co., Japan) pro-viding 506± 30 µmol m−2s−1 PFD (Red:FarRed 4.2) at plant level anda low PFD intensity extension period using incandescent lamps (ClassicA 100W, Osram AG, Munich, Germany) providing 42± 6 µmol m−2s−1
PFD (Red:FarRed 0.8). This low PDF extension to the desired photoperiodshould prevent a confounding between photoperiod and the dose of pho-ton flux received (Wareing 1953). An additional set of cuttings was placedin a warm greenhouse (> 21 ◦C) with long daylength (16 h) provided bymetal halide lamps to determine the time to bud burst under warm forcingconditions
3 Photoperiod and temperature responses of bud swelling and bud burst 45
Visual bud census
Bud development was observed in two day intervals, using a four-stagescale for bud development (dormant, swollen, bud burst, leaf unfolding).Bud burst was defined by the appearance of the first green leaf tip. Dueto the large number of samples (1200 twigs after the third sampling), weused a customized barcode system to efficiently accomplish the bud obser-vations: The samples were identified by a barcode-label and the visuallydetermined bud status was stored directly into a spreadsheet using a bar-coded scale for the state of bud development.
Tracking bud swelling and image analysis
Bud development until bud burst was tracked using image time seriesmade by scanning the twigs every 3 to 4 days using a commercial flatbedscanner (CanoScan LiDe 200, Canon, Tokyo, Japan; scanned at 300dpiresolution). Bud width, -length and -projected area were then extractedfrom the individual bud images using custom designed semi-automaticsoftware (by the author, written in python; www.python.org). A total of960 time series (∼10’000 images) was assembled; however, 234 time se-ries had to be excluded from further analysis, as no continuous observa-tion of the same bud on the twig was possible or the observed bud failedto burst.
The onset of bud swelling (λ ) and thus, the duration of the bud swellingperiod under our controlled temperature treatments, were determined asthe nonlinear least-squares estimates of a partially linear model fitted tothe individual bud measurement time series y(t):
log(y(t)) =
{yo (t < λ )
µmax(t−λ )+a (t ≥ λ )(3.1)
where t denotes time, yo is the fitted size of the dormant bud and µmaxthe fitted maximal bud growth rate. The parameter a was given as
a = ymax− log(eµmax(t−λ )+ eymax−yo −1) (3.2)
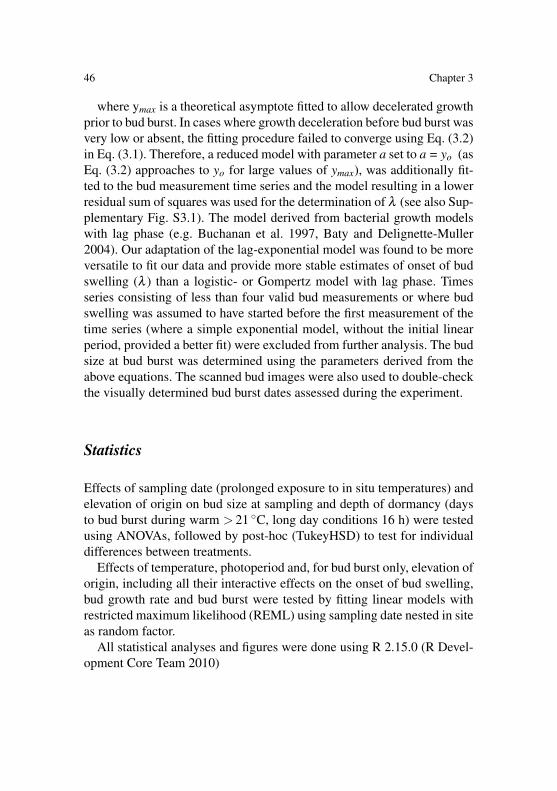
46 Chapter 3
where ymax is a theoretical asymptote fitted to allow decelerated growthprior to bud burst. In cases where growth deceleration before bud burst wasvery low or absent, the fitting procedure failed to converge using Eq. (3.2)in Eq. (3.1). Therefore, a reduced model with parameter a set to a = yo (asEq. (3.2) approaches to yo for large values of ymax), was additionally fit-ted to the bud measurement time series and the model resulting in a lowerresidual sum of squares was used for the determination of λ (see also Sup-plementary Fig. S3.1). The model derived from bacterial growth modelswith lag phase (e.g. Buchanan et al. 1997, Baty and Delignette-Muller2004). Our adaptation of the lag-exponential model was found to be moreversatile to fit our data and provide more stable estimates of onset of budswelling (λ ) than a logistic- or Gompertz model with lag phase. Timesseries consisting of less than four valid bud measurements or where budswelling was assumed to have started before the first measurement of thetime series (where a simple exponential model, without the initial linearperiod, provided a better fit) were excluded from further analysis. The budsize at bud burst was determined using the parameters derived from theabove equations. The scanned bud images were also used to double-checkthe visually determined bud burst dates assessed during the experiment.
Statistics
Effects of sampling date (prolonged exposure to in situ temperatures) andelevation of origin on bud size at sampling and depth of dormancy (daysto bud burst during warm > 21 ◦C, long day conditions 16 h) were testedusing ANOVAs, followed by post-hoc (TukeyHSD) to test for individualdifferences between treatments.
Effects of temperature, photoperiod and, for bud burst only, elevation oforigin, including all their interactive effects on the onset of bud swelling,bud growth rate and bud burst were tested by fitting linear models withrestricted maximum likelihood (REML) using sampling date nested in siteas random factor.
All statistical analyses and figures were done using R 2.15.0 (R Devel-opment Core Team 2010)
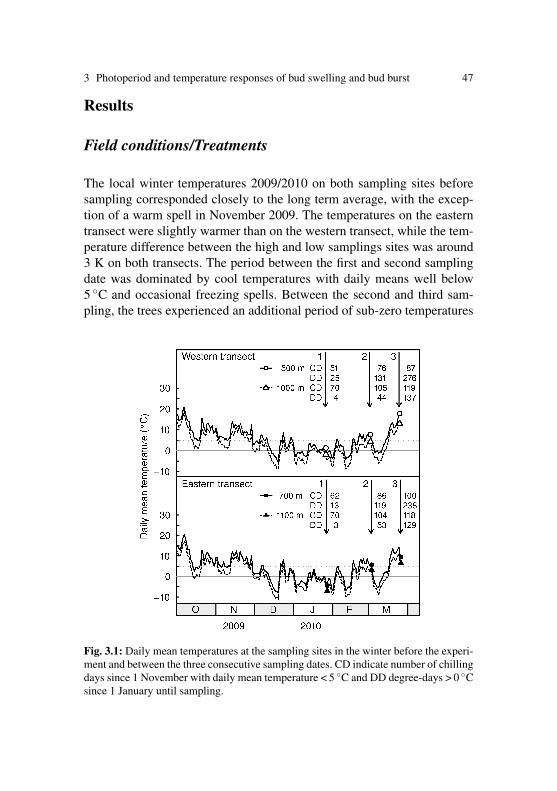
3 Photoperiod and temperature responses of bud swelling and bud burst 47
Results
Field conditions/Treatments
The local winter temperatures 2009/2010 on both sampling sites beforesampling corresponded closely to the long term average, with the excep-tion of a warm spell in November 2009. The temperatures on the easterntransect were slightly warmer than on the western transect, while the tem-perature difference between the high and low samplings sites was around3 K on both transects. The period between the first and second samplingdate was dominated by cool temperatures with daily means well below5 ◦C and occasional freezing spells. Between the second and third sam-pling, the trees experienced an additional period of sub-zero temperatures
Fig. 3.1: Daily mean temperatures at the sampling sites in the winter before the experi-ment and between the three consecutive sampling dates. CD indicate number of chillingdays since 1 November with daily mean temperature < 5 ◦C and DD degree-days > 0 ◦Csince 1 January until sampling.

48 Chapter 3
before the temperatures started to rise with daily means above 5 ◦C in sec-ond half of March (Fig. 3.1).
In the growth chambers, the treatment temperatures could be main-tained to near the set points with an overall mean temperature of 8.7±2.3 ◦C (short daylength, SD) and 8.7± 2.6 ◦C (long daylength, LD) inthe warm treatments and the 5.6± 2.2 ◦C (SD) and 5.7± 2.1 ◦C (LD) inthe cool treatments. During the whole experiment (96 days), temperaturesums were 829 degree-days (SD) and 822 degree-days (LD) in the warmtreatments, and 530 (SD) and 548 (LD) degree-days in the cool treatments.In the warm greenhouse, the mean temperature of the additional long dayforcing treatment was 22.6±2.8 ◦C (2158 degree-days).
Development of bud size and dormancy on sampling sites
In situ bud size during late winter and early spring was influenced byelevation of origin and sampling date (26/27 January, 1/2 March, 30/31March). At the first sampling date end of January, all sampled buds ap-peared to be fully dormant. Significantly larger buds were observed onlyat the last sampling end of March, indicating that bud swelling has alreadystarted under the local weather conditions at the sampling sites (Fig. 3.2).A significant increase of bud length, -width, and -projected area at thelast sampling was found in all four species, although in absence of an in-crease of bud width in Quercus. Against expectation, we observed also
Fig. 3.2: Mean (± SE) days to bud burst under forcing conditions (> 21 ◦C/16 h pho-toperiod) and bud size in four species at three consecutive sampling dates during win-ter/spring 2010. The figure shows pooled data over four sampling sites.
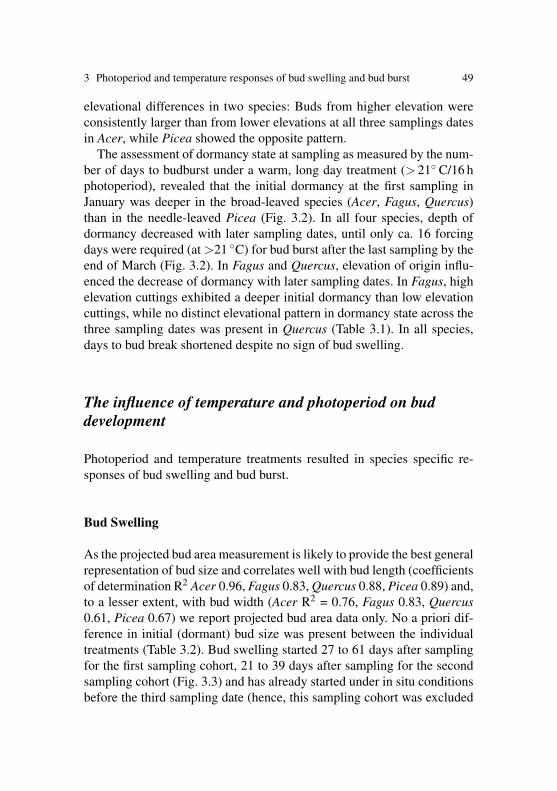
3 Photoperiod and temperature responses of bud swelling and bud burst 49
elevational differences in two species: Buds from higher elevation wereconsistently larger than from lower elevations at all three samplings datesin Acer, while Picea showed the opposite pattern.
The assessment of dormancy state at sampling as measured by the num-ber of days to budburst under a warm, long day treatment (> 21◦ C/16 hphotoperiod), revealed that the initial dormancy at the first sampling inJanuary was deeper in the broad-leaved species (Acer, Fagus, Quercus)than in the needle-leaved Picea (Fig. 3.2). In all four species, depth ofdormancy decreased with later sampling dates, until only ca. 16 forcingdays were required (at >21 ◦C) for bud burst after the last sampling by theend of March (Fig. 3.2). In Fagus and Quercus, elevation of origin influ-enced the decrease of dormancy with later sampling dates. In Fagus, highelevation cuttings exhibited a deeper initial dormancy than low elevationcuttings, while no distinct elevational pattern in dormancy state across thethree sampling dates was present in Quercus (Table 3.1). In all species,days to bud break shortened despite no sign of bud swelling.
The influence of temperature and photoperiod on buddevelopment
Photoperiod and temperature treatments resulted in species specific re-sponses of bud swelling and bud burst.
Bud Swelling
As the projected bud area measurement is likely to provide the best generalrepresentation of bud size and correlates well with bud length (coefficientsof determination R2 Acer 0.96, Fagus 0.83, Quercus 0.88, Picea 0.89) and,to a lesser extent, with bud width (Acer R2 = 0.76, Fagus 0.83, Quercus0.61, Picea 0.67) we report projected bud area data only. No a priori dif-ference in initial (dormant) bud size was present between the individualtreatments (Table 3.2). Bud swelling started 27 to 61 days after samplingfor the first sampling cohort, 21 to 39 days after sampling for the secondsampling cohort (Fig. 3.3) and has already started under in situ conditionsbefore the third sampling date (hence, this sampling cohort was excluded
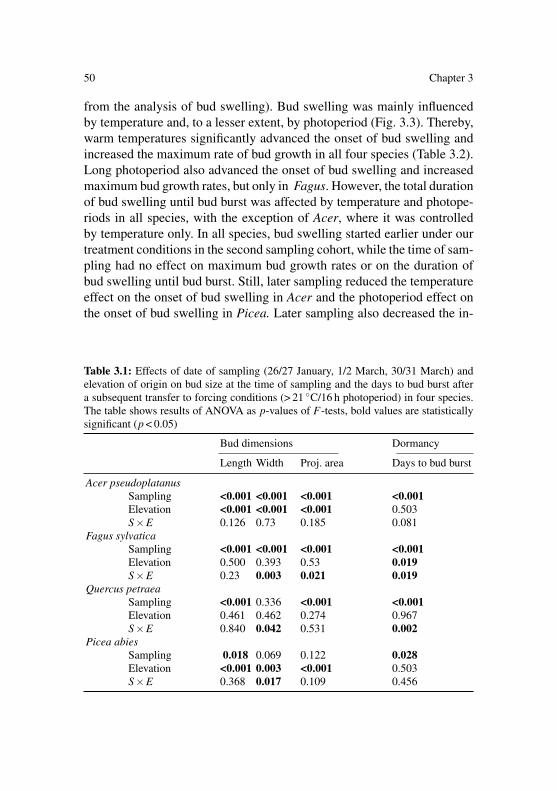
50 Chapter 3
from the analysis of bud swelling). Bud swelling was mainly influencedby temperature and, to a lesser extent, by photoperiod (Fig. 3.3). Thereby,warm temperatures significantly advanced the onset of bud swelling andincreased the maximum rate of bud growth in all four species (Table 3.2).Long photoperiod also advanced the onset of bud swelling and increasedmaximum bud growth rates, but only in Fagus. However, the total durationof bud swelling until bud burst was affected by temperature and photope-riods in all species, with the exception of Acer, where it was controlledby temperature only. In all species, bud swelling started earlier under ourtreatment conditions in the second sampling cohort, while the time of sam-pling had no effect on maximum bud growth rates or on the duration ofbud swelling until bud burst. Still, later sampling reduced the temperatureeffect on the onset of bud swelling in Acer and the photoperiod effect onthe onset of bud swelling in Picea. Later sampling also decreased the in-
Table 3.1: Effects of date of sampling (26/27 January, 1/2 March, 30/31 March) andelevation of origin on bud size at the time of sampling and the days to bud burst aftera subsequent transfer to forcing conditions (> 21 ◦C/16 h photoperiod) in four species.The table shows results of ANOVA as p-values of F-tests, bold values are statisticallysignificant (p < 0.05)
Bud dimensions Dormancy
Length Width Proj. area Days to bud burst
Acer pseudoplatanusSampling <0.001 <0.001 <0.001 <0.001Elevation <0.001 <0.001 <0.001 0.503S×E 0.126 0.73 0.185 0.081
Fagus sylvaticaSampling <0.001 <0.001 <0.001 <0.001Elevation 0.500 0.393 0.53 0.019S×E 0.23 0.003 0.021 0.019
Quercus petraeaSampling <0.001 0.336 <0.001 <0.001Elevation 0.461 0.462 0.274 0.967S×E 0.840 0.042 0.531 0.002
Picea abiesSampling 0.018 0.069 0.122 0.028Elevation <0.001 0.003 <0.001 0.503S×E 0.368 0.017 0.109 0.456

3 Photoperiod and temperature responses of bud swelling and bud burst 51
fluence of temperature on the duration of bud swelling in all species butFagus. No significant differences were observed for the bud size at budburst in neither species.
Table 3.2: Effects of temperature, photoperiod and sampling date (26/27 January, 1/2March; reflecting increased natural chilling) on the initial bud size (projected area;BSi), bud size before bud burst (BSBB), onset (λ ) and duration (tBS) of bud swellingand maximum growth rate (µmax). The table shows results of ANOVA as p-values ofF-tests, bold values are statistically significant (p< 0.05)
Bud swelling
BSi λ µmax BSBB tBS
Acer pseudoplatanusTemperature 0.605 <0.001 <0.001 0.109 <0.001Photoperiod 0.971 0.690 0.201 0.308 0.265Sampling 0.516 0.004 0.232 0.328 0.375T ×P 0.520 0.165 0.600 0.689 0.237T ×S 0.314 0.002 0.154 0.835 0.019P×S 0.699 0.450 0.411 0.250 0.266
Fagus sylvaticaTemperature 0.338 0.017 <0.001 0.543 <0.001Photoperiod 0.309 0.013 0.001 0.921 <0.001Sampling 0.052 <0.001 0.938 0.303 0.225T ×P 0.370 0.083 0.216 0.086 0.050T ×S 0.269 0.098 0.734 0.175 0.065P×S 0.164 0.943 0.901 0.266 0.316
Quercus petraeaTemperature 0.373 <0.001 <0.001 0.076 0.001Photoperiod 0.869 0.235 0.320 0.682 0.001Sampling 0.911 0.005 0.728 0.693 0.061T ×P 0.144 0.131 0.117 0.959 0.703T ×S 0.238 0.332 0.442 0.750 0.013P×S 0.621 0.595 0.525 0.728 0.993
Picea abiesTemperature 0.830 <0.001 <0.001 0.059 <0.001Photoperiod 0.353 0.240 0.079 0.683 <0.001Sampling 0.282 0.029 0.445 0.411 0.029T ×P 0.856 0.067 0.685 0.680 0.637T ×S 0.363 0.110 0.808 0.626 0.013P×S 0.143 0.024 0.301 0.356 0.540

52 Chapter 3
Fig. 3.3: Average bud growth from the onset of bud swelling until bud burst underdifferent temperature and photoperiod conditions of two consecutive sampling dates(26/27 January, 1/2 March). The underlying parameters were obtained by fitting a lag-exponential function to the individual bud size time series (see Methods). Error barsrepresent ± SE. The figure shows pooled data over four sampling sites.
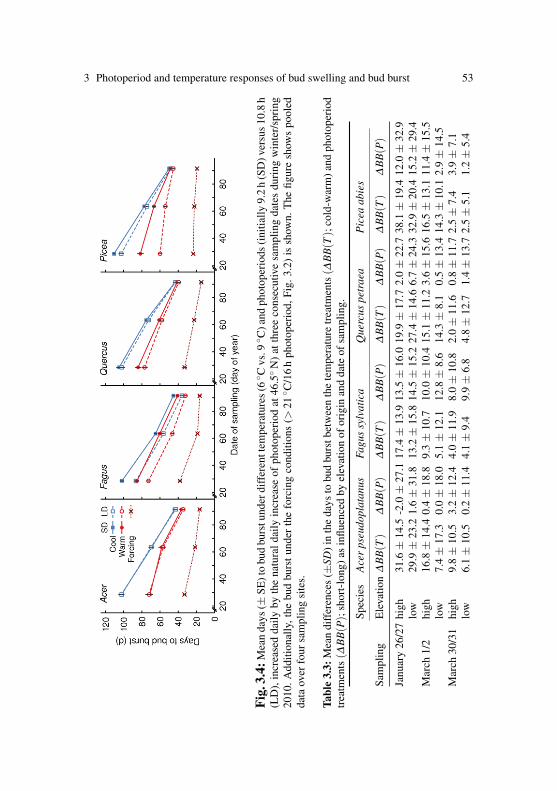
3 Photoperiod and temperature responses of bud swelling and bud burst 53
Fig.
3.4:
Mea
nda
ys(±
SE)t
obu
dbu
rstu
nder
diff
eren
ttem
pera
ture
s(6◦ C
vs.9◦ C
)and
phot
oper
iods
(ini
tially
9.2
h(S
D)v
ersu
s10.
8h
(LD
),in
crea
sed
daily
byth
ena
tura
ldai
lyin
crea
seof
phot
oper
iod
at46
.5◦
N)
atth
ree
cons
ecut
ive
sam
plin
gda
tes
duri
ngw
inte
r/sp
ring
2010
.Add
ition
ally
,the
bud
burs
tund
erth
efo
rcin
gco
nditi
ons
(>21◦ C
/16
hph
otop
erio
d,Fi
g.3.
2)is
show
n.T
hefig
ure
show
spo
oled
data
over
four
sam
plin
gsi
tes.
Tabl
e3.
3:M
ean
diff
eren
ces
(±SD
)in
the
days
tobu
dbu
rstb
etw
een
the
tem
pera
ture
trea
tmen
ts(∆
BB(T
);co
ld-w
arm
)and
phot
oper
iod
trea
tmen
ts(∆
BB(P);
shor
t-lo
ng)a
sin
fluen
ced
byel
evat
ion
ofor
igin
and
date
ofsa
mpl
ing.
Spec
ies
Ace
rps
eudo
plat
anus
Fagu
ssy
lvat
ica
Que
rcus
petr
aea
Pic
eaab
ies
Sam
plin
gE
leva
tion
∆B
B(T
)∆
BB(P)
∆B
B(T
)∆
BB(P)
∆B
B(T
)∆
BB(P)
∆B
B(T
)∆
BB(P)
Janu
ary
26/2
7hi
gh31
.6±
14.5
-2.0±
27.1
17.4±
13.9
13.5±
16.0
19.9±
17.7
2.0±
22.7
38.1±
19.4
12.0±
32.9
low
29.9±
23.2
1.6±
31.8
13.2±
15.8
14.5±
15.2
27.4±
14.6
6.7±
24.3
32.9±
20.4
15.2±
29.4
Mar
ch1/
2hi
gh16
.8±
14.4
0.4±
18.8
9.3±
10.7
10.0±
10.4
15.1±
11.2
3.6±
15.6
16.5±
13.1
11.4±
15.5
low
7.4±
17.3
0.0±
18.0
5.1±
12.1
12.8±
8.6
14.3±
8.1
0.5±
13.4
14.3±
10.1
2.9±
14.5
Mar
ch30
/31
high
9.8±
10.5
3.2±
12.4
4.0±
11.9
8.0±
10.8
2.0±
11.6
0.8±
11.7
2.5±
7.4
3.9±
7.1
low
6.1±
10.5
0.2±
11.4
4.1±
9.4
9.9±
6.8
4.8±
12.7
1.4±
13.7
2.5±
5.1
1.2±
5.4

54 Chapter 3
Bud burst
In all treatments and for all three sampling dates, some buds randomlyfailed to burst and desiccated before the end of the experiment. In general,we observed higher bud burst percentages in the diffuse porous speciesAcer (92%) and Fagus (98%), and a lower percentage in the ring porousQuercus (79 %) and the coniferous Picea (80%). In the latter species budburst failed most likely due to conduit failure in cuttings’ xylem duringthe experiment, despite our precautional re-cutting and exchange of water.
The time of bud burst, the most striking phenological event in spring,was significantly influenced by date of sampling, temperature and pho-toperiod. Here again, later sampling dates, warmer temperatures and longerphotoperiods consistently decreased the time to bud burst under our treat-ment conditions (Fig. 3.4).
With later sampling dates, and thus shorter exposition to the contrastingtreatment conditions the treatment effects generally weakened (Fig. 3.4,Table 3.3). The strongest temperature effect on bud burst was found inPicea, although the effect was only slightly weaker in Acer and Quercus.Fagus was least responsive to temperature (Table 3.4). The photoperiodeffect on the time of bud burst was strongest in Fagus and Picea, onlyrelatively weak in Quercus and absent in Acer.
In all species except Picea, the time of bud burst was additionally influ-enced by the cutting’s elevation of origin on at least one of the three sam-pling dates (Table 3.3 and 3.4): in Acer and Fagus, we observed earlierbud burst on low elevation cuttings compared to high elevation cuttings,irrespective of temperature, when sampled at the first sampling date. Withlater sampling dates, this effect disappeared in Acer and was reversed inFagus. A reversed pattern that is, bud burst of high-elevation-cuttings pre-ceding those of low-elevation-cuttings, was observed in Quercus, but onlyfor the first two sampling dates, while no such effect of elevation of originwas found for the third sampling date.
Furthermore, a significantly larger photoperiod effect was found underwarm temperatures than under cool temperatures for the first two sam-pling dates in Picea and for the second sampling in Fagus, whereas nosignificant photoperiod × temperature interaction was found in the otherspecies. Finally, in Picea cuttings of the second sampling date, the pho-toperiod effect was significantly stronger in cuttings from high elevationsthan in those from low elevations and we also observed a slightly stronger
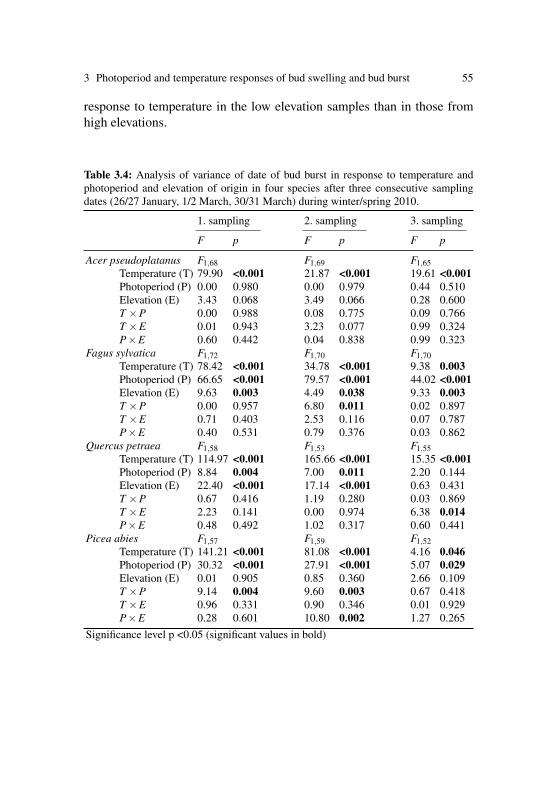
3 Photoperiod and temperature responses of bud swelling and bud burst 55
response to temperature in the low elevation samples than in those fromhigh elevations.
Table 3.4: Analysis of variance of date of bud burst in response to temperature andphotoperiod and elevation of origin in four species after three consecutive samplingdates (26/27 January, 1/2 March, 30/31 March) during winter/spring 2010.
1. sampling 2. sampling 3. sampling
F p F p F p
Acer pseudoplatanus F1,68 F1,69 F1,65Temperature (T) 79.90 <0.001 21.87 <0.001 19.61 <0.001Photoperiod (P) 0.00 0.980 0.00 0.979 0.44 0.510Elevation (E) 3.43 0.068 3.49 0.066 0.28 0.600T ×P 0.00 0.988 0.08 0.775 0.09 0.766T ×E 0.01 0.943 3.23 0.077 0.99 0.324P×E 0.60 0.442 0.04 0.838 0.99 0.323
Fagus sylvatica F1,72 F1,70 F1,70Temperature (T) 78.42 <0.001 34.78 <0.001 9.38 0.003Photoperiod (P) 66.65 <0.001 79.57 <0.001 44.02 <0.001Elevation (E) 9.63 0.003 4.49 0.038 9.33 0.003T ×P 0.00 0.957 6.80 0.011 0.02 0.897T ×E 0.71 0.403 2.53 0.116 0.07 0.787P×E 0.40 0.531 0.79 0.376 0.03 0.862
Quercus petraea F1,58 F1,53 F1,55Temperature (T) 114.97 <0.001 165.66 <0.001 15.35 <0.001Photoperiod (P) 8.84 0.004 7.00 0.011 2.20 0.144Elevation (E) 22.40 <0.001 17.14 <0.001 0.63 0.431T ×P 0.67 0.416 1.19 0.280 0.03 0.869T ×E 2.23 0.141 0.00 0.974 6.38 0.014P×E 0.48 0.492 1.02 0.317 0.60 0.441
Picea abies F1,57 F1,59 F1,52Temperature (T) 141.21 <0.001 81.08 <0.001 4.16 0.046Photoperiod (P) 30.32 <0.001 27.91 <0.001 5.07 0.029Elevation (E) 0.01 0.905 0.85 0.360 2.66 0.109T ×P 9.14 0.004 9.60 0.003 0.67 0.418T ×E 0.96 0.331 0.90 0.346 0.01 0.929P×E 0.28 0.601 10.80 0.002 1.27 0.265
Significance level p <0.05 (significant values in bold)
56 Chapter 3
Discussion
The results show that bud burst of cuttings collected from mature treesduring late winter and early spring respond differently to temperature andphotoperiod, and these differences depended on minute differences in insitu stages of bud development. The origin of elevation as well as speciesidentity influence responsiveness. The more advanced endo- or ecodor-mancy release was the less did the treatments conditions affected furtherbud development and the timing of bud burst. Hence, very early advancesof bud development preset later phenology.
Chilling
In temperate climates, the release of endodormancy requires the exposureto chilling temperatures before buds resume growth under warm tempera-tures. Insufficient chilling may delay bud burst or decrease bud burst per-centage under warm forcing conditions (Samish 1954). Here, the initialdormancy in February was strongest in Fagus, intermediate in Acer andQuercus and surprisingly low in Picea. The remarkably low dormancy inPicea may arise from the fact that this species, in contrast to the otherspecies, seems to require less stringent chilling experience (Nienstaedt1967, Worrall and Mergen 1967, Sogaard et al. 2008). The significant re-duction in dormancy state observed between the first and second samplingcohorts (despite the lack of warm days at the field sites) may reflect thefulfilment of chilling requirements. The chill days as a measure for the de-gree of chilling as used here (days with mean temperature < 5 ◦C) is onlya rough approximation for the actual (unknown) dose-response to cooltemperatures. Yet, there are no known physiological or molecular mark-ers that indicate the fulfilment of the chilling requirement (Cooke et al.2012). However, under our temperature and photoperiod test conditionsbuds can be assumed to have experienced sufficient chilling either by thecool in situ winter temperatures before sampling or later, under our rathermoderate temperature treatments, with low night temperatures likely tohave added to the fulfilment of chilling requests, if there was a need. Thehigh bud burst percentage as well as, the low thermal requirement underforcing conditions observed support this assumption. Since the effective

3 Photoperiod and temperature responses of bud swelling and bud burst 57
ranges of chilling and growth promoting temperatures may overlap, lowtemperatures within the upper range of potential chilling temperatures arealso able to promote bud growth and induce bud burst, as was observedfor example in experiments with Betula pendula Roth and B. pubescensEhrh. (Myking and Heide 1995) and Sorbus aucuparia L. (Heide 2011).
High resolution data for actual field temperatures inside buds combinedwith histological observations in cut buds (Sutinen et al. 2009, Sutinenet al. 2012) or in situ automatic dendrometer-type assessments of budswould help to identify the threshold temperatures for tissue growth inbuds. From results of studies in other tissues in cold adapted plants, we ex-pect a threshold near 5 ◦C (Alvarez-Uria and Körner 2007, Körner 2008,Rossi et al. 2008)
Bud swelling
Using individual bud image time series permitted us to accurately monitorthe bud swelling period, which closely follows the transition from endo-to ecodormancy under our controlled conditions, together with an increasein metabolic activity, rise in bud water content and mobilization of storagereserves following dormancy release (Saure 1985, Pallardy 2008). Ourdata, for the first time, permitted to assess the responses of the onset ofbud swelling to temperature and photoperiod, but also the estimation ofbud growth curves of individual buds. Although, the phenological phase ofbud swelling is often part of observation protocols such as the widely usedBBCH scale (Biologische Bundesanstalt, Bundessortenamt und CHemis-che Industrie; Meier 2001), the precise start of bud swelling is very diffi-cult to ascertain over a multitude of buds in regular intervals. Thus, previ-ous studies largely reported with more striking, later phenophases, such asbud burst or leaf unfolding, which also mark the start of the new growingseason. Our results show, that the onset and duration of bud growth areco-controlled by temperature and photoperiod in Fagus and Picea and tosome extent in Quercus, but not in Acer, which appears to be temperaturecontrolled only. These responses suggest further, that although maximumbud growth rate is mainly driven by concurrent temperatures (with the ex-ception of Fagus, where long photoperiods increase maximum growth
58 Chapter 3
rates), the duration of bud swelling is modulated by photoperiod in pho-toperiod sensitive species.
The onset of bud swelling advanced in all species and treatment con-ditions with later sampling, which may be related to decreasing endodor-mancy in the later sampled cohorts and thus, likely linked to the addi-tional natural chilling received in situ. Significant photoperiod effects onthe onset of bud swelling, despite the sufficiently fulfilled chilling require-ment (as indicated by the stable, low thermal requirement under forcingconditions) were present in Fagus. Still, with later sampling, and thus,advanced dormancy release, these photoperiodic effects decreased. Usingcalculated bud growth indices, chilling has been reported to affect the sub-sequent temperature response of bud growth in several species (Campbelland Sugano 1975, Cannell 1989, Battey 2000). We did not observe sig-nificantly different maximum bud growth rates or bud swelling durationwith later sampling dates, suggesting again, that the species were suf-ficiently chilled before bud swelling started or that such effects on budgrowth rates may only be detected in stronger, less realistic temperaturecontrasts. Furthermore, our decreased duration of the bud swelling periodin Fagus, Quercus and Picea under long photoperiods supports the con-clusion that photoperiod may affect bud development also during ecodor-mancy release, as was reported for Betula pubescens (Myking and Heide1995, Caffarra et al. 2011), rather than substituting for a lack of chillingonly (Downs and Borthwick 1956, Vegis 1964, Nienstaedt 1967, Cannelland Smith 1983).
Although the underlying physiological drivers of bud dormancy releaseare not yet completely understood, plant hormones, e.g. abscisic Acid(ABA), gibberellic acid (GA), auxins (IAA) and cytokinins, are stronglyinvolved in regulating bud dormancy (Wareing and Saunders 1971, Aroraet al. 2003, Welling and Palva 2006, Chao et al. 2007, Meier et al. 2012).Among these, levels of ABA and GA and IAA are affected by phy-tochrome, the plants sensory apparatus for perceiving daylength (Olsenet al. 1997b, Sawada et al. 2008). While short-day induced ABA is mostlyinvolved in dormancy induction (Rinne et al. 1994, Welling et al. 2002),a phytochrome mediated increase in GA levels has been observed in Salixpentandra L. during dormancy release (Olsen et al. 1997a). Thus, the pho-toperiod responses observed here may reflect such plant hormonal effects,and these hormones may be candidates for further physiological researchon plant dormancy release in photoperiod sensitive late successional trees.

3 Photoperiod and temperature responses of bud swelling and bud burst 59
Bud burst
As expected, warmer temperatures accelerated the final stages of bud de-velopment and resulted in earlier bud burst. With later sampling in thefield, the temperature effects on bud burst diminished, indicating the grad-ually advancing dormancy release during late winter. While the buds ofAcer, Quercus and Picea where about equally sensitive to temperature,generally lower temperature sensitivity was observed in Fagus. This find-ing is consistent with the generally lower temperature sensitivity of Faguscompared to other co-occurring species observed along elevational gradi-ents (Dittmar et al. 2006, Migliavacca et al. 2008, Vitasse et al. 2009), andthe findings of a common garden experiment along the same elevationalgradients as used in this study, where a sensitivity to the mean temper-ature of the month of leaf unfolding of −2.6± 0.2 days K−1 in Fagus,and −4.0± 0.3 days K−1 in Acer was found (Vitasse et al. 2013). How-ever, Fagus is the most photoperiod sensitive species, and photoperiodresponses may have influenced these in situ ‘temperature sensitivities’ aswell. By controlling for both, temperature and photoperiod conditions, weobtained similar low temperature sensitivities in Fagus compared to theother species. Low temperature sensitivity and strong photoperiod sensi-tivity of bud development may lead to the low inter-annual variation re-ported for leaf unfolding in Fagus (Menzel et al. 2001, Studer et al. 2005,Vitasse and Basler 2013). The large delay of bud burst in Picea under ourlow temperature treatments, despite the low depth of dormancy, is likely tobe related to the fact that this species exhibits a low, early fulfilled, chill-ing requirement and these low temperatures may be close to the thresholdtemperature for bud development.
The observed photoperiod responses in the four species are in line withthe results from a previous screening of 14 species for photoperiod influ-ences on bud burst on the same elevational gradients (Basler and Körner2012). For Fagus, the photoperiod effect on bud burst observed here con-firms previous findings (Klebs 1914, Wareing 1953, Heide 1993b, Caffarraand Donnelly 2010).
The observed diminishing of photoperiod effects with later samplingdates may either have been influenced by longer exposure to chilling tem-peratures in situ or by the threshold nature of the photoperiod effect oncethe critical photoperiod has been passed and developmental barriers arereleased, photoperiod may not exert any further influence. A diminishing

60 Chapter 3
photoperiod effect with increasing chilling has been described for severalspecies (Worrall and Mergen 1967, Heide 1993a, Myking and Heide 1995,Partanen et al. 2005, Caffarra and Donnelly 2010) and these authors con-cluded that photoperiod was effective in insufficiently chilled buds only.Hence, following their reasoning, photoperiod could substitute chilling ef-fects. Most of these studies, assessed the effect of photoperiod after a con-trolled amount of chilling followed by rather high forcing temperatures(> 20 ◦C), much warmer than the temperature ever would be in field andmuch higher than the temperatures employed in our experiments.
Methodical considerations
Experiments, such as the ones presented here, may suffer from effects ofrelated to the disconnection of cuttings, from potential whole-tree signals(e.g. hormonal signals produced outside the branchlet/bud), even thoughthe phenology of adult trees seems to be well represented by that of cut-tings (Vitasse and Basler 2014). For obvious reasons, however, in situ ma-nipulation of photoperiod on adult trees was not an option and seedlingsare not a good substitute to study phenology of mature trees, due to onto-genic differences in phenology (Ununger et al. 1988, Besford et al. 1996,Partanen et al. 2001, Vitasse 2013). We assume that the use of cuttings datalead to a conservative picture of photoperiod signals compared to wholetree responses (see Basler and Körner 2012). Real-scale photoperiod re-duction in mature forests is perhaps the most challenging types of anymanipulation in global change research. It is the shortening of photope-riod in a warmer world (earlier thermal forcing) that matters, and no suchexperiment has ever been attempted on mature trees, and we doubt its fea-sibility, given the complete darkness (night extension) needed day-by-day.In-situ shortening of photoperiod was anyhow conducted with saplings,e.g. Hänninen (1995) used 10–15 years old, 1.5 to 2 m tall saplings of Pi-nus sylvestris L. and found only a negligible effect of photoperiod on thetiming of bud burst. Latitudinal transplant experiments seem more fea-sible, but in this case the temperature regime comes into play. Plantinglow elevation northern provenances at high elevations in the south maybea possibility. Unfortunately, arboreta (or park trees) commonly hold norecord of seed/plant origin.

3 Photoperiod and temperature responses of bud swelling and bud burst 61
Conclusions
We showed that photoperiod is involved in the release of bud dormancy inthree out of four late successional tree species and we evidenced speciesspecific photoperiod effects on the onset of bud swelling and bud growthrates during the forcing period linked. Although recent climate warmingcaused a shift of spring phenology towards an earlier onset of the grow-ing season in many plant species (Parmesan and Yohe 2003, Menzel et al.2006), late successional, photoperiod sensitive species are thus, unlikelyto fully track future warming at current rates, as photoperiodic clues be-come increasingly important. Warm temperatures in autumn (Heide 2003)or less chilling during winter (Morin et al. 2010) may delay bud burst evenfurther in certain climates (e.g. mild costal climates). In consequence, thephotoperiod sensitive species may not profit from a substantially extendedgrowing season in a warmer climate, especially as the autumn phenolog-ical events (growth cessation and bud set) are unlikely to become con-siderably delayed in a warming climate due to their strong photoperiodiccontrol (Kramer 1936, Wareing 1956, Vaartaja 1959, Thomas and Vince-Prue 1997). Contrary, in many tree species warm night temperatures inautumn have even been found to hasten growth cessation, expect for pho-toperiod insensitive species and a few northern ecotypes where low tem-perature alone has been found to induce growth cessation in autumn (asreviewed in Hänninen and Tanino 2011). Photoperiod thresholds are ele-vation specific (ecotypic) and photoperiod sensitivity commonly found inlate successional tree species, is a strategy to escape fatal freezing damagein immature, less robust tissue by delaying bud burst into low risk periods,irrespective of actual weather.
Acknowledgements We would like to thank Georges Grun for the technical supportduring the growth chamber experiment. We also grateful to Heikki Hänninen and twoanonymous reviewers for their supportive and constructive comments on a previousversion of the manuscript.
This project was funded by Velux-Foundation and was supported by NCCR-climateof the Swiss Science Foundation. The project also contributed to the project TREELIMfunded by the European Research Council (grant 233399).

62 Chapter 3
References
Alvarez-Uria P, Körner C (2007) Low temperature limits of root growth in deciduousand evergreen temperate tree species. Funct. Ecol. 21: 211–218.
Arora R, Rowland LJ, Tanino K (2003) Induction and release of bud dormancy inwoody perennials: A science comes of age. HortScience 38: 911–921.
Basler D, Körner C (2012) Photoperiod sensitivity of bud burst in 14 temperate foresttree species. Agric. For. Meteorol. 165: 73–81.
Battey NH (2000) Aspects of seasonality. J. Exp. Bot. 51: 1769–1780.Baty F, Delignette-Muller ML (2004) Estimating the bacterial lag time: which model,
which precision? Int. J. Food. Microbiol. 91: 261–277.Besford RT, Hand P, Richardson CM, Peppitt SD (1996) Photoperiod effect on bud
burst in Prunus is phase dependent: Significance for early photosynthetic develop-ment. Tree Physiol. 16: 491–496.
Buchanan RL, Whiting RC, Damert WC (1997): When is simple good enough: a com-parison of the Gompertz, Baranyi, and three-phase linear models for fitting bacterialgrowth curves. Food Microbiol. 14: 313–326.
Caffarra A, Donnelly A (2010) The ecological significance of phenology in four differ-ent tree species: effects of light and temperature on bud burst. Int. J. Biometeorol.55: 711–21.
Caffarra A, Donnelly A, Chuine I, Jones MB (2011) Modelling the timing of Betulapubescens budburst. I. Temperature and photoperiod: a conceptual model. Clim.Res. 46: 147–157.
Campbell RK, Sugano AI (1975) Phenology of bud burst in Douglas-fir related toprovenance, photoperiod, chilling, and flushing temperature. Bot. Gaz. 136: 290–298.
Cannell MGR (1989) Chilling, thermal time and the date of flowering of trees. In:Wright CJ (Ed.) Manipulation of fruiting. Butterworths, London, UK, pp. 99–113.
Cannell MGR Smith RI (1983) Thermal time, chill days and prediction of budburst inPicea sitchensis. J. Appl. Ecol. 20: 951–963.
Chao WS, Foley ME, Horvath DP, Anderson JV (2007) Signals regulating dormancyin vegetative buds. Int. J. Plant Dev. Biol. 1: 49–56.
Cooke JEK, Eriksson ME, Junttila O (2012) The dynamic nature of bud dormancyin trees: environmental control and molecular mechanisms. Plant Cell Environ. 35:1707–1728.
Dittmar C, Fricke W, Elling W (2006) Impact of late frost events on radial growth ofcommon beech (Fagus sylvatica L.) in Southern Germany. Eur. J. Forest Res. 125:249–259.
Downs RJ, Borthwick HA (1956) Effects of photoperiod on growth of trees. Bot. Gaz.117: 310–326.
Essiamah S, Eschrich W (1986) Water-uptake in deciduous trees during winter and therole of conducting tissues in spring reactivation. IAWA Bull. 7: 31–38.
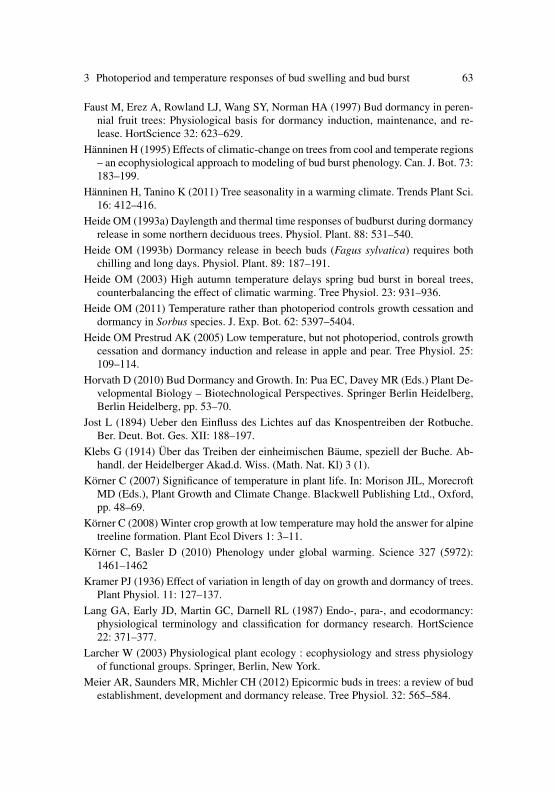
3 Photoperiod and temperature responses of bud swelling and bud burst 63
Faust M, Erez A, Rowland LJ, Wang SY, Norman HA (1997) Bud dormancy in peren-nial fruit trees: Physiological basis for dormancy induction, maintenance, and re-lease. HortScience 32: 623–629.
Hänninen H (1995) Effects of climatic-change on trees from cool and temperate regions– an ecophysiological approach to modeling of bud burst phenology. Can. J. Bot. 73:183–199.
Hänninen H, Tanino K (2011) Tree seasonality in a warming climate. Trends Plant Sci.16: 412–416.
Heide OM (1993a) Daylength and thermal time responses of budburst during dormancyrelease in some northern deciduous trees. Physiol. Plant. 88: 531–540.
Heide OM (1993b) Dormancy release in beech buds (Fagus sylvatica) requires bothchilling and long days. Physiol. Plant. 89: 187–191.
Heide OM (2003) High autumn temperature delays spring bud burst in boreal trees,counterbalancing the effect of climatic warming. Tree Physiol. 23: 931–936.
Heide OM (2011) Temperature rather than photoperiod controls growth cessation anddormancy in Sorbus species. J. Exp. Bot. 62: 5397–5404.
Heide OM Prestrud AK (2005) Low temperature, but not photoperiod, controls growthcessation and dormancy induction and release in apple and pear. Tree Physiol. 25:109–114.
Horvath D (2010) Bud Dormancy and Growth. In: Pua EC, Davey MR (Eds.) Plant De-velopmental Biology – Biotechnological Perspectives. Springer Berlin Heidelberg,Berlin Heidelberg, pp. 53–70.
Jost L (1894) Ueber den Einfluss des Lichtes auf das Knospentreiben der Rotbuche.Ber. Deut. Bot. Ges. XII: 188–197.
Klebs G (1914) Über das Treiben der einheimischen Bäume, speziell der Buche. Ab-handl. der Heidelberger Akad.d. Wiss. (Math. Nat. Kl) 3 (1).
Körner C (2007) Significance of temperature in plant life. In: Morison JIL, MorecroftMD (Eds.), Plant Growth and Climate Change. Blackwell Publishing Ltd., Oxford,pp. 48–69.
Körner C (2008) Winter crop growth at low temperature may hold the answer for alpinetreeline formation. Plant Ecol Divers 1: 3–11.
Körner C, Basler D (2010) Phenology under global warming. Science 327 (5972):1461–1462
Kramer PJ (1936) Effect of variation in length of day on growth and dormancy of trees.Plant Physiol. 11: 127–137.
Lang GA, Early JD, Martin GC, Darnell RL (1987) Endo-, para-, and ecodormancy:physiological terminology and classification for dormancy research. HortScience22: 371–377.
Larcher W (2003) Physiological plant ecology : ecophysiology and stress physiologyof functional groups. Springer, Berlin, New York.
Meier AR, Saunders MR, Michler CH (2012) Epicormic buds in trees: a review of budestablishment, development and dormancy release. Tree Physiol. 32: 565–584.
64 Chapter 3
Meier U (2001) BBCH Monografie: Entwicklungsstadien mono- und dikotyler Pflanzen.Biologische Bundesanstalt für Land und Forstwirtschaft, p. 165.
Menzel A, Estrella N, Fabian P (2001) Spatial and temporal variability of the pheno-logical seasons in Germany from 1951 to 1996. Glob. Change Biol. 7: 657–666.
Menzel A, Sparks TH, Estrella N, Koch E, Aasa A, Ahas R, Alm-Kubler K, Bissolli P,Braslavska O, Briede A, Chmielewski FM, Crepinšek Z, Curnel Y, Dahl A, DefilaC, Donnelly A, Filella Y, Jatcza K , Mage F, Mestre A, Nordli O, Penuelas J, PirinenP, Remisova V, Scheifinger H, Striz M, Susnik A, Van Vliet AJH, Wielgolaski FE,Zach S, Zust A (2006) European phenological response to climate change matchesthe warming pattern. Glob. Change Biol. 12: 1969–1976.
Migliavacca M, Cremonese E, Colombo R, Busetto L, Galvagno M, Ganis L, MeroniM, Pari E, Rossini M, Siniscalco C, di Cella UM (2008) European larch phenologyin the Alps: can we grasp the role of ecological factors by combining field observa-tions and inverse modelling? Int. J. Biometeorol. 52: 587–605.
Morin X, Roy J, Sonie L, Chuine I (2010) Changes in leaf phenology of three Europeanoak species in response to experimental climate change. New Phytol. 186: 900–910.
Myking T, Heide OM (1995) Dormancy release and chilling requirement of buds oflatitudinal ecotypes of Betula pendula and B. pubescens. Tree Physiol. 15: 697–704.
Nienstaedt H (1967) Chilling requirements in seven Picea species. Silvae Genet. 16:65–68.
Olsen JE, Junttila O, Moritz T (1997a) Long-day induced bud break in Salix pentandrais associated with transiently elevated levels of GA1 and gradual increase in indole-3-acetic acid. Plant Cell Physiol. 38: 536–540.
Olsen JE, Junttila O, Nilsen J, Eriksson ME, Martinussen I, Olsson O, Sandberg Gand Moritz T (1997b) Ectopic expression of oat phytochrome A in hybrid aspenchanges critical daylength for growth and prevents cold acclimatization. Plant J. 12:1339–1350.
Pallardy SG (2008) Physiology of woody plants. Academic Press, Burlington, MA.Parmesan C, Yohe G (2003) A globally coherent fingerprint of climate change impacts
across natural systems. Nature 421: 37–42.Partanen J, Hänninen H, Häkkinen R (2005) Bud burst in Norway spruce (Picea abies):
preliminary evidence for age-specific rest patterns. Trees-Struct. Funct. 19: 66–72.Partanen J, Koski V, Hänninen H (1998) Effects of photoperiod and temperature on the
timing of bud burst in Norway spruce (Picea abies). Tree Physiol. 18: 811–816.Partanen J, Leinonen I, Repo T 2001. Effect of accumulated duration of the light period
on bud burst in Norway spruce (Picea abies) of varying ages. Silva Fenn. 35: 111–117.
Perry TO (1971) Dormancy of trees in winter. Science 171: 29–36.R Development Core Team (2010) R: A Language and Environment for Statistical
Computing. R Foundation for Statistical Computing, Vienna, Austria.Rinne P, Hänninen H, Kaikuranta P, Jalonen JE, Repo T (1997) Freezing exposure
releases bud dormancy in Betula pubescens and B. pendula. Plant Cell Environ. 20:1199–1204.

3 Photoperiod and temperature responses of bud swelling and bud burst 65
Rinne P, Tuominen H, Junttila O (1994) Seasonal-changes in bud dormancy in rela-tion to bud morphology, water and starch content, and abscisic-acid concentration inadult trees of Betula pubescens. Tree Physiol. 14: 549–561.
Romberger JA (1963) Meristems, growth, and development in woody plants; an analyt-ical review of anatomical, physiological, and morphogenic aspects. U.S. Govt. Print.Off., Washington.
Rossi S, Deslauriers A, Griçar J, Seo JW, Rathgeber CBK, Anfodillo T, Morin H, Lev-anic T, Oven P, Jalkanen R (2008) Critical temperatures for xylogenesis in conifersof cold climates. Glob. Ecol. Biogeogr. 17: 696–707.
Samish RM (1954) Dormancy in woody plants. Annu. Rev. Plant Phys. 5: 183–204.Sarvas R (1974) Investigations on the annual cycle of development of forest trees. II.
Autumn dormancy and winter dormancy. In: Communicationes Instituti ForestalisFenniae, pp. 1–101.
Saure MC (1985) Dormancy release in deciduous fruit trees. In: Horticultural Reviews.John Wiley & Sons, Inc., pp. 239–300.
Sawada Y, Aoki M, Nakaminami K, Mitsuhashi W, Tatematsu K, Kushiro T, Koshiba T,Kamiya Y, Inoue Y, Nambara E, Toyomasu T (2008) Phytochrome- and gibberellin-mediated regulation of abscisic acid metabolism during germination of photoblasticlettuce seeds. Plant Physiol. 146: 1386–1396.
Sogaard G, Johnsen O, Nilsen J, Junttila O (2008) Climatic control of bud burst inyoung seedlings of nine provenances of Norway spruce. Tree Physiol. 28: 311–320.
Studer S, Appenzeller C, Defila C (2005) Inter-annual variability and decadal trends inalpine spring phenology: A multivariate analysis approach. Clim. Change 73: 395–414.
Sutinen S, Partanen J, Viherä-Aarnio A, Häkkinen R (2009) Anatomy and morphologyin developing vegetative buds on detached Norway spruce branches in controlledconditions before bud burst. Tree Physiol. 29: 1457–1465.
Sutinen S, Partanen J, Viherä-Aarnio A, Häkkinen R (2012) Development and growthof primordial shoots in Norway spruce buds before visible bud burst in relation totime and temperature in the field. Tree Physiol. 32: 987–997.
Thomas B, Vince-Prue D (1997) Photoperiodism in plants. Academic Press, London.Ununger J, Ekberg I, Kang H (1988) Genetic control and age-related changes of juve-
nile growth characters in Picea abies. Scand. J. For. Res. 3: 55–66.Vaartaja O (1959) Evidence of photoperiodic ecotypes in trees. Ecol. Monogr. 29: 91–
111.Vegis A (1964) Dormancy in higher plants. Annu. Rev. Plant Phys. 15: 185–224.Vitasse Y (2013) Ontogenic changes rather than difference in temperature cause under-
story trees to leaf out earlier. New Phytol. 198: 149–155.Vitasse Y, Basler D (2013) What role for photoperiod in the bud burst phenology of
European beech. Eur. J. Forest Res. 132: 1–8.Vitasse Y, Basler D (2014) Is the use of cuttings a good proxy to explore phenologi-
cal responses of temperate forests in warming and photoperiod experiments? TreePhysiol. 34: 174–183

66 Chapter 3
Vitasse Y, Delzon S, Dufrene E, Pontailler JY, Louvet JM, Kremer A, Michalet R(2009) Leaf phenology sensitivity to temperature in European trees: Do within-species populations exhibit similar responses? Agric. For. Meteorol. 149: 735–744.
Vitasse Y, Hoch G, Randin CF, Lenz A, Kollas C, Scheepens JF, Körner C (2013)Elevational adaptation and plasticity in seedling phenology of temperate deciduoustree species. Oecologia 171: 663–678.
Wareing PF (1953) Growth studies in woody species. 5. Photoperiodism in dormantbuds of Fagus sylvatica L. Physiol. Plant. 6: 692–706.
Wareing PF (1956) Photoperiodism in woody plants. Annu. Rev. Plant Phys. 7: 191–214.
Wareing PF (1969) Germination and dormancy. In: Wilkins MB (Ed.) Physiology ofPlant Growth and Development. McGrawhill, London, pp. 605–644.
Wareing, PF Saunders PF (1971) Hormones and Dormancy. Annu. Rev. Plant Phys. 22:261–288.
Welling A, Moritz T, Palva ET, Junttila O (2002) Independent activation of cold ac-climation by low temperature and short photoperiod in hybrid aspen. Plant Physiol.129: 1633–1641.
Welling A, Palva ET (2006) Molecular control of cold acclimation in trees. Physiol.Plant. 127: 167–181.
Worrall J, Mergen F (1967) Environmental and genetic control of dormancy in Piceaabies. Physiol. Plant. 20: 733–745.
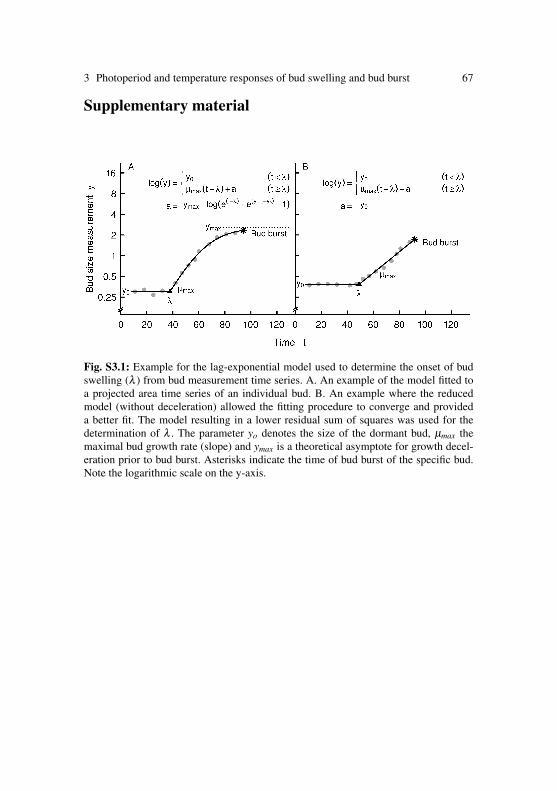
3 Photoperiod and temperature responses of bud swelling and bud burst 67
Supplementary material
Fig. S3.1: Example for the lag-exponential model used to determine the onset of budswelling (λ ) from bud measurement time series. A. An example of the model fitted toa projected area time series of an individual bud. B. An example where the reducedmodel (without deceleration) allowed the fitting procedure to converge and provideda better fit. The model resulting in a lower residual sum of squares was used for thedetermination of λ . The parameter yo denotes the size of the dormant bud, µmax themaximal bud growth rate (slope) and ymax is a theoretical asymptote for growth decel-eration prior to bud burst. Asterisks indicate the time of bud burst of the specific bud.Note the logarithmic scale on the y-axis.

Chapter 4Evaluating phenological models for theprediction of leaf-out dates in sixtemperate tree species across centralEurope
David Basler
Abstract Inter-annual variation in climate is reflected by changes in thetiming of phenology. Over the last decades a considerable number of mod-els have been developed in order to explain the inter-annual variation ofspring phenology in trees. Contrary to empirical models, ‘process-based’models aim at simulating physiological processes in order to yield morerealistic predictions of growing season onset dates. Despite the increas-ing knowledge on the environmental controls of seasonal dormancy intrees, the detailed action and interaction of the involved environmentaldrivers (chilling, photoperiod and warm temperature) remains to be elu-cidated. This study aims at a uniform comparison of a wide range ofexisting models (and new recombinations), on a multitude of long-termobservation series in six tree species across central Europe, using ex-tensive cross-validation. Even though the assessed models differ in thephases of dormancy and environmental drivers accounted for, they yieldeda surprisingly similar quality of prediction of leaf unfolding dates. De-pending on the species, the lowest average prediction errors for leaf un-folding (RMSE) ranged from 7 to 9 days for the dataset pooled acrosssites and years and from 4 to 6 days for site-specific predictions, in ab-sence of any obvious geographical pattern. Simple models, that featureecodormancy release only, performed similar or better than more com-plex models, which additionally include endodormancy release through
Original article published in Agricultural and Forest Meteorology 217:10-21
69
70 Chapter 4
chilling temperatures. Model parameterisation tended to converge towardssimilar behaviour and models with many parameters tended to overfit onthe 40 year time-series of leaf unfolding. Additionally, all models tendedto underestimate the inter-annual variation of leaf unfolding and failedto predict very early or late dates of leaf unfolding in certain years. Thetransfer of site-specific parameters to other sites was associated with an al-most doubling of the average prediction error, independent of distance andclimatic similarity between the calibration and validation sites. The find-ings challenge the accurate implementation of the physiological processescontrolling spring phenology in the models and highlight shortcomingsassociated with model parameterisation on observational time-series only.
Key words: Bud burst, Chilling, Temperature, Spring phenology, Process-based, Photoperiod
Introduction
Plant phenology studies the seasonal and visible phenomena of plant de-velopment related to weather. The timing of phenological events reflectsa combination of internal (genetic) settings and environmental influences.Given its significance for avoiding late spring freezing damage and im-pacts of early autumnal cold events, a well-timed phenology is crucial forplant survival. In addition, the control of synchronous flowering amongindividuals assures sexual reproduction. The phenological events defin-ing the onset and end of the growing season are of special interest, sincethey are setting the length of the growing season, and thereby control-ling range limits of species (Chuine and Beaubien 2001). During the dor-mant period, buds pass through three distinct states of dormancy (Langet al. 1987): (1) paradormancy, a state of specific bud dormancy main-tained due to physiological factors outside the bud but inside the plant(e.g., apical dominance), (2) endodormancy, state of inactivity mediatedby factor inside the bud and (3) ecodormancy, a state of inactivity imposedby unfavourable environmental conditions at otherwise full preparednessfor advancing seasonal development. The transitions between the differentphases of dormancy are gradual and species-specific (Perry 1971). In treespecies adapted to cool climates, dormancy is induced by the shortening of

4 Evaluating phenological models for the prediction of leaf-out dates 71
day-length in autumn, perceived in leaves, and modulated by concurrenttemperatures. Moderate sub-zero temperatures are then inducing endodor-mancy, which is generally released in late winter or early spring, aftersufficiently long exposure to cool, but non-freezing temperatures in therange of 2–7 ◦C (‘chilling’; Coville 1920, Doorenbos 1953, Battey 2000).Many species need an additional weather independent photoperiod signalto effectively advance the transition from endodormancy to the follow-ing ecodormancy. During this stage, actual weather (largely temperature)controls bud development and bud burst (environmental ‘forcing’).
Phenology gained much attention during the last decades, once its im-plications in the climate change discussion became acknowledged. Eversince phenological data was collected, the phenological events were re-lated to climate and simple models were built to calculate the timing ofphenological phases, especially in agro-ecosystems. Nowadays, the appli-cations of phenological models range from reconstruction and quality as-sessment of phenological time-series, spatial extrapolation of observationsand even to species-specific predictions of phenology, and thus speciesperformance, in future climate. Thus, phenology plays an important rolein species distribution models (e.g., Chuine and Beaubien 2001) or dy-namic global vegetation models (e.g., Krinner et al. 2005). Through theintimate linkage with the length of the growing season and thus, net pri-mary production, phenology plays also an important role in carbon cyclemodels at ecosystem and global scale (Richardson et al. 2013). For tem-perate and boreal tree species, numerous models have been developed tosimulate the events of spring phenology, such as bud burst or leaf unfold-ing, whereas only few models attempted to simulate the autumnal phasesof phenology, such as leaf colouration and leaf fall (White et al. 1997,Delpierre et al. 2009). The more mechanistic models commonly outper-form simple correlative statistical models for phenology, which often uselinear correlations to spring temperature only (but see Olsson and Jöns-son 2014). These ‘process-based’ models are also able to reflect the non-linear responses of phenology to the various environmental drivers. In sim-ple phenological models, the bud development towards bud-burst is basi-cally defined as a response to concurrent temperature, mostly by adoptingthe concept of accumulated temperature over a certain threshold (degreedays). However, the shortcomings of this simple approach (accounting forthe release of ecodormancy only) and the increasing knowledge of the un-derlying physiological processes motivated the development of numerous

72 Chapter 4
advanced models for spring phenology, which account also for chillingand photoperiod influences. Most recently, even the complex interactionsof all three drivers of spring phenology, chilling signals, photoperiod, andactual thermal forcing were integrated into a single model (Caffarra etal. 2011). However, with the increasing number of factors, complexity ofmodels increases dramatically and parameterisation becomes increasinglydifficult. At first, the statistical fitting of parameters was difficult and oftenled to unstable parameter estimates (Kramer 1994), thus Hänninen (1995)compared 96 model formulations using parameters derived from literature.Later, efficient optimisation methods (Chuine et al. 1998) and appropriatemethods for the statistical estimation of prediction errors, such as boot-strapping (Häkkinen 1999) or cross-validation (Chuine et al. 1999) led tofurther improvement of model parameterisation and evaluation. No singlemodel structure was found to predict spring phenology across differentspecies, so the best predictive models are still species-specific (Hunterand Lechowicz 1992, Chuine et al. 1998, Schaber and Badeck 2003) anddifferent model structures may perform equally well for a given species(Schaber and Badeck 2003). A recent uncertainty analysis for a set ofphenological models using data from Harvard forest revealed, that predic-tion errors are largely a result of the uncertain nature and strength of theactual drivers (model structure), and to a lesser extent due to model param-eterisation (Migliavacca et al. 2012). The more recently developed modelshave been tested on rather limited datasets for only a few species. The cur-rent study collectively analyses the performance of current process-basedphenology model structures for three aspects (1) generalisation, (2) site-specific accuracy and (3) spatial transferability, using a large and consis-tent phenology data set covering 40 year of observation on a multitude ofsites throughout Europe for 6 temperate tree species. The assessed mod-els differ with respect to the mechanisms they account for (dormancy in-duction, endodormancy release and ecodormancy release), the employeddrivers (forcing temperature, chilling temperature and photoperiod), andthe specific responses for different species. This study aims at improvingthe understanding of the capabilities and uncertainties of these models,and disclosing some pitfalls in modelling the spring phenology of temper-ate and boreal forest trees.
4 Evaluating phenological models for the prediction of leaf-out dates 73
Material and methods
Models types
The ‘process-based’ phenology-models published so far, and includedhere, simulate the environmental influence on bud development, until acritical developmental threshold for bud burst or leaf unfolding is reached.Parameters common to most models are a starting date, after which thespecific environmental drivers affect bud development, and one or moreparameters controlling the rate of response to environmental drivers.
The models are grouped according to their scope of operation into threecategories: (1) models explaining ecodormancy release only, (2) modelsexplaining the release of endo- and ecodormancy and (3) models explain-ing the whole transition from dormancy induction until bud burst. Fur-ther, I classified models by the environmental drivers they are account-ing for: chilling temperature, photoperiod and forcing temperature (Ta-ble 4.1). Models were implemented according to the original publication(Table 4.1, supplementary Table S4.1); however, I fitted the starting daterather than using an arbitrary date (such as 1 January). For each param-eter, upper and lower limit was defined within a wide, but (biologically)reasonable range (see supplementary Table S4.2).
Models accounting for ecodormancy release only
These are the oldest models, dating back to de Réaumur (1735), ac-counting for thermal forcing in spring only. These ‘Thermal Time’ mod-els (Wang 1960, Cannell and Smith 1983, Hunter and Lechowicz 1992,Chuine et al. 1999) are using degree days as forcing units. A modificationof this model type, hereafter named the ‘sigmoid Thermal Time model’(Hänninen 1990, Kramer 1994) uses a sigmoid, rather than linear, forcingfunction (see supplementary Table S4.1). Although photoperiod is wellknown to influence phenology of crops (e.g., Masle et al. 1989, Siebertand Ewert 2012) and late successional tree species (Caffarra and Don-nelly 2010, Körner and Basler 2010, Basler and Körner 2014), few modelsyet include photoperiod as explicit driver of spring phenology (the fixedstarting date of most models may, however, imply a strong photoperiod

74 Chapter 4
Table 4.1: Overview of the phenological models for leaf unfolding included in thisstudy. The models are grouped by implemented processes and drivers: chilling temper-atures (C), forcing temperatures (F) and photoperiod (P). Temperature responses notseparable in chilling or forcing are indicated with T .
Model name Drivers No. Comments/ReferencesParameters
EmpiricalNULL 1 mean date of leaf unfoldingLinear T 2 linear correlation with mean spring
temperaturesEcodormancy release only
Thermal Time a F 3 (4) de Réaumur (1735), Wang (1960),Cannell and Smith (1983), Chuine etal. (1999), Hunter and Lechowicz(1992), Hänninen (1990), Kramer(1994)
Photothermal-time a PF 3 (4) Masle et al. (1989), Crepinšek et al.(2006)
M1a PF 4 (5) Blümel and Chmielewski (2012)Endo- and eco dormancy release
Alternating CF 5 Cannel Smith (1983), Murray et al.(1989)
Sequential b CF 8 Hänninen (1990), Kramer (1994)Parallel b CF 9 Landsberg (1974), Hänninen (1990),
Kramer (1994)Unified CF 9 Chuine (2000)Sequentialb CPF 9 combination of Sequential model with
M1 modelParallel M1 b CPF 10 combination of Parallel model with
M1 modelUnified M1 CPF 10 combination of Unified model with
M1 modelDormPhot spring CPF 8 DormPhot model without dormancy
inductionPIM 1 - 12 PT 10 Schaber and Badeck (2003)
Dormancy induction, endo- and ecodormancy releaseFour-Phase b CF 12 Vegis 1964, Hänninen (1990)Deepening-Rest b CF 10 Kobayashi and Fuchigami (1983)DormPhot CPF 11 Caffarra et al. (2011)
a These models were also calibrated using a sigmoid temerature response (Hänninen1990, Kramer 1994), adding one parameter;
b These models were also calibrated using a bell-shaped chilling response (Chuine2000)
4 Evaluating phenological models for the prediction of leaf-out dates 75
threshold). In the Photothermal-time model developed for crops (Masleet al. 1989) and successfully applied to trees by Crepinšek et al. (2006),photoperiod has been included as an additional factor influencing the rateof forcing. Recently, a study investigating the shortcomings of the clas-sic Thermal Time model again suggested the inclusion of photoperiod asexplicit driver and thereby proposed an extension of the Photothermal-time model by an additional exponential constant (M1 model; Blümel andChmielewski 2012).
Models accounting for endo- and ecodormancy release
The chilling requirement, indicating to the plant that winter has passed,plays an additional role in dormancy release of temperate and boreal trees.In current models, the response to chilling temperatures is implementedeither as a triangular function of temperature (defined by minimal chillingtemperature, optimal chilling temperature and maximal chilling tempera-ture; Hänninen 1990, Kramer 1994) or a bell shaped curve (Chuine 2000;see equation in supplementary Table S4.1). Depending on the model’s as-sumption, the chilling requirement has to be fulfilled either before forc-ing temperatures are accumulating, such as in the Sequential model (Hän-ninen 1990, Kramer 1994), or chilling and forcing may act simultane-ously, as implemented in the Parallel model (Landsberg 1974, Hänninen1990, Kramer 1994). The either sequential or parallel integrations of chill-ing into models have later been combined in the Unified Model (Chuine2000). However, the flexible structure of this model has a cost in termsof higher number of parameters to be defined. For this study, the threeformerly mentioned models were extended with the addition of a photope-riod response, as photoperiod is known to control the phenology of certainspecies: In the Parallel-, Sequential- and Unified model, the (sigmoid) re-sponse to forcing temperature was extended by the photoperiod responsefactor of the M1 model (see equation in supplementary Table S4.1).
Again another formulation for including chilling fulfilment has beenintroduced by Murray et al. (1989) as the Alternating model, where a spe-cific day may either add to the accumulation of forcing or to the accumula-tion of chilling, depending on the actual daily mean temperature. I did notinclude further chilling models designed mainly for specific fruit trees,such as the ChillHours Model (summed hours with T < 7.2 ◦C; Wein-

76 Chapter 4
berger 1950), the Utah Model (temperature-weighted accumulation ofchilling hours; Richardson et al. 1974), the Positive Utah Model (Lindsley-Noakes et al. 1995), and the very complex ‘Dynamic model’ for chill-ing accumulation (Fishman et al. 1987a,b), as these models would requirehourly input data not available for this study.
A different approach at phenological modelling accounts for molecu-lar (e.g., hormonal) regulation of bud dormancy and was introduced bySchaber and Badeck (2003) as the ‘Promoter–Inhibitor models’ (PIM):these models do not explicitly separate endodormancy and ecodormancybut rather describe dormancy release as a continuum under control of thebalance of (virtual) promoters and inhibitors. Promoter-accumulation andinhibitor-decomposition rates are modulated by different combinations oftemperature and/or photoperiod.
Models for the whole dormant period
Some more sophisticated models include (temperature-induced) dormancyinduction prior to the release of dormancy through chilling and warm tem-peratures, such as the Four-Phase Model (Vegis 1964, Hänninen 1990) orthe Deepening-Rest model (Kobayashi and Fuchigami 1983). The mostcomplex model of this type, the DormPhot model (Caffarra et al. 2011)designed for Betula, integrates even the complex interactions of photope-riod with dormancy induction, chilling and thermal forcing.
NULL model and linear regression
All models were compared to the NULL model that assumes a fixed meandate of leaf unfolding over all years. Additionally, I also provide the resultsof a simple linear regression model of leaf unfolding dates against meanspring temperature: the relevant period was determined by choosing thebest linear correlation of leaf unfolding dates with mean temperatures ofeither a single month (January–May) or of a continuous combination ofthese months.

4 Evaluating phenological models for the prediction of leaf-out dates 77
Fig. 4.1: Locations of the phenological observation sites used in this study (leaf unfold-ing data 1970–2009). Data was provided by the Pan European Phenological Network(PEP).
Phenological data
The phenological time-series used for this study was extracted from thePEP725 Pan European Phenology Database (Data set accessed 2013-01-07at http://www.zamg.ac.at/pep725/). Out of the many tree species coveredby this dataset, I selected 6 species with abundant temporal and spatialcoverage: Aesculus hippocastanum L., Betula pendula Roth, Fagus syl-vatica L., Quercus robur L., Larix decidua Mill. and Picea abies (L.)H. Karst. (in the following species are referred to by their genus). Thesespecies represent contrasting characteristics in terms of successional status(early vs. late successional), leaf traits (broad leaved vs. coniferous) andcanopy duration (deciduous vs. evergreen). As phenological spring phase,leaf unfolding (BBCH code 11) was selected for the broad-leafed species

78 Chapter 4
and needle elongation (BBCH 10) for conifers. In each species, all datacovering the observation period of 1970–2009 was used to apply a robustmean outlier detection using the 30-day rule (Schaber and Badeck 2002)to exclude the most obvious flaws. Only stations where the full 40 yearswere covered after outlier removal were used in the study. Time-seriesfulfilling these requirements were located in Germany, Switzerland, Aus-tria, Slovenia and Croatia (Fig. 4.1), spanning an elevation range from sealevel to 1440 m a.s.l. Mean leaf unfolding was earliest in Larix, followedby Aesculus and Betula, while a later mean leaf unfolding was found inthe late successional species Fagus, Quercus and Picea (Table 4.2). Theinter-annual range of the overall spring phenology per site was around5 weeks.
Table 4.2: Properties of the phenological datasets used in this study. Mean (± SD) dayof leaf unfolding (BBCH 11), inter-annual range and trend during the observed period1970–2009.
Species Sites Data Mean leaf Maximum Mean trend Mean R2
points unolding inter-annual 1970-2009 1970-2009(DOY) range (dy−1)
A. hippocastanum 283 11320 109.8 ± 7.5 37.3 ± 6.4 -0.32 ± 0.20 0.19 ± 0.2B. pendula 270 10800 109.9 ± 6.5 38.0 ± 6.1 -0.29 ± 0.16 0.14 ± 0.1F. sylvatica 196 7840 118.4 ± 6.1 33.2 ± 6.4 -0.29 ± 0.17 0.23 ± 0.2Q. robur 160 6400 124.6 ± 6.7 35.8 ± 6.5 -0.38 ± 0.18 0.29 ± 0.2L. deciduaa 139 5560 105.7 ± 8.3 43.9 ± 7.3 -0.31 ± 0.22 0.13 ± 0.1P. abiesa 154 6160 128.0 ± 6.7 36.1 ± 8.0 -0.36 ± 0.19 0.27 ± 0.2a needle elongation (BBCH 10)
Climate data
As temperature reference, the gridded daily mean temperatures providedin the E-OBS Dataset version 7.0 (Haylock et al. 2008) was used. Thedataset provides European daily mean temperatures since 1950 on a 0.25◦
regular grid (∼28 km). Temperatures at the phenological observation siteswere calculated by using the corresponding grid cell’s temperature, cor-
4 Evaluating phenological models for the prediction of leaf-out dates 79
rected for the observation site’s elevation by a linear lapse rate. Thelapse rates were calculated daily, using a linear regression of the temper-atures of the 25 surrounding grid cells against their elevation. The ap-plied method provides reasonable estimates of local temperature whentested against actual weather station data (obtained from 157 weather sta-tions across Switzerland and Germany during the 40 years period: meanR2 = 0.98± 0.06, RMSE 1.0± 0.6 ◦C; Data provided by the GermanWeather Service DWD and MeteoSwiss) and outperformed the use ofmonthly- or annual averaged lapse rates. Photoperiod was calculated asa function of latitude and day-of-year using basic trigonometry (sunrise tosunset, without twilight; http://www.gandraxa.com/length_of_day.xml).
Model calibration and validation
First, to assess the general performance of the models, I fitted the modelsfor each species to the pooled dataset of all years and sites, and used a10-fold cross-validation (the resulting errors are hereafter referred to as‘pooled calibration’ and ‘pooled validation’). Second, to assess the site-specific performance of the models, each model was fitted over the whole40 years (‘site-specific calibration’) as well as evaluated using leave-one-out cross-validation over the 40 year observation period per individual site(‘site-specific validation’). Finally, to characterise the spatial transferabil-ity of site-specific model parameters, I used the parameters calibrated oneach site (‘site specific calibration’, see above) to predict the phenologyof all remaining sites (‘external site validation’) for each model.
Software
The model evaluation framework used here was implemented using theprogramming language C. Best parameters were estimated by minimis-ing the root mean squared error (RMSE) between observations and pre-diction, applying an adaption of the Adaptive Simulated Annealing code(ASA; Ingber 1993). Simulated annealing (Metropolis et al. 1953) hasbeen used previously for the parameterisation of phenology models and
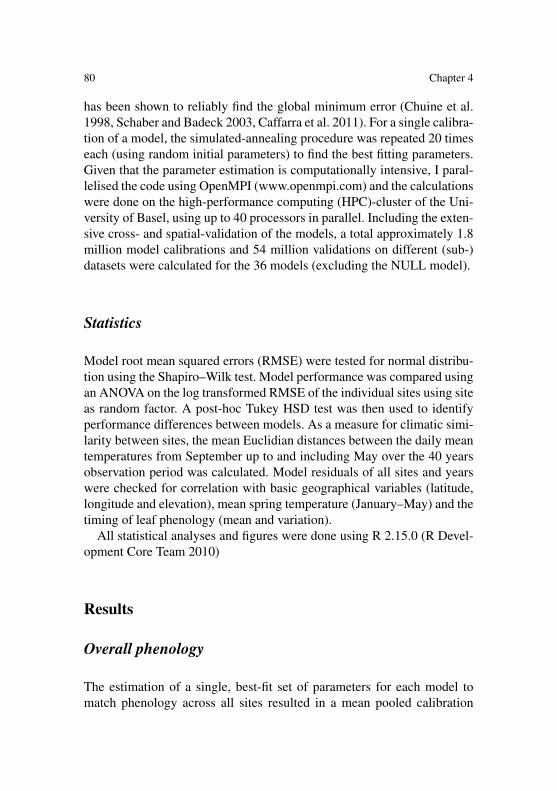
80 Chapter 4
has been shown to reliably find the global minimum error (Chuine et al.1998, Schaber and Badeck 2003, Caffarra et al. 2011). For a single calibra-tion of a model, the simulated-annealing procedure was repeated 20 timeseach (using random initial parameters) to find the best fitting parameters.Given that the parameter estimation is computationally intensive, I paral-lelised the code using OpenMPI (www.openmpi.com) and the calculationswere done on the high-performance computing (HPC)-cluster of the Uni-versity of Basel, using up to 40 processors in parallel. Including the exten-sive cross- and spatial-validation of the models, a total approximately 1.8million model calibrations and 54 million validations on different (sub-)datasets were calculated for the 36 models (excluding the NULL model).
Statistics
Model root mean squared errors (RMSE) were tested for normal distribu-tion using the Shapiro–Wilk test. Model performance was compared usingan ANOVA on the log transformed RMSE of the individual sites using siteas random factor. A post-hoc Tukey HSD test was then used to identifyperformance differences between models. As a measure for climatic simi-larity between sites, the mean Euclidian distances between the daily meantemperatures from September up to and including May over the 40 yearsobservation period was calculated. Model residuals of all sites and yearswere checked for correlation with basic geographical variables (latitude,longitude and elevation), mean spring temperature (January–May) and thetiming of leaf phenology (mean and variation).
All statistical analyses and figures were done using R 2.15.0 (R Devel-opment Core Team 2010)
Results
Overall phenology
The estimation of a single, best-fit set of parameters for each model tomatch phenology across all sites resulted in a mean pooled calibration

4 Evaluating phenological models for the prediction of leaf-out dates 81
Fig. 4.2: Mean (± SE) RMSE of predicted leaf unfolding dates of 37 models in 6species for pooled validation across all years and sites (40 years× n sites; 10-fold crossvalidation), site-specific calibration/validation (40 years per site; leave-one-out cross-validation) and, external validation of site-specific parameters. Model abbreviations:NULL: Mean date of leaf unfolding, LIN: Simple linear regression against mean tem-perature of specified months (Aesculus, Betula and Fagus: March and April; Quercus:April and May; Larix: February to April; Picea: March to May), TT: Thermal Time,PTT: Photothermal-time, M1: M1 model, AT: Alternating, SQ: Sequential, SM1: Se-quential M1, PA: Parallel, PM1: Parallel M1, UN: Unified, UM1: Unified M1, PM01-PM12: Promotor–Inhibitor, DPS: DormPhot spring, DP: DormPhot, DR: Deepening-Rest FP: Four-Phase; ‘s’ denotes the variant using a sigmoid, rather than linear forcingfunction; ‘b’ denotes the variant using a bell-shaped, rather than triangular, chillingfunction.

82 Chapter 4
error (RMSE) of around 7 ± 9 days, depending on species: lowest cal-ibration errors were obtained in Betula (6.6 days), highest in Larix (8.6days) while Fagus, Quercus, Picea and Aesculus took intermediate posi-tions (6.9, 7.2, 7.5 and 7.9 days, respectively). Due to the large size ofthe dataset, the pooled validation error (as estimated by a 10-fold cross-validation) was very similar to the pooled calibration error and varied onlyslightly across the individual cross-validation folds. As expected, all mod-els outperformed the NULL model (9.9 ± 13.6 days); however no singlemodel was distinctly superior. In contrast, no significantly different per-formance (RMSE) was observed between the majorities of the models(Fig. 4.2, ‘pooled validation’). The residuals of the different models werehighly correlated (mean r = 0.97± 0.02), except for the null models (meanr = 0.67 ± 0.05).
Species-specific differences were found for the time period providingthe lowest calibration and validation error in the simple linear regressionof leaf unfolding dates with mean temperatures: the mean of March andApril temperatures was best for Aesculus, Betula and Fagus, whereas themean of April and May temperatures was best for Quercus, the mean ofFebruary–April temperatures for Larix and finally the mean of March–May temperatures for Picea.
Site-specific phenology
Fitting the models to the individual 40 year time-series of each site re-sulted in a decreased mean RMSE across sites in all models comparedto pooled validation error (Fig. 4.2). The lowest mean site-specific val-idation RMSEs ranged from 4 to 5 days, with only minor differencesamong species (Fig. 4.3). While the models accounted for up to 70% ofthe variation in leaf unfolding during model calibration, only up to 40%of the variation was explained by the models in the cross-validation. Site-specific model calibration excludes the variation between sites (betweenecotypes or between individual trees), at the cost of less stable predictions,as indicated by the considerable difference between calibration and valida-tion error, which was roughly 12% larger than the calibration error acrossspecies and models (Fig. 4.2). Interestingly, models with only few param-eters, based on forcing temperature and photoperiod (M1, Photothermal-
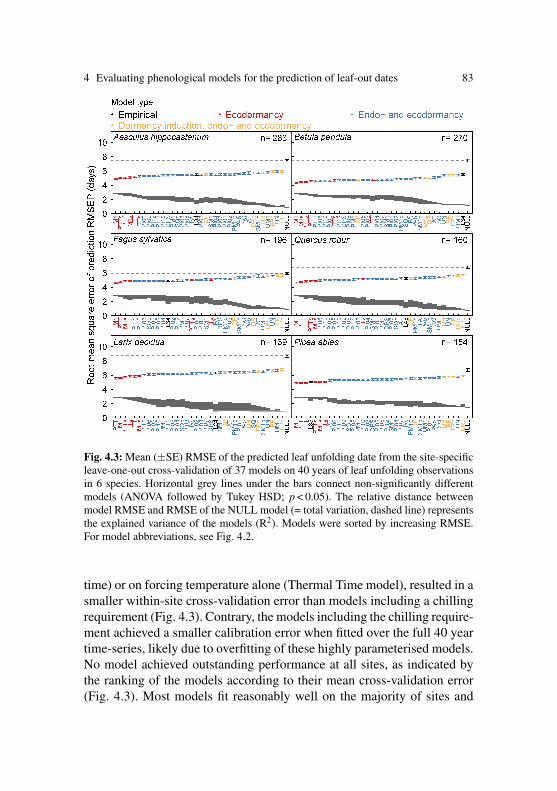
4 Evaluating phenological models for the prediction of leaf-out dates 83
Fig. 4.3: Mean (±SE) RMSE of the predicted leaf unfolding date from the site-specificleave-one-out cross-validation of 37 models on 40 years of leaf unfolding observationsin 6 species. Horizontal grey lines under the bars connect non-significantly differentmodels (ANOVA followed by Tukey HSD; p < 0.05). The relative distance betweenmodel RMSE and RMSE of the NULL model (= total variation, dashed line) representsthe explained variance of the models (R2). Models were sorted by increasing RMSE.For model abbreviations, see Fig. 4.2.
time) or on forcing temperature alone (Thermal Time model), resulted in asmaller within-site cross-validation error than models including a chillingrequirement (Fig. 4.3). Contrary, the models including the chilling require-ment achieved a smaller calibration error when fitted over the full 40 yeartime-series, likely due to overfitting of these highly parameterised models.No model achieved outstanding performance at all sites, as indicated bythe ranking of the models according to their mean cross-validation error(Fig. 4.3). Most models fit reasonably well on the majority of sites and

84 Chapter 4
worse on only a few sites, resulting in a positively skewed, log-normaldistribution of the RMSE across sites. Within a site, the residuals werenormally distributed. No tight correlation of the model performance withgeographical parameters of the sites (latitude, longitude and elevation) orsite mean spring temperature (January–May) was present in any model(R2 always < 0.06, slope always < 0.3). However, the prediction error ofall models was correlated with the yearly anomaly of phenology i.e. mod-els predictions were worse in years where the timing of leaf-out divergedfurther from the long-term mean (Fig. 4.4). This trend was strongest inFagus (mean slope = −0.58± 0.05, mean R2 = 0.37± 0.05; excludingthe NULL model) and Picea (slope = −0.52± 0.02, R2 = 0.35± 0.04),intermediate in Quercus (slope = −0.49± 0.02, R2 = 0.33± 0.03) andAesculus (slope =−0.45±0.02, R2 = 0.29±0.03), and slightly less pro-nounced in Larix (slope = −0.42± 0.02, R2 = 0.27± 0.03) and Betula(slope =−0.35±0.02, R2 = 0.21±0.03).
No significant differences (significance level 0.05) were found betweenmodel using the different chilling (triangular vs. bell shaped) and forc-ing functions (linear above base temperature vs. sigmoid temperature re-sponse), except in Fagus and Picea, where the Sequential model applyingthe bell shaped chilling functions achieved a significantly lower error thanthe variant applying the triangular response function. The addition of pho-toperiod to the classical endodormancy release models (Parallel, Sequen-tial and Unified) led to slightly (not significantly) lower mean predictionerrors for leaf unfolding in all species, especially in the case of the Paral-lel M1 model. Of the models describing the whole dormancy period, theDormPhot model always yielded the lowest prediction errors and was sig-nificantly different from other models of the same category in Aesculusand Betula, but not in the four other species.
Interestingly, the start day of the models simulating the ecodormancyphase only (without chilling) was always fitted best between mid-Januaryand mid-February, indicating that most variation of the actual bud burstdates under current climate may be (statistically) related to the temperatureand photoperiod conditions during early spring. Similarly, the calibrationof the chilling response in endodormancy-release models often yieldedrather late starting dates for chilling accumulation (early to mid-winter).
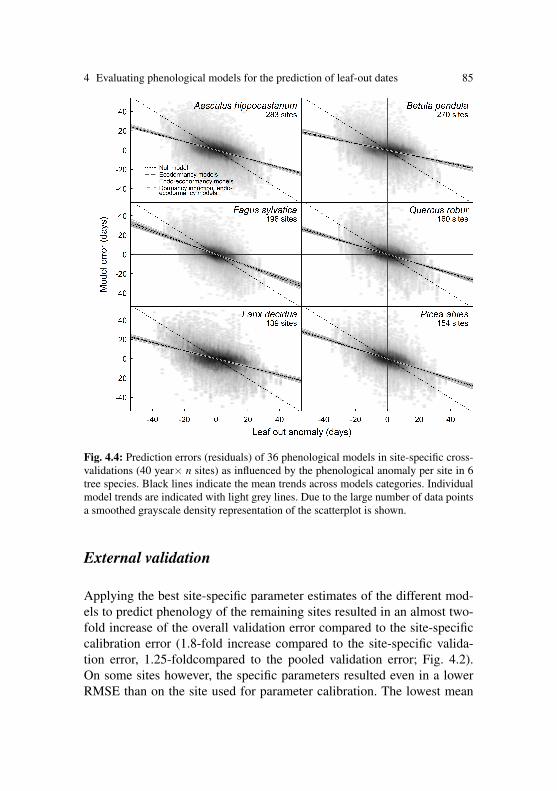
4 Evaluating phenological models for the prediction of leaf-out dates 85
Fig. 4.4: Prediction errors (residuals) of 36 phenological models in site-specific cross-validations (40 year× n sites) as influenced by the phenological anomaly per site in 6tree species. Black lines indicate the mean trends across models categories. Individualmodel trends are indicated with light grey lines. Due to the large number of data pointsa smoothed grayscale density representation of the scatterplot is shown.
External validation
Applying the best site-specific parameter estimates of the different mod-els to predict phenology of the remaining sites resulted in an almost two-fold increase of the overall validation error compared to the site-specificcalibration error (1.8-fold increase compared to the site-specific valida-tion error, 1.25-foldcompared to the pooled validation error; Fig. 4.2).On some sites however, the specific parameters resulted even in a lowerRMSE than on the site used for parameter calibration. The lowest mean
86 Chapter 4
RMSE of the external-validation across sites ranged from 7.9 ± 15 daysin Betula (M1 model), 8.3 ± 1.8 days in Fagus (M1 model), 9.3 ± 1.9days in Aesculus (M1 model), 9 ±1.9 days in Picea (Photothermal-timemodel) to 10 ± 12.0 days in Larix (Photothermal-time model). However,the best models performed only 29% (Fagus) to 35% (Betula) better thanthe NULL model (10.8 ± 14.2 days; Fig. 4.5). Again, the mean external-validation RMSEs of the different models were almost similar, as wasformerly found for the site-specific cross-validation RMSE. The external-validation performance was neither reasonably correlated with the geo-graphical distance from the calibration site to the validation site in anymodel (R2 always < 0.03, slope always < 0.01) nor with the mean Eu-clidean distance value of climate similarity among observation sites (R2
always < 0.05, slope always < 0.02).The model evaluation error increased with the increasing deviation of
the evaluations site’s mean phenology from the overall mean phenology.Surprisingly, the simple linear regression was among the models resultingin the lowest transfer error in 4 out the 6 species and yielded even thelowest absolute mean validation error in Fagus and Picea.
Discussion
The comparison of 35 ‘process-based’ phenological models for leaf un-folding in 6 tree species using a long-term observation dataset (40 years)revealed a surprisingly small effect of model structure on the quality ofprediction under a current climate. In the following the observed patternsand their implications for phenology modelling are discussed.
Model performance and structure
Model prediction errors
In general, no model could accurately predict the phenology of leaf un-folding with a single set of parameters calibrated across all years and sites.Instead, a broad range of models yielded an equally large error with highly

4 Evaluating phenological models for the prediction of leaf-out dates 87
Fig. 4.5: Mean (±SE) RMSE of the predicted leaf unfolding date of 37 models in 6species from the external site validation based on parameters calibrated on 40 yearsleaf unfolding observations per site. Horizontal grey lines under bars connect non-significantly different models (ANOVA followed by Tukey HSD; p < 0.05). The rela-tive distance between model RMSE and RMSE of the NULL model (= total variation,dashed line) represents the explained variance of the models (R2). Models were sortedby increasing RMSE. For model abbreviations, see Fig. 4.2.
correlated residuals. A mean error for leaf unfolding dates of more than aweek is rather insufficient for most applications, as, for example, a varia-tion of leaf unfolding of∼10 days has been suggested to induce a variationof ∼5.0% of annual GPP and ∼2% annual ET using global circulationmodels (Migliavacca et al. 2012). Site-specific calibration decreased themean prediction error to around 4 ± 5 days, similar to that of previousstudies using fewer models and data (e.g.,Schaber and Badeck 2003).

88 Chapter 4
Spatial extrapolation
The increased mean prediction error present when applying site-specificparameter sets to predict the phenology of other sites (external valida-tion; Fig. 4.2), indicates a limited spatial extrapolation potential of pro-cess based models. Indeed, for all 6 species assessed here, the predictionquality of a simple linear regression model was almost similar to that ofthe process-based models, a pattern also observed for two species by Ols-son and Jönsson (2014). The generally high prediction error for the exter-nal validation support the conclusions of a recent study investigating leafunfolding of Betula along urbanisation gradients in Germany (using theDormPhot model), that the possibility to use a space-for-time substitutionin phenological time-series is limited (Jochner et al. 2013). This claim isespecially true as the increase in the error of prediction on the validationsite was neither correlated with the distance from the calibration site norwith climate similarity of the sites (in terms of temperature). Thus, theobserved increase of the prediction error is likely based on several con-founded factors: (1) the individual variation of phenology among trees,(2) possible ecotypic/provenance differentiation of trees across sites or (3)the overfitting of a highly parameterised model on the small site-specificdataset (40 observations of leaf unfolding per site).
Leaf phenology is known to exhibit considerable variation even be-tween individuals of a given population. For example, most of the vari-ation of Pinus sylvestris L. in Scotland occurs within, and not betweenpopulations (Salmela et al. 2013). As most of the time-series used here,represent the phenology of individual trees (depending on the observationprotocol of the original collector/weather service), it is unknown to whichextent the individual tree is representing the mean phenology of a site.
A provenance differentiation of phenology, often related to climatic gra-dients, has been evidenced in common gardens for the timing of bud burst(e.g., Kriebel and Wang 1962, von Wuehlisch et al. 1995) and has beenattributed to different chilling and thermal forcing requirement amongprovenances, for example, a variation in the required temperature sumsfor bud burst (Gunderson et al. 2012, Vitasse et al. 2013). Some ecotypicdifferentiation has also been evidenced for the photoperiodic inductionof bud set (Wareing 1956, Vaartaja 1959, Kriebel and Wang 1962, vonWuehlisch et al. 1995, Thomas and Vince-Prue 1997) and bud burst inspring (Linkosalo and Lechowicz 2006, Basler and Körner 2012, 2014).

4 Evaluating phenological models for the prediction of leaf-out dates 89
However, the direction of the response of such genetic clines depends onspecies and the genetic effect on the timing of bud burst is often smallerthan the environmental effects in situ (Vitasse et al. 2013). Conducting‘hypothetical transplants’, several previous modelling studies, concludedthat local adaptation plays a subordinate role in predicting the floweringphenology of several, early successional lowland tree species (Chuine etal. 1999, 2000a,b).
Modelling endodormancy release
The similar performance of different models in all validation proceduresconducted here might have been caused by the general spring-temperatureaccumulation principle common to all these models (even though thetemperature-response functions differ among models). An analysis of thecalibrated parameters and the high correlation among predictions of differ-ent models indicate, that most models conform to a model dominated bythe accumulation of thermal forcing, while the additional parameters (e.g.,for chilling accumulation) modulated the residual variation only. Indeed,certain parameter combinations may even prune some features from thecomplex models, reducing them to simple thermal time models (Linkos-alo et al. 2008).
The finding that simple ecodormancy release models produce slightlybetter estimates of leaf phenology under current conditions than modelswith additional endodormancy release through chilling, is in line withseveral previous modelling studies (Häkkinen et al. 1998, Hannerz 1999,Linkosalo et al. 2000, 2008, Leinonen and Kramer 2002, Hänninen andKramer 2007, Granhus et al. 2009). A valid calibration of the chilling re-sponses during winter is limited to sites and species where the chillingfulfilment is currently an issue and where a lack of chilling is also re-flected in delayed leaf unfolding: on sites where the chilling requirementis fulfilled early in winter, buds remain in a state of ecodormancy for muchof the remaining winter (as growth is suspended due to low temperature orshort photoperiods). Hence, the chilling parameters are unlikely to be esti-mated unambiguously using fitting procedures, especially since the actualchilling requirements and effective ranges of chilling temperatures are yetscarcely known for forest tree species (Battey 2000) and thus wide param-eter ranges have to be used for model calibration.

90 Chapter 4
The calibration of models which include dormancy induction (Dorm-Phot, Deepening-Rest and Four-Phase model), suffer from the sparselyavailable observational data on the relevant autumnal phases (bud set anddormancy induction). The bulk of autumnal observations consist of par-tially coincidental, but more striking events such as leaf colouring and leaffall which have also been used as starting dates in phenological modellingstudies (Schaber and Badeck 2003). However, these events do not repre-sent the physiological state of bud dormancy induction and are stronglymodified by of a few cold nights in autumn (but see Delpierre et al. 2009).Statistical calibration of these parameters restricted to previously fixed pa-rameter ranges is thus often the only solution to calibrate such models.
Photoperiod responses during ecodormancy release
Models that included photoperiod during the ecodormancy release phasewere generally among the models with the best performance in all 6species. Linkosalo et al. (2006) speculated that the lower performance ofmodels including chilling, compared to simple forcing models, may becaused by a yet inadequately formulated temperature response during theearly phase of ecodormancy in late winter, soon after the fulfilment of thechilling requirement. The general trend to late starting dates in phenolog-ical models suggests either a negligible effect of mid-winter temperatureson the date of leaf unfolding under current conditions (as is also indicatedby the good fit of the simple linear regressions), indicating either that thestate of dormancy may affect the shape of the temperature response tochilling (Campbell and Sugano 1975, Hänninen 1990) or forcing temper-atures (Junttila and Hänninen 2012), or the presence of a strong externalthreshold, such as a possible photoperiod threshold. The trend to late start-ing dates may further result from the intrinsic model structure, such asanalysed for the Thermal Time model (Blümel and Chmielewski 2012).The inclusion of photoperiod as driver during ecodormancy release, as inthe Photothermal-time or M1 model or also in combination with precedentendodormancy release, may slightly indeed improve estimates of leaf un-folding dates and lead to more realistic parameters for the 6 tree speciesincluded here, and thus, should be considered as a reliable starting pointfor further model development.

4 Evaluating phenological models for the prediction of leaf-out dates 91
Underestimated inter-annual variation
All evaluated models underestimated the inter-annual variation of leafunfolding dates. The significant decrease of predictions quality for veryearly/late years indicates that models do not fully represent the true re-sponse to the environmental drivers. The underestimation of inter-annualvariation was slightly less pronounced in Betula and Aesculus (Fig. 4.4),the two species, where the inter-annual range of leaf-out dates is larger(Table 4.1), suggesting that the sparse coverage of extreme responsesin long-term observational data may bias model calibration and preventthe generalisation of the resulting parameter set. Consequently, eithera dataset containing a wider range of responses or a model calibrationscheme that puts more weight to extreme responses might be needed toimprove model parameterisation. These results support Hänninen’s (1995)conclusions, based on a comparison of leaf unfolding dates in field and inwarming experiments, that to predict phenology in a future climate, theuse of complementary data from experiments should be considered to in-crease data coverage for the calibration of the model parameters. However,in most cases the amount of data resulting from experiments does not al-low for direct calibration of complex models and should rather be usedto complement existing observational time-series or to restrict parameterranges, also because data from experiments may not be representative forobservations in situ (Wolkovich et al. 2012). For example, the phenologyof tree seedlings, as often used in experiments, does not represent the re-sponses of adult trees due to ontogenic differences (Vitasse 2013). Thus,to study dormancy release in warming and photoperiod experiments, cut-tings from adult trees should preferably be used (Vitasse and Basler 2014,Primack et al. 2015), whereas rooted cuttings or grafts from adult treesmay further be used to investigate the induction of dormancy or responsesto chilling temperatures in mid-winter.
Another possibility to extend the range of observed responses is to as-sess phenological data of transplant gardens e.g. International Phenolog-ical Gardens (Schnelle and Volkert 1974, Chmielewski and Rötzer 2001,Primack and Miller-Rushing 2009), where identical clones of trees weretransplanted to different climates and long time-series of phenological ob-servations are available. In fact, such data has been used, for example toshow that the transferability of model parameter estimates within a geno-type is high (Chuine et al. 2000a), and to calibrate the very complex Dorm-

92 Chapter 4
Phot model for Betula (Caffarra et al. 2011). Unfortunately, most datafrom experiments is limited to only few provenances and may thus, evenbe less suited for spatial extrapolation than in-situ observations.
Methodical considerations
Temperature data
The quality of the driving temperature data may have influenced modelcalibration and thus, the validation among sites. The gridded climatedataset used for this study is missing the exact local temperature con-ditions actually perceived by trees (despite the lapse-rate correction ap-plied). Yet, even precise weather station data from the vicinity of the phe-nological observation site may not reflect the actual temperature trees orbuds experience, yet the situation is certainly better for tall trees than forlow stature vegetation (Kollas et al. 2014). Furthermore, for practical rea-sons, e.g. data availability, data handling and computation time, only dailymean temperature, rather than higher resolution temperature data, havebeen applied to calibrate and run the models. This neglects the influenceof the diurnal amplitude of the temperature, known to affect phenologyin several species (Campbell and Sugano 1979, Erez and Couvillon 1987,Myking 1997, Partanen et al. 1998, Saxe et al. 2001).
Phenological time-series
The phenological data used for the parameterisation and validation of themodels were obtained from several national phenological networks acrossEurope, which used historically different observation protocols. The datacollected by many different observers are likely not free from flaws, al-though the robust error detection scheme (Schaber and Badeck 2002) ap-plied to the time-series, should have exclude the most unlikely data fromthe dataset. Unfortunately, no measure of the accuracy of the remainingindividual observations is available.
4 Evaluating phenological models for the prediction of leaf-out dates 93
Conclusions
The results obtained here show that it is not possible to prioritise a sin-gle mechanistic model as possible candidate for the actual mechanism ofdormancy release. Yet, the relatively similar performance of all 35 pro-cess based model assessed here, indicates that the model have the struc-tural flexibility to reproduce the weather-induced inter-annual variation ofspring phenology, even though their intrinsic mechanistic assumption orparameterisation may not reflect actual physiological responses that con-trol dormancy release. The transition from an empirically fitted model to amodel that accurately describes the physiological processes is gradual andlargely depends on the level of prior knowledge to reasonably restrict pa-rameter ranges. There are yet no clear physiological or molecular markersthat would allow to clearly separate and model each phase separately, e.g.,the fulfilment of the chilling requirement (Cooke et al. 2012). For mosttime-series in central Europe, simple models (simulating the ecodormancyrelease only) yield reasonable prediction for the concurrent climate whencalibrated with long phenological time-series. The simulation of endodor-mancy release or even of the whole period of dormancy in a phenologicalmodel is challenged by at least three, partially linked aspects: first, theaccurate mechanistic understanding of dormancy induction and release,second their correct representation in models, and third, model calibra-tion (overfitting) and data availability. The understanding of the underly-ing physiological mechanisms is essential, when making predictions forthe future climates beyond current observational data coverage. Thus, formaking such predictions I suggest running an ensemble of selected simple(ecodormancy) and more complex (endo-ecodormancy) models, until theunderlining processes are fully revealed and accurately represented in amodel.
Acknowledgements I am grateful to Christian Körner, Yann Vitasse and the anony-mous reviewers for their valuable comments which improved the original manuscript.Phenological data were provided by the members of the PEP725 project. I acknowl-edge the E-OBS dataset from the EU-FP6 project ENSEMBLES (http://ensembles-eu.metoffice.com) and the data providers in the ECA&D project (http://eca.knmi.nl).
This project was funded by Velux-Foundation grant 499 (to Ch. Körner) and sup-ported by NCCR-climate of the Swiss Science Foundation. The author received fund-ing from the Swiss State Secretariat for Education, Research and Innovation COSTFP1106 grant C12.0085 (to Ch. Körner) while completing the manuscript.
94 Chapter 4
References
Basler D, Körner C (2012) Photoperiod sensitivity of bud burst in 14 temperate foresttree species. Agric. For. Meteorol. 165 (0): 73–81.
Basler D, Körner C (2014) Photoperiod and temperature responses of bud swelling andbud burst in four temperate forest tree species. Tree Physiol. 34: 377–388.
Battey NH (2000) Aspects of seasonality. J. Exp. Bot. 51 (352): 1769–1780.Blümel K, Chmielewski FM (2012) Shortcomings of classical phenological forcing
models and a way to overcome them. Agric. For. Meteorol. 164 (0): 10–19.Caffarra A, Donnelly A (2010) The ecological significance of phenology in four differ-
ent tree species: effects of light and temperature on bud burst. Int. J. Biometeorol.55 (5): 711–721.
Caffarra A, Donnelly A, Chuine I (2011) Modelling the timing of Betula pubescensbud burst. II. Integrating complex effects of photoperiod into process-based models.Clim. Res. 46 (2): 159–170.
Campbell RK, Sugano A.I (1975) Phenology of bud burst in Douglas-fir related toprovenance, photoperiod, chilling, and flushing temperature. Bot. Gaz. 136 (3): 290–298.
Campbell RK, Sugano A.I (1979) Genecology of bud-burst phenology in Douglas-fir:response to flushing temperature and chilling. Bot. Gaz. 140 (2): 223–231.
Cannell MGR, Smith RI (1983) Thermal time, chill days and prediction of budburst inPicea sitchensis. J. Appl. Ecol. 20 (3): 951–963.
Chmielewski FM, Rötzer T (2001) Response of tree phenology to climate changeacross Europe. Agric. For. Meteorol. 108 (2): 101–112.
Chuine I (2000) A unified model for budburst of trees. J. Theor. Biol. 207 (3): 337–347.Chuine I, Beaubien EG (2001) Phenology is a major determinant of tree species range.
Ecol. Lett. 4 (5): 500–510.Chuine I, Belmonte J, Mignot A (2000a)A modelling analysis of the genetic variation
of phenology between tree populations. J. Ecol. 88 (4): 561–570.Chuine I, Cambon G, Comtois P (2000b) Scaling phenology from the local to the
regional level: advances from species-specific phenological models. Glob. ChangeBiol. 6 (8): 943–952.
Chuine I, Cour P, Rousseau DD (1998) Fitting models predicting dates of floweringof temperate-zone trees using simulated annealing. Plant Cell Environ. 21 (5): 455–466.
Chuine I, Cour P, Rousseau DD (1999) Selecting models to predict the timing of flow-ering of temperate trees: implications for tree phenology modelling. Plant Cell Env-iron. 22 (1): 1–13.
Cooke JEK, Eriksson ME, Junttila O (2012) The dynamic nature of bud dormancyin trees: environmental control and molecular mechanisms. Plant Cell Environ. 35(10): 1707–1728.
4 Evaluating phenological models for the prediction of leaf-out dates 95
Coville FC (1920) The influence of cold in stimulating the growth of plants. Proc. Natl.Acad. Sci. USA 6: 434–435.
Crepinšek, Z, Kajfež-Bogataj, L, Bergant K (2006) Modelling of weather variabilityeffect on fitophenology. Ecol. Model. 194 (1–3): 256–265.
de Réaumur RAF (1735) Observations du thermomètres, faites a Paris pendant l’année1735, comparées avec celles qui ont été faites sous la ligne, a l’isle de France, aAlger et quelques unes de nos isles de l’Amérique. Acad. R. Sci. 545: 545–576.
Delpierre N, Dufrene E, Soudani K, Ulrich E, Cecchini S, Boe J, Francois C (2009)Modelling interannual and spatial variability of leaf senescence for three deciduoustree species in France. Agric. For. Meteorol. 149 (6–7): 938–948.
Doorenbos J (1953) Review of the literature on dormancy in buds of woody plants.Medelingen Landbouwhogeschool Wageningen/Nederland 53: 1–24.
Erez A, Couvillon GA (1987) Characterization of the influence of moderate tempera-tures on rest completion in Peach. J. Am. Soc. Hortic. Sci. 112 (4): 677–680.
Fishman S, Erez A, Couvillon GA (1987a) The temperature-dependence of dormancybreaking in plants: computer-simulation of processes studied under controlled tem-peratures. J. Theor. Biol. 126 (3): 309–321.
Fishman S, Erez A, Couvillon GA (1987b) The temperature-dependence of dormancybreaking in plants: mathematical-analysis of a 2-step model involving a cooperativetransition. J. Theor. Biol. 124 (4): 473–483.
Granhus A, Floistad IS, Sogaard G (2009) Bud burst timing in Picea abies seedlings asaffected by temperature during dormancy induction and mild spells during chilling.Tree Physiol. 29 (4): 497–503.
Gunderson CA, Edwards NT, Walker AV, O’Hara KH, Campion CM, Hanson PJ (2012)Forest phenology and a warmer climate: growing season extension in relation toclimatic provenance. Glob. Change Biol. 18: 2008–2025.
Häkkinen R (1999) Statistical evaluation of bud development theories: application tobud burst of Betula pendula leaves. Tree Physiol. 19 (9): 613–618.
Häkkinen R, Linkosalo T, Hari P (1998) Effects of dormancy and environmental factorson timing of bud burst in Betula pendula. Tree Physiol. 18 (10): 707–712.
Hannerz M (1999) Evaluation of temperature models for predicting bud burst in Nor-way spruce. Can. J. For. Res. 29 (1): 9–19.
Hänninen H (1990) Modelling bud dormancy release in trees from cool and temperateregions. Acta For. Fennica 213: 1–47.
Hänninen H (1995) Effects of climatic-change on trees from cool and temperate re-gions: an ecophysiological approach to modeling of bud burst phenology, Can. J.Bot. 73 (2): 183–199.
Hänninen H, Kramer K (2007) A framework for modelling the annual cycle of trees inboreal and temperate regions. Silva Fenn. 41 (1): 167–205.
Haylock MR, Hofstra N, Tank AMGK, Klok EJ, Jones PD, New M (2008) A Europeandaily high-resolution gridded data set of surface temperature and precipitation for1950–2006. J. Geophys. Res. Atmos. 113 (D20119): 1–12.

96 Chapter 4
Hunter AF, Lechowicz MJ (1992) Predicting the timing of budburst in temperate trees,J. Appl. Ecol. 29 (3): 597–604.
Ingber L (1993) Adaptive Simulated Annealing (ASA) Global Optimization C-code,Caltech Alumni Association; Pasadena, CA.
Jochner S, Caffarra A, Menzel A (2013) Can spatial data substitute temporal data inphenological modelling? A survey using birch flowering. Tree Physiol. 33 (12):1256–1268.
Junttila O, Hänninen H (2012) The minimum temperature for budburst in Betula de-pends on the state of dormancy. Tree Physiol. 32 (3): 337–345.
Kobayashi KD, Fuchigami LH (1983) Modeling bud development during the quiescentphase in red-osier Dogwood (Cornus sericea L.). Agric. Meteorol. 28 (1): 75–84.
Kollas C, Randin CF, Vitasse Y, Körner C (2014) How accurately can minimum tem-peratures at the cold limits of tree species be extrapolated from weather station data?.Agric. For. Meteorol. 184 (15): 257–266.
Körner C, Basler D (2010) Phenology under global warming. Science 327 (5972):1461–1462.
Kramer K (1994) Selecting a model to predict the onset of growth of Fagus sylvatica.J. Appl. Ecol. 31 (1): 172–181.
Kriebel HB, Wang CW (1962) The interaction between provenance and degree of chill-ing in bud-break of sugar maple. Silvae Genet. 11 (5/6): 125–130.
Krinner G, Viovy N, de Noblet-Ducoudré N, Ogée J, Polcher J, Friedlingstein P, CiaisP, Sitch S, Prentice IC (2005) A dynamic global vegetation model for studies of thecoupled atmosphere-biosphere system. Glob. Biogeochem.Cycles 19 (1): GB1015.
Landsberg JJ (1974) Apple fruit bud development and growth: analysis and an empiri-cal model. Ann. Bot. 38 (158): 1013–1023.
Lang GA, Early JD, Martin GC, Darnell RL (2002) Endo-, para-, and ecodormancy:physiological terminology and classification for dormancy research. HortScience 22(3): 371–377.
Leinonen I, Kramer K (2002) Applications of phenological models to predict the futurecarbon sequestration potential of boreal forests. Clim. Change 55 (1–2): 99–113.
Lindsley-Noakes GC, Louw M, Allan P (1995) Estimating daily positive Utah ChillUnits using daily minimum and maximum temperatures. J. S. Afr. Soc. Hortic. Sci.5: 19–23.
Linkosalo T, Carter TR, Häkkinen R, Hari P (2000) Predicting spring phenology andfrost damage risk of Betula spp. under climatic warming: a comparison of two mod-els. Tree Physiol. 20 (17): 1175–1182.
Linkosalo T, Häkkinen R, Hänninen H (2006) Models of the spring phenology of borealand temperate trees: is there something missing?. Tree Physiol. 26 (9): 1165–1172.
Linkosalo T, Lechowicz MJ (2006) Twilight far-red treatment advances leaf bud burstof silver birch (Betula pendula Roth). Tree Physiol. 26: 1249–1256.
Linkosalo T, Lappalainen HK, Hari P (2008) A comparison of phenological models ofleaf bud burst and flowering of boreal trees using independent observations. TreePhysiol. 28, 1873–1882.

4 Evaluating phenological models for the prediction of leaf-out dates 97
Masle J, Doussinault G, Farquhar GD, Sun B (1989) Foliar stage in wheat correlatesbetter to photothermal time than to thermal time. Plant Cell Environ. 12 (3): 235–247.
Metropolis N, Rosenbluth AW, Rosenbluth MN, Teller AH, Teller E (1953) Equationof state calculations by fast computing machines. J. Chem. Phys. 21 (6): 1087–1092.
Migliavacca M, Sonnentag O, Keenan TF, Cescatti A, O’Keefe J, Richardson AD(2012) On the uncertainty of phenological responses to climate change, and im-plications for a terrestrial biosphere model. Biogeosciences 9 (6): 2063–2083.
Murray MB, Cannell MGR, Smith RI (1989) Date of budburst of 15 tree species inBritain following climatic warming. J. Appl. Ecol. 26 (2): 693–700.
Myking T (1997) Effects of constant and fluctuating temperature on time to budburstin Betula pubescens and its relation to bud respiration. Trees-Struct. Funct. 12 (2):107–112.
Partanen J, Koski V, Hänninen H (1998) Effects of photoperiod and temperature on thetiming of bud burst in Norway spruce (Picea abies). Tree Physiol. 18 (12): 811–816.
Perry TO (1971) Dormancy of trees in winter. Science 171 (3966): 29–36.Primack RB, Laube J, Gallinat AS, Menzel A (2015) From observations to experiments
in phenology research: investigating climate change impacts on trees and shrubsusing dormant twigs. Ann. Bot. 116 (6): 889-897
Primack RB, Miller-Rushing AJ (2009) The role of botanical gardens in climate changeresearch. New Phytol. 182 (2): 303–313.
Olsson C, Jönsson AM (2014) Process-based models not always better than empiricalmodels for simulating budburst of Norway spruce and birch in Europe. Glob. ChangeBiol. 20: 3492–3507.
R Development Core Team (2010) A Language and Environment for Statistical Com-puting. Foundation for Statistical Computing; Vienna, Austria.
Richardson AD, Keenana TF, Migliavacca M, Ryu Y, Sonnentag O, Toomey M (2013)Climate change, phenology, and phenological control of vegetation feedbacks to theclimate system. Agric. For. Meteorol. 169 (0): 156–173.
Richardson EA, Seeley SD, Walker DR (1974) A model for estimating the completionof rest for ‘Redhaven’ and ‘Elberta’ peach trees. HortScience 9: 331–333.
Salmela MJ, Cavers S, Cottrell JE, Iason GR, Ennos RA (2013) Spring phenologyshows genetic variation among and within populations in seedlings of Scots pine(Pinus sylvestris L.) in the Scottish Highlands. Plant Ecol. Divers. 6 (3-4): 523–536.
Saxe H, Cannell MGR, Johnsen B, Ryan MG, Vourlitis G (2001) Tree and forest func-tioning in response to global warming. New Phytol. 149 (3): 369–399.
Schaber J, Badeck FW (2002) Evaluation of methods for the combination of phenolog-ical time series and outlier detection. Tree Physiol. 22 (14): 973–982.
Schaber J, Badeck FW (2003) Physiology-based phenology models for forest treespecies in Germany. Int. J. Biometeorol. 47 (4): 193–201.
Schnelle F, Volkert E (2012) International Phenological Gardens in Europe: the basicnetwork for international phenological observations. In: Lieth H (Ed.) Phenologyand Seasonality Modeling. Ecological Studies, 1974 ,Springer; Berlin, Heidelberg,pp. 383–387.

98 Chapter 4
Siebert S, Ewert F (2012) Spatio-temporal patterns of phenological development inGermany in relation to temperature and day length. Agric. For. Meteorol. 152: 44–57.
Thomas B, Vince-Prue D (1997) Photoperiodism in Plants. Academic Press; London,428.
Vaartaja O (1959) Evidence of photoperiodic ecotypes in trees. Ecol. Monogr. 29 (2):91–111.
Vegis A (1964) Dormancy in higher plants. Annu. Rev. Plant Phys. 15: 185–224.Vitasse Y (2013) Ontogenic changes rather than difference in temperature cause under-
story trees to leaf out earlier. New Phytol. 198 (1): 149–155.Vitasse Y, Basler D. (2014) Is the use of cuttings a good proxy to explore phenologi-
cal responses of temperate forests in warming and photoperiod experiments?. TreePhysiol. 34 (2): 174–183.
Vitasse Y, Hoch G, Randin CF, Lenz A, Kollas C, Scheepens JF, Körner C. (2013)Elevational adaptation and plasticity in seedling phenology of temperate deciduoustree species. Oecologia 171 (3): 663–678.
von Wuehlisch G, Krusche D, Muhs HJ (1995) Variation in temperature sum require-ment for flushing of beech provenances. Silvae Genet. 44 (5–6): 343–346.
Wang JY (1960) A critique of the heat unit approach to plant-response studies. Ecology41 (4): 785–790.
Wareing PF (1956) Photoperiodism in woody plants. Annu. Rev. Plant Phys. 7: 191–214.
Weinberger JH (1950) Chilling requirements of peach varieties. Proc. Am. Soc. Hortic.Sci. 56 (DEC): 122–128.
White MA, Thornton PE, Running SW (1997) A continental phenology model for mon-itoring vegetation responses to interannual climatic variability. Glob. Biogeochem.Cycles 11 (2): 217–234.
Wolkovich EM, Cook BI, Allen JM, Crimmins TM, Betancourt JL, Travers SE,PauS, Regetz J, Davies TJ, Kraft NJB, Ault TR, Bolmgren K, Mazer SJ, McCabe GJ,McGill BJ, Parmesan C, Salamin N, Schwartz MD, Cleland EE (2012) Warmingexperiments underpredict plant phenological responses to climate change. Nature485 (7399): 494–497
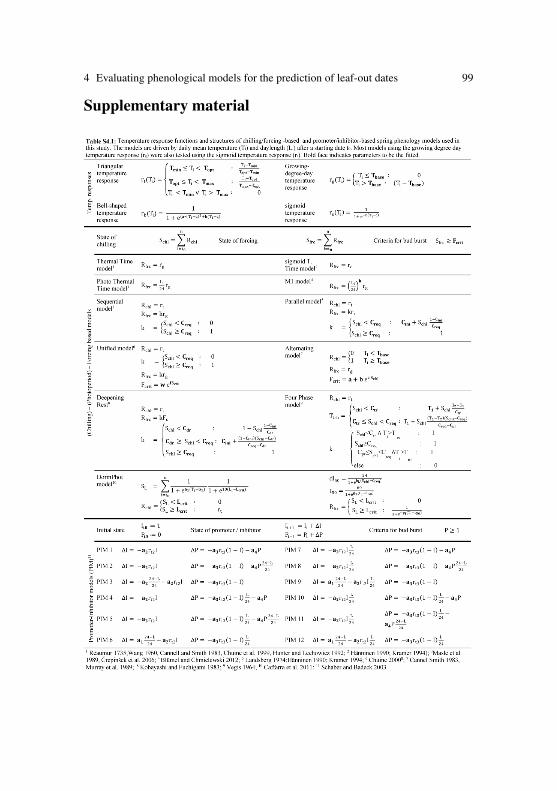
4 Evaluating phenological models for the prediction of leaf-out dates 99
Supplementary material

100 Chapter 4
Table S4.2: Parameter ranges used to calibrate the models.
General parameters for several modelsStartdaya −168≤ to ≤ 182
Growing degree day response Sigmoid temperature response−5≤ Tbase ≤ 10 0≤ Fcrit ≤ 3500≤ Fcrit ≤ 2000 0≤ b≤ 100
0≤ c≤ 100
Triangular chilling response Bell-shaped chilling response−5≤ Topt ≤ 10 0≤Ca ≤ 10−5≤ Tmin ≤ 10 −20≤Cb ≤ 200≤ Tmax ≤ 15 −10≤Cc ≤ 100≤Creq ≤ 350
Model-specific parameterParallel Alternating0≤Cini ≤ 1 −168≤ tochill ≤ 182
0≤ a≤ 500DeepeningRest 0≤ b≤ 10000≤Cini ≤ 1 0≤ c≤ 50≤Cdr ≤ 350 0≤ Tbase ≤ 8
Unified FourPhase0≤ Fb ≤ 100 0≤Ctr ≤ 3500≤ Fc ≤ 15 0≤Cpr ≤ 3500≤ w≤ 1000 0≤ T1 ≤ 15−100≤ k ≤ 0 0≤ T2 ≤ 20
0≤ b≤ 50PIM 1-12 −5≤ c≤ 10−25≤ IT min ≤ 10−15≤ ITopt ≤ 20 DormPhot0≤ IT max ≤ 35 8≤ Lcrit ≤ 14−20≤ PT min ≤ 15 0≤ Dcrit ≤ 1000≤ PTopt ≤ 40 0≤Ccrit ≤ 1005≤ PT max ≤ 45 0≤ Fcrit ≤ 1000≤ a1 ≤ 1 −5≤ aL ≤ 50≤ a2 ≤ 1 0≤ bL ≤ 200≤ a3 ≤ 1 0≤ aC ≤ 50≤ a4 ≤ 1 0≤ cC ≤ 20
0≤ hDL ≤ 20astartday refers to the start day of forcing for ecodormancy models, to the startday ofchilling or dormancy induction for all other models. Startday -182 refers to day 183(July 1) of the previous year

Part IIFurther studies and reviews


Chapter 5Phenology under global warming
Christian Körner, David Basler
In most temperate tree species, phenological events such asflowering and autumnal cessation of growth are not primarilycontrolled by temperature.
Phenological events such as bud burst, flowering, and senescence havereceived increased interest in the light of global warming (Cleland et. al2007, Khanduri et al. 2008, Morin et al. 2009). Spring events at temper-ate latitudes have advanced by 2.5 days per decade since 1971 (Menzelet al. 2006). As global warming progresses, how will it affect the arrivalof spring and the length of the growing season?
In humid extratropical areas, the three most important factors control-ling phenology in dominant forest tree species are the degree of winterchilling, photoperiod (day length relative to night length), and tempera-ture (Hay 1990, Chuine and Cour 1999, Körner 2007; see the Fig. 5.1).Because the seasonal course of temperature varies strongly from year toyear, sensitivity to photoperiod protects plants from the potentially fa-tal consequences of simply tracking temperatures at the ‘wrong’ time ofthe year. Photoperiod controls the induction (formation of winter buds,leaf abscission meristems, and freezing resistance; Wareing 1956, Li etal. 2003, Keskitalo et al. 2005) and release from dormancy, the onset ofgrowth, and reproductive events, including synchronous flowering (Kellerand Körner 2003, Jackson 2009). Temperature plays a modulating roleand triggers the visible progress of phenology, such as leaf coloration, inmany species.
Original article published in Science 327:1461-1462
103

104 Chapter 5
Because the photoperiod is equally long in autumn and spring, dor-mancy release in spring requires the information that winter has passed,obtained from the dose of low temperatures experienced by the plant.When this chilling requirement is fulfilled, plants become receptive tophotoperiod signals. Once a critical photoperiod has passed, actual budbreak is a matter of concurrent temperature. A lack of sufficient chillingin mild winters delays bud break (Murray et al. 1989) but may be par-tially replaced by long photoperiods and/or very high temperatures (Heide1993).
Not all tree species are sensitive to photoperiod, but the long-lived, latesuccessional species that become dominant in mature forests commonlyare. The genetic controls of plant development by photoperiod even re-main in action when these temperate tree species are transplanted to sub-tropical parks, where bud break in hackberry (Celtis), beech (Fagus), andoak (Quercus) species was never found to occur before early March, de-spite exceptionally high temperatures in this exotic environment (Borchertet al. 2005). It is thus a misconception to linearly extrapolate a few daysadvance of leafing during warm years into a proportional lengthening ofthe growing season in climate warming scenarios (Penuelas 2009, Moseret al. 2010).
Shorter-lived, early successional species adopt a more risky life strat-egy (Körner 2007). Many phenological observations in the literature comefrom such pioneer species as hazel, poplars, or birch, which are oppor-tunistic (photoperiod-insensitive in spring). Other opportunistic speciesinclude weeds, as well as ornamental plants from warmer climates.
For instance, the famous phenological time series for horse chestnut inthe streets of Geneva (Defila and Clot 2001), showing clear advances inleafing, is for an exotic species from a sub- Mediterranean setting. Anotherprominent time series shows early flowering of domestic cherry trees (De-fila and Clot 2001), which exhibit adaptive traits from central Asia, fromwhere the cultivars originate. In these continental regions, the advent ofspring is rather invariable, presumably due to the great distance from thesea, and phenological tracking of temperature bears no risk. In fact, treesin these regions should be more likely to keep tracking climatic warmingthan those in climates with more unpredictable weather systems, an inter-esting question to be explored in future work. Many ornamental plants intemperate gardens are photoperiod-insensitive, and their spring phenology

5 Phenology under global warming 105
Fig. 5.1: Not just temperature. Spring development in many ornamental plants fromwarm regions, such as lilac (Syringa), is primarily controlled by temperature, whereasearly successional species native to temperate latitudes, such as hornbeam (Carpinus),only become temperature-sensitive once their chilling demand has been fulfilled. Latesuccessional taxa, such as beech (Fagus), are photoperiod controlled, with temperatureonly exerting a limited modulating effect once the critical day length has passed. Thismechanism prevents such taxa from sprouting at the ‘wrong’ time.
tracks temperature with only very minor chilling requirements, as exem-plified by lilac (Syringa; Larcher 2007).
Phenology in late successional species will thus not continue to trackclimatic warming (the lengthening of the potential growing season) butwill increasingly become constrained by internal controls, as the photope-riod threshold (set by genes) is approached. For most extratropical trees,seasons will not become substantially longer until new genotypes emerge,which will take a few tree generations (a few hundred years) 1.
1 This estimate is based on what is known for weeds, which need about five generationsto evolve new latitude–specific photoperiod genotypes (Langlet 1971).

106 Chapter 5
Opportunistic taxa may profit from a warmer climate and may thus gaina competitive advantage over photoperiod-sensitive taxa. Rapid climaticwarming may also drive current tree genotypes into a disparity betweentheir insurance against ‘misleading’ (too early in the season) warm tem-peratures and concurrent temperature-sensitive soil processes such as min-eralization. Ecosystem nutrient losses are a potential consequence of treesgetting out of phase with the climate system. Climatic warming shouldthus not be seen as a self-evident cause for more tree growth.
Acknowledgements Funded by Velux-Foundation and National Center of Compe-tence in Research (NCCR) Climate of the Swiss Science Foundation.
References
Borchert R, Robertson K, Schwartz MD, Williams-Linera G (2005) Phenology of tem-perate trees in tropical climates. Int. J. Biometeorol. 50(1): 57–65.
Chuine I, Cour P (1999) Climatic determinants of budburst seasonality in four temperate-zone tree species. New Phytol. 143(2): 339–349.
Cleland EE, Chuine I, Menzel A, Mooney HA, Schwartz MD (2007) Shifting plantphenology in response to global change. Trends in Ecology & Evolution 22: 357–365
Defila C, Clot B (2001) Phytophenological trends in Switzerland. Int. J. Biometeorol.45(4): 203–207.
Hay RKM (1990) The Influence of photoperiod on the dry-matter production of grassesand cereals. New Phytol. 116(2): 233–254.
Heide OM (1993) Daylength and thermal time responses of budburst during dormancyrelease in some northern deciduous trees. Physiol. Plant. 88(4): 531–540.
Jackson, SD (2009) Plant responses to photoperiod. New Phytol. 181(3): 517–531.Keller F, Körner C (2003) The role of photoperiodism in alpine plant development.
Arct. Antarct. Alp. Res. 35(3): 361–368.Keskitalo J, Bergquist G, Gardestrom P, Jansson S (2005) A cellular timetable of au-
tumn senescence. Plant Physiol. 139(4): 1635–1648.Khanduri, VP, Sharma CM, Singh SP (2008). The effects of climate change on plant
phenology. Environmentalist 28(2): 143–147.Körner C (2007) Significance of temperature in plant life. In: Morison JIL, Morecroft
MD (Eds.) Plant Growth and Climate Change. Blackwell Publishing Ltd, Oxford,pp. 48–69.
Langlet O (1971) Two hundred years genecology. Taxon 20(5/6): 653-721.

5 Phenology under global warming 107
Larcher W (2007) Altitudinal variation in flowering time of lilac (Syringa vulgarisL.) in the Alps in relation to temperatures, Sitzber. Anzeiger Math.-Nat. Kl. Jg.2006.(212): 3–18
Li CY, Junttila O, Ernstsen A, Heino P, Palva, ET, (2003) Photoperiodic control ofgrowth, cold acclimation and dormancy development in silver birch (Betula pen-dula) ecotypes. Physiol. Plant. 117(2): 206–212.
Menzel A, Sparks TH, Estrella N, Koch E, Aasa A, Ahas R, Alm-Kubler K, Bissolli P,Braslavska O, Briede A, Chmielewski FM, Crepinšek Z, Curnel Y, Dahl A, DefilaC, Donnelly A, Filella Y, Jatcza K, Mage F, Mestre A, Nordli O, Penuelas J, PirinenP, Remisova V, Scheifinger H, Striz M, Susnik A, Van Vliet AJH, Wielgolaski FE,Zach S, Zust A (2006) European phenological response to climate change matchesthe warming pattern. Glob. Change Biol. 12(10): 1969–1976.
Morin X, Lechowicz MJ, Augspurger C, O’ Keefe J, Viner D, Chuine I (2009) Leafphenology in 22 North American tree species during the 21st century. Glob. ChangeBiol. 15(4): 961–975.
Moser L, Fonti P, Buntgen U, Esper J, Luterbacher J, Franzen J, Frank D (2010) Timingand duration of European larch growing season along altitudinal gradients in theSwiss Alps. Tree Physiol. 30(2): 225–233.
Murray MB, Cannell MGR, Smith RI (1989). Date of budburst of 15 tree species inBritain following climatic warming. J. Appl. Ecol. 26(2): 693–700.
Penuelas J, Rutishauser T, Filella I (2009) Phenology feedbacks on climate change.Science 324(5929): 887–888.
Wareing PF (1956) Photoperiodism in woody plants. Annu. Rev. Plant Phys. 7: 191–214.

Chapter 6What role for photoperiod in the bud burstphenology of European beech
Yann Vitasse, David Basler
Abstract A considerable number of studies have investigated the phenol-ogy of European beech using models, experimental controlled conditions,or descriptive surveys of patterns in situ. In spite of this interest, thereis no consensus about the environmental factors controlling bud burst inbeech, especially about the role of photoperiod and chilling temperature(cold temperature effective to release bud dormancy). However, recent ex-perimental and modelling studies provide new insights into the means bywhich these environmental factors control beech phenology. This presentcontribution aims to reconcile contradictory hypotheses about the mainenvironmental factors controlling bud burst date of European beech. First,we review the main published results on the environmental control ofbeech phenology both in controlled and in natural conditions. Second,supported by the findings of recent studies, we propose a new theory forthe role of photoperiod during the chilling phase for explaining spatialand temporal variations in bud burst phenology of European beech. Ex-amples using long-term data from the Swiss Alps and Germany are pre-sented to support this theory. The possible impacts of future and ongoingclimate warming on beech phenology are discussed. Finally, due to inter-actions between chilling, forcing temperature, and photoperiod, we assertthat beech phenology follows a nonlinear trend across biogeographicalgradients such as changes in elevation or latitude and that the bud burst
Original article published in European Journal of Forest Research 132:1–8
109

110 Chapter 6
date of beech is expected not to undergo significant changes in responseto global warming, especially in warmer climates.
Key words: Fagus sylvatica, Spring phenology, Bud burst, Chilling, Pho-toperiod, Temperature, Climate change
Introduction
The European beech (Fagus sylvatica L.) is one of the most dominant for-est tree species in Europe. Its distribution area is mainly concentrated inthe Centre and West of Europe and covers various habitats ranging frommountainous regions in southern and Eastern Europe to lowlands in cen-tral Europe (Bolte et al. 2007). That said, and despite the considerable im-portance of the beginning of the growing season for tree growth (Rötzeret al. 2004, Churkina et al. 2005, Gomory and Paule 2011), tree fitnessand tree species distribution area (Chuine 2010), it is surprising that theway environmental factors act on bud burst phenology of beech is stillpoorly understood. Indeed, among temperate tree species, European beechhas always occupied a special place for scientists studying the phenologyof trees but nevertheless the accurate prediction of beech bud burst dateis still problematic because of various unresolved issues (Kramer 1994).The “apparent” contradictory results found in the literature led to differentassumptions about the main environmental factors controlling spatial andtemporal variations in bud burst dates of beech. Here, through our criti-cal appraisal of recent findings, we were able to reconcile the conflictingresults and propose a new theory for the role of photoperiod during thechilling phase to explain spatial and temporal variations in bud burst datesof European beech. We first review the different results reported from ob-servational studies, from experimental manipulations with particular ref-erence to biogeographical gradients, and from modelling studies. Then,we finally test our theory through a new analysis of data from differentelevations.
6 Photoperiod and bud burst phenology of European beech 111
Spatial and temporal patterns of bud burst in nature
The spring phenological pattern of European beech differs to that of othertemperate tree species in two main aspects. First, the bud burst date ofbeech shows less temporal and spatial variations than most of the other de-ciduous tree species in Europe. For example, along elevational gradients,beech exhibits a slight delay in leaf unfolding dates, generally less than20 days 1000 m−1, whereas other co-occurring tree species, such as Quer-cus petraea or Larix decidua, delay more than 30 days 1000 m−1 (Dittmarand Elling 2006, Migliavacca et al. 2008, Vitasse et al. 2009b, Davi et al.2011, Jochner et al. 2012). During the last decades, the bud burst date ofbeech shows only low year-to-year variation, especially in mild climates.For instance, beech exhibits the lowest variability in leaf unfolding datesfrom year to year among the six forest tree species monitored in the same107 sites in Germany during the period 1980–2009 (Table 6.1). Further-more, although climatic warming over the last decades has significantlyadvanced spring phenology in most deciduous tree species (reviewed byBertin 2008), European beech has exhibited little or no spring phenolog-ical shift during this period (Menzel et al. 2001, Studer et al. 2005, Vi-tasse et al. 2009a). Accordingly, both spatial and temporal studies have re-ported relatively little sensitivity of beech bud burst date to spring temper-ature, with an average advance of 2 days for every 1 ◦C increase (Kramer1995, Vitasse et al. 2009a, Lebourgeois et al. 2010, Kreyling et al. 2012).Second, European beech is considered to be a late-flushing species, com-pared with most of the co-occurring broad-leaved tree species under mildand warm climates in Europe (Kramer 1995, Gordo and Sanz 2009, Vi-tasse et al. 2009a). Nevertheless, since tree species can respond to differ-ent environmental cues, e.g., photoperiod-sensitive against photoperiod-insensitive species (Körner and Basler 2010, Polgar and Primack 2011),and can have different sensitivity to temperature (Vitasse et al. 2009a), thespecies ranking for the timing of flushing can also change with climate.For instance, Vitasse et al. (2009b) reported that in the French PyreneesMountains, bud burst of beech commenced 20 days later than sessile oakand about one week later than sycamore and European ash at low elevation(below 500 m), whereas it commenced one week earlier than those speciesat high elevation (above 1500 m). In summary, beech can be considered asa late-flushing species under warm or mild climates, but not necessarilyunder colder climates within its range.

112 Chapter 6
Table 6.1: Mean leaf unfolding date (day of the year) and pooled standard deviation(BBCH 11) across 107 sites in Germany from 1980 to 2009.
Species Mean date of leaf unfolding Pooled SD
Alnus glutinosa 107.0 11.95Betula pendula 107.1 9.42Fagus sylvatica 116.6 7.46Fraxinus excelsior 126.3 9.03Picea abiesa 126.4 8.63Quercus robur 122.1 8.06
Only sites where all species are present were selected. Data were provided by themembers of the PEP725 Pan European Phenology Data project (Accessed 2011-04-1at http://www.zamg.ac.at/pep725/)a Leaf separation (BBCH10)
What can we learn from experimental studies?
Many experiments have been conducted using European beech in an at-tempt to elucidate the biological mechanisms involved in bud dormancyrelease. This knowledge is crucial for us to understand and predict howtrees will respond in different climates. So far, the diversity of oftencontradictory results from these experiments has proven hard to unify,leaving the environmental controls of dormancy release and beech budburst poorly understood. However, due to the renewed enthusiasm of re-searchers to assess the future shift of tree phenology in response to climatewarming, several new experimental studies have been conducted, provid-ing a better insight into the different factors involved and their interactionsin the mediation of bud burst of European beech.
Evidence of high chilling requirement for dormancyrelease
Before the 1990s, experimental studies using tree seedlings under con-trolled conditions generally highlighted the role of chilling temperaturesand/or the photoperiod in determining the date of bud burst of somelate-leafing species included European beech. For instance, Murray et al.

6 Photoperiod and bud burst phenology of European beech 113
(1989) demonstrated for a set of common European broad-leaved treespecies that an increased duration of chilling temperatures led to a de-crease in the heating requirement for bud burst. They pointed out that, ofthis set, beech was unique because it was the only species to never reach itsminimal thermal time requirement as long as the previous chilling temper-ature increased. Based on this result, they suggested that European beechhas a very high chilling requirement to fully release bud dormancy, some-thing which was confirmed later by Falusi and Calamassi (1990) and byCaffarra and Donnelly (2011). We applied the same calculation method asMurray et al. (1989) to beech phenology data recorded in situ from largeelevational gradients and published in Vitasse et al. (2009b), which con-firmed that beech seems to have a high chilling requirement (Fig. 6.1). Theincrease of the chilling duration exponentially reduces the thermal time tobud burst in sessile oak, among many other tree species (e.g. Murray etal. 1989, Harrington et al. 2010); however, in European beech, there wasa linear relationship in our data between thermal time requirement to budburst and the duration of chilling (Fig. 6.1). This result would indicate thatmost of the beech populations monitored in Vitasse et al. (2009b) currentlyinhabit environments which do not allow the full satisfaction of their chill-ing requirement, except perhaps for the highest populations which expe-rienced more than 120 days of chilling days over winter (Fig. 6.1). How-ever, this result should be interpreted with caution, because photoperiod isa confounding factor in situ as it may affect the relationship between forc-ing (warm temperatures) and chilling requirement (see next section). Inaddition, the temperature ranges where chilling and forcing temperatureare effective on bud dormancy are likely overlapping and are still unclearfor most species (Harrington et al. 2010, Cooke et al. 2012).
Evidence of photoperiodic mediation in late winter andearly spring
Although it is commonly assumed that chilling temperatures play a cru-cial role in regulation of bud burst dates for European beech, the role ofphotoperiod remains more equivocal. There are conflicting reports on theinfluence of photoperiod during chilling, forcing and both phases of buddevelopment. Some studies have claimed that photoperiod may modulate

114 Chapter 6
Fig. 6.1: Relationship between the thermal time required to bud burst, calculated as thesum of day degrees > 5 ◦C from 1st January to the date of leaf unfolding, and the accu-mulated number of chill days for populations of Fagus sylvatica and Quercus petraeamonitored across two elevational gradients in Pyrenees mountains during 2005–2007period (dataset from Vitasse et al. 2009b). A linear regression model was fitted to Fa-gus sylvatica (y =− 3.22x + 591) and a nonlinear model was fitted to Quercus petraea(y = 220 + 594 e−0.037x). The studied sites covered 10 populations of Fagus sylvaticaand 14 populations of Quercus petraea at elevations ranging from 100 to 1600 m a.s.l..Air temperature at 2 m height was recorded hourly in each site, whereas leaf develop-ment was assessed every 10 days (see Vitasse et al. 2009a, b for further information)

6 Photoperiod and bud burst phenology of European beech 115
the amount of accumulated forcing temperature required to initiate budburst of beech even after the buds were assumed to be fully chilled (Ware-ing 1953, Heide 1993), while Falusi and Calamassi (1990) found only anegligible effect of photoperiod. Heide (1993) reported that both photope-riod and chilling temperature together control the timing of bud burst. Inparticular, he found that nonchilled buds sampled in November and De-cember are unable to develop until they have received a substantial periodof chilling, even under long day conditions. Finally, by controlling boththe amount of chilling and the photoperiod on beech seedlings, Falusi andCalamassi (1996) reported that long days could partially substitute win-ter chilling. In other words, a longer photoperiod may reduce the thermaltime requirement for bud burst when chilling temperatures are insufficientto fully release the buds from dormancy. More recently, Caffarra and Don-nelly (2011) reconfirmed these earlier results that photoperiod only has astrong effect on buds when they are not fully chilled. This study clearlyshows a decrease in the photoperiod effect with increasing exposure tochilling temperatures.
Interactions between photoperiod and chilling/forcingtemperatures
Since beech is assumed to have a very large chilling requirement, whichtends to be reached only in the coldest parts of its current distribution (seeprevious section), it is likely that overwintered buds collected in previ-ous experimental studies were not all fully chilled (e.g. in Wareing 1953,Heide 1993). Thus, the equivocable results of these studies on the role ofphotoperiod are controversial because they are likely to be based on a mix-ture of fully or partially chilled buds. The contradictory results could alsoarise from the way experiments are conducted. For instance, some stud-ies used different fixed photoperiod (e.g. Heide 1993, Caffarra and Don-nelly 2011) rather than gradually lengthening photoperiods (Basler andKörner 2012), or used cutting twigs (Heide 1993) rather than the wholeplant (e.g. Falusi and Calamassi 1996, Caffarra and Donnelly 2011). Fi-nally, all experiments manipulating photoperiod have been conducted onseedlings or twig cuttings which may not mirror the phenology of adulttrees growing in situ (Basler and Körner 2012, Vitasse Unpublished data).

116 Chapter 6
The main challenge today is to quantify how the photoperiod and chillingtemperatures interact together to influence the timing of beech bud burstas well as the physiological and molecular modes of action of these pro-cesses (Falusi and Calamassi 2003, Cooke et al. 2012). Indeed, there aretwo main different ways in which photoperiod, sensed by the plants phy-tochrome system, may interact with chilling and forcing temperatures: (1)A fixed photoperiod threshold might be required to trigger dormancy re-lease, subsequently allowing buds to respond to forcing temperature witha forcing requirement depending on the chilling fulfilment (Fig. 6.2a), (2)The forcing requirement for bud burst might decrease towards its minimalvalue when increases in the photoperiod are detected (Fig. 6.2b), or theaccumulation rate of forcing temperature could be accelerated by increas-ing bud sensitivity to forcing as photoperiod increases, or after passing acertain threshold of photoperiod (not shown).
A recent experimental study conducted on Betula pubescens combinedwith a new phenological model that accounts for the effects and interac-tions of temperature and photoperiod supports the last hypothesis, sug-gesting that photoperiod affects the rate of forcing accumulation (Caffarraet al. 2011). These authors also demonstrate that the photoperiod effect isgreater when there is a deficit in the amount of chilling that bud experi-ences.
What can we learn from modelling studies?
Phenological models underline the importance of chillingtemperatures in the prediction of bud burst dates forEuropean beech
Until recently, two classes of process-based models were classically usedto simulate spring phenological phases of trees. The first class of mod-els, called hereafter the ‘1-phase models’, considers only forcing temper-ature, assuming that bud burst occurs after a fixed sum of forcing unitshas been reached. This kind of model implicitly assumes that dormancy isfully released before the starting date of forcing accumulation. The secondclass of models, called hereafter the ‘2-phase models’, considers the ac-

6 Photoperiod and bud burst phenology of European beech 117
Fig. 6.2: Conceptual scheme on the two hypotheses for the role of photoperiod on forc-ing requirement in the bud burst phenology of European beech. Fig. 6.2a. A fixed pho-toperiod threshold triggers dormancy release, subsequently allowing buds to respond toforcing temperature; Fig. 6.2b. The forcing requirement for bud burst decreases towardsits minimal value when increases in the photoperiod are detected. Note that, alterna-tively, the accumulation rate of forcing temperature could be accelerated by increasingbud sensitivity to forcing as photoperiod increases (not drawn).
tion of chilling temperatures during the endodormancy phase (winter deepdormancy caused by plant endogenous factors) and forcing temperaturesduring the ecodormancy phase (dormancy maintained by environmentalfactors, see Lang et al. 1987). The 2-phase models assume that the accu-mulation of forcing units starts and/or evolves according to the state of buddevelopment during endodormancy (Chuine 2000, Hänninen and Kramer2007, Vitasse et al. 2011) and that the critical sum of forcing units maybe related to the amount of chilling units previously received (Cannelland Smith 1983, Murray et al. 1989). For most tree species, the 1-phasemodels have been shown to perform similarly or better than the 2-phasemodels (e.g. Hunter and Lechowicz 1992), suggesting that under current

118 Chapter 6
and past climate, the chilling requirement of trees seems to be fully met. Incontrast, for beech, or in general for late-leafing species, the 2-phase mod-els tend to outperform the 1-phase models (Kramer 1994, Thompson andClark 2008, Vitasse et al. 2011). This is in agreement with the assumptionthat beech has a high chilling requirement to release dormancy and maynot always saturate its chilling phase, especially in the mild winter ex-perienced in southern and central parts of its distribution area. However,outputs from phenological models should be interpreted with caution sincethe state of chilling can be year to year correlated with the state of forcing(controlled by spring temperature). This correlation would give equivalentperformance between 1- and 2-phase models without proving that chillingrequirement is fully met. The advantage of 2-phase models would appearwhen the amount of chilling strongly varies from year to year and if thisvariation is not correlated with spring temperature. Towards new modelsintegrating photoperiodic effect In spite of the improvement of predictionsgained by using 2-phase models, the accuracy of these predictions is gen-erally lower for European beech than for the other cooccurring tree species(Vitasse et al. 2011). This is likely due to the additional photoperiod sen-sitivity of this species besides the chilling and forcing temperature effects,as demonstrated by the experimental studies presented in the previous sec-tion. Although the influence of photoperiod in beech phenology has beenpreviously tested in models, the results were inconsistent: Schaber andBadeck (2003) suggested strong photoperiodic control with chilling play-ing only a subordinate role, whereas Kramer (1994) found lower modelefficiency when photoperiod was incorporated into the model. However,these two previous studies included photoperiod only as a function affect-ing the rate of chilling. Yet, experimental studies suggest that the photope-riod effect acts more on forcing rate via interaction with chilling require-ment (Falusi and Calamassi 1996), as it was also demonstrated for Betulapubescens (Myking and Heide 1995, Caffarra et al. 2011). Hence, an orig-inal moresophisticated type of model which integrates some componentsof those models previously applied to beech (Kramer 1994, Chuine 2000,Hänninen and Kramer 2007) to address the effect of photoperiod on therate of forcing accumulation and requirement, depending on prior chillingtemperature, is currently being developed and performs better than classi-cal 2-phase models on Betula pubescens (Caffarra et al. 2011). This typeof model shows promise for testing our assumptions about the main envi-ronmental factors driving spring phenology in European beech.

6 Photoperiod and bud burst phenology of European beech 119
How to explain the temporal and spatial phenologicalpatterns of European beech: towards concordance betweenobservations and results from experiments and models?
As mentioned in the first section, beech exhibits low variation in bud burstdate from year to year or along environmental gradients in comparisonwith other species. This is especially true at low latitudes or elevations,i.e., in milder winter conditions. According to our theory, one would ex-pect weak variations in the date of bud burst in warm conditions such asat low elevation in a maritime climate and higher variations in cooler win-ter conditions, such as at high elevation, in the northern part of Europeor with a continental climate. Indeed, under mild winter conditions, budsare likely not to reach their optimal chilling and subsequently require ahigher degree of forcing before bud burst, which could potentially delaythe date of bud burst. However, as photoperiod lengthens through spring,it might compensate for this delay, either by increasing the forcing accu-mulation rate or by decreasing the amount of forcing required to bud burst(Fig. 6.2b). Consequently, in such warmer climates, the effect of photope-riod should counterbalance the lack of chilling that occurs during warmerwinters and early spring, leading to weak variations in bud burst datesfrom year to year. Similarly, buds are chilled more (or fully chilled) dur-ing cooler years, so require both a reduced amount of forcing temperatureand lessened importance of photoperiod before bud burst, resulting in amore-modest delay of bud burst compared with warmer years than mightotherwise be expected, i.e., a feedback loop is created that tends to sta-bilise bud burst date. In contrast, in cooler winter conditions as occur athigh elevation, buds tend to be fully chilled, removing the possible inter-action between chilling temperature and photoperiod. The bud burst dateswould thus mostly depend on forcing temperatures, increasing the poten-tial interannual variation of these dates and the correlation with springtemperatures.
This representation of the relative contributions of the three factors ac-cording to climate conditions is in line with the suggestion of Wareing(1953), 60 years ago (!), that beech bud burst dates are mainly controlledby photoperiod for southern populations and by thermic conditions for thenorthernmost populations. This assertion is also supported by the recordedtemporal variation of bud burst dates from low and high elevation beech

120 Chapter 6
populations in the Swiss Alps during the three last decades. The leaf un-folding date of beech exhibits greater variability from year to year at highelevation than at low elevation over this period (Fig. 6.3). In addition, al-though the mean spring temperature has significantly increased during thisperiod at both low and high elevations, a significant trend towards an ear-lier flushing was detected only for higher elevation (Fig. 6.3). These tem-poral trends strengthen the hypothesis that forcing temperatures predom-inately drive phenological variations in beech growing in climates withcold winters, whereas photoperiod and chilling reduce phenological vari-ation at sites with mild winter conditions.
Implications for climate warming
Based on results from the different approaches cited above, the bud burstdate of beech is expected not to undergo significant changes in responseto global warming, in particular in the warmer part of its distribution area.The number of years with insufficient chilling temperatures to fully breakdormancy is likely to increase under climate change, especially at lowerlatitude or elevation. As a result, the amount of forcing temperature re-quired for bud burst may increase and offset the predicted advance offlushing in response to increasing spring temperatures. However, photope-riodic control in spring may counterbalance the lack of chilling, by de-creasing the amount of forcing required or by increasing bud sensitivityto forcing temperature, leading to more conserved bud burst dates fromyear to year. Thus, the advance of the date of bud burst of this speciesin response to global warming, related to winter and spring temperatures,may be limited. However, the bud burst date of beech is expected to bemore sensitive in the cold boundary of its distribution area such as at highelevation, since in such climates forcing temperature will remain the mainlimiting factor. These expectations are in agreement with long series ofphenological observations of European beech available in Europe. For in-stance, in Slovenia, Cufar et al. (2012) reported earlier leaf unfolding dateat high elevation over the last decades but no significant trend at low el-evation. In Switzerland, observations of beech phenology along an eleva-tional range of 200–1440 m a.s.l. show the same consistent pattern: beechpopulations inhabiting colder climates (high elevation) exhibited a greater
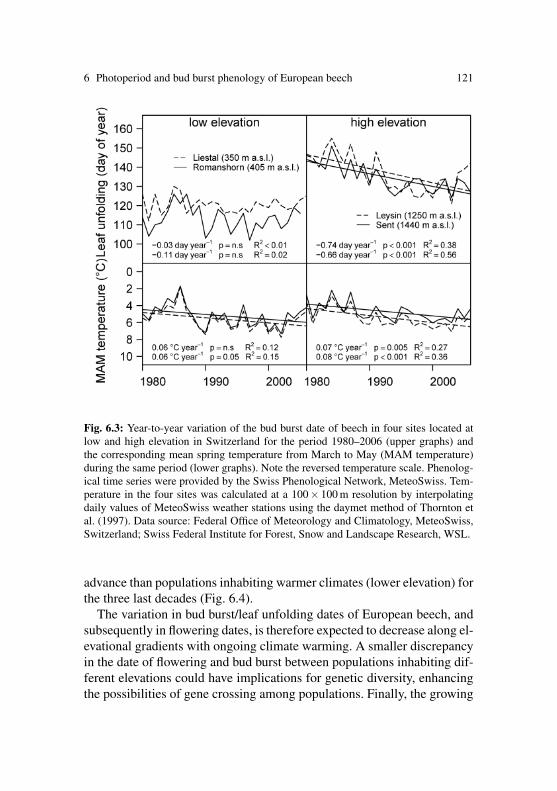
6 Photoperiod and bud burst phenology of European beech 121
Fig. 6.3: Year-to-year variation of the bud burst date of beech in four sites located atlow and high elevation in Switzerland for the period 1980–2006 (upper graphs) andthe corresponding mean spring temperature from March to May (MAM temperature)during the same period (lower graphs). Note the reversed temperature scale. Phenolog-ical time series were provided by the Swiss Phenological Network, MeteoSwiss. Tem-perature in the four sites was calculated at a 100× 100 m resolution by interpolatingdaily values of MeteoSwiss weather stations using the daymet method of Thornton etal. (1997). Data source: Federal Office of Meteorology and Climatology, MeteoSwiss,Switzerland; Swiss Federal Institute for Forest, Snow and Landscape Research, WSL.
advance than populations inhabiting warmer climates (lower elevation) forthe three last decades (Fig. 6.4).
The variation in bud burst/leaf unfolding dates of European beech, andsubsequently in flowering dates, is therefore expected to decrease along el-evational gradients with ongoing climate warming. A smaller discrepancyin the date of flowering and bud burst between populations inhabiting dif-ferent elevations could have implications for genetic diversity, enhancingthe possibilities of gene crossing among populations. Finally, the growing

122 Chapter 6
Fig. 6.4: Linear temporal trends of the bud burst date of beech (days year−1,1980–2010) observed in 54 sites in Switzerland according to their elevation. Phenolog-ical time series were provided by the Swiss Phenological Network, MeteoSwiss. Onlycontinuous time series with full coverage of the time period 1980–2010 were used.
season length may be extended less in response to the increasing tem-peratures for beech populations than for other photoperiod- insensitivetree species (Körner and Basler 2010). On the other hand, photoperiod-insensitive tree species, which closely track the warming spring temper-atures, may be more exposed to late frost events in the future, while forbeech, the dual role of chilling and forcing temperatures in combinationwith photoperiod could serve to protect this species against such damage(Gu et al. 2008).
Conclusions
New insights into European beech phenology have been documented fromexperimental and modelling studies providing robust evidence for theroles of photoperiod and temperature during winter and early spring. Thus,the bud burst date of beech is likely to be driven by both chilling andforcing temperatures with an interaction effect of the photoperiod on forc-
6 Photoperiod and bud burst phenology of European beech 123
ing rate (or forcing requirement) more pronounced when the chilling re-quirement is partially satisfied, rather than when buds are fully chilled.Finally, this review also underlines that phenology of beech follows a non-linear trend across biogeographical gradients such as elevational gradients(Fig. 6.4), due to a change of the relative importance of the three mainenvironmental factors according to climate conditions. New models thatinclude photoperiod effect are being developed (Caffarra et al. 2011) andseem promising to fit phenological data of European beech. Fitted to budburst data acquired from the warmest margin of beech distribution area(South Europe and low elevation) where chilling requirement of buds tofully release dormancy is likely to be only partially fulfilled, these mod-els could be particularly relevant to examine whether their parameteriza-tion matches with the assumptions presented here. However, there are stillsome ‘black boxes’ in the environmental mechanisms affecting beech phe-nology. First, we are not able to distinguish whether the advance of budburst date in response to increasing chilling exposure is due to a lower re-quirement in forcing temperature to bud burst, an advance of the endodor-mancy release or both. It remains unclear whether, when buds are not fullychilled, a longer photoperiod decreases forcing requirement or increasesthe sensitivity of beech to forcing temperatures (higher forcing rate). Then,we are uncertain whether forcing and chilling can occur simultaneously.Finally, the last and most challenging knowledge gap is to quantify at whattemperature range and temperature threshold forcing and chilling accumu-lation occur, and whether these temperature thresholds/ranges are fixed orchange as the photoperiod increases.
Acknowledgements We are grateful to Thomas Herren for providing the phenologicaldata of European beech from the MeteoSwiss (Swiss Federal Office of Meteorology andClimatology) and the Landscape dynamic unit, Swiss Federal Institute for Forest, Snowand Landscape Research, WSL, Birmensdorf, Switzerland for providing the modelledtemperature data used in the Fig. 6.3. We thank Wade Jenner for linguistic revisionand improvement of the text. We are grateful to two anonymous referees and for theirvaluable comments on a previous version of the manuscript.
The research has been funded by the European Research Council (ERC) grant233399 (project TREELIM).
124 Chapter 6
References
Basler D, Körner C (2012) Photoperiod sensitivity of bud burst in 14 temperate foresttree species. Agric. For. Meteorol. 165: 73–81
Bertin RI (2008) Plant phenology and distribution in relation to recent climate change.J. Torrey Bot. Soc. 135(1): 126–146
Bolte A, Czajkowski T, Kompa T (2007) The north-eastern distribution range of Euro-pean beech—a review. Forestry 80(4): 413–429
Caffarra A, Donnelly A (2011) The ecological significance of phenology in four differ-ent tree species: effects of light and temperature on bud burst. Int. J. Biometeorol.55(5): 711–721
Caffarra A, Donnelly A, Chuine I, Jones MB (2011) Modelling the timing of Betulapubescens budburst. I. Temperature and photoperiod: a conceptual model. Clim.Res. 46(2): 147–157
Cannell MGR, Smith RI (1983) Thermal time, chill days and prediction of budburst inPicea sitchensis. J. Appl. Ecol. 20(3): 951–963
Chuine I (2000) A unified model for budburst of trees. J. Theor. Biol. 207(3): 337–347Chuine I (2010) Why does phenology drive species distribution? Philos. Trans. R. Soc.
B. Biol. Sci. 365(1555): 3149–3160Churkina G, Schimel D, Braswell BH, Xiao XM (2005) Spatial analysis of growing
season length control over net ecosystem exchange. Glob. Change Biol. 11(10):1777–1787
Cooke JEK, Eriksson ME, Junttila O (2012) The dynamic nature of bud dormancyin trees: environmental control and molecular mechanisms. Plant, Cell Environ.35(10): 1707–1728.
Cufar K, De Luis M, Saz MA, Crepinšek Z, Kajfez-Bogataj L (2012) Temporal shiftsin leaf phenology of beech (Fagus sylvatica) depend on elevation. Trees 26(4):1091–1100
Davi H, Gillmann T, Cailleret M, Bontemps A, Fady B, Lefèvre F (2011) Diversityof leaf unfolding dynamics among tree species: new insights from a study along analtitudinal gradient. Agric. For. Meteorol. 151(12): 1504–1513
Dittmar C, Elling W (2006) Phenological phases of common beech (Fagus sylvaticaL.) and their dependence on region and altitude in Southern Germany. Eur. J. For.Res. 125(2): 181–188
Falusi M, Calamassi R (1990) Bud dormancy in beech (Fagus sylvatica L.). Effect ofchilling and photoperiod on dormancy release of beech seedlings. Tree Physiol 6(4):429–438
Falusi M, Calamassi R (1996) Geographic variation and bud dormancy in beechseedlings (Fagus sylvatica L). Ann. Sci. For. 53(5): 967–979
Falusi M, Calamassi R (2003) Dormancy of Fagus sylvatica L. buds III. Temperatureand hormones in the evolution of dormancy in one-node cuttings. Plant Biosyst.137(2): 185–191
6 Photoperiod and bud burst phenology of European beech 125
Gomory D, Paule L (2011) Trade-off between height growth and spring flushing incommon beech (Fagus sylvatica L.). Ann. For. Sci. 68(5): 975–984
Gordo O, Sanz JJ (2009) Long-term temporal changes of plant phenology in the West-ern Mediterranean. Glob. Change Biol. 15(8): 1930–1948
Gu L, Hanson PJ, Mac Post W, Kaiser DP, Yang B, Nemani R,Pallardy SG, MeyersT (2008) The 2007 eastern US spring freezes: increased cold damage in a warmingworld? Bioscience 58(3): 253–262
Hänninen H, Kramer K (2007) A framework for modelling the annual cycle of trees inboreal and temperate regions. Silva Fennica 41(1): 167–205
Harrington CA, Gould PJ, St Clair JB (2010) Modeling the effects of winter environ-ment on dormancy release of Douglas-fir. For. Ecol. Manage. 259(4): 798–808
Heide OM (1993) Dormancy release in beech buds (Fagus sylvatica) requires bothchilling and long days. Physiol. Plant. 89(1): 187–191
Hunter AF, Lechowicz MJ (1992) Predicting the time of budburst in temperate trees. J.Appl. Ecol. 29(3): 597–604
Jochner S, Sparks T, Estrella N, Menzel A (2012) The influence of altitude and urbani-sation on trends and mean dates in phenology (1980–2009). Int. J. Biometeorol. 56:387–394
Körner C, Basler D (2010) Phenology under global warming. Science 327(5972):1461–1462
Kramer K (1994) Selecting a model to predict the onset of growth of Fagus sylvatica.J. Appl. Ecol. 31(1): 172–181
Kramer K (1995) Phenotypic plasticity of the phenology of seven European tree speciesin relation to climatic warming. Plant, Cell Environ. 18(2): 93–104
Kreyling J, Thiel D, Nagy L, Jentsch A, Huber G, Konnert M, Beierkuhnlein C (2012)Late frost sensitivity of juvenile Fagus sylvatica L. differs between southern Ger-many and Bulgaria and depends on preceding air temperature. Eur. J. For. Res.131(3): 717–725
Lang GA, Early JD, Martin GC, Darnell RL (1987) Endo-, para-, and ecodormancy:physiological terminology and classification for dormancy research. HortScience22(3): 371–377
Lebourgeois F, Pierrat JC, Perez V, Piedallu C, Cecchini S, Ulrich E (2010) Simulatingphenological shifts in French temperate forests under two climatic change scenariosand four driving global circulation models. Int. J. Biometeorol. 54(5): 563–581
Menzel A, Estrella N, Fabian P (2001) Spatial and temporal variability of the pheno-logical seasons in Germany from 1951 to 1996. Glob. Change Biol. 7(6): 657–666
Migliavacca M, Cremonese E, Colombo R, Busetto L, Galvagno M, Ganis L, MeroniM, Pari E, Rossini M, Siniscalco C, di Cella UM (2008) European larch phenologyin the Alps: can we grasp the role of ecological factors by combining field observa-tions and inverse modelling? Int. J. Biometeorol. 52(7): 587–605
Murray MB, Cannell MGR, Smith RI (1989) Date of budburst of fifteen tree species inBritain following climatic warming. J. Appl. Ecol. 26(2): 693–700

126 Chapter 6
Myking T, Heide OM (1995) Dormancy release and chilling requirement of buds of lati-tudinal ecotypes of Betula pendula and B. pubescens. Tree Physiol. 15(11): 697–704
Polgar CA, Primack RB (2011) Leaf-out phenology of temperate woody plants: fromtrees to ecosystems. New Phytol. 191(4): 926–941
Rötzer T, Grote R, Pretzsch H (2004) The timing of bud burst and its effect on treegrowth. Int. J. Biometeorol. 48(3): 109–118
Schaber J, Badeck FW (2003) Physiology-based phenology models for forest treespecies in Germany. Int. J. Biometeorol. 47(4): 193–201
Studer S, Appenzeller C, Defila C (2005) Inter-annual variability and decadal trendsin alpine spring phenology: a multivariate analysis approach. Clim. Change 73(3):395–414
Thompson R, Clark RM (2008) Is spring starting earlier? Holocene 18(1): 95–104Thornton PE, Running SW, White MA (1997) Generating surfaces of daily meteorolog-
ical variables over large regions of complex terrain. J. Hydrol. 190(3–4): 214–251Vitasse Y, Delzon S, Dufrene E, Pontailler JY, Louvet JM, Kremer A, Michalet R
(2009a) Leaf phenology sensitivity to temperature in European trees: do within-species populations exhibit similar responses? Agric. For. Meteorol. 149(5): 735–744
Vitasse Y, Porte AJ, Kremer A, Michalet R, Delzon S (2009b) Responses of canopyduration to temperature changes in four temperate tree species: relative contributionsof spring and autumn leaf phenology. Oecologia 161(1): 187–198
Vitasse Y, Francois C, Delpierre N, Dufrene E, Kremer A, Chuine I, Delzon S (2011)Assessing the effects of climate change on the phenology of European temperatetrees. Agric. For. Meteorol. 151(7): 969–980
Wareing PF (1953) Growth studies in woody species. V. Photoperiodism in dormantbuds of Fagus sylvatica. Physiol. Plant. 6(4): 692–706

Chapter 7Is the use of cuttings a good proxy toexplore phenological responses oftemperate forests in warming andphotoperiod experiments?
Yann Vitasse, David Basler
Abstract For obvious practical reasons, tree phenological data obtainedin warming and photoperiod experiments are generally conducted on ju-venile trees (saplings and seedlings) or on watered or rooted cuttingscollected from adult trees. As juvenile trees differ from adult trees intheir phenological response to environmental conditions, they representinappropriate plant material to experimentally assess the phenological re-sponses of forests to seasonality. Cuttings are physiologically closer toadult trees, but cutting itself and the disruption of hormonal signals maycreate artefacts. This study aimed to investigate the potential deviation be-tween phenological responses of cuttings vs donor trees. We hypothesizedthat, once dormant, buds may respond autonomously to environmental in-fluences such as chilling, photoperiod and warming, and, thus, cuttingsmay exhibit similar phenological responses to mature trees. We comparedbud development of seedlings, saplings and mature trees of three decidu-ous tree species with bud development of cuttings that were excised fromboth saplings and adults and positioned in situ in the vicinity of adult treeswithin a mature mixed forest in the foothills of the Swiss Jura Mountains.No significant difference was detected in the timing of bud burst betweencuttings and donor trees for the three studied tree species when the verticalthermal profile was accounted for. However, a significant difference in thetiming of flushing was found between seedlings, saplings and adults, withearlier flushing during the juvenile stage. At least for the three studied
Original article published in Tree Physiology 34: 174-183
127
128 Chapter 7
species, this study clearly demonstrates that cuttings are better surrogatesthan juvenile trees to assess potential phenological responses of temperateforests to climate change in warming and photoperiod experiments
Key words: Adult trees, Bud burst, Phenology, Saplings, Seedlings
Introduction
Numerous long time-series of phenological observations are now avail-able worldwide in temperate climates and show that temperate deciduoustrees are leafing-out earlier as a result of rising temperature (e.g., in NorthAmerica: Beaubien and Freeland 2000; in Europe: Menzel 2000; in EastAsia: Ibanez et al. 2010). Earlier leaf-out of trees has a considerable im-pact on ecosystem processes, because it directly affects the water balanceand may influence productivity (Richardson et al. 2010), biotic interac-tions through, for instance, the synchrony of host parasites or herbivores(e.g., van Asch and Visser 2007) and may feed back on the climate system(Richardson et al. 2013). Long time-series of phenological observationsare valuable for the calibration of phenological models that aim at project-ing tree responses to a future warmer climate. However, the confidencein phenological simulations derived from such data for the future remainslimited because projections are made into unexplored ranges of interac-tion between temperature and photoperiod. Indeed, temperate forests areexpected to face warmer temperatures earlier in the season in the comingdecades, so in other words at a shorter photoperiod. In addition, temperatetrees exhibit a species-specific chilling requirement for dormancy release,that is, they require a minimum duration of cold hours before warm tem-perature (or thermal time) can lead to bud burst (Murray et al. 1989). Inmilder regions, the chilling requirement might not be fulfilled in com-ing decades under continued climate warming, especially for populationsgrowing in the warmest parts of the species range (Morin et al. 2009, Vi-tasse et al. 2011) and in tree species having a high chilling requirementsuch as Fagus sylvatica L. (Vitasse and Basler 2013). Thus, phenologicalresponses of trees to temperature increase might be mitigated in the futureby a larger influence of photoperiod and chilling temperatures (Körnerand Basler 2010). The scientific community is currently debating whether

7 Are cuttings a good proxy to explore temperate forest phenology? 129
spring phenology will continue to advance in the forthcoming decadeswith the continued rise in temperatures (Chuine et al. 2010).
To overcome this major issue, numerous warming and photoperiodexperiments have recently been conducted on temperate trees using ei-ther seedlings, saplings or cuttings. Although these experimental studiesconfirmed that warmer temperature does indeed advance bud burst in anon-linear way (e.g., Ghelardini et al. 2010, Morin et al. 2010, Fu et al.2012), the magnitude of the phenological response to temperature con-trasts with the one deduced from long series of phenological observations(Wolkovich et al. 2012). Similarly, in photoperiod manipulation experi-ments using watered cuttings, short photoperiods have been found to de-lay the timing of bud burst in some tree species (Heide 1993, Basler andKörner 2012), especially under lower chilling conditions (Caffarra andDonnelly 2011, Laube et al. 2014). For obvious practical reasons, pheno-logical data obtained in warming and photoperiod experiments are gener-ally conducted on juvenile ‘trees’ or on watered/rooted cuttings from adulttrees. Hence, a crucial issue arises: are these appropriate proxies to assessthe phenological responses of adult trees to environmental cues?
Understory trees of temperate forests generally begin their growing sea-son earlier than conspecific canopy trees (Seiwa 1999a, Richardson andO’ Keefe 2009), allowing them to benefit from light before canopy clo-sure (Augspurger 2008). This phenological discrepancy between canopytrees and understory trees has recently been assigned to ontogenic ratherthan micro-environmental effects (Vitasse 2013). Therefore, phenologicaldata obtained from juvenile trees appear inappropriate to infer phenologi-cal responses of forests to climate change. Here we asked whether cuttingsfrom adult trees would be a better substitute than juvenile trees in warm-ing and photoperiod experiments to unravel the mechanisms of phenologyin temperate forest trees.
Dormancy in temperate trees involves an interrelated series of physi-ological processes regulated by internal and external factors (Lang 1994,Horvath et al. 2003). According to Lang (1994), bud dormancy can be cat-egorized into three types in temperate climate. Buds are in paradormancywhen growth inhibition is induced by distant organs (during autumn), inendodormancy when growth inhibition is induced by internal bud sig-nals (late autumn and early winter) and in ecodormancy when growthinhibition is induced by unfavourable external conditions (early and latespring). However, the different dormancy phases are not strictly separated

130 Chapter 7
in time and are known to interact with each other (Cooke et al. 2012).Cuttings are disconnected from whole-tree growth-promoting/inhibitingsignals that can potentially affect bud burst such as sugars or phytohor-mones. Among the phytohormones, abscisic acid, gibberellic acid (GA)and cytokinins are known to interact with bud burst, with the formermaintaining and the other two releasing bud endodormancy (Wareing andSaunders 1971, Arora et al. 2003, Chao et al. 2007, Cooke et al. 2012).However, in contrast to paradormancy and endodormancy induction in au-tumn, the maintenance and the release of endodormancy in winter mightreside solely within the buds, which could then autonomously respond tospecific combinations of low and moderate temperatures or photoperiod(Lang 1994). Indeed, after the initiation of endodormancy, meristem cellsof apical buds are likely to be insulated from growth-promoting signals,such as GA (Lang 1994, Rinne et al. 2001, Rohde and Bhalerao 2007).One study demonstrated that meristem cells in dormant buds of Betulapubescens Ehrh. would recover their connection between each other, orwith adjacent tissue, via plasmodesmal channels that are progressively re-stored after they have undergone sufficient chilling temperatures (Rinneet al. 2001). In addition, recent studies identified genes in temperate fruittrees that are suppressed by exposure to chilling conditions, acting there-fore as quantitative repressors of bud development in spring (Jiménez et al.2010, Barros et al. 2012, Saito et al. 2013). Although the role of phytohor-mones has been reasonably well identified for bud set and endodormancyinduction, the molecular mechanisms controlling endodormancy releaseand the ecodormancy phase after exposure to chilling temperatures havenot been clarified (Horvath et al. 2003, Cooke et al. 2012). Here we hy-pothesized that cuttings harvested after endodormancy induction wouldconstitute a better proxy than juvenile trees to infer the phenological re-sponse of forests to climate change.
Materials and methods
Study site and study species
The experiment was conducted in a mature mixed forest stand (∼110 yearsold) near the village of Hofstetten (47◦ 28′ N, 7◦ 30′ E, 570–580 m above

7 Are cuttings a good proxy to explore temperate forest phenology? 131
sea level) in the surroundings of the Swiss Canopy Crane (Körner et al.2005), located 12 km south-west of Basel, Switzerland. Soils are of therendzina type on calcareous bedrock. The dominant tree species are Fa-gus sylvatica L. and Picea abies L., while Acer campestre L., Acer pseu-doplatanus L., Carpinus betulus L., Fraxinus excelsior L., Prunus aviumL. and Tilia platyphyllos Scop. occur as companion species. The site is sit-uated on a north-facing slope with no access to the ground water table andhas essentially rocky subsoil at 40–90 cm below the surface. The meanannual air temperature recorded on a long term series at the nearest cli-mate station was 10.3 ◦C and the mean annual precipitation was 810 mm(1970–2011 recorded at Binningen, 316 m a.s.l. ∼10 km away from thestudy site). Using the same temperature dataset, the mean air temperatureover the ∼6-month growing season from April to October was 15.6 ◦C,with a mean temperature for the warmest month (July) of 19.3 ◦C. Thewinters are mild with the mean temperature of the coldest month (Jan-uary) being around 1.5 ◦C. At the study site there are usually only a fewweeks of slight snow cover during mid-winter.
We selected three tree species having contrasting spring phenology inthe study site: an early flushing species, Carpinus betulus; an interme-diate flushing species, Fagus sylvatica; and a late flushing species, Acerpseudoplatanus, based on the phenological data recorded on adults in theprevious year (Vitasse 2013). For clarity and brevity, hereafter we willrefer to each species by its genus.
Experimental design
In November 2012, we selected and tagged 10 mature trees for eachspecies, having a low branch (approximately between 6 and 9 m height),so that cuttings could be collected from the ground by using a polepruner and so that observations of bud development within the samebranch would be accurate from the ground. In the vicinity of each se-lected mature tree, one sapling (∼2.9–3.5 m height; Table 7.1) and threeseedlings (∼0.24–0.54 m height; Table 7.1) were also marked and as-signed to the corresponding adult tree. The average distance between adulttrees and the assigned seedlings and saplings was from 3 to 15 m de-pending on the species (see details in Table 7.1). The experiment was set
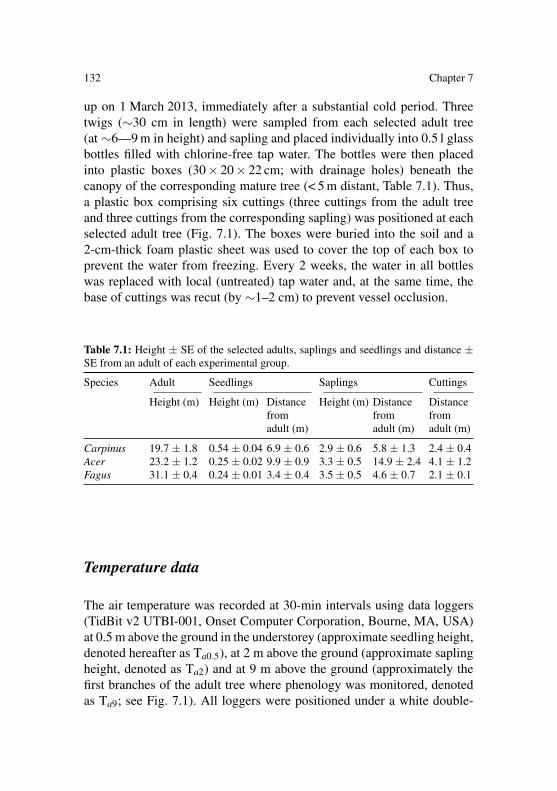
132 Chapter 7
up on 1 March 2013, immediately after a substantial cold period. Threetwigs (∼30 cm in length) were sampled from each selected adult tree(at ∼6—9 m in height) and sapling and placed individually into 0.5 l glassbottles filled with chlorine-free tap water. The bottles were then placedinto plastic boxes (30× 20× 22 cm; with drainage holes) beneath thecanopy of the corresponding mature tree (< 5 m distant, Table 7.1). Thus,a plastic box comprising six cuttings (three cuttings from the adult treeand three cuttings from the corresponding sapling) was positioned at eachselected adult tree (Fig. 7.1). The boxes were buried into the soil and a2-cm-thick foam plastic sheet was used to cover the top of each box toprevent the water from freezing. Every 2 weeks, the water in all bottleswas replaced with local (untreated) tap water and, at the same time, thebase of cuttings was recut (by ∼1–2 cm) to prevent vessel occlusion.
Table 7.1: Height ± SE of the selected adults, saplings and seedlings and distance ±SE from an adult of each experimental group.
Species Adult Seedlings Saplings Cuttings
Height (m) Height (m) Distance Height (m) Distance Distancefrom from fromadult (m) adult (m) adult (m)
Carpinus 19.7 ± 1.8 0.54 ± 0.04 6.9 ± 0.6 2.9 ± 0.6 5.8 ± 1.3 2.4 ± 0.4Acer 23.2 ± 1.2 0.25 ± 0.02 9.9 ± 0.9 3.3 ± 0.5 14.9 ± 2.4 4.1 ± 1.2Fagus 31.1 ± 0.4 0.24 ± 0.01 3.4 ± 0.4 3.5 ± 0.5 4.6 ± 0.7 2.1 ± 0.1
Temperature data
The air temperature was recorded at 30-min intervals using data loggers(TidBit v2 UTBI-001, Onset Computer Corporation, Bourne, MA, USA)at 0.5 m above the ground in the understorey (approximate seedling height,denoted hereafter as Ta0.5), at 2 m above the ground (approximate saplingheight, denoted as Ta2) and at 9 m above the ground (approximately thefirst branches of the adult tree where phenology was monitored, denotedas Ta9; see Fig. 7.1). All loggers were positioned under a white double-

7 Are cuttings a good proxy to explore temperate forest phenology? 133
Fig. 7.1: The experimental design used for one experimental plot to compare the phe-nology of seedlings, saplings, adults and cuttings from saplings and adults. This studydesign was replicated 10 times for each of the three species. Ta9, Ta2 and Ta0.5 cor-respond to the air temperatures recorded at 9, 2 and 0.5 m during the experiment; Tscorresponds to the soil temperature recorded at a depth of 10 cm; Tw and Tb correspondto water temperature recorded inside a glass bottle used for cuttings and the temperaturerecorded at the bottom of the box outside the bottles.
layered, aerated plastic shelter to prevent any exposure to rain or to directsunlight. Additional loggers recorded temperatures inside the experimen-tal boxes: two loggers were placed into water inside bottles containingcuttings (denoted as Tw) and another two were placed at the bottom ofthe box (denoted as Tb). Soil temperature was also recorded at a depthof 10 cm (denoted as Ts; see Fig. 7.1). Two loggers were used for eachheight position and the average of the two was used in all further results,except for T9, because only one logger was found after the experiment. Tocompare cumulative degree hours among the different height positions,we accumulated the temperature difference for every hour above a 5 ◦Cthreshold, starting on 1 March 2013 (when cuttings were sampled and

134 Chapter 7
placed into the experimental boxes) until the end of the flushing period(10 May 2013). After the study period, all loggers were immersed 2 h inan ice-water bath for 0 ◦C calibration and cross-checking the sensors foridentical readings. Deviations never exceeded 0.17 K among the differentloggers, meeting the manufacturer’s specifications.
Phenological observations
For each experimental group (i.e., seedlings, saplings, adult trees, cuttingsfrom saplings and cuttings from adult trees), bud development was mon-itored twice a week from 1 March 2013 to the end of the flushing period(10 May 2013). We used a four-stage categorical scale according to Vi-tasse (2013). Stage 0 (dormant bud) is characterized by the absence ofany visible bud development; at stage 1 (bud swelling), buds were swollenand/or elongating; at stage 2 (bud burst), bud scales were open and leaveswere partially visible; at stage 3 (leaf-out), leaves had fully emerged fromthe buds but were still folded, crinkled or pendant, depending on species;and at stage 4 (leaf unfolded), at least one leaf was fully unfolded. Forseedlings and cuttings, we considered the apical bud only. For saplings,phenology was monitored on the apical bud of each of the three previ-ously tagged branches. For adult trees, phenology was monitored usingbinoculars (Canon 10× 30 Image Stabilization Binoculars) on the lowestbranch of the canopy that was used to harvest cuttings (approximately be-tween 6 and 9 m in height) and the phenological score was assigned as anaverage score assessed over three terminal buds of this selected branch.
The bud burst and leaf-out dates were reached for each selected in-dividual, branch or cutting when the apical bud reached stages 2 and 3,respectively, which was estimated by linear interpolation when necessary(i.e., when this stage occurred in between two monitoring dates).
Data analysis
While cuttings are obviously dependent on the donor trees, natural seed-lings, saplings and adult trees could have been considered as independent

7 Are cuttings a good proxy to explore temperate forest phenology? 135
and treated using a one-way analysis of variance followed by Tukey’s HSDtests. However, since natural seedlings and saplings have been selected asclose as possible to each of the 10 adult trees, we decided to considerthem dependent on each other in terms of microclimate (same tempera-ture). In other words, one replicate consists of one adult tree, one sapling,three seedlings and three cuttings excised from both the adult tree andthe sapling. In consequence, we conducted multiple paired t-tests withineach species to compare the dates of bud burst and leaf-out among the fiveexperimental groups. The difference between pairs was tested for assump-tions of normal distribution for each of the 120 paired t-tests performedusing Shapiro—Wilk normality tests. It was found to follow a normal dis-tribution for > 80% of the tests. However, after a visual examination ofresiduals (Q–Q plot) we assumed that the other 20% did not excessivelydeviate from a normal distribution. All p-values were adjusted using Bon-ferroni corrections, and details of the degree of freedom and t-statisticvalues are provided in Supplementary Data (see Table S7.1 and S7.2).Comparisons between the five categories are shown for bud burst andleaf-out stages (stages 2 and 3) only because stage 1 (the onset of budswelling) is rather difficult to observe in adult trees and the mobile car-bon pool might be limited in cuttings for further development, once theleaves are out (stage 3). Some cuttings did not reach phenological stage 3(Acer: one replicate of adult cuttings, Carpinus: three replicates of adultcuttings), probably because the conductive vessels became plugged and/orreserves were exhausted. These data were dismissed from analyses regard-ing stage 3. To avoid confusion between temperatures (◦C) and tempera-ture differences, we join other authors in adopting K (for Kelvin) for alldifferences in temperature.
All analyses were performed using R 2.12.2 (R Development CoreTeam 2011).
Results
Temperature data
Early spring 2013 was particularly cool until mid-April. During this pe-riod, daily mean temperatures were mostly < 5 ◦C (Fig. 7.2). A gradual

136 Chapter 7
increase in temperature was found from the ground to a height of 9 mabove ground (approximately the height where the lowest buds of adultshave been monitored). The mean Ta9 during the experiment was 0.1 and0.3 K warmer than those recorded at sapling (Ta2) and seedling height(Ta0.5), respectively. On 1 May 2013, i.e., 2 months after the beginning ofthe experiment, the cumulative degree hours above 5 ◦C reached 3774 ◦C hat a height of 9 m, whereas it reached 3485 and 3377 ◦C h at sapling andseedling height, respectively (Fig. 7.2). The boxes used to place the cut-tings were well isolated from the air temperature as there was negligibledifference between the temperature recorded inside the boxes (into wa-ter in the bottles and outside of water) and soil temperature at a depth of10 cm (Fig. 7.2). According to the temperature recorded in our experimen-tal boxes, no freezing of water occurred within the buried boxes.
Phenological differences among species
The three study species exhibited different timings of bud development,nevertheless to a lower extent than expected (and known from normalspring weather) due to the prolonged cool weather in early spring (Fig. 7.2).Such cold weather prevents flushing despite stepwise dormancy release.Regarding adult trees, Carpinus was the earliest flushing species andAcer the latest, though, beyond phenological stage 2 (bud burst), the dis-crepancy of bud development among species was considerably reduced(Fig. 7.3). The average bud-burst date (stage 2) of adult trees occurredon the day of year 104.0± 0.7 for Carpinus, 110.4± 0.8 for Fagus and113.0± 0.8 for Acer. Interestingly the ranking across species was not con-served at the seedling stage: bud-burst date of Acer seedlings occurred5 days earlier than in Fagus (Fig. 7.3). Phenological differences amongseedlings, saplings and adults under natural conditions A clear pheno-logical discrepancy was found between young and adult trees for Carpi-nus and Acer (Fig. 7.3, Table 7.2). For Carpinus, bud burst of saplingsand seedlings occurred 9.6 and 13.8 days earlier (paired t-test, p < 0.05and p < 0.001, respectively) than in adult trees (Table 7.2). For Acer, budburst of seedlings occurred 7.8 days earlier (p < 0.0001) than adult trees,whereas saplings tended to exhibit earlier bud burst and leaf-out than adulttrees, but this was only marginally significant (p < 0.10, Table 7.2). For

7 Are cuttings a good proxy to explore temperate forest phenology? 137
Fig. 7.2: Air temperatures at various heights above the ground. The upper panel showsthe air temperature at 2 m recorded from 1 March 2013 to the end of the flushing pe-riod. The thick line corresponds to the daily mean temperatures surrounded in a greyarea by the daily minimum and daily maximum temperatures. The lower panel showscumulative degree hours above 5 ◦C from the beginning of the experiment (1 March2013) to the date of the last individual flushing (mid-May 2013) at seedling height(0.5 m height), at sapling height (2 m height), at a height of 9 m (approximately theheight where buds of adults were monitored), at a depth of 10 cm in the soil, inside theexperimental boxes in water and inside the experimental boxes out of water. The insettable shows the mean of daily minimum, mean and maximum air temperatures duringthe same period for each logger.
Fagus, both saplings and seedlings exhibited slightly earlier phenologythan adults, but this was not significant (Table 7.2).
When the microclimate due to the difference in height between seed-lings, saplings and adults was taken into account (mean temperature in-crease with height above ground; Fig. 7.2), the phenological discrepancyamong the three lifestage categories became enhanced (Fig. 7.4). Thus,in all three species, bud burst and leaf-out of seedlings and saplings oc-curred after significantly fewer degree hours than in adult trees (Fig. 7.4,

138 Chapter 7
Table 7.3). In addition, a clear phenological discrepancy was detectedamong the three life-stage categories for Acer, with seedlings requiring689 and 1312 ◦C h less than saplings and adult trees, respectively, to budburst (p < 0.05; Table 7.3). No difference of heat requirement for bud burstwas detected between seedlings and saplings for the other two species.
Fig. 7.3: Bud and leaf development progression in spring for each experimental group.The time on the x-axis is expressed as day of the year. Bars represent standard errors.
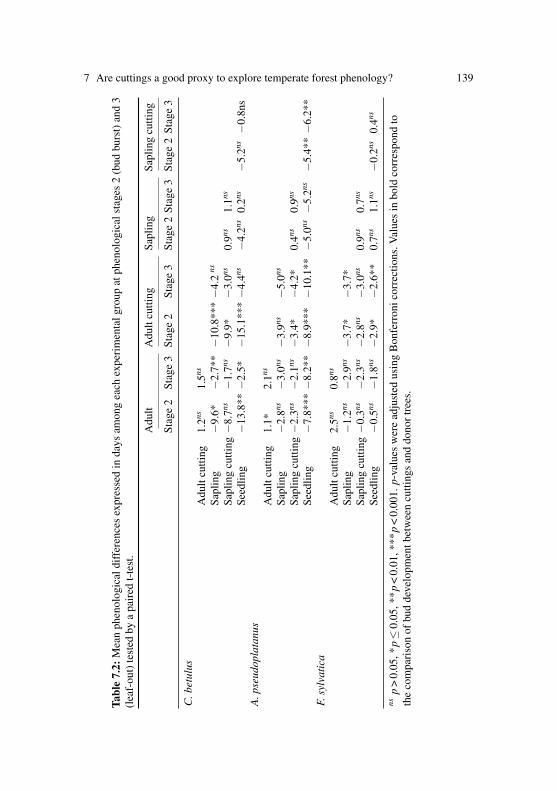
7 Are cuttings a good proxy to explore temperate forest phenology? 139
Tabl
e7.
2:M
ean
phen
olog
ical
diff
eren
ces
expr
esse
din
days
amon
gea
chex
peri
men
talg
roup
atph
enol
ogic
alst
ages
2(b
udbu
rst)
and
3(l
eaf-
out)
test
edby
apa
ired
t-te
st.
Adu
ltA
dult
cutti
ngSa
plin
gSa
plin
gcu
tting
Stag
e2
Stag
e3
Stag
e2
Stag
e3
Stag
e2
Stag
e3
Stag
e2
Stag
e3
C.b
etul
usA
dult
cutti
ng1.
2ns1.
5ns
Sapl
ing
−9.
6*−
2.7*
*−
10.8
***−
4.2
ns
Sapl
ing
cutti
ng−
8.7ns
−1.
7ns−
9.9*
−3.
0ns0.
9ns1.
1ns
Seed
ling
−13
.8**−
2.5*
−15
.1**
*−
4.4ns
−4.
2ns0.
2ns−
5.2ns−
0.8n
sA
.pse
udop
lata
nus
Adu
ltcu
tting
1.1*
2.1ns
Sapl
ing
−2.
8ns−
3.0ns
−3.
9ns−
5.0ns
Sapl
ing
cutti
ng−
2.3ns
−2.
1ns−
3.4*
−4.
2*0.
4ns0.
9ns
Seed
ling
−7.
8***−
8.2*
*−
8.9*
**−
10.1
**−
5.0ns−
5.2ns
−5.
4**−
6.2*
*F.
sylv
atic
aA
dult
cutti
ng2.
5ns0.
8ns
Sapl
ing
−1.
2ns−
2.9ns
−3.
7*−
3.7*
Sapl
ing
cutti
ng−
0.3ns
−2.
3ns−
2.8ns
−3.
0ns0.
9ns0.
7ns
Seed
ling
−0.
5ns−
1.8ns
−2.
9*−
2.6*
*0.
7ns1.
1ns−
0.2ns
0.4ns
nsp
>0.
05,*
p≤
0.05
,**p
<0.
01,*
**p
<0.
001.
p-va
lues
wer
ead
just
edus
ing
Bon
ferr
onic
orre
ctio
ns.V
alue
sin
bold
corr
espo
ndto
the
com
pari
son
ofbu
dde
velo
pmen
tbet
wee
ncu
tting
san
ddo
nort
rees
.

140 Chapter 7
Fig. 7.4: Bud and leaf development progression in spring for each experimental group.The time on the x-axis is expressed as thermal time, i.e., accumulation of degrees above5 ◦C at an hourly scale since the beginning of the experiment (1 March 2013). Barsrepresent standard errors.

7 Are cuttings a good proxy to explore temperate forest phenology? 141
Tabl
e7.
3:M
ean
phen
olog
ical
diff
eren
ces
expr
esse
din
degr
eeho
urs
(◦C
h)am
ong
each
expe
rim
enta
lgro
upat
phen
olog
ical
stag
es2
(bud
burs
t)an
d3
(lea
f-ou
t)te
sted
bya
pair
edt-
test
. Adu
ltA
dult
cutti
ngSa
plin
gSa
plin
gcu
tting
Stag
e2
Stag
e3
Stag
e2
Stag
e3
Stag
e2
Stag
e3
Stag
e2
Stag
e3
C.b
etul
usA
dult
cutti
ng68
ns−
142ns
Sapl
ing
−69
8**−
875*
**−
766*
*−
695ns
Sapl
ing
cutti
ng−
727*
*−
757*
*−
795*
*−
572ns
−29
ns11
8ns
Seed
ling
−72
4**−
887*
**−
792*
−79
1ns−
26ns−
11.9
ns2ns
−13
0ns
A.p
seud
opla
tanu
sA
dult
cutti
ng−
83ns
−71
ns
Sapl
ing
−62
2ns−
672*
−53
9ns−
602ns
Sapl
ing
cutti
ng−
628*
*−
625*
*−
545*
*−
575*
*−
5ns36
ns
Seed
ling
−13
12**
*−
1373
***−
1229
***−
1290
***−
689*−
712*
−68
4**−
748*
*F.
sylv
atic
aA
dult
cutti
ng−
165ns
−18
8ns
Sapl
ing
−53
0*−
493*
−36
5*−
306ns
Sapl
ing
cutti
ng−
526*
−52
5*−
362ns
−33
8ns3ns
−32
ns
Seed
ling
−46
0*−
513*
−29
5*−
326*
70ns
−20
ns67
ns12
ns
nsp
>0.
05,*
p≤
0.05
,**p
<0.
01,*
**p
<0.
001.
p-va
lues
wer
ead
just
edus
ing
Bon
ferr
onic
orre
ctio
ns.V
alue
sin
bold
corr
espo
ndto
the
com
pari
son
ofbu
dde
velo
pmen
tbet
wee
ncu
tting
san
ddo
nort
rees
.

142 Chapter 7
Phenological differences between cuttings and donor trees
Overall, bud burst of cuttings tightly paralleled bud burst of donor trees(Fig. 7.3). However, the phenological discrepancy between cuttings anddonor trees was always positive, indicating a slight phenological delay ofcuttings. This slightly later phenology of cuttings was found to be signif-icant within the adult category only for Acer at stage 2 (1.1 days delay;Table 7.2).
Interestingly, when comparing the thermal time to bud burst betweencuttings and the whole tree, no significant difference was found for anyspecies, phenological stage or life stage (Table 7.3, Fig. 7.4). This is be-cause the air temperature at sapling height and at the height where adultbranches were monitored was slightly warmer than the air temperaturerecorded at seedling height, i.e., at the height where also our cuttings werepositioned in the plastic boxes (Fig. 7.1 and 7.2). In contrast, for all speciescuttings of saplings exhibited significantly fewer degree hours to bud burstthan adult trees (from−525 to−757 ◦C h, for Fagus and Carpinus, respec-tively; Table 7.3, Fig. 7.4).
Discussion
Unravelling the mechanisms that drive tree phenology in response to en-vironmental cues in experiments is challenging due to the size of adult in-dividuals, constraining researchers to use either young trees or cuttings assubstitutes. The present study confirms that young trees do exhibit differ-ent phenology from conspecific adult trees, as previously reported (Seiwa1999a, 1999b, Richardson and O’ Keefe 2009, Vitasse 2013). Therefore,phenological data obtained from juvenile trees (seedlings and saplings)should not be considered as surrogates for phenological responses of adulttrees (Vitasse 2013). In contrast, the phenology of watered cuttings heldunder field conditions was found to mirror the phenology of donor treesboth in saplings (earlier) and adult trees (later), and would therefore con-stitute a better surrogate for adult trees than juvenile trees. The findingsalso suggest that there is no wholetree influence on bud development inspring, e.g., long-distance hormonal signals, which differs from that incuttings for these three species (branch autonomy).

7 Are cuttings a good proxy to explore temperate forest phenology? 143
Buds may respond autonomously to environmental cues
The physiological mechanism of dormancy release remains poorly un-derstood. Once endodormancy is released, the remaining cascade of re-sponses appears to be intrinsic to the bud itself (e.g., the gradual recon-stitution of symplasmic channels among apical meristem cells in responseto chilling temperatures; Rinne et al. 2001). Nevertheless, local transportof hormones from tissues located close to, but outside the buds is not ex-cluded in cuttings, though cuttings lack internal sap pressure. The role ofhormones in dormancy release is still controversial (reviewed in Rohdeand Bhalerao 2007 and references therein; see also Cooke et al. 2012).An increase in GA was generally reported prior to and during bud burstin forest trees, and even in cuttings. However, the origin of GA is unclearand could be located in buds or in adjacent tissues with a local transferto bud cells rather than from distant tissues (Hewett and Wareing 1973).Similarly the concentration of cytokinins increases during dormancy re-lease and prior to bud burst (e.g., in Scots pine according to Qamaruddinet al. 1990). For Salix babylonica L., Staden (1979) suggested that budsthemselves do not have the ability to synthesize cytokines but they canhydrolyse storage forms with the resumption of extension growth.
Although the timing of bud burst in rooted cuttings or cuttings bear-ing several buds has been shown to be parallel to that on mature trees infruit tree species (Arias and Crabbé 1975, Couvillon et al. 1975), to ourknowledge, it has never been shown in forest tree species.
Importance of recording temperature at a micro-scale
Here, we attributed the slightly later phenology of cuttings compared withdonor trees to micro-environmental gradients, given that the temperaturerecorded at the monitored branch level of adult trees was slightly warmerthan the one measured at seedling height (the mean difference during theexperiment 0.3 K, ∼500 ◦C h). Indeed, no significant phenological dis-crepancy was found between cuttings and donor trees when comparingthe thermal time to bud burst. The daily course of the mean temperatureaveraged over the period of the experiment showed that the daily maximaltemperature is reached later at a height of 9 m (and probably even later
144 Chapter 7
in the canopy) than in the understorey, which seems to affect the coolingduring late evening and night in a way that the air temperature at a heightof 9 m remains slightly warmer than in the understorey (supplementaryFig. S7.1). This pattern is likely the result of the site topography (north-facing slope) and its effect on the incoming radiation. In contrast, the phe-nological discrepancy between juvenile and adult trees is clearly the resultof ontogenic effects rather than micro-environmental effects, since juve-nile trees flushed earlier than adult trees in all three species, in spite of thecooler temperature recorded at seedling height.
Comparison among species
Overall, the phenological discrepancy observed between seedlings andadults was much smaller during spring 2013 than the one recorded onthe same site and species in the previous year (Vitasse 2013). This couldbe explained by the exceptionally cool early spring that occurred duringthe present experiment. Indeed, if considering that juvenile trees exhibita shallower level of endodormancy than adult trees (Vitasse 2013), andso are ‘programmed’ for earlier leaf-out than canopy trees, but cannotproceed because of cold weather, the seedling–adult phenology gap is re-duced. Thus, under warm early spring conditions, such as occurred in 2012(Vitasse 2013), the gap widens, while it gets narrower under cooler earlyspring conditions, as occurred in the present study.
Interestingly, the ranking across species was not conserved betweenadult and seedling stages: bud burst of seedlings occurred 5 days earlierin Acer compared with Fagus, whereas in adult trees, bud burst of Aceroccurred 3 days later than for Fagus. The same change in the sequenceof species phenology between seedling and adult stages was reported inthe previous year at the same site (Vitasse 2013). We attributed this se-quence change between young and mature trees to different environmen-tal requirement for a full dormancy release in juvenile trees, such as alower chilling requirement, which is especially distinct in Acer. In agree-ment with this hypothesis, rooted cuttings from adult trees were shown toexhibit greater chilling requirement than juvenile plant material in Acersaccharinum L. (Ashby et al. 1991), strengthening the evidence that cut-tings excised from adults are better at mirroring adult trees than seedlings.

7 Are cuttings a good proxy to explore temperate forest phenology? 145
A shallower endodormancy in young trees enables them to start their de-velopment before canopy closure and therefore to enhance their growthand competitive abilities, which is crucial under dense understory condi-tions (Gill et al. 1998, Augspurger 2008). In contrast, adult trees reach-ing the canopy adopt a safer strategy in relation to late spring freezingevents by exhibiting a deeper endodormancy (higher requirement of chill-ing and longer photoperiod for a full dormancy release), allowing themto reduce the likelihood of freezing damage, particularly in reproductiveorgans. Thus, the species and age-specific relationship between the differ-ent environmental requirements may lead to changes in the phenologicalsequence among species between young and adult trees under differentspring conditions. Accordingly, the sequence of bud burst timing on wa-tered cuttings among 36 woody species was shown to significantly changeunder low chilling conditions (Laube et al. 2014).
Methodological considerations
The use of watered cuttings to assess spring phenological responses hassome shortcomings: only part of the whole bud dormancy cycle can bemanipulated, as watered cuttings have a restricted lifetime, and are thusmost appropriate to investigate dormancy release and bud burst. Here, wesampled the cuttings on 1 March 2013, assuming that the chilling require-ments have been met before, and the buds were therefore in the ecodor-mant phase. Yet, we are confident that sampling during the endodormancyphase would not have influenced the general response patterns observedhere. Ring-porous species such as Quercus and Fraxinus may give riseto conduit failure when used as cuttings, which is less likely to occur indiffuse-porous species as examined here. Rooted cuttings excised fromadult trees may overcome the issue of short experimental period, and itneeds to be explored whether such rooted cuttings retain adult stage de-velopmental physiology. The use of either single node cuttings or cuttingsbearing several buds may also influence the results. Here we used cuttingsbearing several buds instead of single node cuttings in order to maintaincorrelative inhibition that may influence bud burst timing (Ghelardini et al.2010), but only apical buds were monitored here to minimize bias amongthe different experimental groups of test plants.

146 Chapter 7
Conclusion
Our study reveals that bud burst of watered cuttings respond to environ-mental cues similarly to adult trees in the three studied species and, thus,can be used as a substitute for mature trees in warming and photoperiodexperiments. In contrast, our study highlights that neither cuttings ex-tracted from saplings nor intact saplings or seedlings in natural conditionsconstitute a good surrogate for adult phenology, since they all exhibitedearlier phenology than canopy trees. Hence, due to strong ontogenetic ef-fects acting on phenology, experiments conducted on young trees are notappropriate to infer phenological responses of forests to climate warm-ing, and cuttings excised from adults should be preferred instead, but thistreatment may affect species differently depending on their xylem struc-ture. Finally, actual spring weather may narrow or widen the phenologygap between juvenile and adult trees.
Acknowledgements We are grateful to Christian Körner for his valuable pieces ofadvice that improved the original manuscript. We are also grateful to two anonymousreferees and to the editor for their supportive and constructive comments on a previousversion of the manuscript.
The research leading to these results has been funded by the European ResearchCouncil (ERC) grant 233399 (project TREELIM).
References
Arias O, Crabbé J (1975) Les gradients morphogénétiques du rameau d’un an des végé-taux ligneaux, en repos apparent. Physiol. Vég. 13: 69–81.
Arora R, Rowland LJ, Tanino K (2003) Induction and release of bud dormancy inwoody perennials: a science comes of age. Hortscience 38: 911–921.
Ashby WC, Bresnan DF, Huetteman CA, Preece JE, Roth PL (1991) Chilling and budbreak in silver maple. J. Environ. Hortic. 9: 1–4.
Augspurger CK (2008) Early spring leaf out enhances growth and survival of saplingsin a temperate deciduous forest. Oecologia 156: 281–286.
Barros PM, Goncalves N, Saibo NJM, Oliveira MM (2012) Cold acclimation and floraldevelopment in almond bud break: insights into the regulatory pathways. J. Exp.Bot. 63: 4585–4596.
Basler D, Körner C (2012) Photoperiod sensitivity of bud burst in 14 temperate foresttree species. Agric. For. Meteorol. 165: 73–81.

7 Are cuttings a good proxy to explore temperate forest phenology? 147
Beaubien EG, Freeland HJ (2000) Spring phenology trends in Alberta, Canada: linksto ocean temperature. Int. J. Biometeorol. 44: 53–59.
Caffarra A, Donnelly A (2011) The ecological significance of phenology in four differ-ent tree species: effects of light and temperature on bud burst. Int. J. Biometeorol.55: 711–721.
Chao WS, Foley ME, Horvath DP, Anderson JV (2007) Signals regulating dormancyin vegetative buds. Int. J. Plant Dev. Biol. 1: 49–56.
Chuine I, Morin X, Bugmann H (2010) Warming, photoperiods, and tree phenology.Science 329: 277–278.
Cooke JE, Eriksson ME, Junttila O (2012) The dynamic nature of bud dormancy intrees: environmental control and molecular mechanisms. Plant Cell Environ. 35:1707–1728.
Couvillon GA, King GA, Moore CM, Bush P (1975) Obtaining small peach plantscontaining all bud types for rest and dormancy studies. Hortscience 10: 78–79.
Fu YH, Campioli M, Deckmyn G, Janssens IA (2012) The impact of winter and springtemperatures on temperate tree budburst dates: results from an experimental climatemanipulation. PLoS One 7: e47324.
Ghelardini L, Santini A, Black-Samuelsson S, Myking T, Falusi M (2010) Bud dor-mancy release in elm (Ulmus spp.) clones—a case study of photoperiod and temper-ature responses. Tree Physiol. 30: 264–274.
Gill DS, Amthor JS, Bormann FH (1998) Leaf phenology, photosynthesis, and the per-sistence of saplings and shrubs in a mature northern hardwood forest. Tree Physiol.18: 281–289.
Heide OM (1993) Daylength and thermal time responses of budburst during dormancyrelease in some northern deciduous trees. Physiol. Plant. 88: 531–540.
Hewett EW, Wareing PF (1973) Cytokinins in Populus× robusta: changes during chill-ing and bud burst. Physiol. Plant. 28: 393–399.
Horvath DP, Anderson JV, Chao WS, Foley ME (2003) Knowing when to grow: signalsregulating bud dormancy. Trends Plant Sci. 8: 534–540.
Ibanez I, Primack RB, Miller-Rushing AJ, Ellwood E, Higuchi H, Lee SD, Kobori H,Silander JA (2010) Forecasting phenology under global warming. Philos. Trans. R.Soc. B. 365: 3247–3260.
Jiménez S, Reighard GL, Bielenberg DG (2010) Gene expression of DAM5 and DAM6is suppressed by chilling temperatures and inversely correlated with bud break rate.Plant Mol. Biol. 73: 157–167.
Körner C, Basler D (2010) Phenology under global warming. Science 327: 1461–1462.Körner C, Asshoff R, Bignucolo O, Hättenschwiler S, Keel SG, Peláez-Riedl S, Pepin
S, Siegwolf RTW, Zotz G (2005) Carbon flux and growth in mature deciduous foresttrees exposed to elevated CO2. Science 309: 1360–1362.
Lang GA (1994) Dormancy—the missing links—molecular studies and integration ofregulatory plant and environmental interactions. Hortscience 29: 1255–1263.
Laube J, Sparks TH, Estrella N, Höfler J, Ankerst DP, Menzel A (2014) Chilling out-weighs photoperiod in preventing precocious spring development. Glob. ChangeBiol. 20: 170–182.

148 Chapter 7
Menzel A (2000) Trends in phenological phases in Europe between 1951 and 1996. Int.J. Biometeorol. 44: 76–81.
Morin X, Lechowicz MJ, Augspurger C, O’ Keefe J, Viner D, Chuine I (2009) Leafphenology in 22 North American tree species during the 21st century. Glob. ChangeBiol. 15: 961–975.
Morin X, Roy J, Sonie L, Chuine I (2010) Changes in leaf phenology of three Europeanoak species in response to experimental climate change. New Phytol 186:900–910.
Murray MB, Cannell MGR, Smith RI (1989) Date of budburst of fifteen tree species inBritain following climatic warming. J. Appl. Ecol. 26:693–700.
Qamaruddin M, Dormling I, Eliasson L (1990) Increases in cytokinin levels in Scotspine in relation to chilling and bud burst. Physiol Plant 79:236–241.
R Development Core Team R (2011) A language and environment for statistical com-puting. R Foundation for Statistical Computing, Vienna, Austria.
Richardson AD, O’ Keefe J (2009) Phenological differences between understory andoverstory: a case study using the long-term Harvard Forest records. In: Noormets A(ed.) Phenology of ecosystem processes. Springer, New York, NY, pp 87–117.
Richardson AD, Black TA, Ciais P, Delbart N, Friedl MA, Gobron N, Hollinger DY,Kutsch WL, Longdoz B, Luyssaert S, Migliavacca M, Montagnani L, Munger WJ,Moors E, Piao S, Rebmann C, Reichstein M, Saigusa N, Tomelleri E, Vargas R,Varlagin A (2010) Influence of spring and autumn phenological transitions on forestecosystem productivity. Philos. Trans. R. Soc. B. 365: 3227–3246.
Richardson AD, Keenan TF, Migliavacca M, Ryu Y, Sonnentag O, Toomey M (2013)Climate change, phenology, and phenological control of vegetation feedbacks to theclimate system. Agric. For. Meteorol. 169: 156–173.
Rinne PLH, Kaikuranta PM, Van Der Schoot C (2001) The shoot apical meristem re-stores its symplasmic organization during chilling-induced release from dormancy.Plant J. 26: 249–264.
Rohde A, Bhalerao RP (2007) Plant dormancy in the perennial context. Trends PlantSci. 12: 217–223.
Saito T, Bai SL, Ito A, Sakamoto D, Saito T, Ubi BE, Imai T, Moriguchi T (2013)Expression and genomic structure of the dormancy-associated MADS box genesMADS13 in Japanese pears (Pyrus pyrifolia Nakai) that differ in their chilling re-quirement for endodormancy release. Tree Physiol. 33: 654–667.
Seiwa K (1999a) Changes in leaf phenology are dependent on tree height in Acer mono,a deciduous broad-leaved tree. Ann. Bot. 83: 355–361.
Seiwa K (1999b) Ontogenetic changes in leaf phenology of Ulmus davidiana var.japonica, a deciduous broad-leaved tree. Tree Physiol. 19: 793–797.
Staden JV (1979) Changes in the endogenous cytokinin levels of excised buds of Salixbabylonica L., cultured aseptically. Bot. Gaz. 140: 138–141.
van Asch M, Visser ME (2007) Phenology of forest caterpillars and their host trees: theimportance of synchrony. Annu. Rev. Entomol. 52: 37–55.
Vitasse Y (2013) Ontogenic changes rather than difference in temperature cause under-story trees to leaf out earlier. New Phytol. 198: 149–155.

7 Are cuttings a good proxy to explore temperate forest phenology? 149
Vitasse Y, Basler D (2013) What role for photoperiod in the bud burst phenology ofEuropean beech. Eur. J. For. Res. 132: 1–8.
Vitasse Y, Francois C, Delpierre N, Dufrene E, Kremer A, Chuine I, Delzon S (2011)Assessing the effects of climate change on the phenology of European temperatetrees. Agric. For. Meteorol. 151: 969–980.
Wareing PF, Saunders PF (1971) Hormones and dormancy. Ann. Rev. Plant Physiol.22: 261–288.
Wolkovich EM, Cook BI, Allen JM, Crimmins TM, Betancourt JL, Travers SE,PauS, Regetz J, Davies TJ, Kraft NJB, Ault TR, Bolmgren K, Mazer SJ, McCabe GJ,McGill BJ, Parmesan C, Salamin N, Schwartz MD, Cleland EE (2012) Warmingexperiments underpredict plant phenological responses to climate change. Nature485 (7399): 494–497
Supplementary material
Fig. S7.1: Daily course of mean temperature at different height levels (seedling, saplingand adult height) in the study site during the experiment (Mean across 70 days, from 1March 2013 to 10 May 2013, 30 minutes logging interval)

150 Chapter 7
Tabl
eS7
.1:
Det
ails
ofth
em
ultip
lepa
ired
t-te
sts
perf
orm
edon
phen
olog
ical
diff
eren
ces
expr
esse
din
days
amon
gea
chex
peri
men
tal
grou
pat
the
phen
olog
ical
stag
es2
(bud
burs
t)an
d3
(lea
f-ou
t)th
eda
ta.T
het-
stat
istic
valu
ean
dth
eD
Fis
repo
rted
.
Adu
ltA
dult
Cut
ting
Sapl
ing
Sapl
ing
Cut
ting
Stag
e2
Stag
e3
Stag
e2
Stag
e3
Stag
e2
Stag
e3
Stag
e2
Stag
e3
DF
tD
Ft
DF
tD
Ft
DF
tD
Ft
DF
tD
Ft
Car
pinu
sbe
tulu
sA
dult
Cut
ting
91.
46
1.5
Sapl
ing
9-4
.29
-5.7
9-6
.66
-2.9
Sapl
ing
cutti
ng9
-3.1
9-1
.99
-4.6
6-1
.69
0.8
92
Seed
ling
9-6
.49
-4.4
9-6
.96
-2.6
9-2
90.
79
-2.2
9-1
.3A
cer
pseu
dopl
atan
usA
dult
Cut
ting
93.
88
3.5
Sapl
ing
9-2
.19
-1.9
9-2
.98
-3.3
Sapl
ing
cutti
ng9
-2.9
9-2
.19
-4.2
8-4
.89
0.5
91.
1Se
edlin
g9
-6.7
9-6
.69
-7.2
8-6
.79
-3.6
9-3
.79
-4.9
9-4
.9Fa
gus
sylv
atic
aA
dult
Cut
ting
93.
49
0.9
Sapl
ing
9-1
.29
-2.3
9-4
.79
-4.5
Sapl
ing
cutti
ng9
-0.3
9-1
.79
-3.2
9-3
.39
29
1.2
Seed
ling
9-0
.59
-1.8
9-3
.79
-4.8
90.
79
1.3
9-0
.29
0.5

7 Are cuttings a good proxy to explore temperate forest phenology? 151
Tabl
eS7
.2:D
etai
lsof
the
mul
tiple
pair
edt-
test
spe
rfor
med
onph
enol
ogic
aldi
ffer
ence
sex
pres
sed
inde
gree
hour
s(◦
Ch)
amon
gea
chex
peri
men
talg
roup
atth
eph
enol
ogic
alst
ages
2(b
udbu
rst)
and
3(l
eaf-
out)
the
data
.The
t-st
atis
ticva
lue
and
the
DF
isre
port
ed.
Adu
ltA
dult
Cut
ting
Sapl
ing
Sapl
ing
Cut
ting
Stag
e2
Stag
e3
Stag
e2
Stag
e3
Stag
e2
Stag
e3
Stag
e2
Stag
e3
DF
tD
Ft
DF
tD
Ft
DF
tD
Ft
DF
tD
Ft
Car
pinu
sbe
tulu
sA
dult
Cut
ting
90.
66
-1Sa
plin
g9
-6.2
9-1
09
-66
-3.6
Sapl
ing
cutti
ng9
-6.5
9-5
.39
-6.2
6-2
.49
-1.1
92
Seed
ling
9-5
.69
-9.4
9-4
.66
-3.5
9-0
.49
-0.2
90
9-1
.2A
cer
pseu
dopl
atan
usA
dult
Cut
ting
9-1
.38
-0.9
Sapl
ing
9-3
.49
-3.8
9-3
.18
-3.6
Sapl
ing
cutti
ng9
-5.6
9-5
.19
-5.2
8-5
.69
-0.1
90.
4Se
edlin
g9
-12.
59
-9.6
9-1
08
-8.3
9-4
.29
-4.4
9-5
.29
-5.8
Fagu
ssy
lvat
ica
Adu
ltC
uttin
g9
-2.2
9-1
.9Sa
plin
g9
-4.1
9-3
.79
-3.7
9-3
.2Sa
plin
gcu
tting
9-3
.99
-3.8
9-3
.49
-3.2
90.
19
-0.8
Seed
ling
9-4
.39
-4.5
9-4
.39
-4.7
90.
69
-0.2
90.
69
0.1


Part IIISummary and conclusions


Chapter 8Summary and general conclusions
David Basler
Aim
The aim of this thesis was to arrive at an understanding of how the tem-perate tree species respond and adjust their phenology to temperature andphotoperiod in order to escape the risk of fatal freezing damage in spring.The following key questions were addressed:
1. Is the timing of bud burst of temperate forest trees related to photope-riod and if so, how strong is photoperiod control?
2. How is the phenology and development before bud burst (during dor-mancy release) affected by the interaction of photoperiod and temper-ature?
3. Are the mechanisms of current ‘process-based’ phenological modelsable to reflect the interacting nature of the underlying drivers?
Summary
Using both, experimental and modeling approaches, I investigated the en-vironmental controls of spring phenology in temperate forest trees. In thefollowing, I provide a general summary of the work conducted, as well asa short outlook, highlighting the prospects for possible follow-up studies.
155

156 Chapter 8
Photoperiod sensitivity of bud burst in 14 temperate forest treespecies (Chapter 2)
Depending on the successional status and life strategy, the spring phenol-ogy of temperate tree species is affected by daylength: while early succes-sional species are thought to take a rather ‘opportunistic’ approach andtheir development follows (potentially misleading) warm temperaturesonly, late successional species are thought to respond rather ‘conservative’and avoid the risk of possible freezing damage. We tested these hypothesesin 14 species by exposing cuttings to controlled photoperiod conditions(gradually adjusted with time according to the natural daylength expan-sion during spring). We observed a distinct photoperiod sensitivity in thelate successional Fagus sylvatica, and a weaker, but still significant delayof bud burst under shorter photoperiod in Tilia cordata, Quercus petraea,Abies alba and Picea abies, but not in the other nine species. Elevation ofand region of origin further affected photoperiod sensitivity in three outof the five photoperiod sensitive species. We concluded that photoperiodicconstrains may keep these species from tracking the rising temperaturesat the current rate.
Photoperiod and temperature responses of bud swelling and budburst in four temperate forest tree species (Chapter 3)
A delayed bud swelling under short photoperiod may be the result of alater start of bud development, due to a photoperiod threshold, or may re-sult from slower rates of bud development under short photoperiods. Infour species, we investigated the response of bud swelling (a clear markerthat dormancy has been released) under contrasting, controlled temper-ature and photoperiod conditions during the period of natural dormancyrelease in spring. We observed that, the depth of dormancy (reflected bydays to bud burst under warm, long day conditions) decreased already be-fore any sign of bud swelling became evident. We found a clear effect ofphotoperiod on the duration of bud swelling in Picea, Quercus and Fa-gus, but not in Acer, while the onset of bud swelling was affected by thephotoperiod treatment in Fagus only. We thus concluded that photoperiodhas a quantitative effect on bud growth and development, rather than justexerting a simple threshold function.

8 Summary and general conclusions 157
Evaluating phenological models for the prediction of leaf-out dates insix temperate tree species across central Europe (Chapter 4)
In an attempt at exploring wheather the photoperiodic responses observedin our experiments could help to improve the currently existing, widelyused phenological models when applied beyond the range currently cov-ered by observational data, I assessed the performance of a large num-ber of different published models (and recombinations thereof) on a largelong-time phenological data set. Surprisingly, even quite contrasting mod-els structures yielded quite similar predictions for the timing of leaf un-folding. An in-depth analysis revealed, that the highly parameterized mod-els most likely overfit to the data, and that responses taking place duringwinter are not reflected in these long-term observation data sets and thusremain unaccounted for in models. The low prediction error of most mod-els actually results from the temperature effect shortly before bud burst.Thus, arrive at realistic projections of phenology in future climates, mod-els need to be calibrated against trustworthy experimental data and theirstatistical validation should not be assumed to reflect the actual mecha-nisms of environmental control of trees phenology.
Phenology under global warming (Chapter 5)
In this ‘Perspectives’, we summarized the concept of photoperiod controlof spring phenology in trees, based on past research. We divide tree speciesinto three basic categories, based on the environmental control of springphenology employed: Species responding to temperature only, species re-sponding to warm temperatures only after a certain chilling requirementhas been fulfilled and finally species, in which the response to warm tem-perature is facilitated by the opening of a photoperiod ‘window’, after thechilling requirements have been fulfilled. Late successional tree speciesare thought to belong to the last category. This basic classification servedas working hypothesis for this thesis. Originally thought as a reminder ofa seemingly ignored environmental driver, this article has received a lot ofattention and initiated a revival of the debate on the influence of photope-riod on phenology.

158 Chapter 8
What role for photoperiod in the bud burst phenology of Europeanbeech (Chapter 6)
As one of the most dominant tree species in Europe, data for Fagus syl-vatica is well represented in the scientific literature, and yet the basicphysiology is poorly understood. The temporal variation of phenology ofFagus is characterized by a remarkably low inter-annual variation, com-pared to other species. Indeed, many studies (also the ones in this thesis)have found a distinct photoperiod sensitivity of this species. Other authorssuggested that Fagus exhibits a large chilling requirement. From this as-sumption we merged results obtained from experimental studies, model-ing studies, and long term-observations to compose a conceptual modelof the interactions of chilling and photoperiod, accounting for the verystable timing of bud burst at low elevation sites, as well as for the earlierof bud burst observed at higher elevations during the last decades due toclimate warming. We conclude that photoperiod may exert a stabilizingeffect on bud burst in Fagus, by delaying bud burst in regions were thechilling requirement is fulfilled early in winter, and by substituting thechilling signal, and accelerating bud burst in mild regions where the chill-ing requirement may not be fulfilled, such as at the southern range limitsof the distribution.
Is the use of cuttings a good proxy to explore phenological responsesof temperate forests in warming and photoperiod experiments?(Chapter 7)
Facing the problem that mature trees do not fit into growth chambers, andthat seedling and sampling differ in their responses from adult trees, theuse of cuttings from adult trees seems like a pragmatic solution. Indeedcuttings are often used to asses phenological responses to temperature andphotoperiod under controlled conditions (e.g., also in Chapter 2 and 3).However, cuttings are per definition disconnected from possible whole-tree signals that facilitate dormancy release and bud burst. In this study,we assessed the phenology of mature trees, saplings and seedling, as wellas from cuttings from mature trees and from saplings in three species in-situ. We found that the response of cuttings reflects the phenology of thedonor tree and reflects also the distinct difference in the timing of bud

8 Summary and general conclusions 159
burst between the young life stages and mature trees. Thus, we concludedthat cuttings may serve as proxy for the responses of mature trees in theexamined species.
Outlook
Based on our findings, (controlled) experiments should be undertaken us-ing multiple photoperiod treatments to quantify the interactions of pho-toperiod and temperature and also to elucidate the nature of ecotypic dif-ferentiation. An ambitious follow-up project should first establish a set ofvisual, anatomical, physiological or molecular markers for the bud dor-mancy state and then advance towards a real-scale photoperiod reductionin mature forest trees, the perhaps most challenging type of any manipula-tion in global change research. This would require the day/ night extensionby complete darkness (because photoperiod signal act dose-independent,with a very low threshold). Once such an experiment is setup, the ad-ditional manipulation of chilling and/or forcing would then seem to bestraightforward.
General Conclusions
The timing of spring phenology is the evolutionary result of minimizingthe risk of late frost damage in spring. The results obtained in this the-sis suggest that species have adopted different strategies to optimize thetrade-off between maximizing the growing season and minimizing the riskof freezing damage. Distinct photoperiod sensitivity, as exhibited by Fa-gus, seems to be the safest strategy to avoid freezing damage in climateswith unpredictable weather in spring. However, the additional safety iscostly in terms of the missed opportunity of a longer growing season inwarm years. Nevertheless, Fagus has successfully competed across largeparts of Europe. Given the different degrees of photoperiod sensitivityexhibited by late successional trees, together with their interaction withpossible chilling and forcing requirements, the response to warming willbe non-linear. The phenology of most late successional species will thus

160 Chapter 8
not continue to track climatic warming at the current rate. We are confi-dent that the responses derived from cuttings are representative for maturetrees at least for the species examined. Yet, the disruption from the wholetree signals could still lead to rather conservative estimates of the photope-riod responses. Opportunistic taxa may increasingly profit from a warmerclimate and may thus gain a competitive advantage over photoperiod-sensitive taxa.