environmental control and limnological impacts of a large recurrent spring bloom in lake washington,...
Post on 20-Dec-2015
213 views
TRANSCRIPT

Environmental control and limnological Environmental control and limnological impacts of a large recurrent spring bloom in impacts of a large recurrent spring bloom in
Lake Washington, USA.Lake Washington, USA.
..ArhonditsisArhonditsis11, M.T.Brett, M.T.Brett11, , D.E. SchindlerD.E. Schindler22 and and J.FrodgeJ.Frodge33
11Department of Civil and Environmental Engineering, Department of Civil and Environmental Engineering, University of Washington, Seattle, USAUniversity of Washington, Seattle, USA
22 Department of Zoology, University of Washington, 404 Department of Zoology, University of Washington, 404 Seattle, Washington, USASeattle, Washington, USA
3 3 King County Department of Metropolitan Services, Seattle, King County Department of Metropolitan Services, Seattle, Washington, USAWashington, USA

Aims of the studyAims of the study
• Quantitative assessment of the spatial vs Quantitative assessment of the spatial vs temporal variabilitytemporal variability
• Identification of the best predictors for Identification of the best predictors for phytoplankton dynamics over the annual phytoplankton dynamics over the annual cyclecycle

Land Uses in the WatershedLand Uses in the Watershed


0.0 0.1 0.2 0.3 0.4 0.5 0.6 0.7 0.8 0.9 1.0
0
10
20
30
40
50
60
Time of Year
Depth (m)
8 10 12 14 16 18 20Temperature (°C)

0.00 0.20 0.40 0.60 0.80 1.00
0
10
20
30
40
50
60
Time of Year
Depth (m)
2 4 6 8 10Chlorophyll concentration (µg/L)

-0.04
-0.02
0
0.02
0.04
Vol.
Wt.
Phyto
. G
row
th R
ate
(p
er d
ay
)
6
7
8
9
10
11
12
13
Vol.
Wt.
Tem
peratu
re (
°C
)
0 0.2 0.4 0.6 0.8 1
Time of Year
Lake Washington Phyto. GrowthTemperature
0
1
2
3
4
5
6
7
Vo
l. W
t. C
hlo
ro
ph
yll
Co
nc.
(µ
g/L
)
6
7
8
9
10
11
12
13V
ol.
Wt.
Tem
perau
re (
°C
)
0 0.2 0.4 0.6 0.8 1
Time of Year
Lake Washington ChlorophyllTemperature
Vol
.Wt.
Chl
orop
hyll
(ug/
l)V
ol.W
t. C
hlor
ophy
ll (u
g/l)
Vol
.Wt.
Tem
pera
ture
(oC
)V
ol.W
t. T
empe
ratu
re (
oC)
Temperature
Temperature
Chlorophyll
Phyto GrowthTime of the year
Time of the year

0
5
10
15
Colu
mn 4
6
8
10
12
14
16
Colu
mn 2
84 85 86 87 88 89 90
Column 1
Data #3 Vol. Wt. Chl.
Vol. Wt. Temp.

0
2
4
6
8
10
Biom
ass (
µg C
hla/
l)
0.0 0.1 0.2 0.3 0.4 0.5 0.6 0.7 0.8 0.9 1.0
Time of Year
Lake Washington seasonal phytoplankton succession
Others
Cyanos
Greens
Cryptos
Diatoms


1 2 3 4 5 6 7 8 9 10 11 120
100
200
300
400
500
Zo
op
lan
kto
n c
on
cen
trati
on
(u
g d
w/l)
Months
Bosmina Cyclops Daphnia Diaphanosoma Diaptomus Epischura Others
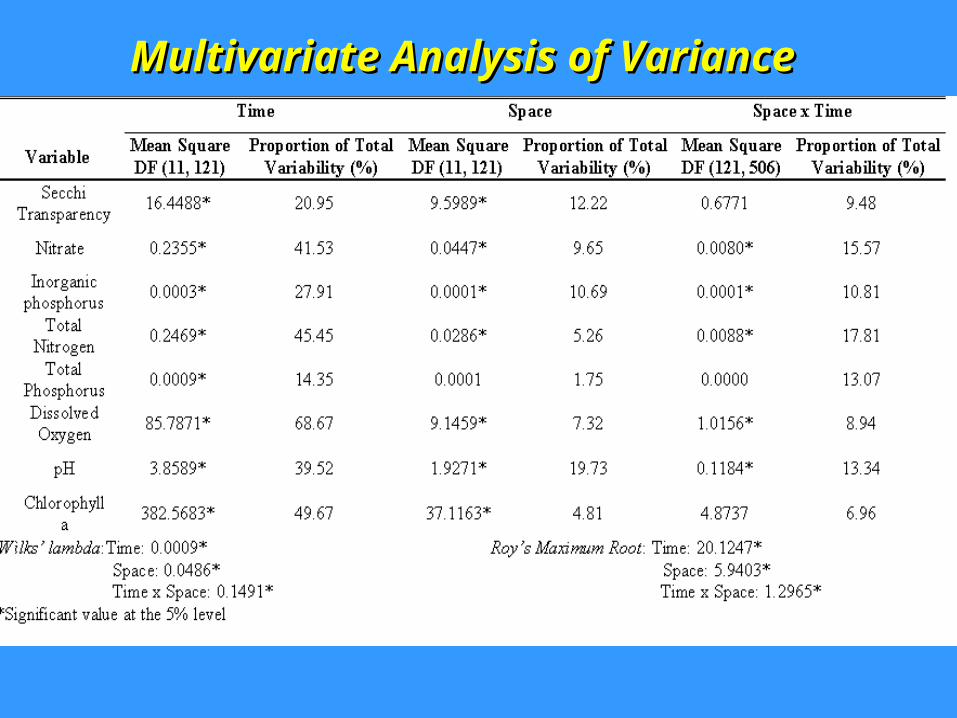
Multivariate Analysis of VarianceMultivariate Analysis of Variance

-0.4
0
0.4
0.8
1.2
1.6
1975 1976 1977 1978 1979 1980 1981 1982 1983 1984 1985 1986 1987 1988 1989 1990 1991 1992 1993 1994 1995 1996 1997 1998 1999
Chl
oroph
yll (
ug/l)
Raw data Trend
-0.4
0
0.4
0.8
1975 1976 1977 1978 1979 1980 1981 1982 1983 1984 1985 1986 1987 1988 1989 1990 1991 1992 1993 1994 1995 1996 1997 1998 1999
Chl
oroph
yll (
ug/l)
Seasonal Component
Time Series AnalysisTime Series Analysis
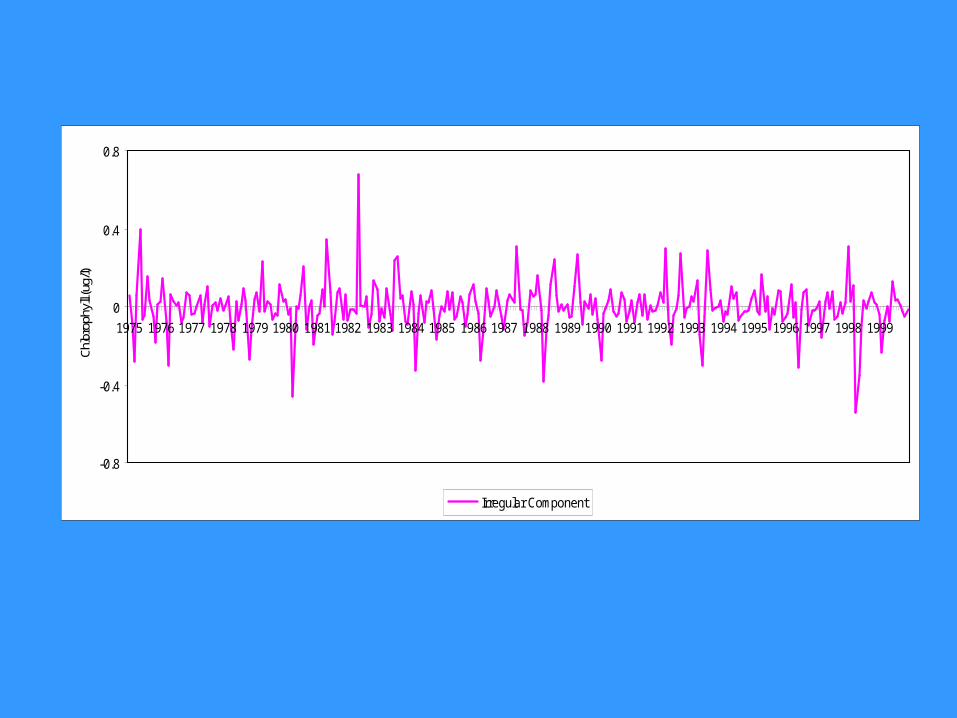
-0.8
-0.4
0
0.4
0.8
1975 1976 1977 1978 1979 1980 1981 1982 1983 1984 1985 1986 1987 1988 1989 1990 1991 1992 1993 1994 1995 1996 1997 1998 1999
Chl
orop
hyll
(ug/
l)
Irregular Component

Principal Component AnalysisPrincipal Component AnalysisYEAR JAN FEB MAR APR MAY JUN JUL AUG SEP OCT NOV DEC1975 0.630435 0.47801 0.290486 0.63384 0.985265 0.539066 0.559354 0.74723 0.606657 0.513737 0.382006 0.5857771976 0.626386 0.778422 0.589133 0.377757 0.737294 0.659692 0.598065 0.559365 0.404498 0.390599 0.48718 0.4546831977 0.342483 0.331228 0.347907 0.396789 0.251092 0.3578 0.459778 0.275764 0.411073 0.459997 0.448277 0.5300081978 0.478592 0.5009 0.528612 0.389064 0.245793 0.499619 0.421819 0.515131 0.587201 0.505684 0.169908 0.2916251979 0.415668 0.422184 0.302176 0.538905 0.251006 0.271773 0.256276 0.215011 0.309423 0.377829 0.620712 0.5888371980 0.632074 0.552401 0.565804 0.095344 0.542428 0.520788 0.554989 0.657163 0.282543 0.353099 0.360479 0.1428351981 0.325409 0.397031 0.572133 0.512455 0.871245 0.589991 0.357549 0.394087 0.515926 0.503041 0.291664 0.3638171982 0.178183 0.207406 0.214772 0.23184 0.989157 0.36564 0.405225 0.506815 0.395305 0.499342 0.689397 0.6414341983 0.453007 0.479851 0.382841 0.49939 0.358323 0.287426 0.664499 0.700864 0.495809 0.505173 0.364656 0.3474951984 0.518315 0.467057 0.145688 0.454916 0.554257 0.425527 0.529645 0.508245 0.527187 0.387388 0.172982 0.2623931985 0.306131 0.293819 0.412257 0.333993 0.408809 0.267889 0.275383 0.386487 0.400372 0.345791 0.480578 0.6419631986 0.720705 0.62191 0.531689 0.242995 0.365345 0.551132 0.483242 0.397837 0.429046 0.486168 0.376069 0.321171987 0.279144 0.46327 0.533272 0.520897 0.48382 0.71577 0.329143 0.272259 0.141016 0.236838 0.447618 0.4588061988 0.481399 0.557605 0.342157 -0.04593 0.220416 0.341663 0.559964 0.737675 0.575208 0.48568 0.483267 0.4132841989 0.415845 0.332527 0.334653 0.493121 0.661165 0.414212 0.303309 0.410445 0.376977 0.441129 0.335403 0.4174941990 0.319396 0.13297 0.428332 0.508532 0.588671 0.675162 0.574523 0.545564 0.553818 0.639488 0.588363 0.4703211991 0.522693 0.593979 0.507204 0.637238 0.706895 0.605649 0.703532 0.567962 0.641441 0.619064 0.641332 0.6775161992 0.723982 0.635607 0.857463 0.422982 0.254706 0.378906 0.412933 0.490603 0.737043 0.433684 0.513758 0.5386151993 0.596147 0.559985 0.6488 0.351554 0.179963 0.439426 0.793692 0.613996 0.500368 0.489134 0.46302 0.4735621994 0.359203 0.432001 0.441534 0.591409 0.51804 0.502538 0.303428 0.280603 0.306 0.343161 0.416323 0.5528431995 0.642515 0.556809 0.536112 0.70792 0.47719 0.518353 0.33113 0.429961 0.3878 0.505359 0.486976 0.3287851996 0.351237 0.384721 0.555003 0.410631 0.521852 0.213247 0.508115 0.565672 0.546895 0.306533 0.325427 0.2907541997 0.304529 0.367022 0.240624 0.485706 0.57347 0.520185 0.603952 0.448237 0.45294 0.517925 0.48582 0.5534331998 0.837716 0.522569 0.550902 -0.16711 -0.01944 0.219535 0.372073 0.374661 0.451798 0.504258 0.435467 0.373831999 0.269397 0.034533 0.205581 0.32664 0.31156 0.579121 0.508045 0.500822 0.42046 0.335533 0.253593 0.23126

Factor 1 (21.7%)
0
0.2
0.4
0.6
0.8
JAN FEB MAR APR MAY JUN JUL AUG SEP OCT NOV DEC
Factor 2 (19.28%)
0
0.2
0.4
0.6
0.8
1
JAN FEB MAR APR MAY JUN JUL AUG SEP OCT NOV DEC
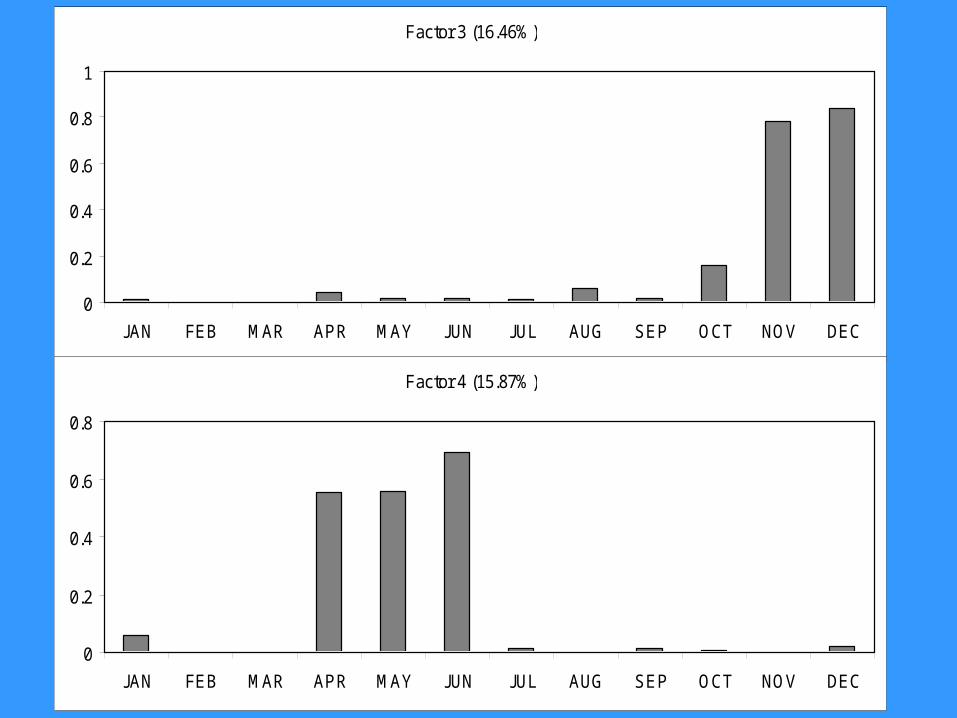
Factor 3 (16.46%)
0
0.2
0.4
0.6
0.8
1
JAN FEB MAR APR MAY JUN JUL AUG SEP OCT NOV DEC
Factor 4 (15.87%)
0
0.2
0.4
0.6
0.8
JAN FEB MAR APR MAY JUN JUL AUG SEP OCT NOV DEC

Multiple Regression ModelsMultiple Regression Models
VARIABLESVARIABLES LAGLAG COEFFICIENTSCOEFFICIENTS RR22partialpartial R2
Solar RadiationSolar Radiation -2-2 0.24970.2497 90.65 %90.65 %
InterceptIntercept -0.6579-0.6579
January-March
-0.4
0
0.4
0.8
1.2
1975 1976 1977 1978 1979 1980 1981 1982 1983 1984 1985 1986 1987 1988 1989 1990 1991 1992 1993 1994 1995 1996 1997 1998
Ch
loro
ph
yll c
on
cen
trat
ion
(u
g/l)
Observed Values Predicted Values
45.22 %45.22 %

VARIABLESVARIABLES LAGLAG COEFFICIENTSCOEFFICIENTS RR22partialpartial R2
CladoceransCladocerans -1-1 -0.0655-0.0655 35.98 %35.98 % 80.17 %80.17 %
Total PhosphorusTotal Phosphorus -1-1 0.14420.1442 34.97 %34.97 %
InterceptIntercept
April-May
-0.4
0
0.4
0.8
1.2
1.6
1975 1976 1977 1978 1979 1980 1981 1982 1983 1984 1985 1986 1987 1988 1989 1990 1991 1992 1993 1994 1995 1996 1997 1998Ch
loro
ph
yll c
on
cen
trat
ion
(u
g/l)
Observed Values Predicted Values

Bayesian AnalysisBayesian Analysis

ConclusionsConclusions
• Phosphorus limiting element for primary productionPhosphorus limiting element for primary production
• Temporal fluctuations 40 % of the total variability Temporal fluctuations 40 % of the total variability
Spatial heterogeneity 10 % of the total variabilitySpatial heterogeneity 10 % of the total variability
Interactions of space with time 10 % of the total Interactions of space with time 10 % of the total variabilityvariability
• Basic regulatory factors of spring bloom dynamics:Basic regulatory factors of spring bloom dynamics: 11stst phase Solar radiation phase Solar radiation 22ndnd phase Epilimnion phosphorus stock phase Epilimnion phosphorus stock Zooplankton grazing pressure (Daphnia Zooplankton grazing pressure (Daphnia
populations) populations)

AcknowledgementsAcknowledgements
• METRO King County (database 1995-2001)METRO King County (database 1995-2001)
• A.W Mellon Foundation and Dr. Daniel E. A.W Mellon Foundation and Dr. Daniel E. Schindler, Department of Zoology, University of Schindler, Department of Zoology, University of Washington (database 1975-1999)Washington (database 1975-1999)