environmental assessment of a marine geophysical survey · pdf fileliterature cited ... airgun...
TRANSCRIPT

Environmental Assessment of a
Marine Geophysical Survey by the R/V Marcus G. Langseth
on the Shatsky Rise in the Northwest Pacific Ocean,
March–April 2012
Prepared for
Lamont-Doherty Earth Observatory
61 Route 9W, P.O. Box 1000
Palisades, NY 10964-8000
and
National Science Foundation
Division of Ocean Sciences
4201 Wilson Blvd., Suite 725
Arlington, VA 22230
by
LGL Ltd., environmental research associates
22 Fisher St., POB 280
King City, Ont. L7B 1A6
18 June 2010
Updated 28 October 2011
LGL Report TA4873-3

Environmental Assessment for L-DEO’s Shatsky Rise Seismic Survey, 2012 Page ii
Table of Contents
Environmental Assessment for L-DEO’s Shatsky Rise Seismic Survey, 2012 Page iii
TABLE OF CONTENTS Page
ABSTRACT .................................................................................................................................................... vi
LIST OF ACRONYMS ................................................................................................................................... viii
I. PURPOSE AND NEED .................................................................................................................................. 1
II. ALTERNATIVES INCLUDING PROPOSED ACTION ..................................................................................... 2
Proposed Action ................................................................................................................................. 2
(1) Project Objectives and Context .......................................................................................... 2
(2) Proposed Activities ............................................................................................................. 2
(3) Monitoring and Mitigation Measures ................................................................................. 5
Alternative Action: Another Time .................................................................................................... 13
No Action Alternative ...................................................................................................................... 13
III. AFFECTED ENVIRONMENT .................................................................................................................... 14
Oceanography ................................................................................................................................... 14
Marine Mammals .............................................................................................................................. 15
(1) Mysticetes ......................................................................................................................... 15
(2) Odontocetes ...................................................................................................................... 22
(3) Pinnipeds .......................................................................................................................... 32
Seabirds ............................................................................................................................................ 33
(1) Short-tailed Albatross ....................................................................................................... 33
Sea Turtles ........................................................................................................................................ 34
(1) Loggerhead Turtle ............................................................................................................ 34
(2) Leatherback Turtle ........................................................................................................... 35
(3) Olive Ridley Turtle ........................................................................................................... 36
(4) Green Turtle ..................................................................................................................... 37
(5) Hawksbill Turtle ............................................................................................................... 38
(6) Summary .......................................................................................................................... 39
IV. ENVIRONMENTAL CONSEQUENCES...................................................................................................... 40
Proposed Action ............................................................................................................................... 40
(1) Direct Effects and Their Significance on Marine Mammals and Sea Turtles .................. 40
(2) Mitigation Measures for Marine Mammals and Sea Turtles ............................................ 55
(3) Numbers of Marine Mammals that Could be ―Taken by Harassment‖ ............................ 55
(4) Conclusions for Marine Mammals and Sea Turtles ......................................................... 61
(5) Direct Effects on Fish, Fisheries, and Their Significance ................................................ 62
(6) Direct Effects on Invertebrates and Their Significance .................................................... 64
(7) Direct Effects on Seabirds and Their Significance ........................................................... 66
(8) Indirect Effects on Marine Mammals, Sea Turtles, and Seabirds, and Their
Significance ................................................................................................................. 67
(9) Cumulative Effects ........................................................................................................... 67
(10) Unavoidable Impacts ...................................................................................................... 72
(11) Coordination with Other Agencies and Processes .......................................................... 73
Table of Contents
Environmental Assessment for L-DEO’s Shatsky Rise Seismic Survey, 2012 Page iv
Alternative Action: Another Time .................................................................................................... 73
No Action Alternative ...................................................................................................................... 73
V. LIST OF PREPARERS ............................................................................................................................... 74
VI. LITERATURE CITED .............................................................................................................................. 75
Marine Mammals and Acoustics ...................................................................................................... 75
Sea Turtles, Seabirds, Fish, and Other .............................................................................................. 97
APPENDIX A: ACOUSTIC CALIBRATION AND MODELING OF SEISMIC ACOUSTIC SOURCES ON
THE R/V LANGSETH (2007–2008) ................................................................................................... 107
Introduction .................................................................................................................................... 107
Modeling Langseth Airgun Arrays for Mitigation ......................................................................... 107
Comparing Modeling with Measurements ..................................................................................... 109
Conclusions .................................................................................................................................... 113
Literature Cited ............................................................................................................................... 113
APPENDIX B: REVIEW OF THE EFFECTS OF AIRGUN SOUNDS ON MARINE MAMMALS ......................... 114
1. Categories of Noise Effects ....................................................................................................... 114
2. Hearing Abilities of Marine Mammals ...................................................................................... 114
2.1 Toothed Whales (Odontocetes) ...................................................................................... 115
2.2 Baleen Whales (Mysticetes) ........................................................................................... 115
2.3 Seals and Sea Lions (Pinnipeds) .................................................................................... 116
2.4 Manatees and Dugong (Sirenians) ................................................................................. 116
2.5 Sea Otter and Polar Bear ................................................................................................ 117
3. Characteristics of Airgun Sounds .............................................................................................. 117
4. Masking Effects of Airgun Sounds ........................................................................................... 119
5. Disturbance by Seismic Surveys ............................................................................................... 121
5.1 Baleen Whales ................................................................................................................ 122
5.2 Toothed Whales ............................................................................................................. 128
5.3 Pinnipeds ........................................................................................................................ 134
5.4 Sirenians, Sea Otter and Polar Bear ............................................................................... 136
6. Hearing Impairment and Other Physical Effects of Seismic Surveys ....................................... 136
6.1 Temporary Threshold Shift (TTS) ................................................................................. 137
6.2 Permanent Threshold Shift (PTS) .................................................................................. 142
6.3 Strandings and Mortality ................................................................................................ 144
6.4 Non-Auditory Physiological Effects .............................................................................. 146
7. Literature Cited .......................................................................................................................... 146
APPENDIX C: REVIEW OF THE EFFECTS OF AIRGUN SOUNDS ON SEA TURTLES ............... 163
1. Sea Turtle Hearing ..................................................................................................................... 163
2. Effects of Airgun Pulses on Behavior and Movement .............................................................. 165
3. Possible Effects of Airgun Sounds on Distribution ................................................................... 168
4. Possible Impacts of Airgun Sounds on Hearing ........................................................................ 169

Table of Contents
Environmental Assessment for L-DEO’s Shatsky Rise Seismic Survey, 2012 Page v
5. Other Physical Effects ............................................................................................................... 171
6. Conclusions ............................................................................................................................... 171
7. Literature Cited .......................................................................................................................... 172
APPENDIX D: REVIEW OF THE EFFECTS OF AIRGUN SOUNDS ON FISHES ............................................. 176
1. Acoustic Capabilities ................................................................................................................. 176
2. Potential Effects on Fishes ........................................................................................................ 178
2.1 Marine Fishes ................................................................................................................. 178
2.2 Freshwater Fishes ........................................................................................................... 181
2.3 Anadromous Fishes ........................................................................................................ 182
3. Indirect Effects on Fisheries ...................................................................................................... 182
4. Literature Cited .......................................................................................................................... 183
APPENDIX E: REVIEW OF THE EFFECTS OF AIRGUN SOUNDS ON MARINE INVERTEBRATES ................ 187
Abstract
Environmental Assessment for L-DEO’s Shatsky Rise Seismic Survey, 2012 Page vi
ABSTRACT
Lamont-Doherty Earth Observatory (L-DEO), with research funding from the U.S. National
Science Foundation (NSF), plans to conduct a marine seismic survey on the Shatsky Rise in the
Northwest Pacific Ocean during March–April 2012. The survey will take place in international waters in
water depths ~3000–5000 m. The seismic study will use a towed array of 36 airguns with a total
discharge volume of ~6600 in3.
NSF, as the funding and action agency, has a mission to ―promote the progress of science; to
advance the national health, prosperity, and welfare; to secure the national defense…‖. The proposed
seismic survey is part of a research proposal recommended for funding by an expert review panel. It will
provide data necessary to decipher the crustal structure of the Shatsky Rise. The survey may also obtain
information that will improve estimates of regional earthquake occurrence and distribution.
L-DEO is requesting an Incidental Harassment Authorization (IHA) from the U.S. National Marine
Fisheries Service (NMFS) to authorize the incidental, i.e., not intentional, harassment of small numbers of
marine mammals should this occur during the seismic survey. The information in this Environmental
Assessment (EA) supports the IHA application process, provides information on marine species that are
not addressed by the IHA application, and addresses the requirements of Executive Order 12114,
―Environmental Effects Abroad of Major Federal Actions‖. Alternatives addressed in this EA consist of a
corresponding program at a different time, along with issuance of an associated IHA; and the no action
alternative, with no IHA and no seismic survey.
Numerous species of marine mammals inhabit the Northwest Pacific Ocean. Several of these
species are listed as endangered under the U.S. Endangered Species Act (ESA), including the Western
North Pacific gray, North Pacific right, sperm, humpback, sei, fin, and blue whales. The Western North
Pacific gray whale is listed as critically endangered by the International Union for Conservation of
Nature and Natural Resources (IUCN) 2011 Red List of Threatened species, but is unlikely to occur in the
offshore study area as it prefers coastal waters. With the exception of humpback and sperm whales, the
other ESA-listed whale species are also considered endangered by the IUCN (2011). Northern fur seals
may also be present, and are listed as vulnerable under the ESA and by the IUCN. Other ESA-listed
species that could occur in the study area include the endangered hawksbill turtle, leatherback turtle, and
short-tailed albatross, and the threatened green, loggerhead, and olive ridley turtles.
Potential impacts of the seismic survey on the environment would be primarily a result of the
operation of the airgun array. A multibeam echosounder and a sub-bottom profiler will also be operated.
Impacts would be associated with increased underwater noise, which may result in avoidance behavior by
marine mammals, sea turtles, and fish, and other forms of disturbance. An integral part of the planned
survey is a monitoring and mitigation program designed to minimize potential impacts of the proposed
activities on marine animals present during the proposed research, and to document as much as possible
the nature and extent of any effects. Injurious impacts to marine mammals, sea turtles, and seabirds have
not been proven to occur near airgun arrays, and also are not likely to be caused by the other types of
sound sources to be used. However, given the high levels of sound emitted by a large array of airguns, a
precautionary approach is warranted. The planned monitoring and mitigation measures would reduce the
possibility of injurious effects.
Protection measures designed to mitigate the potential environmental impacts to marine mammals
and turtles will include the following: ramp ups; typically two, but a minimum of one dedicated observer
maintaining a visual watch during all daytime airgun operations; two observers 30 min before and during

Abstract
Environmental Assessment for L-DEO’s Shatsky Rise Seismic Survey, 2012 Page vii
ramp ups during the day and at night; no start ups during poor visibility or at night unless at least one
airgun has been operating; passive acoustic monitoring (PAM) via towed hydro-phones during both day
and night to complement visual monitoring (unless the system and back-up systems are damaged during
operations); and power downs (or if necessary shut downs) when marine mammals or sea turtles are
detected in or about to enter designated exclusion zones. L-DEO and its contractors are committed to
apply these measures in order to minimize effects on marine mammals and sea turtles and other
environmental impacts. The relatively wide shot spacing, in time and space, to be used during some of
the survey, is an inherent mitigation measure relative to more typical seismic surveys with closer
shotpoints.
With the planned monitoring and mitigation measures, unavoidable impacts to each species of
marine mammal and turtle that could be encountered are expected to be limited to short-term, localized
changes in behavior and distribution near the seismic vessel. At most, effects on marine mammals may
be interpreted as falling within the U.S. Marine Mammal Protection Act (MMPA) definition of ―Level B
Harassment‖ for those species managed by NMFS. No long-term or significant effects are expected on
individual marine mammals, sea turtles, seabirds, the populations to which they belong, or their habitats.
List of Acronyms
Environmental Assessment for L-DEO’s Shatsky Rise Seismic Survey, 2012 Page viii
LIST OF ACRONYMS
~ approximately
CITES Convention on International Trade in Endangered Species
CPA Closest Point of Approach
CPUE Catch per Unit Effort
CV Coefficient of Variation
DoN U.S. Department of the Navy
EA Environmental Assessment
EEZ Exclusive Economic Zone
ESA (U.S.) Endangered Species Act
ETP Eastern Tropical Pacific
ft feet
gCm-2
d-1
grams of Carbon per meter squared per day
GIS Geographic Information System
GT Gross Tonnes
h hour
hp horsepower
ICR Japan Institute of Cetacean Research
IHA Incidental Harassment Authorization (under U.S. MMPA)
in inch
IUCN International Union for the Conservation of Nature
IWC International Whaling Commission
kHz kilohertz
kt knot
L-DEO Lamont-Doherty Earth Observatory of Columbia University
Langseth R/V Marcus G. Langseth
LME Large Marine Ecosystem
m meter
MBES Multibeam echosounder
MCS Multichannel seismic
mi mile
min minute
PSO Protected Species Observer
PSAO Protected Species Acoustic Observer
MMPA (U.S.) Marine Mammal Protection Act
ms millisecond
n.mi. nautical mile
n.d. no date
NEPA (U.S.) National Environmental Policy Act
NMFS (U.S.) National Marine Fisheries Service
NOAA (U.S.) National Oceanic and Atmospheric Administration
NRC (U.S.) National Research Council
NSF (U.S.) National Science Foundation
NVD Night Vision Device
PAM Passive Acoustic Monitoring
pk peak
PL Propagation Loss
psi pounds per square inch
PTS Permanent Threshold Shift
RL Received Level

List of Acronyms
Environmental Assessment for L-DEO’s Shatsky Rise Seismic Survey, 2012 Page ix
R/V Research Vessel
rms root-mean-square
rpm rotations per minute
s second
SBP Sub-Bottom Profiler
SEL Sound Exposure Level (a measure of acoustic energy)
SL Source Level
SPL sound pressure level
SWFSC Southwest Fisheries Science Center
SOSUS Sound Surveillance System
t tonnes
TTS Temporary Threshold Shift
UNEP United Nations Environment Program
U.S. United States of America
USFWS U.S. Fish and Wildlife Service
USN U.S. Navy
vs. versus
WHOI Woods Hole Oceanographic Institution

1. Purpose and Need
Environmental Assessment for L-DEO’s Shatsky Rise Seismic Survey, 2012 Page 1
I. PURPOSE AND NEED
Lamont-Doherty Earth Observatory (L-DEO), a part of Columbia University, operates the oceano-
graphic research vessel Marcus G. Langseth under a cooperative agreement with the U.S. National Science
Foundation (NSF). L-DEO plans to conduct a seismic survey in international waters over the Shatsky Rise
in the Northwest Pacific Ocean, from ~24 March to 16 April 2012. The marine seismic survey will take
place in International Waters of the Pacific Ocean.
NSF, as the funding and action agency, has a mission to ―promote the progress of science; to
advance the national health, prosperity, and welfare; to secure the national defense…‖. The proposed
seismic survey is part of a research proposal recommended for funding by an expert review panel. It will
provide data necessary to decipher the crustal structure of the Shatsky Rise. The survey may also obtain
data that can be used to improve estimates of regional earthquake occurrence and distribution.
The purpose of this Environmental Assessment (EA) is to provide the information needed to assess
the potential environmental impacts associated with the use of a 36-airgun array during the proposed
study. The EA was prepared under Executive Order 12114, ―Environmental Effects Abroad of Major
Federal Actions‖. The EA addresses potential impacts of the proposed seismic survey on marine
mammals, as well as other species of concern in and near the study area, including sea turtles, fish, and
invertebrates. The EA will also provide useful information in support of the application for an Incidental
Harassment Authorization (IHA) from the National Marine Fisheries Service (NMFS). The requested
IHA would, if issued, allow the non-intentional ―take by harassment‖ of small numbers of marine
mammals during the proposed seismic survey by L-DEO during March–April 2012.
To be eligible for an IHA under the U.S. Marine Mammal Protection Act (MMPA), the proposed
―taking‖ (with mitigation measures in place) must not cause serious physical injury or death of marine
mammals, must have negligible impacts on the species and stocks, must ―take‖ no more than small
numbers of those species or stocks, and must not have an unmitigable adverse impact on the availability
of the species or stocks for legitimate subsistence uses.
Numerous species of marine mammals inhabit the Northwest Pacific Ocean. Several of these
species are listed as endangered under the U.S. Endangered Species Act (ESA), including the Western
North Pacific gray, North Pacific right, sperm, humpback, sei, fin, and blue whales. The Western North
Pacific gray whale is listed as critically endangered by the International Union for Conservation of
Nature and Natural Resources (IUCN) 2011 Red List of Threatened species, but is unlikely to occur in the
offshore study area as it prefers coastal waters. With the exception of humpback and sperm whales, the
other ESA-listed whale species are also considered endangered by the IUCN (2011). Northern fur seals
may also be present, and are listed as vulnerable under the ESA and by the IUCN. Other ESA-listed
species that could occur in the study area include the endangered hawksbill turtle, leatherback turtle, and
short-tailed albatross, and the threatened green, loggerhead, and olive ridley turtles.
Protection measures designed to mitigate the potential environmental impacts are also described in
this EA as an integral part of the planned activities. With these mitigation measures in place, any impacts
on marine mammals and sea turtles are expected to be limited to short-term, localized changes in behavior
of small numbers of animals. No long-term or significant effects are expected on individual mammals,
turtles, or their populations. The proposed project would also have little impact on fish resources, and the
only effect on fish habitat would be short-term disturbance that could lead to temporary relocation of
pelagic fish species or their food. Impacts of seismic sounds on some pelagic seabirds are possible,
although none are expected to be significant to individual birds or their populations.
II. Alternatives Including Proposed Action
Environmental Assessment for L-DEO’s Shatsky Rise Seismic Survey, 2012 Page 2
II. ALTERNATIVES INCLUDING PROPOSED ACTION
Three alternatives are evaluated: (1) the proposed seismic survey and issuance of an associated
IHA, (2) a corresponding seismic survey at an alternative time, along with issuance of an associated IHA,
and (3) no action alternative.
Proposed Action
The project objectives and context, activities, and mitigation measures for L-DEO‘s planned
seismic survey are described in the following subsections.
(1) Project Objectives and Context
L-DEO plans to complete the seismic survey over the Shatsky Rise, a large igneous plateau in the
Northwest Pacific Ocean, that was started in 2010. (The survey could not be completed in 2010 because
the survey was disrupted twice by medical diversions to Japan.) The proposed survey will provide data
necessary to decipher the crustal structure of the Shatsky Rise. The sheer scale of plateau formation
implies a potential role in environmental crises such as oceanic anoxia and mass extinctions. Likewise,
oceanic plateaus may be important for the growth of continental crust. Hence, the information provided
by this survey will address major questions of Earth history, geodynamics, and tectonics, and could have
a profound impact on our understanding of terrestrial magmatism and mantle convection. The survey
may also obtain data that could be used to improve estimates of regional earthquake occurrence and
distribution.
(2) Proposed Activities
(a) Location of the Activities
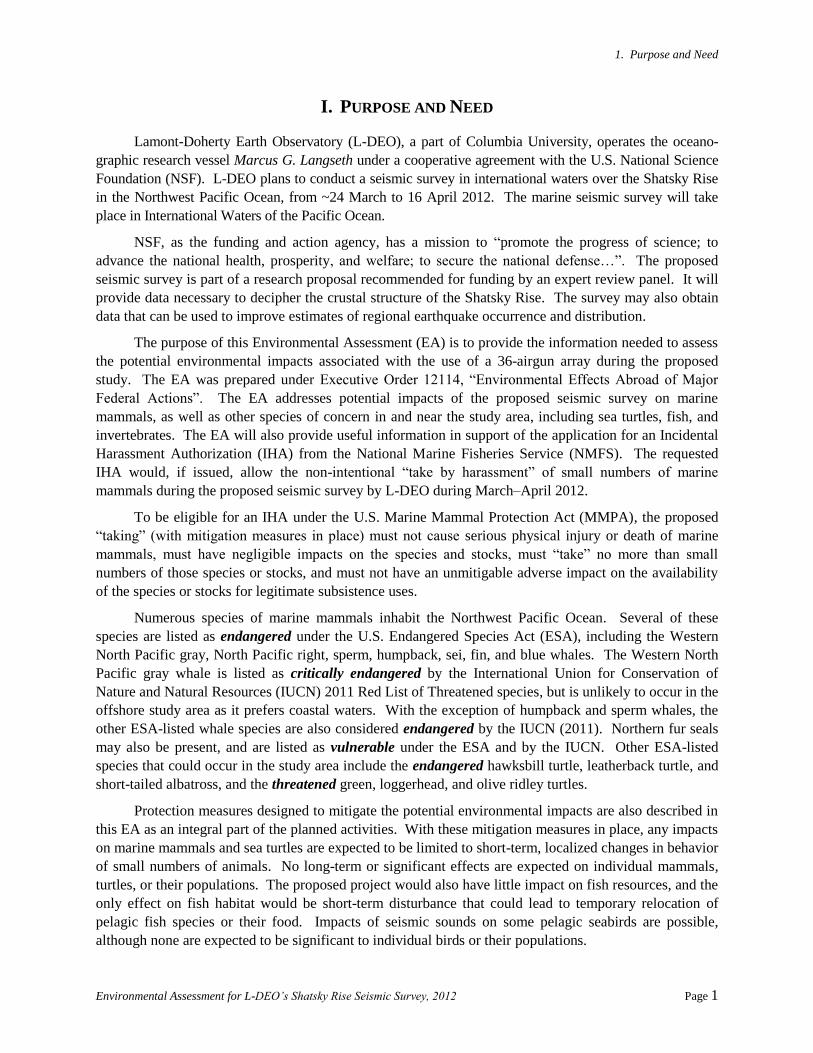
The survey will occur at ~33.5–36°N, 156–161°E in the Shatsky Rise area, at least 1200 km
offshore from Japan (Fig. 1). The seismic survey will take place in International Waters deeper than
1000 m.
(b) Description of the Activities
The procedures to be used for the survey will be similar to those used during previous seismic
surveys by L-DEO and will use conventional seismic methodology. The survey will involve one source
vessel, the R/V Marcus G. Langseth. The Langseth will deploy an array of 36 airguns as an energy
source. The receiving system will consist of a 6-km long hydrophone streamer. As the airgun array is
towed along the survey lines, the hydrophone streamer will receive the returning acoustic signals and
transfer the data to the on-board processing system.
The planned seismic survey will consist of ~1216 km of transect lines in the Shatsky Rise survey
area (Fig. 1). A multichannel seismic (MCS) survey will be conducted with shot intervals of ~20 s.
In addition to the operations of the airgun array, a multibeam echosounder (MBES) and a sub-
bottom profiler (SBP) will also be operated from the Langseth continuously throughout the cruise. All
planned geophysical data acquisition activities will be conducted by L-DEO with on-board assistance by
the scientists who have proposed the study. The Principal Investigators are Drs. Jun Korenaga (Yale
University, New Haven, CT) and William Sager (Texas A&M University, College Station, TX). The
vessel will be self-contained, and the crew will live aboard the vessel for the entire cruise.
II. Alternatives Including Proposed Action
Environmental Assessment for L-DEO’s Shatsky Rise Seismic Survey, 2012 Page 3
FIGURE 1. Study area and proposed seismic transect lines on the Shatsky Rise for the L-DEO survey
planned for 24 March–16 April 2012.
(c) Schedule
The Langseth will depart from Yokohama, Japan, on 24 March 2012 for a 6-day transit to the study
area. After operations have been completed at Shatsky Rise, the vessel will travel to Honolulu, HI, for
arrival on 16 April 2012. Seismic operations in the study area will be carried out for ~7 days, with the
balance of the cruise occupied with transit to and from the study area. Some minor deviation from this
schedule is possible, depending on logistics and weather (i.e., the cruise may depart earlier or be extended
due to poor weather; there could be extra days of seismic operations if collected data are of substandard
quality).
(d) Source Vessel Specifications
The R/V Marcus G. Langseth will be used as the source vessel. The Langseth will tow the 36-
airgun array, as well as the hydrophone streamer, along predetermined lines (Fig. 1). When the Langseth
is towing the airgun array and the hydrophone streamer, the turning rate of the vessel is limited to five
degrees per minute. Thus, the maneuverability of the vessel is limited during operations with the
streamer.
The Langseth has a length of 71.5 m, a beam of 17.0 m, and a maximum draft of 5.9 m. The Lang-
seth was designed as a seismic research vessel, with a propulsion system designed to be as quiet as
II. Alternatives Including Proposed Action
Environmental Assessment for L-DEO’s Shatsky Rise Seismic Survey, 2012 Page 4
possible to avoid interference with the seismic signals. The ship is powered by two Bergen BRG-6 diesel
engines, each producing 3550 hp, which drive the two propellers directly. Each propeller has four blades,
and the shaft typically rotates at 750 revolutions per minute (rpm). The vessel also has an 800 hp bow-
thruster, which is not used during seismic acquisition. The operation speed during seismic acquisition is
typically 7.4–9.3 km/h. When not towing seismic survey gear, the Langseth typically cruises at 18.5
km/h and has a range of 25,000 km (the distance the vessel can travel without refueling).
The Langseth will also serve as the platform from which vessel-based protected species observers
(PSOs) will watch for animals before and during airgun operations, as described in § II(3), below.
Other details of the Langseth include the following:
Owner: National Science Foundation
Operator: Lamont-Doherty Earth Observatory of Columbia University
Flag: United States of America
Date Built: 1991 (Refitted in 2006)
Gross Tonnage: 3834
Accommodation Capacity: 55 including ~35 scientists
(e) Airgun Description
During the survey, the airgun array to be used will consist of 36 airguns, with a total volume of
~6600 in3. The airgun array will consist of a mixture of Bolt 1500LL and Bolt 1900LLX airguns. The
airguns will be configured as four identical linear arrays or ―strings‖ (Fig. 2). Each string will have ten
airguns; the first and last airguns in the strings are spaced 16 m apart. Nine airguns in each string will be
fired simultaneously, whereas the tenth is kept in reserve as a spare, to be turned on in case of failure of
another airgun. The four airgun strings will be distributed across an area of ~24×16 m behind the Lang-
seth and will be towed ~100 m behind the vessel. The shot interval will be relatively short (20 s) for
MCS surveying with the hydrophone streamer. The firing pressure of the array is 1900 psi. During
firing, a brief (~0.1 s) pulse of sound is emitted. The airguns will be silent during the intervening periods.
The tow depth of the array will be 9 m. Because the actual source is a distributed sound source (36
airguns) rather than a single point source, the highest sound levels measurable at any location in the water
will be less than the nominal source level. In addition, the effective source level for sound propagating in
near-horizontal directions will be substantially lower than the nominal source level applicable to
downward propagation because of the directional nature of the sound from the airgun array.
36-Airgun Array Specifications
Energy Source Thirty-six 1900 psi Bolt airguns of 40–360 in3,
in four strings each containing nine operating airguns
Source output (downward) 0-pk is 84 bar-m (259 dB re 1 μPa · m);
pk-pk is 177 bar · m (265 dB)
Air discharge volume ~6600 in3
Dominant frequency components 2–188 Hz

II. Alternatives Including Proposed Action
Environmental Assessment for L-DEO’s Shatsky Rise Seismic Survey, 2012 Page 5
FIGURE 2. One linear airgun array or string with ten airguns, nine of which would be operating.
(f) Multibeam Echosounder and Sub-bottom Profiler
Along with the airgun operations, two additional acoustical data acquisition systems will be operat-
ed during the survey. The ocean floor will be mapped with the Kongsberg EM 122 MBES and a Knudsen
Chirp 3260 SBP. These sound sources will be operated from the Langseth continuously throughout the
cruise.
The Kongsberg EM 122 MBES operates at 10.5–13 (usually 12) kHz and is hull-mounted on the
Langseth. The transmitting beamwidth is 1 or 2° fore–aft and 150° athwartship. The maximum source
level is 242 dB re 1 μPa · mrms. Each ―ping‖ consists of eight (in water >1000 m deep) or four (<1000 m)
successive fan-shaped transmissions, each ensonifying a sector that extends 1° fore–aft. Continuous-
wave (CW) pulses increase from 2 to 15 ms long in water depths up to 2600 m, and FM chirp pulses up to
100 ms long are used in water >2600 m. The successive transmissions span an overall cross-track angular
extent of about 150°, with 2-ms gaps between the pulses for successive sectors.
The Knudsen Chirp 3260 SBP is normally operated to provide information about the sedimentary
features and the bottom topography that is being mapped simultaneously by the MBES. The SBP is
capable of reaching depths of 10,000 m. The beam is transmitted as a 27º cone, which is directed
downward by a 3.5-kHz transducer in the hull of the Langseth. The nominal power output is 10 kW, but
the actual maximum radiated power is 3 kW or 222 dB re 1 μPa · m. The ping duration is up to 64 ms,
and the ping interval is 1 s. A common mode of operation is to broadcast five pings at 1-s intervals
followed by a 5-s pause.
Langseth Sub-bottom Profiler Specifications
Maximum source output (downward) 222 dB re 1 μPa · m
Dominant frequency components 3.5 kHz; up to 210 kHz
Nominal beam width ~27 degrees
Ping duration up to 64 ms
(3) Monitoring and Mitigation Measures
Numerous species of marine mammals are known to occur in the proposed study area. However,
the number of individual animals expected to be approached closely during the proposed activities will be
relatively small in relation to regional population sizes. With the proposed monitoring and mitigation

II. Alternatives Including Proposed Action
Environmental Assessment for L-DEO’s Shatsky Rise Seismic Survey, 2012 Page 6
provisions, potential effects on most if not all individuals are expected to be limited to minor behavioral
disturbance. Those potential effects are expected to have negligible impacts both on individual marine
mammals and on the associated species and stocks.
To minimize the likelihood that impacts will occur to the species and stocks, airgun operations will
be conducted in accordance with all applicable U.S. federal regulations and IHA requirements.
The following subsections provide more detailed information about the monitoring and mitigation
measures that are an integral part of the planned activities. The procedures described here are based on
protocols used during previous L-DEO seismic research cruises as approved by NMFS, and on best prac-
tices recommended in Richardson et al (1995), Pierson et al. (1998), and Weir and Dolman (2007).
(a) Planning Phase
This survey was originally proposed and initiated in 2010. NEPA documentation pursuant to EO
12114 was prepared for the proposed survey, an ESA Section 7 consultation was completed, and an
Incidental Harrassment Authorization was obtained. During the survey, the scientific work was disrupted
twice by medical diversions to Japan, each of which took about a week because of the remoteness of the
study area, and as a result, the study remained unfinished.
Subsequently, the PIs worked with L-DEO and NSF to identify potential time periods to complete
the survey, taking into consideration key factors such as environmental conditions (i.e., the seasonal
presence of marine mammals, sea turtles, and seabirds), weather conditions, equipment, and optimal
timing for other proposed seismic surveys using the R/V Langseth. As was determined necessary for the
2010 survey, the PIs confirmed that use of the 36-airgun array with a total volume of ~6600 in3 would
still be required to achieve the project research goals; given the research goals, location of the survey and
associated deep water, this energy source level was still viewed appropriate.
Most marine mammal species are expected to occur in the area year-round, therefore altering the
timing of the proposed project from the original survey timeframe likely would result in no changes in the
potentical impacts to marine species noted in the original 2010 survey environmental analysis. The
environmental analysis prepared for the 2010 survey formed the basis for this assessment, but has been
updated to reflect current scientific information and the revisions to the proposed survey and timing. The
environmental analysis prepared for this proposed 2012 survey will also be open for a public comment
period, an IHA application will be submitted to NMFS, and ESA Section 7 consultation will be requested.
(b) Visual Monitoring
PSO observations will take place during daytime airgun operations and nighttime ramp ups of the
airguns. Airgun operations will be suspended when marine mammals or turtles are observed within, or
about to enter, designated exclusion zones [see subsection (e) below] where there is concern about
potential effects on hearing or other physical effects. PSOs will also watch for marine mammals and
turtles near the seismic vessel for at least 30 min prior to the planned start of airgun operations. Observa-
tions will also be made during daytime periods when the Langseth is underway without seismic
operations, such as during transits.
During seismic operations, at least four PSOs will be based aboard the Langseth. PSOs will be
appointed by L-DEO with NMFS concurrence. During the majority of seismic operations, two PSOs will
monitor for marine mammals and sea turtles around the seismic vessel. Use of two simultaneous obser-
vers will increase the effectiveness of detecting animals around the source vessel. However, during meal
times, only one PSO may be on duty. PSO(s) will be on duty in shifts of duration no longer than 4 h.
II. Alternatives Including Proposed Action
Environmental Assessment for L-DEO’s Shatsky Rise Seismic Survey, 2012 Page 7
Other crew will also be instructed to assist in detecting marine mammals and turtles and implementing
mitigation requirements. Before the start of the seismic survey the crew will be given additional
instruction regarding how to do so.
The Langseth is a suitable platform for marine mammal and turtle observations. When stationed
on the observation platform, the eye level will be ~21.5 m above sea level, and the observer will have a
good view around the entire vessel. During daytime, the PSO(s) will scan the area around the vessel
systematically with reticle binoculars (e.g., 7×50 Fujinon), Big-eye binoculars (25×150), and with the
naked eye. During darkness, night vision devices (NVDs) will be available (ITT F500 Series Generation
3 binocular-image intensifier or equivalent), when required. Laser rangefinding binoculars (Leica LRF
1200 laser rangefinder or equivalent) will be available to assist with distance estimation. Those are useful
in training observers to estimate distances visually, but are generally not useful in measuring distances to
animals directly; that is done primarily with the reticles in the binoculars.
When mammals or turtles are detected within or about to enter the designated exclusion zone, the
airguns will immediately be powered down or shut down if necessary. The PSO(s) will continue to
maintain watch to determine when the animal(s) are outside the exclusion zone. Airgun operations will
not resume until the animal has left the exclusion zone.
The vessel-based monitoring will provide data to estimate the numbers of marine mammals
exposed to various received sound levels, to document any apparent disturbance reactions or lack thereof,
and thus to estimate the numbers of mammals potentially ―taken‖ by harassment. It will also provide the
information needed in order to power down or shut down the airguns at times when mammals or turtles
are present in or near the exclusion zone. When a sighting is made, the following information about the
sighting will be recorded:
1. Species, group size, age/size/sex categories (if determinable), behavior when first sighted and
after initial sighting, heading (if consistent), bearing and distance from seismic vessel, sighting
cue, apparent reaction to the airguns or vessel (e.g., none, avoidance, approach, paralleling,
etc.), and behavioral pace.
2. Time, location, heading, speed, activity of the vessel, sea state, visibility, and sun glare.
The data listed under (2) will also be recorded at the start and end of each observation watch, and during a
watch whenever there is a change in one or more of the variables.
All observations and power downs or shut downs will be recorded in a standardized format. Data
will be entered into an electronic database. The accuracy of the data entry will be verified by computer-
ized data validity checks as the data are entered and by subsequent manual checking of the database.
These procedures will allow initial summaries of data to be prepared during and shortly after the field
program, and will facilitate transfer of the data to statistical, graphical, and other programs for further
processing and archiving.
Results from the vessel-based observations will provide
1. The basis for real-time mitigation (airgun power down or shut down).
2. Information needed to estimate the number of marine mammals potentially taken by harass-
ment, which must be reported to NMFS.
3. Data on the occurrence, distribution, and activities of marine mammals and turtles in the area
where the seismic study is conducted.
II. Alternatives Including Proposed Action
Environmental Assessment for L-DEO’s Shatsky Rise Seismic Survey, 2012 Page 8
4. Information to compare the distance and distribution of marine mammals and turtles relative to
the source vessel at times with and without seismic activity.
5. Data on the behavior and movement patterns of marine mammals and turtles seen at times with
and without seismic activity.
(c) Passive Acoustic Monitoring
Passive acoustic monitoring (PAM) will take place to complement the visual monitoring program.
Visual monitoring typically is not effective during periods of poor visibility or at night, and even with
good visibility, is unable to detect marine mammals when they are below the surface or beyond visual
range. Acoustical monitoring can be used in addition to visual observations to improve detection,
identification, and localization of cetaceans. The acoustic monitoring will serve to alert visual observers
(if on duty) when vocalizing cetaceans are detected. It is only useful when marine mammals call, but it
can be effective either by day or by night, and does not depend on good visibility. It will be monitored in
real time so that the visual observers can be advised when cetaceans are detected.
The PAM system consists of hardware (i.e., hydrophones) and software. The ―wet end‖ of the system
consists of a towed hydrophone array that is connected to the vessel by a tow cable. The tow cable is 250 m
long, and the hydrophones are fitted in the last 10 m of cable. A depth gauge is attached to the free end of
the cable, and the cable is typically towed at depths <20 m. The array will be deployed from a winch
located on the back deck. A deck cable will connect the tow cable to the electronics unit in the main
computer lab where the acoustic station, signal conditioning, and processing system will be located. The
acoustic signals received by the hydrophones are amplified, digitized, and then processed by the Pamguard
software. The system can detect marine mammal vocalizations at frequencies up to 250 kHz.
One acoustic PSO or PSAO (in addition to the 4 visual PSOs) will be on board. The towed
hydrophones will ideally be monitored 24 h per day while at the seismic survey area during airgun
operations, and during most periods when the Langseth is underway while the airguns are not operating.
However, PAM may not be possible if damage occurs to the array or back-up systems during operations.
One PSO will monitor the acoustic detection system at any one time, by listening to the signals from two
channels via headphones and/or speakers and watching the real-time spectrographic display for frequency
ranges produced by cetaceans. The PSAO monitoring the acoustical data will be on shift for 1–6 h at a
time. All observers are expected to rotate through the PAM position, although the most experienced with
acoustics will be on PAM duty more frequently.
When a vocalization is detected while visual observations are in progress, the PSAO will contact
the visual PSO immediately, to alert him/her to the presence of cetaceans (if they have not already been
seen), and to allow a power down or shut down to be initiated, if required. The information regarding the
call will be entered into a database. The data to be entered include an acoustic encounter identification
number, whether it was linked with a visual sighting, date, time when first and last heard and whenever
any additional information was recorded, position and water depth when first detected, bearing if
determinable, species or species group (e.g., unidentified dolphin, sperm whale), types and nature of
sounds heard (e.g., clicks, continuous, sporadic, whistles, creaks, burst pulses, strength of signal, etc.),
and any other notable information. The acoustic detection can also be recorded for further analysis.
(d) Reporting
A report will be submitted to NMFS and NSF within 90 days after the end of the cruise. The report
will describe the operations that were conducted and sightings of marine mammals and turtles near the
operations. The report will provide full documentation of methods, results, and interpretation pertaining

II. Alternatives Including Proposed Action
Environmental Assessment for L-DEO’s Shatsky Rise Seismic Survey, 2012 Page 9
to all monitoring. The 90-day report will summarize the dates and locations of seismic operations, and all
marine mammal and turtle sightings (dates, times, locations, activities, associated seismic survey
activities). The report will also include estimates of the number and nature of exposures that could result
in ―takes‖ of marine mammals by harassment or in other ways.
(e) Proposed Exclusion Zones
Received sound levels have been predicted by L-DEO‘s model, in relation to distance and direction
from the airguns, for the 36-airgun array and for a single 1900LL 40-in3 airgun, which will be used during
power downs. Results have been reported for propagation measurements of pulses from the 36-airgun
array in two water depths (~1600 m and 50 m) in the Gulf of Mexico in 2007–2008 (Tolstoy et al. 2009).
Results of the propagation measurements showed that radii around the airguns for various received levels
varied with water depth (Tolstoy et al. 2009). In addition, propagation varies with array tow depth. The
empirical values that resulted from Tolstoy et al. (2009) are used here to determine exclusion zones for
the 36-airgun array. However, the depth of the array was different in the Gulf of Mexico calibration study
(6 m) than in the proposed survey (9 m); thus, correction factors have been applied to the distances
reported by Tolstoy et al. (2009). The correction factors used were the ratios of the 160-, 180-, and 190-
dB distances from the modeled results for the 6600-in3 airgun array towed at 6 m vs. 9 m, from LGL
(2008): 1.285; 1.338; and 1.364, respectively.
Measurements were not reported for a single airgun, so model results will be used. The L-DEO model
does not allow for bottom interactions, and thus is most directly applicable to deep water. A detailed
description of the modeling effort is provided in Appendix A. The tow depth has minimal effect on the
maximum near-field output and the shape of the frequency spectrum for the single airgun; thus, the predicted
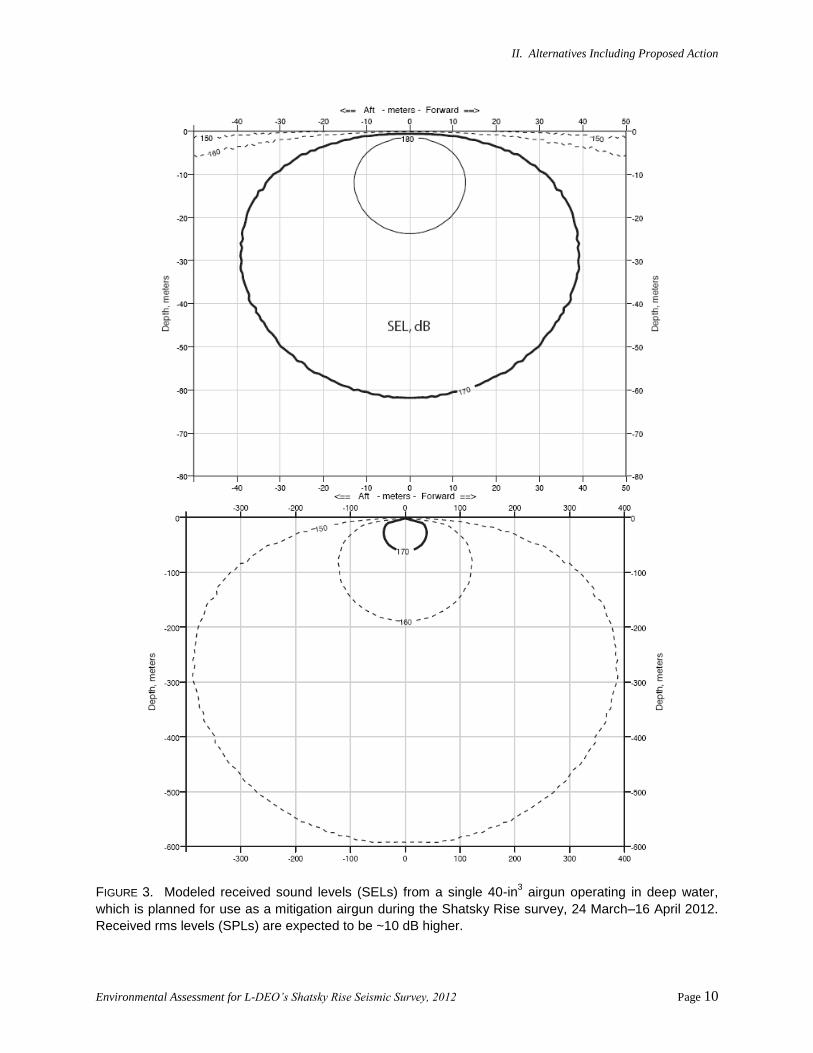
exclusion zones are essentially the same at different tow depths. Figure 3 illustrates modeled received sound
levels for a single airgun operating in deep water. The predicted sound contours for the 40-in3 mitigation
airgun are shown as sound exposure levels (SEL) in decibels (dB) re 1 μPa2 · s. SEL is a measure of the
received energy in the pulse and represents the sound pressure level (SPL) that would be measured if the
pulse energy were spread evenly across a 1-s period. Because actual seismic pulses are less than 1 s in
duration in most situations, this means that the SEL value for a given pulse is usually lower than the SPL
calculated for the actual duration of the pulse (see Appendix B). The advantage of working with SEL is
that the SEL measure accounts for the total received energy in the pulse, and biological effects of pulsed
sounds are believed to depend mainly on pulse energy (Southall et al. 2007). In contrast, SPL for a given
pulse depends greatly on pulse duration. A pulse with a given SEL can be long or short depending on the
extent to which propagation effects have ―stretched‖ the pulse duration. The SPL will be low if the
duration is long and higher if the duration is short, even though the pulse energy (and presumably the
biological effects) are the same.
Although SEL is now believed to be a better measure than SPL when dealing with biological effects
of pulsed sound, SPL is the measure that has been most commonly used in studies of marine mammal
reactions to airgun sounds and in NMFS guidelines concerning levels above which ―taking‖ might occur.
SPL is often referred to as rms or ―root mean square‖ pressure, averaged over the pulse duration. As noted
above, the rms received levels that are used as impact criteria for marine mammals are not directly
comparable to pulse energy (SEL). At the distances where rms levels are 160–190 dB re 1 μPa, the
difference between the SEL and SPL values for the same pulse measured at the same location usually
average ~10–15 dB, depending on the propagation characteristics of the location (Greene 1997; McCauley
et al. 1998, 2000a; Appendix B). In this EA, we assume that rms pressure levels of received seismic pulses
will be 10 dB higher than the SEL values predicted by L-DEO‘s model. Thus, we assume that 170 dB SEL
II. Alternatives Including Proposed Action
Environmental Assessment for L-DEO’s Shatsky Rise Seismic Survey, 2012 Page 10
FIGURE 3. Modeled received sound levels (SELs) from a single 40-in3 airgun operating in deep water,
which is planned for use as a mitigation airgun during the Shatsky Rise survey, 24 March–16 April 2012.
Received rms levels (SPLs) are expected to be ~10 dB higher.
II. Alternatives Including Proposed Action
Environmental Assessment for L-DEO’s Shatsky Rise Seismic Survey, 2012 Page 11
180 dB re 1 μParms. It should be noted that neither the SEL nor the SPL (=rms) measure is directly
comparable to the peak or peak-to-peak pressure levels normally used by geophysicists to characterize
source levels of airguns. Peak and peak-to-peak pressure levels for airgun pulses are always higher than the
rms dB referred to in much of the biological literature (Greene 1997; McCauley et al. 1998, 2000a). For
example, a measured received level of 160 dB re 1 μParms in the far field typically would correspond to a
peak measurement of ~170–172 dB re 1 Pa, and to a peak-to-peak measurement of ~176–178 dB re 1 μPa,
as measured for the same pulse received at the same location (Greene 1997; McCauley et al. 1998, 2000a).
(The SEL value for the same pulse would normally be 145–150 dB re 1 Pa2 · s). The precise difference
between rms and peak or peak-to-peak values for a given pulse depends on the frequency content and
duration of the pulse, among other factors. However, the rms level is always lower than the peak or peak-
to-peak level and (for an airgun-type source at the ranges relevant here) higher than the SEL value.
Using the corrected measurements (array) or model (single airgun), Table 1 shows the distances at
which three rms sound levels are expected to be received from the 36-airgun array and a single airgun.
The 180- and 190-dB re 1 μParms distances are the safety criteria as specified by NMFS (2000) and are
applicable to cetaceans and pinnipeds, respectively. The 180-dB distance will also be used as the
exclusion zone for sea turtles, as required by NMFS in most other recent seismic projects (e.g., Smultea et
al. 2004; Holst et al. 2005b; Holst and Beland 2008; Holst and Smultea 2008; Hauser et al. 2008; Holst
2009; Antochiw et al. n.d.). If marine mammals or turtles are detected within or about to enter the
appropriate exclusion zone, the airguns will be powered down (or shut down if necessary) immediately.
Southall et al. (2007) made detailed recommendations for new science-based noise exposure
criteria. L-DEO will be prepared to revise its procedures for estimating numbers of mammals ―taken‖,
exclusion zones, etc., as may be required by any new guidelines established by NMFS as a result of these
recommendations. However, currently the procedures are based on best practices noted by Pierson et al.
(1998) and Weir and Dolman (2007) as NMFS has not yet specified a new procedure for determining
exclusion zones.
(f) Mitigation During Operations
Mitigation measures that will be adopted during the survey include (1) power-down procedures, (2)
shut-down procedures, and (3) ramp-up procedures.
Power-down Procedures.―A power down involves decreasing the number of airguns in use such
that the radius of the 180-dB (or 190-dB) zone is decreased to the extent that marine mammals or turtles
are no longer in or about to enter the exclusion zone. A power down of the airgun array can also occur
when the vessel is moving from one seismic line to another. During a power down for mitigation, one
airgun will be operated. The continued operation of one airgun is intended to alert marine mammals and
turtles to the presence of the seismic vessel in the area. In contrast, a shut down occurs when all airgun
activity is suspended.
If a marine mammal (other than right whales—see Shut-down Procedures below) or turtle is
detected outside the exclusion zone but is likely to enter the exclusion zone, the airguns will be powered
down before the animal is within the exclusion zone. Likewise, if a mammal or turtle is already within
the safety zone when first detected, the airguns will be powered down immediately. During a power
down of the airgun array, the 40-in3 airgun will be operated. If a marine mammal or turtle is detected
within or near the smaller exclusion zone around that single airgun (Table 1), it will be shut down (see
next subsection).

II. Alternatives Including Proposed Action
Environmental Assessment for L-DEO’s Shatsky Rise Seismic Survey, 2012 Page 12
TABLE 1. Measured (array) or predicted (single airgun) distances to which sound levels 190, 180, and
160 dB re 1 μParms could be received in deep (>1000 m) water during the proposed Shatsky Rise survey,
24 March–16 April 2012. Measured radii for the array are based on Tolstoy at al. (2009), and predicted radii for a single airgun are based on Figure 3, assuming that received levels on an RMS basis are, numerically, 10 dB higher than the SEL values shown in Figure 3.
Source and Volume
Predicted RMS Distances (m) in
deep (>1000 m) water
190 dB 180 dB 160 dB
Single Bolt airgun, 40 in3 12 40 385
4 strings, 36 airguns, 6600 in3, tow depth 9 m 400 940 3850
Following a power down, airgun activity will not resume until the marine mammal or turtle has
cleared the safety zone. The animal will be considered to have cleared the safety zone if
it is visually observed to have left the exclusion zone, or
it has not been seen within the zone for 15 min in the case of small odontocetes (or pinnipeds), or
it has not been seen within the zone for 30 min in the case of mysticetes and large odontocetes,
including sperm, pygmy sperm, dwarf sperm, and beaked whales, or
the vessel has moved outside the exclusion zone for turtles, e.g., if a turtle is sighted close to the
vessel and the ship speed is 7.4 km/h, it would take the vessel ~8 min to leave the turtle behind].
During airgun operations following a shut down whose duration has exceeded the time limits
specified above, the airgun array will be ramped up gradually. Ramp-up procedures are described below.
During past R/V Langseth marine geophysical surveys, following an extended power-down period, the
seismic source followed ramp-up procedures to return to the full seismic source level. Under a power-
down scenario, however, a single mitigation airgun still would be operating to alert and warn animals of
the on-going activity. Furthermore, under these circumstances, ramp-up procedures may unnecessarily
extend the length of the survey time needed to collect seismic data. LDEO, NSF, and NMFS have
discussed this mitigation practice and have concluded that a ramp-up procedure following an extended
power down is not necessary. This assessment therefore does not include this practice as part of the
monitoring and mitigation plan.
Shut-down Procedures.―The operating airgun(s) will be shut down if a marine mammal or turtle
is seen within or approaching the exclusion zone for the single airgun. Shut downs will be implemented
(1) if an animal enters the exclusion zone of the single airgun after a power down has been initiated, or (2)
if an animal is initially seen within the exclusion zone of the single airgun when more than one airgun
(typically the full array) is operating. Airgun activity will not resume until the marine mammal or sea
turtle has cleared the safety zone, or until the PSO is confident that the animal has left the vicinity of the
vessel. Criteria for judging that the animal has cleared the safety zone will be as described in the
preceding subsection.
Considering the conservation status for the North Pacific right whale, the airgun(s) will be shut
down immediately in the unlikely event that this species is observed, regardless of the distance from the
Langseth. Ramp up will only begin if the whale has not been seen for 30 min.
Ramp-up Procedures.―A ramp-up procedure will be followed when the airgun array begins
operating after a specified period without airgun operations or when a shut down has exceeded that
period. It is proposed that, for the present cruise, this period would be ~8 min. This period is based on
the 180-dB radius (940 m) for the 36-airgun array towed at 9 m in relation to the minimum planned speed

II. Alternatives Including Proposed Action
Environmental Assessment for L-DEO’s Shatsky Rise Seismic Survey, 2012 Page 13
of the Langseth while shooting (7.4 km/h). Similar periods (~8–10 min) were used during previous
L-DEO surveys. Ramp up will not occur if a marine mammal or sea turtle has not cleared the safety zone
as described earlier.
Ramp up will begin with the smallest airgun in the array (40 in3). Airguns will be added in a
sequence such that the source level of the array will increase in steps not exceeding 6 dB per 5-min period
over a total duration of ~35 min. During ramp up, the PSOs will monitor the exclusion zone, and if
marine mammals or turtles are sighted, a power down or shut down will be implemented as though the
full array were operational.
If the complete exclusion zone has not been visible for at least 30 min prior to the start of
operations in either daylight or nighttime, ramp up will not commence unless at least one airgun (40 in3 or
similar) has been operating during the interruption of seismic survey operations. Given these provisions,
it is likely that the airgun array will not be ramped up from a complete shut down at night or in thick fog,
because the outer part of the safety zone for that array will not be visible during those conditions. If one
airgun has operated during a power-down period, ramp up to full power will be permissible at night or in
poor visibility, on the assumption that marine mammals and turtles will be alerted to the approaching seis-
mic vessel by the sounds from the single airgun and could move away. Ramp up of the airguns will not
be initiated if a sea turtle or marine mammal is sighted within or near the applicable exclusion zones
during the day or night.
As noted above under ―Power-down Procedures‖, during past R/V Langseth marine geophysical
surveys, following an extended power-down period, the seismic source followed ramp-up procedures to
return to the full seismic source level. Under a power-down scenario, however, a single mitigation airgun
still would be operating to alert and warn animals of the on-going activity. Furthermore, under these
circumstances, ramp-up procedures may unnecessarily extend the length of the survey time needed to
collect seismic data. LDEO, NSF, and NMFS have discussed this mitigation practice and have concluded
that a ramp-up procedure following an extended power down is not necessary. This assessment therefore
does not include this practice as part of the monitoring and mitigation plan.
Alternative Action: Another Time
An alternative to issuing the IHA for the period requested and to conducting the project then is to
issue the IHA for another time and to conduct the project at that alternative time. The proposed time for
the cruise is the most suitable time logistically for the Langseth (and the participating scientists) and takes
into consideration the timing of the typhoon season between late August and December. If the IHA is
issued for another period, it could result in significant delay and disruption not only of the proposed
cruise, but of subsequent geophysical studies that are planned by L-DEO for 2012 and beyond. An
evaluation of the effects of this alternative action is given in § IV.
No Action Alternative
An alternative to conducting the proposed activities is the ‖No Action‖ alternative, i.e., do not issue
an IHA and do not conduct the research operations. If the research is not conducted, the ―No Action‖
alternative would result in no disturbance to marine mammals due to the proposed activities.
The seismic data from the proposed survey are necessary to complete the data collection already
initiated in 2010 and decipher the crustal structure of the Shatsky Rise. The sheer scale of plateau
formation implies a potential role in environmental crises such as oceanic anoxia and mass extinctions.
Data obtained from the survey will also improve our understanding of tectonics and earthquake

II. Alternatives Including Proposed Action
Environmental Assessment for L-DEO’s Shatsky Rise Seismic Survey, 2012 Page 14
occurrence and distribution. Under the ―No Action‖ alternative, this valuable scientific information
would not become available.
In addition to forcing cancellation of the planned seismic survey, the ―No Action‖ alternative could
also, in some circumstances, result in significant delay of other geophysical studies that are planned by
L-DEO for 2012 and beyond, depending on the timing of the decision. The entire proposal, based on the
premise of collecting these data, would be compromised. Cancellation (no action) for this cruise would
decrease available data and support for the academic institutions involved. Data collection is an essential
first step for a much greater effort to analyze and report information concerning the scientifically
significant topics indicated. The field effort will provide material for years of analyses involving multiple
professors, students, and technicians. The lost opportunity to collect valuable scientific information
would be compounded by lost opportunities for support of research infrastructure, training, and profes-
sional career growth.
III. AFFECTED ENVIRONMENT
Oceanography
Shatsky Rise is an enormous underwater feature comprising three seamounts and spanning
~750,000 km2 of the sea floor; it is the second largest plateau in the Pacific Ocean (Sliter and Brown
1993). Water depth varies from ~2000 m above the largest bathymetric feature to more than 6000 m in
the adjacent Northwest Pacific Basin. The largest and southernmost of the three seamounts is located at
~32ºN, 157ºE and at the approximate intersection of three oceanographic provinces: the Kuroshio Current
Province to the northwest, the North Pacific Polar Front Province to the northeast, and the North Pacific
Subtropical Gyre Province to the south (Longhurst 2007). Or, according to a newer classification of
ocean provinces, the Shatsky Rise is in the high-seas west of the Cold Temperate Northwest Pacific
Province (Spalding et al. 2007).
Below depths of 3500 m and between Shatsky Rise and the Mariana Trench (to the southwest) is
cold water (<1.2ºC) associated with the Lower Circumpolar Deep Water current. Upper Circumpolar
Deep Water and North Pacific Deep Water (1.3 to 2.2ºC) interact at depths between 2000 and 3500 m
south of the seamounts (Kawabe et al. 2009).
The prominent oceanic feature above the Shatsky Rise is associated with the Kuroshio Extension –
a warm-water surface current that jets eastward from Japan across the Pacific Basin. Free from coastal
influence, the Kuroshio Current (called the Kuroshio Extension once offshore) forms a meandering,
inertial jet and series of back-eddies that transports large amounts of heat energy into the north Pacific
(Nishida and White 1982; Mizuno and White 1983; Qiu 2000; Yasuda 2003). The Extension meanders
directly over the Shatsky Rise, where it bifurcates and gradually dissipates eastward (Nishida and White
1982; Mizuno and White 1983; Qu et al. 2001).
There are multiple current fronts where this meandering jet collides with the cold Oyashio Current
and oceanic Polar Frontal Zone (Longhurst 2007). Although the Kuroshio is considered oligotrophic (i.e.,
low nutrients), these oceanic fronts are sharp boundaries between physical and chemical parameters that
tend to aggregate pelagic organisms as the colder, nutrient-rich water cascades beneath the warmer
surface water. Low trophic level predators like jellies can maintain position in these downwelling zones
and capitalize on the influx of prey such as copepods, smaller jellies, larval fish, and diatoms (Polovina et
al. 2000). The primary productivity of the Kuroshio Current Large Marine Ecosystem is 422 mgC·m-
²·day-1
, and for the Oyashio Current LME, it is 716 mgC·m-²·day
-1 (Sea Around Us 2011). For the
III. Affected Environment
Environmental Assessment for L-DEO’s Shatsky Rise Seismic Survey, 2012 Page 15
exclusive economic zone (EEZ) of Japan, the main islands have a primary productivity of 570 mgC·m-
²·day-1
, and the outer islands of the EEZ have a primary productivity of 273 mgC·m-²·day
-1.
Other regions of increased productivity appear in the vortices of the warm-core rings and
immediately west of Shatsky Rise, where the Kuroshio Extension bifurcates and chlorophyll
concentrations bloom in April and May (Komatsu et al. 2002). This spring bloom near Shatsky Rise
fades in late summer, before a gradual increase and sharp drop off again in the dark winter months
(Polovina et al. 2006; Longhurst 2007). This complex system of fronts and back-eddies―and the
escalated levels of biomass they support―have long been known by Japanese fishers seeking optimal
fishing grounds for swordfish, tuna, Pacific saury, pelagic sharks, sardine, and other commercially
important fish (Komatsu et al. 2002; Yokota et al. 2006).
Marine Mammals
Thirty-three cetacean species, including 26 odontocete (dolphins and small- and large-toothed
whales) species and seven mysticetes (baleen whales) may occur in the Shatsky Rise study area (Table 2).
In addition, the southern extent of the pelagic range for the northern fur seal overlaps with the study area.
Information on the occurrence, distribution, population size, and conservation status for each of the 34
marine mammal species that may occur in the proposed study area is presented in Table 2. The status of
these species is based on the ESA, the IUCN Red List of Threatened Species, and the Convention on
International Trade in Endangered Species (CITES). Several of these species are listed under the ESA as
endangered, including the North Pacific right, sperm, humpback, fin, sei, and blue whales.
The Western North Pacific gray whale also occurs in the Northwest Pacific Ocean; it is listed as
endangered under the ESA and as critically endangered by the IUCN. Its migration route is believed to
include the Pacific coast of Japan (Reilly et al. 2008a). Although the offshore limit of this route is not
well documented, gray whales are known to prefer nearshore coastal waters. Hence, it is extremely
unlikely that this species would occur within the proposed study area. Therefore, the gray whale is not
analyzed further and is not included in the density table (see below) or as take requests.
(1) Mysticetes
North Pacific Right Whale (Eubalaena japonica)
The North Pacific right whale is listed as Endangered under the ESA and on the IUCN Red List of
Threatened Species (IUCN 2011), and is listed in CITES Appendix I (UNEP-WCMC 2011) (Table 2). It
is considered by NMFS (1991) to be the most endangered baleen whale in the world. Although protected
from commercial whaling since 1935, there has been little indication of recovery. The pre-exploitation
stock may have exceeded 11,000 animals (NMFS 1991). There are no reliable current population
estimates for this species. Wada (1973; see also Braham and Rice 1984) provided an estimate of 100–200
right whales in the North Pacific. More recently, Miyashita and Kato (1998 in Kato et al. 2005)
suggested an abundance of 420–2100 right whales for the Sea of Okhotsk, and Jefferson et al. (2008)
indicate that there are ―no more than a few hundred right whales alive today‖.
North Pacific right whales summer in the northern North Pacific and Bering Sea, apparently feeding
off southern and western Alaska from May to September (e.g., Tynan et al. 2001). Wintering and
breeding areas are unknown, but have been suggested to include the Hawaiian Islands, the Ryukyu
Islands, and the Sea of Japan (Allen 1942; Banfield 1974; Gilmore 1978; Reeves et al. 1978; Herman et
al. 1980; Omura 1986), as well as Guangdong province, southern China (Rudolph and Smeenk 2002).
III. Affected Environment
Environmental Assessment for L-DEO’s Shatsky Rise Seismic Survey, 2012 Page 16
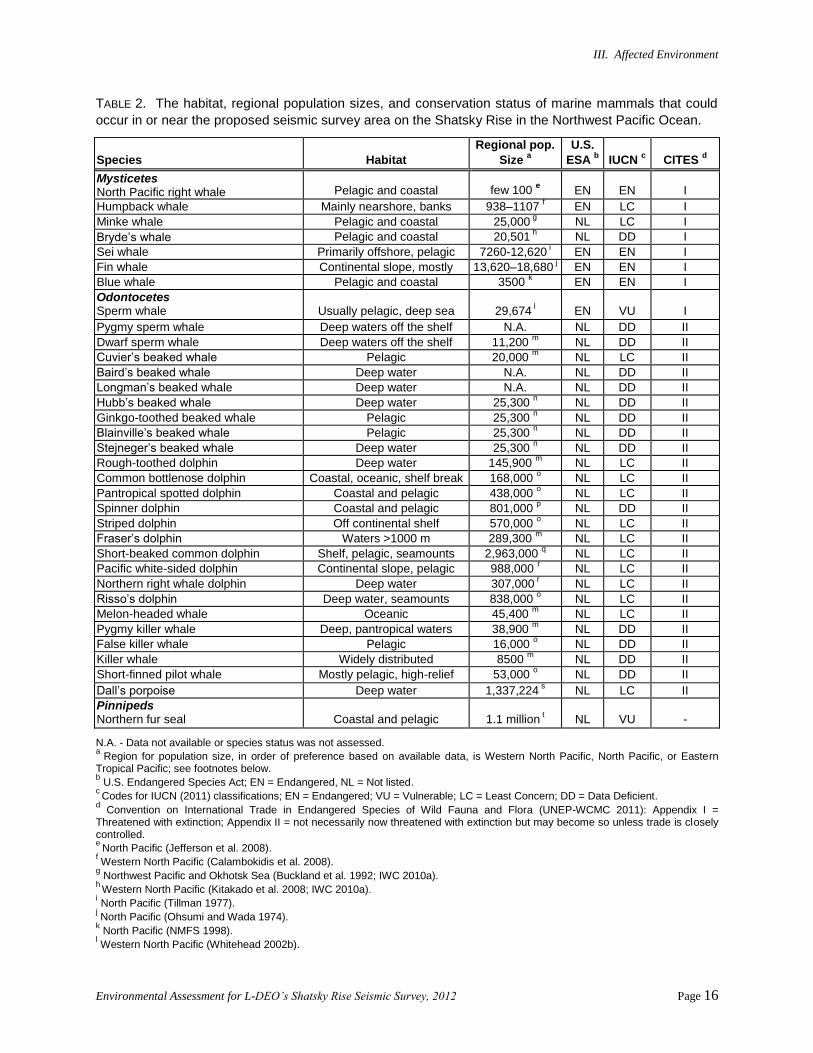
TABLE 2. The habitat, regional population sizes, and conservation status of marine mammals that could
occur in or near the proposed seismic survey area on the Shatsky Rise in the Northwest Pacific Ocean.
Species Habitat
Regional pop.
Size a
U.S.
ESA b IUCN
c CITES
d
Mysticetes North Pacific right whale Pelagic and coastal few 100
e EN EN I
Humpback whale Mainly nearshore, banks 938–1107 f EN LC I
Minke whale Pelagic and coastal 25,000 g NL LC I
Bryde’s whale Pelagic and coastal 20,501 h NL DD I
Sei whale Primarily offshore, pelagic 7260-12,620 i EN EN I
Fin whale Continental slope, mostly
pelagic
13,620–18,680 j EN EN I
Blue whale Pelagic and coastal 3500 k EN EN I
Odontocetes Sperm whale Usually pelagic, deep sea 29,674
l EN VU I
Pygmy sperm whale Deep waters off the shelf N.A. NL DD II
Dwarf sperm whale Deep waters off the shelf 11,200 m NL DD II
Cuvier’s beaked whale Pelagic 20,000 m NL LC II
Baird’s beaked whale Deep water N.A. NL DD II
Longman’s beaked whale Deep water N.A. NL DD II
Hubb’s beaked whale Deep water 25,300 n NL DD II
Ginkgo-toothed beaked whale Pelagic 25,300 n NL DD II
Blainville’s beaked whale Pelagic 25,300 n NL DD II
Stejneger’s beaked whale Deep water 25,300 n NL DD II
Rough-toothed dolphin Deep water 145,900 m NL LC II
Common bottlenose dolphin Coastal, oceanic, shelf break 168,000 o NL LC II
Pantropical spotted dolphin Coastal and pelagic 438,000 o NL LC II
Spinner dolphin Coastal and pelagic 801,000 p NL DD II
Striped dolphin Off continental shelf 570,000 o NL LC II
Fraser’s dolphin Waters >1000 m 289,300 m NL LC II
Short-beaked common dolphin Shelf, pelagic, seamounts 2,963,000 q NL LC II
Pacific white-sided dolphin Continental slope, pelagic 988,000 r NL LC II
Northern right whale dolphin Deep water 307,000 r NL LC II
Risso’s dolphin Deep water, seamounts 838,000 o NL LC II
Melon-headed whale Oceanic 45,400 m NL LC II
Pygmy killer whale Deep, pantropical waters 38,900 m NL DD II
False killer whale Pelagic 16,000 o NL DD II
Killer whale Widely distributed 8500 m NL DD II
Short-finned pilot whale Mostly pelagic, high-relief 53,000 o NL DD II
Dall’s porpoise Deep water 1,337,224 s NL LC II
Pinnipeds Northern fur seal Coastal and pelagic 1.1 million
t NL VU -
N.A. - Data not available or species status was not assessed. a
Region for population size, in order of preference based on available data, is Western North Pacific, North Pacific, or Eastern Tropical Pacific; see footnotes below. b U.S. Endangered Species Act; EN = Endangered, NL = Not listed.
c Codes for IUCN (2011) classifications; EN = Endangered; VU = Vulnerable; LC = Least Concern; DD = Data Deficient.
d Convention on International Trade in Endangered Species of Wild Fauna and Flora (UNEP-WCMC 2011): Appendix I =
Threatened with extinction; Appendix II = not necessarily now threatened with extinction but may become so unless trade is closely controlled.
e North Pacific (Jefferson et al. 2008).
f Western North Pacific (Calambokidis et al. 2008).
g Northwest Pacific and Okhotsk Sea (Buckland et al. 1992; IWC 2010a).
h Western North Pacific (Kitakado et al. 2008; IWC 2010a).
i North Pacific (Tillman 1977).
j North Pacific (Ohsumi and Wada 1974). k North Pacific (NMFS 1998).
l Western North Pacific (Whitehead 2002b).

III. Affected Environment
Environmental Assessment for L-DEO’s Shatsky Rise Seismic Survey, 2012 Page 17
m Eastern Tropical Pacific (ETP) (Wade and Gerrodette 1993).
n ETP; all Mesoplodon spp. (Wade and Gerrodette 1993).
o Western North Pacific (Miyashita 1993a).
p Whitebelly spinner dolphin in the ETP in 2000 (Gerrodette et al. 2005 in Hammond et al 2008a).
q ETP (Gerrodette and Forcada 2002 in Hammond et al 2008b).
r North Pacific (Miyashita 1993b).
s North Pacific (Buckland et al 1993).
t North Pacific, 2004–2005 (Gelatt and Lowry 2008).
The Hawaiian Islands were not a major calving ground for right whales in the last 200 years, but
mid-ocean whaling records of right whales during winter suggest that right whales may have wintered and
calved far offshore in the Pacific Ocean (Scarff 1986, 1991; Clapham et al. 2004). In April 1996, a right
whale was sighted off Maui, the first documented sighting of a right whale in Hawaiian waters since 1979
(Herman et al. 1980; Rowntree et al. 1980).
Whaling records indicate that right whales once ranged across the entire North Pacific Ocean north
of 35ºN and occasionally occurred as far south as 20ºN. In the western Pacific, most sightings in the
1900s were reported from Japanese waters, followed by the Kuril Islands, and the Okhotsk Sea (Brownell
et al. 2001). However, since the 1960s sightings have been relatively rare (e.g., Clapham et al. 2004;
Shelden et al. 2005). Nonetheless, in the western Pacific, significant numbers of right whales have been
seen in the Okhotsk Sea during the 1990s, suggesting that the adjacent Kuril Islands and Kamchatka coast
are a major feeding ground (Brownell et al. 2001). Right whales were also seen near Chichi-jima Island
(Bonin Islands), Japan, in the 1990s (Mori et al. 1998). During 1994-2007, right whale sightings were
also reported off northern Japan, the Kuril Islands, and Kamchatka (Matsuoka et al. 2009). Sightings
were reported for the months of April through August, with highest densities occurring in May and
August (Matsuoka et al. 2009). All sightings were north of 37ºN (Matsuoka et al. 2009). Right whale
sightings were made directly north of the proposed Shatsky Rise study area during May (Matsuoka et al.
2009). However, given the relatively small number of whales in this population, it is unlikely that any
right whales would be encountered in the study.
Humpback Whale (Megaptera novaeangliae)
The humpback whale is found throughout all of the oceans of the world (Clapham 2002). The
species is listed as Endangered under the ESA and Least Concern on the IUCN Red List of Threatened
Species (IUCN 2011), and it is listed in CITES Appendix I (UNEP-WCMC 2011) (Table 2). The
worldwide population of humpback whales is divided into northern and southern ocean populations, but
genetic analyses suggest some gene flow (either past or present) between the North and South Pacific
oceans (e.g., Baker et al. 1993; Caballero et al. 2001). Based on a collaborative study involving
numerous jurisdictions, the North Pacific stock has been recently estimated at 18,302 whales, excluding
calves (Calambokidis et al. 2008; IUCN 2009). Overall, the North Pacific stock is considered to be
increasing. The western Pacific stock is estimated at 938–1107 (Calambokidis et al. 2008). The low
population estimate for the western North Pacific subpopulation is a cause for concern for the IUCN
(2009). Calambokidis et al. (2008) noted that humpbacks along the coast of Asia appear to be subject to
high incidental mortality.
Although considered to be mainly a coastal species, humpback whales often traverse deep pelagic
areas while migrating. Humpback whales spend spring through fall on mid- or high-latitude feeding
grounds, and winter on low-latitude breeding grounds, with limited interchange between regions (Baker et
al. 1998; Clapham 2002; Garrigue et al. 2002). On winter breeding grounds, humpback dives have been
recorded at depths >100 m (Baird et al. 2000). In summer feeding areas, humpbacks typically forage in

III. Affected Environment
Environmental Assessment for L-DEO’s Shatsky Rise Seismic Survey, 2012 Page 18
the upper 120 m of the water column, with a maximum recorded dive depth of 500 m (Dolphin 1987;
Dietz et al. 2002). Humpback whales are often sighted singly or in groups of two or three; however,
while on their breeding and feeding ranges, they may occur in groups of up to 15 (Leatherwood and
Reeves 1983; Donoghue 1996).
North Pacific humpback whales migrate between summer feeding grounds along the Pacific Rim
and the Bering and Okhotsk seas, and winter calving and breeding areas in subtropical and tropical waters
(Pike and MacAskie 1969; Rice 1978). North Pacific humpback whales are known to assemble in three
different winter breeding areas: (1) the eastern North Pacific along the coast of Mexico and central
America, and near the Revillagigedo Islands; (2) around the main Hawaiian Islands; and (3) in the west
Pacific, particularly around the Ogasawara and Ryukyu Islands in southern Japan and the northern
Philippines (Perry et al. 1999a; Calambokidis et al. 2008).
In the western North Pacific, most humpback whales winter and calve near Okinawa (Ryukyu
Island) and Ogasawara (Bonin Islands) (Nishiwaki 1959; Rice 1989; Darling and Mori 1993).
Calambokidis et al. (2008) also included the waters of Taiwan and the Mariana Islands as part of the
humpback winter range. There is potential for the mixing of the western and eastern North Pacific
humpback populations, as several individuals have been seen in the wintering areas of Japan and Hawaii
in separate years (Darling and Cerchio 1993; Salden et al. 1999; Calambokidis et al. 2001, 2008). Whales
from these wintering areas have been shown to travel to summer feeding areas in British Columbia
(B.C.), Canada, and Kodiak Island, Alaska (Darling et al. 1996; Calambokidis et al. 2001), but feeding
areas in Russian waters may be most important (Calambokidis et al. 2008). There appears to be a very
low level of interchange between wintering and feeding areas in Asia and those in the eastern and central
Pacific (Calambokidis et al. 2008).
During Japanese sighting surveys from 1994 to 2007, numerous humpback whales sightings were
made off northern Japan, the Kuril Islands, and Kamchatka (Matsuoka et al. 2009). Sightings were
reported for the months of April through September, with lowest densities in April and September
(Matsuoka et al. 2009). In May and June, sightings were concentrated east of northern Japan; highest
densities were reported for July and August off the Kuril Islands and Kamchatka (Matsuoka et al. 2009).
Humpback whales were encountered directly north of the proposed Shatsky Rise study area in May; some
sightings reported in June and July were also near the study area (Matsuoka et al. 2009). In August,
sightings were farther to the north (Matsuoka et al. 2009). Most of the animals in this population are on
their way to northern feeding grounds in June and July; thus, few individuals are expected to occur within
the proposed study area at the time of the survey.
Minke Whale (Balaenoptera acutorostrata)
The minke whale has a cosmopolitan distribution that spans polar, temperate, and tropical regions
(Jefferson et al. 2008). In the Northern Hemisphere, minke whales are usually seen in coastal areas, but
can also be seen in pelagic waters during northward migrations in spring and summer, and southward
migration in autumn (Stewart and Leatherwood 1985).
In the North Pacific, the summer range of the minke whale extends to the Chukchi Sea; in the
winter, the whales move further south to within 2º of the equator (Perrin and Brownell 2002). Three
stocks of minke whales are currently recognized in the North Pacific: the Sea of Japan/East China Sea, the
rest of the western Pacific west of 180ºN, and the remainder of the Pacific (Donovan 1991). The current
abundance estimate for the Northwest Pacific and Okhotsk Sea is 25,000 minkes (Buckland et al. 1992;
IWC 2010a).

III. Affected Environment
Environmental Assessment for L-DEO’s Shatsky Rise Seismic Survey, 2012 Page 19
The minke whale is a small baleen whale and tends to be solitary or in groups of 2–3, but can occur
in much larger aggregations around prey resources (Jefferson et al. 2008). The small size, inconspicuous
blows, and brief surfacing times of minke whales mean that they are easily overlooked in heavy sea
states, although they are known to approach vessels in some circumstances (Stewart and Leatherwood
1985). Little is known about the diving behavior of minke whales, but they are not known to make pro-
longed deep dives (Leatherwood and Reeves 1983).
North Pacific minke whales are known to occur in the Yellow, East China and South China Seas
(Parsons et al. 1995), as well as in the waters of the open Pacific (Hakamada et al. 2009). Minke whales
have been hunted off Japan for many years (see IWC 2010b). They are seen regularly during Japanese
sighting surveys south of 41°N in May–June, and migrate to north of 41°N in July–August (Hakamada et
al. 2009).
Bryde’s Whale (Balaenoptera edeni/brydei)
Bryde‘s whale is found in tropical and subtropical waters throughout the world between 40ºN and
40ºS, generally in waters warmer than 20ºC, but at minimum 15ºC (Reeves et al. 1999; Kato 2002; Kanda
et al. 2007). Long confused with sei whales, Balaenoptera edeni was named in 1913 and B. brydei was
named in 1950, although it is still uncertain whether the two are distinct species or subspecies (Kato
2002). The smaller B. edeni (the pygmy Bryde‘s or Eden‘s whale) may be a distinct species from the
larger B. brydei or Bryde‘s whale (Wada et al. 2003; Sasaki et al. 2006). The small form is known to
occur in southwestern Japan, Hong Kong/Macau, and Australia, but this form has not been distinguished
from the common Bryde‘s whale (Jefferson et al. 2008). Populations in the western North Pacific,
western South Pacific, eastern South Pacific, and eastern Indian Ocean currently show low levels of
genetic interchange (Kanda et al. 2007).
Bryde‘s whales are known to occur in both shallow coastal and deeper offshore waters (Jefferson et
al. 2008). Some populations show a general pattern of movement toward the equator in winter and
toward higher latitudes in summer, though the locations of actual winter breeding grounds are unknown
(Reeves et al. 1999; Kato 2002; Kanda et al. 2007). Bryde‘s whales are usually solitary or in pairs,
although groups of 10–20 are known from feeding grounds (Jefferson et al. 2008). Wade and Gerrodette
(1993) reported a mean group size of 1.7 for the ETP. The durations of Bryde‘s whale dives are 1–20 min
(Cummings 1985).
In the western North Pacific, Bryde‘s whales occur off the Pacific coasts of Japan, Taiwan, and the
Philippines (Kato 2002), in Hong Kong (Parsons et al. 1995; Jefferson and Hung 2007), as well as in the
Yellow, East China, and South China Seas (Parsons et al. 1995; Chou 2004). Whales in the East China
Sea and coastal waters of Kochi, Japan, differ from the whales in offshore waters of the western North
Pacific, perhaps at the subspecific level (Yoshida and Kato 1999). However, the reclassification of
Bryde‘s whales remains unresolved (Jefferson et al. 2008). Bryde‘s whales are hunted off the coast of
Japan (see IWC 2010b). The current population estimate for the western North Pacific is 20,501
(Kitakado et al. 2008; IWC 2010a). Bryde‘s whales are seen regularly during Japanese summer sighting
surveys (Shimada 2004; Hakamada et al. 2009). Near the Shatsky Rise survey area, sightings are highest
during July and August (Shimada 2004; Hakamada et al. 2009).
Sei Whale (Balaenoptera borealis)
The sei whale is listed as Endangered under the U.S. ESA and on the IUCN Red List of Threat-
ened Species (IUCN 2011), and is listed in CITES Appendix I (UNEP-WCMC 2011) (Table 2). Sei
whale populations were depleted by whaling, and their current status is generally uncertain (Horwood
III. Affected Environment
Environmental Assessment for L-DEO’s Shatsky Rise Seismic Survey, 2012 Page 20
1987). The global population is thought to be ~80,000 (Horwood 2002), with up to ~12,620 animals in
the North Pacific (Tillman 1977). Although Hakamada et al. (2004) extrapolated an abundance estimate
for the entire Northwest Pacific based on one part of that region, this estimate (68,000) has not yet been
accepted (Reilly et al. 2008b). The sei whale is poorly known because of confusion with Bryde‘s whale
and unpredictable distribution patterns, such that it may be common in an area for several years and then
seemingly disappears (Schilling et al. 1992; Jefferson et al. 2008).
The distribution of the sei whale is not well known, but this whale is found in all oceans and
appears to prefer mid-latitude temperate waters (Jefferson et al. 2008). Sei whales migrate from
temperate zones occupied in winter to higher latitudes in the summer, where most feeding takes place
(Gambell 1985a). In the North Pacific, the sei whale can be found across the Bering Sea and off the
coasts of Japan and Korea in the summer. Its winter distribution is concentrated at about 20°N. No
breeding grounds have been identified for sei whales; however, calving is thought to occur from
September to March.
The sei whale is pelagic and generally not found in coastal waters (Harwood and Wilson 2001). It
is found in deeper waters characteristic of the continental shelf edge region (Hain et al. 1985) and in other
regions of steep bathymetric relief such as seamounts and canyons (Kenney and Winn 1987; Gregr and
Trites 2001). On feeding grounds, sei whales associate with oceanic frontal systems (Horwood 1987)
such as the cold eastern currents in the North Pacific (Perry et al. 1999a). Sei whales are frequently seen
in groups of 2–5 (Jefferson et al. 2008), although larger groups sometimes form on feeding grounds
(Gambell 1985a). Sei whales generally do not dive deeply, and dive durations are 15 min or longer
(Gambell 1985a).
Sei whales are hunted off Japan (see IWC 2010b). They are seen regularly during Japanese
sighting surveys in the summer (Hakamada et al. 2009). Sei whales have been sighted in and near the
Shatsky Rise survey area in greatest numbers in May, June, and July; in August, sightings occur farther to
the north (Hakamada et al. 2009). During the summer, sei whales travel northward. They are seen
regularly during Japanese sighting surveys south of 41°N in May–June, and migrate to north of 41°N in
July–August (Hakamada et al. 2009).
Fin Whale (Balaenoptera physalus)
The fin whale is widely distributed in all the world‘s oceans (Gambell 1985b), but typically occurs
in temperate and polar regions from 20° to 70° north and south of the equator (Perry et al. 1999b). It is
listed as Endangered under the U.S. ESA and on the IUCN Red List of Threatened Species (IUCN 2011),
and is listed in CITES Appendix I (UNEP-WCMC 2011) (Table 2). Northern and southern fin whale
populations are distinct and are sometimes recognized as different subspecies (Aguilar 2002). Abundance
estimates for the northern populations are 13,620–18,680 for the North Pacific (Ohsumi and Wada 1974),
30,000 for the central and northeastern Atlantic (IWC 2010a), and 3200 for West Greenland (IWC
2010a). Miyashita and Kato (2005 in Kato et al. 2005) provided an abundance estimate of 13,000 for the
Sea of Okhotsk.
Fin whales occur in coastal, shelf, and oceanic waters. Sergeant (1977) proposed that fin whales
tend to follow steep slope contours, either because they detect them readily or because biological
productivity is high along steep contours because of tidal mixing and perhaps current mixing. They can
be found as individuals or groups of 2–7, but can form much larger feeding aggregations, sometimes with
humpback and minke whales (Jefferson et al. 2008). Foraging fin whales reach mean dive depths and
times of 98 m and 6.3 min, respectively, while recorded mean dive depths and times for non-foraging fin

III. Affected Environment
Environmental Assessment for L-DEO’s Shatsky Rise Seismic Survey, 2012 Page 21
whales in the Pacific are 59 m and 4.2 min, respectively (Croll et al. 2001). Dive depths of >150 m
coinciding with the diel migration of krill were reported by Panigada et al. (1999).
The current distribution of fin whales in the western North Pacific is largely unknown. Fin whales
undergo seasonal migrations, and are known to winter in the Yellow, East China, and South China Seas
(Parsons et al. 1995; Rudolph and Smeenk 2002). A recent review of fin whale distribution in the North
Pacific noted the lack of sightings across the pelagic waters between eastern and western winter areas
(Mizroch et al. 2009). In the summer, fin whales are seen off northern Japan, the Kuril Islands, and
Kamchatka (Matsuoka et al. 2009). During Japanese sightings surveys in the western North Pacific from
1994 to 2007, the fin whale was sighted more frequently than the blue, humpback or right whale
(Matsuoka et al. 2009). Most sightings were made in July and August; sightings in August were
concentrated towards the northern parts of the area (Matsuoka et al. 2009). During these sighting surveys,
fin whales were seen in and near the proposed Shatsky Rise study area during May, June, and July; in
August and September, fin whale sightings were farther to the north (Matsuoka et al. 2009). Thus, fin
whales could be encountered during the proposed seismic survey.
Blue Whale (Balaenoptera musculus)
The blue whale has a cosmopolitan distribution and tends to be pelagic, only coming nearshore to
feed and possibly to breed (Jefferson et al. 2008). It is listed as Endangered under the U.S. ESA and on
the IUCN Red List of Threatened Species (IUCN 2011), and is listed in CITES Appendix I (UNEP-
WCMC 2011) (Table 2). All blue whale populations have been exploited commercially, and many have
been severely depleted as a result. Blue whale abundance has been estimated at 2300 for the Southern
Hemisphere (IWC 2010a), up to 1000 in the central and northeast Atlantic (Pike et al. 2009), and ~3500
in the eastern North Pacific (NMFS 1998).
Blue whales are typically found singly or in groups of two or three (Yochem and Leatherwood
1985; Jefferson et al. 2008). Matsuoka et al. (2009) reported a mean group size of 1.4 for the western
North Pacific, and Wade and Gerrodette (1993) reported a mean group size of 1.5 for the ETP. Croll et
al. (2001) reported mean dive depths and times of 140 m and 7.8 min for foraging blue whales, and 68 m
and 4.9 min for non-foraging individuals. Dives of up to 300 m were recorded for tagged blue whales
(Calambokidis et al. 2003).
Generally, blue whales are seasonal migrants between high latitudes in the summer, where they
feed, and low latitudes in the winter, where they mate and give birth (Lockyer and Brown 1981).
However, little information is available on blue whale wintering areas (Perry et al. 1999a). Some
individuals may stay in low or high latitudes throughout the year (Reilly and Thayer 1990; Watkins et al.
2000b). Moore et al. (2002) reported that blue whale calls are received in the North Pacific year-round.
Although it has been suggested that there are at least five subpopulations of blue whales in the North
Pacific (NMFS 1998), analysis of blue whale calls monitored from the U.S. Navy Sound Surveillance
System (SOSUS) and other offshore hydrophones (see Stafford et al. 1999, 2001, 2007; Watkins et al.
2000a; Stafford 2003) suggest that there are two separate populations―one in the eastern and one in the
western North Pacific (Sears 2002).
The current distribution of blue whales in the western North Pacific is largely unknown. However,
numerous blue whale sightings have been made in the western North Pacific during recent Japanese
sighting surveys during 1994-2007 (Matsuoka et al. 2009). The highest blue whale densities were seen
southeast of Kamchatka (Matsuoka et al. 2009). Most sightings were made in July and August; sightings
in August were concentrated towards the northern parts of the area (Matsuoka et al. 2009). Blue whales
were seen in and near the proposed Shatsky Rise survey area during May, June, and July; sightings in
III. Affected Environment
Environmental Assessment for L-DEO’s Shatsky Rise Seismic Survey, 2012 Page 22
August and September were farther to the north (Matsuoka et al. 2009). Thus, it is possible that blue
whales could be encountered at Shatsky Rise during the proposed seismic survey.
(2) Odontocetes
Sperm Whale (Physeter macrocephalus)
Sperm whales are the largest of the toothed whales, with an extensive worldwide distribution (Rice
1989). The species is listed as Endangered under the U.S. ESA, but on a worldwide basis it is abundant
and not biologically endangered. It is listed as Vulnerable on the IUCN Red List of Threatened Species
(IUCN 2011), and is listed in CITES Appendix I (UNEP-WCMC 2011) (Table 2). There currently is no
accurate estimate for the size of any sperm whale population (Whitehead 2002a). Best estimates probably
are those of Whitehead (2002b), who provided a sperm whale population size estimate of 29,674 for the
western North Pacific.
Sperm whale distribution is linked to social structure—mixed groups of adult females and juvenile
animals of both sexes generally occur in tropical and subtropical waters, whereas adult males are com-
monly found alone or in same-sex aggregations, often occurring in higher latitudes outside the breeding
season (Best 1979; Watkins and Moore 1982; Arnbom and Whitehead 1989; Whitehead and Waters
1990). Mature male sperm whales migrate to warmer waters to breed when they are in their late twenties
(Best 1979). They spend periods of at least months on the breeding grounds, moving between mixed
groups of 20–30 on average (Whitehead 1993, 2003). Mean group sizes were reported as 3.5 for the
western North Pacific (Kato and Miyashita 1998) and 7.9 for the ETP (Wade and Gerrodette 1993).
Sperm whales generally are distributed over large areas that have high secondary productivity and
steep underwater topography, in waters at least 1000 m deep (Jaquet and Whitehead 1996; Whitehead
2002a). They are often found far from shore, but can be found closer to oceanic islands that rise steeply
from deep ocean waters (Whitehead 2002a). They can dive as deep as ~2 km and possibly deeper on rare
occasions for periods of over 1 h; however, most of their foraging occurs at depths of ~300–800 m for 30–
45 min (Whitehead 2003). During a foraging dive, sperm whales typically travel ~3 km horizontally and
0.5 km vertically (Whitehead 2003). Whales in the Galápagos Islands typically dove for ~40 min and then
spent 10 min at the surface (Papastavrou et al. 1989).
In the western North Pacific, sperm whales are known to occur in the waters of Japan (Kato and
Miyashita 1998; Hakamada et al. 2009), Hong Kong (Parsons et al. 1995; Jefferson and Hung 2007), the
Philippines (Acebes et al. 2000 in Perrin et al. 2005; Acebes and Lesaca 2003), and Taiwan (Chou 2004).
During winter, few sperm whales are sighted off the east coast of Japan (Kato and Miyashita 1998), but
sperm whales are seen regularly during sighting surveys in the summer (Hakamada et al. 2009). They
have been sighted in and near the Shatsky Rise survey area from May through August (Hakamada et al.
2009). Thus, sperm whales could be encountered during the proposed Shatsky Rise seismic program.
Pygmy and Dwarf Sperm Whales (Kogia breviceps and K. sima)
Pygmy sperm whales and dwarf sperm whales are distributed widely throughout tropical and temp-
erate seas, but their precise distributions are unknown as most information on these species comes from
strandings (McAlpine 2002). They are difficult to sight at sea, perhaps because of their avoidance
reactions to ships and behavior changes in relation to survey aircraft (Würsig et al. 1998). The two
species are difficult to distinguish from one another when sighted (McAlpine 2002). During sighting
surveys and, hence, in population and density estimates, the two species are most often categorized
together as Kogia spp. (Waring et al. 2009).

III. Affected Environment
Environmental Assessment for L-DEO’s Shatsky Rise Seismic Survey, 2012 Page 23
Pygmy sperm whales may inhabit waters beyond the continental shelf edge, whereas dwarf sperm
whales are thought to inhabit the shelf-edge and slope waters (Rice 1998). Also, the dwarf sperm whale
may prefer warmer waters than the pygmy sperm whale (McAlpine 2002). Pygmy sperm whales feed
mainly on various species of squid in the deep zones of the continental shelf and slope (McAlpine et al.
1997). Pygmy sperm whales occur in small groups of up to six, and dwarf sperm whales can form groups
of up to 10 (Caldwell and Caldwell 1989). Wade and Gerrodette (1993) noted a mean group size of 1.7
for the dwarf sperm whale in the ETP.
Although there are few useful estimates of abundance for pygmy or dwarf sperm whales anywhere
in their range, they are thought to be fairly common in some areas. In the western North Pacific,
confirmed Kogia records exist for the East and South China seas off mainland China, Taiwan, Hong
Kong, and the Philippines (Parsons et al. 1995; Zhou et al. 1995; Perrin et al. 2005; Chou 2004; Jefferson
and Hung 2007). Although Kogia spp. have been seen during Japanese sighting surveys in the western
North Pacific in August/September (Kato et al. 2005), to the best of our knowledge, there are no direct
data available for the Shatsky Rise survey area with respect to Kogia spp. Given their habitat preferences,
it is more likely that pygmy sperm whales rather than dwarf sperm whales would be encountered in the
study area.
Cuvier’s Beaked Whale (Ziphius cavirostris)
Cuvier‘s beaked whale is probably the most widespread of the beaked whales, although it is not
found in polar waters (Heyning 1989). It is rarely observed at sea and is mostly known from strandings.
It strands more commonly than any other beaked whale (Heyning 1989). Its inconspicuous blows, deep-
diving behavior, and tendency to avoid vessels all help to explain the infrequent sightings (Barlow and
Gisiner 2006). Adult males of this species usually travel alone, but these whales can be seen in groups of
up to 15 individuals, with a mean group size of 2.3 (MacLeod and D‘Amico 2006). Cuvier‘s beaked
whale is an offshore species that feeds on fish and squid (Heyning 2002). Its dives generally last 30–60
min, but dives of 85 min have been recorded (Tyack et al. 2006). Wade and Gerrodette (1993) reported a
mean group size of 2.2 for the ETP.
In the western Pacific, Cuvier‘s beaked whales are known to occur in the waters of Japan
(Nishiwaki and Oguro 1972 in Wang et al. 1995) and parts of southeast Asia (Heyning 1989). They were
also seen during Japanese sighting surveys in August/September in the western North Pacific (Kato et al.
2005). There is very little information on this species for the Shatsky Rise study area, but what is known
of its distribution and habitat preferences suggests that it may occur there.
Baird’s Beaked Whale (Berardius bairdii)
Baird‘s beaked whale has a fairly extensive range across the North Pacific north of 30˚N, and
strandings have occurred as far north as the Pribilof Islands (Rice 1986). This species is divided into
three distinct stocks: Sea of Japan, Okhotsk Sea, and Bering Sea/eastern North Pacific (Balcomb 1989;
Reyes 1991). Concentrations are thought to occur in the Sea of Okhotsk and Bering Sea (Rice 1998;
Kasuya 2002a). The whales occur year-round in the Sea of Okhotsk and the Sea of Japan (Kasuya
2002a). Their abundance is estimated at 5029 for the Pacific coast of Japan, 1260 for the eastern Sea of
Japan, and 660 for the southern Okhotsk Sea (Kasuya 2002a).
Baird‘s beaked whales sometimes are seen close to shore, but their primary habitat is over or near
the continental slope and oceanic seamounts in waters 1000–3000 m deep (Jefferson et al. 1993; Kasuya
and Ohsumi 1984; Kasuya 2002a). Off Japan and California, they primarily feed on benthic fishes and
cephalopods, although pelagic fishes are also taken occasionally (Kasuya 2002a). Baird‘s beaked whales

III. Affected Environment
Environmental Assessment for L-DEO’s Shatsky Rise Seismic Survey, 2012 Page 24
can stay submerged for up to 67 min, although most (66%) dives are <20 min long, and time at the
surface is 1–14 min (Kasuya 2002a). They travel in groups of a few to several dozen (Balcomb 1989).
Off Japan, they form groups of up to 30 individuals, although groups of 2 to 9 animals are seen most
often (Kasuya 2002a). Wade et al. (2003) reported a mean group size of 10.8 for the ETP. There appears
to be a calving peak in March and April (Jefferson et al. 1993).
Baird‘s beaked whales have been hunted for centuries in the far western North Pacific. Before
1840, the annual catch in Japan was <25 animals; after World War II, the fishery expanded to the entire
northern Pacific, with a reported catch of over 300, but subsequently declined (Kasuya 2002a). Currently,
Baird‘s beaked whales are hunted off the west coast of Japan in the summer; Kasuya (2002a) reported
quotas of eight Baird‘s beaked whales for the Sea of Japan, two for the southern Okhotsk Sea, and 52 for
the Pacific coast. Off Japan‘s Pacific coast, Baird‘s beaked whales start to appear in May, numbers
increase over the summer, and decrease toward October (Kasuya 2002a). During this time, they are
nearly absent in offshore waters (Kasuya 2002a). Kato et al. (2005) also reported the presence of Baird‘s
beaked whales in the western North Pacific in August/September. Thus, it is possible that this species
could be encountered at Shatsky Rise during the proposed seismic survey in spring.
Longman’s Beaked Whale (Indopacetus pacificus)
Until very recently, Longman‘s beaked whale was thought to be extremely rare, and it was known
only from two skulls (Pitman et al. 1987). Recent morphometric and genetic analyses of those two
original specimens and an additional four specimens have allowed a more detailed characterization of the
species (Dalebout et al. 2003). It seems likely that it is, in fact, the cetacean that has been seen in Indo-
Pacific waters and called the ―tropical bottlenose whale‖. Some authorities place the species in the genus
Mesoplodon, but there now seems to be sufficient information to afford it status as a separate genus
(Dalebout et al. 2003). Records of this species exist within an area from 10ºS to 40ºN.
Longman‘s beaked whales have been sighted in waters with temperatures 21–31ºC and have been
seen in the tropics every month of the year except June, indicating year-round residency (Pitman et al.
1999; Jefferson et al. 2008). Although widespread throughout the tropical Pacific, the species must still
be considered rare because of a scarcity of sightings despite a great deal of survey effort (Pitman et al.
1999). Longman‘s beaked whales have been seen alone, but more commonly in groups of at least ten and
up to 100, with an average group size of 15–20 (Jefferson et al. 2008). Pitman et al. (1999) reported a
mean group size of 18.5 in the tropics. Dives are thought to last 18–33 min (Jefferson et al. 2008).
In eastern Asia, records for this species exist for Japan (Yamada et al. 2004), the Philippines
(Acebes et al. 2005), and Taiwan (Yang et al. 2008). Kato et al. (2005) also reported on sightings of this
species during Japanese surveys in the western North Pacific in August/September. Given that this
species prefers tropical and sub-tropical waters, the Shatsky Rise survey area would be at the limit of its
range. Thus, encounters with this species in the proposed study area are considered unlikely.
Mesoplodont Beaked Whales
Four species of mesoplodont whales may occur in deep waters of the Shatsky Rise study area:
Blainville‘s (Mesoplodon densirostris), gingko-toothed (Mesoplodon ginkgodens), Stejneger‘s (M.
stejnegeri), and Hubb‘s (M. carlhubbsi) beaked whales. No population estimates exist for any of these
species for the western North Pacific.
Almost everything that is known regarding most mesoplodont species has come from stranded
animals (Pitman 2002). The different mesoplodont species are difficult to distinguish in the field, and are

III. Affected Environment
Environmental Assessment for L-DEO’s Shatsky Rise Seismic Survey, 2012 Page 25
most often categorized by genus during sighting surveys, resulting in density and population estimates for
Mesoplodon spp. They are all thought to be deep-water animals, only rarely seen over the continental
shelf. Typical group sizes range from one to six (Pitman 2002). Because of the scarcity of sightings,
most are thought to be rare.
Blainville’s beaked whale.—This species is found in tropical and temperate waters of all oceans
(Jefferson et al. 2008). Blainville‘s beaked whale has the widest distribution throughout the world of all
Mesoplodon species (Mead 1989). There is no evidence that Blainville‘s beaked whales undergo seasonal
migrations. Blainville‘s beaked whales are most often found in singles or pairs, but also in groups of 3–7
(Jefferson et al. 2008).
Like other beaked whales, Blainville‘s beaked whales are generally found in deep waters 200 m to
1400 m deep (Gannier 2000; Jefferson et al. 2008). Maximum dive depths have been reported as 1251 m
(Tyack et al. 2006) and 1408 m (Baird et al. 2006), and dives have lasted as long as 54 min (Baird et al.
2006) to 57 min (Tyack et al. 2006). However, they also can occur in coastal areas and have been known
to spend long periods of time at depths <50 m (Jefferson et al. 2008).
In Asia, sighting records exist for Blainville‘s beaked whale for the East China Sea off mainland
China and for the Philippines (Perrin et al. 2005). They are also known to occur off Taiwan (Zhou et al.
1995; Chou 2004; Perrin et al. 2005). To the best of our knowledge, there are no published sighting
records near the Shatsky Rise, but this area is believed to be within the distribution range for this species
(Jefferson et al. 2008).
Ginkgo-toothed beaked whale.—This species is only known from stranding records (Mead 1989;
Jefferson et al. 2008). In the South Pacific Ocean, it has stranded in New South Wales, Australia, and the
North Island and Chatham Islands, New Zealand (Mead 1989; Baker and van Helden 1999). The ginkgo-
toothed whale is hypothesized to occupy tropical and warm temperate waters of the Indian and Pacific
oceans (Pitman 2002). Its occurrence has been confirmed in the Yellow and East China seas off mainland
China (Perrin et al. 2005), as well as off Taiwan (Yang 1976 in Zhou et al. 1995; Chou 2004; Wang and
Yang 2006). The distributional range of this species suggests that any occurrence in the study area would
be rare.
Stejneger’s beaked whale.—Stejneger‘s beaked whale occurs in subarctic and cool temperate
waters of the North Pacific (Mead 1989). Most records are from Alaskan waters, and the Aleutian Islands
appear to be its center of distribution (Mead 1989). The species typically occurs in groups of 3–4,
ranging to ~15 (Reeves et al. 2002). It is known to occur in the Sea of Japan and possibly the southern
Okhotsk Sea (MacLeod et al. 2006). Stejneger‘s beaked whale was also seen during Japanese sighting
surveys in the western North Pacific during August/September (Kato et al. 2005). Seasonal peaks in
strandings along the western coast of Japan suggest that this species may migrate north in the summer
from the Sea of Japan (Mead 1989).
Hubb’s beaked whale.—This species occurs in temperate waters of the North Pacific (Mead 1989).
Most of the stranding records are from California, but at least seven strandings have been recorded along
the B.C. coast as far north as Prince Rupert (Houston 1990; Willis and Baird 1998). Its distribution
appears to be correlated with the deep subarctic current (Mead et al. 1982). The range of this species is
believed to be continuous across the North Pacific (Macleod et al. 2006), although this has yet to be
substantiated because very few direct at-sea observations exist. Hubb‘s beaked whale was seen during
Japanese sighting surveys in the western North Pacific during August/September (Kato et al. 2005). This
species has been taken in Japanese hunts for small cetaceans and sold at markets (Dalebout et al. 2001).

III. Affected Environment
Environmental Assessment for L-DEO’s Shatsky Rise Seismic Survey, 2012 Page 26
Rough-toothed Dolphin (Steno bredanensis)
The rough-toothed dolphin is widely distributed around the world, but mainly occurs in tropical
and warm temperate waters (Miyazaki and Perrin 1994). Rough-toothed dolphins generally occur in
deep, oceanic waters, but can be found in shallower coastal waters in some regions (Jefferson et al. 2008).
Rough-toothed dolphins are deep divers and can dive for up to 15 min (Jefferson et al. 2008). They
usually form groups of 10–20, but aggregations of hundreds have been seen (Jefferson et al. 2008). Wade
and Gerrodette (1993) reported a mean group size of 14.7 for the ETP.
In the Pacific, rough-toothed dolphins occur from central Japan and northern Australia to Baja
California, Mexico, and southern Peru (Jefferson 2002). Rough-toothed dolphins are also known to occur
in the Philippines (Acebes et al. 2000 in Perrin et al. 2005; Acebes and Lesaca 2003; Perrin et al. 2005)
and in the East and South China seas (Parsons et al. 1995; Zhou et al. 1995; Chou 2004; Perrin et al.
2005; Jefferson and Hung 2007). There are no estimates of abundance for rough-toothed dolphins in the
western Pacific. Rough-toothed dolphins were seen during Japanese sighting surveys in the western
North Pacific during August/September (Kato et al. 2005). In Japan, rough-toothed dolphins have been
taken in drive and harpoon hunts (Miyazaki and Perrin 1994). As the Shatsky Rise study area is known to
be within this species‘ range, the rough-toothed dolphin may be encountered during the proposed survey.
Common Bottlenose Dolphin (Tursiops truncatus)
The bottlenose dolphin is distributed worldwide. It is found mainly where surface temperatures
range from 10–32ºC (Reeves et al. 2002). Generally, there are two distinct bottlenose dolphin types: a
shallow water type, mainly found in coastal waters, and a deep water type, mainly found in oceanic
waters (Duffield et al. 1983; Hoelzel et al. 1998; Walker et al. 1999). As well as inhabiting different
areas, these ecotypes differ in their diving abilities (Klatsky 2004) and prey types (Mead and Potter 1995).
Bottlenose dolphins have been reported to regularly dive to depths >450 m for periods of >5 min (Klatsky
2004), and even down to depths of 600–700 m for up to 12 min (Klatsky et al. 2005). Mean group sizes
have been reported as 66.9 for the western North Pacific (Miyashita 1993a), 22–24 for the ETP (Wade
and Gerrodette 1993; Smith and Whitehead 1999).
In the western Pacific, the bottlenose dolphin is distributed from Japan to Australia and New
Zealand. In Japan, bottlenose dolphins are hunted by whalers in drive and harpoon fisheries (Kasuya
2007). Bottlenose dolphins are also known to occur in the Philippines and the Yellow, East, and South
China seas off China and Taiwan (Perrin et al. 2005), and Hong Kong (Parsons et al. 1995; Jefferson and
Hung 2007). It has been estimated that 168,000 bottlenose dolphins inhabit the western North Pacific
(Miyashita 1993a). Bottlenose dolphins were regularly seen during Japanese summer sighting surveys in
the western North Pacific (Miyashita 1993a). They were seen in groups of 1 to 500 animals and were
often sighted in mixed schools with other dolphin species (Miyashita 1993a). Occurrence in the western
North Pacific was patchy, but high densities were generally observed in coastal waters as well as in some
offshore areas (Miyashita 1993a). Bottlenose dolphins have been sighted in the proposed Shatsky Rise
study area in August, and near the study area in June and July (Miyashita 1993a).
Pantropical Spotted Dolphin (Stenella attenuata)
The pantropical spotted dolphin can be found throughout tropical and some subtropical oceans of
the world (Perrin and Hohn 1994). The southernmost limit of its range is ~40°S (Perrin 2002a). There
are two forms of pantropical spotted dolphin―coastal and offshore―although the coastal form occurs
mainly in the ETP from Baja California to South America (Jefferson et al. 2008). In the ETP, this

III. Affected Environment
Environmental Assessment for L-DEO’s Shatsky Rise Seismic Survey, 2012 Page 27
dolphin is associated with warm (>25ºC) tropical surface water (Au and Perryman 1985; Reilly 1990;
Reilly and Fiedler 1994; Reeves et al. 1999). The offshore form inhabits tropical, equatorial, and
southern subtropical water masses (Perrin 2002a). This species is found primarily in deeper waters, and
rarely over the continental shelf or continental shelf edge (Davis et al. 1998).
Pantropical spotted dolphins are extremely gregarious, forming groups of hundreds or even thou-
sands. In the western North Pacific, groups of 3 to 2500 striped dolphins were seen, and the mean group
size was 226 (Miyashita 1993a). Wade and Gerrodette (1993) reported a mean group size of 149.4 for the
western/southern stock in the ETP. Pantropical spotted and spinner dolphins are commonly seen together
in mixed-species groups, e.g., in the ETP (Au and Perryman 1985), off Hawaii (Psarakos et al. 2003), and
off the Marquesas Archipelago (Gannier 2002).
In the western Pacific, pantropical spotted dolphins occur from Japan south to Australia; they have
been hunted in drive fisheries off Japan for decades (Kasuya 2007). Pantropical spotted dolphins are also
known to occur in the Philippines and in the East and South China seas off China (Perrin et al. 2005), in
Taiwan (Parsons et al. 1995; Zhou et al. 1995; Chou 2004), and off Hong Kong (Parsons et al. 1995;
Jefferson and Hung 2007). Their abundance in the western North Pacific has been estimated at 438,000
(Miyashita 1993a). They were regularly seen during Japanese summer sighting surveys in the western
North Pacific (Miyashita 1993a). Densities were highest in offshore waters between 30ºN and 37ºN
(Miyashita 1993a). Pantropical spotted dolphins have been sighted in the proposed Shatsky Rise study
area in June, August, and September; survey effort was low in July (Miyashita 1993a).
Spinner Dolphin (Stenella longirostris)
The spinner dolphin is distributed in oceanic and coastal tropical waters between 40ºN and 40ºS
(Jefferson et al. 2008). In the Pacific, two subspecies of spinner dolphin occur in the western Pacific: the
widespread, offshore spinner dolphin (Stenella longirostris longirostris) and the dwarf spinner dolphin (S.
l. roseiventris). There is little or no genetic interchange between the two subspecies (Dizon et al. 1991).
S. l. longirostris feeds on small mesopelagic fish and squid, whereas S. l. roseiventris preys on benthic
and coral reef fishes and invertebrates (Perrin et al. 1999). S. l. longirostris occurs in the deep inner
waters of the Philippines as well as Japan, whereas S. l. roseiventris inhabits the shallow waters of inner
southeast Asia (Perrin et al. 1999).
Kato et al. (2005) noted that this species was seen during Japanese sighting surveys in the western
North Pacific in August/September. Spinner dolphins are also known to occur in the East and South
China seas off China and Taiwan (Perrin et al. 2005) and Hong Kong (Parsons et al. 1995; Jefferson and
Hung 2007). To the best of our knowledge, there are no known estimates of abundance near the Shatsky
Rise. However, the study area is within the known range of the offshore subspecies of spinner dolphins.
Striped Dolphin (Stenella coeruleoalba)
The striped dolphin has a cosmopolitan distribution in tropical to warm temperate waters (Perrin et
al. 1994a) and is generally seen south of 43ºN (Archer 2002). It is typically found in waters outside the
continental shelf and is often associated with convergence zones and areas of upwelling (Archer 2002).
Striped dolphins are fairly gregarious (groups of 20 or more are common) and active at the surface
(Whitehead et al. 1998). Miyashita (1993a) reported groups as large as 1500 animals and a mean group
size of 121.4 for the western North Pacific. Mean group size was reported as 60.9 for the ETP (Wade and
Gerrodette 1993) and 50 for the Galápagos Islands (Smith and Whitehead 1999).

III. Affected Environment
Environmental Assessment for L-DEO’s Shatsky Rise Seismic Survey, 2012 Page 28
In the western North Pacific, striped dolphins are known to occur in the Philippines (Perrin et al.
2005), in the East and South China seas off China and Taiwan (Parsons et al. 1995; Zhou et al. 1995;
Chou 2004; Perrin et al. 2005), Hong Kong (Parsons et al. 1995; Jefferson and Hung 2007), and Japan
(Miyashita 1993a). In Japan, striped dolphins have been hunted in drive and harpoon fisheries for many
decades (Kasuya 2007). The abundance estimate for striped dolphins in the western North Pacific is
estimated at 570,000 (Miyashita 1993a). The striped dolphin was one of the most common dolphin
species seen during Japanese summer sighting surveys in the western North Pacific (Miyashita 1993a).
During these surveys, densities were highest in offshore areas between 35ºN and 40ºN, and in coastal
waters of southeastern Japan (Miyashita 1993a). Striped dolphins were seen in the proposed Shatsky Rise
study area in July, August, and September; survey effort in June was limited (Miyashita 1993a).
Fraser’s Dolphin (Lagenodelphis hosei)
Fraser‘s dolphin is a tropical species found between 30°N and 30°S (Dolar 2009). It only occurs
rarely in temperate regions, and then only in relation to temporary oceanographic anomalies such as El
Niño events (Perrin et al. 1994b). The species typically occurs in deep, oceanic waters. In the ETP, most
sightings were 45–100 km from shore in waters 1500–2500 m deep (Dolar 2009). Off Huahine and
Tahiti (Society Islands), it was observed in waters 500–1500 m deep (Gannier 2000).
Fraser‘s dolphins travel in groups ranging from just a few animals to 100 or even 1000 (Perrin et al.
1994b). Wade and Gerrodette (1993) reported a mean group size of 395 for the ETP. Fraser‘s dolphins
were seen during Japanese sighting surveys in the western North Pacific during August/September (Kato
et al. 2005). Fraser‘s dolphins are also known to occur in the Philippines and in the East and South China
seas off China and Taiwan (Perrin et al. 2005), as well as Hong Kong (Parsons et al. 1995; Jefferson and
Hung 2007). In the eastern Sulu Sea adjacent to the Philippines, abundance is estimated at 8700 (Dolar
1999 in Perrin et al. 2003). Given its habitat preferences, the Shatsky Rise area is probably at the
northern limit of the Fraser‘s dolphin‘s range. Therefore, it seems likely that any occurrence in the study
area would be rare.
Short-beaked Common Dolphin (Delphinus delphis)
The common dolphin is found in tropical and warm temperate oceans around the world (Perrin
2002b). It ranges as far south as 40°S in the Pacific Ocean, is common in coastal waters 200–300 m deep,
and is also associated with prominent underwater topography, such as seamounts (Evans 1994). There
are two species of common dolphins: the short-beaked common dolphin (Delphinus delphis) and the
long-beaked common dolphin (D. capensis). The short-beaked common dolphin is found in offshore
waters, and the long-beaked common dolphin is more prominent in coastal areas. Off northern New
Zealand, the short-beaked common dolphin is generally seen at a mean distance <10 km from shore in the
summer, but animals move further offshore in winter (Neumann 2001).
Common dolphins often travel in fairly large groups; schools of hundreds or even thousands are
common. Smith and Whitehead (1999) noted that common dolphins were frequently seen in waters near
the Galápagos Islands, with a mean group size of 125. Wade and Gerrodette reported a mean group size
of 472.8 in the southern portion of the ETP.
There are no abundance estimates for Delphinus for the western Pacific. During Japanese sighting
surveys in the western North Pacific in August/September, both long- and short-beaked common dolphins
have been seen (Kato et al. 2005). As the short-beaked common dolphin is found in offshore waters, it is
the most likely species of Delphinus to occur at the Shatsky Rise study area. Besides Japan, short-beaked
common dolphins have also been reported to occur off Taiwan (Rudolph and Smeenk 2002).

III. Affected Environment
Environmental Assessment for L-DEO’s Shatsky Rise Seismic Survey, 2012 Page 29
Pacific White-sided Dolphin (Lagenorhynchus obliquidens)
The Pacific white-sided dolphin is found throughout the temperate North Pacific, in a relatively
narrow distribution between 38°N and 47°N (Brownell et al. 1999). From surveys conducted in the North
Pacific, Buckland et al. (1993) estimated that there were a total of 931,000 Pacific white-sided dolphins,
and Miyashita (1993b) estimated an abundance of 988,000.
The species is common both on the high seas and along the continental margins (see Leatherwood
et al. 1984; Dahlheim and Towell 1994; Ferrero and Walker 1996). Pacific white-sided dolphins often
associate with other species, including cetaceans (especially Risso‘s and northern right whale dolphins;
Green et al. 1993), pinnipeds, and seabirds. Pacific white-sided dolphins are very inquisitive and may
approach stationary boats (Carwardine 1995).
Pacific-white sided dolphins have been seen during Japanese sighting surveys in the western North
Pacific in August/September (Kato et al. 2005). During the 1970s and 1980s, Pacific white-sided
dolphins were often killed as bycatch in the high-seas drift gillnet fisheries of the western North Pacific.
Those fisheries ceased to operate following the United Nations moratorium in 1993. Although the
estimates of abundance and levels of removal are not very precise, the number of Pacific white-sided
dolphins in the western North Pacific was probably not highly depleted as a result of that bycatch (Hobbs
and Jones 1993). Pacific white-sided dolphins are known to occur in the Shatsky Rise study area
(Buckland et al 1993).
Northern Right Whale Dolphin (Lissodelphis borealis)
The northern right whale dolphin is found in cool temperate and sub-arctic waters of the North
Pacific, ranging from 30°N to 50°N (Reeves et al. 2002). Their abundance has been estimated at 307,000
(Miyashita 1993b). In the North Pacific Ocean, the northern right whale dolphin is one of the most
common marine mammal species, occurring primarily in shelf and slope waters ~100 m to >2000 m deep
(see Green et al. 1993; Barlow 2003; Carretta et al. 2007). The northern right whale dolphin does,
however, come closer to shore where there is deep water, such as over submarine canyons (Carwardine
1995; Reeves et al. 2002). Northern right whale dolphins are gregarious, and groups of several hundred
to over a thousand dolphins are not uncommon (Reeves et al. 2002). They are often seen in mixed-
species schools with Pacific white-sided dolphins.
Northern right whale dolphins were seen during Japanese sighting surveys in the western North
Pacific in August/September (Kato et al. 2005). Like Pacific white-sided dolphins, northern right whale
dolphins were killed in large numbers as bycatch in the high-seas drift gillnet fisheries of the western
North Pacific. It seems likely that the number of northern right whale dolphins was noticeably reduced in
this region as a result. Although the magnitude of this reduction is uncertain, Mangel (1993) estimates
that it is likely to have been 30% or less of the pre-exploitation numbers. Northern right whale dolphins
are known to occur near the Shatsky Rise and are most likely to be encountered in the northern half of the
study area (Buckland et al. 1993).
Risso’s Dolphin (Grampus griseus)
Risso‘s dolphin is primarily a tropical and mid-temperate species distributed worldwide. It occurs
between 60ºN and 60ºS, where surface water temperatures are at least 10ºC (Kruse et al. 1999). In the
northern Gulf of Mexico, Risso‘s dolphin usually occurs over steeper sections of the upper continental
slope (Baumgartner 1997) in waters 150–2000 m deep (Davis et al. 1998). In Monterey Bay, California,
it is most numerous where there is steep bottom topography (Kruse et al. 1999). Risso‘s dolphins occur
individually or in small to moderate-sized groups, normally ranging from 2 to <250. The majority of

III. Affected Environment
Environmental Assessment for L-DEO’s Shatsky Rise Seismic Survey, 2012 Page 30
groups consist of <50 (Kruse et al. 1999; Miyashita 1993a). In the western North Pacific, Miyashita
(1993a) reported groups of 1 to 200 individuals and a mean group size of 32.6. Wade and Gerrodette
(1993) reported a mean group size of 12 in the ETP.
In the western Pacific, Risso‘s dolphins range from the Kuril Islands to New Zealand and Australia.
In Japan, Risso‘s dolphins are hunted in small cetacean drive and hand harpoon fisheries, as well as
small-type whaling operations (Kasuya 2007). Risso‘s dolphins are also known to occur in the
Philippines, off mainland China in the Yellow, East, and South China seas (Perrin et al. 2005), and
around Taiwan and Hong Kong (Parsons et al. 1995). The abundance in the western North Pacific has
been estimated at 838,000 (Miyashita 1993a). Risso‘s dolphins were regularly seen during Japanese
summer sighting surveys in the western North Pacific (Miyashita 1993a). Occurrence was patchy, but
high densities were observed in coastal waters, between 148ºE–157ºE, and east of 162ºE (Miyashita
1993a). Risso‘s dolphins have been sighted in the proposed Shatsky Rise study area in August and
September; effort in June and July was low, but they were also sighted near the study area during those
months (Miyashita 1993a).
Melon-headed Whale (Peponocephala electra)
The melon-headed whale is a pantropical and pelagic species that occurs mainly between 20ºN and
20ºS in offshore waters (Perryman et al. 1994). Melon-headed whales tend to occur in groups of 100–
500, but have also been seen in groups of up to 2000 (Jefferson et al. 2008). Wade and Gerrodette (1993)
reported a mean group size of 199 for the ETP. Melon-headed whales are commonly seen in mixed
groups with other cetaceans (Jefferson and Barros 1997).
Melon-headed whales have been seen during Japanese sighting surveys in the western North
Pacific in August/September (Kato et al. 2005). In the western North Pacific, melon-headed whales are
known to occur off mainland China in the East and South China seas, off Taiwan, and in the Philippines
(Perrin et al. 2005). There is little information on abundance for this species near the Shatsky Rise. The
study area is near the northern limit of its range; therefore, any occurrence would likely be rare.
Pygmy Killer Whale (Feresa attenuata)
The pygmy killer whale is distributed throughout tropical and subtropical oceans worldwide (Ross
and Leatherwood 1994; Donahue and Perryman 2002). In warmer water, it is usually seen close to the
coast (Wade and Gerrodette 1993), but it is also found in deep waters. In Hawaiian waters, the pygmy
killer whale is found in nearshore waters, but not in the offshore waters (Barlow 2006). In the Marquesas,
it was sighted in water 100 m deep (Gannier 2002). Pygmy killer whales tend to travel in groups of 15–
50, although herds of a few hundred have been sighted (Ross and Leatherwood 1994). Wade and
Gerrodette (1993) reported a mean group size of 27.9 in the ETP.
In the Northwest Pacific, the pygmy killer whale is frequently sighted off Hawaii and Japan
(Donahue and Perryman 2002). Kato et al. (2005) reported the occurrence of this species during Japanese
sighting surveys in the western North Pacific in August/September. The pygmy killer whale is also
known to occur off mainland China in the East China Sea (Perrin et al. 2005), in Taiwan (Zhou et al.
1995; Chou 2004; Wang and Yang 2006), and in the Philippines (Perrin et al. 2005). There is little
information on abundance for this species near the Shatsky Rise area. In general, pygmy killer whales are
uncommon and are unlikely to be encountered during the proposed seismic survey.

III. Affected Environment
Environmental Assessment for L-DEO’s Shatsky Rise Seismic Survey, 2012 Page 31
False Killer Whale (Pseudorca crassidens)
The false killer whale is found in all tropical and warmer temperate oceans, especially in deep, off-
shore waters (Odell and McClune 1999). However, it is also known to occur in nearshore areas (e.g.,
Stacey and Baird 1991). False killer whales travel in pods of 20–100 (Baird 2002), although groups of
several hundred are sometimes observed. Groups of 1–40 animals were mostly seen during sighting
surveys in the western North Pacific, although one group of ~500 animals was also sighted (Miyashita
1993a). Mean group sizes have been reported as 32.2 for the western North Pacific (Miyashita 1993a)
and 11.4 for the ETP (Wade and Gerrodette 1993).
Nothing is known of the stock structure of false killer whales in the North Pacific Ocean
(Miyashita 1993a). In the western Pacific, the false killer whale is distributed from Japan to Australia.
The false killer whale is hunted in Japan (Kasuya 2007). It is also known to occur in the Philippines and
in the Yellow, East, and South China seas off China and Taiwan (Perrin et al. 2005), and Hong Kong
(Parsons et al. 1995; Jefferson and Hung 2007). The abundance estimate for the western North Pacific is
16,000 (Miyashita 1993a). False killer whales have been seen during Japanese summer sighting surveys
(Miyashita 1993a). Distribution was patchy, with several high-density areas in offshore waters
(Miyashita 1993a). False killer whales have been sighted in the proposed Shatsky Rise study area in
August and September; survey effort was low in June and July, but animals were also seen near the study
area during those months (Miyashita 1993a).
Killer Whale (Orcinus orca)
The killer whale is cosmopolitan and globally fairly abundant; it has been observed in all oceans of
the world (Ford 2002). It is very common in temperate waters, and also frequents tropical waters, at least
seasonally (Heyning and Dahlheim 1988; Reeves et al. 1999). High densities of the species occur in high
latitudes, especially in areas where prey is abundant. Although resident in some parts of its range, the
killer whale can also be transient. Killer whale movements generally appear to follow the distribution of
their prey, which includes marine mammals, fish, and squid. Killer whales are large and conspicuous,
often traveling in close-knit matrilineal groups of a few to tens of individuals (Dahlheim and Heyning
1999). Wade and Gerrodette (1993) reported a mean group size of 5.4 in the ETP.
Very little is known about killer whale abundance and distribution in the western Pacific Ocean.
Miyashita and Kato (2005 in Kato et al. 2005) provided an abundance estimate of 720 for the Sea of
Okhotsk. Kato et al. (2005) reported sightings of this species during Japanese sighting surveys in the
western North Pacific in August/September. Killer whales are also known to occur off China in the
Yellow and East China seas (Zhou et al. 1995; Perrin et al. 2005), off Taiwan (Zhou et al. 1995; Chou
2004; Chou et al. 2007), and in the Philippines (Perrin et al. 2005). It is possible that killer whales could
be encountered during the Shatsky Rise survey.
Short-finned Pilot Whale (Globicephala macrorhynchus)
The short-finned pilot whale is found in tropical and warm temperate waters (Olson and Reilly
2002); it is seen as far south as ~40ºS, but is more common north of ~35ºS (Olson and Reilly 2002). Pilot
whales occur on the shelf break, over the slope, and in areas with prominent topographic features; they
are usually seen in groups of 20–90 (Olson and Reilly 2002). In the western North Pacific, Miyashita
(1993a) reported sightings of 10–300 animals, although most sightings were of groups with <100 animals.
Mean group sizes have been reported as 49.8 for the western North Pacific (Miyashita 1993a) and 18.3
for the ETP (Wade and Gerrodette 1993). Long-finned pilot whales outfitted with time-depth recorders
III. Affected Environment
Environmental Assessment for L-DEO’s Shatsky Rise Seismic Survey, 2012 Page 32
dove to depths up to 828 m, although most of their time was spent above depths of 7 m (Heide-Jørgensen
et al. 2002). The species‘ maximum recorded dive depth is 971 m (Baird pers. comm. in DoN 2005).
In the western North Pacific, short-finned pilot whales are known to occur off mainland China in
the South China Sea (Perrin et al. 2005), Taiwan (Miyashita et al. 1995 in Zhou et al. 1995; Chou 2004),
the Philippines (Acebes et al. 2000 in Perrin et al. 2005; Acebes and Lesaca 2003; Perrin et al. 2005), and
Japan (Miyashita 1993a). In Japan, they are taken by whalers in the drive fishery (Kasuya 2007). The
abundance of short-finned pilot whales has been estimated at 53,000 for the western North Pacific
(Miyashita 1993a). Stock structure of short-finned pilot whales has not been adequately studied in the
North Pacific, except in Japanese waters, where two stocks have been identified based on pigmentation
patterns and head shape differences of adult males (Kasuya et al. 1988). The southern stock of short-
finned pilot whales has been observed during Japanese summer sightings surveys (Miyashita 1993a).
Distribution of short-finned pilot whales in the western North Pacific was patchy, but high densities were
observed in coastal waters of central and southern Japan and in some areas offshore (Miyashita 1993a).
Short-finned pilot whales have also been seen in the proposed Shatsky Rise survey area in August and
September; survey effort in June and July was low, but animals were also seen near the study area during
those months (Miyashita 1993a).
Dall’s Porpoise (Phocoenoides dalli)
Dall‘s porpoise is only found in the North Pacific and adjacent seas. It is widely distributed across
the North Pacific over the continental shelf and slope waters, and over deep (>2500 m) oceanic waters
(Hall 1979), ranging from ~32ºN to 65ºN (Reeves et al. 2002). In general, this species is common
throughout its range (Buckland et al. 1993). Dall‘s porpoises usually occur in small groups of 2 to 12
individuals, characterized by fluid associations (Reeves et al. 2002). Dall‘s porpoises are fast-swimming
and active porpoises, and readily approach vessels to ride the bow wave.
Buckland et al. (1993) provided an abundance estimate of 1.3 million Dall‘s porpoises for the
North Pacific, and Miyashita (1991) estimated the abundance in the Sea of Okhotsk at 443,000. In the
western North Pacific, there are two different color morphs that are also considered sub-species: the truei-
type and the dalli-type. They can be distinguished from each other by the extent of their white thoracic
patches―the truei-type has a much broader patch, which extends nearly the length of the body. They
were one of the most common cetaceans in the bycatch of the central and western North Pacific high-seas
driftnet fisheries, but that source of mortality is not thought to have substantially depleted their abundance
in the region (Hobbs and Jones 1993). Currently, Dall‘s porpoises are hunted using hand harpoons by
Japanese whalers, with annual catch quotas of 17,300 animals from stocks that summer in the Okhotsk
Sea (Kasuya 2007). Dall‘s porpoise (of the dalli-type) that are known to occur at Shatsky Rise during
summer are from a different stock than those that summer in the Okhotsk Sea.
(3) Pinnipeds
Northern Fur Seal (Callorhinus ursinus)
The northern fur seal is endemic to the North Pacific Ocean, and it occurs from southern California
to the Bering Sea, the Okhotsk Sea, and Honshu Island, Japan. Two stocks are recognized, the Eastern
Pacific and the San Miguel Island stocks. The Eastern Pacific stock ranges from the Pribilof Islands and
Bogoslof Island in the Bering Sea during summer to the Channel Islands in Southern California during
winter. The population of northern fur seals has declined from a peak of ~2.1 million in the 1950s to ~1.1

III. Affected Environment
Environmental Assessment for L-DEO’s Shatsky Rise Seismic Survey, 2012 Page 33
million in 2004-2005 (Gelatt and Lowry 2008). The population estimate for the eastern Pacific stock in
2008 was ~665,550 (Allen and Angliss 2010).
During the breeding season, 74% of the worldwide population of northern fur seals inhabits the
Pribilof Islands in the southern Bering Sea (Lander and Kajimura 1982). A small percentage of seals
breed at San Miguel Island off southern California. When not on rookery islands, northern fur seals are
primarily pelagic but occasionally haul out on rocky shorelines. During the breeding season, adult males
usually come ashore in May–August and may sometimes be present until November, and adult females
are found ashore from June to November (Carretta et al. 2007). After reproduction, northern fur seals
spend the next 7–8 months feeding at sea (Roppel 1984). Once weaned, juveniles spend 2–3 years at sea
before returning to the rookeries. During that time, animals may migrate off Japan and California. The
southern extent of the migration is about 35ºN. Northern fur seals have been sighted in the Shatsky Rise
area (Buckland et al. 1993). However, it is likely that any occurrence at Shatsky Rise would be rare.
Seabirds
Only one ESA-listed seabird species, the endangered short-tailed albatross (Phoebastria albatrus),
could occur in or near the proposed study area.
(1) Short-tailed Albatross
Historically, millions of short-tailed albatrosses bred in the western North Pacific Ocean on islands
off the coast of Japan. This species was the most abundant albatross in the North Pacific. However, the
entire population was nearly extirpated during the last century by feather hunters at Japanese breeding
colonies. In addition, the breeding grounds of the remaining birds were threatened by volcanic eruptions
in the 1930s; this species was believed to be extinct in 1949 until it was rediscovered in 1951 (BirdLife
International 2010). Thus, the short-tailed albatross is currently listed as Endangered under the ESA and
Vulnerable on the IUCN Red List of Threatened Species (IUCN 2011). However, this population is
increasing, and the most recent population estimate is 2406 individuals (USFWS 2008). Current threats
to this population include volcanic activity on Torishima, commercial fisheries, and pollutants (USFWS
2008).
Currently, nearly all short-tailed albatrosses breed on two islands off the coast of Japan―Torishima
and Minami-kojima (UWFWS 2008; BirdLife International 2011). Single nests have been found in
recent years on other islands, including Kita-Kojima, Senkaku; Yomejima Island; and Midway Island,
Hawaii (USFWS 2008). During the breeding season (December to May), the highest densities are found
around Japan (BirdLife International 2011); parents forage primarily off the east coast of Honshu Island,
where the warm Kuroshio and the cold Oyashio currents meet (USWS 2008).
During the non-breeding season, short-tailed albatrosses roam much of the North Pacific Ocean;
females spend more time offshore of Japan and Russia, while males and juveniles spend more time
around the Aleutian Islands and Bering Sea (Suryan et al. 2007). Post-breeding dispersal occurs from
April through August (USWFS 2001). After leaving the breeding areas, short-tailed albatrosses seem to
spend the majority of time within the exclusive economic zones of Japan, Russia, and the U.S. (Aleutian
Islands and Bering Sea) (Suryan et al. 2007). Thus, they are considered a continental shelf-edge specialist
(Piatt et al. 2006). However, Suryan et al. (2006) reported that short-tailed albatrosses occasionally
transit the northern boundary of the Kuroshio Extension in May while en route to the Aleutians and
Bering Sea, but that they do not spend much time in the area. Thus, some sightings of short-tailed
albatrosses have been reported near the study area (USWFS 2001, 2008; Suryan et al. 2006, 2007). Given

III. Affected Environment
Environmental Assessment for L-DEO’s Shatsky Rise Seismic Survey, 2012 Page 34
the relatively small population size, the large pelagic range of this species, and the far offshore location of
the study area, the occurrence of short-tailed albatrosses in the study area would be considered rare.
Sea Turtles
Five species of sea turtle may occur in the Shatsky Rise study area. In order of decreasing
likelihood they are: the loggerhead (Caretta caretta), leatherback (Dermochelys coriacea), olive ridley
(Lepidochelys olivacea), green (Chelonia mydas), and hawksbill (Eretmochelys imbricata) turtles (Chan
et al. 2007). Loggerhead and leatherback turtles can spend substantial amounts of time offshore during
migrations or feeding between breeding seasons, including the North Pacific and specifically in the
vicinity of Shatsky Rise. Olive ridley turtles tend to remain in coastal areas or offshore at lower latitudes
than the Shatsky Rise; however, this species is widespread and little is known of its offshore habits.
Green and hawksbill turtles are unlikely to inhabit the Shatsky Rise region in favor of more tropical
latitudes. All sea turtle species have special conservation status with the IUCN and under the U.S. ESA.
(1) Loggerhead Turtle
The loggerhead sea turtle is listed as Threatened under the ESA, primarily because of recent
population declines from direct take, incidental capture in various fisheries, and the alteration and
destruction of its coastal nesting habitat (NMFS 2002). It is listed as Endangered on the IUCN Red List
of Threatened Species (IUCN 2011) and is listed in CITES Appendix I (UNEP-WCMC 2011). The
global loggerhead population is estimated to include 43,320 to 44,560 nesting females (Spotila 2004).
The loggerhead turtle is widely distributed, generally occurring in coastal tropical and subtropical
waters around the world. Loggerhead nests in the Pacific Ocean basin are restricted to the western region,
principally in Japan and Australia (or New Caledonia) where stocks are genetically distinct (NMFS and
USFWS 2007a). They also nest in China (EuroTurtle 2008). In Japan, loggerheads nest on Honshu,
Shikoku, Kyushu, and the Ryukyu Islands (Sea Turtle Association of Japan 2010). Surveys for nesting
turtles conducted on Okinawa and adjacent islands of the central Ryukyus between 1995 and 1996 found
47 clutches belonging to loggerheads (Kikukawa et al. 1996). Loggerhead nesting along the Japanese
coast occurs from April to August, with a peak in July. Nesting beaches are located at least 1200 km
from the proposed survey site at Shatsky Rise.
Loggerheads typically spend two to six years foraging at sea before returning to coastal areas to
breed (NMFS 2002). During their sea-going phase, they undertake long migrations and at times occur far
offshore and far from their breeding grounds. For example, some loggerheads seen feeding along Baja
California have been tracked genetically and by satellite telemetry; these have been shown to come from
Japanese breeding sites (Bowen et al. 1995; Resendiz et al. 1998; Nichols et al. 2000). Apparently, they
gather along the Baja coast to capitalize on an abundance of nutrient-rich prey, like pelagic red crabs
(Pleuroncodes planipes) that accumulate in local zones of upwelling (Bowen et al. 1995).
Loggerheads may pass Shatsky Rise on both eastward and westward legs of their trans-Pacific
migration. On the eastward leg, juveniles are likely entrained by the Kuroshio Extension and carried
directly to the Shatsky Rise where the Kuroshio bifurcates (Polovina et al. 2006). Juvenile loggerheads
appear to linger in this area for months to forage in nutrient-rich surface waters (from fall to winter, and
spring) (Polovina et al. 2006). In summer, when surface waters are oligotrophic (i.e., depleted of
nutrients), it is less likely that loggerheads will be encountered in the Shatsky Rise area.
III. Affected Environment
Environmental Assessment for L-DEO’s Shatsky Rise Seismic Survey, 2012 Page 35
Once sexually mature, loggerheads depart feeding grounds near California and begin their long,
slow journey back to natal beaches in Japan (Bowen et al. 1995; Nichols et al. 2000). Traveling <2 km/h,
loggerheads appear to migrate along nutrient-rich, oceanic fronts in the north Pacific (Nichols et al. 2000;
Polovina et al. 2000; Kobayashi et al. 2008). This preferred route, counter the North Pacific Current and
past the Hawaiian Islands, returns loggerheads to the Shatsky Rise region where they are susceptible as
bycatch to local longliners seeking tuna, swordfish, and sharks (Lewison et al. 2004; Yokota et al. 2006).
After returning to Japan to breed, adult loggerheads tend to remain in the western Pacific, migrating
annually between nesting beaches in Japan and feeding grounds in the South and East China Seas (Sato et
al. 1997; Nichols 2005; Parker et al. 2005).
Loggerheads feed in all marine habitats, including coastal bays and estuaries, shallow water along
the continental shelves, and high-seas (Bowen et al. 1995; Yokota et al. 2006; Reich et al. 2009). Adult
loggerheads feed on a variety of benthic fauna like conchs, crabs, shrimp, sea urchins, sponges, and fish.
During migrations through the open sea they feed primarily in surface waters on jellyfish, pteropods,
floating mollusks, floating egg clusters, flying fish, and squid (Polovina et al. 2003, 2004).
The Shatsky Rise region tends to accumulate juvenile loggerheads for weeks to months on their
outgoing migration to the North and East Pacific (Polovina et al. 2006). Adults likely migrate past this
region upon return to nesting sites in Japan. Because loggerheads feed as they migrate, they can be
attracted to the juvenile fish and squid used as bait on longlines, and are thus regularly hooked as bycatch
by Japanese fishers far offshore in the Kuroshio Extension (Lewison et al. 2004; Yokota et al. 2006).
On average, loggerheads spend over 90% of their time underwater, although diving time and depth
varies considerably with age and whether individuals are in coastal or high-sea habitats (Byles 1988;
Renaud and Carpenter 1994). Juveniles spend more time on the surface in deep, offshore areas than in
shallow, nearshore waters, possibly because they tend to migrate in the former and forage in the latter
(Lutcavage and Lutz 1997). In the North Pacific, two loggerheads (tagged with satellite-linked depth
recorders) spent about 40% of their time within 1 m of the surface, and although they were recorded
plunging as deep as 100 m, 70% of dives were to depths less than 5 m (Polovina et al. 2003; Spotila
2004). Offshore of Japan, two adult loggerheads stayed within 30 m of the surface while feeding between
nesting seasons (Sakamoto et al. 1993). Routine dives can last 4 to 172 min (Byles 1988; Sakamoto et al.
1990; Renaud and Carpenter 1994).
(2) Leatherback Turtle
The leatherback turtle is listed as Endangered under the U.S. ESA and Critically Endangered on
the IUCN Red List of Threatened Species (IUCN 2011), and is listed in CITES Appendix I (UNEP-
WCMC 2011). The world leatherback population is estimated to have 35,860 females (Spotila 2004).
There has been a significant decline and some extirpations of nesting populations in the Pacific (Spotila et
al. 2000; Dutton et al. 2007).
The leatherback is the largest and most widely distributed sea turtle, ranging far from its tropical
and subtropical breeding grounds to feed (Plotkin 2003). Frair et al. (1972) and Greer et al. (1973) noted
that leatherback turtles have evolved physiological and anatomical adaptations to cold water, allowing
them to venture into higher latitudes than other species of turtle. Leatherbacks have been reported from
71°N to 42°S in the Pacific Ocean (NMFS and USFWS 1998a, 2007b).
Similar to loggerhead turtles, adult leatherbacks appear to migrate along bathymetric contours from
200 to 3500 m (Morreale et al. 1994). Adults spend the majority of their time in waters >1000 m deep
and possibly swim more than 10,000 km each year (Eckert 1995 in NMFS 2002). They appear to use the

III. Affected Environment
Environmental Assessment for L-DEO’s Shatsky Rise Seismic Survey, 2012 Page 36
Kuroshio Extension during migrations from Indonesia to the high seas and East Pacific (Benson et al.
2008). Female leatherbacks approach coastal waters only during the reproductive season, whereas males
are rarely observed near nesting sites (NMFS 2002).
The largest remaining nesting sites for leatherbacks in the Pacific Ocean occur on the beaches of
Birdshead Peninsula in Papua, Indonesia (Benson et al. 2008). Leatherbacks also nest in New Guinea, the
Solomon Islands, and Vanuatu, with fewer nesting in Fiji, Malaysia, and Australia (EuroTurtle 2008;
NMFS and USFWS 2007b). Nesting leatherbacks were recently discovered in Japan; thus, the closest
nesting site to the Shatsky Rise is ~2500 km away, along the coast of the Ryukyu Islands (Kamezaki et al.
2002). In the eastern Pacific, leatherbacks nest along the west coast of Mexico and Central America
(EuroTurtle 2008). Hatchling leatherbacks are pelagic, but nothing is known about their distribution for
the first four years (Musick and Limpus 1997).
Leatherbacks tend to feed in areas of high productivity, such as current fronts and upwelling areas,
along continental margins, and in archipelagic waters (Morreale et al. 1994; Lutcavage 1996).
Leatherbacks feed mainly on jellyfish, tunicates, and other epipelagic soft-bodied invertebrates
(Davenport and Balazs 1991). Predation on squid is inferred by incidental, long-line catches with squid
used as bait (Skillman and Balazs 1992).
Although nesting is limited in Japan, leatherbacks are sighted off the coast at various times of the
year (Sea Turtle Association of Japan 2010). Given the patchy distribution of high biomass areas
associated with the Kuroshio Extension and bifurcation, combined with the apparent leatherback
migration corridor along oceanic fronts in the north Pacific, leatherbacks are likely to appear occasionally
in the Shatsky Rise region to feed much like loggerheads and other predators (Polovina et al. 2000;
Komatsu et al. 2002; Yokota et al. 2006). However, to the best of our knowledge, leatherbacks have not
been seen in the Shatsky Rise region, nor have they been caught by longliners fishing the Kuroshio
Extension (e.g., Yokota et al. 2006).
Leatherback turtles are known to dive deeper than 1000 m, spending little time near the surface
between subsequent dives (Eckert et al. 1986; Eckert et al. 1989; Southwood et al. 1998). Off Playa
Grande, Costa Rica, six inter-nesting female leatherbacks spent 57–68% of their time underwater, diving
at a mean depth of 19 m for 7.4 min (Southwood et al. 1998 in NMFS 2002). Offshore of St. Croix, six
inter-nesting females dove to a mean depth of 61.6 m for an average of 9.9 min, and post-dive surfacing
intervals averaged 4.9 min (Eckert et al. 1989). During shallow-water diving in the South China Sea,
typical dive durations averaged 6.9 to 14.5 min, with a maximum of 42 min (Eckert et al. 1996). Off
central California, leatherbacks dove to 20 to 30 m with a maximum of 92 m, corresponding to the
vertical distribution if their prey, and mean dive and surface durations were 2.9 and 2.2 min, respectively
(Harvey et al. 2006).
(3) Olive Ridley Turtle
The olive ridley turtle is listed as Vulnerable on the IUCN Red List of Threatened Species (IUCN
2011) and is listed in CITES Appendix I (UNEP-WCMC 2011). Under the U.S. ESA, the Mexico-Pacific
breeding populations are listed as Endangered; all other populations are listed as Threatened. The
worldwide population is estimated at about two million nesting females, making it the most abundant sea
turtle in the world despite ongoing population declines (Spotila 2004).
The olive ridley turtle has a large range in tropical and subtropical regions in the Pacific, Indian,
and South Atlantic oceans, and is generally found between 40ºN and 40ºS. In the western Pacific, nesting
colonies occur in the Philippines and northern Australia (EuroTurtle 2008), Papua New Guinea (Spring
III. Affected Environment
Environmental Assessment for L-DEO’s Shatsky Rise Seismic Survey, 2012 Page 37
1995), Brunei, Malaysia, Indonesia, and Vietnam (Spotila 2004). They do not nest in Japan. In the
eastern Pacific, the largest nesting concentrations occur in southern Mexico and northern Costa Rica, with
stragglers nesting as far north as southern Baja California (Fritts et al. 1982) and as far south as Peru
(Brown and Brown 1982). Most olive ridleys nest synchronously in huge colonies (1000s of individuals)
called arribadas, although solitary nesting females are also common (Kalb and Owens 1994). Females
generally lay two clutches of eggs with an inter-nesting period of one to two months throughout the year,
peaking in the eastern Pacific during September to December (Plotkin et al. 1994b; NMFS and USFWS
1998b). Arribadas are not known to occur in the western Pacific (Spotila 2004). The olive ridley is the
most abundant sea turtle found in the high seas of the ETP, where it can be seen foraging or mating in
groups exceeding 1000 individuals called flotillas (Pitman 1990, 91; Arenas and Hall 1991; Kopitsky et
al. 2000; NMFS 2002). Satellite tags on olive ridleys from Costa Rica were tracked more than 3000 km
offshore in the central Pacific (Plotkin et al. 1994a).
Although olive ridleys aggregate during breeding seasons (peaking in August and September), they
tend to disperse offshore when not breeding. Thus, little is know of their behaviors or migratory patterns
during these times. In general, it is believed that olive ridleys do not return to specific offshore foraging
areas, but that they are nomadic and occupy a series of feeding areas (Plotkin et al. 1994a,b).
Presumably, olive ridleys are attracted to offshore areas of high productivity (e.g., current front and back-
eddies of the Kuroshio Extension and bifurcation; e.g., akin to loggerheads, Polovina et al. 2006).
However, to the best of our knowledge, olive ridleys have not been seen in the Shatsky Rise region, nor
have they been caught by longliners fishing the Kuroshio Extension (e.g., Yokota et al. 2006). However,
they are known to occur off the coast of Japan at various times of the year (Sea Turtle Association of
Japan 2010).
Olive ridleys are primarily carnivorous, feeding on crabs, jellyfish, and fish eggs, resorting to algae
when prey is scarce. They are often associated with flotsam in high seas, possibly feeding on associated
fish and invertebrates (Pitman 1992). They are generally thought to be surface feeders, but have also
been caught in trawls at depths of 80–110 m (NMFS and USFWS 1998b, 2007c). Coastal fishery bycatch
in waters around Penghu showed that coral reefs can also be foraging grounds for olive ridleys (Chen et
al. 2004). After feeding (usually in the morning), olive ridleys spend considerable time basking in the sun
near the sea surface, presumably in an effort to speed metabolism and digestion after a deep dive (Spotila
2004).
Olive ridleys are primarily a pelagic species (NMFS 2008a), capable of hunting at considerable
depths (80–300 m), although ~90% of their time is spent in depths <100 m (Eckert et al. 1986; Polovina
et al. 2003). In the ETP, at least 25% of total dive time is within the permanent thermocline, located at a
depth of 20 to 100 m (Parker et al. 2003). In the North Pacific, two olive ridleys tagged with satellite-
linked depth recorders spent ~20% of time in the top meter and ~10% of time deeper than 100 m; 70% of
the dives were no deeper than 5 m (Polovina et al. 2003). Olive ridleys are also found regularly at the sea
surface near flotsam, which probably acts as shelter and also habitat for prey items like small fish and
invertebrates (Pitman 1992). Olive ridleys generally feed in the morning and bask near the surface in the
afternoon sun (Spotila 2004).
(4) Green Turtle
The green turtle is listed as Endangered on the IUCN Red List of Threatened Species (IUCN
2011) and is listed in CITES Appendix I (UNEP-WCMC 2011). Except for the Endangered population
nesting on the Pacific coast of Mexico, this species is listed as Threatened under the U.S. ESA
III. Affected Environment
Environmental Assessment for L-DEO’s Shatsky Rise Seismic Survey, 2012 Page 38
throughout its Pacific range. The global population is estimated between 88,520 and 150,000 nesting
females (Spotila 2004; NMFS and USFWS 2007d), reduced by 50 to 70% since 1900 (Spotila 2004).
Some authorities treat the black turtle (Chelonia agassizii) as a separate species, but most recognize
the black turtle as a subspecies of green turtle (Karl and Bowen 2001). Regardless, the green turtle is
widely distributed in tropical and subtropical waters near continental coasts and around islands, including
mainland China, Taiwan, Philippines, and Japan (Chan et al. 2007). In Japan, these turtles nest at
Okinawa and adjacent islands of the central Ryukyus, as well as in the Ogasawara Islands (Chan et al.
2007). To the best of our knowledge, they have not been seen in the Shatsky Rise region, nor have they
been caught by longliners fishing the Kuroshio Extension (e.g., Yokota et al. 2006). Shatsky Rise is
probably too far north and offshore to be inhabited by green turtles.
Green turtles typically migrate along coastal routes from rookeries in Australia and the South
China Sea to their feeding grounds, although some populations exhibit trans-oceanic migrations
(EuroTurtle 2008; Chan et al. 2007). The closest nesting ground to Shatsky Rise is at least 1200 km
away. In 1995 and 1996, surveys of Okinawa and the central Ryukyus, Japan, found five clutches
belonging to green turtles (Kikukawa et al. 1996). The nesting period in this area seems to range from
mid-May to mid-July (Kikukawa et al. 1996). In Taiwan, green turtles principally nest on Wan-an Island
in the Penghu Archipelago and Lanyu Island in Taitung County (Cheng 1997 in Chan et al. 2007). Wan-
an Island hosts a small rookery, which has had 2 to 19 nesting females annually from 1992 to 2005 (Chen
and Cheng 1995). The small green turtle rookery on Lanyu Island hosts between 5 and 13 nesting
females per season. Females show high nest-site fidelity, returning repeatedly to their natal beach to lay
eggs. Nesting can occur throughout the year, but peaks between July and August (Cheng 2002). Juvenile
and sub-adult green turtles can travel thousands of kilometers before they return to breeding and nesting
grounds (Carr et al. 1978).
Green turtles feed during the day on seagrass and algae (Bjorndal 1982), and are thus typically
associated with seagrass pastures, shallow inland waters, and coral reefs. However, some green turtles
remain in pelagic regions, feeding mostly on jellyfish and other pelagic prey (NMFS and USFWS 2007d).
Satellite telemetry showed that the foraging grounds of adult green turtles nesting at Wan-an Island
included the coastal waters off northern Taiwan, Nanao Island, Huidong, Hong Kong, Donsha
Archipelago, Hainan Island, east coast of Leizhou Peninsula, northern Philippines, Ryukyu Archipelago
(Japan), and Koshiki in southern Japan (Cheng et al. 2000; Cheng and Chen 1997). One post-nesting
green turtle from Wan-an Island and another from Gangkou Sea Turtle National Reserve spent time in the
nearshore waters of Okinawa Island, Japan (Cheng 2000a; Song et al. 2002). The northeastern waters of
Okinawa Island are also known foraging sites for green turtles. The coastal fishery bycatch in Penghu
waters showed that coral reefs also act as a foraging site for juvenile and subadult green turtles (Chen et
al. 2004).
Hatchling green turtles are epipelagic (surface dwelling in the open sea) for the first one to three
years. Subsequently, most inhabit shallow bays and protected shorelines. Green turtles typically dive
less than 30 m deep (Hochscheid et al. 1999; Hays et al. 2000), although they have been recorded diving
from 73 to 110 m in the eastern Pacific (Berkson 1967). The maximum dive time recorded for a juvenile
green turtle was 66 min offshore of Hawaii, with routine dive times of 9 to 23 min (Brill et al. 1995).
(5) Hawksbill Turtle
The hawksbill turtle is listed as Endangered under the U.S. ESA and Critically Endangered on the
IUCN Red List of Threatened Species (IUCN 2011), and is listed in CITES Appendix I (UNEP-WCMC

III. Affected Environment
Environmental Assessment for L-DEO’s Shatsky Rise Seismic Survey, 2012 Page 39
2011), and it is considered endangered under the U.S. ESA. It is a solitary nester, which makes
population estimates difficult. Nonetheless, the global population is thought to consist of 20,000 to
26,000 nesting females, reduced by >90% in the past 100 years (Spotila 2004).
Hawksbill turtles are typically associated with clear, coastal waters of mainland and island shelves,
seagrass pastures, and coral reefs (Márquez 1990). Perhaps their closest inhabited range to the Shatsky
Rise is in the Yellow and East China seas, including the Ryukyu Islands, Japan (Frazier et al. 1988).
Hawksbills are known to nest at the Ryukyu Islands (Sea Turtle Association of Japan 2010). A small
rookery (4 to 10 females) is also known on the Dongsha Archipelago, Taiwan (Cheng 1995, 2000b). The
closest large rookery (with >1000 females) to the proposed Shatsky Rise study area is probably in
Indonesia (Márquez 1990). It is expected that only post-hatchling hawksbills are likely to be found in the
offshore waters of Shatsky Rise, taking shelter in weed lines around convergence zones before returning
to coastal waters when they are 25 to 35 cm long (NMFS and USFWS 1998c). However, the offshore
habit of juvenile hawksbills is not known (NMFS 2008b). It may be more likely to find an adult
hawksbill near Shatsky Rise, perhaps transported by the warm Kuroshio Extension during an inter-
breeding migration to feed (NMFS and USFWS 1998c, 2007e).
Hawksbill turtles are generalist carnivores, feeding on a variety of prey like corals, tunicates, algae,
sponges, hydroids, gastropods, cephalopods, decapods, ascidians, and barnacles (Márquez 1990). In
some areas, hawksbills may be specialist sponge feeders (e.g., Vicente 1994). These turtles typically feed
by picking prey from substrates like rocks and reefs; thus, they are found regularly in coastal areas with
suitable habitats for this feeding strategy like coral reefs and shallow seagrass pastures (Chen et al. 2004).
Closest to the Shatsky Rise region, hawksbills appear to feed in waters surrounding Nanao Island and
Dongshan Island in the East and South China seas (Xu and Zheng 2000 in Chan et al. 2007), and the
inshore waters of Pingtan Island, Dongshan Island, and the Ryukyus, Japan (Zheng 1985; AFCD 2005).
Hawksbills move from shallow to deeper water (<200 m) as they grow (NMFS and USFWS
1998c). They have very long routine dive times; inter-nesting females in St. Croix averaged 56 min
underwater with a maximum dive time of 73.5 min and an average surface interval of about 2 min
(Starbird et al. 1999). Average day and night dive times were 34 to 65 and 42 to 74 min, respectively.
Based on time-depth recorder studies in Puerto Rico, foraging dives of immature hawksbills varied
between 8.6 to 14 min with a mean depth of 4.7 m (van Dam and Diez 1996).
(6) Summary
Loggerhead, leatherback, and possibly olive ridley turtles could be encountered near Shatsky Rise.
Green and hawksbill turtles are distributed in lower latitudes, tend to remain closer to shore, and are thus
less likely to be encountered unless carried offshore to Shatsky Rise by a strong easterly current like the
Kuroshio Extension.
The only sea turtle species identified near Shatsky Rise is the loggerhead, caught as bycatch by
longliners fishing the Kuroshio Extension (see Lewison et al. 2004; Polovina et al. 2006; Yokota et al.
2006). Loggerheads are likely attracted to the various oceanic fronts and eddies associated with the
Kuroshio Extension and its bifurcation near Shatsky Rise, because fronts and eddies tend to accumulate
pelagic organisms and promote upwelling (and primary production), respectively. Moreover, these
biological hotspots appear to be important for species spending prolonged periods offshore to migrate and
feed, like loggerhead and leatherback turtles (Reich et al. 2009). The productive surface waters of the
Kuroshio Extension also attract other top predators like swordfish and blue sharks (Yokota et al. 2006).

III. Affected Environment
Environmental Assessment for L-DEO’s Shatsky Rise Seismic Survey, 2012 Page 40
The Kuroshio bifurcation (west of Shatsky Rise) may be an important nursery area for anchovy and
sardine spawn that are carried offshore from Japan by the Kuroshio Extension, especially during periods
of high stock abundance (Komatsu et al. 2002). Incidentally, juvenile loggerheads―known to feed on
small fish (Yokota et al. 2006)―also aggregate in this area in fall, winter, and spring when surface waters
have high productivity; in summer, when surface productivity near Shatsky Rise is low, they migrate
north (Polovina et al. 2006).
Sea surface temperature and chlorophyll a concentration (the latter is a measure of primary
productivity) are the two best predictors of loggerhead migration corridors in the north Pacific (Kobayashi
et al. 2008). For example, loggerheads aggregate within the Kuroshio Extension at temperatures 19–
24.5ºC, and along 17 and 20ºC current fronts near Hawaii during trans-Pacific migrations (Polovina et al.
2000). This corroborates observations nearshore, since loggerheads tend to accumulate in areas of coastal
upwelling where ocean productivity is high (Bowen et al. 1995).
Loggerhead turtles departing from nesting sites along Japan are known to drift with strong currents
offshore, as far as the Kuroshio Extension bifurcation near the Shatsky Rise (Ikeda 2008). Similarly,
leatherbacks appear to use the Kuroshio Extension during migrations from Indonesia to the high seas and
East Pacific (Benson et al. 2008). Conversely, loggerheads and leatherbacks may migrate past the
Shatsky Rise upon return from high seas to Japanese nesting grounds (Bowen et al. 1995; Nichols et al.
2000). Accordingly, satellite telemetry has shown that loggerheads are capable of trans-Pacific
migrations, from Baja California to Japan, possibly using the subtropical frontal zone as a migratory
corridor (Resendiz et al. 1998; Nichols et al. 2000). Moreover, loggerheads have been followed while on
against-current migrations (i.e., westward across the Pacific), apparently favoring corridors along current
fronts, like that between the Subarctic and Subtropical Gyres in the north Pacific (Polovina et al. 2000).
All turtle species nest on island and mainland beaches, not at sea. Thus, the offshore Shatsky Rise
study area is located far from any nesting beaches. The closest nesting site to Shatsky Rise is at least
2500 km away.
IV. ENVIRONMENTAL CONSEQUENCES
Proposed Action
(1) Direct Effects and Their Significance on Marine Mammals and Sea Turtles
The material in this section includes a summary of the anticipated effects (or lack thereof) on
marine mammals and sea turtles of the airgun system to be used by L-DEO. A more detailed review of
airgun effects on marine mammals appears in Appendix B. That Appendix is similar to corresponding
parts of previous EAs and associated IHA applications concerning other L-DEO seismic surveys since
2003, but was updated in 2009. Appendix C contains a general review of the effects of seismic pulses on
sea turtles. This section (along with Appendix B) also includes a discussion of the potential impacts of
operations by L-DEO‘s MBES and SBP.
Finally, this section includes estimates of the numbers of marine mammals that could be affected
by the proposed seismic survey. A description of the rationale for L-DEO‘s estimates of the numbers of
exposures to various received sound levels that could occur during the planned seismic program is also
provided.
IV. Environmental Consequences
Environmental Assessment for L-DEO’s Shatsky Rise Seismic Survey, 2012 Page 41
(a) Summary of Potential Effects of Airgun Sounds
The effects of sounds from airguns could include one or more of the following: tolerance, masking
of natural sounds, behavioral disturbance, and at least in theory, temporary or permanent hearing impair-
ment, or non-auditory physical or physiological effects (Richardson et al. 1995; Gordon et al. 2004;
Nowacek et al. 2007; Southall et al. 2007). Permanent hearing impairment, in the unlikely event that it
occurred, would constitute injury, but temporary threshold shift (TTS) is not an injury (Southall et al.
2007). Although the possibility cannot be entirely excluded, it is unlikely that the project would result in
any cases of temporary or especially permanent hearing impairment, or any significant non-auditory
physical or physiological effects. Some behavioral disturbance is expected, but this would be localized
and short-term.
Tolerance.―Numerous studies have shown that pulsed sounds from airguns are often readily
detectable in the water at distances of many kilometers. For a summary of the characteristics of airgun
pulses, see Appendix B (3). Several studies have shown that marine mammals at distances more than a
few kilometers from operating seismic vessels often show no apparent response—see Appendix B (5).
That is often true even in cases when the pulsed sounds must be readily audible to the animals based on
measured received levels and the hearing sensitivity of that mammal group. Although various baleen
whales and toothed whales have been shown to react behaviorally to airgun pulses under some conditions,
at other times mammals of both types have shown no overt reactions. The relative responsiveness of
baleen and toothed whales are quite variable. During active seismic surveys, sea turtles typically do not
show overt reactions to airgun pulses.
Masking.―Masking effects of pulsed sounds (even from large arrays of airguns) on marine
mammal calls and other natural sounds are expected to be limited, although there are very few specific
data on this. Because of the intermittent nature and low duty cycle of seismic pulses, animals can emit
and receive sounds in the relatively quiet intervals between pulses. However, in exceptional situations,
reverberation occurs for much or all of the interval between pulses (e.g., Simard et al. 2005; Clark and
Gagnon 2006), which could mask calls. Some baleen and toothed whales are known to continue calling
in the presence of seismic pulses, and their calls usually can be heard between the seismic pulses (e.g.,
Richardson et al. 1986; McDonald et al. 1995; Greene et al. 1999a,b; Nieukirk et al. 2004; Smultea et al.
2004; Holst et al. 2005a,b, 2006; Dunn and Hernandez 2009). However, Clark and Gagnon (2006)
reported that fin whales in the northeast Pacific Ocean went silent for an extended period starting soon
after the onset of a seismic survey in the area. Similarly, there has been one report that sperm whales
ceased calling when exposed to pulses from a very distant seismic ship (Bowles et al. 1994). However,
more recent studies found that sperm whales continued calling in the presence of seismic pulses (Madsen
et al. 2002; Tyack et al. 2003; Smultea et al. 2004; Holst et al. 2006; Jochens et al. 2008). Dolphins and
porpoises commonly are heard calling while airguns are operating (e.g., Gordon et al. 2004; Smultea et al.
2004; Holst et al. 2005a,b; Potter et al. 2007). The sounds important to small odontocetes are predom-
inantly at much higher frequencies than are the dominant components of airgun sounds, thus limiting the
potential for masking. In general, masking effects of seismic pulses are expected to be minor, given the
normally intermittent nature of seismic pulses. Masking effects on marine mammals are discussed further
in Appendix B (4). We are not aware of any information concerning masking of hearing in sea turtles.
Disturbance Reactions.―Disturbance includes a variety of effects, including subtle to conspicuous
changes in behavior, movement, and displacement. Based on NMFS (2001, p. 9293), NRC (2005), and
Southall et al. (2007), we assume that simple exposure to sound, or brief reactions that do not disrupt
behavioral patterns in a potentially significant manner, do not constitute harassment or ―taking‖. By
IV. Environmental Consequences
Environmental Assessment for L-DEO’s Shatsky Rise Seismic Survey, 2012 Page 42
potentially significant, we mean ―in a manner that might have deleterious effects to the well-being of
individual marine mammals or their populations‖.
Reactions to sound, if any, depend on species, state of maturity, experience, current activity, repro-
ductive state, time of day, and many other factors (Richardson et al. 1995; Wartzok et al. 2004; Southall
et al. 2007; Weilgart 2007). If a marine mammal does react briefly to an underwater sound by changing
its behavior or moving a small distance, the impacts of the change are unlikely to be significant to the
individual, let alone the stock or population. However, if a sound source displaces marine mammals from
an important feeding or breeding area for a prolonged period, impacts on individuals and populations
could be significant (e.g., Lusseau and Bejder 2007; Weilgart 2007). Given the many uncertainties in
predicting the quantity and types of impacts of noise on marine mammals, it is common practice to
estimate how many mammals would be present within a particular distance of industrial activities and/or
exposed to a particular level of industrial sound. In most cases, this approach likely overestimates the
numbers of marine mammals that would be affected in some biologically-important manner.
The sound criteria used to estimate how many marine mammals might be disturbed to some
biologically-important degree by a seismic program are based primarily on behavioral observations of a
few species. Detailed studies have been done on humpback, gray, bowhead, and sperm whales. Less
detailed data are available for some other species of baleen whales and small toothed whales, but for
many species there are no data on responses to marine seismic surveys.
Baleen Whales
Baleen whales generally tend to avoid operating airguns, but avoidance radii are quite variable.
Whales are often reported to show no overt reactions to pulses from large arrays of airguns at distances
beyond a few kilometers, even though the airgun pulses remain well above ambient noise levels out to
much longer distances. However, as reviewed in Appendix B (5), baleen whales exposed to strong noise
pulses from airguns often react by deviating from their normal migration route and/or interrupting their
feeding and moving away. In the cases of migrating gray and bowhead whales, the observed changes in
behavior appeared to be of little or no biological consequence to the animals. They simply avoided the
sound source by displacing their migration route to varying degrees, but within the natural boundaries of
the migration corridors.
Studies of gray, bowhead, and humpback whales have shown that seismic pulses with received levels
of 160–170 dB re 1 µParms seem to cause obvious avoidance behavior in a substantial fraction of the
animals exposed (Richardson et al. 1995). In many areas, seismic pulses from large arrays of airguns
diminish to those levels at distances ranging from 4 to 15 km from the source. A substantial proportion of
the baleen whales within those distances may show avoidance or other strong behavioral reactions to the
airgun array. Subtle behavioral changes sometimes become evident at somewhat lower received levels, and
studies summarized in Appendix B (5) have shown that some species of baleen whales, notably bowhead
and humpback whales, at times show strong avoidance at received levels lower than 160–170 dB re
1 µParms.
Responses of humpback whales to seismic surveys have been studied during migration, on summer
feeding grounds, and on Angolan winter breeding grounds; there has also been discussion of effects on
the Brazilian wintering grounds. McCauley et al. (1998, 2000a,b) studied the responses of humpback
whales off Western Australia to a full-scale seismic survey with a 16-airgun, 2678-in3 array, and to a
single 20-in3 airgun with source level 227 dB re 1 µPa·mp–p. McCauley et al. (1998) documented that
avoidance reactions began at 5–8 km from the array, and that those reactions kept most pods ~3–4 km

IV. Environmental Consequences
Environmental Assessment for L-DEO’s Shatsky Rise Seismic Survey, 2012 Page 43
from the operating seismic boat. McCauley et al. (2000a) noted localized displacement during migration
of 4–5 km by traveling pods and 7–12 km by more sensitive resting pods of cow-calf pairs. Avoidance
distances with respect to the single airgun were smaller but consistent with the results from the full array
in terms of the received sound levels. The mean received level for initial avoidance of an approaching
airgun was 140 dB re 1 µParms for humpback pods containing females, and at the mean closest point of
approach (CPA) distance the received level was 143 dB re 1 µParms. The initial avoidance response
generally occurred at distances of 5–8 km from the airgun array and 2 km from the single airgun.
However, some individual humpback whales, especially males, approached within distances of 100–
400 m, where the maximum received level was 179 dB re 1 µParms.
Data collected by observers during several seismic surveys in the Northwest Atlantic showed that
sighting rates of humpback whales were significantly greater during periods of no seismic compared with
periods when a full array was operating (Moulton and Holst 2010). In addition, humpback whales were
more likely to swim away and less likely to swim towards a vessel during seismic vs. non-seismic periods
(Moulton and Holst 2010).
Humpback whales on their summer feeding grounds in southeast Alaska did not exhibit persistent
avoidance when exposed to seismic pulses from a 1.64-L (100-in3) airgun (Malme et al. 1985). Some
humpbacks seemed ―startled‖ at received levels of 150–169 dB re 1 Pa. Malme et al. (1985) concluded
that there was no clear evidence of avoidance, despite the possibility of subtle effects, at received levels
up to 172 re 1 Pa on an approximate rms basis. However, Moulton and Holst (2010) reported that
humpback whales monitored during seismic surveys in the Northwest Atlantic had lower sighting rates
and were most often seen swimming away from the vessel during seismic periods compared with periods
when airguns were silent.
It has been suggested that South Atlantic humpback whales wintering off Brazil may be displaced
or even strand upon exposure to seismic surveys (Engel et al. 2004). The evidence for this was circum-
stantial and subject to alternative explanations (IAGC 2004). Also, the evidence was not consistent with
subsequent results from the same area of Brazil (Parente et al. 2006), or with direct studies of humpbacks
exposed to seismic surveys in other areas and seasons. After allowance for data from subsequent years,
there was ―no observable direct correlation‖ between strandings and seismic surveys (IWC 2007:236).
There are no data on reactions of right whales to seismic surveys, but results from the closely-
related bowhead whale show that their responsiveness can be quite variable depending on their activity
(migrating vs. feeding). Bowhead whales migrating west across the Alaskan Beaufort Sea in autumn, in
particular, are unusually responsive, with substantial avoidance occurring out to distances of 20–30 km
from a medium-sized airgun source at received sound levels of around 120–130 dB re 1 µParms [Miller et
al. 1999; Richardson et al. 1999; see Appendix B (5)]. However, more recent research on bowhead
whales (Miller et al. 2005; Harris et al. 2007) corroborates earlier evidence that, during the summer
feeding season, bowheads are not as sensitive to seismic sources. Nonetheless, subtle but statistically
significant changes in surfacing–respiration–dive cycles were evident upon analysis (Richardson et al.
1986). In summer, bowheads typically begin to show avoidance reactions at received levels of about
152–178 dB re 1 µParms (Richardson et al. 1986, 1995; Ljungblad et al. 1988; Miller et al. 2005).
Reactions of migrating and feeding (but not wintering) gray whales to seismic surveys have been
studied. Malme et al. (1986, 1988) studied the responses of feeding eastern Pacific gray whales to pulses
from a single 100-in3 airgun off St. Lawrence Island in the northern Bering Sea. They estimated, based
on small sample sizes, that 50% of feeding gray whales stopped feeding at an average received pressure
level of 173 dB re 1 Pa on an (approximate) rms basis, and that 10% of feeding whales interrupted

IV. Environmental Consequences
Environmental Assessment for L-DEO’s Shatsky Rise Seismic Survey, 2012 Page 44
feeding at received levels of 163 dB re 1 Parms. Those findings were generally consistent with the results
of experiments conducted on larger numbers of gray whales that were migrating along the California
coast (Malme et al. 1984; Malme and Miles 1985), and western Pacific gray whales feeding off Sakhalin
Island, Russia (Würsig et al. 1999; Gailey et al. 2007; Johnson et al. 2007; Yazvenko et al. 2007a,b),
along with data on gray whales off British Columbia, Canada (Bain and Williams 2006).
Various species of Balaenoptera (blue, sei, fin, and minke whales) have occasionally been seen in
areas ensonified by airgun pulses (Stone 2003; MacLean and Haley 2004; Stone and Tasker 2006), and
calls from blue and fin whales have been localized in areas with airgun operations (e.g., McDonald et al.
1995; Dunn and Hernandez 2009; Castellote et al. 2010). Sightings by observers on seismic vessels off
the United Kingdom from 1997 to 2000 suggest that, during times of good sightability, sighting rates for
mysticetes (mainly fin and sei whales) were similar when large arrays of airguns were shooting vs. silent
(Stone 2003; Stone and Tasker 2006). However, these whales tended to exhibit localized avoidance,
remaining significantly further (on average) from the airgun array during seismic operations compared
with non-seismic periods (Stone and Tasker 2006). Castellote et al. (2010) reported that singing fin
whales in the Mediterranean moved away from an operating airgun array.
Ship-based monitoring studies of baleen whales (including blue, fin, sei, minke, and humpback
whales) in the Northwest Atlantic found that overall, this group had lower sighting rates during seismic
vs. non-seismic periods (Moulton and Holst 2010). Baleen whales as a group were also seen significantly
farther from the vessel during seismic compared with non-seismic periods, and they were more often seen
to be swimming away from the operating seismic vessel (Moulton and Holst 2010). Blue and minke
whales were initially sighted significantly farther from the vessel during seismic operations compared to
non-seismic periods; the same trend was observed for fin whales (Moulton and Holst 2010). Minke
whales were most often observed to be swimming away from the vessel when seismic operations were
underway (Moulton and Holst 2010).
Data on short-term reactions by cetaceans to impulsive noises are not necessarily indicative of
long-term or biologically significant effects. It is not known whether impulsive sounds affect repro-
ductive rate or distribution and habitat use in subsequent days or years. However, gray whales have
continued to migrate annually along the west coast of North America with substantial increases in the
population over recent years, despite intermittent seismic exploration (and much ship traffic) in that area
for decades (Appendix A in Malme et al. 1984; Richardson et al. 1995; Allen and Angliss 2010). The
western Pacific gray whale population did not seem affected by a seismic survey in its feeding ground
during a previous year (Johnson et al. 2007). Similarly, bowhead whales have continued to travel to the
eastern Beaufort Sea each summer, and their numbers have increased notably, despite seismic exploration
in their summer and autumn range for many years (Richardson et al. 1987; Allen and Angliss 2010).
Toothed Whales
Little systematic information is available about reactions of toothed whales to noise pulses. Few
studies similar to the more extensive baleen whale/seismic pulse work summarized above and (in more
detail) in Appendix B have been reported for toothed whales. However, there are recent systematic
studies on sperm whales (e.g., Gordon et al. 2006; Madsen et al. 2006; Winsor and Mate 2006; Jochens et
al. 2008; Miller et al. 2009). There is an increasing amount of information about responses of various
odontocetes to seismic surveys based on monitoring studies (e.g., Stone 2003; Smultea et al. 2004;
Moulton and Miller 2005; Bain and Williams 2006; Holst et al. 2006; Stone and Tasker 2006; Potter et al.
2007; Hauser et al. 2008; Holst and Smultea 2008; Weir 2008; Barkaszi et al. 2009; Richardson et al.
2009).
IV. Environmental Consequences
Environmental Assessment for L-DEO’s Shatsky Rise Seismic Survey, 2012 Page 45
Seismic operators and marine mammal observers on seismic vessels regularly see dolphins and
other small toothed whales near operating airgun arrays, but in general there is a tendency for most
delphinids to show some avoidance of operating seismic vessels (e.g., Goold 1996a,b,c; Calambokidis
and Osmek 1998; Stone 2003; Moulton and Miller 2005; Holst et al. 2006; Stone and Tasker 2006; Weir
2008; Barkaszi et al. 2009; Richardson et al. 2009; Moulton and Holst 2010). Some dolphins seem to be
attracted to the seismic vessel and floats, and some ride the bow wave of the seismic vessel even when
large arrays of airguns are firing (e.g., Moulton and Miller 2005). Nonetheless, small toothed whales
more often tend to head away, or to maintain a somewhat greater distance from the vessel, when a large
array of airguns is operating than when it is silent (e.g., Stone and Tasker 2006; Weir 2008; Barry et al.
2010; Moulton and Holst 2010). In most cases the avoidance radii for delphinids appear to be small, on
the order of 1 km less, and some individuals show no apparent avoidance. The beluga is a species that (at
least at times) shows long-distance avoidance of seismic vessels. Aerial surveys conducted in the
southeastern Beaufort Sea during summer found that sighting rates of beluga whales were significantly
lower at distances 10–20 km compared with 20–30 km from an operating airgun array, and observers on
seismic boats in that area rarely see belugas (Miller et al. 2005; Harris et al. 2007).
Captive bottlenose dolphins and beluga whales exhibited changes in behavior when exposed to
strong pulsed sounds similar in duration to those typically used in seismic surveys (Finneran et al. 2000,
2002, 2005). However, the animals tolerated high received levels of sound before exhibiting aversive
behaviors.
Results for porpoises depend on species. The limited available data suggest that harbor porpoises
show stronger avoidance of seismic operations than do Dall‘s porpoises (Stone 2003; MacLean and Koski
2005; Bain and Williams 2006; Stone and Tasker 2006). Dall‘s porpoises seem relatively tolerant of
airgun operations (MacLean and Koski 2005; Bain and Williams 2006), although they too have been
observed to avoid large arrays of operating airguns (Calambokidis and Osmek 1998; Bain and Williams
2006). This apparent difference in responsiveness of these two porpoise species is consistent with their
relative responsiveness to boat traffic and some other acoustic sources (Richardson et al. 1995; Southall et
al. 2007).
Most studies of sperm whales exposed to airgun sounds indicate that the sperm whale shows
considerable tolerance of airgun pulses (e.g., Stone 2003; Stone and Tasker 2006; Weir 2008; Moulton
and Holst 2010). In most cases the whales do not show strong avoidance, and they continue to call (see
Appendix B for review). However, controlled exposure experiments in the Gulf of Mexico indicate that
foraging behavior was altered upon exposure to airgun sound (Jochens et al. 2008; Miller et al. 2009;
Tyack 2009).
There are almost no specific data on the behavioral reactions of beaked whales to seismic surveys.
However, some northern bottlenose whales remained in the general area and continued to produce high-
frequency clicks when exposed to sound pulses from distant seismic surveys (Gosselin and Lawson 2004;
Laurinolli and Cochrane 2005; Simard et al. 2005). Most beaked whales tend to avoid approaching
vessels of other types (e.g., Würsig et al. 1998). They may also dive for an extended period when
approached by a vessel (e.g., Kasuya 1986), although it is uncertain how much longer such dives may be
as compared to dives by undisturbed beaked whales, which also are often quite long (Baird et al. 2006;
Tyack et al. 2006). In any event, it is likely that most beaked whales would also show strong avoidance
of an approaching seismic vessel, although this has not been documented explicitly. In fact, Moulton and
Holst (2010) reported 15 sightings of beaked whales during seismic studies in the Northwest Atlantic;
seven of those sightings were made at times when at least one airgun was operating. There was little

IV. Environmental Consequences
Environmental Assessment for L-DEO’s Shatsky Rise Seismic Survey, 2012 Page 46
evidence to indicate that beaked whale behavior was affected by airgun operations; sighting rates and
distances were similar during seismic and non-seismic periods (Moulton and Holst 2010).
There are increasing indications that some beaked whales tend to strand when naval exercises
involving mid-frequency sonar operation are ongoing nearby (e.g., Simmonds and Lopez-Jurado 1991;
Frantzis 1998; NOAA and USN 2001; Jepson et al. 2003; Hildebrand 2005; Barlow and Gisiner 2006; see
also the ―Strandings and Mortality‖ subsection, later). These strandings are apparently at least in part a
disturbance response, although auditory or other injuries or other physiological effects may also be
involved. Whether beaked whales would ever react similarly to seismic surveys is unknown (see ―Strand-
ings and Mortality‖, below). Seismic survey sounds are quite different from those of the sonars in
operation during the above-cited incidents.
Odontocete reactions to large arrays of airguns are variable and, at least for delphinids and Dall‘s
porpoises, seem to be confined to a smaller radius than has been observed for the more responsive of the
mysticetes, belugas, and harbor porpoises (Appendix B). A 170 dB re 1 μPa disturbance criterion
(rather than 160 dB) is considered appropriate for delphinids (and pinnipeds), which tend to be less
responsive than the more responsive cetaceans.
Sea Turtles
The limited available data indicate that sea turtles will hear airgun sounds and sometimes exhibit
localized avoidance (see Appendix C). Based on available data, it is likely that sea turtles will exhibit
behavioral changes and/or avoidance within an area of unknown size near a seismic vessel (e.g., Holst et
al. 2005a, 2006; Holst and Smultea 2008). Observed responses of sea turtles to airguns are reviewed in
Appendix C. To the extent that there are any impacts on sea turtles, seismic operations in or near areas
where turtles concentrate are likely to have the greatest impact. There are no specific data that demon-
strate the consequences to sea turtles if seismic operations with large or small arrays of airguns occur in
important areas at biologically important times of year.
Additional details on the behavioral reactions (or the lack thereof) by all types of marine mammals
to seismic vessels can be found in Appendix B (5). Corresponding details for sea turtles can be found in
Appendix C.
Hearing Impairment and Other Physical Effects.―Temporary or permanent hearing impairment
is a possibility when marine mammals are exposed to very strong sounds. TTS has been demonstrated
and studied in certain captive odontocetes and pinnipeds exposed to strong sounds (reviewed in Southall
et al. 2007). However, there has been no specific documentation of TTS let alone permanent hearing
damage, i.e., permanent threshold shift (PTS), in free-ranging marine mammals exposed to sequences of
airgun pulses during realistic field conditions. Current NMFS policy regarding exposure of marine
mammals to high-level sounds is that cetaceans should not be exposed to impulsive sounds with received
levels 180 dB re 1 µParms (NMFS 2000). This criterion has been used in establishing the exclusion
(=shut-down) zones planned for the proposed seismic survey. However, this criterion was established
before there was any information about minimum received levels of sounds necessary to cause auditory
impairment in marine mammals. As discussed in Appendix B (6) and summarized here,
the 180-dB criterion for cetaceans is probably quite precautionary, i.e., lower than necessary to
avoid temporary auditory impairment let alone permanent auditory injury, at least for delphinids.
TTS is not injury and does not constitute ―Level A harassment‖ in U.S. MMPA terminology.
IV. Environmental Consequences
Environmental Assessment for L-DEO’s Shatsky Rise Seismic Survey, 2012 Page 47
the minimum sound level necessary to cause permanent hearing impairment (―Level A harass-
ment‖) is higher, by a variable and generally unknown amount, than the level that induces barely-
detectable TTS.
the level associated with the onset of TTS is often considered to be a level below which there is
no danger of permanent damage. The actual PTS threshold is likely to be well above the level
causing onset of TTS (Southall et al. 2007).
Recommendations for new science-based noise exposure criteria for marine mammals, frequency-
weighting procedures, and related matters were published recently (Southall et al. 2007). Those recom-
mendations have not, as of late 2009, been formally adopted by NMFS for use in regulatory processes and
during mitigation programs associated with seismic surveys. However, some aspects of the recommenda-
tions have been taken into account in certain EISs and small-take authorizations. NMFS has indicated
that it may issue new noise exposure criteria for marine mammals that account for the now-available
scientific data on TTS, the expected offset between the TTS and PTS thresholds, differences in the
acoustic frequencies to which different marine mammal groups are sensitive (e.g., M-weighting or
generalized frequency weightings for various groups of marine mammals, allowing for their functional
bandwidths), and other relevant factors. Preliminary information about possible changes in the regulatory
and mitigation requirements, and about the possible structure of new criteria, was given by Wieting
(2004) and NMFS (2005).
Several aspects of the planned monitoring and mitigation measures for this project are designed to
detect marine mammals occurring near the airgun array, and to avoid exposing them to sound pulses that
might, at least in theory, cause hearing impairment (see § II, ―Monitoring and Mitigation Measures‖). In
addition, many cetaceans and (to a limited degree) sea turtles show some avoidance of the area where
received levels of airgun sound are high enough such that hearing impairment could potentially occur. In
those cases, the avoidance responses of the animals themselves will reduce or (most likely) avoid any
possibility of hearing impairment.
Non-auditory physical effects may also occur in marine mammals exposed to strong underwater
pulsed sound. Possible types of non-auditory physiological effects or injuries that might (in theory) occur in
mammals close to a strong sound source include stress, neurological effects, bubble formation, and other
types of organ or tissue damage. It is possible that some marine mammal species (i.e., beaked whales) may
be especially susceptible to injury and/or stranding when exposed to strong transient sounds. However, as
discussed below, there is no definitive evidence that any of these effects occur even for marine mammals in
close proximity to large arrays of airguns. It is unlikely that any effects of these types would occur during
the present project given the brief duration of exposure of any given mammal, the deep water in the study
area, and the planned monitoring and mitigation measures (see below). The following subsections discuss
in somewhat more detail the possibilities of TTS, PTS, and non-auditory physical effects.
Temporary Threshold Shift
TTS is the mildest form of hearing impairment that can occur during exposure to a strong sound
(Kryter 1985). While experiencing TTS, the hearing threshold rises and a sound must be stronger in order
to be heard. At least in terrestrial mammals, TTS can last from minutes or hours to (in cases of strong
TTS) days. For sound exposures at or somewhat above the TTS threshold, hearing sensitivity in both
terrestrial and marine mammals recovers rapidly after exposure to the noise ends. Few data on sound
levels and durations necessary to elicit mild TTS have been obtained for marine mammals, and none of
the published data concern TTS elicited by exposure to multiple pulses of sound. Available data on TTS
IV. Environmental Consequences
Environmental Assessment for L-DEO’s Shatsky Rise Seismic Survey, 2012 Page 48
in marine mammals are summarized in Southall et al. (2007). Based on these data, the received energy
level of a single seismic pulse (with no frequency weighting) might need to be ~186 dB re 1 µPa2 · s (i.e.,
186 dB SEL or ~196–201 dB re 1 µParms) in order to produce brief, mild TTS1. Exposure to several
strong seismic pulses that each have received levels near 190 dB re 1 µParms might result in cumulative
exposure of ~186 dB SEL and thus slight TTS in a small odontocete assuming the TTS threshold is (to a
first approximation) a function of the total received pulse energy; however, this ‗equal-energy‘ concept is
an oversimplification. The distances from the Langseth‘s airguns at which the received energy level (per
pulse, flat-weighted) would be expected to be 190 dB re 1 µParms are estimated in Table 1. Levels 190
dB re 1 µParms are expected to be restricted to radii no more than 460 m (Table 1). For an odontocete
closer to the surface, the maximum radius with 190 dB re 1 µParms would be smaller.
The above TTS information for odontocetes is derived from studies on the bottlenose dolphin and
beluga. For the one harbor porpoise tested, the received level of airgun sound that elicited onset of TTS
was lower (Lucke et al. 2009). If these results from a single animal are representative, it is inappropriate
to assume that onset of TTS occurs at similar received levels in all odontocetes (cf. Southall et al. 2007).
Some cetaceans apparently can incur TTS at considerably lower sound exposures than are necessary to
elicit TTS in the beluga or bottlenose dolphin.
For baleen whales, there are no data, direct or indirect, on levels or properties of sound that are
required to induce TTS. The frequencies to which baleen whales are most sensitive are assumed to be lower
than those to which odontocetes are most sensitive, and natural background noise levels at those low
frequencies tend to be higher. As a result, auditory thresholds of baleen whales within their frequency band
of best hearing are believed to be higher (less sensitive) than are those of odontocetes at their best
frequencies (Clark and Ellison 2004). From this, it is suspected that received levels causing TTS onset may
also be higher in baleen whales (Southall et al. 2007). In any event, no cases of TTS are expected given
three considerations: (1) the low abundance of baleen whales in the planned study area at the time of the
survey; (2) the strong likelihood that baleen whales would avoid the approaching airguns (or vessel) before
being exposed to levels high enough for TTS to occur; and (3) the mitigation measures that are planned.
NMFS (1995, 2000) concluded that cetaceans should not be exposed to pulsed underwater noise at
received levels exceeding 180 dB re 1 µParms. This sound level is not considered to be the level above
which TTS might occur. Rather, it was the received levels above which, in the view of a panel of
bioacoustics specialists convened by NMFS before TTS measurements for marine mammals started to
become available, one could not be certain that there would be no injurious effects, auditory or otherwise,
to cetaceans. As summarized above and in Southall et al. (2007), data that are now available imply that
TTS is unlikely to occur in most odontocetes (and probably mysticetes as well) unless they are exposed to
a sequence of several airgun pulses stronger than 190 dB re 1 µParms.
____________________________________
1 If the low frequency components of the watergun sound used in the experiments of Finneran et al. (2002) are
downweighted as recommended by Miller et al. (2005) and Southall et al. (2007) using their Mmf-weighting curve,
the effective exposure level for onset of mild TTS was 183 dB re 1 μPa2 · s (Southall et al. 2007).
Permanent Threshold Shift
When PTS occurs, there is physical damage to the sound receptors in the ear. In severe cases, there
can be total or partial deafness, whereas in other cases, the animal has an impaired ability to hear sounds
in specific frequency ranges (Kryter 1985).
IV. Environmental Consequences
Environmental Assessment for L-DEO’s Shatsky Rise Seismic Survey, 2012 Page 49
There is no specific evidence that exposure to pulses of airgun sound can cause PTS in any marine
mammal, even with large arrays of airguns. However, given the possibility that mammals close to an
airgun array might incur at least mild TTS, there has been further speculation about the possibility that
some individuals occurring very close to airguns might incur PTS (e.g., Richardson et al. 1995, p. 372ff;
Gedamke et al. 2008). Single or occasional occurrences of mild TTS are not indicative of permanent
auditory damage, but repeated or (in some cases) single exposures to a level well above that causing TTS
onset might elicit PTS.
Relationships between TTS and PTS thresholds have not been studied in marine mammals, but are
assumed to be similar to those in humans and other terrestrial mammals. PTS might occur at a received
sound level at least several decibels above that inducing mild TTS if the animal were exposed to strong
sound pulses with rapid rise time—see Appendix B (6). Based on data from terrestrial mammals, a
precautionary assumption is that the PTS threshold for impulse sounds (such as airgun pulses as received
close to the source) is at least 6 dB higher than the TTS threshold on a peak-pressure basis, and probably
>6 dB (Southall et al. 2007). On an SEL basis, Southall et al. (2007:441-4) estimated that received levels
would need to exceed the TTS threshold by at least 15 dB for there to be risk of PTS. Thus, for cetaceans
they estimate that the PTS threshold might be an M-weighted SEL (for the sequence of received pulses)
of ~198 dB re 1 μPa2 ∙ s (15 dB higher than the Mmf-weighted TTS threshold, in a beluga, for a watergun
impulse), where the SEL value is cumulated over the sequence of pulses.
Southall et al. (2007) also note that, regardless of the SEL, there is concern about the possibility of
PTS if a cetacean received one or more pulses with peak pressure exceeding 230 or 218 dB re 1 μPa
(peak), respectively. Thus, PTS might be expected upon exposure of cetaceans to either SEL ≥198 dB re
1 μPa2 ·
s or peak pressure ≥230 dB re 1 μPa. Corresponding proposed dual criteria for pinnipeds (at least
harbor seals) are ≥186 dB SEL and ≥ 218 dB peak pressure (Southall et al. 2007). These estimates are all
first approximations, given the limited underlying data, assumptions, species differences, and evidence
that the ―equal energy‖ model is not be entirely correct. A peak pressure of 230 dB re 1 μPa (3.2 bar · m,
0-pk) would only be found within a few meters of the largest (360-in3) airguns in the planned airgun array
(e.g., Caldwell and Dragoset 2000). A peak pressure of 218 dB re 1 μPa could be received somewhat
farther away; to estimate that specific distance, one would need to apply a model that accurately
calculates peak pressures in the near-field around an array of airguns.
Given the higher level of sound necessary to cause PTS as compared with TTS, it is considerably
less likely that PTS would occur. Baleen whales generally avoid the immediate area around operating
seismic vessels, as do some other marine mammals and sea turtles. The planned monitoring and
mitigation measures, including visual monitoring, PAM, power downs, and shut downs of the airguns
when mammals are seen within or approaching the ―exclusion zones‖, will further reduce the probability
of exposure of marine mammals to sounds strong enough to induce PTS.
Strandings and Mortality
Marine mammals close to underwater detonations of high explosives can be killed or severely
injured, and the auditory organs are especially susceptible to injury (Ketten et al. 1993; Ketten 1995).
However, explosives are no longer used for marine waters for commercial seismic surveys or (with rare
exceptions) for seismic research; they have been replaced entirely by airguns or related non-explosive
pulse generators. Airgun pulses are less energetic and have slower rise times, and there is no specific
evidence that they can cause serious injury, death, or stranding even in the case of large airgun arrays.
However, the association of strandings of beaked whales with naval exercises and, in one case, an L-DEO
seismic survey (Malakoff 2002; Cox et al. 2006), has raised the possibility that beaked whales exposed to
IV. Environmental Consequences
Environmental Assessment for L-DEO’s Shatsky Rise Seismic Survey, 2012 Page 50
strong ―pulsed‖ sounds may be especially susceptible to injury and/or behavioral reactions that can lead to
stranding (e.g., Hildebrand 2005; Southall et al. 2007). Appendix B (6) provides additional details.
Specific sound-related processes that lead to strandings and mortality are not well documented, but
may include (1) swimming in avoidance of a sound into shallow water; (2) a change in behavior (such as
a change in diving behavior) that might contribute to tissue damage, gas bubble formation, hypoxia,
cardiac arrhythmia, hypertensive hemorrhage or other forms of trauma; (3) a physiological change such as
a vestibular response leading to a behavioral change or stress-induced hemorrhagic diathesis, leading in
turn to tissue damage; and (4) tissue damage directly from sound exposure, such as through acoustically
mediated bubble formation and growth or acoustic resonance of tissues. Some of these mechanisms are
unlikely to apply in the case of impulse sounds. However, there are increasing indications that gas-bubble
disease (analogous to ―the bends‖), induced in supersaturated tissue by a behavioral response to acoustic
exposure, could be a pathologic mechanism for the strandings and mortality of some deep-diving
cetaceans exposed to sonar. The evidence for this remains circumstantial and associated with exposure to
naval mid-frequency sonar, not seismic surveys (Cox et al. 2006; Southall et al. 2007).
Seismic pulses and mid-frequency sonar signals are quite different, and some mechanisms by which
sonar sounds have been hypothesized to affect beaked whales are unlikely to apply to airgun pulses. Sounds
produced by airgun arrays are broadband impulses with most of the energy below 1 kHz. Typical military
mid-frequency sonars emit non-impulse sounds at frequencies of 2–10 kHz, generally with a relatively
narrow bandwidth at any one time. A further difference between seismic surveys and naval exercises is that
naval exercises can involve sound sources on more than one vessel. Thus, it is not appropriate to assume
that there is a direct connection between the effects of military sonar and seismic surveys on marine
mammals. However, evidence that sonar signals can, in special circumstances, lead (at least indirectly) to
physical damage and mortality (e.g., Balcomb and Claridge 2001; NOAA and USN 2001; Jepson et al.
2003; Fernández et al. 2004, 2005; Hildebrand 2005; Cox et al. 2006) suggests that caution is warranted
when dealing with exposure of marine mammals to any high-intensity ―pulsed‖ sound.
There is no conclusive evidence of cetacean strandings or deaths at sea as a result of exposure to
seismic surveys, but a few cases of strandings in the general area where a seismic survey was ongoing
have led to speculation concerning a possible link between seismic surveys and strandings. Suggestions
that there was a link between seismic surveys and strandings of humpback whales in Brazil (Engel et al.
2004) were not well founded (IAGC 2004; IWC 2007). In Sept. 2002, there was a stranding of two
Cuvier‘s beaked whales in the Gulf of California, Mexico, when the L-DEO vessel R/V Maurice Ewing
was operating a 20-airgun, 8490-in3 airgun array in the general area. The link between the stranding and
the seismic surveys was inconclusive and not based on any physical evidence (Hogarth 2002; Yoder
2002). Nonetheless, the Gulf of California incident plus the beaked whale strandings near naval exercises
involving use of mid-frequency sonar suggests a need for caution in conducting seismic surveys in areas
occupied by beaked whales until more is known about effects of seismic surveys on those species
(Hildebrand 2005). No injuries of beaked whales are anticipated during the proposed study because of
(1) the high likelihood that any beaked whales nearby would avoid the approaching vessel before being
exposed to high sound levels, (2) the proposed monitoring and mitigation measures, and (3) differences
between the sound sources operated by L-DEO and those involved in the naval exercises associated with
strandings.
Non-auditory Physiological Effects
Non-auditory physiological effects or injuries that theoretically might occur in marine mammals
exposed to strong underwater sound include stress, neurological effects, bubble formation, resonance, and

IV. Environmental Consequences
Environmental Assessment for L-DEO’s Shatsky Rise Seismic Survey, 2012 Page 51
other types of organ or tissue damage (Cox et al. 2006; Southall et al. 2007). Studies examining such
effects are limited. However, resonance effects (Gentry 2002) and direct noise-induced bubble formation
(Crum et al. 2005) are implausible in the case of exposure to an impulsive broadband source like an
airgun array. If seismic surveys disrupt diving patterns of deep-diving species, this might perhaps result
in bubble formation and a form of ―the bends‖, as speculated to occur in beaked whales exposed to sonar.
However, there is no specific evidence of this upon exposure to airgun pulses.
In general, very little is known about the potential for seismic survey sounds (or other types of
strong underwater sounds) to cause non-auditory physical effects in marine mammals. Such effects, if
they occur at all, would presumably be limited to short distances and to activities that extend over a
prolonged period. The available data do not allow identification of a specific exposure level above which
non-auditory effects can be expected (Southall et al. 2007), or any meaningful quantitative predictions of
the numbers (if any) of marine mammals that might be affected in those ways. Marine mammals that
show behavioral avoidance of seismic vessels, including most baleen whales and some odontocetes, are
especially unlikely to incur non-auditory physical effects. Also, the planned mitigation measures [§ II
(3)], including shut downs of the airguns, will reduce any such effects that might otherwise occur.
Sea Turtles
The limited available data indicate that the frequency range of best hearing sensitivity by sea turtles
extends from roughly 250–300 Hz to 500–700 Hz. Sensitivity deteriorates as one moves away from that
range to either lower or higher frequencies. However, there is some sensitivity to frequencies as low as
60 Hz, and probably as low as 30 Hz. Thus, there is substantial overlap in the frequencies that sea turtles
detect vs. the frequencies in airgun pulses. We are not aware of measurements of the absolute hearing
thresholds of any sea turtle to waterborne sounds similar to airgun pulses. In the absence of relevant
absolute threshold data, we cannot estimate how far away an airgun array might be audible. Moein et al.
(1994) and Lenhardt (2002) reported TTS for loggerhead turtles exposed to many airgun pulses
(Appendix C). This suggests that sounds from an airgun array might cause temporary hearing impairment
in sea turtles if they do not avoid the (unknown) radius where TTS occurs. However, exposure duration
during the planned surveys would be much less than during the aforementioned studies. Also, recent
monitoring studies show that some sea turtles do show localized movement away from approaching
airguns (Holst et al. 2005a, 2006; Holst and Smultea 2008). At short distances from the source, received
sound level diminishes rapidly with increasing distance. In that situation, even a small-scale avoidance
response could result in a significant reduction in sound exposure.
As noted above, the PSOs stationed on the Langseth will also watch for sea turtles, and airgun
operations will be shut down if a turtle enters the designated exclusion zone.
(b) Possible Effects of Multibeam Echosounder Signals
The Kongsberg EM 122 MBES will be operated from the source vessel during the planned study.
Information about this equipment was provided in § II. Sounds from the MBES are very short pulses,
occurring for 2–15 ms once every 5–20 s, depending on water depth. Most of the energy in the sound
pulses emitted by this MBES is at frequencies near 12 kHz, and the maximum source level is 242 dB re 1
μParms · mrms. The beam is narrow (1–2º) in fore-aft extent and wide (150º) in the cross-track extent.
Each ping consists of eight (in water >1000 m deep) or four (<1000 m deep) successive fan-shaped
transmissions (segments) at different cross-track angles. Any given mammal at depth near the trackline
would be in the main beam for only one or two of the nine segments. Also, marine mammals that
encounter the Kongsberg EM 122 are unlikely to be subjected to repeated pulses because of the narrow

IV. Environmental Consequences
Environmental Assessment for L-DEO’s Shatsky Rise Seismic Survey, 2012 Page 52
fore–aft width of the beam and will receive only limited amounts of pulse energy because of the short
pulses. Animals close to the ship (where the beam is narrowest) are especially unlikely to be ensonified
for more than one 2–15 ms pulse (or two pulses if in the overlap area). Similarly, Kremser et al. (2005)
noted that the probability of a cetacean swimming through the area of exposure when an MBES emits a
pulse is small. The animal would have to pass the transducer at close range and be swimming at speeds
similar to the vessel in order to receive the multiple pulses that might result in sufficient exposure to cause
TTS.
Navy sonars that have been linked to avoidance reactions and stranding of cetaceans (1) generally
have a longer pulse duration than the Kongsberg EM 122, and (2) are often directed close to horizontally
vs. more downward for the MBES. The area of possible influence of the MBES is much smaller—a
narrow band below the source vessel. The duration of exposure for a given marine mammal can be much
longer for a naval sonar. During L-DEO‘s operations, the individual pulses will be very short, and a
given mammal would not receive many of the downward-directed pulses as the vessel passes by.
Possible effects of an MBES on marine mammals are outlined below.
Masking.—Marine mammal communications will not be masked appreciably by the MBES signals
given the low duty cycle of the echosounder and the brief period when an individual mammal is likely to
be within its beam. Furthermore, in the case of baleen whales, the MBES signals (12 kHz) do not overlap
with the predominant frequencies in the calls, which would avoid any significant masking.
Behavioral Responses.—Behavioral reactions of free-ranging marine mammals to sonars,
echosounders, and other sound sources appear to vary by species and circumstance. Observed reactions
have included silencing and dispersal by sperm whales (Watkins et al. 1985), increased vocalizations and
no dispersal by pilot whales (Rendell and Gordon 1999), and the previously-mentioned beachings by
beaked whales. During exposure to a 21–25 kHz ―whale-finding‖ sonar with a source level of 215 dB re
1 μPa · m, gray whales reacted by orienting slightly away from the source and being deflected from their
course by ~200 m (Frankel 2005). When a 38-kHz echosounder and a 150-kHz acoustic Doppler current
profiler were transmitting during studies in the Eastern Tropical Pacific, baleen whales showed no
significant responses, while spotted and spinner dolphins were detected slightly more often and beaked
whales less often during visual surveys (Gerrodette and Pettis 2005).
Captive bottlenose dolphins and a white whale exhibited changes in behavior when exposed to 1-s
tonal signals at frequencies similar to those that will be emitted by the MBES used by L-DEO, and to
shorter broadband pulsed signals. Behavioral changes typically involved what appeared to be deliberate
attempts to avoid the sound exposure (Schlundt et al. 2000; Finneran et al. 2002; Finneran and Schlundt
2004). The relevance of those data to free-ranging odontocetes is uncertain, and in any case, the test
sounds were quite different in duration as compared with those from an MBES.
Hearing Impairment and Other Physical Effects.—Given recent stranding events that have been
associated with the operation of naval sonar, there is concern that mid-frequency sonar sounds can cause
serious impacts to marine mammals (see above). However, the MBES proposed for use by L-DEO is
quite different than sonars used for navy operations. Pulse duration of the MBES is very short relative to
the naval sonars. Also, at any given location, an individual marine mammal would be in the beam of the
MBES for much less time given the generally downward orientation of the beam and its narrow fore-aft
beamwidth; navy sonars often use near-horizontally-directed sound. Those factors would all reduce the
sound energy received from the MBES rather drastically relative to that from the sonars used by the navy.

IV. Environmental Consequences
Environmental Assessment for L-DEO’s Shatsky Rise Seismic Survey, 2012 Page 53
Given the maximum source level of 242 dB re 1 Pa · mrms (see § II), the received level for an
animal within the MBES beam 100 m below the ship would be ~202 dB re 1 Parms, assuming 40 dB of
spreading loss over 100 m (circular spreading). Given the narrow beam, only one pulse is likely to be
received by a given animal as the ship passes overhead. The received energy level from a single pulse of
duration 15 ms would be about 184 dB re 1 Pa2 · s, i.e., 202 dB + 10 log (0.015 s). That is below the
TTS threshold for a cetacean receiving a single non-impulse sound (195 dB re 1 μPa2 · s) and even further
below the anticipated PTS threshold (215 dB re 1 μPa2 · s) (Southall et al. 2007). In contrast, an animal
that was only 10 m below the MBES when a ping is emitted would be expected to receive a level ~20 dB
higher, i.e., 204 dB re 1 μPa2 · s in the case of the EM120. That animal might incur some TTS (which
would be fully recoverable), but the exposure would still be below the anticipated PTS threshold for
cetaceans. As noted by Burkhardt et al. (2007, 2008), cetaceans are very unlikely to incur PTS from
operation of scientific sonars on a ship that is underway.
Sea Turtles.—It is unlikely that MBES operations during the planned seismic survey would
significantly affect sea turtles through masking, disturbance, or hearing impairment. Any effects would
likely be negligible given the brief exposure and the fact that the MBES frequency is far above the range
of optimal hearing by sea turtles (see Appendix C).
(c) Possible Effects of the Sub-bottom Profiler Signals
An SBP will also be operated from the source vessel during the planned study. Details about this
equipment were provided in § II. Sounds from the SBP are very short pulses, occurring for up to 64 ms
once every second. Most of the energy in the sound pulses emitted by the SBP is at 3.5 kHz, and the
beam is directed downward. The sub-bottom profiler on the Langseth has a maximum source level of
222 dB re 1 µPa · m (see § II). Kremser et al. (2005) noted that the probability of a cetacean swimming
through the area of exposure when a bottom profiler emits a pulse is small―even for an SBP more
powerful than that on the Langseth―if the animal was in the area, it would have to pass the transducer at
close range and in order to be subjected to sound levels that could cause TTS.
Masking.—Marine mammal communications will not be masked appreciably by the SBP signals
given the directionality of the signal and the brief period when an individual mammal is likely to be
within its beam. Furthermore, in the case of most baleen whales, the SBP signals do not overlap with the
predominant frequencies in the calls, which would avoid significant masking.
Behavioral Responses.—Marine mammal behavioral reactions to other pulsed sound sources are
discussed above, and responses to the SBP are likely to be similar to those for other pulsed sources if
received at the same levels. However, the pulsed signals from the SBP are considerably weaker than
those from the MBES. Therefore, behavioral responses are not expected unless marine mammals are very
close to the source.
Hearing Impairment and Other Physical Effects.—It is unlikely that the SBP produces pulse levels
strong enough to cause hearing impairment or other physical injuries even in an animal that is (briefly) in a
position near the source. The SBP operated simultaneously with other higher-power acoustic sources,
including the airguns. Many marine mammals will move away in response to the approaching higher-power
sources or the vessel itself before the mammals would be close enough for there to be any possibility of
effects from the less intense sounds from the SBP. In the case of mammals that do not avoid the
approaching vessel and its various sound sources, mitigation measures that would be applied to minimize
effects of other sources [see § II(3)] would further reduce or eliminate any minor effects of the SBP.

IV. Environmental Consequences
Environmental Assessment for L-DEO’s Shatsky Rise Seismic Survey, 2012 Page 54
Sea Turtles.—It is very unlikely that SBP operations during the planned seismic survey would
significantly affect sea turtles through masking, disturbance, or hearing impairment. Any effects likely
would be negligible given the brief exposure and relatively low source level. Also, the frequency of the
SBP sounds is higher than the frequency range of best hearing by sea turtles.
(d) Possible Non-acoustic Effects of Seismic Surveys
Possible non-acoustic effects of seismic surveys on marine mammals and/or sea turtles include
disturbance by vessel noise, and injury or mortality from collisions with vessels or entanglement in
seismic gear.
Vessel noise from the Langseth could affect marine animals in the proposed survey area. Noise
from large vessels generally dominates ambient noise at frequencies from 20 to 300 Hz (Richardson et al.
1995). Baleen whales are thought to be more sensitive to sound at these low frequencies than are toothed
whales, possibly causing localized avoidance by marine mammals of the proposed survey area during
seismic operations. Reactions of gray and humpback whales to vessels have been studied, and there is
limited information available about the reactions of right whales and rorquals (fin, blue, and minke
whales). Reactions of humpback whales to boats are variable, ranging from approach to avoidance
(Payne 1978; Salden 1993). Baker et al. (1982, 1983) and Baker and Herman (1989) found humpbacks
often move away when vessels are within several kilometers. Humpbacks seem less likely to react
overtly when actively feeding than when resting or engaged in other activities (Krieger and Wing 1984,
1986).
Many odontocetes show considerable tolerance of vessel traffic, although they sometimes react at
long distances if confined by ice or shallow water, if previously harassed by vessels, or have had little or
no recent exposure to ships (Richardson et al. 1995). Dolphins of many species tolerate and sometimes
approach vessels. Some dolphin species approach moving vessels to ride the bow or stern waves
(Williams et al. 1992). There are few data on the behavioral reactions of beaked whales to vessel noise,
though they seem to avoid approaching vessels (e.g., Würsig et al. 1998) or dive for an extended period
when approached by a vessel (e.g., Kasuya 1986). Based on a single observation, Aguilar-Soto et al.
(2006) suggest foraging efficiency of Cuvier‘s beaked whales may be reduced by close approach of
vessels.
Another concern with vessel traffic is the potential for striking marine mammals. Jensen and Silber
(2003) assembled a database of whale strikes reported throughout the world. Of the 292 records of
confirmed or possible ship strikes to large whales, most were reported in North America, but this may be
an artifact of data collection procedures and/or decreased reporting in other global jurisdictions. The
probability of a ship strike resulting in a lethal injury (mortality or severe injury) of a large cetacean
increases with ship speed (Laist et al. 2001; Vanderlaan and Taggart 2007). Most lethal and severe
injuries to large whales occur when vessels travel 14 kts or faster, and the probability of severe or lethal
injury to a whale approaches 100% in the event of a direct strike when a ship is traveling faster than
15 kts (Laist et al. 2001; Vanderlaan and Taggart 2007). The probability of a ship strike is a function of
vessel density, animal density, and vessel speed. Given the slow speed of the seismic vessel (~4 kt), the
probability of injurious or fatal strikes with mammals during the operations is considered to be low.
Sea turtles are also at risk from ship strikes. NMFS has recognized that sea turtles are highly
susceptible to vessel collisions because they regularly surface to breathe and often rest at or near the
surface. Of all dead sea turtle strandings recorded from Queensland, Australia, 14% were attributable to
ship strikes (Hazel and Gyuris 2006). A study carried out to assess the ability of green turtles to avoid
vessels in Morton Bay, Queensland, found that the proportion of turtles that displayed a flight response to

IV. Environmental Consequences
Environmental Assessment for L-DEO’s Shatsky Rise Seismic Survey, 2012 Page 55
approaching vessels decreased as speed increased, and that this was most notable for close encounters
(Hazel et al. 2007). Turtles were observed to flee from slow-moving vessels (~4 km/hr) in 60% of obser-
vations (Hazel et al. 2007). This study also indicated that a turtle‘s ability to detect an approaching vessel
was vision-dependent and so directly related to water clarity. Because the study was carried out using a
small vessel (6-m boat with a 40-hp outboard motor) in shallow (2–4 m) water, it is uncertain how the
results apply to the much larger seismic vessel in deeper water.
As noted above in § IV(1)(a) and in Appendix C, the limited available data indicate that sea turtles
will hear airgun sounds and sometimes exhibit localized avoidance, thereby reducing the risk of a
collision. Also, the probability of collision during the proposed seismic survey is expected to be low
because few encounters with sea turtles are expected.
Entanglement of sea turtles in seismic gear is also a concern; there have been reports of turtles
being trapped and killed between the gaps in tail-buoys offshore from West Africa (Weir 2007). In April
2011, a dead olive ridley turtle was found in a deflector foil of the seismic gear on the R/V Langseth
when the gear was recovered at the conclusion of a survey off of Costa Rica, where sea turtles were
numerous. Such incidents are possible, but this is the first case of sea turtle entanglement in seismic gear
for the Langseth, which has been conducting seismic surveys since 2008, or for its predecessor, R/V
Maurice Ewing, during 2003–2007. Towing the hydrophone streamer or other equipment during the
proposed survey is not expected to significantly interfere with sea turtle movements, including migration,
because sea turtles are not expected to be abundant in the survey area.
(2) Mitigation Measures for Marine Mammals and Sea Turtles
Several mitigation measures are built into the proposed seismic survey as an integral part of the
planned activities. These measures include the following: ramp ups; typically two, but a minimum of
one dedicated observer maintaining a visual watch during all daytime airgun operations; two observers for
30 min before and during ramp ups during the day and at night; PAM during the day and night to
complement visual monitoring (unless the system and back-up systems are damaged during operations);
and power downs (or if necessary shut downs) when mammals or turtles are detected in or about to enter
designated exclusion zones. Also, special mitigation measures are in place for the North Pacific right
whale. These mitigation measures are described earlier in this document, in § II(3). The fact that the 36-
airgun array, as a result of its design, directs the majority of the energy downward, and less energy
laterally, is also an inherent mitigation measure.
Previous and subsequent analysis of the potential impacts take account of these planned mitigation
measures. It would not be meaningful to analyze the effects of the planned activities without mitigation,
as the mitigation (and associated monitoring) measures are a basic part of the activities.
(3) Numbers of Marine Mammals that Could be “Taken by Harassment”
All anticipated takes would be ―takes by harassment‖, involving temporary changes in behavior.
The mitigation measures to be applied will minimize the possibility of injurious takes. (However, as
noted earlier, there is no specific information demonstrating that injurious ―takes‖ would occur even in
the absence of the planned mitigation measures.) In the sections below, we describe methods to estimate
the number of potential exposures to various received sound levels and present estimates of the numbers
of marine mammals that could be affected during the proposed seismic program. The estimates are based
on a consideration of the number of marine mammals that could be disturbed appreciably by operations

IV. Environmental Consequences
Environmental Assessment for L-DEO’s Shatsky Rise Seismic Survey, 2012 Page 56
with the 36-airgun array to be used during ~1216 km of seismic surveys at the Shatsky Rise. The sources
of distributional and numerical data used in deriving the estimates are described in the next subsection.
It is assumed that, during simultaneous operations of the airgun array and the other sources, any
marine mammals close enough to be affected by the MBES and SBP would already be affected by the
airguns. However, whether or not the airguns are operating simultaneously with the other sources, marine
mammals are expected to exhibit no more than short-term and inconsequential responses to the MBES
and SBP given their characteristics (e.g., narrow downward-directed beam) and other considerations
described in §II and IV(1)(b and c), above. Such reactions are not considered to constitute ―taking‖
(NMFS 2001). Therefore, no additional allowance is included for animals that could be affected by sound
sources other than airguns.
(a) Basis for Estimating “Take by Harassment”
Density data on 18 marine mammal species in the Shatsky Rise area are available from two sources
using conventional line transect methods: Japanese sighting surveys conducted since the early 1980s, and
fisheries observers in the high-seas driftnet fisheries during 1987–1990 (Table 3). For the 16 other
marine mammal species that could be encountered in the proposed survey area, data from the western
North Pacific are not available (Table 3). We are not aware of any density estimates for three of those
species—Hubb‘s, Stejneger‘s, and gingko-toothed beaked whales. For the remaining 13 species (Table
3), density estimates are available from other areas of the Pacific: 11 species from the offshore stratum of
the 2002 Hawaiian Islands survey (Barlow 2006) and two species from surveys of the California Current
ecosystem off the U.S. west coast between 1991 and 2005 (Barlow and Forney 2007). Those estimates
are based on standard line-transect protocols developed by NMFS Southwest Fisheries Science Center
(SWFSC).
Densities for 14 species are available from Japanese sighting surveys in the Shatsky Rise survey
area. Miyashita (1993a) provided estimates for six dolphin species in this area that have been taken in the
Japanese drive fisheries. The densities used here are Miyashita‘s (1993a) estimates for the ‗Eastern
offshore‘ survey area (30–42°N, 145°E–180°). Kato and Miyashita (1998) provided estimates for sperm
whale densities from Japanese sightings data during 1982–1996 in the western North Pacific (0–50°N,
130°E–180°), and Hakamada et al. (2004) provided density estimates for sei whales during August–
September in the JARPN II sub-areas 8 and 9 (35–50ºN, 150–170ºE excluding waters in the EEZ of
Russia) during 2002–2003. We used density estimates during May–June 2006 and 2007 for minke
whales at 35–40ºN, 157–170ºE from Hakamada et al. (2009), density estimates during 1998–2002 for
Bryde‘s whales at 31–43ºN, 145–165ºE from Kitakado et al. (2008), and density estimates during 1994–
2007 for blue, fin, humpback, and North Pacific right whales at 31–51ºN, 140–170ºE calculated from data
in Matsuoka et al. (2009).
For four species (northern fur seal, Dall‘s porpoise, Pacific white-sided dolphin, northern right-
whale dolphin), estimates of densities in the Shatsky Rise area are available from sightings data collected
by observers in the high-seas driftnet fisheries during 1987–1990 (Buckland et al. 1993). Those data were
analysed for 5° x 5° blocks, and the densities used here are from blocks for which available data overlap
the proposed survey area. In general, those data represent the average annual density in the northern half
of the Shatsky Rise survey area (35–40°N).
The densities mentioned above had been corrected by the original authors for detectability bias and,
with the exception of Kitakado et al. 2008 and Hakamada et al. 2009, for availability bias. Detectability
bias is associated with diminishing sightability with increasing lateral distance from the track line [f(0)].
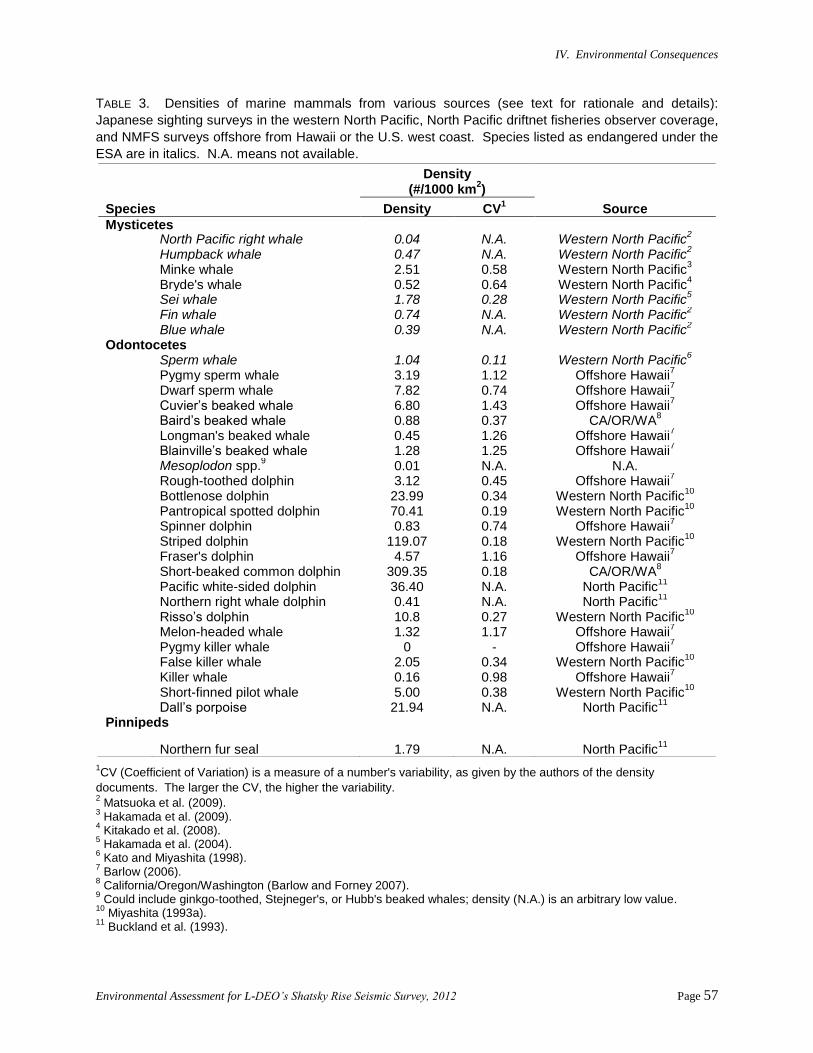
IV. Environmental Consequences
Environmental Assessment for L-DEO’s Shatsky Rise Seismic Survey, 2012 Page 57
TABLE 3. Densities of marine mammals from various sources (see text for rationale and details):
Japanese sighting surveys in the western North Pacific, North Pacific driftnet fisheries observer coverage,
and NMFS surveys offshore from Hawaii or the U.S. west coast. Species listed as endangered under the
ESA are in italics. N.A. means not available.
1CV (Coefficient of Variation) is a measure of a number's variability, as given by the authors of the density
documents. The larger the CV, the higher the variability. 2 Matsuoka et al. (2009).
3 Hakamada et al. (2009).
4 Kitakado et al. (2008).
5 Hakamada et al. (2004).
6 Kato and Miyashita (1998).
7 Barlow (2006).
8 California/Oregon/Washington (Barlow and Forney 2007).
9 Could include ginkgo-toothed, Stejneger's, or Hubb's beaked whales; density (N.A.) is an arbitrary low value.
10 Miyashita (1993a).
11 Buckland et al. (1993).
Density
(#/1000 km2)
Species Density CV1 Source
Mysticetes North Pacific right whale 0.04 N.A. Western North Pacific
2
Humpback whale 0.47 N.A. Western North Pacific2
Minke whale 2.51 0.58 Western North Pacific3
Bryde's whale 0.52 0.64 Western North Pacific4
Sei whale 1.78 0.28 Western North Pacific5
Fin whale 0.74 N.A. Western North Pacific2
Blue whale 0.39 N.A. Western North Pacific2
Odontocetes Sperm whale 1.04 0.11 Western North Pacific
6
Pygmy sperm whale 3.19 1.12 Offshore Hawaii7
Dwarf sperm whale 7.82 0.74 Offshore Hawaii7
Cuvier’s beaked whale 6.80 1.43 Offshore Hawaii7
Baird’s beaked whale 0.88 0.37 CA/OR/WA8
Longman's beaked whale 0.45 1.26 Offshore Hawaii7
Blainville’s beaked whale 1.28 1.25 Offshore Hawaii7
Mesoplodon spp.9 0.01 N.A. N.A.
Rough-toothed dolphin 3.12 0.45 Offshore Hawaii7
Bottlenose dolphin 23.99 0.34 Western North Pacific10
Pantropical spotted dolphin 70.41 0.19 Western North Pacific10
Spinner dolphin 0.83 0.74 Offshore Hawaii
7
Striped dolphin 119.07 0.18 Western North Pacific10
Fraser's dolphin 4.57 1.16 Offshore Hawaii
7
Short-beaked common dolphin 309.35 0.18 CA/OR/WA8
Pacific white-sided dolphin 36.40 N.A. North Pacific11
Northern right whale dolphin 0.41 N.A. North Pacific11
Risso’s dolphin 10.8 0.27 Western North Pacific
10
Melon-headed whale 1.32 1.17 Offshore Hawaii7
Pygmy killer whale 0 - Offshore Hawaii7
False killer whale 2.05 0.34 Western North Pacific10
Killer whale 0.16 0.98 Offshore Hawaii
7
Short-finned pilot whale 5.00 0.38 Western North Pacific10
Dall’s porpoise 21.94 N.A. North Pacific
11
Pinnipeds
Northern fur seal 1.79 N.A. North Pacific11

IV. Environmental Consequences
Environmental Assessment for L-DEO’s Shatsky Rise Seismic Survey, 2012 Page 58
Availability bias refers to the fact that there is <100% probability of sighting an animal that is present
along the survey track line, and it is measured by g(0). Densities calculated from effort, sightings, and
mean group sizes in Matsuoka et al. (2009) used a value for f(0) of 0.682 from Hakamada et al. (2009) for
the same surveys, and a value for g(0) of 0.921 from Barlow and Forney (2007).
There is some uncertainty about the representativeness of the density data and the assumptions
used in the calculations. The available densities in Miyashita (1993a) and Buckland et al. (1993) are from
the 1980s; although these densities represent the best available information for the Shatsky Rise area at
present, they will be biased if abundance or distributions of those species have changed since the data
were collected. Furthermore, the Shatsky Rise survey area represents a transitional zone across which
many species migrate (north and south) during a given year; June–July is a period of high migration
through the survey area. Therefore, there is uncertainty with respect to the expected marine mammal
densities during this time. However, the approach used here is based on the best available data.
The estimated numbers of individuals potentially exposed are based on the 160-dB re 1 μParms
criterion for all cetaceans. It is assumed that marine mammals exposed to airgun sounds that strong might
change their behavior sufficiently to be considered ―taken by harassment‖.
It should be noted that the following estimates of exposures to various sound levels assume that the
surveys will be completed; in fact, the ensonified areas calculated using the planned number of line-kilometers
have been increased by 25% to accommodate lines that may need to be repeated, equipment testing, etc. As is
typical during offshore ship surveys, inclement weather and equipment malfunctions are likely to cause delays
and may limit the number of useful line-kilometers of seismic operations that can be undertaken. Furthermore,
any marine mammal sightings within or near the designated exclusion zones will result in the power down or
shut down of seismic operations as a mitigation measure. Thus, the following estimates of the numbers of
marine mammals potentially exposed to sound levels of 160-dB re 1 μParms are precautionary and probably
overestimate the actual numbers of marine mammals that might be involved. These estimates assume that
there will be no weather, equipment, or mitigation delays, which is highly unlikely.
Furthermore, as summarized in ―Summary of Potential Airgun Effects‖, above, and Appendix
B (5), delphinids seem to be less responsive to airgun sounds than are some mysticetes. The 160-dB
(rms) criterion currently applied by NMFS, on which the following estimates are based, was developed
based primarily on data from gray and bowhead whales. A 170 dB re 1 μPa disturbance criterion (rather
than 160 dB) is considered appropriate for delphinids, which tend to be less responsive than the more
responsive cetaceans. The estimates of ―takes by harassment‖ of delphinids given below are thus
considered precautionary.
(b) Potential Number of Marine Mammals Exposed to Airgun Sounds
The number of different individual cetaceans that could be exposed to airgun sounds with received
levels 160 dB re 1 μParms on one or more occasions can be estimated by considering the expected density
of animals in the area along with the total marine area that would be within the 160-dB radius around the
operating airgun array on at least one occasion. The number of possible exposures (including repeated
exposures of the same individuals) can be estimated by considering the total marine area that would be
within the 160-dB radius around the operating airguns, including areas of overlap. In the proposed
survey, the majority of seismic lines are widely spaced in the survey area, so few individual mammals
would be exposed numerous times during the survey; the area including overlap is only 1.01 x the area
excluding overlap. Thus, an average individual marine mammal would be exposed only once during the
survey. Moreover, it is unlikely that a particular animal would stay in the area during the entire survey.

IV. Environmental Consequences
Environmental Assessment for L-DEO’s Shatsky Rise Seismic Survey, 2012 Page 59
The numbers of different individuals potentially exposed to 160 dB re 1 µParms were calculated
by multiplying
the expected species density, times
the anticipated area to be ensonified to that level during airgun operations excluding overlap.
The area expected to be ensonified was determined by entering the planned survey lines into a Map-
Info Geographic Information System (GIS), using the GIS to identify the relevant areas by ―drawing‖ the
applicable 160-dB buffer (see Table 1) around each seismic line, and then calculating the total area within
the buffers. Areas of overlap were included only once when estimating the number of individuals exposed.
Applying the approach described above, ~9229 km2 would be within the 160-dB isopleth on one or
more occasions during the survey (11,536 km2 including the 25% contingency). Because this approach
does not allow for turnover in the mammal populations in the study area during the course of the survey,
the actual number of individuals exposed could be underestimated. However, the approach assumes that
no cetaceans will move away from or toward the trackline as the Langseth approaches in response to
increasing sound levels prior to the time the levels reach 160 dB, which will result in overestimates for
those species known to avoid seismic vessels (see § IV a).
Table 4 shows the estimates of the number of different individual cetaceans that potentially could
be exposed to ≥160 dB re 1 μParms during the seismic survey if no animals moved away from the survey
vessel. The Requested Take Authorization is given in the far right column of Table 4. For endangered
species, the Requested Take Authorization has been increased to the mean group size for the particular
species in cases where the calculated number of individuals exposed was between 0.05 and the mean group
size (i.e., for the North Pacific right whale). For non-listed species, the Requested Take Authorization has
been increased to the mean group size for the particular species in cases where the calculated number of
individuals exposed was between 1 and the mean group size. Group sizes are from the sources listed in
Table 3.
Number of Cetaceans that might be Exposed to 160 dB.—The estimate of the number of
individual cetaceans that could be exposed to seismic sounds with received levels ≥160 dB re 1 µParms
during the proposed survey is 7354 (Table 4). That total includes 74 baleen whales, 39 of which are
endangered: 5 humpback whales or 0.53% of the regional population, 21 sei whales (0.21%), 9 fin
whales (0.05%), and 4 blue whales (0.13%) (Table 4).
In addition, 12 sperm whales (also listed as endangered under the ESA) or 0.04% of the regional
population could be exposed during the survey, and 108 beaked whales including Cuvier‘s, Longman‘s,
Baird‘s, and Blainville‘s beaked whales (Table 4). Most (96%) of the cetaceans potentially exposed are
delphinids; short-beaked common, striped, pantropical spotted, and Pacific white-sided dolphins are
estimated to be the most common species in the area, with estimates of 3569 (0.12% of the regional
population), 1374 (0.24%), 812 (0.19%), and 420 (0.04%) exposed to ≥160 dB re 1 μParms, respectively.
Number of Pinnipeds that might be Exposed to 160 dB.—The only pinniped species that could
occur in the offshore waters of the survey area is the northern fur seal. As summarized in § IV(1)(a) and
Appendix B, some studies suggest that most pinnipeds, like delphinids, may be less sensitive to airgun
sounds than mysticetes.
The methods described previously for cetaceans were also used to calculate the numbers of
individual northern fur seals that may be exposed during the survey. Based on the estimated density, ~21
northern fur seals could be exposed to airgun sounds 160 dB re 1 µParms.

IV. Environmental Consequences
Environmental Assessment for L-DEO’s Shatsky Rise Seismic Survey, 2012 Page 60
TABLE 4. Estimates of the possible numbers of marine mammals exposed to different sound levels during L-DEO’s proposed seismic survey at the Shatsky Rise during March–April 2012. The proposed
sound source is a 36-airgun array with a discharge volume of ~6600 in³. Received levels of airgun
sounds are expressed in dB re 1 µPa (rms, averaged over pulse duration), consistent with NMFS’ practice. Not all marine mammals will change their behavior when exposed to these sound levels, but some may alter their behavior when levels are lower (see text). Species in italics are listed under the ESA as endangered.
Number of Individuals Exposed to Sound
Levels >160 dB
Species Number
1 % Regional Pop'n²
Requested Take Authorization
North Pacific right whale 0 0.23 23
Humpback whale 5 0.53 5
Minke whale 29 0.12 29
Bryde's whale 6 0.03 6
Sei whale 21 0.21 21
Fin whale 9 0.05 9
Blue whale 4 0.13 4
Sperm whale 12 0.04 12
Pygmy sperm whale 37 N.A. 37
Dwarf sperm whale 90 <0.01 90
Cuvier’s beaked whale 78 0.39 78
Baird’s beaked whale 10 N.A. 10
Longman's beaked whale 5 N.A. 183
Blainville’s beaked whale 15 0.06 15
Mesoplodon spp.4 0 <0.01 0
Rough-toothed dolphin 36 0.02 36
Bottlenose dolphin 277 0.16 277
Pantropical spotted dolphin 812 0.19 812
Spinner dolphin 10 <0.01 323
Striped dolphin 1374 0.24 1374
Fraser's dolphin 53 0.02 2863
Short-beaked common dolphin 3569 0.12 3569
Pacific white-sided dolphin 420 0.04 420
Northern right whale dolphin 5 <0.01 5
Risso’s dolphin 125 0.01 125
Melon-headed whale 15 0.03 893
Pygmy killer whale 0 <0.01 0
False killer whale 24 0.15 24
Killer whale 2 0.02 73
Short-finned pilot whale 58 0.11 653
Dall’s porpoise 253 0.02 253
Northern fur seal 21 <0.01 21
¹ Estimates are based on densities in Table 3 and an ensonified area (including 25% contingency 11,536 km²).
² Regional population size estimates are from Table 3; NA means not available. 3 Requested Take Authorization increased to mean group size from density sources in Table 4.
4 Could include ginkgo-toothed, Stejneger's, or Hubb's beaked whales; density (not available) is an arbitrary low value

IV. Environmental Consequences
Environmental Assessment for L-DEO’s Shatsky Rise Seismic Survey, 2012 Page 61
(4) Conclusions for Marine Mammals and Sea Turtles
The proposed seismic survey will involve towing an airgun array that introduces pulsed sounds into
the ocean, along with simultaneous operation of an MBES and SBP. The survey will employ a 36-airgun
array similar to the airgun arrays used for typical high-energy seismic surveys. The total airgun discharge
volume is ~6600 in3. Routine vessel operations, other than the proposed airgun operations, are conven-
tionally assumed not to affect marine mammals sufficiently to constitute ―taking‖. No ―taking‖ of marine
mammals is expected in association with echosounder operations given the considerations discussed in
§IV(1)(b and c), i.e., sounds are beamed downward, the beam is narrow, and the pulses are extremely
short.
(a) Cetaceans
Several species of mysticetes show strong avoidance reactions to seismic vessels at ranges up to 6–
8 km and occasionally as far as 20–30 km from the source vessel when medium-large airgun arrays have
been used. However, reactions at the longer distances appear to be atypical of most species and
situations. If mysticetes are encountered, the numbers estimated to occur within the 160-dB isopleth in
the survey area are expected to be relatively low.
Odontocete reactions to seismic pulses, or at least the reactions of delphinids and Dall‘s porpoise,
are expected to extend to lesser distances than are those of mysticetes. Odontocete low-frequency hearing
is less sensitive than that of mysticetes, and dolphins are often seen from seismic vessels. In fact, there
are documented instances of dolphins approaching active seismic vessels. However, delphinids (along
with other cetaceans) sometimes show avoidance responses and/or other changes in behavior when near
operating seismic vessels.
Taking into account the mitigation measures that are planned (see § II), effects on cetaceans are
generally expected to be limited to avoidance of the area around the seismic operation and short-term
changes in behavior, falling within the MMPA definition of ―Level B harassment‖.
Estimates of the numbers of marine mammals that might be exposed to strong airgun sounds during
the proposed program have been presented together with the requested ―take authorization‖ for each
species. Those figures likely overestimate the actual number of animals that will be exposed to and will
react to the seismic sounds. The reasons for that conclusion are outlined above. The relatively short-term
exposures are unlikely to result in any long-term negative consequences for the individuals or their
populations.
The many cases of apparent tolerance by cetaceans of seismic exploration, vessel traffic, and some
other human activities show that co-existence is possible. Mitigation measures such as look outs, ramp
ups, and power downs or shut downs when marine mammals are seen within defined ranges, as well as
special mitigation measures for right whales, should further reduce short-term reactions, and avoid or
minimize any effects on hearing sensitivity. In all cases, the effects are expected to be short-term, with no
lasting biological consequence.
(b) Pinnipeds
Only one pinniped species—the northern fur seal—is likely to occur in the offshore waters of the
survey area. An estimate of 21 northern fur seals could be exposed to airgun sounds with received levels
160 dB re 1 µParms. As for cetaceans, the estimated numbers of pinnipeds that may be exposed to
received levels 160 dB are probably overestimates of the actual numbers that will be affected signifi-
cantly. Any effects are expected to be short-term, with no lasting biological consequence.

IV. Environmental Consequences
Environmental Assessment for L-DEO’s Shatsky Rise Seismic Survey, 2012 Page 62
(c) Sea Turtles
The proposed activity will occur at least ~1200 km from sea turtle nesting beaches in Japan.
Loggerheads, leatherbacks, and green turtles are known to nest in Japan. In the Shatsky Rise study area,
loggerheads are most likely to be encountered during the survey. However, at the time of the survey, at
least some loggerheads are nesting on Okinawa and adjacent islands of the central Ryukyus, Japan;
nesting begins in April and peak nesting occurs in July. Thus, some nesting females would be nearshore
or on land far from the survey area at the time of the survey. However, migrating or foraging sea turtles
could be encountered in the deep waters of the survey area at any time of year. With the implementation
of mitigation measures, it is anticipated that the proposed seismic survey will have, at most, a short-term
effect on behavior and no long-term impacts on individual sea turtles or their populations.
(5) Direct Effects on Fish, Fisheries, and Their Significance
One reason for the adoption of airguns as the standard energy source for marine seismic surveys is
that, unlike explosives, they have not been associated with large-scale fish kills. However, existing
information on the impacts of seismic surveys on marine fish populations is limited (see Appendix D).
There are three types of potential effects of exposure to seismic surveys: (1) pathological, (2)
physiological, and (3) behavioral. Pathological effects involve lethal and temporary or permanent sub-
lethal injury. Physiological effects involve temporary and permanent primary and secondary stress
responses, such as changes in levels of enzymes and proteins. Behavioral effects refer to temporary and
(if they occur) permanent changes in exhibited behavior (e.g., startle and avoidance behavior). The three
categories are interrelated in complex ways. For example, it is possible that certain physiological and
behavioral changes could potentially lead to an ultimate pathological effect on individuals (i.e.,
mortality).
The specific received sound levels at which permanent adverse effects to fish potentially could
occur are little studied and largely unknown. Furthermore, the available information on the impacts of
seismic surveys on marine fish is from studies of individuals or portions of a population; there have been
no studies at the population scale. The studies of individual fish have often been on caged fish that were
exposed to airgun pulses in situations not representative of an actual seismic survey. Thus, available
information provides limited insight on possible real-world effects at the ocean or population scale. This
makes drawing conclusions about impacts on fish problematic because, ultimately, the most important
issues concern effects on marine fish populations, their viability, and their availability to fisheries.
Hastings and Popper (2005), Popper 2009, and Popper and Hastings (2009a,b) provided recent
critical reviews of the known effects of sound on fish. The following sections provide a general synopsis
of the available information on the effects of exposure to seismic and other anthropogenic sound as
relevant to fish. The information comprises results from scientific studies of varying degrees of rigor plus
some anecdotal information. Some of the data sources may have serious shortcomings in methods,
analysis, interpretation, and reproducibility that must be considered when interpreting their results (see
Hastings and Popper 2005). Potential adverse effects of the program‘s sound sources on marine fish are
then noted.
(a) Pathological Effects
The potential for pathological damage to hearing structures in fish depends on the energy level of
the received sound and the physiology and hearing capability of the species in question (see Appendix D).
For a given sound to result in hearing loss, the sound must exceed, by some substantial amount, the
hearing threshold of the fish for that sound (Popper 2005). The consequences of temporary or permanent
IV. Environmental Consequences
Environmental Assessment for L-DEO’s Shatsky Rise Seismic Survey, 2012 Page 63
hearing loss in individual fish on a fish population are unknown; however, they likely depend on the
number of individuals affected and whether critical behaviors involving sound (e.g., predator avoidance,
prey capture, orientation and navigation, reproduction, etc.) are adversely affected.
Little is known about the mechanisms and characteristics of damage to fish that may be inflicted by
exposure to seismic survey sounds. Few data have been presented in the peer-reviewed scientific literature.
As far as we know, there are only two papers with proper experimental methods, controls, and careful
pathological investigation implicating sounds produced by actual seismic survey airguns in causing adverse
anatomical effects. One such study indicated anatomical damage, and the second indicated TTS in fish
hearing. The anatomical case is McCauley et al. (2003), who found that exposure to airgun sound caused
observable anatomical damage to the auditory maculae of ―pink snapper‖ (Pagrus auratus). This damage in
the ears had not been repaired in fish sacrificed and examined almost two months after exposure. On the
other hand, Popper et al. (2005) documented only TTS (as determined by auditory brainstem response) in
two of three fish species from the Mackenzie River Delta. This study found that broad whitefish
(Coregonus nasus) that received a sound exposure level of 177 dB re 1 µPa2 · s showed no hearing loss.
During both studies, the repetitive exposure to sound was greater than would have occurred during a typical
seismic survey. However, the substantial low-frequency energy produced by the airguns [less than ~400 Hz
in the study by McCauley et al. (2003) and less than ~200 Hz in Popper et al. (2005)] likely did not
propagate to the fish because the water in the study areas was very shallow (~9 m in the former case and
<2 m in the latter). Water depth sets a lower limit on the lowest sound frequency that will propagate (the
―cutoff frequency‖) at about one-quarter wavelength (Urick 1983; Rogers and Cox 1988).
Wardle et al. (2001) suggested that in water, acute injury and death of organisms exposed to
seismic energy depends primarily on two features of the sound source: (1) the received peak pressure and
(2) the time required for the pressure to rise and decay. Generally, as received pressure increases, the
period for the pressure to rise and decay decreases, and the chance of acute pathological effects increases.
According to Buchanan et al. (2004), for the types of seismic airguns and arrays involved with the
proposed program, the pathological (mortality) zone for fish would be expected to be within a few meters
of the seismic source. Numerous other studies provide examples of no fish mortality upon exposure to
seismic sources (Falk and Lawrence 1973; Holliday et al. 1987; La Bella et al. 1996; Santulli et al. 1999;
McCauley et al. 2000a,b, 2003; Bjarti 2002; Thomsen 2002; Hassel et al. 2003; Popper et al. 2005;
Boeger et al. 2006).
Some studies have reported, some equivocally, that mortality of fish, fish eggs, or larvae can occur
close to seismic sources (Kostyuchenko 1973; Dalen and Knutsen 1986; Booman et al. 1996; Dalen et al.
1996). Some of the reports claimed seismic effects from treatments quite different from actual seismic
survey sounds or even reasonable surrogates. However, Payne et al. (2009) reported no statistical
differences in mortality/morbidity between control and exposed groups of capelin eggs or monkfish
larvae. Saetre and Ona (1996) applied a ‗worst-case scenario‘ mathematical model to investigate the
effects of seismic energy on fish eggs and larvae. They concluded that mortality rates caused by exposure
to seismic surveys are so low, as compared to natural mortality rates, that the impact of seismic surveying
on recruitment to a fish stock must be regarded as insignificant.
(b) Physiological Effects
Physiological effects refer to cellular and/or biochemical responses of fish to acoustic stress. Such
stress potentially could affect fish populations by increasing mortality or reducing reproductive success.
Primary and secondary stress responses of fish after exposure to seismic survey sound appear to be
temporary in all studies done to date (Sverdrup et al. 1994; Santulli et al. 1999; McCauley et al. 2000a,b).

IV. Environmental Consequences
Environmental Assessment for L-DEO’s Shatsky Rise Seismic Survey, 2012 Page 64
The periods necessary for the biochemical changes to return to normal are variable and depend on
numerous aspects of the biology of the species and of the sound stimulus (see Appendix D).
(c) Behavioral Effects
Behavioral effects include changes in the distribution, migration, mating, and catchability of fish
populations. Studies investigating the possible effects of sound (including seismic survey sound) on fish
behavior have been conducted on both uncaged and caged individuals (e.g., Chapman and Hawkins 1969;
Pearson et al. 1992; Santulli et al. 1999; Wardle et al. 2001; Hassel et al. 2003). Typically, in these
studies fish exhibited a sharp ―startle‖ response at the onset of a sound followed by habituation and a
return to normal behavior after the sound ceased.
In general, any adverse effects on fish behavior or fisheries attributable to seismic testing may
depend on the species in question and the nature of the fishery (season, duration, fishing method). They
may also depend on the age of the fish, its motivational state, its size, and numerous other factors that are
difficult, if not impossible, to quantify at this point, given such limited data on effects of airguns on fish,
particularly under realistic at-sea conditions.
(d) Effects on Fisheries
One possible gear conflict is the Langseth‘s streamer entangling with fishing gear. L-DEO will
employ avoidance tactics as necessary to prevent conflict. It is not expected that L-DEO‘s operations will
have a significant impact on commercial fisheries in the Northwest Pacific Ocean. Nonetheless, L-DEO
will minimize the potential to have a negative impact on the fisheries by avoiding areas where fishing is
actively underway.
There is general concern about potential adverse effects of seismic operations on fisheries, namely
a potential reduction in the ―catchability‖ of fish involved in fisheries. Although reduced catch rates have
been observed in some marine fisheries during seismic testing, in a number of cases the findings are
confounded by other sources of disturbance (Dalen and Raknes 1985; Dalen and Knutsen 1986; Løkke-
borg 1991; Skalski et al. 1992; Engås et al. 1996). In other airgun experiments, there was no change in
catch per unit effort (CPUE) of fish when airgun pulses were emitted, particularly in the immediate
vicinity of the seismic survey (Pickett et al. 1994; La Bella et al. 1996). For some species, reductions in
catch may have resulted from a change in behavior of the fish, e.g., a change in vertical or horizontal dist-
ribution, as reported in Slotte et al. (2004).
(6) Direct Effects on Invertebrates and Their Significance
(a) Seismic operations
The existing body of information on the impacts of seismic survey sound on marine invertebrates is
very limited. However, there is some unpublished and very limited evidence of the potential for adverse
effects on invertebrates, thereby justifying further discussion and analysis of this issue. The three types of
potential effects of exposure to seismic surveys on marine invertebrates are pathological, physiological,
and behavioral. Based on the physical structure of their sensory organs, marine invertebrates appear to be
specialized to respond to particle displacement components of an impinging sound field and not to the
pressure component (Popper et al. 2001; see also Appendix E).
The only information available on the impacts of seismic surveys on marine invertebrates involves
studies of individuals; there have been no studies at the population scale. Thus, available information
provides limited insight on possible real-world effects at the regional or ocean scale. The most important
IV. Environmental Consequences
Environmental Assessment for L-DEO’s Shatsky Rise Seismic Survey, 2012 Page 65
aspect of potential impacts concerns how exposure to seismic survey sound ultimately affects invertebrate
populations and their viability, including availability to fisheries.
Literature reviews of the effects of seismic and other underwater sound on invertebrates were
provided by Moriyasu et al. (2004) and Payne et al. (2008). The following sections provide a synopsis of
available information on the effects of exposure to seismic survey sound on species of decapod
crustaceans and cephalopods, the two taxonomic groups of invertebrates on which most such studies have
been conducted. The available information is from studies with variable degrees of scientific soundness
and from anecdotal information. A more detailed review of the literature on the effects of seismic survey
sound on invertebrates is provided in Appendix E.
Pathological Effects.—In water, lethal and sub-lethal injury to organisms exposed to seismic
survey sound appears to depend on at least two features of the sound source: (1) the received peak
pressure, and (2) the time required for the pressure to rise and decay. Generally, as received pressure
increases, the period for the pressure to rise and decay decreases, and the chance of acute pathological
effects increases. For the type of airgun array planned for the proposed program, the pathological
(mortality) zone for crustaceans and cephalopods is expected to be within a few meters of the seismic
source, at most; however, very few specific data are available on levels of seismic signals that might
damage these animals. This premise is based on the peak pressure and rise/decay time characteristics of
seismic airgun arrays currently in use around the world.
Some studies have suggested that seismic survey sound has a limited pathological impact on early
developmental stages of crustaceans (Pearson et al. 1994; Christian et al. 2003; DFO 2004). However,
the impacts appear to be either temporary or insignificant compared to what occurs under natural
conditions. Controlled field experiments on adult crustaceans (Christian et al. 2003, 2004; DFO 2004)
and adult cephalopods (McCauley et al. 2000a,b) exposed to seismic survey sound have not resulted in
any significant pathological impacts on the animals. It has been suggested that giant squid strandings were
caused by exposure to commercial seismic survey activities (Guerra et al. 2004), but there was little
evidence to support the claim. André et al. (2011) exposed cephalopods, primarily cuttlefish, to
continuous 50–400 Hz sinusoidal wave sweeps for two hours while captive in relatively small tanks, and
reported morphological and ultrastructural evidence of massive acoustic trauma (i.e., permanent and
substantial alterations of statocyst sensory hair cells). The received SPL was reported as 157±5 dB re
1µPa, with peak levels at 175 dB re 1µPa. As in the McCauley et al. (2003) paper on sensory hair cell
damage in pink snapper as a result of exposure to seismic sound, the cephalopods were subjected to
higher sound levels than they would be under natural conditions, and they were unable to swim away
from the sound source.
Physiological Effects.—Physiological effects refer mainly to biochemical responses by marine
invertebrates to acoustic stress. Such stress potentially could affect invertebrate populations by increasing
mortality or reducing reproductive success. Primary and secondary stress responses (i.e., changes in
haemolymph levels of enzymes, proteins, etc.) of crustaceans have been noted several days or months
after exposure to seismic survey sounds (Payne et al. 2007). The periods necessary for these biochemical
changes to return to normal are variable and depend on numerous aspects of the biology of the species
and of the sound stimulus.
Behavioral Effects.—There is increasing interest in assessing the possible direct and indirect
effects of seismic and other sounds on invertebrate behavior, particularly in relation to the consequences
for fisheries. Changes in behavior could potentially affect such aspects as reproductive success, distribu-
tion, susceptibility to predation, and catchability by fisheries. Studies investigating the possible behavior-

IV. Environmental Consequences
Environmental Assessment for L-DEO’s Shatsky Rise Seismic Survey, 2012 Page 66
al effects of exposure to seismic survey sound on crustaceans and cephalopods have been conducted on
both uncaged and caged animals. In some cases, invertebrates exhibited startle responses (e.g., squid in
McCauley et al. 2000a,b). In other cases, no behavioral impacts were noted (e.g., crustaceans in Christian
et al. 2003, 2004; DFO 2004). There have been anecdotal reports of reduced catch rates of shrimp shortly
after exposure to seismic surveys; however, other studies have not observed any significant changes in
shrimp catch rate (Andriguetto-Filho et al. 2005). Similarly, Parry and Gason (2006) did not find any evi-
dence that lobster catch rates were affected by seismic surveys. Any adverse effects on crustacean and
cephalopod behavior or fisheries attributable to seismic survey sound depend on the species in question
and the nature of the fishery (season, duration, fishing method).
(7) Direct Effects on Seabirds and Their Significance
Investigations into the effects of airguns on seabirds are extremely limited. Stemp (1985)
conducted opportunistic observations on the effects of seismic exploration on seabirds, and Lacroix et al.
(2003) investigated the effect of seismic surveys on molting long-tailed ducks in the Beaufort Sea,
Alaska. Stemp (1985) did not observe any effects of seismic testing, although he warned that his
observations should not be extrapolated to areas with large concentrations of feeding or molting birds. In
a more intensive and directed study, Lacroix et al. (2003) did not detect any effects of nearshore seismic
exploration on molting long-tailed ducks in the inshore lagoon systems of Alaska‘s North Slope. Both
aerial surveys and radio-tracking indicated that the proportion of ducks that stayed near their marking
location from before to after seismic exploration was unaffected by proximity to seismic survey activities.
Seismic activity also did not appear to change the diving intensity of long-tailed ducks significantly.
Birds might be affected slightly by seismic sounds from the proposed study, but the impacts are not
expected to be significant to individual birds or their populations. The types of impacts that are possible
are summarized below:
Localized, temporary displacement and disruption of feeding.—Such displacements would be
similar to those caused by other large vessels that passed through the area. Agness et al. (2008) reported
changes in behavior of Kittlitz‘s murrelets in the presence of large, fast-moving vessels, and suggested the
possibility of biological effects attributable to increased energy expenditure by the birds. However, the
Langseth travels at a relatively slow speed (7.4–9.3 km/h) during seismic acquisition.
Modified prey abundance.—It is unlikely that prey species for birds will be affected by seismic
activities to a degree that affects the foraging success of birds. If prey species exhibit avoidance of the
ship, the avoidance is expected to be transitory and limited to a very small portion of a bird‘s foraging
range.
Disturbance to breeding birds.—A vessel (seismic or otherwise) that approaches too close to a
breeding colony could disturb adult birds from nests in response to sonic or visual stimuli. There is little
potential for this during the proposed survey, because the seismic vessel will be at least 1200 km from
land.
Egg and nestling mortality.—Disturbance of adult birds from nests can lead to egg or nestling
mortality via temperature stress or predation. There is no potential for this considering the distance that
the seismic survey will occur from land.
Chance injury or mortality.—Many species of marine birds feed by diving to depths of several
meters or more. Flocks of feeding birds may consist of hundreds or even thousands of individuals. Also,
some species of seabirds (particularly alcids) escape from boats by diving when the boat gets too close. It

IV. Environmental Consequences
Environmental Assessment for L-DEO’s Shatsky Rise Seismic Survey, 2012 Page 67
is possible that, during the course of normal feeding or escape behavior, some birds could be near enough
to an airgun to be injured by a pulse. Although no specific information is available about the circum-
stances (if any) where this might occur, the negligible aversive reactions of birds to airguns (see above)
suggest that a bird would have to be very close to any airgun to receive a pulse with sufficient energy to
cause injury, if that is possible at all.
Induced injury or mortality.—If it disorients, injures, or kills prey species, or otherwise increases
the availability of prey species to marine birds, a seismic survey could attract birds. Birds drawn too
close to an airgun may be at risk of injury. However, available evidence from other seismic surveys
utilizing airguns has not shown a pattern of fish (or other prey) kills from airguns [see § IV(5), above].
Thus, the potential that birds would be attracted and subsequently injured by the proposed seismic survey
appears very low.
(8) Indirect Effects on Marine Mammals, Sea Turtles, and Seabirds, and Their Significance
The proposed airgun operations will not result in any permanent impact on habitats used by marine
mammals, sea turtles, or seabirds, or to the food sources they use. The main impact issue associated with
the proposed activities will be temporarily elevated noise levels and the associated direct effects on
marine mammals, sea turtles, and seabirds, as discussed above.
During the seismic study, only a small fraction of the available habitat would be ensonified at any
given time. Disturbance to fish species and invertebrates would be short-term, and fish would return to
their pre-disturbance behavior once the seismic activity ceased [see § IV(5) and § IV(6), above]. Thus,
the proposed survey would have little impact on the abilities of marine mammals, sea turtles, or seabirds
to feed in the area where seismic work is planned.
Some mysticetes feed on concentrations of zooplankton. A reaction by zooplankton to a seismic
impulse would only be relevant to whales if it caused a concentration of zooplankton to scatter. Pressure
changes of sufficient magnitude to cause that type of reaction would probably occur only very close to the
source. Impacts on zooplankton behavior are predicted to be negligible, and that would translate into
negligible impacts on those mysticetes that feed on zooplankton.
(9) Cumulative Effects
Cumulative effects refer to the impacts on the environment that result from a combination of past,
existing, and reasonably foreseeable projects and human activities. Causal agents of cumulative effects can
include multiple causes, multiple effects, effects of activities in more than one locale, and recurring events.
Human activities, when conducted separately or in combination with other activities, could affect marine
mammals and sea turtles in the Shatsky Rise study area. However, understanding the cumulative effects for
marine mammals and sea turtles is complex because of the animals‘ extensive habitat ranges, and the
difficulty in monitoring populations and determining the level of impacts that may result from certain
activities. For example, to consider all possible stressors on loggerhead turtles we may need to consider all
human activity throughout their feeding and migratory ranges (from the coasts of Baja California and
Hawaii to Asia and the high seas in between). Instead, here we focus on activities that could impact animals
specifically in the region of Shatsky Rise (i.e., vessel traffic, fishing, and whaling and harvesting).
(a) Past and future research activities in the area
In 2009, the Integrated Ocean Drilling Program conducted a study at the Shatsky Rise from 4
September to 3 November. A drill ship was used to collect samples at six sites on the Shatsky Rise to

IV. Environmental Consequences
Environmental Assessment for L-DEO’s Shatsky Rise Seismic Survey, 2012 Page 68
examine the history, source(s), and evolution of this plateau. In 2010, the Langseth conducted part of the
original marine geophysical survey at the Shatsky Rise. Data collection along 3279 km of seismic survey
transect lines using ocean bottom seismometers was carried out in the region. As noted previously,
because of medical emergencies the survey was unable to be completed. As a result, the PIs are interested
in returning to the Shatsky Rise area for data collection necessary to complete their research objectives.
Other scientific research activities may have been or may be conducted in this region in the future,
however no other marine geophysical surveys are proposed using the Langseth in the foreseeable future.
(b) Vessel noise, collisions, entanglement in equipment
Vessel traffic in the proposed study area will generally consist of commercial fishing vessels and
potentially other large commercial (cargo) ships, but is anticipated to be fairly low. Vessel traffic has the
potential to affect marine mammals and sea turtles via disturbance and collisions. Noise from large
vessels generally dominates ambient noise at frequencies from 20 to 300 Hz (Richardson et al. 1995).
Baleen whales are thought to be more sensitive to sound at these low frequencies than are toothed whales,
possibly causing localized avoidance by marine mammals of the study area during seismic operations.
Many odontocetes show considerable tolerance of vessel traffic, although they sometimes react at long
distances if confined by ice or shallow water, if previously harassed by vessels, or have had little or no
recent exposure to ships (Richardson et al. 1995). Dolphins of many species tolerate and sometimes
approach vessels. Additional discussion of effects of large vessels and vessels in general is given in
Section IV(1)(d), above.
Killer whales rarely show avoidance to boats within 400 m (Duffus and Dearden 1993), but when
more than one boat is nearby, they sometimes swim faster towards less confined waters (Kruse 1991;
Williams et al. 2002a,b). Killer whales have also been shown to increase travelling and decrease
foraging behavior because of the presence of nearby vessels (Williams et al. 2002a,b). Vessel impact
studies of southern resident killer whales also showed decreased foraging in the presence of boats
(Lusseau et al. 2009) and other behavioral responses (e.g., Noren et al. 2009), indicating that vessel
disturbance may have long-term consequences for this endangered small population of killer whales.
In Western Australia, bottlenose dolphin behavior became more erratic and dolphin schools
tightened in response to controlled boat interactions (Bejder et al. 2006). During vessel interactions
with bottlenose dolphins in New Zealand, travelling behavior increased and resting behavior decreased
(Lusseau 2003, 2004). Also, dolphins apparently avoided areas and times characterized by high vessel
traffic (Lusseau 2005). Common dolphins in New Zealand have also reacted to boats with changes in
their overall behavioral budget, including decreases in foraging and resting times and increases in
socializing and milling behavior (Stockin et al. 2008).
Sperm whales can often be approached with small motorized or sailing vessels (Papastavrou et al.
1989), but sometimes avoid outboard-powered whale watching vessels up to 2 km away (J. McGibbon in
Cawthorn 1992). Resident sperm whales that are repeatedly exposed to small vessels show subtle
changes in various measures of behavior, and transient individuals (which presumably have less exposure
to vessels) react more strongly (Richter et al. 2003, 2006). There are few data on the behavioral reactions
of beaked whales to vessel noise, though they seem to avoid approaching vessels (e.g., Würsig et al.
1998) or dive for an extended period when approached by a vessel (e.g., Kasuya 1986). Based on a single
observation, Aguilar-Soto et al. (2006) suggest foraging efficiency of Cuvier‘s beaked whales may be
reduced by close approach of vessels.
Reactions of humpback whales to boats are variable, ranging from approach to avoidance (Payne
1978; Salden 1993). In southeast Alaska, concern was raised that increasing vessel traffic in Glacier Bay
IV. Environmental Consequences
Environmental Assessment for L-DEO’s Shatsky Rise Seismic Survey, 2012 Page 69
National Park may have caused humpbacks to leave the bay, particularly early in 1978 (Jurasz and Jurasz
1979). A subsequent detailed study confirmed that humpbacks often move away when vessels are
within several km (Baker et al. 1982, 1983; Baker and Herman 1989), although reactions of humpbacks
vary considerably. Humpbacks seem less likely to react overtly when actively feeding than when resting
or engaged in other activities (Krieger and Wing 1984, 1986). More recent studies of humpback whale
responses to approaching vessels have been carried out on breeding grounds. Off the coast of mainland
Ecuador, humpback whales were found to react to the approach of whale-watching boats by increasing
swim speeds significantly (Scheidat et al. 2004), and behavioral responses including abrupt course
changes and long dive times have also been reported for humpback whales in Hawaiian waters (Green
1998 in Nowacek et al. 2007). There is limited information available about the reactions of rorquals to
vessels, but in general, cetacean reactions to vessels are varied. Some researchers suggest that vessel
disturbances can lead to biologically-significant effects with long-term consequences for individuals or
populations (see Lusseau and Bejder 2007), and urge that management schemes be established for popu-
lations with multiple potential stressors (e.g., Higham et al. 2009).
Another concern with vessel traffic is the potential for striking marine mammals. Jensen and Silber
(2004) assembled a database of whale strikes reported throughout the world. Of the 292 records of
confirmed or possible ship strikes to large whales, most were reported in North America, but this may be
an artifact of data collection procedures and/or decreased reporting in other global jurisdictions. Two
were reported for offshore Japan (Jensen and Silber 2004). The probability of a ship strike resulting in a
lethal injury (mortality or severe injury) of a large cetacean increases with ship speed (Laist et al. 2001;
Vanderlaan and Taggart 2007). Most lethal and severe injuries to large whales occur when vessels travel
at 14 kt or faster, and the probability of severe or lethal injury to a whale approaches 100% in the event of
a direct strike when a ship is traveling faster than 15 kt (Laist et al. 2001; Vanderlaan and Taggart 2007).
The probability of a ship strike is a function of vessel density, animal density, and vessel speed. Vessel
and animal density (particularly of baleen whales) are expected to be relatively low at Shatsky Rise. In
addition, given the slow speed of the seismic vessel (~4 kt), the probability of injurious or fatal strikes
with mammals during the proposed operations is considered to be low.
Direct physical effects to sea turtles during seismic operations could include ship collisions and
entanglement with seismic gear. Vessels traveling at speeds >4 km/h are more likely to collide with turtles
at sea, which can result in turtle injury or death (Hazel et al. 2007). Large species like leatherbacks that
spend extended periods near the surface are particularly susceptible to ship strikes. Because the prevalence
of ship strikes are a function of vessel density and turtle density―both of which will be low at Shatsky
Rise―the probability of collision during the seismic survey is expected to be low. Ship-turtle collisions are
more likely in coastal areas where boat traffic is high and during nesting seasons when turtles aggregate.
Entanglement of sea turtles in seismic gear is also a concern; there have been reports of turtles
being trapped and killed between the gaps in tail-buoys offshore of West Africa (Weir 2007). Again, the
probability of entanglements will be a function of turtle density in the study area, which is expected to be
low. Towing of hydrophone streamers or other equipment is not expected to significantly interfere with
sea turtle movements, including migration, unless they were to become entrapped as indicated above.
(c) Fisheries
Commercial fishing activities have the potential to affect marine mammals and turtles by reducing
prey availability or accidentally entangling or hooking individual animals (Cheng and Chen 1997; Smith et
al. 2003; Reeves et al. 2003). In the offshore waters of the Northwest Pacific Ocean, tuna is the primary
fishery. The Western and Central Pacific Fisheries Commission (WCPFC) regulates this fishery. Tuna are

IV. Environmental Consequences
Environmental Assessment for L-DEO’s Shatsky Rise Seismic Survey, 2012 Page 70
caught using longlines, pole-and-line, purse seines, and trolls. Japanese longliners mainly land albacore,
bigeye, and yellowfin tuna in the WCPFC region, but marlin and swordfish are also caught (WCPFC 2010).
In recent years, the majority of the catch by Japanese longliners in the WCPFC consisted of bigeye tuna
(WCPFC 2010). The number of Japanese distant water and offshore longline vessels have decreased over
the years in the WCPFC region, from 1520 in 1980 to 165 in 2009 (WCPFC 2010). Similarly, the catch has
decreased steadily, from ~138,021 t in 1980 to ~29,553 t in 2009 (WCPFC 2010). In contrast, the Japanese
purse-seine fishery, which mainly targets skipjack, has continued to grow since the early 1970s; the total
catch for 2009 was ~231,922 t (WCPFC 2010). The Japanese pole-and-line catch also consists primarily of
skipjack; the catch has leveled off since 1990 at ~150,000 t annually (WCPFC 2010). In 2009, a total of
~2.5 million t of tuna were taken in the WCPFC region; by country, Japan took the largest catch or 16% of
that total (WCPFC 2010).
In the Shatsky Rise area, most fishing effort takes place by Japan, although some longliners are
from Vanuatu and possibly China (Lawson 2008). Within or near the study area, Japanese longliners
landed mostly bigeye, followed by albacore tuna in 2006; the Vanuatu longliner catch in 2007 consisted
only of albacore tuna (Lawson 2008). Albacore tuna and skipjack were landed by pole-and-line methods
by Japanese vessels in 2006; in 2007, Japanese purse-seiners landed mainly skipjack to the west of the
study area (Lawson 2008).
(d) Bycatch
Bycatch has been recognized as a significant cause of cetacean mortality for the past 30 to 40 years
since the worldwide proliferation of synthetic gill nets (Reeves et al. 2003). There is also concern over
the potential effects of trawl and longline activities on cetaceans. In many cases, cetacean bycatch is
regarded by fishermen as a nuisance since time and effort are required to free animals from nets and
resulting damage to equipment. Bycatch is often discarded at sea, although some animals are reported
simply as bycatch to government agencies and then sold at markets. Baker et al. (2006) reported incon-
sistencies when studying mitochondrial DNA from samples of cetacean products at markets in Korea; in
2003, three of eight species identified in markets were not reported, and five of 11 species were not
recorded in 2004. This suggests poor record keeping or illegal harvesting.
The level of impacts to cetaceans from entanglement and bycatch and how these impacts may affect
populations are unknown. In Japan, up to 130 minke whales are ‗incidentally‘ taken in the trap-net fishery;
other baleen whales and small cetaceans are also taken occasionally. Parsons and Jefferson (2000) reported
eight of 64 cetaceans examined post-mortem from the waters near Hong Kong exhibited wounds consistent
with fisheries bycatch suggesting possible high incidence of cetacean interaction with fishing gear. Off the
east coast of Taiwan, entanglement of marine mammals in drift gillnets occurs frequently (Perrin et al.
2005); between 27,000 and 41,000 cetaceans are thought to be taken incidentally by fisheries each year.
The critically endangered Western North Pacific gray whale also experiences mortality from entrapment or
entanglement in fishing gear. In recent years, there have been several mortalities of gray whales undergoing
migration due to coastal net fisheries, particularly off Japan (Weller et al. 2008). It is unknown how fishing
activities affect cetaceans in the offshore Shatsky Rise region.
Incidental capture in commercial fishing gear is also a major threat to sea turtles throughout the
Pacific Ocean, including coastal waters of southeast Asia (Frazier et al. 1998), offshore of Hawaii
(Skillman and Balazs 1992; Polovina et al. 2000), and the Kuroshio Extension (Lewison et al. 2004;
Yokota et al. 2006). Prior to the North Pacific drift net fishery moratorium, as many as 4000 loggerheads
were taken annually in the North Pacific, and 16,000 turtles of all species in the west Pacific (Bowen et al.
1995). Currently, longline fisheries are a significant threat to leatherbacks and loggerheads in the North

IV. Environmental Consequences
Environmental Assessment for L-DEO’s Shatsky Rise Seismic Survey, 2012 Page 71
Pacific and in the warm water masses of the Kuroshio Extension (Polovina et al. 2000; Lewison et al.
2004; Kaplan 2005; Yokota et al. 2006). In 2002, 2003, and 2004, only loggerheads were caught in the
Kuroshio Extension by the longliners (Yokota et al. 2006). Lewison et al. (2004) estimated that 30,000 to
75,000 loggerheads are taken as bycatch in longlines in 2000 in the Pacific; although the estimate for
leatherbacks was lower (20,000 to 40,000).
Nishimura and Nakahigashi (1990) estimated that Japanese research and training vessels captured
over 21,200 turtles historically in the western Pacific and South China Sea, of which an estimated 12,296
were killed. Of 395 loggerhead turtles tagged while nesting on Senri Beach in Japan between 1990 and
1995, two were captured by trawler nets in the East China Sea, and seven were captured by set-nets along
the coast of Japan (Sato et al. 1997). Set-net fisheries have been the main source of coastal fisheries
bycatch in Taiwan, where most turtles caught incidentally were once slaughtered or sold (now they are
usually released back into the sea; Chan et al. 2007).
(e) Whaling and Harvesting
Whaling and harvesting directly impacts cetacean and turtle populations. Whales and small
cetaceans have been hunted for centuries in the western North Pacific. Legal harvesting of cetaceans still
occurs in Japan and Russia (Rudolph and Smeenk 2002). Japan joined the IWC in 1951, and currently
conducts whaling under scientific permit; the former USSR (now Russian Federation) joined in 1948 and
is engaged in aboriginal subsistence whaling. China and Korea are also members of the IWC.
In Japan, the fishery for cetaceans includes small-type whaling, drive fishery for dolphins, and
hand harpoon fishery for dolphins and porpoises (Kasuya 2002b, 2007). Currently, five small-type
whaling vessels are in operation in Japan with annual quotas of 62 Baird‘s beaked whales, 100 short-
finned pilot whales, and 20 Risso‘s dolphins (Kasuya 2007). Drive fisheries for six different dolphin
species still occur on the Izu and Kii coasts; the quota is ~3000 dolphins (Kasuya 2002b, 2007). Dolphins
and porpoises are also taken in harpoon fisheries; currently ~400 vessels of Hokkaido, Sanriku, Boso, Kii,
and Okinawa are in operation (Kasuya 2002b). The quotas for the drive and harpoon fisheries are 17,700
Dall‘s porpoises, 1300 Risso‘s dolphins, 1100 bottlenose dolphins, 950 pantropical spotted dolphins, 500
short-finned pilot whales, and 50 false killer whales (Kasuya 2007).
Although the IWC banned commercial whaling in 1985/1986, Japan still conducts large-type
whaling. The Japan Institute of Cetacean Research (ICR) started whaling for scientific purposes in the
1987/1988 Antarctic season and in 1994 in the North Pacific (Kasuya 2002b; IWC 2010b). In the North
Pacific, the catches of minkes increased from 21 in 1994 to 171 in 2008 (IWC 2010b). Since 2000,
annual catches have also included up to 101 sei, 51 Bryde‘s, and 10 sperm whales (IWC 2010b). Up to
62 Baird‘s beaked whales are also taken annually (Kasuya 2007). In 1986, the Republic of Korea also
took 69 minke whales in the North Pacific under a ‗scientific‘ permit (IWC 2010b). No commercial
whaling has taken place in Russia since the moratorium; however, aboriginal subsistence whaling for
eastern North Pacific gray whales still continues in the North Pacific by natives of Chukotka, Russia.
Catch limits are imposed by the IWC (2010c).
Historically cetaceans were hunted in southern Taiwan; baleen whales as well as beaked and killer
whales were taken. Up until 1990, a drive fishery of false killer whales occurred in the Penghu Islands,
Taiwan, where dozens of whales were taken. Although killing and capturing of cetaceans has been
prohibited in Taiwan since August 1990 under the Wildlife Conservation Law (Zhou et al. 1995; Chou
2004), illegal harpooning still occurs (Perrin et al. 2005). From 1993 to 1995, ~600 cetaceans were taken
by harpoon per year in Nanfang Ao, in northeast Taiwan, despite this practice being outlawed since 1990
under the Wildlife Conservation Law (Zhou et al. 1995; Chou 2004; Perrin et al. 2005). Bryde‘s whales
IV. Environmental Consequences
Environmental Assessment for L-DEO’s Shatsky Rise Seismic Survey, 2012 Page 72
have been harvested in the Philippines, and until the 1990s, there was also a significant hunt of small
cetaceans (Rudolph and Smeenk 2002). However, this hunt seems to have almost disappeared after
successive bans on the harvesting of whales and dolphins by the Philippine Government during the 1990s.
In China, a considerable number of sea turtles were harvested before they were listed as a protected
species in 1988 (Liang et al. 1990 in Chan et al. 2007). Both the eggs and nesting turtles were harvested
for consumption from nesting sites such as those at Gangkou and the Xisha Archipelago (Chan et al.
2007). In Gangkou, 60,000 to 200,000 eggs of green turtles were collected each year before the 1950s
(Zhang 1995). Green turtles were also intensively fished, mostly during summer and autumn, in the
Xisha Archipelago (Frazier et al. 1988). Direct beach harvesting for meat was common in Taiwan in the
early 1970s, especially along the east coast, resulting in the mortality of most of the nesting green turtles
(I.J. Cheng, unpubl. data 1995; Chan et al. 2007). Similar to green turtles, the population of hawksbill
turtles in China declined dramatically in recent decades due to overharvesting. Currently, the direct
harvesting of sea turtles and egg poaching is prohibited in protected nesting sites; however, illegal capture
still occurs (Chan et al. 2007).
(f) Summary of Cumulative Impacts
The marine mammals and sea turtles encountered in the Shatsky Rise region will either be
migrating elsewhere or temporarily feeding in patches of high productivity associated with the Kuroshio
Extension and bifurcation (west of the study area). These same individuals rely heavily on other oceanic
regions, distant to the study area, to feed and breed, where other stressors (e.g., marine pollution, habitat
loss) may impact populations. Major threats to sea turtles in coastal areas include hunting and poaching,
the collection of eggs, coastal development, increased tourism, beach sand mining, ingestion of plastic
and marine garbage, and destruction of feeding habitat in coral reefs and seagrass beds (Horrocks 1992;
Marcovaldi et al. 2003). Solid debris, oil and tar, organochlorine residues, and heavy metals have also
threatened the survivorship of turtles in many areas of the world (Godley et al. 1999).
Impacts of the proposed seismic survey at Shatsky Rise are expected to be no more than a minor
(and short-term) increment when viewed in the light of other human activities within and near the study
area and past research activities. Unlike some other activities (e.g., fishing), seismic activities are not
expected to result in injuries or deaths of marine mammals and sea turtles. Although airgun sounds do
have high source levels, the sounds are pulses rather than continuous tones, and operations will be carried
out for only ~7 days. As previously discussed, L-DEO‘s airgun operations are unlikely to cause any
large-scale or prolonged effects. Thus, the combination of L-DEO‘s operations with the existing
shipping, fishing, and whaling operations is expected to produce only a negligible increase in overall
disturbance effects on marine mammals and turtles.
(10) Unavoidable Impacts
Unavoidable impacts to the species of marine mammals and turtles occurring in the proposed study
area will be limited to short-term, localized changes in behavior of individuals and possibly a few
occurrences of TTS in marine mammals that approach close to the operating airgun array. For cetaceans,
some of the changes in behavior may be sufficient to fall within the MMPA definition of ―Level B
Harassment‖ (behavioral disturbance; no serious injury or mortality). TTS, if it occurs, will be limited to
a few individuals, is a temporary phenomenon that does not involve injury, and is unlikely to have long
term consequences for the few individuals involved. No long-term or significant impacts are expected on
any of these individual marine mammals or turtles, or on the populations to which they belong. Effects
on recruitment or survival are expected to be (at most) negligible.

IV. Environmental Consequences
Environmental Assessment for L-DEO’s Shatsky Rise Seismic Survey, 2012 Page 73
(11) Coordination with Other Agencies and Processes
This EA has been prepared by LGL on behalf of NSF pursuant to Executive Order 12114 and
assesses potential impacts to endangered species. It will be used to support the ESA Section 7
consultation process with NMFS. This document will also be used as supporting documentation for an
IHA application submitted by L-DEO to NMFS, under the U.S. MMPA, for ―taking by harassment‖
(disturbance) of small numbers of marine mammals, for this proposed seismic project. As the project will
occur in international waters, there is no Essential Fish Habitat (EFH), Habitat Areas of Particular
Concern (HAPC), or critical habitat in the proposed study area.
In preparation of the environmental analysis for the original 2010 survey, Dr. Toshihide Kitakado
of Tokyo University of Marine Science and Technology was contacted regarding information on Bryde‘s
whale densities in the Shatsky Rise area. L-DEO and NSF have coordinated, and will continue to
coordinate, with other applicable agencies, and will comply with their requirements.
Alternative Action: Another Time
An alternative to issuing the IHA for the period requested, and to conducting the project then, is to
issue the IHA for another time, and to conduct the project at that alternative time. The proposed time for
the cruise is the period when the personnel and equipment essential to meet the overall project objectives
are available, and it takes into consideration the timing of the typhoon season (late August–December).
Marine mammals and sea turtles are expected to be found throughout the proposed study area.
Many cetaceans occur in the survey area throughout the year, but others (some baleen whales) may only
migrate through the area during spring and fall; thus, altering the timing of the proposed project likely
would result in net benefits for only those few species. Loggerhead, leatherback, and green turtles nest on
the Ryukyu Islands, Japan, at the time of the survey, so nesting females would be nearshore or on land far
from the survey area. However, migrating or foraging loggerhead, leatherback, or green turtles could be
encountered in the deep waters of the survey area at any time of year.
No Action Alternative
An alternative to conducting the proposed activities is the ―No Action‖ alternative, i.e., do not issue
an IHA and do not conduct the operations. If the research were not conducted, the ―No Action‖
alternative would result in no disturbance to marine mammals or sea turtles attributable to the proposed
activities, but geological data of considerable scientific value and relevance in understanding plateau
formation and earthquake potential (see § I) would not be acquired.

V. List of Preparers
Environmental Assessment for L-DEO’s Shatsky Rise Seismic Survey, 2012 Page 74
V. LIST OF PREPARERS
LGL Ltd., environmental research associates
John Brandon, Ph.D., Anchorage, AK*
William E. Cross, M.Sc., King City, Ont.*
Meike Holst, M.Sc., Sidney, B.C.*
John Christian, M.Sc., St. John's, Nfld.
Mark Fitzgerald, B.A.A., King City, Ont.
William Koski, M.Sc., King City, Ont.
W. John Richardson, Ph.D., King City, Ont.
Lamont-Doherty Earth Observatory
Meagan Cummings, B.Sc., Palisades, NY
John Diebold, Ph.D., Palisades, NY
Jeff Rupert, B.Sc., Palisades, NY
National Science Foundation
Holly E. Smith, M.A., Arlington, VA
Olivia Lee, Ph.D., Arlington, VA
* Principal preparer of this specific document. Others listed above contributed to a lesser extent, or
contributed substantially to previous related documents from which material has been excerpted.

VI. Literature Cited
Environmental Assessment for L-DEO’s Shatsky Rise Seismic Survey, 2012 Page 75
VI. LITERATURE CITED
Marine Mammals and Acoustics
Acebes, J.M.V. and L.A.R. Lesaca. 2003. Research and conservation of humpback whales and other cetacean
species in the Babuyan islands, northern Luzon. p. 34-42 In: J. Van der Ploeg, A. Masipiquena, and E.C.
Bernardo (eds.), The Sierra Madre Mountain Range: global relevance, local realisties. Papers presented at
the 4th
regional conference on Environment and Development. Cagayan Valley Program for Environment
and Development, Godlen Press, Tuguegarao City.
Acebes, J.M.V., A.L. Bautista, T.K. Yamada, L. Dolar, and F. Perrin. 2005. Stranding of Indopacetus pacificus in
Davao, Philippines. Abstr. 16th
Bienn. Conf. Biol. Mar. Mamm., San Diego, CA, 12–16 December 2005.
Aguilar, A. 2002. Fin whale Balaenoptera physalus. p. 435-438 In: W.F. Perrin, B. Würsig, and J.G.M. Thewissen
(eds.), Encyclopedia of marine mammals. Academic Press, San Diego, CA. 1414 p.
Aguilar-Soto, N., M. Johnson, P.T. Madsen, P.L. Tyack, A. Bocconcelli, and J.F. Borsani. 2006. Does intense ship
noise disrupt foraging in deep-diving Cuvier‘s beaked whales (Ziphius cavirostris)? Mar. Mamm. Sci.
22(3):690-699.
Allen, G.M. 1942. Extinct and vanishing mammals of the Western Hemisphere with the marine species of all
oceans. Spec. Publ. Am. Comm. Int. Wildl. Protection No.11. 620 p.
Allen, B.M. and R.P. Angliss. 2010. Alaska marine mammal stock assessments, 2009. U.S. Dep. Commer.,
NOAA Tech. Memo. NMFS-AFSC-206. 276 p.
Antochiw, D., A. Dubuque, S. Milne, D. Palacios, and M. Piercy. Marine mammal and sea turtle monitoring report
for the Costa Rica 3D seismic survey (Bangs Crisp Project) in the Pacific Ocean offshore Costa Rica 7 April
2011- 12 May 2011 R/V Marcus G. Langseth. Rep. from RPS, Houston, TX, for Lamont-Doherty Earth
Observatory of Columbia Univ., Palisades, NY, and Nat. Mar. Fish. Serv., Silver Spring, MD.45 p. + app.
Archer, F.I. 2002. Striped dolphin Stenella coeruleoalba. p. 1201-1203 In: W.F. Perrin, B. Würsig, and J.G.M.
Thewissen (eds.), Encyclopedia of marine mammals. Academic Press, San Diego, CA. 1414 p.
Arnbom, T. and H. Whitehead. 1989. Observations on the composition and behaviour of groups of female sperm
whale near the Galápagos Islands. Can. J. Zool. 67(1):1-7.
Au, D.K.W. and W.L. Perryman. 1985. Dolphin habitats in the eastern tropical Pacific. Fish. Bull. 83(4):623-643.
Bain, D.E. and R. Williams. 2006. Long-range effects of airgun noise on marine mammals: responses as a function
of received sound level and distance. Working Pap. SC/58/E35. Int. Whal. Comm., Cambridge, U.K. 13 p.
Baird, R.W. 2002. False killer whale. p. 411-412 In: W.F. Perrin, B. Würsig, and J.G.M. Thewissen (eds.),
Encyclopedia of marine mammals. Academic Press, San Diego, CA. 1414 p.
Baird, R.W., A.D. Ligon, and S.K. Hooker. 2000. Sub-surface and night-time behavior of humpback whales off
Maui, Hawaii: a preliminary report. Report prepared under Contract #40ABNC050729 from the Hawaiian
Islands Humpback Whale National Marine Sanctuary, Kihei, HI, to the Hawaii Wildlife Fund, Paia, HI.
Baird, R.W., D.L. Webster, D.J. McSweeney, A.D. Ligon, G.S. Schorr, and J. Barlow. 2006. Diving behavior and
ecology of Cuvier‘s (Ziphius cavirostris) and Blainville‘s (Mesoplodon densirostris) beaked whales in
Hawaii. Can. J. Zool. 84(8):1120-1128.
Baker, C.S. and L.M. Herman. 1989. Behavioral responses of summering humpback whales to vessel traffic:
experimental and opportunistic observations. NPS-NR-TRS-89-01. Rep. from Kewalo Basin Mar. Mamm.
Lab., Univ. Hawaii, Honolulu, HI, for U.S. Natl. Park Serv., Anchorage, AK. 50 p. NTIS PB90-198409.
Baker, A.N. and A.L. van Helden. 1999. New records of beaked whales, genus Mesoplodon, from New Zealand
(Cetacea: Ziphiidae). J. Roy. Soc. New Zealand 29(3):235-244.

VI. Literature Cited
Environmental Assessment for L-DEO’s Shatsky Rise Seismic Survey, 2012 Page 76
Baker, C.S., L.M. Herman, B.G. Bays, and W.F. Stifel. 1982. The impact of vessel traffic on the behavior of
humpback whales in southeast Alaska. Rep. from Kewalo Basin Mar. Mamm. Lab., Honolulu, HI, for U.S.
Natl. Mar. Fish. Serv., Seattle, WA. 78 p.
Baker, C.S., L.M. Herman, B.G. Bays, and G.B. Bauer. 1983. The impact of vessel traffic on the behavior of
humpback whales in southeast Alaska: 1982 season. Rep. from Kewalo Basin Mar. Mamm. Lab., Honolulu,
HI, for U.S. Natl. Mar. Mamm. Lab., Seattle, WA. 30 p. + fig., tables.
Baker, C.S., A. Perry, J.L. Bannister, M.T Weinrich, R.B. Abernethy, J. Calambokidis, J. Lien, R.H. Lambertsen, J.
Urbán Ramirez, O. Vasquez, P.J. Clapham, A. Alling, S.J. O‘Brien, and S.R. Palumbi. 1993. Abundant
mitochondrial DNA variation and world-wide population structure in humpback whales. Proc. Nat. Acad.
Sci. USA 90:8239-8243.
Baker, C.S., L. Flórez-González, B. Abernethy, H.C. Rosenbaum, R.W. Slade, J. Capella, and J.L. Bannister. 1998.
Mitochondrial DNA variation and maternal gene flow among humpback whales of the Southern Hemisphere.
Mar. Mamm. Sci. 14(4):721-737.
Baker, C.S., V. Lukoschek, S. Lavery, M.L. Dalebout, M. Yongun, T. Endo, and N. Funahashi. 2006. Incomplete
reporting of whale, dolphin and porpoise ―bycatch‖ revealed by molecular monitoring of Korean markets.
Anim. Cons. 9(4):474-482.
Balcomb, K.C. 1989. Baird‘s beaked whale Berardius bairdii Stejneger, 1883; Arnoux‘s beaked whale Berardius
arnuxii Duvernoy, 1851. p. 261-288 In: S.H. Ridgway and S.R. Harrison (eds.), Handbook of marine
mammals, Vol. 4: River dolphins and the larger toothed whales. Academic Press, London, U.K. 442 p.
Balcomb, K.C., III and D.E. Claridge. 2001. A mass stranding of cetaceans caused by naval sonar in the Bahamas.
Bahamas J. Sci. 8(2):2-12.
Banfield, A.W.F. 1974. The mammals of Canada. Univ. Toronto Press, Toronto, Ont. 438 p.
Barkaszi, M.J., D.M. Epperson, and B. Bennett. 2009. Six-year compilation of cetacean sighting data collected
during commercial seismic survey mitigation observations throughout the Gulf of Mexico, USA. p. 24-25
In: Abstr. 18th
Bienn. Conf. Biol. Mar. Mamm., Québec, Canada, Oct. 2009. 306 p.
Barlow, J. 2003. Preliminary estimates of the abundance of cetaceans along the U.S. West Coast: 1991–2001.
Admin. Rep. LJ-03-03. Southwest Fish. Sci. Center, Nat. Mar. Fish. Serv., La Jolla, CA. 31 p.
Barlow, J. 2006. Cetacean abundance in Hawaiian waters estimated from a summer/fall survey in 2002. Mar.
Mamm. Sci. 22(2):446-464.
Barlow, J. and R. Gisiner. 2006. Mitigating, monitoring and assessing the effects of anthropogenic sound on
beaked whales. J. Cetac. Res. Manage. 7(3):239-249.
Barry, S.B., A.C. Cucknell, and N. Clark. 2010. A direct comparison of bottlenose and common dolphin behaviour
during seismic surveys when airguns are and are not being utilized. Abstr. In: 2nd
Int. Conf. Effects Noise
Aquat. Life, Cork, Ireland, 15–20 August 2010.
Baumgartner, M.F. 1997. The distribution of Risso‘s dolphin (Grampus griseus) with respect to the physiography
of the Northern Gulf of Mexico. Mar. Mamm. Sci. 13(4):614-638.
Best, P.B. 1979. Social organization in sperm whales, Physeter macrocephalus. p. 227-289 In: H.E. Winn and
B.L. Olla (eds.), Behavior of marine animals, Vol. 3. Plenum, New York, NY.
Bejder, L., A. Samuels, H. Whitehead, and N. Gales. 2006b. Interpreting short-term behavioural responses to
disturbance with a longitudinal perspective. Animal Behav. 72:1149-1158.
Bowles, A.E., M. Smultea, B. Würsig, D.P. DeMaster, and D. Palka. 1994. Relative abundance and behavior of
marine mammals exposed to transmissions from the Heard Island Feasibility Test. J. Acoust. Soc. Am.
96(4):2469-2484.

VI. Literature Cited
Environmental Assessment for L-DEO’s Shatsky Rise Seismic Survey, 2012 Page 77
Braham, H.W. and D.W. Rice. 1984. The right whale, Balaena glacialis. Mar. Fish. Rev. 46(4):38-44.
Brownell, R.L., W.A. Walker, and K.A. Forney. 1999. Pacific white-sided dolphin Lagenorhynchus obliquidens
(Gray, 1828). p. 57-84 In: S.H. Ridgway and S.R. Harrison (eds.), Handbook of marine mammals, Vol. 6:
The second book of dolphins and porpoises. Academic Press, San Diego, CA. 486 p.
Brownell, R.L., Jr., P.J. Clapham, T. Miyashita, and T. Kasuya. 2001. Conservation status of North Pacific right
whales. J. Cetac. Res. Manage. Spec. Iss. 2:269-286.
Buckland, S.T., K.L. Cattanach, and T. Miyashita. 1992. Minke whale abundance in the northwest Pacific and the
Okhotsk Sea, estimated from 1989 and 1990 sighting surveys. Rep. Int. Whal. Comm. 42:387-392.
Buckland, S.T., K.L. Cattanach, and R.C. Hobbs. 1993. Abundance estimates of Pacific white-sided dolphin,
northern right whale dolphin, Dall‘s porpoise and northern fur seal in the North Pacific, 1987–1990. Int.
North Pacific Fish. Comm. Bull. 53(3):387-407.
Burkhardt, E., O. Boebel, H. Bornemann, and C. Ruholl. 2007. Risk assessment of scientific sonars. Poster Paper,
Int. Conf. Effects of Noise on Aquatic Life, 13–17 August 2007, Nyborg, Denmark.
Burkhardt, E., O. Boebel, H. Bornemann, and C. Ruholl. 2008. Risk assessment of scientific sonars. Bioacoustics
17:235-237 (In press).
Caballero, S., H. Hamilton, C. Jaramillo, J. Capella, L. Flórez-González, C. Olavarria, H. Rosenbaum, F. Guhl, and
C.S. Baker. 2001. Genetic characterisation of the Colombian Pacific coast humpback whale population
using RAPD and mitochondrial DNA sequences. Mem. Queensl. Mus. 47(2):459-464.
Calambokidis, J. and S.D. Osmek. 1998. Marine mammal research and mitigation in conjunction with air gun
operation for the USGS ‗SHIPS‘ seismic surveys in 1998. Rep. from Cascadia Research, Olympia, WA, for
U.S. Geol. Surv., Nat. Mar. Fish. Serv., and Minerals Manage. Serv.
Calambokidis, J., G.H. Steiger, J.M. Straley, L.M. Herman, S. Cerchio, D.R. Salden, J. Urbán R., J.K. Jacobsen, O.
von Ziegesar, K.C. Balcomb, C.M. Gabrielle, M.E. Dahlheim, S. Uchida, G. Ellis, Y. Miyamura, P.L. de
Guevara P., M. Yamaguchi, F. Sato, S.A. Mizroch, L. Schlender, K. Rasmussen, J. Barlow, and T.J. Quinn
II. 2001. Movements and population structure of humpback whales in the North Pacific. Mar. Mamm. Sci
17(4):769-794.
Calambokidis, J., T. Chandler, L. Schlender, G.H. Steiger, and A. Douglas. 2003. Research on humpback and blue
whales off California, Oregon, and Washington in 2002. Final Rep. from Cascadia Research, Olympia, WA,
for Southwest Fish. Sci. Center, Nat. Mar. Fish Serv., La Jolla, CA. 47 p.
Calambokidis, J., E.A. Falcone, T.J. Quinn, A.M Burdin, P.J. Clapham, J.K.B. Ford, C.M. Gabriele, R. LeDuc, D.
Mattila, L. Rojas-Bracho, J.M. Straley, B.L. Taylor, J. Urban R., D. Weller, B.H. Witteveen, M. Yamaguchi,
A. Bendlin, D. Camacho, K. Flynn, A. Havron, J. Huggins, and N. Maloney. 2008. SPLASH: Structure of
populations, levels of abundance and status of humpback whales in the North Pacific. Rep. AB133F-03-RP-
0078 for U.S. Dept. of Comm., Seattle, WA.
Caldwell, D.K. and M.C. Caldwell. 1989. Pygmy sperm whale Kogia breviceps (de Blainville, 1838): dwarf sperm
whale Kogia simus Owen, 1866. p. 235-260 In: S.H. Ridgway and R. Harrison (eds.), Handbook of marine
mammals, Vol. 4: River dolphins and the larger toothed whales. Academic Press, San Diego, CA. 444 p.
Caldwell, J. and W. Dragoset. 2000. A brief overview of seismic air-gun arrays. The Leading Edge 19(8,
Aug.):898-902.
Carwardine, M. 1995. Whales, dolphins and porpoises. Dorling Kindersley Publishing, Inc., NY. 256 p.
Carretta, J.V., K.A. Forney, M.M. Muto, J. Barlow, J. Baker, B. Hanson, and M.S. Lowry. 2007. Pacific marine
mammal stock assessments: 2007. NOAA Tech. Memo. NMFS-SWFSC-398. Southwest Fish. Sci. Center,
Nat. Mar. Fish. Serv., La Jolla, CA. 312 p.
VI. Literature Cited
Environmental Assessment for L-DEO’s Shatsky Rise Seismic Survey, 2012 Page 78
Castellote, M., C.W. Clark, and M.O. Lammers. 2010. Acoustic compensation to shipping and airgun noise by
Mediterranean fin whales (Balaenoptera physalus). Abstr. In: 2nd
Int. Conf. Effects Noise Aquat. Life, Cork,
Ireland, 15–20 August 2010.
Cawthorn, M.W. 1992. New Zealand progress report on cetacean research. Rep. Int. Whal. Comm. 42:357-360.
Chou, L.-S. 2004. History of the marine mammal study in Taiwan. p. 129-138 In: S. Akiyama et al. (eds.), Proc.
5th
and 6th
Symp. Collection Building and Nat. Hist. Stud. in Asia and the Pacific Rim. Nat. Sci. Mus.
Monogr. 24:129-138.
Chou, L.-S., H.-Y. Yu, and R.L. Brownell, Jr. 2007. Killer whales in Taiwanese waters: population identity
biology, and conservation status. Working Pap. SC/59/SM1. Int. Whal. Comm., Cambridge, U.K.
Clapham, P.J. 2002. Humpback whale. p. 589-592 In: W.F. Perrin, B. Würsig, and J.G.M. Thewissen (eds.),
Encyclopedia of marine mammals. Academic Press, San Diego, CA. 1414 p.
Clapham, P.J., C. Good, S.E. Quinn, R.R. Reeves, J.E. Scarff, and R.L. Brownell Jr. 2004. Distribution of North
Pacific right whales (Eubalaena japonica) as shown by 19th
and 20th
century whaling catch and sighting
records. J. Cetac. Res. Manage. 6(1):1-6.
Clark, C.W. and W.T. Ellison. 2004. Potential use of low-frequency sounds by baleen whales for probing the
environment: evidence from models and empirical measurements. p. 564-582 In: J.A. Thomas, C.F. Moss,
and M. Vater (eds.), Echolocation in bats and dolphins. Univ. Chicago Press, Chicago, IL.
Clark, C.W. and G.C. Gagnon. 2006. Considering the temporal and spatial scales of noise exposures from seismic
surveys on baleen whales. Working Pap. SC/58/E9. Int. Whal. Comm., Cambridge, U.K. 9 p.
Cox, T.M., T.J. Ragen, A.J. Read, E. Vos, R.W. Baird, K. Balcomb, J. Barlow, J. Caldwell, T. Cranford, L. Crum,
A. D‘Amico, G. D‘Spain, A. Fernández, J. Finneran, R. Gentry, W. Gerth, F. Gulland, J. Hildebrand, D.
Houser, T. Hullar, P.D. Jepson, D. Ketten, C.D. MacLeod, P. Miller, S. Moore, D.C. Mountain, D. Palka, P.
Ponganis, S. Rommel, T. Rowles, B. Taylor, P. Tyack, D. Wartzok, R. Gisiner, J. Mead, and L. Benner.
2006. Understanding the impacts of anthropogenic sound on beaked whales. J. Cetac. Res. Manage.
7(3):177-187.
Croll, D.A., A. Acevedo-Gutiérrez, B. Tershy, and J. Urbán-Ramírez. 2001. The diving behavior of blue and fin
whales: is dive duration shorter than expected based on oxygen stores? Comp. Biochem. Physiol.
129A:797-809.
Crum, L.A., M.R. Bailey, J. Guan, P.R. Hilmo, S.G. Kargl, and T.J. Matula. 2005. Monitoring bubble growth in
supersaturated blood and tissue ex vivo and the relevance to marine mammal bioeffects. Acoust. Res. Lett.
Online 6(3):214-220.
Cummings, W.C. 1985. Bryde‘s whale Balaenoptera edeni (Anderson, 1878). p. 137-154 In: S.H. Ridgway and R.
Harrison (eds.), Handbook of marine mammals, Vol. 3: The sirenians and baleen whales. Academic Press,
London, U.K. 362 p.
Dahlheim, M.E. and J.E. Heyning. 1999. Killer whale Orcinus orca (Linnaeus, 1758). p. 281-322 In: S.H.
Ridgway and R. Harrison (eds.), Handbook of marine mammals, Vol. 6: The second book of dolphins and
the porpoises. Academic Press, San Diego, CA. 486 p.
Dahlheim, M.E. and R.G. Towell. 1994. Occurrence and distribution of Pacific white-sided dolphins
(Lagenorhynchus obliquidens) in southeastern Alaska, with notes on an attack by killer whales (Orcinus
orca). Mar. Mamm. Sci. 10(4):458-464.
Dalebout, M.L., F.B. Pichler, G.M. Lento, and C.S. Baker. 2001. Species identification of small cetacean products
from Japanese and Korean markets, 1993–1999. Working Pap. SC/53/SM7. Int. Whal. Comm., Cambridge,
U.K.

VI. Literature Cited
Environmental Assessment for L-DEO’s Shatsky Rise Seismic Survey, 2012 Page 79
Dalebout, M.L., G.J.B. Ross, C.S. Baker, R.C. Anderson, P.B. Best, V.G. Cockcroft, H.L. Hinsz, V. Peddemors, and
R.L. Pitman. 2003. Appearance, distribution, and genetic distinctiveness of Longman's beaked whale,
Indopacetus pacificus. Mar. Mamm. Sci. 19(3):421-461.
Darling, J.D. and S. Cerchio. 1993. Movement of a humpback whale (Megaptera novaeangliae) between Japan and
Hawaii. Mar. Mamm. Sci. 9:84-89.
Darling, J.D. and K. Mori. 1993. Recent observations of humpback whales (Megaptera novaeangliae) in Japanese
waters off Ogasawara and Okinawa. Can. J. Zool. 71:325-333.
Darling, J.D., J. Calambokidis, K.C. Balcomb, P. Bloedel, K. Flynn, A. Mochizuki, K. Mori, F. Sato, H. Suganuma,
and M. Yamaguchi. 1996. Movement of a humpback whale (Megaptera novaeangliae) from Japan to
British Columbia and return. Mar. Mamm. Sci. 12(2):281-287.
Davis, R.W., G.S. Fargion, N. May, T.D. Leming, M. Baumgartner, W.E. Evans, L.J. Hansen, and K. Mullin. 1998.
Physical habitat of cetaceans along the continental slope in the north-central and western Gulf of Mexico.
Mar. Mamm. Sci. 14(3):490-507.
Dietz, R., J. Teilmann, M.P. Jørgensen, and M.V. Jensen. 2002. Satellite tracking of humpback whales in West
Greenland. NERI Tech. Rep. No. 411. National Environmental Research Institute, Roskilde, Denmark.
40 p.
Dizon, A.E., S.O. Southern, and W.F. Perrin. 1991. Molecular analuysis of mtDNA typies in exploited populations
of spinner dophins (Stenella longirostris). Rep. Int. Whal. Comm. Spec. Iss. 15:355-363.
Dolar, M.L.L. 2009. Fraser‘s dolphin Lagenodelphis hosei. p. 469-471 In: W.F. Perrin, B. Würsig, and J.G.M.
Thewissen (eds.), Encyclopedia of marine mammals. Academic Press, San Diego, CA. 1316 p.
Dolphin, W.F. 1987. Dive behavior and foraging of humpback shales in Southeast Alaska. Can. J. Zool. 65:354-
362.
DoN (U.S. Department of the Navy). 2005. Marine resources assessment for the Marianas Operating Area. Pacific
Division, Naval Facilities Engineering Command, Pearl Harbor, Hawaii. Contract No. N62470-02-D-9997,
CTO 0027. Prepared by Geo-Marine, Inc., Plano, TX.
Donahue, M.A. and W.L. Perryman. 2002. Pygmy killer whale. p. 1009-1010 In: W.F. Perrin, B. Würsig, and
J.G.M. Thewissen (eds.), Encyclopedia of marine mammals. Academic Press, San Diego, CA. 1414 p.
Donoghue, M.F. 1996. New Zealand, progress report on cetacean research, April 1994 to March 1995. Rep. Int.
Whal. Comm. 46:265-269.
Donovan, G.P. 1991. A review of IWC stock boundaries. Rep. Int. Whal. Comm. Spec. Iss. 13:39-63.
Duffield, D.A., S.H. Ridgway, and L.H. Cornell. 1983. Hematology distinguishes coastal and offshore forms of
dolphins (Tursiops). Can. J. Zool. 61(4):930-933.
Duffus, D.A. and P. Dearden. 1993. Recreational use, valuation, and management of killer whales (Orcinus orca)
on Canada‘s Pacific coast. Environ. Cons. 20(2):149-156.
Dunn, R.A. and O. Hernandez. 2009. Tracking blue whales in the eastern tropical Pacific with an ocean-bottom
seismometer and hydrophone array. J. Acoust. Soc. Am. 126(3):1084-1094.
Engel, M.H., M.C.C. Marcondes, C.C.A. Martins, F.O. Luna, R.P. Lima, and A. Campos. 2004. Are seismic
surveys responsible for cetacean strandings? An unusual mortality of adult humpback whales in Abrolhos
Bank, northeastern coast of Brazil. Working Pap. SC/56/E28. Int. Whal. Comm., Cambridge, U.K. 8 p.
Evans, W.E. 1994. Common dolphin, white-bellied porpoise Delphinus delphis Linnaeus, 1758. p. 191-224 In:
S.H. Ridgway and R. Harrison (eds.), Handbook of marine mammals, Vol. 5: The first book of dolphins.
Academic Press, San Diego, CA. 416 p.

VI. Literature Cited
Environmental Assessment for L-DEO’s Shatsky Rise Seismic Survey, 2012 Page 80
Fernández, A., M. Arbelo, R. Deaville, I.A.P. Patterson, P. Castro, J.R. Baker, E. Degollada, H.M. Ross, P. Herráez,
A.M. Pocknell, E. Rodríguez, F.E. Howie, A. Espinosa, R.J. Reid, J.R. Jaber, V. Martin, A.A. Cunningham,
and P.D. Jepson. 2004. Pathology: whales, sonar and decompression sickness (reply). Nature 428(6984):1.
Fernández, A., J.F. Edwards, F. Rodriquez, A.E. de los Monteros, P. Herráez, P. Castro, J.R. Jaber, V. Martin, and
M. Arbelo. 2005. ―Gas and fat embolic syndrome‖ involving a mass stranding of beaked whales (Family
Ziphiidae) exposed to anthropogenic sonar signals. Vet. Pathol. 42(4):446-457.
Ferrero, R.C. and W.A. Walker. 1996. Age, growth and reproductive patterns of the Pacific white-sided dolphin
(Lagenorhynchus obliquidens) taken in high seas driftnets in the central North Pacific Ocean. Can. J. Zool.
74(9):1673-1687.
Finneran, J.J. and C.E. Schlundt. 2004. Effects of intense pure tones on the behavior of trained odontocetes. Tech.
Rep. 1913. Space and Naval Warfare (SPAWAR) Systems Center, SSC San Diego, San Diego, CA.
Finneran, J.J., C.E. Schlundt, D.A. Carder, J.A. Clark, J.A. Young, J.B. Gaspin, and S.H. Ridgway. 2000. Auditory
and behavioral responses of bottlenose dolphins (Tursiops truncatus) and beluga whale (Delphinapterus
leucas) to impulsive sounds resembling distant signatures of underwater explosions. J. Acoust. Soc. Am.
108(1):417-431.
Finneran, J.J., C.E. Schlundt, R. Dear, D.A. Carder, and S.H. Ridgway. 2002. Temporary shift in masked hearing
thresholds in odontocetes after exposure to single underwater impulses from a seismic watergun. J. Acoust.
Soc. Am. 111(6):2929-2940.
Finneran, J.J., D.A. Carder, C.E. Schlundt, and S.H. Ridgway. 2005. Temporary threshold shift in bottlenose
dolphins (Tursiops truncatus) exposed to mid-frequency tones. J. Acoust. Soc. Am. 118(4):2696-2705.
Ford, J.K.B. 2002. Killer whale. p. 669-675 In: W.F. Perrin, B. Würsig, and J.G.M. Thewissen (eds.),
Encyclopedia of marine mammals. Academic Press, San Diego, CA. 1414 p.
Frankel, A.S. 2005. Gray whales hear and respond to a 21–25 kHz high-frequency whale-finding sonar. Abstr. 16th
Bienn. Conf. Biol. Mar. Mamm., 12–16 Dec. 2005, San Diego, CA.
Frantzis, A. 1998. Does acoustic testing strand whales? Nature 392(6671):29.
Gailey, G., B. Würsig, and T.L. McDonald. 2007. Abundance, behavior, and movement patterns of western gray
whales in relation to a 3-D seismic survey, northeast Sakhalin Island, Russia. Environ. Monit. Assess.
134(1-3):75-91. doi: 10.1007/s10661-007-9812-1.
Gambell, R. 1985a. Sei whale Balaenoptera borealis Lesson, 1828. p. 155-170 In: S.H. Ridgway and R. Harrison
(eds.), Handbook of marine mammals, Vol. 3: The sirenians and baleen whales. Academic Press, London,
U.K. 362 p.
Gambell, R. 1985b. Fin whale Balaenoptera physalus (Linnaeus, 1758). p. 171-192 In: S.H. Ridgway and R.
Harrison (eds.), Handbook of marine mammals, Vol. 3: The sirenians and baleen whales. Academic Press,
London, U.K. 362 p.
Gannier, A. 2000. Distribution of cetaceans off the Society Islands (French Polynesia) as obtained from dedicated
surveys. Aquat. Mamm. 26(2):111-126.
Gannier, A. 2002. Cetaceans of the Marquesas Islands (French Polynesia): distribution and relative abundance as
obtained from a small boat dedicated survey. Aquat. Mamm. 28(2):198-210.
Garrigue, C., A. Aguayo, V.L.U. Amante-Helweg, C.S. Baker, S. Caballero, P. Clapham, R. Constantine, J.
Denkinger, M. Donoghue, L. Flórez-González, J. Greaves, N. Hauser, C. Olavarría, C. Pairoa, H. Peckham,
and M. Poole. 2002. Movements of humpback whales in Oceania, South Pacific. J. Cetac. Res. Manage.
4(3):255-260.
VI. Literature Cited
Environmental Assessment for L-DEO’s Shatsky Rise Seismic Survey, 2012 Page 81
Gedamke, J., S. Frydman, and N. Gales. 2008. Risk of baleen whale hearing loss from seismic surveys: preliminary
results from simulations accounting for uncertainty and individual variation. Working Pap. SC/60/E9. Int.
Whal. Comm., Cambridge, U.K. 10 p.
Gelatt, T. and L. Lowry. 2008. Callorhinus ursinus. In: IUCN 2011. IUCN Red List of Threatened Species.
Version 2011.1. Accessed on 12 October 2011 at http://www.iucnredlist.org/apps/redlist/details/3590/0.
Gentry, R. (ed.). 2002. Report of the workshop on acoustic resonance as a source of tissue trauma in cetaceans.
April 24 and 25, 2002, Silver Spring, MD. 19 p. Accessed on 7 January 2011 at
http://www.nmfs.noaa.gov/pr/pdfs/acoustics/cetaceans.pdf.
Gerrodette, T. and J. Pettis. 2005. Responses of tropical cetaceans to an echosounder during research vessel
Surveys. p. 104 In: Abstr. 16th Bien. Conf. Biol. Mar. Mamm., 12–16 Dec. 2005, San Diego, CA.
Gilmore, R.M. 1978. Right whale. In: D. Haley (ed.) Marine mammals of eastern North Pacific and arctic waters.
Pacific Search Press, Seattle, WA.
Goold, J.C. 1996a. Acoustic assessment of common dolphins off the west Wales coast, in conjunction with 16th
round seismic surveying. Rep. from School of Ocean Sciences, Univ. Wales, Bangor, Wales, for Chevron
UK Ltd, Repsol Explor. (UK) Ltd., and Aran Energy Explor. Ltd. 22 p.
Goold, J.C. 1996b. Acoustic assessment of populations of common dolphin Delphinus delphis in conjunction with
seismic surveying. J. Mar. Biol. Assoc. U.K. 76:811-820.
Goold, J.C. 1996c. Acoustic cetacean monitoring off the west Wales coast. Rep. from School of Ocean Sciences,
Univ. Wales, Bangor, Wales, for Chevron UK Ltd, Repsol Explor. (UK) Ltd, and Aran Energy Explor. Ltd.
20 p.
Gordon, J., D. Gillespie, J. Potter, A. Frantzis, M.P. Simmonds, R. Swift, and D. Thompson. 2004. A review of the
effects of seismic surveys on marine mammals. Mar. Technol. Soc. J. 37(4):16-34.
Gosselin, J.-F. and J. Lawson. 2004. Distribution and abundance indices of marine mammals in the Gully and two
adjacent canyons of the Scotian Shelf before and during nearby hydrocarbon seismic exploration program-
mes in April and July 2003. Res. Doc. 2004/133. Can. Sci. Advis. Secretariat, Fisheries & Oceans Canada.
24 p. Accessed at http://www.dfo-mpo.gc.ca/csas/Csas/DocREC/2004/RES2004_133_e.pdf in October
2011.
Greene, C.R., Jr. 1997. Physical acoustics measurements. p. 3-1 to 3-63 In: W.J. Richardson (ed.), Northstar
marine mammal monitoring program, 1996: marine mammal and acoustical monitoring of a seismic
program in the Alaskan Beaufort Sea. LGL Rep. 2121-2. Rep. from LGL Ltd., King City, Ont., and
Greeneridge Sciences Inc., Santa Barbara, CA, for BP Explor. (Alaska) Inc., Anchorage, AK, and Nat. Mar.
Fish. Serv., Anchorage, AK, and Silver Spring, MD. 245 p.
Greene, C.R., Jr., N.S. Altman, and W.J. Richardson. 1999a. Bowhead whale calls. p. 6-1 to 6-23 In: W.J.
Richardson (ed.), Marine mammal and acoustical monitoring of Western Geophysical‘s open-water seismic
program in the Alaskan Beaufort Sea, 1998. LGL Rep. TA2230-3. Rep. from LGL Ltd., King City, Ont.,
and Greeneridge Sciences Inc., Santa Barbara, CA, for Western Geophysical, Houston, TX, and U.S. Nat.
Mar. Fish. Serv., Anchorage, AK, and Silver Spring, MD. 390 p.
Greene, C.R., Jr., N.S. Altman, and W.J. Richardson. 1999b. The influence of seismic survey sounds on bowhead
whale calling rates. J. Acoust. Soc. Am. 106(4, Pt. 2):2280 (Abstr.).
Green, G.A., R.A. Grotefendt, M.A. Smultea, C.E. Bowlby, and R.A. Rowlett. 1993. Delphinid aerial surveys in
Oregon and Washington offshore waters. Rep. from Ebasco Environmental, Bellevue, WA, for Nat. Mar.
Fish. Serv., Nat. Mar. Mamm. Lab., Seattle, WA. Contract #50ABNF200058. 35 p.
Gregr, E.J. and A.W. Trites. 2001. Predictions of critical habitat of five whale species in the waters of coastal
British Columbia. Can. J. Fish. Aquat. Sci. 58:1265-1285.
Hain, J.H.W., W.A.M. Hyman, R.D. Kenney, and H.E. Winn. 1985. The role of cetaceans in the shelf-edge region
of the U.S. Mar. Fish. Rev. 47(1):13-17.
VI. Literature Cited
Environmental Assessment for L-DEO’s Shatsky Rise Seismic Survey, 2012 Page 82
Hakamada, T., K. Matsuoka, and S. Nishiwaki. 2004. Increasing trend and abundance estimate of sei whales in the
western North Pacific. Working Pap. SC/56/O19. Int. Whal. Comm., Cambridge, U.K. 9 p.
Hakamada, T., K. Matsuoka, and T. Miyashita. 2009. Distribution and the number of western North Pacific
common minke, Bryde‘s, sei and sperm whales distributed in JARPN II Offshore component survey area.
Paper SC/J09/JR15 Presented to the expert workshop to review the ongoing JARPN II Programme,
Yokohama, Japan, 26-30, January 2009. 18 p. (unpublished).
Hall, J. 1979. A survey of cetaceans of Prince William Sound and adjacent waters – their numbers and seasonal
movements. Unpubl. Rep. to Alaska Outer Continental Shelf Environmental Assessment Programs. NOAA
OSCEAP Juneau Project Office, Juneau, AK.
Hammond, P.S., G. Bearzi, A. Bjørge, K. Forney, L. Karczmarski, T. Kasuya, W.F. Perrin, M.D. Scott, J.Y. Wang,
R.S. Wells, and B. Wilson. 2008a. Stenella longirostris. In: IUCN 2011: IUCN Red List of Threatened
Species. Version 2011.1. Accessed at http://www.iucnredlist.org/apps/redlist/details/20733/0 in October
2011.
Hammond, P.S., G. Bearzi, A. Bjørge, K. Forney, L. Karczmarski, T. Kasuya, W.F. Perrin, M.D. Scott, J.Y. Wang,
R.S. Wells, and B. Wilson. 2008b. Delphinus delphis. In: IUCN 2011: IUCN Red List of Threatened
Species. Version 2011.1. Accessed in October 2011 at http://www.iucnredlist.org/apps/redlist/details/6336/0.
Harris, R.E., T. Elliot, and R.A. Davis. 2007. Results of mitigation and monitoring program, Beaufort Span 2-D
marine seismic program, open water season 2006. LGL Rep. TA4319-1. Rep. from LGL Ltd., King City,
Ont., for GX Technol., Houston, TX. 48 p.
Harwood, J. and B. Wilson. 2001. The implications of developments on the Atlantic Frontier for marine mammals.
Cont. Shelf Res. 21:1073-1093.
Hauser, D.D.W., M Holst, and V.D. Moulton. 2008. Marine mammal and sea turtle monitoring during Lamont-
Doherty Earth Observatory‘s marine seismic program in the eastern tropical Pacific, April–August 2008.
LGL Rep. TA4656/7-1. Rep. from LGL Ltd., King City., Ont., and St. John‘s, Nfld., for Lamont-Doherty
Earth Observatory of Columbia Univ., Palisades, NY, and Nat. Mar. Fish. Serv., Silver Spring, MD. 98 p.
Heide-Jørgensen, M.P., D. Bloch, E. Stefansson, B. Mikkelsen, L.H. Ofstad, and R. Dietz. 2002. Diving behaviour
of long-finned pilot whales Globicephala melas around the Faroe Islands. Wildl. Biol. 8:307-313.
Herman, L.M., C.S. Baker, P.H. Forestell, and R.C. Antinoja. 1980. Right whale, Balaena glacialis, sightings nears
Hawaii: a clue to the wintering grounds? Mar. Ecol. Prog. Ser. 2(4):271-275.
Heyning, J.E. 1989. Cuvier‘s beaked whale Ziphius cavirostris G. Cuvier, 1823. p. 289-308 In: S.H. Ridgway and
R.J. Harrison (eds.), Handbok of marine mammals, Vol. 4: River dolphins and the larger toothed whales.
Academic Press, San Diego, CA. 444 p.
Heyning, J.E. 2002. Cuvier‘s beaked whale Ziphius cavirostris. p. 305-307 In: W.F. Perrin, B. Würsig, and J.G.M.
Thewissen (eds.), Encyclopedia of marine mammals. Academic Press, San Diego, CA. 1414 p.
Heyning, J.E. and M.E. Dahlheim. 1988. Orcinus orca. Mammal. Spec. 304:1-9.
Higham, J.E.S., L. Bejder, and D. Lusseau. 2009. An integrated and adaptive management model to address the
long-term sustainability of tourist interactions with cetaceans. Env. Conserv. 35(4):294-302.
Hildebrand, J.A. 2005. Impacts of anthropogenic sound. p. 101-124 In: J.E. Reynolds, W.F. Perrin, R.R. Reeves,
S. Montgomery, and T. Ragen (eds.), Marine mammal research: conservation beyond crisis. Johns Hopkins
Univ. Press, Baltimore, MD. 223 p.
Hobbs, R.C. and L.L. Jones. 1993. Impacts of high seas driftnet fisheries on marine mammal populations in the
North Pacific. Int. North Pacific Fish. Comm. Bull. 53(3):409-434.
Hoelzel, A.R., C.W. Potter, and P.B. Best. 1998. Genetic differentiation between parapatric ‗nearshore‘ and
‗offshore‘ populations of the bottlenose dolphin. Proc. R. Soc Lond. B 265:1177-1183.

VI. Literature Cited
Environmental Assessment for L-DEO’s Shatsky Rise Seismic Survey, 2012 Page 83
Hogarth, W.T. 2002. Declaration of William T. Hogarth in opposition to plaintiff‘s motion for temporary restrain-
ing order, 23 October 2002. Civ. No. 02-05065-JL. U.S. District Court, Northern District of California, San
Francisco Div.
Holst, M. 2009. Marine mammal and sea turtle monitoring during Lamont-Doherty Earth Observatory‘s TAIGER
marine seismic program near Taiwan, April–July 2009. LGL Rep. TA4553-4. Rep. from LGL Ltd., King
City, Ont. for Lamont-Doherty Earth Observatory of Columbia Univ., Palisades, NY, and Nat. Mar. Fish.
Serv., Silver Spring, MD. 103 p.
Holst, M. and J. Beland. 2008. Marine mammal and sea turtle monitoring during Lamont-Doherty Earth
Observatory‘s seismic testing and calibration study in the northern Gulf of Mexico, November 2007–
February 2008. LGL Rep. TA4295-2. Rep. from LGL Ltd., King City, Ont., for Lamont-Doherty Earth
Observatory of Columbia Univ., Palisades, NY, and Nat. Mar. Fish. Serv., Silver Spring, MD. 77 p.
Holst, M. and M.A. Smultea. 2008. Marine mammal and sea turtle monitoring during Lamont-Doherty Earth
Observatory‘s marine seismic program off Central America, Feburary–April 2008. LGL Rep. TA4342-3.
Rep. from LGL Ltd., King City, Ont., for Lamont-Doherty Earth Observatory of Columbia Univ., Palisades,
NY, and Nat. Mar. Fish. Serv., Silver Spring, MD. 133 p.
Holst, M., M.A. Smultea, W.R. Koski, and B. Haley. 2005a. Marine mammal and sea turtle monitoring during
Lamont-Doherty Earth Observatory‘s marine seismic program in the eastern tropical Pacific Ocean off
Central America, November–December 2004. LGL Rep. TA2822-30. Rep. from LGL Ltd., King City, Ont.,
for Lamont-Doherty Earth Observatory of Columbia Univ., Palisades, NY, and Nat. Mar. Fish. Serv., Silver
Spring, MD. 125 p.
Holst, M., M.A. Smultea, W.R. Koski, and B. Haley. 2005b. Marine mammal and sea turtle monitoring during
Lamont-Doherty Earth Observatory‘s marine seismic program off the Northern Yucatán Peninsula in the
Southern Gulf of Mexico, January–February 2005. LGL Rep. TA2822-31. Rep. from LGL Ltd., King City,
Ont., for Lamont-Doherty Earth Observatory of Columbia Univ., Palisades, NY, and Nat. Mar. Fish. Serv.,
Silver Spring, MD. 96 p.
Holst, M., W.J. Richardson, W.R. Koski, M.A. Smultea, B. Haley, M.W. Fitzgerald, and M. Rawson. 2006. Effects
of large and small-source seismic surveys on marine mammals and sea turtles. Abstr. Presented at Am.
Geophys. Union - Soc. Explor. Geophys. Joint Assembly on Environ. Impacts from Mar. Geophys. Geol.
Studies - Recent Advances from Academic & Industry Res. Progr., Baltimore, MD, May 2006.
Horwood, J. 1987. The sei whale: population biology, ecology, and management. Croom Helm, Beckenham, Kent,
U.K. 375 p.
Horwood, J. 2002. Sei whale. p. 1069-1071 In: W.F. Perrin, B. Würsig, and J.G.M. Thewissen (eds.),
Encyclopedia of marine mammals. Academic Press, San Diego, CA. 1414 p.
Houston, J. 1990. Status of Stejneger‘s beaked whale, Mesoplodon stejnegeri, in Canada. Can. Field-Nat.
104(1):131-134.
IAGC. 2004. Further analysis of 2002 Abrolhos Bank, Brazil humpback whale strandings coincident with seismic
surveys. Int. Assoc. Geophys. Contr., Houston, TX.
IUCN (The World Conservation Union). 2011. IUCN Red List of Threatened Species. Version 2011.1. Accessed
on 14 September 2011 at http://www.iucnredlist.org.
IWC (International Whaling Commission). 2007. Report of the standing working group on environmental
concerns. Annex K to Report of the Scientific Committee. J. Cetac. Res. Manage. 9 (Suppl.):227-260.
IWC (International Whaling Commission). 2010a. Whale population estimates. Accessed on 27 October 2011 at
http://www.iwcoffice.org/conservation/estimate.htm.

VI. Literature Cited
Environmental Assessment for L-DEO’s Shatsky Rise Seismic Survey, 2012 Page 84
IWC (International Whaling Commission). 2010b. Catches taken: under scientific permit. Accessed on 27 October
2011 at http://www.iwcoffice.org/conservation/table_permit.htm.
IWC (International Whaling Commission). 2010c. Catch limits & catches taken. Accessed on 27 October 2011 at
http://www.iwcoffice.org/conservation/catches.htm.
Jacquet, N. and H. Whitehead. 1996. Scale-dependent correlation of sperm whale distribution with environmental
features and productivity in the South Pacific. Mar. Ecol. Prog. Ser. 135(1-3):1-9.
Jefferson, T.A. 2002. Rough-toothed dolphin Steno bredanensis. p. 1055-1059 In: W.F. Perrin, B. Würsig, and
J.G.M. Thewissen (eds.), Encyclopedia of marine mammals. Academic Press, San Diego, CA. 1414 p.
Jefferson, T.A. and N.B. Barros. 1997. Peponocephala electra. Mammal. Spec. 553:1-6.
Jefferson, T.A. and S.K. Hung. 2007. An updated, annotated checklist of the marine mammals of Hong Kong.
Mammalia 2007:105-114.
Jefferson, T.A., S. Leatherwood, and M.A. Webber. 1993. FAO Species identification guide. Marine mammals of
the world. UNEP/FAO, Rome, Italy.
Jefferson, T.A., M.A. Webber, and R.L. Pitman. 2008. Marine mammals of the world: a comprehensive guide to
their identification. Academic Press, New York, NY. 573 p.
Jepson, P.D., M. Arbelo, R. Deaville, I.A.P. Patterson, P. Castro, J.R. Baker, E. Degollada, H.M. Ross, P. Herráez,
A.M. Pocknell, F. Rodríguez, F.E. Howie, A. Espinosa, R.J. Reid, J.R. Jaber, V. Martin, A.A. Cunningham,
and A. Fernández. 2003. Gas-bubble lesions in stranded cetaceans. Nature 425(6958):575-576.
Jensen, A.S. and G.K. Silber. 2004. Large whale ship strike database. U.S. Department of Commerce, NOAA
Tech. Memo. NMFS-OPR-25, Nat. Mar. Fish. Serv., Silver Spring, MD. 37 p.
Jochens, A., D. Biggs, K. Benoit-Bird, D. Engelhaupt, J. Gordon, C. Hu, N. Jaquet, M. Johnson, R. Leben, B. Mate,
P. Miller, J. Ortega-Ortiz, A. Thode, P. Tyack, and B. Würsig. 2008. Sperm whale seismic study in the Gulf
of Mexico: synthesis report. OCS Study MMS 2008-006. Rep. from Dep. Oceanogr., Texas A & M Univ.,
College Station, TX, for U.S. Minerals Manage. Serv., Gulf of Mexico OCS Reg., New Orleans, LA. 341 p.
Johnson, S.R., W.J. Richardson, S.B. Yazvenko, S.A. Blokhin, G. Gailey, M.R. Jenkerson, S.K. Meier, H.R.
Melton, M.W. Newcomer, A.S. Perlov, S.A. Rutenko, B. Würsig, C.R. Martin, and D.E. Egging. 2007. A
western gray whale mitigation and monitoring program for a 3-D seismic survey, Sakhalin Island, Russia.
Environ. Monit. Assess. 134(1-3):1-19. doi: 10.1007/s10661-007-9813-0.
Jurasz, C.M. and V.P. Jurasz. 1979. Ecology of humpback whale. Draft report for U.S. Natl. Park Serv. Contr.
No. CX-9000-7-0045.
Kanda, N., M. Goto, H. Kato, M.V. McPhee, and L.A. Pastene. 2007. Population genetic structure of Bryde‘s
whales (Balaenoptera brydei) at the inter-oceanic and trans-equatorial levels. Conserv. Genet. 8:853-864.
Kasuya, T. 1986. Distribution and behavior of Baird‘s beaked whales off the Pacific coast of Japan. Sci. Rep.
Whales Res. Inst. 37:61-83.
Kasuya, T. 2002a. Giant beaked whales Berardius bairdii and B. arnuxii. p. 519-522 In: W.F. Perrin, B. Würsig,
and J.G.M. Thewissen (eds.), Encyclopedia of marine mammals. Academic Press, San Diego, CA. 1414 p.
Kasuya, T. 2002b. Japanese whaling. p. 655-662 In: W.F. Perrin, B. Würsig, and J.G.M. Thewissen (eds.),
Encyclopedia of marine mammals. Academic Press, San Diego, CA. 1414 p.
Kasuya, T. 2007. Japanese whaling and other fisheries. Env. Sci. Pollut. Res. 14:39-48.
Kasuya, T. and S. Ohsumi. 1984. Further analysis of Baird‘s beaked whales in the waters adjacent to Japan. Rep.
Int. Whal. Comm. 33:633-641.

VI. Literature Cited
Environmental Assessment for L-DEO’s Shatsky Rise Seismic Survey, 2012 Page 85
Kasuya, T., T. Miyashita, and F. Kasamatsu. 1988. Segregation of two forms of short-finned pilot whales off the
Pacific coast of Japan. Sci. Rep. Whales Res. Inst. Tokyo 39:77-90.
Kato, H. 2002. Bryde‘s whales Balaenoptera edeni and B. brydei. p. 171-176 In: W.F. Perrin, B. Würsig, and
J.G.M. Thewissen (eds.), Encyclopedia of marine mammals. Academic Press, San Diego, CA. 1414 p.
Kato, H. and T. Miyashita. 1998. Current status of the North Pacific sperm whales and its preliminary abundance
estimates. Working Pap. SC/50/CAWS2. Int. Whal. Comm., Cambridge, U.K. 6 p.
Kato, H., M. Yoshioka, and S. Ohsumi. 2005. Current status of cetaceans and other marine mammals in the North
Pacific, with a review of advanced research activities on cetacean biology in Japan. Mamm. Study 30:S113-
S124.
Kenney, R.D. and H.E. Winn. 1987. Cetacean biomass densities near submarine canyons compared to adjacent
shelf/slope areas. Continent. Shelf Res. 7:107-114.
Ketten, D.R. 1995. Estimates of blast injury and acoustic trauma zones for marine mammals from underwater
explosions. p. 391-407 In: R.A. Kastelein, J.A. Thomas, and P.E. Nachtigall (eds.), Sensory systems of
aquatic mammals. De Spil Publ., Woerden, Netherlands. 588 p.
Ketten, D.R., J. Lien, and S. Todd. 1993. Blast injury in humpback whale ears: evidence and implications. J.
Acoust. Soc. Am. 94(3, Pt. 2):1849-1850.
Kitakado, T., H. Shimada, H. Okamura, and T. Miyashita. 2008. CLA abundance estimates for western North
Pacific Bryde‘s whale and their associated CVs with taking the additional variance into account. Working
Pap. SC/60/PFI3. Int. Whal. Comm., Cambridge, U.K. 27 p.
Klatsky, L.J. 2004. Movement and dive behavior of bottlenose dolphins (Tursiops truncatus) near the Bermuda
Pedestal. M.Sc. Thesis. San Diego State University, CA. 31 p.
Klatsky, L., R. Wells, and J. Sweeney. 2005. Bermuda‘s deep diving dolphins – movements and dive behavior of
offshore bottlenose dolphins in the Northwest Atlantic Ocean near Bermuda. Abstr. 16th
Bienn. Conf. Biol.
Mar. Mamm., San Diego, CA, 12–16 Dec. 2005.
Kremser, U., P. Klemm, and W.D. Kötz. 2005. Estimating the risk of temporary acoustic threshold shift, caused by
hydroacoustic devices, in whales in the Southern Ocean. Antarctic Sci. 17(1):3-10.
Krieger, K.J. and B.L. Wing. 1984. Hydroacoustic surveys and identification of humpback whale forage in Glacier
Bay, Stephens Passage, and Frederick Sound, southeastern Alaska, summer 1983. NOAA Tech. Memo.
NMFS F/NWC-66. U.S. Natl. Mar. Fish. Serv., Auke Bay, AK. 60 p. NTIS PB85-183887.
Krieger, K.J. and B.L. Wing. 1986. Hydroacoustic monitoring of prey to determine humpback whale movements.
NOAA Tech. Memo. NMFS F/NWC-98. U.S. Natl. Mar. Fish. Serv., Auke Bay, AK. 63 p. NTIS PB86-
204054.
Kruse, S. 1991. The interactions between killer whales and boats in Johnstone Strait, B.C. p 148-159 In: K. Pryor
and K.S. Norris (eds.), Dolphin societies/discoveries and puzzles. Univ. Calif. Press, Berkeley, CA.
Kruse, S., D.K. Caldwell, and M.C. Caldwell. 1999. Risso‘s dolphin Grampus griseus (G. Cuvier, 1812). p. 183-
212 In: S.H. Ridgway and R. Harrison (eds.), Handbook of marine mammals, Vol. 6: The second book of
dolphins and the porpoises. Academic Press, San Diego, CA. 486 p.
Kryter, K.D. 1985. The effects of noise on man, 2nd
ed. Academic Press, Orlando, FL. 688 p.
Laist, D.W., A.R. Knowlton, J.G. Mead, A.S. Collet, and M. Podesta. 2001. Collisions between ships and whales.
Mar. Mamm. Sci. 17:35–75.
Lander, R.H. and H. Kajimura. 1982. Status of northern fur seals. FAO Fish. Ser. 5:319-345.
Laurinolli, M.H. and N.A. Cochrane. 2005. Hydroacoustic analysis of marine mammal vocalization data from
ocean bottom seismometer mounted hydrophones in the Gully. p. 89-95 In: K. Lee, H. Bain, and G.V.
VI. Literature Cited
Environmental Assessment for L-DEO’s Shatsky Rise Seismic Survey, 2012 Page 86
Hurley (eds.), Acoustic monitoring and marine mammal surveys in The Gully and outer Scotian Shelf before
and during active seismic surveys. Environ. Stud. Res. Funds Rep. 151. 154 p. Published 2007.
Leatherwood, S. and R.R. Reeves. 1983. The Sierra Club handbook of whales and dolphins. Sierra Club, San
Francisco, CA. 302 p.
Leatherwood, S., R.R. Reeves, A.E. Bowles, B.S. Stewart, and K.R. Goodrich. 1984. Distribution, seasonal
movements, and abundance of Pacific white-sided dolphins in the eastern North Pacific. Sci. Rep. Whales
Res. Inst. Tokyo 35:129-157.
LGL. 2008. Environmental assessment of a marine geophysical survey by the R/V Marcus G. Langseth in
Southeast Asia, March–July 2009. LGL Rep. TA4553-1. Rep. from LGL Ltd., King City, Ont., for Lamont-
Doherty Earth Observatory of Columbia Univ., Palisades, NY, and National Science Foundation, Arlington,
VA. Available at http://www.nsf.gov/geo/oce/envcomp/Att1_LGL_Taiger_EA_FINAL_24Oct_ver2.pdf.
Ljungblad, D.K., B. Würsig, S.L. Swartz, and J.M. Keene. 1988. Observations on the behavioral responses of
bowhead whales (Balaena mysticetus) to active geophysical vessels in the Alaskan Beaufort Sea. Arctic
41(3):183-194.
Lockyer, C.H. and S.G. Brown. 1981. The migration of whales. p. 105-137 In: D.J. Aidley (ed.), Animal
migration. Soc. Exp. Biol. Seminar Ser. 13, Cambridge University Press, U.K.
Lucke, K., U. Siebert, P.A. Lepper and M.-A. Blanchet. 2009. Temporary shift in masked hearing thresholds in a
harbor porpoise (Phocoena phocoena) after exposure to seismic airgun stimuli. J. Acoust. Soc. Am.
125(6):4060-4070.
Lusseau, D. 2003. Effects of tour boats on the behavior of bottlenose dolphins: using Markov chains to model
anthropogenic impacts. Conserv. Biol. 17(6):1785-1793.
Lusseau, D. 2004. The hidden cost of tourism: detecting long-term effects of tourism using behavioral information.
Ecol. Soc. 9(1):2.
Lusseau, D. 2005. The residency patterns of bottlenose dolphins (Tursiops spp.) have different strategies to avoid
interactions with tour boats in Doubtful Sound, New Zealand. Mar. Ecol. Prog. Ser. 257:265-272.
Lusseau, D. and L. Bejder. 2007. The long-term consequences of short-term responses to disturbance experience
from whalewatching impact assessment. Int. J. Comp. Psych. 20(2-3):228-236.
Lusseau, D., D.E. Bain, R. Williams, and J.C. Smith. 2009. Vessel traffic disrupts the foraging behavior of
southern resident killer whales Orcinus orca. Endang. Spec. Res. 6:211-221.
MacLean, S.A. and B. Haley. 2004. Marine mammal monitoring during Lamont-Doherty Earth Observatory‘s
seismic study in the Støregga Slide area of the Norwegian Sea, August–September 2003. LGL Rep.
TA2822-20. Rep. from LGL Ltd., King City, Ont., for Lamont-Doherty Earth Observatory of Columbia
Univ., Palisades, NY, and Nat. Mar. Fish. Serv., Silver Spring, MD. 59 p.
MacLean, S.A. and W.R. Koski. 2005. Marine mammal monitoring during Lamont-Doherty Earth Observatory's
seismic program in the Gulf of Alaska, August–September 2004. LGL Rep. TA2822-28. Rep. from LGL
Ltd., King City, Ont., for Lamont-Doherty Earth Observatory of Columbia Univ., Palisades, NY, and Nat.
Mar. Fish. Serv., Silver Spring, MD. 102 p.
MacLeod, C.D. and A. D‘Amico. 2006. A review of beaked whale behaviour and ecology in relation to assessing
and mitigating impacts of anthropogenic noise. J. Cetac. Res. Manage. 7(3):211-221.
MacLeod, C.D., W.F. Perrin, R.L. Pitman, J. Barlow, L. Balance, A. D‘Amico, T. Gerrodette, G. Joyce, K.D.
Mullin, D.L. Palka, and G.T. Waring. 2006. Known and inferred distributions of beaked whale species
(Ziphiidae: Cetacea). J. Cetac. Res. Manage. 7(3):271-286.
Madsen, P.T., B. Mohl, B.K. Nielsen, and M. Wahlberg. 2002. Male sperm whale behavior during exposures to
distant seismic survey pulses. Aquat. Mamm. 28(3):231-240.
VI. Literature Cited
Environmental Assessment for L-DEO’s Shatsky Rise Seismic Survey, 2012 Page 87
Madsen, P.T., M. Johnson, P.J.O. Miller, N. Aguilar de Soto, J. Lynch, and P.L. Tyack. 2006. Quantitative mea-
sures of air gun pulses recorded on sperm whales (Physeter macrocephalus) using acoustic tags during
controlled exposure experiments. J. Acoust. Soc. Am. 120(4):2366–2379.
Malakoff, D. 2002. Suit ties whale deaths to research cruise. Science 298(5594):722-723.
Malme, C.I. and P.R. Miles. 1985. Behavioral responses of marine mammals (gray whales) to seismic discharges.
p. 253-280 In: G.D. Greene, F.R. Engelhardt, and R.J. Paterson (eds.), Proc. Worksh. Effects Explos. Mar.
Environ., Jan. 1985, Halifax, N.S. Tech. Rep. 5. Can. Oil & Gas Lands Admin., Environ. Prot. Br., Ottawa,
Ont. 398 p.
Malme, C.I., P.R. Miles, C.W. Clark, P. Tyack, and J.E. Bird. 1984. Investigations of the potential effects of
underwater noise from petroleum industry activities on migrating gray whale behavior/Phase II: January
1984 migration. BBN Rep. 5586. Rep. from Bolt Beranek & Newman Inc., Cambridge, MA, for U.S.
Minerals Manage. Serv., Anchorage, AK. Var. pag. NTIS PB86-218377.
Malme, C.I., P.R. Miles, P. Tyack, C.W. Clark, and J.E. Bird. 1985. Investigation of the potential effects of
underwater noise from petroleum industry activities on feeding humpback whale behavior. BBN Rep. 5851;
OCS Study MMS 85-0019. Rep. from BBN Labs Inc., Cambridge, MA, for U.S. Minerals Manage. Serv.,
Anchorage, AK. Var. pag. NTIS PB86-218385.
Malme, C.I., B. Würsig, J.E. Bird, and P. Tyack. 1986. Behavioral responses of gray whales to industrial noise:
feeding observations and predictive modeling. Outer Cont. Shelf Environ. Assess. Progr., Final Rep. Princ.
Invest., NOAA, Anchorage, AK 56(1988):393-600. BBN Rep. 6265. 600 p. OCS Study MMS 88-0048;
NTIS PB88-249008.
Malme, C.I., B. Würsig, J.E. Bird, and P. Tyack. 1988. Observations of feeding gray whale responses to controlled
industrial noise exposure. p. 55-73 In: W.M. Sackinger, M.O. Jeffries, J.L. Imm, and S.D. Treacy (eds.), Port
and ocean engineering under arctic conditions, Vol. II. Geophysical Inst., Univ. Alaska, Fairbanks, AK.
111 p.
Mangel, M. 1993. Effects of high-seas driftnet fisheries on the northern right whale dolphin Lissodelphis borealis.
Ecol. Appl. 3:221-229.
Matsuoka, K., H. Kiwada, Y. Fujise, and T. Miyashita. 2009. Distribution of blue (Balaenoptera musculus), fin (B.
physalus), humpback (Megaptera novaeangliae) and North Pacific right (Eubalaena japonica) whales in the
western North Pacific based on JARPN and JARPN II sighting surveys (1994 to 2007). Working Pap.
SC/J09/JR35. Int. Whal. Comm., Cambridge, U.K.
McAlpine, D.F. 2002. Pygmy and dwarf sperm whales Kogia breviceps and K. sima. p. 1007-1009 In: W.F.
Perrin, B. Würsig, and J.G.M. Thewissen (eds.), Encyclopedia of marine mammals. Academic Press, San
Diego, CA. 1414 p.
McAlpine, D.F., L.D. Murison, and E.P. Hoberg. 1997. New records for the pygmy sperm whale, Kogia breviceps
(Physeteridae) from Atlantic Canada with notes on diet and parasites. Mar. Mamm. Sci. 13(4):701-704.
McCauley, R.D., M.-N. Jenner, C. Jenner, K.A. McCabe, and J. Murdoch. 1998. The response of humpback whales
(Megaptera novaeangliae) to offshore seismic survey noise: preliminary results of observations about a
working seismic vessel and experimental exposures. APPEA (Austral. Petrol. Product. Explor. Assoc.) J.
38:692-707.
McCauley, R.D., J. Fewtrell, A.J. Duncan, C. Jenner, M.-N. Jenner, J.D. Penrose, R.I.T. Prince, A. Adhitya, J.
Murdoch, and K. McCabe. 2000a. Marine seismic surveys: analysis of airgun signals; and effects of air gun
exposure on humpback whales, sea turtles, fishes and squid. Rep. from Centre for Marine Science and
Technology, Curtin Univ., Perth, W.A., for Austral. Petrol. Prod. Assoc., Sydney, N.S.W. 188 p.

VI. Literature Cited
Environmental Assessment for L-DEO’s Shatsky Rise Seismic Survey, 2012 Page 88
McCauley, R.D., J. Fewtrell, A.J. Duncan, M.-N. Jenner, M-N., C. Jenner, R.I.T. Prince, A. Adhitya, K. McCabe,
and J. Murdoch. 2000b. Marine seismic surveys – a study of environmental implications. APPEA
(Austral. Petrol. Product. Explor. Assoc.) J. 40:692-708.
McDonald, M.A., J.A. Hildebrand, and S.C. Webb. 1995. Blue and fin whales observed on a seafloor array in the
Northeast Pacific. J. Acoust. Soc. Am. 98(2 Pt.1):712-721.
Mead, J.G. 1989. Beaked whales of the genus Mesoplodon. p. 349-430 In: S.H. Ridgway and R.J. Harrison (eds.),
Handbook of marine mammals, Vol. 4: River dolphins and the larger toothed whales. Academic Press, San
Diego, CA. 444 p.
Mead, J.G. and C.W. Potter. 1995. Recognizing two populations of the bottlenose dolphins (Tursiops truncatus) off
the Atlantic coast of North America: morphological and ecological considerations. IBI Reports 5:31-44.
Mead, J.G., W.A. Walker, and W.J. Jouck. 1982. Biological observations on Mesoplodon carlhubbsi (Cetacea:
Ziphiidae). Smithson. Contrib. Zool. 344.
Miller, G.W., R.E. Elliott, W.R. Koski, V.D. Moulton, and W.J. Richardson. 1999. Whales. p. 5-1 to 5-109 In:
W.J. Richardson (ed.), Marine mammal and acoustical monitoring of Western Geophysical‘s open-water
seismic program in the Alaskan Beaufort Sea, 1998. LGL Rep. TA2230-3. Rep. from LGL Ltd., King City,
Ont., and Greeneridge Sciences Inc., Santa Barbara, CA, for Western Geophysical, Houston, TX, and U.S.
Nat. Mar. Fish. Serv., Anchorage, AK, and Silver Spring, MD. 390 p.
Miller, G.W., V.D. Moulton, R.A. Davis, M. Holst, P. Millman, A. MacGillivray, and D. Hannay. 2005.
Monitoring seismic effects on marine mammals—southeastern Beaufort Sea, 2001–2002. p. 511-542 In:
S.L. Armsworthy, P.J. Cranford, and K. Lee (eds.), Offshore oil and gas environmental effects
monitoring/approaches and technologies. Battelle Press, Columbus, OH. 631 p.
Miller, P.J.O., M.P. Johnson, P.T. Madsen, N. Biassoni, M. Quero, and P.L. Tyack. 2009. Using at-sea experiments
to study the effects of airguns on the foraging behavior of sperm whales in the Gulf of Mexico. Deep-Sea
Res. I 56(7):1168-1181.
Miyashita, T. 1991. Stocks and abundance of Dall‘s porpoises in the Okhotsk Sea and adjacent waters. Working
Pap. SC/43/SM7. Int. Whal. Comm., Cambridge, U.K.
Miyashita, T. 1993a. Abundance of dolphin stocks in the western North Pacific taken by the Japanese drive fishery.
Rep. Int. Whal. Comm. 43:417-437.
Miyashita, T. 1993b. Distribution and abundance of some dolphins taken in the North Pacific driftnet fisheries. Int.
North Pacific Fish. Comm. Bull. 53(3):435-449.
Miyazaki, N. and W.F. Perrin. 1994. Rough-toothed dolphin Steno bredanensis (Lesson, 1828). p. 1-21 In: S.H.
Ridgway and R.J. Harrison (eds.), Handbook of marine mammals, Vol. 5: The first book of dolphins.
Academic Press, San Diego, CA. 416 p.
Mizroch, S.A., D.W. Rice, D. Zwiefelhofer, J. Waite, and W.L. Perryman. 2009. Distribution and movments of fin
whales in the North Pacific Ocean. Mammal Rev. 39(3):193-227.
Moore, S.E., J.M. Waite, N.A. Friday, and T. Honkalehto. 2002. Distribution and comparative estimates of
cetacean abundance on the central and south-eastern Bering Sea shelf with observations on bathymetric and
prey associations. Prog. Oceanogr. 55(1-2):249-262.
Mori, K., F. Sato, and A. Mochizuki. 1998. Recent observation records onf the northern right whale in the waters
of Ogasaw Ara (Bonin Islands), Japan. Abstr. p. 93-94 In: World Mar. Mam. Sci. Conf., Monaco, January
1998.
Moulton, V.D. and G.W. Miller. 2005. Marine mammal monitoring of a seismic survey on the Scotian Slope, 2003.
p. 29-40. In: K. Lee, H. Bain, and G.V. Hurley (eds.), Acoustic monitoring and marine mammal surveys in

VI. Literature Cited
Environmental Assessment for L-DEO’s Shatsky Rise Seismic Survey, 2012 Page 89
the Gully and outer Scotian Shelf before and during active seismic programs. Env. Stud. Res. Funds Rep.
No. 151. 154 p. + xx. Published 2007.
Moulton, V.D. and M. Holst. 2010. Effects of seismic survey sound on cetaceans in the Northwest Atlantic.
Environmental Studies Research Funds Report No. 182. St. John‘s, Newfoundland. 28 p.
Neumann, D.R. 2001. Seasonal movements of short-beaked common dolphins (Delphinus delphis) in the north-
western Bay of Plenty, New Zealand: influence of sea surface temperature and El Niño/La Niña. N.Z. J.
Mar. Freshw. Res. 35:371-374.
Nieukirk, S.L., K.M. Stafford, D.K. Mellinger, R.P. Dziak, and C.G. Fox. 2004. Low-frequency whale and seismic
airgun sounds recorded in the mid-Atlantic Ocean. J. Acoust. Soc. Am. 115(4):1832-1843.
Nishiwaki, M. 1959. Humpback whales in Ryukyuan waters. Sci. Rep. Whales Res. Inst. Tokyo 14:49-87.
NMFS (National Marine Fisheries Service). 1991. Recovery plan for the northern right whale (Eubalaena
glacialis). Prepared by the Right Whale Recovery Team for Nat. Mar. Fish. Serv., Silver Spring, MD. 86 p.
NMFS (National Marine Fisheries Service). 1995. Small takes of marine mammals incidental to specified
activities; offshore seismic activities in southern California. Fed. Regist. 60(200, 17 Oct.):53753-53760.
NMFS (National Marine Fisheries Service). 1998. Recovery plan for the blue whale (Balaenoptera musculus).
Prepared by R.R. Reeves, P.J. Clapham, R.L. Brownell, Jr., and G.K. Silber for Nat. Mar. Fish. Serv., Silver
Spring, MD. 42 p.
NMFS (National Marine Fisheries Service). 2000. Small takes of marine mammals incidental to specified
activities; marine seismic-reflection data collection in southern California/Notice of receipt of application.
Fed. Regist. 65(60, 28 Mar.):16374-16379.
NMFS (National Marine Fisheries Service). 2001. Small takes of marine mammals incidental to specified
activities; oil and gas exploration drilling activities in the Beaufort Sea/Notice of issuance of an incidental
harassment authorization. Fed. Regist. 66(26, 7 Feb.):9291-9298.
NMFS (National Marine Fisheries Service). 2005. Endangered fish and wildlife; notice of intent to prepare an
environmental impact statement. Fed. Regist. 70(7, 11 Jan.):1871-1875.
NMFS (National Marine Fisheries Service). 2007. Pacific Islands region marine mammal response network activity
update, July–September 2007. Accessed in October 2011 at
http://www.fpir.noaa.gov/Library/PRD/Marine%20Mammal%20Response/MMRN%20Newsletter%206%20
HT%20final.pdf
NOAA and USN (National Oceanographic and Atmospheric Administration and U.S. Navy). 2001. Joint interim
report: Bahamas marine mammal stranding event of 15–16 March 2000. U.S. Dep. Commer., Nat. Oceanic
Atmos. Admin., Nat. Mar. Fish. Serv., Sec. Navy, Assist. Sec. Navy, Installations and Environ. 59 p.
Accessed in September 2011 at http://www.nmfs.noaa.gov/pr/pdfs/health/stranding_bahamas2000.pdf.
Noren, D.P., A.H. Johnson, D. Rehder, and A. Larson. 2009. Close approaches by vessels elicit surface active
behaviours by southern resident killer whales. Endang. Spec. Res. 8: 179-192.
Nowacek, D.P., L.H. Thorne, D.W. Johnston, and P.L. Tyack. 2007. Responses of cetaceans to anthropogenic
noise. Mamm. Rev. 37(2):81-115.
NRC (National Research Council). 2005. Marine mammal populations and ocean noise/Determining when noise
causes biologically significant effects. U.S. Nat. Res. Counc., Ocean Studies Board, Committee on
Characterizing Biologically Significant Marine Mammal Behavior (Wartzok, D.W., J. Altmann, W. Au, K.
Ralls, A. Starfield, and P.L. Tyack). Nat. Acad. Press, Washington, DC. 126 p.
VI. Literature Cited
Environmental Assessment for L-DEO’s Shatsky Rise Seismic Survey, 2012 Page 90
Odell, D.K. and K.M. McClune. 1999. False killer whale Pseudorca crassidens (Owen, 1846). p. 213-243 In: S.H.
Ridgway and R. Harrison (eds.), Handbook of marine mammals, Vol. 6: The second book of dolphins and
the porpoises. Academic Press, San Diego, CA. 486 p.
Ohsumi, S. and S. Wada. 1974. Status of whale stocks in the North Pacific, 1972. Rep. Int. Whal. Comm.
25:114-126.
Olson, P.A. and S. B. Reilly. 2002. Pilot whales. p. 898-893 In: W.F. Perrin, B. Würsig, and J.G.M. Thewissen
(eds.), Encyclopedia of marine mammals. Academic Press, San Diego, CA. 1414 p.
Omura, H. 1986. History of right whale catches in the waters around Japan. Rep. Int. Whal. Comm. Spec. Iss.
10:35-41.
Panigada, S., M. Zanardelli, S. Canese, and M. Jahoda. 1999. Deep diving performances of Mediterranean fin
whales. p. 144 In: Abstr., 13th Bienn. Conf. Biol. Mar. Mamm. 28 Nov.–3 Dec. 1999, Wailea, Maui, HI.
Papastavrou, V., S.C. Smith, and H. Whitehead. 1989. Diving behaviour of the sperm whale, Physeter
macrocephalus, off the Galápagos Islands. Can. J. Zool. 67(4):839-846.
Parente, C.L., M.C.C. Marcondes, and M.H. Engel. 2006. Humpback whale strandings and seismic surveys in
Brazil from 1999 to 2004. Working Pap. SC/58/E41. Int. Whal. Comm., Cambridge, U.K. 16 p.
Parsons, E.C.M. and T.A. Jefferson. 2000. Post-mortem investigations on stranded dolphins and porpoises from
Hong Kong waters. J. Wildl. Dist. 36(2):342-356.
Parsons, E.C.M., M.L. Felley, and L.J. Porter. 1995. An annotated checklist of cetaceans recorded from Hong
Kong‘s territorial waters. Asian Mar. Biol. 12:79-100.
Payne, R. 1978. Behavior and vocalizations of humpback whales (Megaptera sp.). In: K.S Norris and R.R.
Reeves (eds.), Report on a workshop on problems related to humpback whales (Megaptera novaeangliae) in
Hawaii. MCC-77/03. Rep. from Sea Life Inc., Makapuu Pt., HI, for U.S. Mar. Mamm. Comm., Washington,
DC.
Perrin, W.F. 2002a. Pantropical spotted dolphin Stenella attenuata. p. 865-867 In: W.F. Perrin, B. Würsig, and
J.G.M. Thewissen (eds.), Encyclopedia of marine mammals. Academic Press, San Diego, CA. 1414 p.
Perrin, W.F. 2002b. Common dolphins Delphinus delphis, D. capensis, and D. tropicalis. p. 245-248 In: W.F.
Perrin, B. Würsig, and J.G.M. Thewissen (eds.), Encyclopedia of marine mammals. Academic Press, San
Diego, CA. 1414 p.
Perrin, W.F. and R.L. Brownell, Jr. 2002. Minke whales Balaenoptera acutorostrata and B. bonaerensis. p. 750-
754 In: W.F. Perrin, B. Würsig, and J.G.M. Thewissen (eds.), Encyclopedia of marine mammals. Academic
Press, San Diego, CA. 1414 p.
Perrin, W.F. and A.A. Hohn. 1994. Pantropical spotted dolphin Stenella attenuata. p. 71-98 In: S.H. Ridgway and
R. Harrison (eds.), Handbook of marine mammals, Vol. 5: The first book of dolphins. Academic Press, San
Diego, CA. 416 p.
Perrin, W.F., C.E. Wilson, and F.I. Archer II. 1994a. Striped dolphin Stenella coeruleoalba (Meyen, 1833). p. 129-
159 In: S. H. Ridgway and R. J. Harrison (eds.), Handbook of marine mammals, Vol. 5: The first book of
dolphins. Academic Press, San Diego, CA. 416 p.
Perrin, W.F., S. Leatherwood, and A. Collet. 1994b. Fraser's dolphin Lagenodelphis hosei Fraser, 1956. p. 225-
240 In: S.H. Ridgway and R. Harrison (eds.), Handbook of marine mammals, Vol. 5: The first book of
dolphins. Academic Press, San Diego, CA. 416 p.
Perrin, W.F., M.L.L. Dolar, and D. Robineau. 1999. Spinner dolphins (Stenella longirostris) of the western Pacific
and Southeast Asia: pelagic and shallow-water forms. Mar. Mamm. Sci. 15(4):1029-1053.

VI. Literature Cited
Environmental Assessment for L-DEO’s Shatsky Rise Seismic Survey, 2012 Page 91
Perrin, W.F., M.L.L. Dolar, M. Amano, and A. Hayano. 2003. Cranial sexual dimorphism and geographic variation
in Fraser‘s dolphin, Lagenodelphis hosei. Mar. Mamm. Sci. 19(3):484-501.
Perrin, W.F., R.R. Reeves, M.L.L. Dolar, T.A. Jefferson, H. Marsh, J.Y. Wang, and J. Estacion (eds). 2005. Report
of the second workshop on the biology and conservation of small cetaceans and dugongs of south-east Asia.
CMS Tech. Ser. Publ. No. 9. 161 p.
Perry, S.L., D.P. DeMaster, and G.K. Silber. 1999a. The great whales: history and status of six species listed as
endangered under the U.S. Endangered Species Act of 1973. Mar. Fish. Rev. 61(1):7-23.
Perry, S.L., D.P. DeMaster, and G.K. Silber. 1999b. The fin whale. Mar. Fish. Rev. 61(1):44-51.
Perryman, W.L., D.W.K. Au, S. Leatherwood, and T.A. Jefferson. 1994. Melon-headed whale Peponocephala
electra Gray, 1846. p. 363-386 In: S.H. Ridgway and R. Harrison (eds.), Handbook of marine mammals,
Vol. 5: The first book of dolphins. Academic Press, San Diego, CA. 416 p.
Pierson, M.O., J.P. Wagner, V. Langford, P. Birnie, and M.L. Tasker. 1998. Protection from, and mitigation of, the
potential effects of seismic exploration on marine mammals. Chapter 7 In: M.L. Tasker and C. Weir (eds.),
Proc. Seismic Mar. Mamm. Worksh., London, U.K., 23–25 June 1998.
Pike, D.G., G.A. Víkingsson, T. Gunnlaugsson, and N. Øien. 2009. A note on the distribution and abundance of
blue whales (Balaenoptera musculus) in the Central and Northeast Atlantic Ocean. NAAMCO Sci. Publ.
7:19-29.
Pike, G.C. and I.B. MacAskie. 1969. Marine mammals of British Columbia. Bull. Fish. Res. Board Can. 171.
54 p.
Pitman, R.L. 2002. Mesoplodont whales Mesoplodon spp. p. 738-742 In: W.F. Perrin, B. Würsig, and J.G.M.
Thewissen (eds.), Encyclopedia of marine mammals. Academic Press, San Diego, CA. 1414 p.
Pitman, R.L., A. Aguayo L., and J. Urbán R. 1987. Observations of an unidentified beaked whale (Mesoplodon sp.)
in the eastern tropical Pacific. Mar. Mamm. Sci. 3(4):345-352.
Pitman, R.L., D.M. Palacios, P.L.R. Brennan, B.J. Brennan, K.C. Balcomb, III, and T. Miyashita. 1999. Sightings
and possible identity of a bottlenose whale in the tropical Indo-Pacific: Indopacetus pacificus? Mar.
Mamm. Sci. 15(2): 513-518.
Potter, J.R., M. Thillet, C. Douglas, M.A. Chitre, Z. Doborzynski, and P.J. Seekings. 2007. Visual and passive
acoustic marine mammal observations and high-frequency seismic source characteristics recorded during a
seismic survey. IEEE J. Oceanic Eng. 32(2):469-483.
Psarakos, S., D.L. Herzing, and K. Marten. 2003. Mixed-species associations between pantropical spotted dolphins
(Stenella attenuata) and Hawaiian spinner dolphins (Stenella longirostris) off Oahu, Hawaii. Aquat.
Mamm. 29(3):390-395.
Reeves, R.R., J.G. Mead, and S. Katona. 1978. The right whale, Eubalaena glacialis, in the western North Atlantic.
Rep. Int. Whal. Comm. 28:303-12.
Reeves, R.R., S. Leatherwood, G.S. Stone, and L. G. Eldredge. 1999. Marine mammals in the area served by the
South Pacific Regional Environment Programme (SPREP). SPREP, Apia, Samoa. 55 p.
Reeves, R.R., B.S. Stewart, P.J. Clapham, and J.A. Powell. 2002. Guide to marine mammals of the world.
Chanticleer Press, New York, NY. 525 p.
Reeves, R.R., B.D. Smith, E.A. Crespo, and G. Notarbartolo di Sciara. 2003. Dolphins, whales, and porpoises.
2002–2010 conservation action plan for the world‘s cetaceans. IUCN/SSC Cetacean Specialist Group.
Gland, Switzerland, and Cambridge, U.K.
Reilly, S.B. 1990. Seasonal changes in distribution and habitat differences among dolphins in the eastern tropical
Pacific. Mar. Ecol. Prog. Ser. 66(1-2):1-11.
VI. Literature Cited
Environmental Assessment for L-DEO’s Shatsky Rise Seismic Survey, 2012 Page 92
Reilly, S.B. and P.C. Fiedler. 1994. Interannual variability of dolphin habitats in the eastern tropical Pacific. I:
Research vessel surveys, 1986–1990. Fish. Bull. 92(2):434-450.
Reilly, S.B. and V.G. Thayer. 1990. Blue whale (Balaenoptera musculus) distribution in the eastern tropical
Pacific. Mar. Mamm. Sci. 6:265-277.
Reilly, S.B., J.L. Bannister, P.B. Best, M. Brown, R.L. Brownell Jr., D.S. Butterworth, P.J. Clapham, J. Cooke, G.P.
Donovan, J. Urbán, and A.N. Zerbini. 2008a. Eschrichtius robustus (western subpopulation). In: IUCN
2011. IUCN Red List of Threatened Species. Version 2011.1. Accessed in October 2011 at
http://www.iucnredlist.org/apps/redlist/details/8099/0.
Reilly, S.B., J.L. Bannister, P.B Best, M. Brown, R.L. Brownell Jr., D.S. Butterworth, P.J. Clapham, J. Cooke, G.P.
Donovan, J. Urbán, and A.N. Zerbini. 2008b. Balaenoptera borealis. In: IUCN 2011. IUCN Red List of
Threatened Species. Version 2011.1. Accessed at http://www.iucnredlist.org/apps/redlist/details/2475/0 in
October 2011.
Rendell, L.E. and J.C.D. Gordon. 1999. Vocal response of long-finned pilot whales (Globicephala melas) to
military sonar in the Ligurian Sea. Mar. Mamm. Sci. 15(1):198-204.
Reyes, J.C. 1991. The conservation of small cetaceans: a review. Rep. for the Secretariat of the Convention on the
Conservation of Migratory Species of Wild Animals. UNEP/CMS Secretariat, Bonn, Germany.
Rice, D.W. 1978. The humpback whale in the North Pacific: distribution, exploitation and numbers. p. 29-44 In:
K.S. Norris and R.R. Reeves (eds.), Report on a workshop on problems related to humpback whales
(Megaptera novaeangliae) in Hawaii. NTIS PB 280 794, U.S. Department of Commerce.
Rice, D.W. 1986. Beaked whales. p. 102-109 In: D. Haley (ed.), Marine mammals of the eastern North Pacific and
arctic waters. Pacific Search Press, Seattle, WA.
Rice, D.W. 1989. Sperm whale Physeter macrocephalus Linnaeus, 1758. p. 177-233 In: S.H. Ridgway and R.
Harrison (eds.), Handbook of marine mammals, Vol. 4: River dolphins and the larger toothed whales.
Academic Press, San Diego, CA. 444 p.
Rice, D.W. 1998. Marine mammals of the world, systematics and distribution. Spec. Publ. 4. Soc. Mar. Mammal.,
Allen Press, Lawrence, KS. 231 p.
Richardson, W.J., B. Würsig, and C.R. Greene. 1986. Reactions of bowhead whales, Balaena mysticetus, to
seismic exploration in the Canadian Beaufort Sea. J. Acoust. Soc. Am. 79(4):1117-1128.
Richardson, W.J., R.A. Davis, C.R. Evans, D.K. Ljungblad, and P. Norton. 1987. Summer distribution of bowhead
whales, Balaena mysticetus, relative to oil industry activities in the Canadian Beaufort Sea, 1980–84. Arctic
40(2):93-104.
Richardson, W.J., C.R. Greene, Jr., C.I. Malme, and D.H. Thomson. 1995. Marine mammals and noise. Academic
Press, San Diego. 576 p.
Richardson, W.J., G.W. Miller, and C.R. Greene, Jr. 1999. Displacement of migrating bowhead whales by sounds
from seismic surveys in shallow waters of the Beaufort Sea. J. Acoust. Soc. Am. 106(4, Pt. 2):2281
(Abstract).
Richardson, W.J., M. Holst, W.R. Koski, and M. Cummings. 2009. Responses of cetaceans to large-source seismic
surveys by Lamont-Doherty Earth Observatory. p. 213 In: Abstr. 18th
Bienn. Conf. Biol. Mar. Mamm.,
Québec, Oct. 2009. 306 p.
Richter, C.F., S.M. Dawson, and E. Slooten. 2003. Sperm whale watching off Kaikoura, New Zealand: effects of
current activities on surfacing and vocalisation patterns. Science for Conserv. 219. Dep. of Conserv.,
Wellington, N.Z. 78 p.

VI. Literature Cited
Environmental Assessment for L-DEO’s Shatsky Rise Seismic Survey, 2012 Page 93
Richter, C., S. Dawson, and E. Slooten. 2006. Impacts of commercial whale watching on male sperm whales at
Kaikoura, New Zealand. Mar. Mamm. Sci. 22(1):46-63.
Rogers, P. and M. Cox. 1988. Underwater sound as a biological stimulus. p. 131-149 In: J. Atema., R.R. Fay, A.N.
Popper, and W.N. Tavolga (eds.), The sensory biology of aquatic animals. Springer-Verlag, New York, NY.
Roppel, A.Y. 1984. Management of northern fur seals on the Pribilof Islands, Alaska, 1786–1981. U.S. Dep.
Commer., NOAA Tech. Rep. NMFS-4. 32 p.
Ross, G.J.B. and S. Leatherwood. 1994. Pygmy killer whale Feresa attenuata Gray, 1874. p. 387-404 In: S.H.
Ridgway and R.J. Harrison (eds.), Handbook of marine mammals, Vol. 5: The first book of dolphins.
Academic Press, San Diego, CA. 416 p.
Rowntree, V., J. Darling, G. Silber, and M. Ferrari. 1980. Rare sighting of a right whale (Eubalaena glacialis) in
Hawaii. Can. J. Zool. 58(2):308-312.
Rudolph, P. and C. Smeenk. 2002. Indo-West Pacific marine mammals. p. 617-624 In: W.F. Perrin, B. Würsig,
and J.G.M. Thewissen (eds.), Encyclopedia of marine mammals. Academic Press, San Diego, CA. 1414 p.
Salden, D.R. 1993. Effects of research boat approaches on humpback whale behavior off Maui, Hawaii, 1989–
1993. p. 94 In: Abstr. 10th
Bienn. Conf. Biol. Mar. Mamm., Galveston, TX, Nov. 1993. 130 p.
Salden, D.R., L.M. Herman, M. Yamaguchik, and F. Sato. 1999. Mulitple visits of individual humpback whales
(Megaptera novaeangliae) between the Hawaiian and Japanese winter grounds. Can. J. Zool. 77:504-508.
Sasaki, T., M. Nikaido, S. Wada, T.K. Yamada, Y. Cao, M. Hasegawa, and N. Okada. 2006. Balaenoptera omurai
is a newly discovered baleen whale that represents an ancient evolutionary lineage. Mol. Phylogenet. Evol.
41:40-52.
Scarff, J.E. 1986. Historic and present distribution of the right whale (Eubalaena glacialis) in the eastern North
Pacific south of 50ºN and east of 180ºW. Rep. Int. Whal. Comm. Spec. Iss. 10:43-63.
Scarff, J.E. 1991. Historic distribution and abundance of the right whale (Eubalaena glacialis) in the North Pacific,
Bering Sea, Sea of Okhotsk and Sea of Japan from the Maury whale charts. Rep. Int. Whal. Comm.
41:467-489.
Scheidat, M., C. Castro, J. Gonzalez, and R. Williams. 2004. Behavioural responses of humpback whales
(Megaptera novaeangliae) to whalewatching boats near Isla de la Plata, Machalilla National Park, Ecuador.
J. Cetac. Res. Manage. 6: 63-68.
Schilling, M.R., I. Selpt, M.T. Weinrich, S.E. Frohock, A.E. Kuhlberg, and P.J. Clapham. 1992. Behavior of
individually-identified sei whales Balaenoptera borealis during an episodic influx into the southern Gulf of
Maine in 1986. Fish. Bull. 90:749-755.
Schlundt, C.E., J.J. Finneran, D.A. Carder, and S.H. Ridgway. 2000. Temporary shift in masking hearing
thresholds of bottlenose dolphins, Tursiops truncatus, and white whales, Delphinapterus leucas, after
exposure to intense tones. J. Acoust. Soc. Am. 107(6):3496-3508.
Sears, R. 2002. Blue whale Balaenoptera musculus. p. 112-116 In: W.F. Perrin, B. Würsig, and J.G.M. Thewissen
(eds.), Encyclopedia of marine mammals. Academic Press, San Diego, CA. 1414 p.
Sergeant, D.E. 1977. Stocks of fin whales Balaenoptera physalus L. in the North Atlantic Ocean. Rep. Int. Whal.
Comm. 27:460-473.
Shelden, K.E.W., S.E. Moore, J.M. Waite, P.R. Wade, and D.J. Rugh. 2005. Historic and current habitat use by
North Pacific right whales Eubalaena japonica in the Bering Sea and Gulf of Alaska. Mamm. Rev.
35(2):129-155.
VI. Literature Cited
Environmental Assessment for L-DEO’s Shatsky Rise Seismic Survey, 2012 Page 94
Shimada, H., H. Okamura, T. Kitakado, and T. Miyashita. 2008. Abundance estimate of western North Pacific
Bryde‘s whales for the estimation of additional variance and CLA application. Working Pap. SC/60/FF12.
Int. Whal. Comm., Cambridge, U.K. 32 p.
Simard, Y., F. Samaran, and N. Roy. 2005. Measurement of whale and seismic sounds in the Scotian Gully and
adjacent canyons in July 2003. p. 97-115 In: K. Lee, H. Bain, and C.V. Hurley (eds.), Acoustic monitoring
and marine mammal surveys in The Gully and outer Scotian Shelf before and during active seismic surveys.
Environ. Stud. Res. Funds Rep. 151. 154 p. (Published 2007).
Simmonds, M. P. and L.F. Lopez-Jurado. 1991. Whales and the military. Nature 351(6326):448.
Smith, B.D., G. Braulik, T.A. Jefferson, B.D. Chung, C.T. Vinh, D.V. Du, B.V. Hanh, P.D. Trong, D.T. Ho, and
V.V. Quang. 2003. Notes on two cetacean surveys in the Gulf of Tonkin, Vietnam. Raff. Bull. Zool.
51(1):165-171.
Smith, S.D. and H. Whitehead. 1999. Distribution of dolphins in Galápagos waters. Mar. Mamm. Sci. 15(2)550-
555.
Smultea, M.A., M. Holst, W.R. Koski, and S. Stoltz. 2004. Marine mammal monitoring during Lamont-Doherty
Earth Observatory‘s seismic program in the Southeast Caribbean Sea and adjacent Atlantic Ocean, April–
June 2004. LGL Rep. TA2822-26. Rep. from LGL Ltd., King City, Ont., for Lamont-Doherty Earth
Observatory of Columbia Univ., Palisades, NY, and Nat. Mar. Fish. Serv., Silver Spring, MD. 106 p.
Southall, B.L., A.E. Bowles, W.T. Ellison, J.J. Finneran, R.L. Gentry, C.R. Greene Jr., D. Kastak, D.R. Ketten, J.H.
Miller, P.E. Nachtigall, W.J. Richardson, J.A. Thomas, and P.L. Tyack. 2007. Marine mammal noise
exposure criteria: initial scientific recommendations. Aquat. Mamm. 33(4):411-522.
Stacey, P.J. and R.W. Baird. 1991. Status of the false killer whale, Pseudorca crassidens, in Canada. Can. Field-
Nat. 105(2):189-197.
Stafford, K.M. 2003. Two types of blue whale calls recorded in the Gulf of Alaska. Mar. Mamm. Sci. 19(4):682-
693.
Stafford, K.M., S.L. Nieukirk, and C.G. Fox. 1999. Low-frequency whale sounds recorded on hydrophones moored
in the eastern tropical Pacific. J. Acoust. Soc. Am. 106(6):3687-3698.
Stafford, K.M., S.L. Nieukirk, and C.G. Fox. 2001. Geographic and seasonal variation of blue whale calls in the
North Pacific. J. Cetac. Res. Manage. 3(1):65-76
Stafford, K.M., D.K. Mellinger, S.E. Moore, and C.G. Fox. 2007. Seasonal variability and detection range
modeling of baleen whale calls in the Gulf of Alaska, 1999–2002. J. Acoust. Soc. Am. 122(6):3378-3390.
Stewart, B.S. and S. Leatherwood. 1985. Minke whale Balaenoptera acutorostrata Lacépède, 1804. p. 91-136 In:
S.H. Ridgway and R. Harrison (eds.), Handbook of marine mammals, Vol. 3: The sirenians and baleen
whales. Academic Press, London, U.K. 362 p.
Stockin, K.A., D. Lusseau, V. Binedell, N. Wiseman, and M.B. Orams. 2008. Tourism affects the behavioural
budget of the common dolphin Delphinus sp. in the Hauraki Gulf, New Zealand. Mar. Ecol. Prog. Ser.
355:287-295.
Stone, C.J. 2003. The effects of seismic activity on marine mammals in UK waters 1998–2000. JNCC Report 323.
Joint Nature Conservancy, Aberdeen, Scotland. 43 p.
Stone, C.J. and M.L. Tasker. 2006. The effects of seismic airguns on cetaceans in U.K. waters. J. Cetac. Res.
Manage. 8(3):255-263.
Tillman, M.F. 1977. Estimates of population size for the North Pacific sei whale. Rep. Int. Whal. Comm. Spec.
Iss. 1:98-106.

VI. Literature Cited
Environmental Assessment for L-DEO’s Shatsky Rise Seismic Survey, 2012 Page 95
Tolstoy, M., J. Diebold, L. Doermann, S. Nooner, S.C. Webb, D.R. Bohenstiehl, T.J. Crone, and R.C. Holmes.
2009. Broadband calibration of R/V Marcus G. Langseth four-string seismic sources. Geochem. Geophys.
Geosyst., 10, Q08011, doi:10.1029/2009GC002451.
Tyack, P.L. 2009. Human-generated sound and marine mammals. Phys. Today 62(11, Nov.):39-44.
Tyack, P., M. Johnson, and P. Miller. 2003. Tracking responses of sperm whales to experimental exposures of
airguns. p. 115-120 In: A.E. Jochens and D.C. Biggs (eds.), Sperm whale seismic study in the Gulf of
Mexico/annual report: Year 1. OCS Study MMS 2003-069. Rep. from Texas A&M Univ., College Station,
TX, for U.S. Minerals Manage. Serv., Gulf of Mexico OCS Reg., New Orleans, LA.
Tyack, P.L., M. Johnson, N. Aguilar Soto, A. Sturlese, and P.T. Madsen. 2006. Extreme diving of beaked whales.
J. Exp. Biol. 209(21):4238-4253.
Tynan, C.T., D.P. DeMaster, and W.T. Peterson. 2001. Endangered right whales on the southeastern Bering Sea
shelf. Science 294(5548):1894.
UNEP-WCMC. 2011. UNEP-WCMC Species Database: CITES-Listed Species. Appendices I, II and III. Valid
from 27 April 2011. Accessed on 14 September 2011 at http://www.cites.org/eng/app/appendices.shtml.
Urick, R.J. 1983. Principles of underwater sound, 3rd
Ed. McGraw-Hill, New York, NY. 423 p.
Vanderlaan, A.S.M. and C.T. Taggart. 2007. Vessel collisions with whales: the probability of lethal injury based on
vessel speed. Mar. Mamm. Sci. 23(1):144-156.
Wada, S. 1973. The ninth memorandum on the stock assessment of whales in the North Pacific. Rep. Int. Whal.
Comm. 23:164-169.
Wada, S., M. Oishi, and T. Yamada. 2003. A newly discovered species of living baleen whale. Nature
426(6969):278-281.
Wade, P.R. and T. Gerrodette. 1993. Estimates of cetacean abundance and distribution in the eastern tropical
Pacific. Rep. Int. Whal. Comm. 43:477-493.
Walker, J.L., C.W. Potter, and S.A. Macko. 1999. The diets of modern and historic bottlenose dolphin populations
reflected through stable isotopes. Mar. Mamm. Sci. 15(2):335-350.
Wang, J.Y. and S.-C. Yang. 2006. Unusual cetacean stranding events of Taiwan in 2004 and 2005. J. Cetac. Res.
Manage. 8(3):283-292.
Wang, J.Y., L.-S. Chou, C.-J. Yao, A.S. Neimanis, and W.-H. Chou. 1995. Records of Cuvier‘s beaked whales
(Ziphius cavirostris) from Taiwan, Republic of China. Asian Mar. Biol. 12:111-118.
Waring, G.T., E. Josephson, C.P. Fairfield-Walsh, and K. Maze-Foley (eds). 2009. U.S. Atlantic and Gulf of
Mexico Marine Mammals Stock Assessments: 2008. NOAA Tech. Memo. NMFS-NE-210. 440 p.
Wartzok, D., A.N. Popper, J. Gordon, and J. Merrill. 2004. Factors affecting the responses of marine mammals to
acoustic disturbance. Mar. Technol. Soc. J. 37(4):6-15.
Watkins, W.A. and K.E. Moore. 1982. An underwater acoustic survey for sperm whales (Physeter catodon) and
other cetaceans in the southeast Caribbean. Cetology 46:1-7.
Watkins, W.A., K.E. Moore, and P. Tyack. 1985. Sperm whale acoustic behaviors in the southeast Caribbean.
Cetology 49:1-15.
Watkins, W.A., M.A. Daher, G.M. Reppucci, J.E. George, D.L. Martin, N.A. DiMarzio, and D.P. Gannon. 2000a.
Seasonality and distribution of whale calls in the North Pacific. Oceanography 13:62-67.
Watkins, W.A., J.E. George, M.A. Daher, K. Mullin, D.L. Martin, S.H. Haga, and N.A. DiMarzio. 2000b. Whale
call data from the North Pacific, November 1995 through July 1999: occurrence of calling whales and source
VI. Literature Cited
Environmental Assessment for L-DEO’s Shatsky Rise Seismic Survey, 2012 Page 96
locations from SOSUS and other acoustic systems. Tech. Rep. WHOI-00-02. Woods Hole Oceanographic
Inst., Woods Hole, MA. 160 p.
Weilgart, L.S. 2007. A brief review of known effects of noise on marine mammals. Int. J. Comp. Psychol.
20:159-168.
Weir, C.R. 2008. Overt responses of humpback whales (Megaptera novaeangliae), sperm whales (Physeter macro-
cephalus), and Atlantic spotted dolphins (Stenella frontalis) to seismic exploration off Angola. Aquat.
Mamm. 34(1):71-83.
Weir, C.R. and S.J. Dolman. 2007. Comparative review of the regional marine mammal mitigation guidelines
implemented during industrial seismic surveys, and guidance towards a worldwide standard. J. Int. Wildl.
Law and Policy. 10(1):1-27.
Weller, D.W., A.L. Bradford, A.R. Lang, H.W. Kim, M. Sidorenko, G.A. Tsidulko, A.M. Burdin, and R.L.
Brownell, Jr. 2008. Status of western gray whales off northeastern Sakhalin Island, Russia, in 2007.
Working Pap. SC/60/BRG3. Int. Whal. Comm., Cambridge, U.K. 9 p.
Whitehead, H. 1993. The behavior of mature male sperm whales on the Galápagos breeding grounds. Can. J.
Zool. 71(4):689-699.
Whitehead, H. 2002a. Sperm whale Physeter macrocephalus. p. 1165-1172 In: W.F. Perrin, B. Würsig, and J.G.M.
Thewissen (eds.), Encyclopedia of marine mammals. Academic Press, San Diego, CA. 1414 p.
Whitehead, H. 2002b. Estimates of the current global population size and historical trajectory for sperm whales.
Mar. Ecol. Prog. Ser. 242:295-304.
Whitehead, H. 2003. Sperm whales: social evolution in the ocean. University of Chicago Press, Chicago, IL.
431 p.
Whitehead, H. and S. Waters. 1990. Social organization and population structure of sperm whales off the
Galápagos Islands, Ecuador (1985–1987). Rep. Int. Whal. Comm. Spec. Iss. 12:249-257.
Whitehead, H., W.D. Bowen, S.K. Hooker, and S. Gowans. 1998. Marine mammals. p. 186-221 In: W.G. Harrison
and D.G. Fenton (eds.), The Gully: a scientific review of its environment and ecosystem. Dep. Fish. Oceans,
Ottawa, Ont. Canadian Stock Assess. Secret. Res. Doc. 98/83.
Wieting, D. 2004. Background on development and intended use of criteria. p. 20 In: S. Orenstein, L. Langstaff, L.
Manning, and R. Maund (eds.), Advisory Committee on Acoustic Impacts on Marine Mammals, final meet.
Summary. Second meet., April 28–30, 2004, Arlington, VA. Sponsored by Mar. Mamm. Comm., 10 Aug.
Williams, R., D.E. Bain, J.K.B. Ford, and A.W. Trites. 2002a. Behavioural responses of male killer whales to a
leapfrogging vessel. J. Cetac. Res. Manage. 4(3):305-310.
Williams, R., A.W. Trites, and D.E. Bain. 2002b. Behavioural responses of killer whales (Orcinus orca) to whale-
watching boats: opportunistic observations and experimental approaches. J. Zool. Lond. 256:255-270.
Williams, T.M, W.A. Friedl, M.L Fong, R.M. Yamada, P. Sideivy, and J.E. Haun. 1992. Travel at low energetic
cost by swimming and wave-riding bottlenose dolphins. Nature 355(6363):821-823.
Willis, P.M. and R.W. Baird. 1998. Sightings and strandings of beaked whales on the west coast of Canada.
Aquat. Mamm. 24(1):21-25.
Winsor, M.H. and B.R. Mate. 2006. Seismic survey activity and the proximity of satellite tagged sperm whales.
Working Pap. SC/58/E16. Int. Whal. Comm., Cambridge, U.K. 8 p.
Würsig, B., S.K. Lynn, T.A. Jefferson, and K.D. Mullin. 1998. Behaviour of cetaceans in the northern Gulf of
Mexico relative to survey ships and aircraft. Aquat. Mamm. 24(1):41-50.
Würsig, B.G., D.W. Weller, A.M. Burdin, S.H. Reeve, A.L Bradford, S.A. Blokhin, and R.L Brownell, Jr. 1999.
Gray whales summering off Sakhalin Island, Far East Russia: July–October 1997. A joint U.S.-Russian
VI. Literature Cited
Environmental Assessment for L-DEO’s Shatsky Rise Seismic Survey, 2012 Page 97
scientific investigation. Final Report. Rep. from Texas A&M Univ., College Station, TX, and Kamchatka
Inst. Ecol. & Nature Manage., Russian Acad. Sci., Kamchatka, Russia, for Sakhalin Energy Investment Co.
Ltd. and Exxon Neftegaz Ltd., Yuzhno-Sakhalinsk, Russia. 101 p.
Yamada, T.K., T. Kakuda, N. Kubo, and M.L. Dalebout. 2004. Kagoshima specimen of Longman‘s beaked whale.
Proc. 18th
Conf. European Cetac. Soc., Kolmården, Sweden, 28–31 March 2004.
Yang, W.-C., L.-S. Chou, P.D. Jepson, R.L. Brownell, D. Cowan, P.-H. Chang, H.-I. Chiou, C.-J. Yao, T.K.
Yamada, J.-T. Chiu, S.-C. Chin, P.-J. Wang, and A. Fernández. 2008. Unusual cetacean mortality event in
Taiwan: caused by naval activities? Vet. Rec. 162.
Yazvenko, S.B., T.L. McDonald, S.A. Blokhin, S.R. Johnson, S.K. Meier, H.R. Melton, M.W. Newcomer, R.M.
Nielson, V.L. Vladimirov, and P.W. Wainwright. 2007a. Distribution and abundance of western gray
whales during a seismic survey near Sakhalin Island, Russia. Environ. Monit. Assess. 134(1-3):45-73. doi:
10.1007/s10661-007-9809-9.
Yazvenko, S.B., T.L. McDonald, S.A. Blokhin, S.R. Johnson, H.R. Melton, and M.W. Newcomer. 2007b. Feeding
activity of western gray whales during a seismic survey near Sakhalin Island, Russia. Environ. Monit.
Assess. 134(1-3): 93-106. doi: 10.1007/s10661-007-9810-3.
Yochem, P.K. and S. Leatherwood. 1985. Blue whale. p. 193-240 In: S.H. Ridgway and R Harrison (eds.), Hand-
book of marine mammals, Vol. 3: The sirenians and baleen whales. Academic Press, New York, NY.
362 p.
Yoder, J.A. 2002. Declaration of James A. Yoder in opposition to plaintiff‘s motion for temporary restraining
order, 28 October 2002. Civ. No. 02-05065-JL. U.S. District Court, Northern District of California, San
Francisco Division.
Yoshida, H. and H. Kato. 1999. Phylogenetic relationships of Bryde‘s whales in the watern north Pacific and
adjacent waters inferred from mitochondrial DNA sequences. Mar. Mamm. Sci. 15(4):1269-1286.
Zhou, K., S. Leatherwood, and T.A. Jefferson. 1995. Records of small cetaceans in Chinese waters: a review.
Asian Mar. Biol. 12:119-139.
Sea Turtles, Seabirds, Fish, and Other
Agness, A.M., J.F. Piatt, J.C. Ha, and G.R. VanBlaricom. 2008. Effects of vessel activity on the near-shore ecology
of Kittlitz‘s murrelets (Brachyramphus brevirostris) in Glacier Bay, Alaska. Auk 125:346-353.
AFCD. 2005. Unpublished sighting records of sea turtles in Hong Kong. Agriculture, Fisheries and Conservation
Department (AFCD), the Hong Kong Special Administrative Region Government, Hong Kong.
André, M., M. Solé, M. Lenoir, M. Durfort, C. Quero, A. Mas, A. Lombarte, M van der Schaar, M. López-Bejar, M.
Morell, S. Zaugg, and L. Houégnigan. 2011. Low-frequency sounds induce acoustic trauma in cephalopods.
Front. Ecol. Environ. doi:10.1890/100124.
Andriguetto-Filho, J.M., A. Ostrensky, M.R. Pie, U.A. Silva, and W.A. Boeger. 2005. Evaluating the impact of
seismic prospecting on artisanal shrimp fisheries. Cont. Shelf. Res.25:1720-1727.
Arenas, P. and M. Hall. 1991. The association of sea turtles and other pelagic fauna with floating objects in the
eastern tropical Pacific Ocean. p. 7-10 In: M. Salmon and J. Wyneken (compilers), Proc. 11th
Ann. Worksh.
Sea Turtle Biol. Conserv. NOAA Tech. Memo. NMFS-SEFSC-302. 195 p.
Benson, S.R., P.H. Dutton, C. Hitipeuw, Y. Thebu, Y. Bakarbessy, C. Sorondanya, N. Tangkepayung, and D.
Parker. 2008. Post-nesting movements of leatherbacks from Jamursba Medi, Papua, Indonesia: Linking
local conservation with international threats. NOAA Tech. Memo. NMFS SEFSC No. 567. 14 p.
Berkson, H. 1967. Physiological adjustments to deep diving in the Pacific green turtle (Chelonia mydas agassizii).
Comp. Biochem. Physiol. 21:507-524.

VI. Literature Cited
Environmental Assessment for L-DEO’s Shatsky Rise Seismic Survey, 2012 Page 98
BirdLife International. 2011. Species factsheet: Short-tailed albatross Phoebastria albatrus. Accessed in October
2011 at http://www.birdlife.org/datazone/speciesfactsheet.php?id=3956.
Bjarti, T. 2002. An experiment on how seismic shooting affects caged fish. Faroese Fisheries Laboratory,
University of Aberdeen. 41 p.
Bjorndal, K.A. 1982. The consequences of herbivory for the life history pattern of the Caribbean green turtle,
Chelonia mydas. p. 111-116 In: K.A. Bjorndal (ed.), Biology and conservation of sea turtles, revised ed.
Smithsonian Institution Press, Washington, D.C. 615 p.
Boeger, W.A., M.R. Pie, A. Ostrensky, and M.F. Cardoso. 2006. The effect of exposure to seismic prospecting on
coral reef fishes. Braz. J. Oceanog. 54(4): 235-239.
Booman, C., J. Dalen, H. Leivestad, A. Levsen, T. van der Meeren, and K. Toklum. 1996. Effecter av
luftkanonshyting på egg, larver og yngel. Fisken og Havet 1996(3):1-83. (Norwegian with English summary).
Bowen, B.W., F.A. Abreu-Grobois, G.H. Balazs, N. Kamezaki, C.J. Limpus, and R.J. Ferl. 1995. Trans-Pacific
migrations of the loggerhead turtle (Caretta caretta) demonstrated with mitochondrial DNA markers. Proc.
Nat. Acad. Sci. USA 92:3731-3734.
Brill, R.W., G.H. Balazs, K.N. Holland, R.K.C. Chang, S. Sullivan, and J.C. George. 1995. Daily movements,
habitat use, and submergence intervals of normal and tumor-bearing juvenile green turtles (Chelonia mydas
L.) within a foraging area in the Hawaiian Islands. J. Exp. Mar. Biol. Ecol. 185:203-218.
Brown, C.H. and W.M. Brown. 1982. Status of sea turtles in the southeastern Pacific: emphasis on Peru. p. 235-
240 In: K.A. Bjorndal (ed.), Biology and conservation of sea turtles. Smithsonian Inst. Press, Washington,
D.C. 583 p.
Buchanan, R.A., J.R. Christian, V.D. Moulton, B. Mactavish, and S. Dufault. 2004. 2004 Laurentian 2-D seismic
survey environmental assessment. Rep. from LGL Ltd., St. John‘s, Nfld., and Canning & Pitt Associates,
Inc., St. John's, Nfld., for ConocoPhillips Canada Resources Corp., Calgary, Alta. 274 p.
Byles, R.A. 1988. Behavior and ecology of sea turtles from Chesapeake Bay, Virginia. Ph.D. diss., College of
William and Mary, Williamsburg, VA.
Carr, A., M.H. Carr, and A.B. Meylan. 1978. The ecology and migrations of sea turtles: the west Caribbean green
turtle colony. Bull. Am. Mus. Hist. 162(1):1-46.
Chan, S. K-F., I-J. Cheng, T. Zhou, H-J. Wang, H-X. Gu, and X-J. Song. 2007. A comprehensive overview of the
population and conservation status of sea turtles in China. Chelonian Conserv. Biol. 6: 185-198.
Chapman, C.J. and A.D. Hawkins. 1969. The importance of sound in fish behaviour in relation to capture by
trawls. FAO Fish. Rep. 62:717-729.
Chen, J.L., W.S. Tsai, and J.J. Cheng. 2004. Records of the sea turtle rehabilitation in Penghu Waters (Abstr.).
2004 Ann. Symp. Anim. Behav. Ecol., Taipei.
Chen, T.H. and I.J. Cheng. 1995. Breeding biology of the green turtle, Chelonia mydas (Reptilia: Cheloniidae) on
Wanan Island, Penghu Archipelago, Taiwan. I. Nesting ecology. Mar. Biol. 124:9–15.
Cheng, I.J. 1995. Sea turtles at Dungsha Tao, South China Sea. Mar. Turtle Newsl. 70:13–14.
Cheng, I.J. 2000a. Post-nesting migrations of green turtles (Chelonia mydas) at Wanan Island, Penghu Archipelago,
Taiwan. Mar. Biol. 137:747–754.
Cheng, I.J. 2000b. Sea turtles at Dungsha Tao (Pratas Islands) and Taipin Tao (Spratly Islands), South China Sea.
p. 59–68 In: N. Pilcher and G. Ismail (eds.), Sea turtles of the Indo-Pacific: research nanagement and
conservation. ASEAN, Academic Press, Malaysia.
Cheng, I.J. 2002. Current sea turtle research and conservation in Taiwan. p. 185-190 In: I. Kinan (ed.), Proc.
Western Pacific Sea Turtle—Coop. Res. Manage. Worksh., February 5–8, 2002, Honolulu, HI.

VI. Literature Cited
Environmental Assessment for L-DEO’s Shatsky Rise Seismic Survey, 2012 Page 99
Cheng, I.J. and T.H. Chen. 1997. The incidental capture of five species of sea turtles by coastal setnet fisheries in
the eastern waters of Taiwan. Biol. Cons. 82:235-239.
Cheng, I.J., C.M. Chen, and T.P. Wei. 2000. Report on the international workshop on the migration, foraging
habitats and nesting ecology of marine turtles in Taiwan. Council of Agriculture, Taiwan. 87 p.
Christian, J.R., A. Mathieu, and R.A. Buchanan. 2004. Chronic effects of seismic energy on snow crab
(Chionoecetes opilio). Environ. Stud. Res. Funds Rep. No. 158, March 2004. Calgary, Alb. 45 p.
Christian, J.R., A. Mathieu, D.H. Thomson, D. White, and R.A. Buchanan. 2003. Effect of seismic energy on snow
crab (Chionoecetes opilio). Rep. from LGL Ltd., St. John‘s, Nfld., for Environ. Stud. Res. Fund (ESRF),
Calgary, Alb. 56 p.
Dalen, J. and G.M. Knutsen. 1986. Scaring effects in fish and harmful effects on eggs, larvae and fry by offshore
seismic explorations. p. 93-102 In: H.M. Merklinger (ed.), Progress in underwater acoustics. Plenum, NY.
839 p.
Dalen, J. and A. Raknes. 1985. Scaring effects on fish from three dimensional seismic surveys. Inst. Mar. Res.
Rep. FO 8504/8505, Bergen, Norway. (In Norwegian, with an English summary).
Dalen, J., E. Ona, A.V. Soldal, and R. Saetre. 1996. Seismiske undersøkelser til havs: en vurdering av konsekvenser
for fisk og fiskerier [Seismic investigations at sea; an evaluation of consequences for fish and fisheries].
Fisken og Havet 1996:1-26. (in Norwegian, with an English summary).
Davenport, J. and G.H. Balaz. 1991. ―Fiery bodies‖ – are pyrosomas important items in the diet of leatherback
turtles? Brit. Herpetolog. Soc. Bull. 37:33-38.
DFO (Fisheries and Oceans Canada). 2004. Potential impacts of seismic energy on snow crab. DFO Can. Sci.
Advis. Secret. Habitat Status Rep. 2004/003.
Dutton, P.H., C.Hitipeuw, M. Zein, S.R. Benson, G. Petro, J. Piti, V. Rei, L. Ambio, and J. Bakarbessy. 2007.
Status and genetic structure of nesting populations of leatherback turtles (Dermochelys coriacea) in the
western pacific. Chelonian Conserv. Biol. 6(1):47-53.
Eckert, S.A., K.L. Eckert, and G.L. Kooyman. 1986. Diving patterns of two leatherback sea turtles (Dermochelys
coriacea) during the interesting intervals at Sandy Point, St. Croix, U.S. Virgin Islands. Herpetologica
42:381-388.
Eckert, S.A., K.L Eckert, P. Ponganis, and G.L. Kooyman. 1989. Diving and foraging behaviour of leatherback sea
turtles (Dermochelys coriacea). Can. J. Zool. 67(11):2834-2840.
Eckert, S.A., H.C. Liew, K.L. Eckert, and E.H. Chan. 1996. Shallow water diving by leatherback turtles in the
South China Sea. Chelonian Cons. Biol. 2:237-243.
Engås, A, S. Løkkeborg, E. Ona, and A.V. Soldal. 1996. Effects of seismic shooting on local abundance and catch
rates of cod (G. morhua) and haddock (M. aeglefinus). Can. J. Fish. Aquat. Sci. 53:2238-2249.
EuroTurtle. 2008. Species of sea turtles. Accessed in October 2010 at http://www.euroturtle.org/1.htm.
Falk, M.R. and M.J. Lawrence. 1973. Seismic exploration: its nature and effect on fish. Fisheries and Marine
Service, Resource Management Branch, Fisheries Operations Directorate: Technical Report CENT-73-9.
Frair, W., R.G. Ackman, and N. Mrosovky. 1972. Body temperature of Dermochelys coriacea: warm turtle from
cold water. Science 177:791-793.
Frazier, S.S., J.G. Frazier, H.B. Ding, Z.J. Huang, J. Zheng, and L. Lu. 1988. Sea turtles in Fujian and Guangdong
Provinces. Acta Herpetologica Sinica 7(1):16–46.
Fritts, T.H., M.L. Stinson, and R. Márquez. 1982. Status of sea turtle nesting in southern Baja California, Mexico.
Bull. South. Calif. Acad. Sci. 81:51-60.
VI. Literature Cited
Environmental Assessment for L-DEO’s Shatsky Rise Seismic Survey, 2012 Page 100
Greer, A.E., J.D. Lazell, Jr., and R.M. Wright. 1973. Anatomical evidence for counter-current heat exchanger in
the leatherback turtle (Dermochelys coriacea). Nature 244:181
Guerra, A., A.F. González, and F. Rocha. 2004. A review of the records of giant squid in the north-eastern Atlantic
and severe injuries in Architeuthis dux stranded after acoustic explorations. ICES CM 2004/CC: 29.
Harvey, J., S. Benson, and T. Graham. 2006. Foraging ecology of leatherbacks in the California Current. p. 192 In:
M. Frick, A. Panagopoulou, A.F.Rees, and K. Williams (compilers), Book of abstracts, 26th
Ann. Symp. Sea
Turtle Biol. Conserv. International Sea Turtle Society, Athens, Greece. 376 p.
Hassel, A., T. Knutsen, J. Dalen, S. Løkkeborg, K. Skaar, Ø. Østensen, E.K. Haugland, M. Fonn, Å. Høines, and
O.A. Misund. 2003. Reaction of sandeel to seismic shooting: a field experiment and fishery statistics study.
Institute of Marine Research, Bergen, Norway.
Hastings, M.C. and A.N. Popper. 2005. Effects of sound on fish. Prepared for Jones & Stokes, Sacramento, CA,
for California Department of Transportation, Sacramento, CA. 28 January.
Hays, G.C., C.R. Adams, A.C. Broderick, B.J. Godley, D.J. Lucas, J.D. Metcalfe, and A.A. Prior. 2000. The diving
behaviour of green turtles at Ascension Island. Anim. Behav. 59:577-586.
Hazel, J., I.R. Lawler, H. Marsh, and S. Robinson. 2007. Vessel speed increases risk of collision for the green turtle
Chelonia mydas. End. Spec. Res. 3:105-113.
Hochscheid, S., B.J. Godley, A.C. Broderick, and R.P. Wilson. 1999. Reptilian diving: highly variable dive
patterns in the green turtle Chelonia mydas. Mar. Ecol. Progr. Ser. 185:101-112.
Holliday, D.V., R.E. Piper, M.E. Clarke, and C.F. Greenlaw. 1987. The effects of airgun energy release on the
eggs, larvae, and adults of the northern anchovy (Engraulis mordax). American Petroleum Institute, Wash-
ington, DC. Tracer Applied Sciences.
Horrocks, J.A. 1992. WIDECAST Sea turtle turtle recovery recovery action plan plan for Barbados. In: K.L.
Eckert (ed.), CEP Tech. Rep. No. 12. UNEP Caribbean Environment Program, Kingston, Jamaica. 61 p.
Ikeda, T. 2008. Seasonal distribution and behavior of loggerhead sea turtles in the north Pacific: statistical analysis
in relation to environmental oceanographic parameters. Ph.D. Dissertation, Hokkaido University Collection
of Scholarly and Academic Papers. 96 p.
IUCN (The World Conservation Union). 2011. IUCN Red List of Threatened Species. Version 2011.1. Accessed
on 14 September 2011 at http://www.iucnredlist.org.
Kalb, H. and D. Owens. 1994. Differences between solitary and arribada nesting olive ridley females during the in-
teresting period. p. 68 In: K.A. Bjorndal, A.B. Bolten, D.A. Johnson, and P.J. Eliazar (compilers), Proc. 14th
Symp. Sea Turtle Biol. Conserv. NOAA Tech. Mem. NMFS-SEFSC-351. 323 p.
Kamezaki, N., K. Oki, K. Mizuno, T. Toji, and O. Doi. 2002. First nesting record of the leatherback turtle,
Dermochelys coriacea, in Japan. Current Herpetol. 21(2):95-97.
Kaplan, I.C. 2005. A risk assessment for Pacific leatherback turtles (Dermochelys coriacea). Can. J. Fish. Aquat.
Sci. 62:1710-1719.
Karl, S.A. and B.W. Bowen. 2001. Evolutionary significant units versus geopolitical taxonomy: molecular
systematics of an endangered sea turtle (genus Chelonia). Conserv. Biol. 13(5):990-999.
Kawabe, M., S. Fujio, D. Yanagimoto, and K. Tanaka. 2009. Water masses and currents of deep circulation
southwest of the Shatsky Rise in the western North Pacific. Deep Sea Res. I 56(10):1675-1687.
Kikukawa, A., N. Kamezaki, K. Hirate, and H. Ota. 1996. Distribution of nesting sites of sea turtles in
Okinawajima and adjacent islands of the central Ryukyus, Japan. Chelonian Conserv. Biol. 2(1):99–101.

VI. Literature Cited
Environmental Assessment for L-DEO’s Shatsky Rise Seismic Survey, 2012 Page 101
Kobayashi, D.R., J.J. Polovina, D.M. Parker, N. Kamezaki, I-J. Cheng, I. Uchida, P.H. Dutton, and G.H. Balazs.
2008. Pelagic habitat characteriation of loggerhead sea turtles, Caretta caretta, in the North Pacific Ocean
(1997–2006): insights from satellite tag tracking and remotely sensed data. J. Exp. Mar. Biol. Ecol. 356:96-
114.
Komatsu T., T. Sugimoto, K.-I. Ishida, K. Itaya, P. Mishra, and T. Miura. 2002. Importance of the Shatsky Rise
area in the Kuroshio Extension as an offshore nursery ground for Japanese anchovy (Engraulis japonicus)
and sardine (Sardinops melanostictus). Fish. Oceanogr. 11(6):354-360.
Kopitshy, K. R.L. Pitman, and P. Plotkin. 2000. Investigations on at-sea mating and reproductive status of olive
ridleys, Lepidochelys olivacea, captured in the eastern tropical Pacific. p. 160-162 In: H.J. Kalb and T.
Wibbels (compilers), Proc. 19th
Ann. Symp. Sea Turtle Biol. Conserv. NOAA Tech. Memo. NMFS-SEFSC-
433. 291 p.
Kostyuchenko, L.P. 1973. Effect of elastic waves generated in marine seismic prospecting on fish eggs on the
Black Sea. Hydrobiol. J. 9:45-48.
LaBella, G., C. Froglia, A. Modica, S. Ratti, and G. Rivas. 1996. First assessment of effects of air-gun seismic
shooting on marine resources in the central Adriatic Sea. Society of Petroleum Engineers, Inc. International
Conference on Health, Safety and Environment, New Orleans, LA, 9–12 June 1996.
Lacroix, D.L., R.B. Lanctot, J.A. Reed, and T.L. McDonald. 2003. Effect of underwater seismic surveys on
molting male long-tailed ducks in the Beaufort Sea, Alaska. Can. J. Zool. 81:1862-1875.
Lawson, T.A. (ed). 2008. Western and Central Pacific Fisheries Commission tuna fishery yearbook 2007.
WCPFC, Federal States of Micronesia. 203 p.
Lenhardt, M. 2002. Sea turtle auditory behavior. J. Acoust. Soc. Am. 112(5, Pt. 2):2314 (Abstract).
Lewison, R.L., S.A. Freeman, and L.B. Crowder. 2004. Quantifying the effects of fisheries on threatened species:
the impact of pelagic longlines on loggerhead and leatherback sea turtles. Ecol. Lett. 7:221-231.
Løkkeborg, S. 1991. Effects of geophysical survey on catching success in longline fishing. ICES CM B 40. 9 p.
Longhurst, A. R. 2007. Ecological geography of the sea, 2nd
ed. Academic Press, Elsevier Inc., San Diego, CA.
542 p.
Lutcavage, M.E. 1996. Planning your next meal: leatherback travel routes and ocean fronts. p. 174-178 In: J.A.
Keinath, D.E. Barnard, J.A. Musick, and B.A. Bell (compilers), Proc. 15th
Ann. Symp. Sea Turtle Biol.
Conserv. NOAA Tech. Memo. NMFS-SEFSC-351. 355 p.
Lutcavage, M.E. and P.L. Lutz. 1997. Diving physiology. p. 277-296 In: P.L. Lutz and J.A. Musick (eds.), The
biology of sea turtles. CRC Press, Boca Raton, FL. 432 p.
McCauley, R.D., J. Fewtrell, and A.N. Popper. 2003. High intensity anthropogenic sound damages fish ears. J.
Acoust. Soc. Am. 113(1):638-642.
Marcovaldi, M.A., J. Thomé, and J.G. Frazier. 2003. Marine turtles in Latin America and the Caribbean: a regional
perspective of successes, failures, and priorities for the future. Mar. Turtle Newsl. 100:38-42.
Márquez, M. 1990. Sea turtles of the world: an annotated and illustrated catalogue of sea turtle species known to
date. FAO Fisheries Synopsis 125(11). 81 p.
Mizuno, K. and W.B. White. 1983. Annual and interannual variability in the Kuroshio Current System. J. Phys.
Oceanogr. 13:1847-1867.
Moein, S.E., J.A. Musick, J.A. Keinath, D.E. Barnard, M. Lenhardt, and R. George. 1994. Evaluation of seismic
sources for repelling sea turtles from hopper dredges. Rep. from Virginia Inst. Mar. Sci., [Gloucester Point],
VA, for U.S. Army Corps of Engineers. 33 p.

VI. Literature Cited
Environmental Assessment for L-DEO’s Shatsky Rise Seismic Survey, 2012 Page 102
Moriyasu, M., R. Allain, K. Benhalima, and R. Claytor. 2004. Effects of seismic and marine noise on invertebrates:
A literature review. Fisheries and Oceans Canada, Science. Canadian Sci. Advis. Secret. Res. Doc.
2004/126.
Morreale, S., E. Standora, F. Paladino, and J. Spotila. 1994. Leatherback migrations along deepwater bathymetric
contours. p.109 In: B.A. Schroeder and B.E. Witherington (compilers), Proc. 13th
Annu. Symp. Sea Turtle
Biol. and Conserv. NOAA Tech. Memo. NMFS-SEFSC-341. 281 p.
Musick, J.A. and C.J. Limpus. 1997. Habitat utilization and migration in juvenile sea turtles. p. 137-163 In: P.L.
Lutz and J.A. Musick (eds.), The biology of sea turtles. CRC Press, Boca Raton, FL. 432 p.
Nichols, W.J. 2005. Following redwood logs, rubber ducks, and drift bottles: transoceanic developmental mig-
rations of loggerhead turtles in the North Pacific Ocean. p. 66 In: M.S. Coyne and R.D. Clark (compilers),
Proc. 21st Ann. Symp. Sea Turtle Biol. Conserv. NOAA Tech. Memo. NMFS-SEFSC-528. 368 p.
Nichols, W.J., A. Resendiz, J.A. Seminoff, and B. Resendiz. 2000. Transpacific migration of a loggerhead turtle
monitored by satellite telemetry. Bull. Mar. Sci. 67(3):937-947.
Nishida, H. and W.B. White. 1982. Horizontal eddy fluxes of momentum and kinetic energy in the near-surface of
the Kuroshio Extension. J. Phys. Oceanogr. 12:160-170.
Nishimura, W. and S. Nakahigashi. 1990. Incidental capture of sea turtles by Japanese research and training
vessels: results of a questionnaire. Mar. Turtle Newsl. 51:1-4.
NMFS (National Marine Fisheries Service). 2002. Endangered Species Act Section 7 Consultation Biological
Opinion: Authorization of pelagic fisheries under the Fishery Management Plan for Pelagic Fisheries of the
Western Pacific Region. Nat. Mar. Fish. Serv., Southwest Region, Pacific Islands Area Office. 365 p.
NMFS (National Marine Fisheries Service). 2008a. Olive ridley turtle (Lepidochelys olivacea). Accessed in
October 2011 at http://www.nmfs.noaa.gov/pr/species/turtles/oliveridley.htm.
NMFS (National Marine Fisheries Service). 2008b. Hawksbill turtle (Eretmochelys imbricata). Accessed in
October 2011 at http://www.nmfs.noaa.gov/pr/species/turtles/hawksbill.htm.
NMFS and USFWS (National Marine Fisheries Service and U.S. Fish and Wildlife Service). 1998a. Recovery plan
for U.S. Pacific populations of the leatherback turtle (Dermochelys coriacea). Nat. Mar. Fish. Serv., Silver
Spring, MD.
NMFS and USFWS (National Marine Fisheries Service and U.S. Fish and Wildlife Service). 1998b. Recovery plan
for U.S. Pacific populations of the olive ridley turtle (Lepidochelys olivacea). Nat. Mar. Fish. Serv., Silver
Spring, MD.
NMFS and USFWS (National Marine Fisheries Service and U.S. Fish and Wildlife Service). 1998c. Recovery plan
for U.S. Pacific populations of the hawksbill turtle (Eretmochelys imbricata). Nat. Mar. Fish. Serv., Silver
Spring, MD.
NMFS and USFWS (National Marine Fisheries Service and U.S. Fish and Wildlife Service). 2007a. Loggerhead
sea turtle (Caretta caretta) 5-Year review: summary and evaluation. Nat. Mar. Fish. Serv., Silver Spring,
MD. 67 p. Accessed at http://www.nmfs.noaa.gov/pr/pdfs/species/loggerhead_5yearreview.pdf in October
2011.
NMFS and USFWS (National Marine Fisheries Service and U.S. Fish and Wildlife Service). 2007b. Leatherback
sea turtle (Dermochelys coriacea) 5-Year review: summary and evaluation. Nat. Mar. Fish. Serv., Silver
Spring, MD. 79 p. Accessed in October 2011 at http://www.fws.gov/northflorida/SeaTurtles/2007-
Reviews/2007-leatherback-turtle-5-year-review-final.pdf.
NMFS and USFWS (National Marine Fisheries Service and U.S. Fish and Wildlife Service). 2007c. Olive Ridley
sea turtle (Lepidochelys olivacea) 5-Year Review: summary and evaluation. Nat. Mar. Fish. Serv., Silver
VI. Literature Cited
Environmental Assessment for L-DEO’s Shatsky Rise Seismic Survey, 2012 Page 103
Spring, MD. 64 p. Accessed in October 2011 at http://www.fws.gov/northflorida/SeaTurtles/2007-
Reviews/2007-Olive-ridley-turtle-5-year-review-final.pdf.
NMFS and USFWS (National Marine Fisheries Service and U.S. Fish and Wildlife Service). 2007d. Green sea
turtle (Chelonia mydas) 5-year review: summary and evaluation. Nat. Mar. Fish. Serv., Silver Spring, M.D.
102 p. Accessed in October 2011 at http://www.fws.gov/northflorida/SeaTurtles/2007-Reviews/2007-green-
turtle-5-year-review-final.pdf.
NMFS and USFWS (National Marine Fisheris Service and U.S. Fish and Wildlife Service). 2007e. Hawksbill sea
turtle (Eretmochelys imbricata) 5-year review: summary and evaluation. Nat. Mar. Fish. Serv., Silver
Spring, MD. 90 p. Accessed in October 2011 at http://www.fws.gov/northflorida/SeaTurtles/2007-
Reviews/2007-hawksbill-turtle-5-year-review-final.pdf.
Parker, D.M., P.H. Dutton, K. Kopitsky, and R.L. Pitman. 2003. Movement and dive behavior determined by satel-lite telemetry for male and female olive ridley turtles in the eastern tropical Pacific. p. 48-49 In: J.A. Sem-inoff (compiler), Proc. 22
nd Ann. Symp. Sea Turtle Biol. Conserv. NOAA Tech. Mem. NMFS-SEFSC-
503. 308 p.
Parker, D.M., P.H. Dutton, S. Eckert, D.R. Kobayashi, J.J. Polovina, D. Dutton, and G.H. Balazs. 2005. Trans-pacific migration along oceanic fronts by loggerhead turtles released from Sea World San Diego. p. 280-
281 In: M.S. Coyne and R.D. Clark (compilers), Proc. 21st Ann. Symp. Sea Turtle Biol. Conserv. NOAA
Tech. Memo. NMFS-SEFSC-528. 368 p.
Parry, G.D. and A. Gason. 2006. The effect of seismic surveys on catch rates of rock lobsters in western Victoria,
Australia. Fish. Res. 79:272-284.
Payne, J.F., J. Coady, and D. White. 2009. Potential effects of seismic airgun discharges on monkfish eggs
(Lophius americanus) and larvae. Environ. Stud. Res. Funds Rep. No. 170. St. John‘s, Nfld. 35 p.
Payne, J.F., C.A. Andrews, L.L. Fancey, A.L. Cook, and J.R. Christian. 2007. Pilot study on the effects of seismic
air gun noise on lobster (Homarus americanus). Can. Tech. Rep. Fish. Aquatic Sci. 2712.
Payne, J.F., C. Andrews, L. Fancey, D. White, and J. Christian. 2008. Potential effects of seismic energy on fish
and shellfish: An update since 2003. Canadian Sci. Advis. Secret. Res. Doc. 2008/060. Department of
Fisheries and Oceans Canada. Accessed at http://www.dfo-mpo.gc.ca/CSAS/Csas/Publications/ResDocs-
DocRech/2008/2008_060_e.pdf in October 2011.
Pearson, W.H., J.R. Skalski, and C.I. Malme. 1992. Effects of sounds from a geophysical survey device on
behaviour of captive rockfish (Sebastes spp.). Can. J. Fish. Aquat. Sci. 49(7):1343-1356.
Pearson, W., J. Skalski, S. Sulkin, and C. Malme. 1994. Effects of seismic energy releases on the survival and
development of zoeal larvae of Dungeness crab (Cancer magister). Mar. Environ. Res. 38:93-113.
Piatt, J.F., J. Wetzel, K. Bell, A.R. DeGange, G.R. Balogh, G.S. Drew, T. Geernaert, C. Ladd, and G.V. Byrd. 2006.
Predictable hotspots and foraging habitat of the endangered short-tailed albatross (Phoebastria albatrus) in
the North Pacific: implications for conservation. Deep Sea Res. II 53: 387-398.
Pickett, G.D., D.R. Eaton, R.M.H. Seaby, and G.P. Arnold. 1994. Results of bass tagging in Poole Bay during
1992. Lab. Leafl. 74, MAFF Direct. Fish. Res., Lowestoft, U.K. 12 p.
Pitman, R.L. 1990. Pelagic distribution and biology of sea turtles in the eastern tropical Pacific. p. 143-148 In:
T.H. Richardson, J.I. Richardson, and M. Donnelly (compilers), Proc. 10th
Ann. Worksh. Sea Turtle Biol.
Conserv. NOAA Tech. Memo. NMFS-SEFC-278. 286 p.
Pitman, R.L. 1992. Sea turtle associations with flotsam in the eastern tropical Pacific Ocean. p. 94 In: M. Salmon
and J. Wyneken (compilers) Proc. 11th
Ann. Workshop Sea Turtle Biol. Conserv. NOAA Tech. Mem.
NMFS-SEFSC-302. 195 p.
Plotkin, P.T. 2003. Adult migrations and habitat use. p. 225-241 In: P.L. Lutz, J.A. Musick, and J. Wyneken
(eds.), The biology of sea turtles. CRC Press, Boca Raton, USA. 455 p.

VI. Literature Cited
Environmental Assessment for L-DEO’s Shatsky Rise Seismic Survey, 2012 Page 104
Plotkin, P.T., R.A. Byles, and D.W. Owens. 1994a. Post-breeding movements of male olive ridley sea turtles
Lepidochelys olivacea from a nearshore breeding area. p. 119 In: K.A. Bjorndal, A.B. Bolten, D.A. Johnson,
and P.J. Eliazar (compilers), Proc. 14th
Annu. Symp. Sea Turtle Biol. Conserv. NOAA Tech. Memo. NMFS-
SEFSC-351. 323 p.
Plotkin, P.T., R.A. Byles, and D.W. Owens. 1994b. Migratory and reproductive behavior of Lepidochelys olivacea
in the eastern Pacific Ocean. p. 138 In: B.A. Schroeder and B.E. Witherington (compilers), Proc. 13th
Ann.
Symp. Sea Turtle Biol. Conserv. NOAA Tech. Memo. NMFS-SEFSC-341. 281 p.
Polovina, J.J., D.R. Kobayashi, D.M. Parker, M.P. Seki, and G.H. Balazs. 2000. Turtles on the edge: movement of
loggerhead turtles (Caretta caretta) along oceanic fronts, spanning longline fishing grounds in the central
North Pacific, 1997–1998. Fish. Oceanogr. 9:71-82.
Polovina, J.J. E.A. Howell, D.M. Parker, and G.H. Balazs. 2003. Dive-depth distribution of loggerhead (Caretta
caretta) and olive ridley (Lepidochelys olivacea) sea turtles in the central North Pacific Ocean: might deep
longline sets catch fewer turtles? Fish. Bull. 10(1):189-193.
Polovina, J.J., G.H. Balazs, E.A. Howell, D.M. Parker, M.P. Seki, and P.H. Dutton. 2004. Forage and migration
habitat of loggerhead (Caretta caretta) and olive ridley (Lepidochelys olivacea) sea turtles in the central
North Pacific Ocean. Fish. Oceanog. 13 (1):36-51.
Polovina, J., I. Uchida, G. Balazs, E.A. Howell, D. Parker, and P. Dutton. 2006. The Kuroshio Extension
Bifurcation Region: a pelagic hotspot for juvenile loggerhead sea turtles. Deep-Sea Res. II 53:326-339.
Popper, A.N. 2005. A review of hearing by sturgeon and lamprey. Report by A.N. Popper, Environmental
BioAcoustics, LLC, Rockville, MD, for U.S. Army Corps of Engineers, Portland District.
Popper, A.N. 2009. Are we drowning out fish in a sea of noise? Mar. Scientist 27: 18-20.
Popper, A.N. and M.C. Hastings. 2009a. The effects of human-generated sound on fish. Integ. Zool. 4: 43-52.
Popper, A.N. and M.C. Hastings. 2009b. The effects of anthropogenic sources of sound on fishes. J. Fish Biol. 75:
455-489.
Popper, A.N., M. Salmon, and K.W. Horch. 2001. Acoustic detection and communication by decapod crustaceans.
J. Comp. Physiol. A 187:83-89.
Popper, A.N., M.E. Smith, P.A. Cott, B.W. Hanna, A.O. MacGilvray, M.E. Austin, and D.A. Mann. 2005. Effects
of exposure to seismic air gun use on hearing of three fish species. J. Acoust. Soc. Am. 117(6):3958-3971.
Qiu, B. 2000. Interannual variability of the Kuroshio extension system and its impact on the wintertime SST field.
J. Phys. Oceanogr. 30:1486-1502.
Qu, T., H. Mitsudera, and B. Qiu. 2001. A climatological view of the Kuroshio/Oyashio system east of Japan. J.
Phys. Oceanogr. 31(9):2575-2589.
Reich, K.J., K.A. Bjorndal, M.G. Frick, B.E. Witherington, C. Johnson, and A.B. Bolton. 2009. Polymodal
foraging in adult female loggerheads (Caretta caretta). Mar. Biol. doi:10.1007/s00227-009-1300-4.
Renaud, M.L. and J.A. Carpenter. 1994. Movements and submergence patterns of loggerhead turtles (Caretta
caretta) in the Gulf of Mexico determined through satellite telemetry. Bull. Mar. Sci. 55:1-15.
Resendiz, A., B. Resendiz, W.J. Nichols, J.A. Seminoff, and N. Kamezaki. 1998. First confirmed east-west
transpacific movement of loggerhead sea turtle, Caretta caretta, released in Baja California, Mexico. Pacific
Sci. 52:151-153.
Saetre, R. and E. Ona. 1996. Seismike undersøkelser og på fiskeegg og -larver en vurdering av mulige effecter pa
bestandsniva. [Seismic investigations and damages on fish eggs and larvae; an evaluation of possible effects
on stock level]. Fisken og Havet 1996:1-17, 1-8. (In Norwegian, with an English summary).

VI. Literature Cited
Environmental Assessment for L-DEO’s Shatsky Rise Seismic Survey, 2012 Page 105
Sakamoto, W., I. Uchida, Y. Naito, K. Kureha, M. Tujimura, and K. Sato. 1990. Deep diving behavior of the
loggerhead turtle near the frontal zone. Nippon Suisan Gakkaishi 56(9):1435-1443.
Sakamoto, W., K. Sato, H. Tanaka, and Y. Naito. 1993. Diving patterns and swimming environment of two logger-head turtles during internesting. Nippon Suisan Gakkaishi 59(7):1129-1137.
Santulli, La A., A. Modica, C. Messina, L. Ceffa, A. Curatolo, G. Rivas, G. Fabi, and V. D'Amelio. 1999.
Biochemical responses of European sea bass (Dicentrarchus labrax L.) to the stress induced by off shore
experimental seismic prospecting. Mar. Pollut. Bull. 38:1105-1114.
Sato, K., T. Bando, Y. Matsuzawa, H. Tanaka, W. Sakamoto, S. Minamikawa, and K. Goto. 1997. Decline of the
loggerhead turtle, Caretta caretta, nesting on Senri Beach in Minabe, Wakayama, Japan. Chelonian
Conserv. Biol. 2(4):600–603.
Sea Around Us. 2011. Sea Around Us Project. Accessed in October 2011 at http://www.seaaroundus.org.
Sea Turtle Association of Japan. 2010. Sea turtles of Japan. Accessed in October 2011 at
http://www.umigame.org/E1/turtlepowerstyle2.html.
Skalski, J.R., W.H. Pearson, and C.I. Malme. 1992. Effects of sounds from a geophysical survey device on catch-
per-unit-effort in a hook-and-line fishery for rockfish (Sebastes spp.). Can. J. Fish. Aquat. Sci. 49:1357-
1365.
Skillman, R.A. and G.H. Balazs. 1992. Leatherback turtle captured by ingestion of squid bait on swordfish
longline. Fish. Bull. 90:807-808.
Sliter, W.V. and G.R. Brown. 1993. Shatsky Rise: Seismic stratigraphy and sedimentary record of Pacific
Paleoceanography since the early Cretaceous. p. 3-13 In: J.H. Natland, M.A. Storms, et al. (eds.),
Proceedings of the Drilling Program, Scientific Results No. 132.
Slotte, A., K. Hansen, J. Dalen, and E. Ona. 2004. Acoustic mapping of pelagic fish distribution and abundance in
relation to a seismic shooting area off the Norwegian west coast. Fish. Res. 67:143-150.
Song, X.J., H.J. Wang, W.Z. Wang, H.X. Gu, S. Chan, and H.S. Jiang,. 2002. Satellite tracking of post-nesting
movements of green turtles Chelonia mydas from the Gangkou Sea Turtle National Nature Reserve, China,
2001. Mar. Turtle Newsl. 97:8–9.
Southwood, A.L., R.D. Andrews, D.R. Jones, M.E. Lutcavage, F.V. Paladino, and N.H. West. 1998. Heart rate and
dive behaviour of the leatherback sea turtle during the interesting interval. p.100-101 In: S.P. Epperly and J.
Braun (compilers), Proc. 17th
Ann. Symp. Sea Turtle Biol. Conserv. NOAA Tech. Memo. NMFS-SEFSC-
415. 294 p.
Spalding, M.D., H.E. Fox, G.R. Allen, N. Davidson, Z.A. Ferdana, M. Finlayson, B.S. Halpern, M.A. Jorge, et al.
2007. Marine Ecoregions of the World: a bioregionalization of coastal and shelf areas. BioScience
57(7):573-583.
Spotila, J.R. 2004. Sea turtles: a complete guide to their biology, behavior, and conservation. The Johns Hopkins
University Press and Oakwood Arts, Baltimore, MD. 227 p.
Spotila, J.R., R.D. Reina, A.C. Steyermark, P.T. Plotkin, and F.V. Paladino. 2000. Pacific leatherback turtles face
extinction. Nature 405:529-530.
Spring, C.S. 1995. Status of marine turtle populations in Papua New Guinea. p. 281-289 In: K.A. Bjorndal (ed.),
Biology and conservation of sea turtles, rev. edit. Smithsonian Institute Press, Washington, D. C. 615 p.
Starbird, C.H., Z. Hillis-Starr, J.T. Harvey, and S.A. Eckert. 1999. Internesting movements and behavior of
hawksbill turtles (Eretmochelys imbricata) around Buck Island Reef National Monument, St. Croix, U.S.
Virgin Islands. Chelonian Conserv. Biol. 3(2):237-243.

VI. Literature Cited
Environmental Assessment for L-DEO’s Shatsky Rise Seismic Survey, 2012 Page 106
Stemp, R. 1985. Observations on the effects of seismic exploration on seabirds. p. 217-231 In: G.D. Greene, F.R.
Engelhardt, and R.J. Paterson (eds.), Proc. Worksh. Effects Explos. Mar. Envir., 29–31 January 1985.
Tech. Rep. 5, Canada Oil and Gas Lands Administration, Environmental Protection Branch, Ottawa, Ont.
Suryan, R.M., F. Sato, G.R. Balogh, K.D. Hyrenbach, P.R. Sievert, and K. Ozaki. 2006. Foraging destinations and
marine habitat use of short-tailed albatrosses: a mulit-scale approach using first-passage time analysis. Deep
Sea Res. Part II 53(3-4):370-386.
Suryan, R.M., K.S. Dietrich, E.F. Melvin, G.R. Balogh, F. Sato, and K. Ozaki. 2007. Migratory routes of short-
tailed albatrosses: use of exclusive economic zones of North Pacific Rim countries and spatial overlap with
commercial fisheries in Alaska. Biol. Conserv. 137(3):450-460.
Sverdrup, A., E. Kjellsby, P.G. Krüger, R. Fløysand, F.R. Knudsen, P.S. Enger, G. Serck-Hanssen, and K.B. Helle.
1994. Effects of experimental seismic shock on vasoactivity of arteries, integrity of the vascular endothelium
and on primary stress hormones of the Atlantic salmon. J. Fish Biol. 45:973-995.
Thomsen, B. 2002. An experiment on how seismic shooting affects caged fish. Thesis, Faroese Fisheries
Laboratory, University of Aberdeen, Aberdeen, Scotland. 16 August.
UNEP-WCMC. 2011. UNEP-WCMC Species Database: CITES-Listed Species. Appendices I, II and III. Valid
from 27 April 2011. Accessed on 14 September 2011 at http://www.cites.org/eng/app/appendices.shtml.
USFWS (U.S. Fish and Wildlife Service). 2001. Short-tailed albatross (Phoebastria albatrus): threatened and
endangered species. Accessed at http://alaska.fws.gov/fisheries/endangered/pdf/STALfactsheet.pdf in
October 2011.
USFWS (U.S. Fish and Wildlife Service). 2008. Short-tailed albatross recovery plan. Anchorage, AK. 105 p.
van Dam, R.P. and C.E. Diez. 1996. Diving behavior of immature hawksbills (Eretmochelys imbricata) in a
Caribbean cliff-wall habitat. Mar. Biol. 127:171-178.
Vincente, V.P. 1994. Spongivory in Caribbean hawksbill turtles, Eretmochelys imbricata: data from stranded
specimens. p. 185-189 In: B.A. Schroeder and B.E. Witherington (compilers), Proc. 13th
Ann. Symp. Sea
Turtle Biol. and Conserv. NOAA Tech. Mem. NMFS-SEFSC-341. 281 p.
Wardle, C.S., T.J. Carter, G.G. Urquhart, A.D.F. Johnstone, A.M. Ziolkowski, G. Hampson, and D. Mackie. 2001.
Effects of seismic air guns on marine fish. Cont. Shelf Res. 21(8-10):1005-1027.
WCPFC (Western and Central Pacific Fisheries Commission). 2010. Tuna fishery yearbook 2009. WCPFC,
Federal States of Micronesia. 113 p. Accessed in October 2011 at http://www.wcpfc.int/node/1759.
Weir, C.R. 2007. Observations of marine turtles in relation to seismic airgun sound off Angola. Mar. Turtle
Newsl. 116:17-20.
Yasuda, I. 2003. Hydrographic structure and variability in the Kuroshio-Oyashio transition area. J. Oceanogr.
59:389-402.
Yokota, K., H. Minami, and T. Nobetsu. 2006. Research on mitigation of the interaction of sea turtle with pelagic
longline fishery in the western North Pacific. p. 3-8 In: Proc. 3rd
Int. Symp. on SEASTAR2000 and Asian
Bio-logging Science (7th
SEASTAR2000 workshop).
Zheng, J. 1985. Preliminary survey of the sea turtles of Fujian. Acta Herpetologica Sinica 4(2):156–157. (English
abstract).
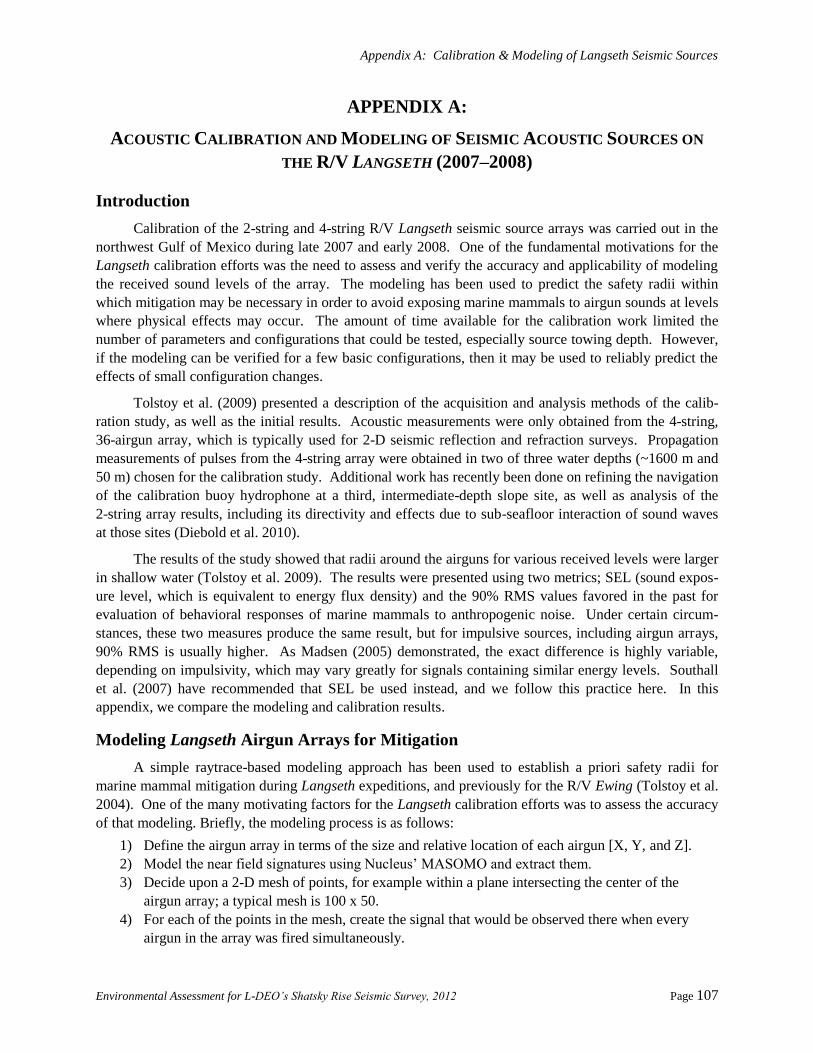
Appendix A: Calibration & Modeling of Langseth Seismic Sources
Environmental Assessment for L-DEO’s Shatsky Rise Seismic Survey, 2012 Page 107
APPENDIX A:
ACOUSTIC CALIBRATION AND MODELING OF SEISMIC ACOUSTIC SOURCES ON
THE R/V LANGSETH (2007–2008)
Introduction
Calibration of the 2-string and 4-string R/V Langseth seismic source arrays was carried out in the
northwest Gulf of Mexico during late 2007 and early 2008. One of the fundamental motivations for the
Langseth calibration efforts was the need to assess and verify the accuracy and applicability of modeling
the received sound levels of the array. The modeling has been used to predict the safety radii within
which mitigation may be necessary in order to avoid exposing marine mammals to airgun sounds at levels
where physical effects may occur. The amount of time available for the calibration work limited the
number of parameters and configurations that could be tested, especially source towing depth. However,
if the modeling can be verified for a few basic configurations, then it may be used to reliably predict the
effects of small configuration changes.
Tolstoy et al. (2009) presented a description of the acquisition and analysis methods of the calib-
ration study, as well as the initial results. Acoustic measurements were only obtained from the 4-string,
36-airgun array, which is typically used for 2-D seismic reflection and refraction surveys. Propagation
measurements of pulses from the 4-string array were obtained in two of three water depths (~1600 m and
50 m) chosen for the calibration study. Additional work has recently been done on refining the navigation
of the calibration buoy hydrophone at a third, intermediate-depth slope site, as well as analysis of the
2-string array results, including its directivity and effects due to sub-seafloor interaction of sound waves
at those sites (Diebold et al. 2010).
The results of the study showed that radii around the airguns for various received levels were larger
in shallow water (Tolstoy et al. 2009). The results were presented using two metrics; SEL (sound expos-
ure level, which is equivalent to energy flux density) and the 90% RMS values favored in the past for
evaluation of behavioral responses of marine mammals to anthropogenic noise. Under certain circum-
stances, these two measures produce the same result, but for impulsive sources, including airgun arrays,
90% RMS is usually higher. As Madsen (2005) demonstrated, the exact difference is highly variable,
depending on impulsivity, which may vary greatly for signals containing similar energy levels. Southall
et al. (2007) have recommended that SEL be used instead, and we follow this practice here. In this
appendix, we compare the modeling and calibration results.
Modeling Langseth Airgun Arrays for Mitigation
A simple raytrace-based modeling approach has been used to establish a priori safety radii for
marine mammal mitigation during Langseth expeditions, and previously for the R/V Ewing (Tolstoy et al.
2004). One of the many motivating factors for the Langseth calibration efforts was to assess the accuracy
of that modeling. Briefly, the modeling process is as follows:
1) Define the airgun array in terms of the size and relative location of each airgun [X, Y, and Z].
2) Model the near field signatures using Nucleus‘ MASOMO and extract them.
3) Decide upon a 2-D mesh of points, for example within a plane intersecting the center of the
airgun array; a typical mesh is 100 x 50.
4) For each of the points in the mesh, create the signal that would be observed there when every
airgun in the array was fired simultaneously.

Appendix A: Calibration & Modeling of Langseth Seismic Sources
Environmental Assessment for L-DEO’s Shatsky Rise Seismic Survey, 2012 Page 108
5) For that signal, determine the desired statistic: Peak-to-peak dB, Peak dB, RMS dB, maximum
psi, etc.
6) Contour the mesh.
7) Determine radii and the trajectory of maximum SPL from contour lines (Fig. 1).
Figure 1. The direct-arrival model for Langseth’s 4-string airgun array, towed at 6 meters depth, the configuration used during the calibration procedure. Whereas the calibration results should be compared to values modeled along the constant-depth “hydrophone” line, the maximum values, used for mitigation radii, are found along the slanted, dashed line. Energy that would be postcritically (i.e., totally) reflected or refracted at the sea floor propagates from the source and the sea surface in the field labeled “Postcritical.” The angle of the dividing line separating pre-and post-critical depends on the velocity of sound below the seafloor, and the x-value of the point at which this line intersects the seafloor is called the “critical distance.”
Most of the work lies in step 3, which has steps of its own:
a) For each of the airguns in the array, determine the distances, thus the time-of-flight between the
airgun and the mesh point, as well as the free surface ghost ―image‖ of the airgun and the mesh
point.
b) Scale and shift the airgun near field signal, dividing by the point-to-point distance and moving
forward in time according to time-of-flight.
c) Scale and shift the near field signal‘s ghost image, as above, in addition multiplying by the free
surface reflection coefficient [typically between -0.9 and -0.95]
d) Sum the results. For the Langseth 36-airgun array, 72 scaled and shifted signals are created and
summed for each mesh point.
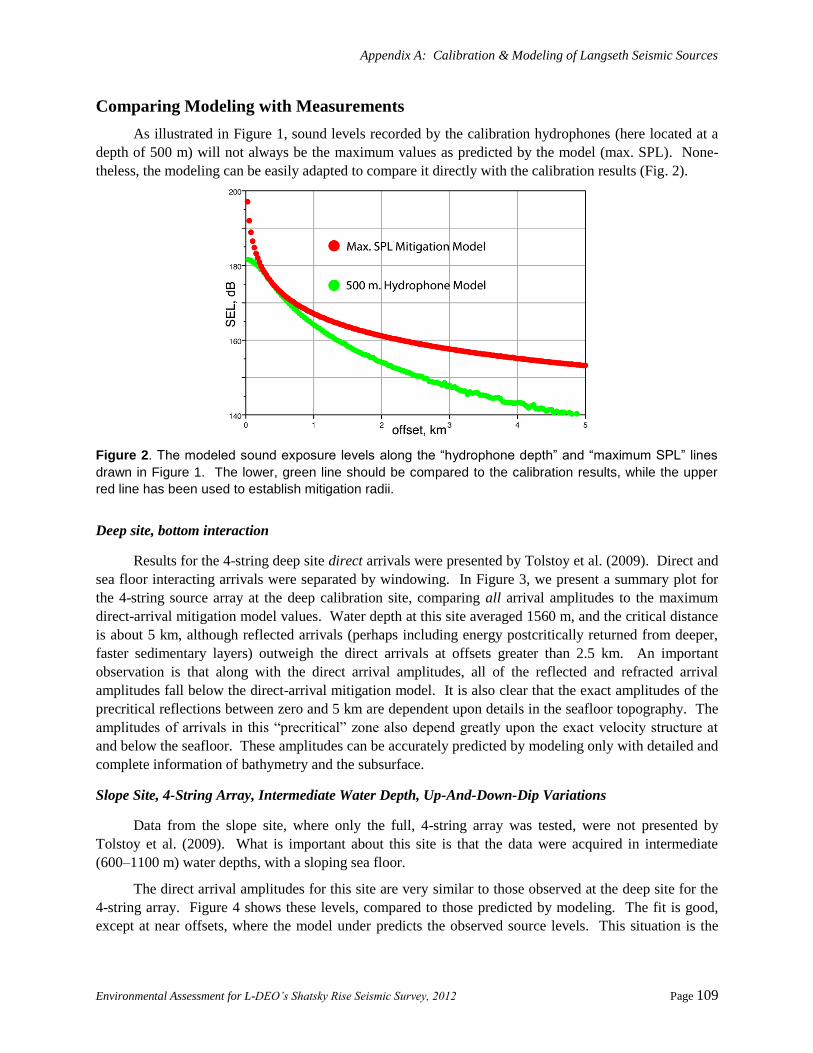
Appendix A: Calibration & Modeling of Langseth Seismic Sources
Environmental Assessment for L-DEO’s Shatsky Rise Seismic Survey, 2012 Page 109
Comparing Modeling with Measurements
As illustrated in Figure 1, sound levels recorded by the calibration hydrophones (here located at a
depth of 500 m) will not always be the maximum values as predicted by the model (max. SPL). None-
theless, the modeling can be easily adapted to compare it directly with the calibration results (Fig. 2).
Figure 2. The modeled sound exposure levels along the “hydrophone depth” and “maximum SPL” lines
drawn in Figure 1. The lower, green line should be compared to the calibration results, while the upper
red line has been used to establish mitigation radii.
Deep site, bottom interaction
Results for the 4-string deep site direct arrivals were presented by Tolstoy et al. (2009). Direct and
sea floor interacting arrivals were separated by windowing. In Figure 3, we present a summary plot for
the 4-string source array at the deep calibration site, comparing all arrival amplitudes to the maximum
direct-arrival mitigation model values. Water depth at this site averaged 1560 m, and the critical distance
is about 5 km, although reflected arrivals (perhaps including energy postcritically returned from deeper,
faster sedimentary layers) outweigh the direct arrivals at offsets greater than 2.5 km. An important
observation is that along with the direct arrival amplitudes, all of the reflected and refracted arrival
amplitudes fall below the direct-arrival mitigation model. It is also clear that the exact amplitudes of the
precritical reflections between zero and 5 km are dependent upon details in the seafloor topography. The
amplitudes of arrivals in this ―precritical‖ zone also depend greatly upon the exact velocity structure at
and below the seafloor. These amplitudes can be accurately predicted by modeling only with detailed and
complete information of bathymetry and the subsurface.
Slope Site, 4-String Array, Intermediate Water Depth, Up-And-Down-Dip Variations
Data from the slope site, where only the full, 4-string array was tested, were not presented by
Tolstoy et al. (2009). What is important about this site is that the data were acquired in intermediate
(600–1100 m) water depths, with a sloping sea floor.
The direct arrival amplitudes for this site are very similar to those observed at the deep site for the
4-string array. Figure 4 shows these levels, compared to those predicted by modeling. The fit is good,
except at near offsets, where the model under predicts the observed source levels. This situation is the
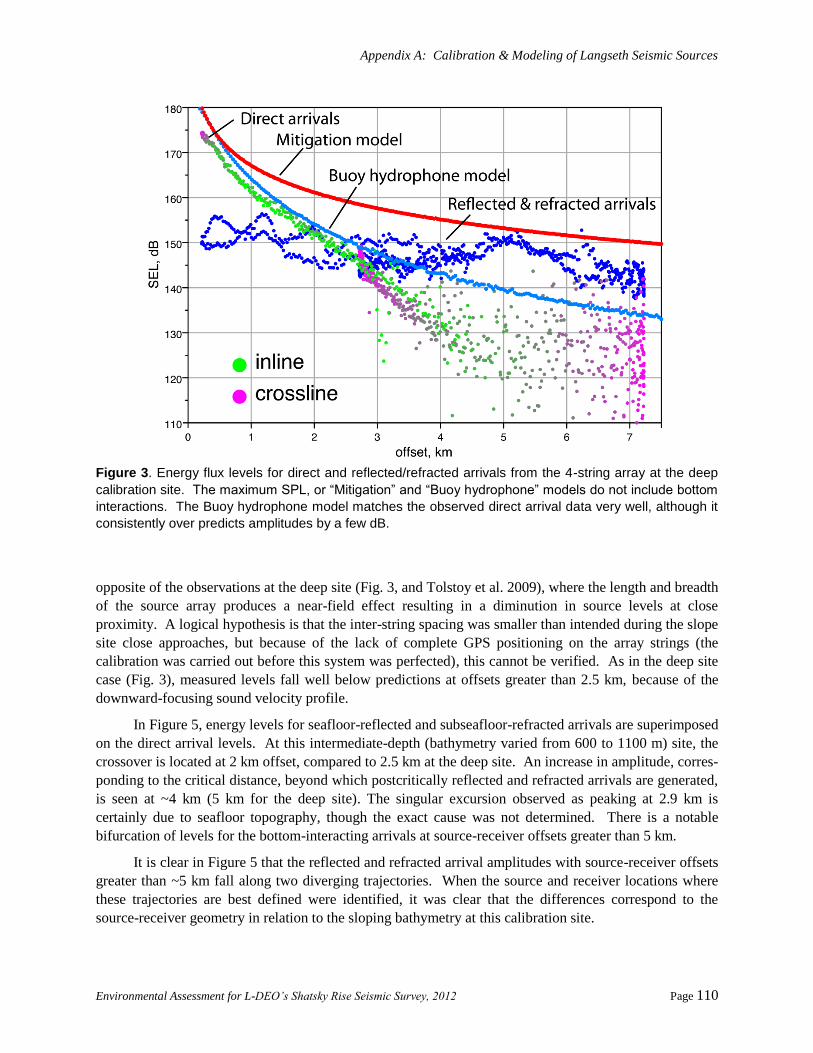
Appendix A: Calibration & Modeling of Langseth Seismic Sources
Environmental Assessment for L-DEO’s Shatsky Rise Seismic Survey, 2012 Page 110
Figure 3. Energy flux levels for direct and reflected/refracted arrivals from the 4-string array at the deep
calibration site. The maximum SPL, or “Mitigation” and “Buoy hydrophone” models do not include bottom
interactions. The Buoy hydrophone model matches the observed direct arrival data very well, although it
consistently over predicts amplitudes by a few dB.
opposite of the observations at the deep site (Fig. 3, and Tolstoy et al. 2009), where the length and breadth
of the source array produces a near-field effect resulting in a diminution in source levels at close
proximity. A logical hypothesis is that the inter-string spacing was smaller than intended during the slope
site close approaches, but because of the lack of complete GPS positioning on the array strings (the
calibration was carried out before this system was perfected), this cannot be verified. As in the deep site
case (Fig. 3), measured levels fall well below predictions at offsets greater than 2.5 km, because of the
downward-focusing sound velocity profile.
In Figure 5, energy levels for seafloor-reflected and subseafloor-refracted arrivals are superimposed
on the direct arrival levels. At this intermediate-depth (bathymetry varied from 600 to 1100 m) site, the
crossover is located at 2 km offset, compared to 2.5 km at the deep site. An increase in amplitude, corres-
ponding to the critical distance, beyond which postcritically reflected and refracted arrivals are generated,
is seen at ~4 km (5 km for the deep site). The singular excursion observed as peaking at 2.9 km is
certainly due to seafloor topography, though the exact cause was not determined. There is a notable
bifurcation of levels for the bottom-interacting arrivals at source-receiver offsets greater than 5 km.
It is clear in Figure 5 that the reflected and refracted arrival amplitudes with source-receiver offsets
greater than ~5 km fall along two diverging trajectories. When the source and receiver locations where
these trajectories are best defined were identified, it was clear that the differences correspond to the
source-receiver geometry in relation to the sloping bathymetry at this calibration site.

Appendix A: Calibration & Modeling of Langseth Seismic Sources
Environmental Assessment for L-DEO’s Shatsky Rise Seismic Survey, 2012 Page 111
Figure 4. Energy flux density (SEL) values for direct arrivals at the slope site. In-line and cross-line
aspects are color-coded. The 4-string model with 6-m tow depth and receiver depth of 400 m is shown
for comparison. The model is only exceeded by the data at small offsets, and at large offsets where the
direct arrival windowing started to fail.
Figure 5. As in Figure 3, measured levels for seafloor reflected and sub-seafloor refracted arrivals are
superimposed on the direct arrival values. Because the water is shallower at this site, the critical distance
is 4 km, rather than the 5 km observed at the deep site. All observed levels (except at very near offsets)
fall below the mitigation model predictions.
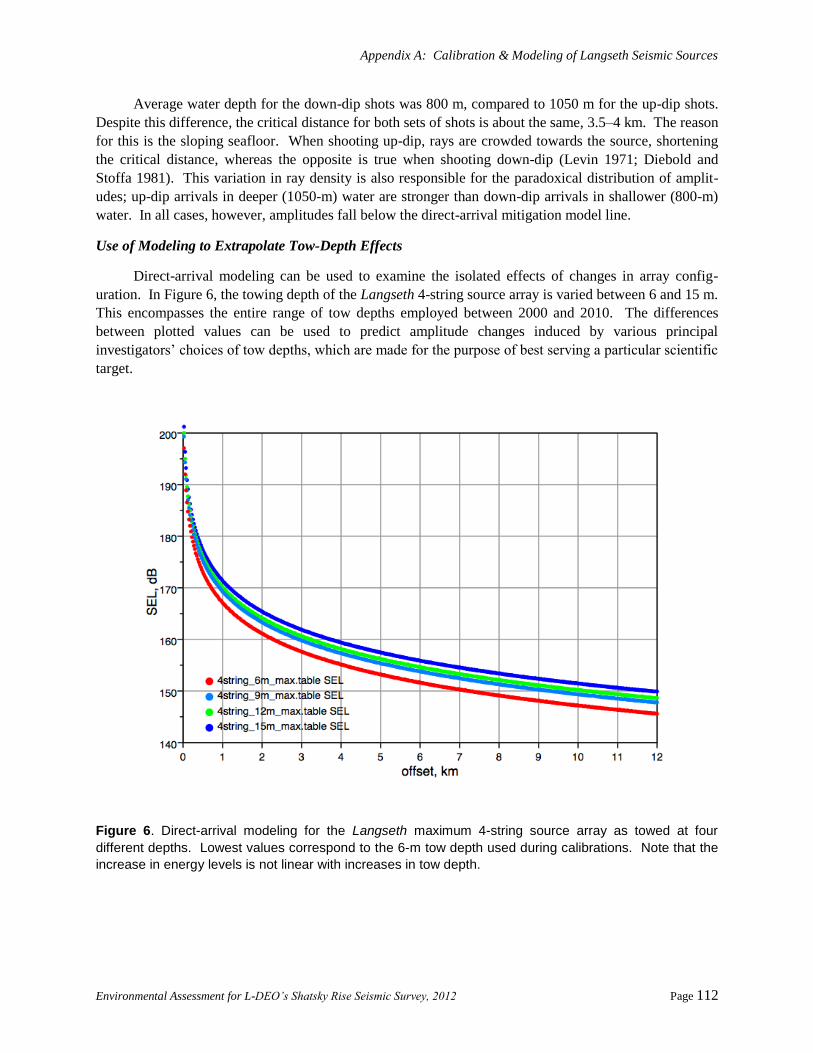
Appendix A: Calibration & Modeling of Langseth Seismic Sources
Environmental Assessment for L-DEO’s Shatsky Rise Seismic Survey, 2012 Page 112
Average water depth for the down-dip shots was 800 m, compared to 1050 m for the up-dip shots.
Despite this difference, the critical distance for both sets of shots is about the same, 3.5–4 km. The reason
for this is the sloping seafloor. When shooting up-dip, rays are crowded towards the source, shortening
the critical distance, whereas the opposite is true when shooting down-dip (Levin 1971; Diebold and
Stoffa 1981). This variation in ray density is also responsible for the paradoxical distribution of amplit-
udes; up-dip arrivals in deeper (1050-m) water are stronger than down-dip arrivals in shallower (800-m)
water. In all cases, however, amplitudes fall below the direct-arrival mitigation model line.
Use of Modeling to Extrapolate Tow-Depth Effects
Direct-arrival modeling can be used to examine the isolated effects of changes in array config-
uration. In Figure 6, the towing depth of the Langseth 4-string source array is varied between 6 and 15 m.
This encompasses the entire range of tow depths employed between 2000 and 2010. The differences
between plotted values can be used to predict amplitude changes induced by various principal
investigators‘ choices of tow depths, which are made for the purpose of best serving a particular scientific
target.
Figure 6. Direct-arrival modeling for the Langseth maximum 4-string source array as towed at four
different depths. Lowest values correspond to the 6-m tow depth used during calibrations. Note that the
increase in energy levels is not linear with increases in tow depth.

Appendix A: Calibration & Modeling of Langseth Seismic Sources
Environmental Assessment for L-DEO’s Shatsky Rise Seismic Survey, 2012 Page 113
Conclusions
Comparison of the modeling and calibration results showed that the model represents the actual
produced levels, particularly within the first few kilometers, where the predicted safety radii lie. At
greater distances, local oceanographic variations begin to take effect, and the model tends to over predict.
Because the modeling matches the observed measurement data quite well and can be used to predict
maximum values, we argue that the modeling can continue to be used for defining mitigation radii, and
further that it is valid for predicting mitigation radii for various tow depths.
Literature Cited
Diebold, J.B. and P.L. Stoffa. 1981. The Traveltime equation, tau-p mapping and inversion of common midpoint
data. Geophysics 46:238-254. [reprinted 1991: Slant-Stack Processing, G.H.F. Gardner and F.K. Levin
(eds.), Geophysics Reprint Series 14:151-167.]
Diebold, J.B., M. Tolstoy, L. Doermann, S.L. Nooner, S.C. Webb, and T.J. Crone. 2010. R/V Marcus G. Langseth
seismic source: Modeling and calibration. Geochem. Geophys. Geosyst. 11, Q12012,
doi:10.1029/2010GC003216.
Levin, F. 1971. Apparent velocity from dipping interface reflections. Geophysics 36, 510; doi:10.1190/1.1440188.
Madsen, P.T. 2005. Marine mammals and noise: Problems with root mean square sound pressure levels for
transients. J. Acous. Soc. Amer. 117:3952-3957.
Southall, B.L., A.E. Bowles, W.T. Ellison, J.J. Finneran, R.L. Gentry, C.R. Greene Jr., D. Kastak, D.R. Ketten, J.H.
Miller, P.E. Nachtigall, W.J. Richardson, J.A. Thomas, and P.L. Tyack. 2007. Marine mammal noise
exposure criteria: Initial scientific recommendations. Aquat. Mamm. 33:1-521.
Tolstoy, M., J.B. Diebold, S.C. Webb, D.R. Bohnenstiehl, E. Chapp, R.C. Holmes, and M. Rawson. 2004.
Broadband calibration of R/V Ewing seismic sources. Geophys. Res. Lett. 31, L14310, doi:
10.1029/2004GL020234.
Tolstoy, M., J. Diebold, L. Doermann, S. Nooner, S.C. Webb, D.R. Bohnenstiehl, T.J. Crone, and R.C. Holmes.
2009. Broadband calibration of the R/V Marcus G. Langseth four-string seismic sources. Geochem.
Geophys. Geosyst. 10, Q08011, doi:10.1029/2009GC002451.

Appendix B. Airgun Sounds and Marine Mammals
Environmental Assessment for L-DEO’s Shatsky Rise Seismic Survey, 2012 Page 114
APPENDIX B:
REVIEW OF THE EFFECTS OF AIRGUN SOUNDS ON MARINE MAMMALS2
The following subsections review relevant information concerning the potential effects of airguns
on marine mammals. Because this review is intended to be of general usefulness, it includes references to
types of marine mammals that will not be found in some specific regions.
1. Categories of Noise Effects
The effects of noise on marine mammals are highly variable, and can be categorized as follows
(adapted from Richardson et al. 1995):
1. The noise may be too weak to be heard at the location of the animal, i.e., lower than the prevail-
ing ambient noise level, the hearing threshold of the animal at relevant frequencies, or both;
2. The noise may be audible but not strong enough to elicit any overt behavioral response, i.e., the
mammal may tolerate it, either without or with some deleterious effects (e.g., masking, stress);
3. The noise may elicit behavioral reactions of variable conspicuousness and variable relevance to
the well being of the animal; these can range from subtle effects on respiration or other behaviors
(detectable only by statistical analysis) to active avoidance reactions;
4. Upon repeated exposure, animals may exhibit diminishing responsiveness (habituation), or distur-
bance effects may persist; the latter is most likely with sounds that are highly variable in charac-
teristics, unpredictable in occurrence, and associated with situations that the animal perceives as a
threat;
5. Any man-made noise that is strong enough to be heard has the potential to reduce (mask) the
ability of marine mammals to hear natural sounds at similar frequencies, including calls from
conspecifics, echolocation sounds of odontocetes, and environmental sounds such as surf noise or
(at high latitudes) ice noise. However, intermittent airgun or sonar pulses could cause strong
masking for only a small proportion of the time, given the short duration of these pulses relative
to the inter-pulse intervals;
6. Very strong sounds have the potential to cause temporary or permanent reduction in hearing
sensitivity, or other physical or physiological effects. Received sound levels must far exceed the
animal‘s hearing threshold for any temporary threshold shift to occur. Received levels must be
even higher for a risk of permanent hearing impairment.
2. Hearing Abilities of Marine Mammals
The hearing abilities of marine mammals are functions of the following (Richardson et al. 1995;
Au et al. 2000):
1. Absolute hearing threshold at the frequency in question (the level of sound barely audible in the
absence of ambient noise). The ―best frequency‖ is the frequency with the lowest absolute
threshold.
2. Critical ratio (the signal-to-noise ratio required to detect a sound at a specific frequency in the
presence of background noise around that frequency).
____________________________________
2 By W. John Richardson and Valerie D. Moulton, with subsequent updates (to Feb. 2010) by WJR and VDM
plus Patrick Abgrall, William E. Cross, Meike Holst, and Mari A. Smultea, all of LGL Ltd., environmental
research associates

Appendix B. Airgun Sounds and Marine Mammals
Environmental Assessment for L-DEO’s Shatsky Rise Seismic Survey, 2012 Page 115
3. The ability to determine sound direction at the frequencies under consideration.
4. The ability to discriminate among sounds of different frequencies and intensities.
Marine mammals rely heavily on the use of underwater sounds to communicate and to gain
information about their surroundings. Experiments and monitoring studies also show that they hear and
may react to many man-made sounds including sounds made during seismic exploration (Richardson et
al. 1995; Gordon et al. 2004; Nowacek et al. 2007; Tyack 2008).
2.1 Toothed Whales (Odontocetes)
Hearing abilities of some toothed whales (odontocetes) have been studied in detail (reviewed in
Chapter 8 of Richardson et al. [1995] and in Au et al. [2000]). Hearing sensitivity of several species has
been determined as a function of frequency. The small to moderate-sized toothed whales whose hearing
has been studied have relatively poor hearing sensitivity at frequencies below 1 kHz, but extremely good
sensitivity at, and above, several kHz. There are very few data on the absolute hearing thresholds of most
of the larger, deep-diving toothed whales, such as the sperm and beaked whales. However, Cook et al.
(2006) found that a stranded juvenile Gervais‘ beaked whale showed evoked potentials from 5 kHz up to
80 kHz (the entire frequency range that was tested), with best sensitivity at 40–80 kHz. An adult Gervais‘
beaked whale had a similar upper cutoff frequency (80–90 kHz; Finneran et al. 2009).
Most of the odontocete species have been classified as belonging to the ―mid-frequency‖ (MF)
hearing group, and the MF odontocetes (collectively) have functional hearing from about 150 Hz to 160
kHz (Southall et al. 2007). However, individual species may not have quite so broad a functional
frequency range. Very strong sounds at frequencies slightly outside the functional range may also be
detectable. The remaining odontocetes―the porpoises, river dolphins, and members of the genera
Cephalorhynchus and Kogia―are distinguished as the ―high frequency‖ (HF) hearing group. They have
functional hearing from about 200 Hz to 180 kHz (Southall et al. 2007).
Airguns produce a small proportion of their sound at mid- and high-frequencies, although at pro-
gressively lower levels with increasing frequency. In general, most of the energy in the sound pulses
emitted by airgun arrays is at low frequencies; strongest spectrum levels are below 200 Hz, with
considerably lower spectrum levels above 1000 Hz, and smaller amounts of energy emitted up to ~150
kHz (Goold and Fish 1998; Sodal 1999; Goold and Coates 2006; Potter et al. 2007).
Despite the relatively poor sensitivity of small odontocetes at the low frequencies that contribute
most of the energy in pulses of sound from airgun arrays, airgun sounds are sufficiently strong, and con-
tain sufficient mid- and high-frequency energy, that their received levels sometimes remain above the
hearing thresholds of odontocetes at distances out to several tens of kilometers (Richardson and Würsig
1997). There is no evidence that most small odontocetes react to airgun pulses at such long distances.
However, beluga whales do seem quite responsive at intermediate distances (10–20 km) where sound
levels are well above the ambient noise level (see below).
In summary, even though odontocete hearing is relatively insensitive to the predominant low freq-
uencies produced by airguns, sounds from airgun arrays are audible to odontocetes, sometimes to dis-
tances of 10s of kilometers.
2.2 Baleen Whales (Mysticetes)
The hearing abilities of baleen whales (mysticetes) have not been studied directly. Behavioral and
anatomical evidence indicates that they hear well at frequencies below 1 kHz (Richardson et al. 1995;

Appendix B. Airgun Sounds and Marine Mammals
Environmental Assessment for L-DEO’s Shatsky Rise Seismic Survey, 2012 Page 116
Ketten 2000). Frankel (2005) noted that gray whales reacted to a 21–25 kHz whale-finding sonar. Some
baleen whales react to pinger sounds up to 28 kHz, but not to pingers or sonars emitting sounds at 36 kHz
or above (Watkins 1986). In addition, baleen whales produce sounds at frequencies up to 8 kHz and, for
humpbacks, with components to >24 kHz (Au et al. 2006). The anatomy of the baleen whale inner ear
seems to be well adapted for detection of low-frequency sounds (Ketten 1991, 1992, 1994, 2000; Parks et
al. 2007b). Although humpbacks and minke whales (Berta et al. 2009) may have some auditory sensi-
tivity to frequencies above 22 kHz, for baleen whales as a group, the functional hearing range is thought
to be about 7 Hz to 22 kHz and they are said to constitute the ―low-frequency‖ (LF) hearing group
(Southall et al. 2007). The absolute sound levels that they can detect below 1 kHz are probably limited by
increasing levels of natural ambient noise at decreasing frequencies (Clark and Ellison 2004). Ambient
noise levels are higher at low frequencies than at mid frequencies. At frequencies below 1 kHz, natural
ambient levels tend to increase with decreasing frequency.
The hearing systems of baleen whales are undoubtedly more sensitive to low-frequency sounds
than are the ears of the small toothed whales that have been studied directly. Thus, baleen whales are
likely to hear airgun pulses farther away than can small toothed whales and, at closer distances, airgun
sounds may seem more prominent to baleen than to toothed whales. However, baleen whales have
commonly been seen well within the distances where seismic (or other source) sounds would be detect-
able and often show no overt reaction to those sounds. Behavioral responses by baleen whales to seismic
pulses have been documented, but received levels of pulsed sounds necessary to elicit behavioral
reactions are typically well above the minimum levels that the whales are assumed to detect (see below).
2.3 Seals and Sea Lions (Pinnipeds)
Underwater audiograms have been obtained using behavioral methods for three species of phocinid
seals, two species of monachid seals, two species of otariids, and the walrus (reviewed in Richardson et
al. 1995: 211ff; Kastak and Schusterman 1998, 1999; Kastelein et al. 2002, 2009). The functional hearing
range for pinnipeds in water is considered to extend from 75 Hz to 75 kHz (Southall et al. 2007), although
some individual species―especially the eared seals―do not have that broad an auditory range
(Richardson et al. 1995). In comparison with odontocetes, pinnipeds tend to have lower best frequencies,
lower high-frequency cutoffs, better auditory sensitivity at low frequencies, and poorer sensitivity at the
best frequency.
At least some of the phocid seals have better sensitivity at low frequencies ( 1 kHz) than do
odontocetes. Below 30–50 kHz, the hearing thresholds of most species tested are essentially flat down to
~1 kHz, and range between 60 and 85 dB re 1 µPa. Measurements for harbor seals indicate that, below
1 kHz, their thresholds under quiet background conditions deteriorate gradually with decreasing frequen-
cy to ~75 dB re 1 µPa at 125 Hz (Kastelein et al. 2009).
For the otariid (eared) seals, the high frequency cutoff is lower than for phocinids, and sensitivity at
low frequencies (e.g., 100 Hz) is poorer than for seals (harbor seal).
2.4 Manatees and Dugong (Sirenians)
The West Indian manatee can apparently detect sounds and low-frequency vibrations from 15 Hz
to 46 kHz, based on a study involving behavioral testing methods (Gerstein et al. 1999, 2004). A more
recent study found that, in one Florida manatee, auditory sensitivity extended up to 90.5 kHz (Bauer et al.
2009). Thus, manatees may hear, or at least detect, sounds in the low-frequency range where most

Appendix B. Airgun Sounds and Marine Mammals
Environmental Assessment for L-DEO’s Shatsky Rise Seismic Survey, 2012 Page 117
seismic energy is released. It is possible that they are able to feel these low-frequency sounds using
vibrotactile receptors or because of resonance in body cavities or bone conduction.
Based on measurements of evoked potentials, manatee hearing is apparently best around 1–1.5 kHz
(Bullock et al. 1982). However, behavioral tests suggest that best sensitivities are at 6–20 kHz (Gerstein
et al. 1999) or 8–32 kHz (Bauer et al. 2009). The ability to detect high frequencies may be an adaptation
to shallow water, where the propagation of low frequency sound is limited (Gerstein et al. 1999, 2004).
2.5 Sea Otter and Polar Bear
No data are available on the hearing abilities of sea otters (Ketten 1998), although the in-air
vocalizations of sea otters have most of their energy concentrated at 3–5 kHz (McShane et al. 1995;
Thomson and Richardson 1995). Sea otter vocalizations are considered to be most suitable for short-
range communication among individuals (McShane et al. 1995). However, Ghoul et al. (2009) noted that
the in-air ―screams‖ of sea otters are loud signals (source level of 93–118 dB re 20 µPapk) that may be
used over larger distances; screams have a frequency of maximum energy ranging from 2 to 8 kHz. In-air
audiograms for two river otters indicate that this related species has its best hearing sensitivity at the
relatively high frequency of 16 kHz, with some sensitivity from about 460 Hz to 33 kHz (Gunn 1988).
However, these data apply to a different species of otter, and to in-air rather than underwater hearing.
Data on the specific hearing capabilities of polar bears are limited. A recent study of the in-air
hearing of polar bears applied the auditory evoked potential method while tone pips were played to
anesthetized bears (Nachtigall et al. 2007). Hearing was tested in ½ octave steps from 1 to 22.5 kHz, and
best hearing sensitivity was found between 11.2 and 22.5 kHz. Although low-frequency hearing was not
studied, the data suggested that medium- and some high-frequency sounds may be audible to polar bears.
However, polar bears‘ usual behavior (e.g., remaining on the ice, at the water surface, or on land) reduces
or avoids exposure to underwater sounds.
3. Characteristics of Airgun Sounds
Airguns function by venting high-pressure air into the water. The pressure signature of an individ-
ual airgun consists of a sharp rise and then fall in pressure, followed by several positive and negative
pressure excursions caused by oscillation of the resulting air bubble. The sizes, arrangement, and firing
times of the individual airguns in an array are designed and synchronized to suppress the pressure
oscillations subsequent to the first cycle. The resulting downward-directed pulse has a duration of only
10–20 ms, with only one strong positive and one strong negative peak pressure (Caldwell and Dragoset
2000). Most energy emitted from airguns is at relatively low frequencies. For example, typical high-
energy airgun arrays emit most energy at 10–120 Hz. However, the pulses contain significant energy up
to 500–1000 Hz and some energy at higher frequencies (Goold and Fish 1998; Potter et al. 2007). Studies
in the Gulf of Mexico have shown that the horizontally-propagating sound can contain significant energy
above the frequencies that airgun arrays are designed to emit (DeRuiter et al. 2006; Madsen et al. 2006;
Tyack et al. 2006a). Energy at frequencies up to 150 kHz was found in tests of single 60-in3 and 250-in
3
airguns (Goold and Coates 2006). Nonetheless, the predominant energy is at low frequencies.
The pulsed sounds associated with seismic exploration have higher peak levels than other industrial
sounds (except those from explosions) to which whales and other marine mammals are routinely exposed.
The nominal source levels of the 2- to 36-airgun arrays used by Lamont-Doherty Earth Observatory
(L-DEO) from the R/V Maurice Ewing (now retired) and R/V Marcus G. Langseth (36 airguns) are 236–
265 dB re 1 µPap–p. These are the nominal source levels applicable to downward propagation. The

Appendix B. Airgun Sounds and Marine Mammals
Environmental Assessment for L-DEO’s Shatsky Rise Seismic Survey, 2012 Page 118
effective source levels for horizontal propagation are lower than those for downward propagation when
the source consists of numerous airguns spaced apart from one another. Explosions are the only man-
made sources with effective source levels as high as (or higher than) a large array of airguns. However,
high-power sonars can have source pressure levels as high as a small array of airguns, and signal duration
can be longer for a sonar than for an airgun array, making the source energy levels of some sonars more
comparable to those of airgun arrays.
Several important mitigating factors need to be kept in mind. (1) Airgun arrays produce inter-
mittent sounds, involving emission of a strong sound pulse for a small fraction of a second followed by
several seconds of near silence. In contrast, some other sources produce sounds with lower peak levels,
but their sounds are continuous or discontinuous but continuing for longer durations than seismic pulses.
(2) Airgun arrays are designed to transmit strong sounds downward through the seafloor, and the amount
of sound transmitted in near-horizontal directions is considerably reduced. Nonetheless, they also emit
sounds that travel horizontally toward non-target areas. (3) An airgun array is a distributed source, not a
point source. The nominal source level is an estimate of the sound that would be measured from a
theoretical point source emitting the same total energy as the airgun array. That figure is useful in
calculating the expected received levels in the far field, i.e., at moderate and long distances, but not in the
near field. Because the airgun array is not a single point source, there is no one location within the near
field (or anywhere else) where the received level is as high as the nominal source level.
The strengths of airgun pulses can be measured in different ways, and it is important to know
which method is being used when interpreting quoted source or received levels. Geophysicists usually
quote peak-to-peak (p-p) levels, in bar-meters or (less often) dB re 1 μPa · m. The peak (= zero-to-peak,
or 0-p) level for the same pulse is typically ~6 dB less. In the biological literature, levels of received
airgun pulses are often described based on the ―average‖ or ―root-mean-square‖ (rms) level, where the
average is calculated over the duration of the pulse. The rms value for a given airgun pulse is typically
~10 dB lower than the peak level, and 16 dB lower than the peak-to-peak value (Greene 1997; McCauley
et al. 1998, 2000a). A fourth measure that is increasingly used is the energy, or Sound Exposure Level
(SEL), in dB re 1 μPa2 · s. Because the pulses, even when stretched by propagation effects (see below),
are usually <1 s in duration, the numerical value of the energy is usually lower than the rms pressure
level. However, the units are different.3 Because the level of a given pulse will differ substantially
depending on which of these measures is being applied, it is important to be aware which measure is in
use when interpreting any quoted pulse level. In the past, the U.S. National Marine Fisheries Service
(NMFS) has commonly referred to rms levels when discussing levels of pulsed sounds that might
―harass‖ marine mammals.
Seismic sound pulses received at any given point will arrive via a direct path, indirect paths that
include reflection from the sea surface and bottom, and often indirect paths including segments through
the bottom sediments. Sounds propagating via indirect paths travel longer distances and often arrive later
____________________________________
3 The rms value for a given airgun array pulse, as measured at a horizontal distance on the order of 0.1 km to 1–10
km in the units dB re 1 μPa, usually averages 10–15 dB higher than the SEL value for the same pulse measured in
dB re 1 μPa2 · s (e.g., Greene 1997). However, there is considerable variation, and the difference tends to be larger
close to the airgun array, and less at long distances (Blackwell et al. 2007; MacGillivray and Hannay 2007a,b). In
some cases, generally at longer distances, pulses are ―stretched‖ by propagation effects to the extent that the rms
and SEL values (in the respective units mentioned above) become very similar (e.g., MacGillivray and Hannay
2007a,b).

Appendix B. Airgun Sounds and Marine Mammals
Environmental Assessment for L-DEO’s Shatsky Rise Seismic Survey, 2012 Page 119
than sounds arriving via a direct path. (However, sound traveling in the bottom may travel faster than that
in the water, and thus may, in some situations, arrive slightly earlier than the direct arrival despite travel-
ing a greater distance.) These variations in travel time have the effect of lengthening the duration of the
received pulse, or may cause two or more received pulses from a single emitted pulse. Near the source,
the predominant part of a seismic pulse is ~10–20 ms in duration. In comparison, the pulse duration as
received at long horizontal distances can be much greater. For example, for one airgun array operating in
the Beaufort Sea, pulse duration was ~300 ms at a distance of 8 km, 500 ms at 20 km, and 850 ms at 73
km (Greene and Richardson 1988).
The rms level for a given pulse (when measured over the duration of that pulse) depends on the
extent to which propagation effects have ―stretched‖ the duration of the pulse by the time it reaches the
receiver (e.g., Madsen 2005). As a result, the rms values for various received pulses are not perfectly
correlated with the SEL (energy) values for the same pulses. There is increasing evidence that biological
effects are more directly related to the received energy (e.g., to SEL) than to the rms values averaged over
pulse duration (Southall et al. 2007).
Another important aspect of sound propagation is that received levels of low-frequency underwater
sounds diminish close to the surface because of pressure-release and interference phenomena that occur at
and near the surface (Urick 1983; Richardson et al. 1995; Potter et al. 2007). Paired measurements of
received airgun sounds at depths of 3 vs. 9 or 18 m have shown that received levels are typically several
decibels lower at 3 m (Greene and Richardson 1988). For a mammal whose auditory organs are within
0.5 or 1 m of the surface, the received level of the predominant low-frequency components of the airgun
pulses would be further reduced. In deep water, the received levels at deep depths can be considerably
higher than those at relatively shallow (e.g., 18 m) depths and the same horizontal distance from the
airguns (Tolstoy et al. 2004a,b).
Pulses of underwater sound from open-water seismic exploration are often detected 50–100 km
from the source location, even during operations in nearshore waters (Greene and Richardson 1988;
Burgess and Greene 1999). At those distances, the received levels are usually low, <120 dB re 1 Pa on
an approximate rms basis. However, faint seismic pulses are sometimes detectable at even greater ranges
(e.g., Bowles et al. 1994; Fox et al. 2002). In fact, low-frequency airgun signals sometimes can be
detected thousands of kilometers from their source. For example, sound from seismic surveys conducted
offshore of Nova Scotia, the coast of western Africa, and northeast of Brazil were reported as a dominant
feature of the underwater noise field recorded along the mid-Atlantic ridge (Nieukirk et al. 2004).
4. Masking Effects of Airgun Sounds
Masking is the obscuring of sounds of interest by interfering sounds, generally at similar freq-
uencies (Richardson et al. 1995). Introduced underwater sound will, through masking, reduce the
effective communication distance of a marine mammal species if the frequency of the source is close to
that used as a signal by the marine mammal, and if the anthropogenic sound is present for a significant
fraction of the time (Richardson et al. 1995). If little or no overlap occurs between the introduced sound
and the frequencies used by the species, communication is not expected to be disrupted. Also, if the
introduced sound is present only infrequently, communication is not expected to be disrupted much if at
all. The duty cycle of airguns is low; the airgun sounds are pulsed, with relatively quiet periods between
pulses. In most situations, strong airgun sound will only be received for a brief period (<1 s), with these
sound pulses being separated by at least several seconds of relative silence, and longer in the case of
deep-penetration surveys or refraction surveys. A single airgun array might cause appreciable masking in
only one situation: When propagation conditions are such that sound from each airgun pulse reverberates

Appendix B. Airgun Sounds and Marine Mammals
Environmental Assessment for L-DEO’s Shatsky Rise Seismic Survey, 2012 Page 120
strongly and persists for much or all of the interval up to the next airgun pulse (e.g., Simard et al. 2005;
Clark and Gagnon 2006). Situations with prolonged strong reverberation are infrequent, in our experi-
ence. However, it is common for reverberation to cause some lesser degree of elevation of the back-
ground level between airgun pulses (e.g., Guerra et al. 2009), and this weaker reverberation presumably
reduces the detection range of calls and other natural sounds to some degree.
Although masking effects of pulsed sounds on marine mammal calls and other natural sounds are
expected to be limited, there are few specific studies on this. Some whales continue calling in the
presence of seismic pulses and whale calls often can be heard between the seismic pulses (e.g.,
Richardson et al. 1986; McDonald et al. 1995; Greene et al. 1999a,b; Nieukirk et al. 2004; Smultea et al.
2004; Holst et al. 2005a,b, 2006; Dunn and Hernandez 2009). However, there is one recent summary
report indicating that calling fin whales distributed in one part of the North Atlantic went silent for an
extended period starting soon after the onset of a seismic survey in the area (Clark and Gagnon 2006). It
is not clear from that preliminary paper whether the whales ceased calling because of masking, or whether
this was a behavioral response not directly involving masking. Also, bowhead whales in the Beaufort Sea
may decrease their call rates in response to seismic operations, although movement out of the area might
also have contributed to the lower call detection rate (Blackwell et al. 2009a,b). In contrast, Di Iorio and
Clark (2009) found evidence of increased calling by blue whales during operations by a lower-energy
seismic source―a sparker.
Among the odontocetes, there has been one report that sperm whales ceased calling when exposed
to pulses from a very distant seismic ship (Bowles et al. 1994). However, more recent studies of sperm
whales found that they continued calling in the presence of seismic pulses (Madsen et al. 2002; Tyack et
al. 2003; Smultea et al. 2004; Holst et al. 2006; Jochens et al. 2008). Madsen et al. (2006) noted that air-
gun sounds would not be expected to mask sperm whale calls given the intermittent nature of airgun
pulses. Dolphins and porpoises are also commonly heard calling while airguns are operating (Gordon et
al. 2004; Smultea et al. 2004; Holst et al. 2005a,b; Potter et al. 2007). Masking effects of seismic pulses
are expected to be negligible in the case of the smaller odontocetes, given the intermittent nature of
seismic pulses plus the fact that sounds important to them are predominantly at much higher frequencies
than are the dominant components of airgun sounds.
Pinnipeds, sirenians and sea otters have best hearing sensitivity and/or produce most of their
sounds at frequencies higher than the dominant components of airgun sound, but there is some overlap in
the frequencies of the airgun pulses and the calls. However, the intermittent nature of airgun pulses
presumably reduces the potential for masking.
A few cetaceans are known to increase the source levels of their calls in the presence of elevated
sound levels, shift their peak frequencies in response to strong sound signals, or otherwise modify their
vocal behavior in response to increased noise (Dahlheim 1987; Au 1993; reviewed in Richardson et al.
1995:233ff, 364ff; Lesage et al. 1999; Terhune 1999; Nieukirk et al. 2005; Scheifele et al. 2005; Parks et
al. 2007a, 2009; Di Iorio and Clark 2009; Hanser et al. 2009). It is not known how often these types of
responses occur upon exposure to airgun sounds. However, blue whales in the St. Lawrence Estuary
significantly increased their call rates during sparker operations (Di Iorio and Clark 2009). The sparker,
used to obtain seismic reflection data, emitted frequencies of 30–450 Hz with a relatively low source level
of 193 dB re 1 μPapk-pk. If cetaceans exposed to airgun sounds sometimes respond by changing their vocal
behavior, this adaptation, along with directional hearing and preadaptation to tolerate some masking by
natural sounds (Richardson et al. 1995), would all reduce the importance of masking by seismic pulses.

Appendix B. Airgun Sounds and Marine Mammals
Environmental Assessment for L-DEO’s Shatsky Rise Seismic Survey, 2012 Page 121
5. Disturbance by Seismic Surveys
Disturbance includes a variety of effects, including subtle to conspicuous changes in behavior,
movement, and displacement. In the terminology of the 1994 amendments to the U.S. Marine Mammal
Protection Act (MMPA), seismic noise could cause ―Level B‖ harassment of certain marine mammals.
Level B harassment is defined as ―...disruption of behavioral patterns, including, but not limited to,
migration, breathing, nursing, breeding, feeding, or sheltering.‖
There has been debate regarding how substantial a change in behavior or mammal activity is
required before the animal should be deemed to be ―taken by Level B harassment‖. NMFS has stated that
―…a simple change in a marine mammal‘s actions does not always rise to the level of disruption
of its behavioral patterns. … If the only reaction to the [human] activity on the part of the marine
mammal is within the normal repertoire of actions that are required to carry out that behavioral
pattern, NMFS considers [the human] activity not to have caused a disruption of the behavioral
pattern, provided the animal‘s reaction is not otherwise significant enough to be considered
disruptive due to length or severity. Therefore, for example, a short-term change in breathing rates
or a somewhat shortened or lengthened dive sequence that are within the animal‘s normal range
and that do not have any biological significance (i.e., do no disrupt the animal‘s overall behavioral
pattern of breathing under the circumstances), do not rise to a level requiring a small take author-
ization.‖ (NMFS 2001, p. 9293).
Based on this guidance from NMFS, and on NRC (2005), simple exposure to sound, or brief reactions
that do not disrupt behavioral patterns in a potentially significant manner, do not constitute harassment or
―taking‖. In this analysis, we interpret ―potentially significant‖ to mean in a manner that might have
deleterious effects on the well-being of individual marine mammals or their populations.
Even with this guidance, there are difficulties in defining what marine mammals should be counted
as ―taken by harassment‖. Available detailed data on reactions of marine mammals to airgun sounds (and
other anthropogenic sounds) are limited to relatively few species and situations (see Richardson et al.
1995; Gordon et al. 2004; Nowacek et al. 2007; Southall et al. 2007). Behavioral reactions of marine
mammals to sound are difficult to predict in the absence of site- and context-specific data. Reactions to
sound, if any, depend on species, state of maturity, experience, current activity, reproductive state, time of
day, and many other factors (Richardson et al. 1995; Wartzok et al. 2004; Southall et al. 2007; Weilgart
2007). If a marine mammal reacts to an underwater sound by changing its behavior or moving a small
distance, the impacts of the change are unlikely to be significant to the individual, let alone the stock or
population. However, if a sound source displaces marine mammals from an important feeding or breed-
ing area for a prolonged period, impacts on individuals and populations could be significant (e.g., Lusseau
and Bejder 2007; Weilgart 2007). Also, various authors have noted that some marine mammals that show
no obvious avoidance or behavioral changes may still be adversely affected by noise (Brodie 1981; Rich-
ardson et al. 1995:317ff; Romano et al. 2004; Weilgart 2007; Wright et al. 2009). For example, some
research suggests that animals in poor condition or in an already stressed state may not react as strongly to
human disturbance as would more robust animals (e.g., Beale and Monaghan 2004).
Studies of the effects of seismic surveys have focused almost exclusively on the effects on individ-
ual species or related groups of species, with little scientific or regulatory attention being given to broader
community-level issues. Parente et al. (2007) suggested that the diversity of cetaceans near the Brazil
coast was reduced during years with seismic surveys. However, a preliminary account of a more recent

Appendix B. Airgun Sounds and Marine Mammals
Environmental Assessment for L-DEO’s Shatsky Rise Seismic Survey, 2012 Page 122
analysis suggests that the trend did not persist when additional years were considered (Britto and Silva
Barreto 2009).
Given the many uncertainties in predicting the quantity and types of impacts of sound on marine
mammals, it is common practice to estimate how many mammals would be present within a particular
distance of human activities and/or exposed to a particular level of anthropogenic sound. In most cases,
this approach likely overestimates the numbers of marine mammals that would be affected in some
biologically important manner. One of the reasons for this is that the selected distances/isopleths are
based on limited studies indicating that some animals exhibited short-term reactions at this distance or
sound level, whereas the calculation assumes that all animals exposed to this level would react in a
biologically significant manner.
The definitions of ―taking‖ in the U.S. MMPA, and its applicability to various activities, were
slightly altered in November 2003 for military and federal scientific research activities. Also, NMFS is
proposing to replace current Level A and B harassment criteria with guidelines based on exposure
characteristics that are specific to particular groups of mammal species and to particular sound types
(NMFS 2005). Recently, a committee of specialists on noise impact issues has proposed new science-
based impact criteria (Southall et al. 2007). Thus, for projects subject to U.S. jurisdiction, changes in
procedures may be required in the near future.
The sound criteria used to estimate how many marine mammals might be disturbed to some
biologically significant degree by seismic survey activities are primarily based on behavioral observations
of a few species. Detailed studies have been done on humpback, gray, bowhead, and sperm whales, and
on ringed seals. Less detailed data are available for some other species of baleen whales and small
toothed whales, but for many species there are no data on responses to marine seismic surveys.
5.1 Baleen Whales
Baleen whales generally tend to avoid operating airguns, but avoidance radii are quite variable
among species, locations, whale activities, oceanographic conditions affecting sound propagation, etc.
(reviewed in Richardson et al. 1995; Gordon et al. 2004). Whales are often reported to show no overt
reactions to pulses from large arrays of airguns at distances beyond a few kilometers, even though the
airgun pulses remain well above ambient noise levels out to much longer distances. However, baleen
whales exposed to strong sound pulses from airguns often react by deviating from their normal migration
route and/or interrupting their feeding and moving away. Some of the major studies and reviews on this
topic are Malme et al. (1984, 1985, 1988); Richardson et al. (1986, 1995, 1999); Ljungblad et al. (1988);
Richardson and Malme (1993); McCauley et al. (1998, 2000a,b); Miller et al. (1999, 2005); Gordon et al.
(2004); Moulton and Miller (2005); Stone and Tasker (2006); Johnson et al. (2007); Nowacek et al.
(2007) and Weir (2008a). Although baleen whales often show only slight overt responses to operating
airgun arrays (Stone and Tasker 2006; Weir 2008a), strong avoidance reactions by several species of
mysticetes have been observed at ranges up to 6–8 km and occasionally as far as 20–30 km from the
source vessel when large arrays of airguns were used. Experiments with a single airgun showed that
bowhead, humpback and gray whales all showed localized avoidance to a single airgun of 20–100 in3
(Malme et al. 1984, 1985, 1986, 1988; Richardson et al. 1986; McCauley et al. 1998, 2000a,b).
Studies of gray, bowhead, and humpback whales have shown that seismic pulses with received
levels of 160–170 dB re 1 Parms seem to cause obvious avoidance behavior in a substantial portion of the
animals exposed (Richardson et al. 1995). In many areas, seismic pulses from large arrays of airguns
diminish to those levels at distances ranging from 4–15 km from the source. More recent studies have
Appendix B. Airgun Sounds and Marine Mammals
Environmental Assessment for L-DEO’s Shatsky Rise Seismic Survey, 2012 Page 123
shown that some species of baleen whales (bowheads and humpbacks in particular) at times show strong
avoidance at received levels lower than 160–170 dB re 1 μParms. The largest avoidance radii involved
migrating bowhead whales, which avoided an operating seismic vessel by 20–30 km (Miller et al. 1999;
Richardson et al. 1999). In the cases of migrating bowhead (and gray) whales, the observed changes in
behavior appeared to be of little or no biological consequence to the animals—they simply avoided the
sound source by displacing their migration route to varying degrees, but within the natural boundaries of
the migration corridors (Malme et al. 1984; Malme and Miles 1985; Richardson et al. 1995). Feeding
bowhead whales, in contrast to migrating whales, show much smaller avoidance distances (Miller et al.
2005; Harris et al. 2007), presumably because moving away from a food concentration has greater cost to
the whales than does a course deviation during migration.
The following subsections provide more details on the documented responses of particular species
and groups of baleen whales to marine seismic operations.
Humpback Whales.—Responses of humpback whales to seismic surveys have been studied during
migration, on the summer feeding grounds, and on Angolan winter breeding grounds; there has also been
discussion of effects on the Brazilian wintering grounds. McCauley et al. (1998, 2000a) studied the
responses of migrating humpback whales off Western Australia to a full-scale seismic survey with a 16-
airgun 2678-in3 array, and to a single 20 in
3 airgun with a (horizontal) source level of 227 dB re
1 Pa · mp-p. They found that the overall distribution of humpbacks migrating through their study area
was unaffected by the full-scale seismic program, although localized displacement varied with pod
composition, behavior, and received sound levels. Observations were made from the seismic vessel, from
which the maximum viewing distance was listed as 14 km. Avoidance reactions (course and speed
changes) began at 4–5 km for traveling pods, with the closest point of approach (CPA) being 3–4 km at
an estimated received level of 157–164 dB re 1 µParms (McCauley et al. 1998, 2000a). A greater stand-off
range of 7–12 km was observed for more sensitive resting pods (cow-calf pairs; McCauley et al. 1998,
2000a). The mean received level for initial avoidance of an approaching airgun was 140 dB re 1 µParms
for humpback pods containing females, and at the mean CPA distance the received level was 143 dB re
1 µParms. One startle response was reported at 112 dB re 1 µParms. The initial avoidance response gener-
ally occurred at distances of 5–8 km from the airgun array and 2 km from the single airgun. However,
some individual humpback whales, especially males, approached within distances of 100–400 m, where
the maximum received level was 179 dB re 1 Parms. The McCauley et al. (1998, 2000a,b) studies show
evidence of greater avoidance of seismic airgun sounds by pods with females than by other pods during
humpback migration off Western Australia.
Humpback whales on their summer feeding grounds in southeast Alaska did not exhibit persistent
avoidance when exposed to seismic pulses from a 1.64-L (100 in3) airgun (Malme et al. 1985). Some
humpbacks seemed ―startled‖ at received levels of 150–169 dB re 1 Pa. Malme et al. (1985) concluded
that there was no clear evidence of avoidance, despite the possibility of subtle effects, at received levels
up to 172 re 1 Pa on an approximate rms basis.
Among wintering humpback whales off Angola (n = 52 useable groups), there were no significant
differences in encounter rates (sightings/hr) when a 24-airgun array (3147 in3 or 5085 in
3) was operating
vs. silent (Weir 2008a). There was also no significant difference in the mean CPA (closest observed point
of approach) distance of the humpback sightings when airguns were on vs. off (3050 m vs. 2700 m,
respectively).
It has been suggested that South Atlantic humpback whales wintering off Brazil may be displaced
or even strand upon exposure to seismic surveys (Engel et al. 2004). The evidence for this was circum-

Appendix B. Airgun Sounds and Marine Mammals
Environmental Assessment for L-DEO’s Shatsky Rise Seismic Survey, 2012 Page 124
stantial and subject to alternative explanations (IAGC 2004). Also, the evidence was not consistent with
subsequent results from the same area of Brazil (Parente et al. 2006), or with direct studies of humpbacks
exposed to seismic surveys in other areas and seasons (see above). After allowance for data from subseq-
uent years, there was ―no observable direct correlation‖ between strandings and seismic surveys (IWC
2007, p. 236).
Bowhead Whales.—Responsiveness of bowhead whales to seismic surveys can be quite variable
depending on their activity (feeding vs. migrating). Bowhead whales on their summer feeding grounds in
the Canadian Beaufort Sea showed no obvious reactions to pulses from seismic vessels at distances of 6–
99 km and received sound levels of 107–158 dB on an approximate rms basis (Richardson et al. 1986);
their general activities were indistinguishable from those of a control group. However, subtle but statis-
tically significant changes in surfacing–respiration–dive cycles were evident upon statistical analysis.
Bowheads usually did show strong avoidance responses when seismic vessels approached within a few
kilometers (~3–7 km) and when received levels of airgun sounds were 152–178 dB (Richardson et al.
1986, 1995; Ljungblad et al. 1988; Miller et al. 2005). They also moved away when a single airgun fired
nearby (Richardson et al. 1986; Ljungblad et al. 1988). In one case, bowheads engaged in near-bottom
feeding began to turn away from a 30-airgun array with a source level of 248 dB re 1 μPa · m at a distance
of 7.5 km, and swam away when it came within ~2 km; some whales continued feeding until the vessel
was 3 km away (Richardson et al. 1986). This work and subsequent summer studies in the same region
by Miller et al. (2005) and Harris et al. (2007) showed that many feeding bowhead whales tend to tolerate
higher sound levels than migrating bowhead whales (see below) before showing an overt change in
behavior. On the summer feeding grounds, bowhead whales are often seen from the operating seismic
ship, though average sighting distances tend to be larger when the airguns are operating. Similarly, pre-
liminary analyses of recent data from the Alaskan Beaufort Sea indicate that bowheads feeding there dur-
ing late summer and autumn also did not display large-scale distributional changes in relation to seismic
operations (Christie et al. 2009; Koski et al. 2009). However, some individual bowheads apparently
begin to react at distances a few kilometers away, beyond the distance at which observers on the ship can
sight bowheads (Richardson et al. 1986; Citta et al. 2007). The feeding whales may be affected by the
sounds, but the need to feed may reduce the tendency to move away until the airguns are within a few
kilometers.
Migrating bowhead whales in the Alaskan Beaufort Sea seem more responsive to noise pulses from
a distant seismic vessel than are summering bowheads. Bowhead whales migrating west across the
Alaskan Beaufort Sea in autumn are unusually responsive, with substantial avoidance occurring out to
distances of 20–30 km from a medium-sized airgun source at received sound levels of around 120–130
dB re 1 µParms (Miller et al. 1999; Richardson et al. 1999; see also Manly et al. 2007). Those results came
from 1996–98, when a partially-controlled study of the effect of Ocean Bottom Cable (OBC) seismic
surveys on westward-migrating bowheads was conducted in late summer and autumn in the Alaskan
Beaufort Sea. At times when the airguns were not active, many bowheads moved into the area close to
the inactive seismic vessel. Avoidance of the area of seismic operations did not persist beyond 12–24 h
after seismic shooting stopped. Preliminary analysis of recent data on traveling bowheads in the Alaskan
Beaufort Sea also showed a stronger tendency to avoid operating airguns than was evident for feeding
bowheads (Christie et al. 2009; Koski et al. 2009).
Bowhead whale calls detected in the presence and absence of airgun sounds have been studied
extensively in the Beaufort Sea. Early work on the summering grounds in the Canadian Beaufort Sea
showed that bowheads continue to produce calls of the usual types when exposed to airgun sounds,
although numbers of calls detected may be somewhat lower in the presence of airgun pulses (Richardson

Appendix B. Airgun Sounds and Marine Mammals
Environmental Assessment for L-DEO’s Shatsky Rise Seismic Survey, 2012 Page 125
et al. 1986). Studies during autumn in the Alaskan Beaufort Sea, one in 1996–1998 and another in 2007–
2008, have shown that numbers of calls detected are significantly lower in the presence than in the
absence of airgun pulses (Greene et al. 1999a,b; Blackwell et al. 2009a,b; Koski et al. 2009; see also
Nations et al. 2009). This decrease could have resulted from movement of the whales away from the area
of the seismic survey or a reduction in calling behavior, or a combination of the two. However, concur-
rent aerial surveys showed that there was strong avoidance of the operating airguns during the 1996–98
study, when most of the whales appeared to be migrating (Miller et al. 1999; Richardson et al. 1999). In
contrast, aerial surveys during the 2007–08 study showed less consistent avoidance by the bowheads,
many of which appeared to be feeding (Christie et al. 2009; Koski et al. 2009). The reduction in call
detection rates during periods of airgun operation may have been more dependent on actual avoidance
during the 1996–98 study and more dependent on reduced calling behavior during the 2007–08 study, but
further analysis of the recent data is ongoing.
There are no data on reactions of bowhead whales to seismic surveys in winter or spring.
Gray Whales.—Malme et al. (1986, 1988) studied the responses of feeding eastern gray whales to
pulses from a single 100-in3 airgun off St. Lawrence Island in the northern Bering Sea. They estimated,
based on small sample sizes, that 50% of feeding gray whales stopped feeding at an average received
pressure level of 173 dB re 1 Pa on an (approximate) rms basis, and that 10% of feeding whales inter-
rupted feeding at received levels of 163 dB re 1 Parms. Malme at al. (1986) estimated that an average
pressure level of 173 dB occurred at a range of 2.6–2.8 km from an airgun array with a source level of
250 dB re 1 µPapeak in the northern Bering Sea. These findings were generally consistent with the results
of studies conducted on larger numbers of gray whales migrating off California (Malme et al. 1984;
Malme and Miles 1985) and western Pacific gray whales feeding off Sakhalin, Russia (Würsig et al.
1999; Gailey et al. 2007; Johnson et al. 2007; Yazvenko et al. 2007a,b), along with a few data on gray
whales off British Columbia (Bain and Williams 2006).
Malme and Miles (1985) concluded that, during migration off California, gray whales showed
changes in swimming pattern with received levels of ~160 dB re 1 Pa and higher, on an approximate
rms basis. The 50% probability of avoidance was estimated to occur at a CPA distance of 2.5 km from a
4000-in³ airgun array operating off central California. This would occur at an average received sound
level of ~170 dB re 1 µParms. Some slight behavioral changes were noted when approaching gray whales
reached the distances where received sound levels were 140 to 160 dB re 1 µParms, but these whales
generally continued to approach (at a slight angle) until they passed the sound source at distances where
received levels averaged ~170 dB re 1 µParms (Malme et al. 1984; Malme and Miles 1985).
There was no indication that western gray whales exposed to seismic noise were displaced from
their overall feeding grounds near Sakhalin Island during seismic programs in 1997 (Würsig et al. 1999)
and in 2001 (Johnson et al. 2007; Meier et al. 2007; Yazvenko et al. 2007a). However, there were
indications of subtle behavioral effects among whales that remained in the areas exposed to airgun sounds
(Würsig et al. 1999; Gailey et al. 2007; Weller et al. 2006a). Also, there was evidence of localized redis-
tribution of some individuals within the nearshore feeding ground so as to avoid close approaches by the
seismic vessel (Weller et al. 2002, 2006b; Yazvenko et al. 2007a). Despite the evidence of subtle changes
in some quantitative measures of behavior and local redistribution of some individuals, there was no
apparent change in the frequency of feeding, as evident from mud plumes visible at the surface (Yaz-
venko et al. 2007b). The 2001 seismic program involved an unusually comprehensive combination of
real-time monitoring and mitigation measures designed to avoid exposing western gray whales to
received levels of sound above about 163 dB re 1 μParms (Johnson et al. 2007). The lack of strong avoid-

Appendix B. Airgun Sounds and Marine Mammals
Environmental Assessment for L-DEO’s Shatsky Rise Seismic Survey, 2012 Page 126
ance or other strong responses was presumably in part a result of the mitigation measures. Effects
probably would have been more significant without such intensive mitigation efforts.
Gray whales in British Columbia exposed to seismic survey sound levels up to ~170 dB re 1 μPa
did not appear to be strongly disturbed (Bain and Williams 2006). The few whales that were observed
moved away from the airguns but toward deeper water where sound levels were said to be higher due to
propagation effects (Bain and Williams 2006).
Rorquals.—Blue, sei, fin, and minke whales (all of which are members of the genus Balaenoptera)
often have been seen in areas ensonified by airgun pulses (Stone 2003; MacLean and Haley 2004; Stone
and Tasker 2006), and calls from blue and fin whales have been localized in areas with airgun operations
(e.g., McDonald et al. 1995; Dunn and Hernandez 2009). Sightings by observers on seismic vessels dur-
ing 110 large-source seismic surveys off the U.K. from 1997 to 2000 suggest that, during times of good
sightability, sighting rates for mysticetes (mainly fin and sei whales) were similar when large arrays of
airguns were shooting vs. silent (Stone 2003; Stone and Tasker 2006). However, these whales tended to
exhibit localized avoidance, remaining significantly further (on average) from the airgun array during
seismic operations compared with non-seismic periods (P = 0.0057; Stone and Tasker 2006). The
average CPA distances for baleen whales sighted when large airgun arrays were operating vs. silent were
about 1.6 vs. 1.0 km. Baleen whales, as a group, were more often oriented away from the vessel while a
large airgun array was shooting compared with periods of no shooting (P <0.05; Stone and Tasker 2006).
In addition, fin/sei whales were less likely to remain submerged during periods of seismic shooting (Stone
2003).
In a study off Nova Scotia, Moulton and Miller (2005) found little difference in sighting rates (after
accounting for water depth) and initial average sighting distances of balaenopterid whales when airguns
were operating (mean = 1324 m) vs. silent (mean = 1303 m). However, there were indications that these
whales were more likely to be moving away when seen during airgun operations. Baleen whales at the
average sighting distance during airgun operations would have been exposed to sound levels (via direct
path) of about 169 dB re 1 μParms (Moulton and Miller 2005). Similarly, ship-based monitoring studies of
blue, fin, sei and minke whales offshore of Newfoundland (Orphan Basin and Laurentian Sub-basin)
found no more than small differences in sighting rates and swim directions during seismic vs. non-seismic
periods (Moulton et al. 2005, 2006a,b). Analyses of CPA data yielded variable results.4 The authors of
the Newfoundland reports concluded that, based on observations from the seismic vessel, some mysti-
cetes exhibited localized avoidance of seismic operations (Moulton et al. 2005, 2006a).
Minke whales have occasionally been observed to approach active airgun arrays where received
sound levels were estimated to be near 170–180 dB re 1 µPa (McLean and Haley 2004).
Discussion and Conclusions.—Baleen whales generally tend to avoid operating airguns, but
avoidance radii are quite variable. Whales are often reported to show no overt reactions to airgun pulses
at distances beyond a few kilometers, even though the airgun pulses remain well above ambient noise
____________________________________
4 The CPA of baleen whales sighted from the seismic vessels was, on average, significantly closer during non-
seismic periods vs. seismic periods in 2004 in the Orphan Basin (means 1526 m vs. 2316 m, respectively; Moulton
et al. 2005). In contrast, mean distances without vs. with seismic did not differ significantly in 2005 in either the
Orphan Basin (means 973 m vs. 832 m, respectively; Moulton et al. 2006a) or in the Laurentian Sub-basin (means
1928 m vs. 1650 m, respectively; Moulton et al. 2006b). In both 2005 studies, mean distances were greater
(though not significantly so) without seismic.

Appendix B. Airgun Sounds and Marine Mammals
Environmental Assessment for L-DEO’s Shatsky Rise Seismic Survey, 2012 Page 127
levels out to much longer distances. However, studies done since the late 1990s of migrating humpback
and migrating bowhead whales show reactions, including avoidance, that sometimes extend to greater
distances than documented earlier. Avoidance distances often exceed the distances at which boat-based
observers can see whales, so observations from the source vessel can be biased. Observations over
broader areas may be needed to determine the range of potential effects of some large-source seismic
surveys where effects on cetaceans may extend to considerable distances (Richardson et al. 1999; Bain
and Williams 2006; Moore and Angliss 2006). Longer-range observations, when required, can sometimes
be obtained via systematic aerial surveys or aircraft-based observations of behavior (e.g., Richardson et
al. 1986, 1999; Miller et al. 1999, 2005; Yazvenko et al. 2007a,b) or by use of observers on one or more
support vessels operating in coordination with the seismic vessel (e.g., Smultea et al. 2004; Johnson et al.
2007). However, the presence of other vessels near the source vessel can, at least at times, reduce sight-
ability of cetaceans from the source vessel (Beland et al. 2009), thus complicating interpretation of
sighting data.
Some baleen whales show considerable tolerance of seismic pulses. However, when the pulses are
strong enough, avoidance or other behavioral changes become evident. Because the responses become
less obvious with diminishing received sound level, it has been difficult to determine the maximum
distance (or minimum received sound level) at which reactions to seismic become evident and, hence,
how many whales are affected.
Studies of gray, bowhead, and humpback whales have determined that received levels of pulses in
the 160–170 dB re 1 Parms range seem to cause obvious avoidance behavior in a substantial fraction of
the animals exposed. In many areas, seismic pulses diminish to these levels at distances ranging from 4
to 15 km from the source. A substantial proportion of the baleen whales within such distances may show
avoidance or other strong disturbance reactions to the operating airgun array. However, in other
situations, various mysticetes tolerate exposure to full-scale airgun arrays operating at even closer
distances, with only localized avoidance and minor changes in activities. At the other extreme, in
migrating bowhead whales, avoidance often extends to considerably larger distances (20–30 km) and
lower received sound levels (120–130 dB re 1 μParms). Also, even in cases where there is no conspicuous
avoidance or change in activity upon exposure to sound pulses from distant seismic operations, there are
sometimes subtle changes in behavior (e.g., surfacing–respiration–dive cycles) that are only evident
through detailed statistical analysis (e.g., Richardson et al. 1986; Gailey et al. 2007).
Mitigation measures for seismic surveys, especially nighttime seismic surveys, typically assume
that many marine mammals (at least baleen whales) tend to avoid approaching airguns, or the seismic
vessel itself, before being exposed to levels high enough for there to be any possibility of injury. This
assumes that the ramp-up (soft-start) procedure is used when commencing airgun operations, to give
whales near the vessel the opportunity to move away before they are exposed to sound levels that might
be strong enough to elicit TTS. As noted above, single-airgun experiments with three species of baleen
whales show that those species typically do tend to move away when a single airgun starts firing nearby,
which simulates the onset of a ramp up. The three species that showed avoidance when exposed to the onset
of pulses from a single airgun were gray whales (Malme et al. 1984, 1986, 1988); bowhead whales (Rich-
ardson et al. 1986; Ljungblad et al. 1988); and humpback whales (Malme et al. 1985; McCauley et al. 1998,
2000a,b). Since startup of a single airgun is equivalent to the start of a ramp-up (=soft start), this strongly
suggests that many baleen whales will begin to move away during the initial stages of a ramp-up.
Data on short-term reactions by cetaceans to impulsive noises are not necessarily indicative of
long-term or biologically significant effects. It is not known whether impulsive sounds affect reproduc-
Appendix B. Airgun Sounds and Marine Mammals
Environmental Assessment for L-DEO’s Shatsky Rise Seismic Survey, 2012 Page 128
tive rate or distribution and habitat use in subsequent days or years. However, gray whales have
continued to migrate annually along the west coast of North America despite intermittent seismic
exploration (and much ship traffic) in that area for decades (Appendix A in Malme et al. 1984; Richard-
son et al. 1995), and there has been a substantial increase in the population over recent decades (Allen and
Angliss 2010). The western Pacific gray whale population did not seem affected by a seismic survey in
its feeding ground during a prior year (Johnson et al. 2007). Similarly, bowhead whales have continued
to travel to the eastern Beaufort Sea each summer despite seismic exploration in their summer and autumn
range for many years (Richardson et al. 1987), and their numbers have increased notably (Allen and
Angliss 2010). Bowheads also have been observed over periods of days or weeks in areas ensonified
repeatedly by seismic pulses (Richardson et al. 1987; Harris et al. 2007). However, it is generally not
known whether the same individual bowheads were involved in these repeated observations (within and
between years) in strongly ensonified areas. In any event, in the absence of some unusual circumstances,
the history of coexistence between seismic surveys and baleen whales suggests that brief exposures to
sound pulses from any single seismic survey are unlikely to result in prolonged effects.
5.2 Toothed Whales
Little systematic information is available about reactions of toothed whales to noise pulses. Few
studies similar to the more extensive baleen whale/seismic pulse work summarized above have been
reported for toothed whales. However, there are recent systematic data on sperm whales (e.g., Gordon et
al. 2006; Madsen et al. 2006; Winsor and Mate 2006; Jochens et al. 2008; Miller et al. 2009). There is
also an increasing amount of information about responses of various odontocetes to seismic surveys based
on monitoring studies (e.g., Stone 2003; Smultea et al. 2004; Moulton and Miller 2005; Bain and
Williams 2006; Holst et al. 2006; Stone and Tasker 2006; Potter et al. 2007; Hauser et al. 2008; Holst and
Smultea 2008; Weir 2008a; Barkaszi et al. 2009; Richardson et al. 2009).
Delphinids (Dolphins and similar) and Monodontids (Beluga).—Seismic operators and marine
mammal observers on seismic vessels regularly see dolphins and other small toothed whales near
operating airgun arrays, but in general there is a tendency for most delphinids to show some avoidance of
operating seismic vessels (e.g., Goold 1996a,b,c; Calambokidis and Osmek 1998; Stone 2003; Moulton
and Miller 2005; Holst et al. 2006; Stone and Tasker 2006; Weir 2008a; Richardson et al. 2009; see also
Barkaszi et al. 2009). In most cases, the avoidance radii for delphinids appear to be small, on the order of
1 km or less, and some individuals show no apparent avoidance. Studies that have reported cases of small
toothed whales close to the operating airguns include Duncan (1985), Arnold (1996), Stone (2003), and
Holst et al. (2006). When a 3959 in3, 18-airgun array was firing off California, toothed whales behaved in
a manner similar to that observed when the airguns were silent (Arnold 1996). Some dolphins seem to be
attracted to the seismic vessel and floats, and some ride the bow wave of the seismic vessel even when a
large array of airguns is firing (e.g., Moulton and Miller 2005). Nonetheless, small toothed whales more
often tend to head away, or to maintain a somewhat greater distance from the vessel, when a large array
of airguns is operating than when it is silent (e.g., Stone and Tasker 2006; Weir 2008a).
Weir (2008b) noted that a group of short-finned pilot whales initially showed an avoidance
response to ramp up of a large airgun array, but that this response was limited in time and space.
Although the ramp-up procedure is a widely-used mitigation measure, it remains uncertain how effective
it is at alerting marine mammals (especially odontocetes) and causing them to move away from seismic
operations (Weir 2008b).

Appendix B. Airgun Sounds and Marine Mammals
Environmental Assessment for L-DEO’s Shatsky Rise Seismic Survey, 2012 Page 129
Goold (1996a,b,c) studied the effects on common dolphins of 2D seismic surveys in the Irish Sea.
Passive acoustic surveys were conducted from the ―guard ship‖ that towed a hydrophone. The results
indicated that there was a local displacement of dolphins around the seismic operation. However, obser-
vations indicated that the animals were tolerant of the sounds at distances outside a 1-km radius from the
airguns (Goold 1996a). Initial reports of larger-scale displacement were later shown to represent a normal
autumn migration of dolphins through the area, and were not attributable to seismic surveys (Goold
1996a,b,c).
The beluga is a species that (at least at times) shows long-distance avoidance of seismic vessels.
Aerial surveys conducted in the southeastern Beaufort Sea in summer found that sighting rates of belugas
were significantly lower at distances 10–20 km compared with 20–30 km from an operating airgun array
(Miller et al. 2005). The low number of beluga sightings by marine mammal observers on the vessel
seemed to confirm there was a strong avoidance response to the 2250 in3 airgun array. More recent seis-
mic monitoring studies in the same area have confirmed that the apparent displacement effect on belugas
extended farther than has been shown for other small odontocetes exposed to airgun pulses (e.g., Harris et
al. 2007).
Observers stationed on seismic vessels operating off the U.K. from 1997 to 2000 have provided
data on the occurrence and behavior of various toothed whales exposed to seismic pulses (Stone 2003;
Gordon et al. 2004; Stone and Tasker 2006). Dolphins of various species often showed more evidence of
avoidance of operating airgun arrays than has been reported previously for small odontocetes. Sighting
rates of white-sided dolphins, white-beaked dolphins, Lagenorhynchus spp., and all small odontocetes
combined were significantly lower during periods when large-volume5 airgun arrays were shooting.
Except for the pilot whale and bottlenose dolphin, CPA distances for all of the small odontocete species
tested, including killer whales, were significantly farther from large airgun arrays during periods of
shooting compared with periods of no shooting. Pilot whales were less responsive than other small
odontocetes in the presence of seismic surveys (Stone and Tasker 2006). For small odontocetes as a
group, and most individual species, orientations differed between times when large airgun arrays were
operating vs. silent, with significantly fewer animals traveling towards and/or more traveling away from
the vessel during shooting (Stone and Tasker 2006). Observers‘ records suggested that fewer cetaceans
were feeding and fewer were interacting with the survey vessel (e.g., bow-riding) during periods with
airguns operating, and small odontocetes tended to swim faster during periods of shooting (Stone and
Tasker 2006). For most types of small odontocetes sighted by observers on seismic vessels, the median
CPA distance was ≥0.5 km larger during airgun operations (Stone and Tasker 2006). Killer whales
appeared to be more tolerant of seismic shooting in deeper waters.
Data collected during seismic operations in the Gulf of Mexico and off Central America show
similar patterns. A summary of vessel-based monitoring data from the Gulf of Mexico during 2003–2008
showed that delphinids were generally seen farther from the vessel during seismic than during non-
seismic periods (based on Barkaszi et al. 2009, excluding sperm whales). Similarly, during two NSF-
funded L-DEO seismic surveys that used a large 20 airgun array (~7000 in3), sighting rates of delphinids
were lower and initial sighting distances were farther away from the vessel during seismic than non-
seismic periods (Smultea et al. 2004; Holst et al. 2005a, 2006; Richardson et al. 2009). Monitoring
results during a seismic survey in the Southeast Caribbean showed that the mean CPA of delphinids was
991 m during seismic operations vs. 172 m when the airguns were not operational (Smultea et al. 2004).
____________________________________
5 Large volume means at least 1300 in
3, with most (79%) at least 3000 in
3.

Appendix B. Airgun Sounds and Marine Mammals
Environmental Assessment for L-DEO’s Shatsky Rise Seismic Survey, 2012 Page 130
Surprisingly, nearly all acoustic detections via a towed passive acoustic monitoring (PAM) array,
including both delphinids and sperm whales, were made when the airguns were operating (Smultea et al.
2004). Although the number of sightings during monitoring of a seismic survey off the Yucatán
Peninsula, Mexico, was small (n = 19), the results showed that the mean CPA distance of delphinids there
was 472 m during seismic operations vs. 178 m when the airguns were silent (Holst et al. 2005a). The
acoustic detection rates were nearly 5 times higher during non-seismic compared with seismic operations
(Holst et al. 2005a).
For two additional NSF-funded L-DEO seismic surveys in the Eastern Tropical Pacific, both using
a large 36-airgun array (~6600 in3), the results are less easily interpreted (Richardson et al. 2009). During
both surveys, the delphinid detection rate was lower during seismic than during non-seismic periods, as
found in various other projects, but the mean CPA distance of delphinids was closer (not farther) during
seismic periods (Hauser et al. 2008; Holst and Smultea 2008).
During two seismic surveys off Newfoundland and Labrador in 2004–05, dolphin sighting rates
were lower during seismic periods than during non-seismic periods after taking temporal factors into
account, although the difference was statistically significant only in 2004 (Moulton et al. 2005, 2006a).
In 2005, the mean CPA distance of dolphins was significantly farther during seismic periods (807 vs.
652 m); in 2004, the corresponding difference was not significant.
Among Atlantic spotted dolphins off Angola (n = 16 useable groups), marked short-term and local-
ized displacement was found in response to seismic operations conducted with a 24-airgun array (3147 in3
or 5085 in3) (Weir 2008a). Sample sizes were low, but CPA distances of dolphin groups were
significantly larger when airguns were on (mean 1080 m) vs. off (mean 209 m). No Atlantic spotted
dolphins were seen within 500 m of the airguns when they were operating, whereas all sightings when
airguns were silent occurred within 500 m, including the only recorded ―positive approach‖ behaviors.
Reactions of toothed whales to a single airgun or other small airgun source are not well docu-
mented, but tend to be less substantial than reactions to large airgun arrays (e.g., Stone 2003; Stone and
Tasker 2006). During 91 site surveys off the U.K. in 1997–2000, sighting rates of all small odontocetes
combined were significantly lower during periods the low-volume6 airgun sources were operating, and
effects on orientation were evident for all species and groups tested (Stone and Tasker 2006). Results
from four NSF-funded L-DEO seismic surveys using small arrays (up to 3 GI guns and 315 in3) were
inconclusive. During surveys in the Eastern Tropical Pacific (Holst et al. 2005b) and in the Northwest
Atlantic (Haley and Koski 2004), detection rates were slightly lower during seismic compared to non-
seismic periods. However, mean CPAs were closer during seismic operations during one cruise (Holst et
al. 2005b), and greater during the other cruise (Haley and Koski 2004). Interpretation of the data was
confounded by the fact that survey effort and/or number of sightings during non-seismic periods during
both surveys was small. Results from another two small-array surveys were even more variable
(MacLean and Koski 2005; Smultea and Holst 2008).
Captive bottlenose dolphins and beluga whales exhibited changes in behavior when exposed to
strong pulsed sounds similar in duration to those typically used in seismic surveys (Finneran et al. 2000,
2002, 2005). Finneran et al. (2002) exposed a captive bottlenose dolphin and beluga to single impulses
from a water gun (80 in3). As compared with airgun pulses, water gun impulses were expected to contain
proportionally more energy at higher frequencies because there is no significant gas-filled bubble, and
____________________________________
6 For low volume arrays, maximum volume was 820 in
3, with most (87%) ≤180 in
3.

Appendix B. Airgun Sounds and Marine Mammals
Environmental Assessment for L-DEO’s Shatsky Rise Seismic Survey, 2012 Page 131
thus little low-frequency bubble-pulse energy (Hutchinson and Detrick 1984). The captive animals some-
times vocalized after exposure and exhibited reluctance to station at the test site where subsequent
exposure to impulses would be implemented (Finneran et al. 2002). Similar behaviors were exhibited by
captive bottlenose dolphins and a beluga exposed to single underwater pulses designed to simulate those
produced by distant underwater explosions (Finneran et al. 2000). It is uncertain what relevance these
observed behaviors in captive, trained marine mammals exposed to single transient sounds may have to
free-ranging animals exposed to multiple pulses. In any event, the animals tolerated rather high received
levels of sound before exhibiting the aversive behaviors mentioned above.
Odontocete responses (or lack of responses) to noise pulses from underwater explosions (as
opposed to airgun pulses) may be indicative of odontocete responses to very strong noise pulses. During
the 1950s, small explosive charges were dropped into an Alaskan river in attempts to scare belugas away
from salmon. Success was limited (Fish and Vania 1971; Frost et al. 1984). Small explosive charges
were ―not always effective‖ in moving bottlenose dolphins away from sites in the Gulf of Mexico where
larger demolition blasts were about to occur (Klima et al. 1988). Odontocetes may be attracted to fish
killed by explosions, and thus attracted rather than repelled by ―scare‖ charges. Captive false killer
whales showed no obvious reaction to single noise pulses from small (10 g) charges; the received level
was ~185 dB re 1 Pa (Akamatsu et al. 1993). Jefferson and Curry (1994) reviewed several additional
studies that found limited or no effects of noise pulses from small explosive charges on killer whales and
other odontocetes. Aside from the potential for causing auditory impairment (see below), the tolerance to
these charges may indicate a lack of effect, or the failure to move away may simply indicate a stronger
desire to feed, regardless of circumstances.
Phocoenids (Porpoises).—Porpoises, like delphinids, show variable reactions to seismic oper-
ations, and reactions apparently depend on species. The limited available data suggest that harbor
porpoises show stronger avoidance of seismic operations than Dall‘s porpoises (Stone 2003; MacLean
and Koski 2005; Bain and Williams 2006). In Washington State waters, the harbor porpoise―despite
being considered a high-frequency specialist―appeared to be the species affected by the lowest received
level of airgun sound (<145 dB re 1 μParms at a distance >70 km; Bain and Williams 2006). Similarly,
during seismic surveys with large airgun arrays off the U.K. in 1997–2000, there were significant
differences in directions of travel by harbor porpoises during periods when the airguns were shooting vs.
silent (Stone 2003; Stone and Tasker 2006). A captive harbor porpoise exposed to single sound pulses
from a small airgun showed aversive behavior upon receipt of a pulse with received level above 174 dB re
1 μPapk-pk or SEL >145 dB re 1 μPa2 · s (Lucke et al. 2009). In contrast, Dall‘s porpoises seem relatively
tolerant of airgun operations (MacLean and Koski 2005; Bain and Williams 2006), although they too have
been observed to avoid large arrays of operating airguns (Calambokidis and Osmek 1998; Bain and
Williams 2006). The apparent tendency for greater responsiveness in the harbor porpoise is consistent
with their relative responsiveness to boat traffic and some other acoustic sources (Richardson et al. 1995;
Southall et al. 2007).
Beaked Whales.—There are almost no specific data on the behavioral reactions of beaked whales
to seismic surveys. Most beaked whales tend to avoid approaching vessels of other types (e.g., Würsig et
al. 1998). They may also dive for an extended period when approached by a vessel (e.g., Kasuya 1986),
although it is uncertain how much longer such dives may be as compared to dives by undisturbed beaked
whales, which also are often quite long (Baird et al. 2006; Tyack et al. 2006b). In any event, it is likely
that most beaked whales would also show strong avoidance of an approaching seismic vessel, regardless
of whether or not the airguns are operating. However, this has not been documented explicitly. Northern
bottlenose whales sometimes are quite tolerant of slow-moving vessels not emitting airgun pulses (Reeves
Appendix B. Airgun Sounds and Marine Mammals
Environmental Assessment for L-DEO’s Shatsky Rise Seismic Survey, 2012 Page 132
et al. 1993; Hooker et al. 2001). The few detections (acoustic or visual) of northern bottlenose whales
from seismic vessels during recent seismic surveys off Nova Scotia have been during times when the
airguns were shut down; no detections were reported when the airguns were operating (Moulton and
Miller 2005; Potter et al. 2007). However, other visual and acoustic studies indicated that some northern
bottlenose whales remained in the general area and continued to produce high-frequency clicks when
exposed to sound pulses from distant seismic surveys (Gosselin and Lawson 2004; Laurinolli and Coch-
rane 2005; Simard et al. 2005).
There are increasing indications that some beaked whales tend to strand when military exercises
involving mid-frequency sonar operation are ongoing nearby (e.g., Simmonds and Lopez-Jurado 1991;
Frantzis 1998; NOAA and USN 2001; Jepson et al. 2003; Barlow and Gisiner 2006; see also the
―Strandings and Mortality‖ subsection, later). These strandings are apparently at least in part a distur-
bance response, although auditory or other injuries or other physiological effects may also be a factor.
Whether beaked whales would ever react similarly to seismic surveys is unknown. Seismic survey
sounds are quite different from those of the sonars in operation during the above-cited incidents. No
conclusive link has been established between seismic surveys and beaked whale strandings. There was a
stranding of two Cuvier‘s beaked whales in the Gulf of California (Mexico) in September 2002 when the
R/V Maurice Ewing was conducting a seismic survey in the general area (e.g., Malakoff 2002; Hilde-
brand 2005). However, NMFS did not establish a cause and effect relationship between this stranding
and the seismic survey activities (Hogarth 2002). Cox et al. (2006) noted the ―lack of knowledge regard-
ing the temporal and spatial correlation between the [stranding] and the sound source‖. Hildebrand
(2005) illustrated the approximate temporal-spatial relationships between the stranding and the Ewing‘s
tracks, but the time of the stranding was not known with sufficient precision for accurate determination of
the CPA distance of the whales to the Ewing. Another stranding of Cuvier‘s beaked whales in the
Galápagos occurred during a seismic survey in April 2000; however ―There is no obvious mechanism that
bridges the distance between this source and the stranding site‖ (Gentry [ed.] 2002).
Sperm Whales.—All three species of sperm whales have been reported to show avoidance reac-
tions to standard vessels not emitting airgun sounds (e.g., Richardson et al. 1995; Würsig et al. 1998;
McAlpine 2002; Baird 2005). However, most studies of the sperm whale Physeter macrocephalus expos-
ed to airgun sounds indicate that this species shows considerable tolerance of airgun pulses. The whales
usually do not show strong avoidance (i.e., they do not leave the area) and they continue to call.
There were some early and limited observations suggesting that sperm whales in the Southern
Ocean ceased calling during some (but not all) times when exposed to weak noise pulses from extremely
distant (>300 km) seismic exploration. However, other operations in the area could also have been a
factor (Bowles et al. 1994). This ―quieting‖ was suspected to represent a disturbance effect, in part
because sperm whales exposed to pulsed man-made sounds at higher frequencies often cease calling
(Watkins and Schevill 1975; Watkins et al. 1985). Also, there was an early preliminary account of
possible long-range avoidance of seismic vessels by sperm whales in the Gulf of Mexico (Mate et al.
1994). However, this has not been substantiated by subsequent more detailed work in that area (Gordon
et al. 2006; Winsor and Mate 2006; Jochens et al. 2008; Miller et al. 2009).
Recent and more extensive data from vessel-based monitoring programs in U.K. waters and off
Newfoundland and Angola suggest that sperm whales in those areas show little evidence of avoidance or
behavioral disruption in the presence of operating seismic vessels (Stone 2003; Stone and Tasker 2006;
Moulton et al. 2005, 2006a; Weir 2008a). Among sperm whales off Angola (n = 96 useable groups),
there were no significant differences in encounter rates (sightings/hr) when a 24-airgun array (3147 in3 or

Appendix B. Airgun Sounds and Marine Mammals
Environmental Assessment for L-DEO’s Shatsky Rise Seismic Survey, 2012 Page 133
5085 in3) was operating vs. silent (Weir 2008a). There was also no significant difference in the CPA
distances of the sperm whale sightings when airguns were on vs. off (means 3039 m vs. 2594 m,
respectively). Encounter rate tended to increase over the 10-month duration of the seismic survey. These
types of observations are difficult to interpret because the observers are stationed on or near the seismic
vessel, and may underestimate reactions by some of the more responsive animals, which may be beyond
visual range. However, these results do seem to show considerable tolerance of seismic surveys by at
least some sperm whales. Also, a study off northern Norway indicated that sperm whales continued to
call when exposed to pulses from a distant seismic vessel. Received levels of the seismic pulses were up
to 146 dB re 1 μPap-p (Madsen et al. 2002).
Similarly, a study conducted off Nova Scotia that analyzed recordings of sperm whale
vocalizations at various distances from an active seismic program did not detect any obvious changes in
the distribution or behavior of sperm whales (McCall Howard 1999).
Sightings of sperm whales by observers on seismic vessels operating in the Gulf of Mexico during
2003–2008 were at very similar average distances regardless of the airgun operating conditions (Barkaszi
et al. 2009). For example, the mean sighting distance was 1839 m when the airgun array was in full
operation (n=612) vs. 1960 m when all airguns were off (n=66).
A controlled study of the reactions of tagged sperm whales to seismic surveys was done recently in
the Gulf of Mexico ―
the Sperm Whale Seismic Study or SWSS (Gordon et al. 2006; Madsen et al. 2006;
Winsor and Mate 2006; Jochens et al. 2008; Miller et al. 2009). During SWSS, D-tags (Johnson and
Tyack 2003) were used to record the movement and acoustic exposure of eight foraging sperm whales
before, during, and after controlled exposures to sound from airgun arrays (Jochens et al. 2008; Miller et
al. 2009). Whales were exposed to maximum received sound levels of 111–147 dB re 1 μParms (131–162
dB re 1 μPapk-pk) at ranges of ~1.4–12.8 km from the sound source (Miller et al. 2009). Although the tag-
ged whales showed no discernible horizontal avoidance, some whales showed changes in diving and
foraging behavior during full-array exposure, possibly indicative of subtle negative effects on foraging
(Jochens et al. 2008; Miller et al. 2009; Tyack 2009). Two indications of foraging that they studied were
oscillations in pitch and occurrence of echolocation buzzes, both of which tend to occur when a sperm
whale closes-in on prey. "Oscillations in pitch generated by swimming movements during foraging dives
were on average 6% lower during exposure than during the immediately following post-exposure period,
with all 7 foraging whales exhibiting less pitching (P = 0.014). Buzz rates, a proxy for attempts to
capture prey, were 19% lower during exposure…" (Miller et al. 2009). Although the latter difference was
not statistically significant (P = 0.141), the percentage difference in buzz rate during exposure vs. post-
exposure conditions appeared to be strongly correlated with airgun-whale distance (Miller et al. 2009:
Fig. 5; Tyack 2009).
Discussion and Conclusions.—Dolphins and porpoises are often seen by observers on active
seismic vessels, occasionally at close distances (e.g., bow riding). However, some studies near the U.K.,
Newfoundland and Angola, in the Gulf of Mexico, and off Central America have shown localized avoid-
ance. Also, belugas summering in the Canadian Beaufort Sea showed larger-scale avoidance, tending to
avoid waters out to 10–20 km from operating seismic vessels. In contrast, recent studies show little
evidence of conspicuous reactions by sperm whales to airgun pulses, contrary to earlier indications.
There are almost no specific data on responses of beaked whales to seismic surveys, but it is likely
that most if not all species show strong avoidance. There is increasing evidence that some beaked whales
may strand after exposure to strong noise from sonars. Whether they ever do so in response to seismic
Appendix B. Airgun Sounds and Marine Mammals
Environmental Assessment for L-DEO’s Shatsky Rise Seismic Survey, 2012 Page 134
survey noise is unknown. Northern bottlenose whales seem to continue to call when exposed to pulses
from distant seismic vessels.
Overall, odontocete reactions to large arrays of airguns are variable and, at least for delphinids and
some porpoises, seem to be confined to a smaller radius than has been observed for some mysticetes.
However, other data suggest that some odontocetes species, including belugas and harbor porpoises, may
be more responsive than might be expected given their poor low-frequency hearing. Reactions at longer
distances may be particularly likely when sound propagation conditions are conducive to transmission of
the higher-frequency components of airgun sound to the animals‘ location (DeRuiter et al. 2006; Goold
and Coates 2006; Tyack et al. 2006a; Potter et al. 2007).
For delphinids, and possibly the Dall‘s porpoise, the available data suggest that a ≥170 dB re
1 µParms disturbance criterion (rather than ≥160 dB) would be appropriate. With a medium-to-large
airgun array, received levels typically diminish to 170 dB within 1–4 km, whereas levels typically remain
above 160 dB out to 4–15 km (e.g., Tolstoy et al. 2009). Reaction distances for delphinids are more
consistent with the typical 170 dB re 1 μParms distances. The 160 dB (rms) criterion currently applied by
NMFS was developed based primarily on data from gray and bowhead whales. Avoidance distances for
delphinids and Dall‘s porpoises tend to be shorter than for those two mysticete species. For delphinids
and Dall‘s porpoises, there is no indication of strong avoidance or other disruption of behavior at
distances beyond those where received levels would be ~170 dB re 1 μParms.
5.3 Pinnipeds
Few studies of the reactions of pinnipeds to noise from open-water seismic exploration have been
published (for review of the early literature, see Richardson et al. 1995). However, pinnipeds have been
observed during a number of seismic monitoring studies. Monitoring in the Beaufort Sea during 1996–
2002 provided a substantial amount of information on avoidance responses (or lack thereof) and
associated behavior. Additional monitoring of that type has been done in the Beaufort and Chukchi Seas
in 2006–2009. Pinnipeds exposed to seismic surveys have also been observed during seismic surveys
along the U.S. west coast. Some limited data are available on physiological responses of pinnipeds
exposed to seismic sound, as studied with the aid of radio telemetry. Also, there are data on the reactions
of pinnipeds to various other related types of impulsive sounds.
Early observations provided considerable evidence that pinnipeds are often quite tolerant of strong
pulsed sounds. During seismic exploration off Nova Scotia, gray seals exposed to noise from airguns and
linear explosive charges reportedly did not react strongly (J. Parsons in Greene et al. 1985). An airgun
caused an initial startle reaction among South African fur seals but was ineffective in scaring them away
from fishing gear (Anonymous 1975). Pinnipeds in both water and air sometimes tolerate strong noise
pulses from non-explosive and explosive scaring devices, especially if attracted to the area for feeding or
reproduction (Mate and Harvey 1987; Reeves et al. 1996). Thus, pinnipeds are expected to be rather tol-
erant of, or to habituate to, repeated underwater sounds from distant seismic sources, at least when the
animals are strongly attracted to the area.
In the U.K., a radio-telemetry study demonstrated short-term changes in the behavior of harbor
(=common) and gray seals exposed to airgun pulses (Thompson et al. 1998). Harbor seals were exposed
to seismic pulses from a 90-in3 array (3 30 in
3 airguns), and behavioral responses differed among
individuals. One harbor seal avoided the array at distances up to 2.5 km from the source and only
resumed foraging dives after seismic stopped. Another harbor seal exposed to the same small airgun
array showed no detectable behavioral response, even when the array was within 500 m. Gray seals

Appendix B. Airgun Sounds and Marine Mammals
Environmental Assessment for L-DEO’s Shatsky Rise Seismic Survey, 2012 Page 135
exposed to a single 10-in3 airgun showed an avoidance reaction: they moved away from the source,
increased swim speed and/or dive duration, and switched from foraging dives to predominantly transit
dives. These effects appeared to be short-term as gray seals either remained in, or returned at least once
to, the foraging area where they had been exposed to seismic pulses. These results suggest that there are
interspecific as well as individual differences in seal responses to seismic sounds.
Off California, visual observations from a seismic vessel showed that California sea lions ―typic-
ally ignored the vessel and array. When [they] displayed behavior modifications, they often appeared to
be reacting visually to the sight of the towed array. At times, California sea lions were attracted to the
array, even when it was on. At other times, these animals would appear to be actively avoiding the vessel
and array‖ (Arnold 1996). In Puget Sound, sighting distances for harbor seals and California sea lions
tended to be larger when airguns were operating; both species tended to orient away whether or not the
airguns were firing (Calambokidis and Osmek 1998). Bain and Williams (2006) also stated that their
small sample of harbor seals and sea lions tended to orient and/or move away upon exposure to sounds
from a large airgun array.
Monitoring work in the Alaskan Beaufort Sea during 1996–2001 provided considerable informa-
tion regarding the behavior of seals exposed to seismic pulses (Harris et al. 2001; Moulton and Lawson
2002). Those seismic projects usually involved arrays of 6–16 airguns with total volumes 560–1500 in3.
Subsequent monitoring work in the Canadian Beaufort Sea in 2001–2002, with a somewhat larger airgun
system (24 airguns, 2250 in3), provided similar results (Miller et al. 2005). The combined results suggest
that some seals avoid the immediate area around seismic vessels. In most survey years, ringed seal
sightings averaged somewhat farther away from the seismic vessel when the airguns were operating than
when they were not (Moulton and Lawson 2002). Also, seal sighting rates at the water surface were
lower during airgun array operations than during no-airgun periods in each survey year except 1997.
However, the avoidance movements were relatively small, on the order of 100 m to (at most) a few hun-
dreds of meters, and many seals remained within 100–200 m of the trackline as the operating airgun array
passed by.
The operation of the airgun array had minor and variable effects on the behavior of seals visible at
the surface within a few hundred meters of the airguns (Moulton and Lawson 2002). The behavioral data
indicated that some seals were more likely to swim away from the source vessel during periods of airgun
operations and more likely to swim towards or parallel to the vessel during non-seismic periods. No
consistent relationship was observed between exposure to airgun noise and proportions of seals engaged
in other recognizable behaviors, e.g., ―looked‖ and ―dove‖. Such a relationship might have occurred if
seals seek to reduce exposure to strong seismic pulses, given the reduced airgun noise levels close to the
surface where ―looking‖ occurs (Moulton and Lawson 2002).
Monitoring results from the Canadian Beaufort Sea during 2001–2002 were more variable (Miller
et al. 2005). During 2001, sighting rates of seals (mostly ringed seals) were similar during all seismic
states, including periods without airgun operations. However, seals tended to be seen closer to the vessel
during non-seismic than seismic periods. In contrast, during 2002, sighting rates of seals were higher
during non-seismic periods than seismic operations, and seals were seen farther from the vessel during
non-seismic compared to seismic activity (a marginally significant result). The combined data for both
years showed that sighting rates were higher during non-seismic periods compared to seismic periods, and
that sighting distances were similar during both seismic states. Miller et al. (2005) concluded that seals
showed very limited avoidance to the operating airgun array.

Appendix B. Airgun Sounds and Marine Mammals
Environmental Assessment for L-DEO’s Shatsky Rise Seismic Survey, 2012 Page 136
Vessel-based monitoring also took place in the Alaskan Chukchi and Beaufort seas during 2006–
2008 (Reiser et al. 2009). Observers on the seismic vessels saw phocid seals less frequently while airguns
were operating than when airguns were silent. Also, during airgun operations, those observers saw seals
less frequently than did observers on nearby vessels without airguns. Finally, observers on the latter ―no-
airgun‖ vessels saw seals more often when the nearby source vessels‘ airguns were operating than when
they were silent. All of these observations are indicative of a tendency for phocid seals to exhibit local-
ized avoidance of the seismic source vessel when airguns are firing (Reiser et al. 2009).
In summary, visual monitoring from seismic vessels has shown only slight (if any) avoidance of
airguns by pinnipeds, and only slight (if any) changes in behavior. These studies show that many pin-
nipeds do not avoid the area within a few hundred meters of an operating airgun array. However, based
on the studies with large sample size, or observations from a separate monitoring vessel, or radio telem-
etry, it is apparent that some phocid seals do show localized avoidance of operating airguns. The limited
nature of this tendency for avoidance is a concern. It suggests that one cannot rely on pinnipeds to move
away, or to move very far away, before received levels of sound from an approaching seismic survey
vessel approach those that may cause hearing impairment (see below).
5.4 Sirenians, Sea Otter and Polar Bear
We are not aware of any information on the reactions of sirenians to airgun sounds.
Behavior of sea otters along the California coast was monitored by Riedman (1983, 1984) while
they were exposed to a single 100 in3
airgun and a 4089 in3 airgun array. No disturbance reactions were
evident when the airgun array was as close as 0.9 km. Sea otters also did not respond noticeably to the
single airgun. These results suggest that sea otters may be less responsive to marine seismic pulses than
some other marine mammals, such as mysticetes and odontocetes (summarized above). Also, sea otters
spend a great deal of time at the surface feeding and grooming (Riedman 1983, 1984). While at the
surface, the potential noise exposure of sea otters would be much reduced by pressure-release and
interference (Lloyd‘s mirror) effects at the surface (Greene and Richardson 1988; Richardson et al. 1995).
Airgun effects on polar bears have not been studied. However, polar bears on the ice would be
largely unaffected by underwater sound. Sound levels received by polar bears in the water would be
attenuated because polar bears generally do not dive much below the surface and received levels of airgun
sounds are reduced near the surface because of the aforementioned pressure release and interference
effects at the water‘s surface.
6. Hearing Impairment and Other Physical Effects of Seismic Surveys
Temporary or permanent hearing impairment is a possibility when marine mammals are exposed to
very strong sounds. Temporary threshold shift (TTS) has been demonstrated and studied in certain
captive odontocetes and pinnipeds exposed to strong sounds (reviewed in Southall et al. 2007). However,
there has been no specific documentation of TTS let alone permanent hearing damage, i.e. permanent
threshold shift (PTS), in free-ranging marine mammals exposed to sequences of airgun pulses during
realistic field conditions. Current NMFS policy regarding exposure of marine mammals to high-level
sounds is that cetaceans and pinnipeds should not be exposed to impulsive sounds ≥180 and 190 dB re
1 Parms, respectively (NMFS 2000). Those criteria have been used in establishing the safety (=shut-
down) radii planned for numerous seismic surveys conducted under U.S. jurisdiction. However, those
criteria were established before there was any information about the minimum received levels of sounds
necessary to cause auditory impairment in marine mammals. As discussed below,

Appendix B. Airgun Sounds and Marine Mammals
Environmental Assessment for L-DEO’s Shatsky Rise Seismic Survey, 2012 Page 137
the 180-dB criterion for cetaceans is probably quite precautionary, i.e., lower than necessary to
avoid temporary auditory impairment let alone permanent auditory injury, at least for delphinids.
TTS is not injury and does not constitute ―Level A harassment‖ in U.S. MMPA terminology.
the minimum sound level necessary to cause permanent hearing impairment (―Level A harass-
ment‖) is higher, by a variable and generally unknown amount, than the level that induces barely-
detectable TTS.
the level associated with the onset of TTS is often considered to be a level below which there is
no danger of permanent damage. The actual PTS threshold is likely to be well above the level
causing onset of TTS (Southall et al. 2007).
Recommendations for new science-based noise exposure criteria for marine mammals, frequency-
weighting procedures, and related matters were published recently (Southall et al. 2007). Those recom-
mendations have not, as of late 2009, been formally adopted by NMFS for use in regulatory processes and
during mitigation programs associated with seismic surveys. However, some aspects of the recommenda-
tions have been taken into account in certain EISs and small-take authorizations. NMFS has indicated
that it may issue new noise exposure criteria for marine mammals that account for the now-available
scientific data on TTS, the expected offset between the TTS and PTS thresholds, differences in the
acoustic frequencies to which different marine mammal groups are sensitive, and other relevant factors.
Preliminary information about possible changes in the regulatory and mitigation requirements, and about
the possible structure of new criteria, was given by Wieting (2004) and NMFS (2005).
Several aspects of the monitoring and mitigation measures that are now often implemented during
seismic survey projects are designed to detect marine mammals occurring near the airgun array, and to
avoid exposing them to sound pulses that might, at least in theory, cause hearing impairment. In addition,
many cetaceans and (to a limited degree) pinnipeds show some avoidance of the area where received
levels of airgun sound are high enough such that hearing impairment could potentially occur. In those
cases, the avoidance responses of the animals themselves will reduce or (most likely) avoid the possibility
of hearing impairment.
Non-auditory physical effects may also occur in marine mammals exposed to strong underwater
pulsed sound. Possible types of non-auditory physiological effects or injuries that might (in theory) occur
include stress, neurological effects, bubble formation, and other types of organ or tissue damage. It is
possible that some marine mammal species (i.e., beaked whales) may be especially susceptible to injury
and/or stranding when exposed to strong pulsed sounds. The following subsections summarize available
data on noise-induced hearing impairment and non-auditory physical effects.
6.1 Temporary Threshold Shift (TTS)
TTS is the mildest form of hearing impairment that can occur during exposure to a strong sound
(Kryter 1985). While experiencing TTS, the hearing threshold rises and a sound must be stronger in order
to be heard. It is a temporary phenomenon, and (especially when mild) is not considered to represent
physical damage or ―injury‖ (Southall et al. 2007). Rather, the onset of TTS is an indicator that, if the
animal is exposed to higher levels of that sound, physical damage is ultimately a possibility.
The magnitude of TTS depends on the level and duration of noise exposure, and to some degree on
frequency, among other considerations (Kryter 1985; Richardson et al. 1995; Southall et al. 2007). For
sound exposures at or somewhat above the TTS threshold, hearing sensitivity recovers rapidly after
exposure to the noise ends. In terrestrial mammals, TTS can last from minutes or hours to (in cases of

Appendix B. Airgun Sounds and Marine Mammals
Environmental Assessment for L-DEO’s Shatsky Rise Seismic Survey, 2012 Page 138
strong TTS) days. Only a few data have been obtained on sound levels and durations necessary to elicit
mild TTS in marine mammals (none in mysticetes), and none of the published data concern TTS elicited
by exposure to multiple pulses of sound during operational seismic surveys (Southall et al. 2007).
Toothed Whales.—There are empirical data on the sound exposures that elicit onset of TTS in
captive bottlenose dolphins and belugas. The majority of these data concern non-impulse sound, but there
are some limited published data concerning TTS onset upon exposure to a single pulse of sound from a
watergun (Finneran et al. 2002). A detailed review of all TTS data from marine mammals can be found
in Southall et al. (2007). The following summarizes some of the key results from odontocetes.
Recent information corroborates earlier expectations that the effect of exposure to strong transient
sounds is closely related to the total amount of acoustic energy that is received. Finneran et al. (2005)
examined the effects of tone duration on TTS in bottlenose dolphins. Bottlenose dolphins were exposed
to 3 kHz tones (non-impulsive) for periods of 1, 2, 4 or 8 s, with hearing tested at 4.5 kHz. For 1-s
exposures, TTS occurred with SELs of 197 dB, and for exposures >1 s, SEL >195 dB resulted in TTS
(SEL is equivalent to energy flux, in dB re 1 μPa2 · s). At an SEL of 195 dB, the mean TTS (4 min after
exposure) was 2.8 dB. Finneran et al. (2005) suggested that an SEL of 195 dB is the likely threshold for
the onset of TTS in dolphins and belugas exposed to tones of durations 1–8 s (i.e., TTS onset occurs at a
near-constant SEL, independent of exposure duration). That implies that, at least for non-impulsive tones,
a doubling of exposure time results in a 3 dB lower TTS threshold.
The assumption that, in marine mammals, the occurrence and magnitude of TTS is a function of
cumulative acoustic energy (SEL) is probably an oversimplification. Kastak et al. (2005) reported prelim-
inary evidence from pinnipeds that, for prolonged non-impulse noise, higher SELs were required to elicit
a given TTS if exposure duration was short than if it was longer, i.e., the results were not fully consistent
with an equal-energy model to predict TTS onset. Mooney et al. (2009a) showed this in a bottlenose dol-
phin exposed to octave-band non-impulse noise ranging from 4 to 8 kHz at SPLs of 130 to 178 dB re
1 Pa for periods of 1.88 to 30 min. Higher SELs were required to induce a given TTS if exposure
duration short than if it was longer. Exposure of the aforementioned bottlenose dolphin to a sequence of
brief sonar signals showed that, with those brief (but non-impulse) sounds, the received energy (SEL)
necessary to elicit TTS was higher than was the case with exposure to the more prolonged octave-band
noise (Mooney et al. 2009b). Those authors concluded that, when using (non-impulse) acoustic signals of
duration ~0.5 s, SEL must be at least 210–214 dB re 1 μPa2 · s to induce TTS in the bottlenose dolphin.
On the other hand, the TTS threshold for odontocetes exposed to a single impulse from a watergun
(Finneran et al. 2002) appeared to be somewhat lower than for exposure to non-impulse sound. This was
expected, based on evidence from terrestrial mammals showing that broadband pulsed sounds with rapid
rise times have greater auditory effect than do non-impulse sounds (Southall et al. 2007). The received
energy level of a single seismic pulse that caused the onset of mild TTS in the beluga, as measured
without frequency weighting, was ~186 dB re 1 µPa2 · s or 186 dB SEL (Finneran et al. 2002).
7 The rms
level of an airgun pulse (in dB re 1 μPa measured over the duration of the pulse) is typically 10–15 dB
higher than the SEL for the same pulse when received within a few kilometers of the airguns. Thus, a
single airgun pulse might need to have a received level of ~196–201 dB re 1 µParms in order to produce
brief, mild TTS. Exposure to several strong seismic pulses that each has a flat-weighted received level
____________________________________
7 If the low-frequency components of the watergun sound used in the experiments of Finneran et al. (2002) are
downweighted as recommended by Southall et al. (2007) using their Mmf-weighting curve, the effective exposure
level for onset of mild TTS was 183 dB re 1 μPa2 · s (Southall et al. 2007).
Appendix B. Airgun Sounds and Marine Mammals
Environmental Assessment for L-DEO’s Shatsky Rise Seismic Survey, 2012 Page 139
near 190 dBrms (175–180 dB SEL) could result in cumulative exposure of ~186 dB SEL (flat-weighted) or
~183 dB SEL (Mmf-weighted), and thus slight TTS in a small odontocete. That assumes that the TTS
threshold upon exposure to multiple pulses is (to a first approximation) a function of the total received
pulse energy, without allowance for any recovery between pulses.
The above TTS information for odontocetes is derived from studies on the bottlenose dolphin and
beluga. For the one harbor porpoise tested, the received level of airgun sound that elicited onset of TTS
was lower. The animal was exposed to single pulses from a small (20 in3) airgun, and auditory evoked
potential methods were used to test the animal‘s hearing sensitivity at frequencies of 4, 32, or 100 kHz
after each exposure (Lucke et al. 2009). Based on the measurements at 4 kHz, TTS occurred upon expo-
sure to one airgun pulse with received level ~200 dB re 1 μPapk-pk or an SEL of 164.3 dB re 1 µPa2 · s. If
these results from a single animal are representative, it is inappropriate to assume that onset of TTS
occurs at similar received levels in all odontocetes (cf. Southall et al. 2007). Some cetaceans may incur
TTS at lower sound exposures than are necessary to elicit TTS in the beluga or bottlenose dolphin.
Insofar as we are aware, there are no published data confirming that the auditory effect of a
sequence of airgun pulses received by an odontocete is a function of their cumulative energy. Southall et
al. (2007) consider that to be a reasonable, but probably somewhat precautionary, assumption. It is pre-
cautionary because, based on data from terrestrial mammals, one would expect that a given energy expo-
sure would have somewhat less effect if separated into discrete pulses, with potential opportunity for
partial auditory recovery between pulses. However, as yet there has been little study of the rate of recov-
ery from TTS in marine mammals, and in humans and other terrestrial mammals the available data on
recovery are quite variable. Southall et al. (2007) concluded that―until relevant data on recovery are
available from marine mammals―it is appropriate not to allow for any assumed recovery during the
intervals between pulses within a pulse sequence.
Additional data are needed to determine the received sound levels at which small odontocetes
would start to incur TTS upon exposure to repeated, low-frequency pulses of airgun sound with variable
received levels. To determine how close an airgun array would need to approach in order to elicit TTS, it
is necessary to determine the total energy that a mammal would receive as an airgun array approaches,
passes at various CPA distances, and moves away (e.g., Erbe and King 2009). At the present state of
knowledge, it is also necessary to assume that the effect is directly related to total received energy even
though that energy is received in multiple pulses separated by gaps. The lack of data on the exposure
levels necessary to cause TTS in toothed whales when the signal is a series of pulsed sounds, separated by
silent periods, remains a data gap, as is the lack of published data on TTS in odontocetes other than the
beluga, bottlenose dolphin, and harbor porpoise.
Baleen Whales.—There are no data, direct or indirect, on levels or properties of sound that are
required to induce TTS in any baleen whale. The frequencies to which mysticetes are most sensitive are
assumed to be lower than those to which odontocetes are most sensitive, and natural background noise
levels at those low frequencies tend to be higher. As a result, auditory thresholds of baleen whales within
their frequency band of best hearing are believed to be higher (less sensitive) than are those of odonto-
cetes at their best frequencies (Clark and Ellison 2004). From this, it is suspected that received levels
causing TTS onset may also be higher in mysticetes (Southall et al. 2007). However, based on prelim-
inary simulation modeling that attempted to allow for various uncertainties in assumptions and variability
around population means, Gedamke et al. (2008) suggested that some baleen whales whose closest point
of approach to a seismic vessel is 1 km or more could experience TTS or even PTS.

Appendix B. Airgun Sounds and Marine Mammals
Environmental Assessment for L-DEO’s Shatsky Rise Seismic Survey, 2012 Page 140
In practice during seismic surveys, few if any cases of TTS are expected given the strong likeli-
hood that baleen whales would avoid the approaching airguns (or vessel) before being exposed to levels
high enough for there to be any possibility of TTS (see above for evidence concerning avoidance respon-
ses by baleen whales). This assumes that the ramp-up (soft-start) procedure is used when commencing
airgun operations, to give whales near the vessel the opportunity to move away before they are exposed to
sound levels that might be strong enough to elicit TTS. As discussed earlier, single-airgun experiments
with bowhead, gray, and humpback whales show that those species do tend to move away when a single
airgun starts firing nearby, which simulates the onset of a ramp up.
Pinnipeds.—In pinnipeds, TTS thresholds associated with exposure to brief pulses (single or
multiple) of underwater sound have not been measured. Two California sea lions did not incur TTS when
exposed to single brief pulses with received levels of ~178 and 183 dB re 1 µParms and total energy fluxes
of 161 and 163 dB re 1 μPa2 · s (Finneran et al. 2003). However, initial evidence from more prolonged
(non-pulse) exposures suggested that some pinnipeds (harbor seals in particular) incur TTS at somewhat
lower received levels than do small odontocetes exposed for similar durations (Kastak et al. 1999, 2005;
Ketten et al. 2001). Kastak et al. (2005) reported that the amount of threshold shift increased with
increasing SEL in a California sea lion and harbor seal. They noted that, for non-impulse sound, doubling
the exposure duration from 25 to 50 min (i.e., a +3 dB change in SEL) had a greater effect on TTS than an
increase of 15 dB (95 vs. 80 dB) in exposure level. Mean threshold shifts ranged from 2.9–12.2 dB, with
full recovery within 24 hr (Kastak et al. 2005). Kastak et al. (2005) suggested that, for non-impulse
sound, SELs resulting in TTS onset in three species of pinnipeds may range from 183 to 206 dB re
1 μPa2 ·
s, depending on the absolute hearing sensitivity.
As noted above for odontocetes, it is expected that—for impulse as opposed to non-impulse
sound—the onset of TTS would occur at a lower cumulative SEL given the assumed greater auditory
effect of broadband impulses with rapid rise times. The threshold for onset of mild TTS upon exposure of
a harbor seal to impulse sounds has been estimated indirectly as being an SEL of ~171 dB re 1 μPa2 ·
s
(Southall et al. 2007). That would be approximately equivalent to a single pulse with received level
~181–186 dB re 1 μParms, or a series of pulses for which the highest rms values are a few dB lower.
At least for non-impulse sounds, TTS onset occurs at appreciably higher received levels in Cal-
ifornia sea lions and northern elephant seals than in harbor seals (Kastak et al. 2005). Thus, the former
two species would presumably need to be closer to an airgun array than would a harbor seal before TTS is
a possibility. Insofar as we are aware, there are no data to indicate whether the TTS thresholds of other
pinniped species are more similar to those of the harbor seal or to those of the two less-sensitive species.
Sirenians, Sea Otter and Polar Bear.―There are no available data on TTS in sea otters and polar
bears. However, TTS is unlikely to occur in sea otters or polar bears if they are on the water surface,
given the pressure release and Lloyd‘s mirror effects at the water‘s surface. Furthermore, sea otters tend
to inhabit shallow coastal habitats where large seismic survey vessels towing large spreads of streamers
may be unable to operate. TTS is also considered unlikely to occur in sirenians as a result of exposure to
sounds from a seismic survey. They, like sea otters, tend to inhabit shallow coastal habitats and rarely
range far from shore, whereas seismic survey vessels towing large arrays of airguns and (usually) even
larger arrays of streamers normally must remain farther offshore because of equipment clearance and
maneuverability limitations. Exposures of sea otters and sirenians to seismic surveys are more likely to
involve smaller seismic sources that can be used in shallow and confined waters. The impacts of these
are inherently less than would occur from a larger source of the types often used farther offshore.

Appendix B. Airgun Sounds and Marine Mammals
Environmental Assessment for L-DEO’s Shatsky Rise Seismic Survey, 2012 Page 141
Likelihood of Incurring TTS.—Most cetaceans show some degree of avoidance of seismic vessels
operating an airgun array (see above). It is unlikely that these cetaceans would be exposed to airgun
pulses at a sufficiently high level for a sufficiently long period to cause more than mild TTS, given the
relative movement of the vessel and the marine mammal. TTS would be more likely in any odontocetes
that bow- or wake-ride or otherwise linger near the airguns. However, while bow- or wake-riding,
odontocetes would be at the surface and thus not exposed to strong sound pulses given the pressure-
release and Lloyd Mirror effects at the surface. But if bow- or wake-riding animals were to dive
intermittently near airguns, they would be exposed to strong sound pulses, possibly repeatedly.
If some cetaceans did incur mild or moderate TTS through exposure to airgun sounds in this
manner, this would very likely be a temporary and reversible phenomenon. However, even a temporary
reduction in hearing sensitivity could be deleterious in the event that, during that period of reduced
sensitivity, a marine mammal needed its full hearing sensitivity to detect approaching predators, or for
some other reason.
Some pinnipeds show avoidance reactions to airguns, but their avoidance reactions are generally
not as strong or consistent as those of cetaceans. Pinnipeds occasionally seem to be attracted to operating
seismic vessels. There are no specific data on TTS thresholds of pinnipeds exposed to single or multiple
low-frequency pulses. However, given the indirect indications of a lower TTS threshold for the harbor
seal than for odontocetes exposed to impulse sound (see above), it is possible that some pinnipeds close to
a large airgun array could incur TTS.
NMFS (1995, 2000) concluded that cetaceans should not be exposed to pulsed underwater noise at
received levels >180 dB re 1 µParms. The corresponding limit for pinnipeds has been set by NMFS at 190
dB, although the HESS Team (HESS 1999) recommended a 180-dB limit for pinnipeds in California.
The 180 and 190 dB re 1 µParms levels have not been considered to be the levels above which TTS might
occur. Rather, they were the received levels above which, in the view of a panel of bioacoustics special-
ists convened by NMFS before TTS measurements for marine mammals started to become available, one
could not be certain that there would be no injurious effects, auditory or otherwise, to marine mammals.
As summarized above, data that are now available imply that TTS is unlikely to occur in various odonto-
cetes (and probably mysticetes as well) unless they are exposed to a sequence of several airgun pulses
stronger than 190 dB re 1 µParms. On the other hand, for the harbor seal, harbor porpoise, and perhaps
some other species, TTS may occur upon exposure to one or more airgun pulses whose received level
equals the NMFS ―do not exceed‖ value of 190 dB re 1 μParms. That criterion corresponds to a single-
pulse SEL of 175–180 dB re 1 μPa2 ·
s in typical conditions, whereas TTS is suspected to be possible in
harbor seals and harbor porpoises with a cumulative SEL of ~171 and ~164 dB re 1 μPa2 ·
s, respectively.
It has been shown that most large whales and many smaller odontocetes (especially the harbor por-
poise) show at least localized avoidance of ships and/or seismic operations (see above). Even when
avoidance is limited to the area within a few hundred meters of an airgun array, that should usually be
sufficient to avoid TTS based on what is currently known about thresholds for TTS onset in cetaceans. In
addition, ramping up airgun arrays, which is standard operational protocol for many seismic operators,
should allow cetaceans near the airguns at the time of startup (if the sounds are aversive) to move away
from the seismic source and to avoid being exposed to the full acoustic output of the airgun array (see
above). Thus, most baleen whales likely will not be exposed to high levels of airgun sounds provided the
ramp-up procedure is applied. Likewise, many odontocetes close to the trackline are likely to move away
before the sounds from an approaching seismic vessel become sufficiently strong for there to be any
potential for TTS or other hearing impairment. Therefore, there is little potential for baleen whales or

Appendix B. Airgun Sounds and Marine Mammals
Environmental Assessment for L-DEO’s Shatsky Rise Seismic Survey, 2012 Page 142
odontocetes that show avoidance of ships or airguns to be close enough to an airgun array to experience
TTS. In the event that a few individual cetaceans did incur TTS through exposure to strong airgun
sounds, this is a temporary and reversible phenomenon unless the exposure exceeds the TTS-onset
threshold by a sufficient amount for PTS to be incurred (see below). If TTS but not PTS were incurred, it
would most likely be mild, in which case recovery is expected to be quick (probably within minutes).
6.2 Permanent Threshold Shift (PTS)
When PTS occurs, there is physical damage to the sound receptors in the ear. In some cases, there
can be total or partial deafness, whereas in other cases, the animal has an impaired ability to hear sounds
in specific frequency ranges (Kryter 1985). Physical damage to a mammal‘s hearing apparatus can occur
if it is exposed to sound impulses that have very high peak pressures, especially if they have very short
rise times. (Rise time is the interval required for sound pressure to increase from the baseline pressure to
peak pressure.)
There is no specific evidence that exposure to pulses of airgun sound can cause PTS in any marine
mammal, even with large arrays of airguns. However, given the likelihood that some mammals close to
an airgun array might incur at least mild TTS (see above), there has been further speculation about the
possibility that some individuals occurring very close to airguns might incur PTS (e.g., Richardson et al.
1995, p. 372ff; Gedamke et al. 2008). Single or occasional occurrences of mild TTS are not indicative of
permanent auditory damage, but repeated or (in some cases) single exposures to a level well above that
causing TTS onset might elicit PTS.
Relationships between TTS and PTS thresholds have not been studied in marine mammals, but are
assumed to be similar to those in humans and other terrestrial mammals (Southall et al. 2007). Based on
data from terrestrial mammals, a precautionary assumption is that the PTS threshold for impulse sounds
(such as airgun pulses as received close to the source) is at least 6 dB higher than the TTS threshold on a
peak-pressure basis, and probably >6 dB higher (Southall et al. 2007). The low-to-moderate levels of
TTS that have been induced in captive odontocetes and pinnipeds during controlled studies of TTS have
been confirmed to be temporary, with no measurable residual PTS (Kastak et al. 1999; Schlundt et al.
2000; Finneran et al. 2002, 2005; Nachtigall et al. 2003, 2004). However, very prolonged exposure to
sound strong enough to elicit TTS, or shorter-term exposure to sound levels well above the TTS
threshold, can cause PTS, at least in terrestrial mammals (Kryter 1985). In terrestrial mammals, the
received sound level from a single non-impulsive sound exposure must be far above the TTS threshold for
any risk of permanent hearing damage (Kryter 1994; Richardson et al. 1995; Southall et al. 2007). How-
ever, there is special concern about strong sounds whose pulses have very rapid rise times. In terrestrial
mammals, there are situations when pulses with rapid rise times (e.g., from explosions) can result in PTS
even though their peak levels are only a few dB higher than the level causing slight TTS. The rise time of
airgun pulses is fast, but not as fast as that of an explosion.
Some factors that contribute to onset of PTS, at least in terrestrial mammals, are as follows:
exposure to single very intense sound,
fast rise time from baseline to peak pressure,
repetitive exposure to intense sounds that individually cause TTS but not PTS, and
recurrent ear infections or (in captive animals) exposure to certain drugs.

Appendix B. Airgun Sounds and Marine Mammals
Environmental Assessment for L-DEO’s Shatsky Rise Seismic Survey, 2012 Page 143
Cavanagh (2000) reviewed the thresholds used to define TTS and PTS. Based on this review and
SACLANT (1998), it is reasonable to assume that PTS might occur at a received sound level 20 dB or
more above that inducing mild TTS. However, for PTS to occur at a received level only 20 dB above the
TTS threshold, the animal probably would have to be exposed to a strong sound for an extended period,
or to a strong sound with rather rapid rise time.
More recently, Southall et al. (2007) estimated that received levels would need to exceed the TTS
threshold by at least 15 dB, on an SEL basis, for there to be risk of PTS. Thus, for cetaceans exposed to a
sequence of sound pulses, they estimate that the PTS threshold might be an M-weighted SEL (for the
sequence of received pulses) of ~198 dB re 1 μPa2 ·
s (15 dB higher than the Mmf-weighted TTS threshold,
in a beluga, for a watergun impulse). Additional assumptions had to be made to derive a corresponding
estimate for pinnipeds, as the only available data on TTS-thresholds in pinnipeds pertained to non-
impulse sound (see above). Southall et al. (2007) estimated that the PTS threshold could be a cumulative
Mpw-weighted SEL of ~186 dB re 1 μPa2 ·
s in the case of a harbor seal exposed to impulse sound. The
PTS threshold for the California sea lion and northern elephant seal would probably be higher given the
higher TTS thresholds in those species. Southall et al. (2007) also note that, regardless of the SEL, there
is concern about the possibility of PTS if a cetacean or pinniped received one or more pulses with peak
pressure exceeding 230 or 218 dB re 1 μPa, respectively. Thus, PTS might be expected upon exposure of
cetaceans to either SEL ≥198 dB re 1 μPa2 ·
s or peak pressure ≥230 dB re 1 μPa. Corresponding propos-
ed dual criteria for pinnipeds (at least harbor seals) are ≥186 dB SEL and ≥ 218 dB peak pressure (South-
all et al. 2007). These estimates are all first approximations, given the limited underlying data, assump-
tions, species differences, and evidence that the ―equal energy‖ model is not be entirely correct.
Sound impulse duration, peak amplitude, rise time, number of pulses, and inter-pulse interval are
the main factors thought to determine the onset and extent of PTS. Ketten (1994) has noted that the
criteria for differentiating the sound pressure levels that result in PTS (or TTS) are location and species-
specific. PTS effects may also be influenced strongly by the health of the receiver‘s ear.
As described above for TTS, in estimating the amount of sound energy required to elicit the onset
of TTS (and PTS), it is assumed that the auditory effect of a given cumulative SEL from a series of pulses
is the same as if that amount of sound energy were received as a single strong sound. There are no data
from marine mammals concerning the occurrence or magnitude of a potential partial recovery effect
between pulses. In deriving the estimates of PTS (and TTS) thresholds quoted here, Southall et al. (2007)
made the precautionary assumption that no recovery would occur between pulses.
The TTS section (above) concludes that exposure to several strong seismic pulses that each have
flat-weighted received levels near 190 dB re 1 μParms (175–180 dB re 1 μPa2 · s SEL) could result in
cumulative exposure of ~186 dB SEL (flat-weighted) or ~183 dB SEL (Mmf-weighted), and thus slight
TTS in a small odontocete. Allowing for the assumed 15 dB offset between PTS and TTS thresholds,
expressed on an SEL basis, exposure to several strong seismic pulses that each have flat-weighted
received levels near 205 dBrms (190–195 dB SEL) could result in cumulative exposure of ~198 dB SEL
(Mmf-weighted), and thus slight PTS in a small odontocete. However, the levels of successive pulses that
will be received by a marine mammal that is below the surface as a seismic vessel approaches, passes and
moves away will tend to increase gradually and then decrease gradually, with periodic decreases super-
imposed on this pattern when the animal comes to the surface to breathe. To estimate how close an
odontocete‘s CPA distance would have to be for the cumulative SEL to exceed 198 dB SEL (Mmf-
weighted), one would (as a minimum) need to allow for the sequence of distances at which airgun shots

Appendix B. Airgun Sounds and Marine Mammals
Environmental Assessment for L-DEO’s Shatsky Rise Seismic Survey, 2012 Page 144
would occur, and for the dependence of received SEL on distance in the region of the seismic operation
(e.g., Erbe and King 2009).
It is unlikely that an odontocete would remain close enough to a large airgun array for sufficiently
long to incur PTS. There is some concern about bowriding odontocetes, but for animals at or near the
surface, auditory effects are reduced by Lloyd‘s mirror and surface release effects. The presence of the
vessel between the airgun array and bow-riding odontocetes could also, in some but probably not all
cases, reduce the levels received by bow-riding animals (e.g., Gabriele and Kipple 2009). The TTS (and
thus PTS) thresholds of baleen whales are unknown but, as an interim measure, assumed to be no lower
than those of odontocetes. Also, baleen whales generally avoid the immediate area around operating
seismic vessels, so it is unlikely that a baleen whale could incur PTS from exposure to airgun pulses. The
TTS (and thus PTS) thresholds of some pinnipeds (e.g., harbor seal) as well as the harbor porpoise may
be lower (Kastak et al. 2005; Southall et al. 2007; Lucke et al. 2009). If so, TTS and potentially PTS may
extend to a somewhat greater distance for those animals. Again, Lloyd‘s mirror and surface release
effects will ameliorate the effects for animals at or near the surface.
Although it is unlikely that airgun operations during most seismic surveys would cause PTS in
many marine mammals, caution is warranted given
the limited knowledge about noise-induced hearing damage in marine mammals, particularly
baleen whales, pinnipeds, and sea otters;
the seemingly greater susceptibility of certain species (e.g., harbor porpoise and harbor seal) to
TTS and presumably also PTS; and
the lack of knowledge about TTS and PTS thresholds in many species, including various species
closely related to the harbor porpoise and harbor seal.
The avoidance reactions of many marine mammals, along with commonly-applied monitoring and
mitigation measures (visual and passive acoustic monitoring, ramp ups, and power downs or shut downs
when mammals are detected within or approaching the ―safety radii‖), would reduce the already-low
probability of exposure of marine mammals to sounds strong enough to induce PTS.
6.3 Strandings and Mortality
Marine mammals close to underwater detonations of high explosives can be killed or severely
injured, and the auditory organs are especially susceptible to injury (Ketten et al. 1993; Ketten 1995).
However, explosives are no longer used in marine waters for commercial seismic surveys or (with rare
exceptions) for seismic research; they have been replaced by airguns and other non-explosive sources.
Airgun pulses are less energetic and have slower rise times, and there is no specific evidence that they can
cause serious injury, death, or stranding even in the case of large airgun arrays. However, the association
of mass strandings of beaked whales with naval exercises and, in one case, a seismic survey (Malakoff
2002; Cox et al. 2006), has raised the possibility that beaked whales exposed to strong ―pulsed‖ sounds
may be especially susceptible to injury and/or behavioral reactions that can lead to stranding (e.g.,
Hildebrand 2005; Southall et al. 2007). Hildebrand (2005) reviewed the association of cetacean strand-
ings with high-intensity sound events and found that deep-diving odontocetes, primarily beaked whales,
were by far the predominant (95%) cetaceans associated with these events, with 2% mysticete whales
(minke). However, as summarized below, there is no definitive evidence that airguns can lead to injury,
strandings, or mortality even for marine mammals in close proximity to large airgun arrays.

Appendix B. Airgun Sounds and Marine Mammals
Environmental Assessment for L-DEO’s Shatsky Rise Seismic Survey, 2012 Page 145
Specific sound-related processes that lead to strandings and mortality are not well documented, but
may include (1) swimming in avoidance of a sound into shallow water; (2) a change in behavior (such as
a change in diving behavior that might contribute to tissue damage, gas bubble formation, hypoxia,
cardiac arrhythmia, hypertensive hemorrhage or other forms of trauma; (3) a physiological change such as
a vestibular response leading to a behavioral change or stress-induced hemorrhagic diathesis, leading in
turn to tissue damage; and (4) tissue damage directly from sound exposure, such as through acoustically
mediated bubble formation and growth or acoustic resonance of tissues. Some of these mechanisms are
unlikely to apply in the case of impulse sounds. However, there are increasing indications that gas-bubble
disease (analogous to ―the bends‖), induced in supersaturated tissue by a behavioral response to acoustic
exposure, could be a pathologic mechanism for the strandings and mortality of some deep-diving cetac-
eans exposed to sonar. The evidence for this remains circumstantial and associated with exposure to
naval mid-frequency sonar, not seismic surveys (Cox et al. 2006; Southall et al. 2007).
Seismic pulses and mid-frequency sonar signals are quite different, and some mechanisms by
which sonar sounds have been hypothesized to affect beaked whales are unlikely to apply to airgun pul-
ses. Sounds produced by airgun arrays are broadband impulses with most of the energy below 1 kHz.
Typical military mid-frequency sonars emit non-impulse sounds at frequencies of 2–10 kHz, generally
with a relatively narrow bandwidth at any one time (though the frequency may change over time). Thus,
it is not appropriate to assume that the effects of seismic surveys on beaked whales or other species would
be the same as the apparent effects of military sonar. For example, resonance effects (Gentry 2002) and
acoustically-mediated bubble-growth (Crum et al. 2005) are implausible in the case of exposure to broad-
band airgun pulses. Nonetheless, evidence that sonar signals can, in special circumstances, lead (at least
indirectly) to physical damage and mortality (e.g., Balcomb and Claridge 2001; NOAA and USN 2001;
Jepson et al. 2003; Fernández et al. 2004, 2005; Hildebrand 2005; Cox et al. 2006) suggests that caution
is warranted when dealing with exposure of marine mammals to any high-intensity ―pulsed‖ sound. One
of the hypothesized mechanisms by which naval sonars lead to strandings might, in theory, also apply to
seismic surveys: If the strong sounds sometimes cause deep-diving species to alter their surfacing–dive
cycles in a way that causes bubble formation in tissue, that hypothesized mechanism might apply to
seismic surveys as well as mid-frequency naval sonars. However, there is no specific evidence of this
upon exposure to airgun pulses.
There is no conclusive evidence of cetacean strandings or deaths at sea as a result of exposure to
seismic surveys, but a few cases of strandings in the general area where a seismic survey was ongoing
have led to speculation concerning a possible link between seismic surveys and strandings. • Suggestions
that there was a link between seismic surveys and strandings of humpback whales in Brazil (Engel et al.
2004) were not well founded (IAGC 2004; IWC 2007). • In Sept. 2002, there was a stranding of two
Cuvier‘s beaked whales in the Gulf of California, Mexico, when the L-DEO seismic vessel R/V Maurice
Ewing was operating a 20-airgun, 8490-in3 airgun array in the general area. The evidence linking the
stranding to the seismic survey was inconclusive and not based on any physical evidence (Hogarth 2002;
Yoder 2002). The ship was also operating its multibeam echosounder at the same time, but this had much
less potential than the aforementioned naval sonars to affect beaked whales, given its downward-directed
beams, much shorter pulse durations, and lower duty cycle. Nonetheless, the Gulf of California incident
plus the beaked whale strandings near naval exercises involving use of mid-frequency sonar suggest a
need for caution in conducting seismic surveys in areas occupied by beaked whales until more is known
about effects of seismic surveys on those species (Hildebrand 2005).
Appendix B. Airgun Sounds and Marine Mammals
Environmental Assessment for L-DEO’s Shatsky Rise Seismic Survey, 2012 Page 146
6.4 Non-Auditory Physiological Effects
Based on evidence from terrestrial mammals and humans, sound is a potential source of stress
(Wright and Kuczaj 2007; Wright et al. 2007a,b, 2009). However, almost no information is available on
sound-induced stress in marine mammals, or on its potential (alone or in combination with other stres-
sors) to affect the long-term well-being or reproductive success of marine mammals (Fair and Becker
2000; Hildebrand 2005; Wright et al. 2007a,b). Such long-term effects, if they occur, would be mainly
associated with chronic noise exposure, which is characteristic of some seismic surveys and exposure
situations (McCauley et al. 2000a:62ff; Nieukirk et al. 2009) but not of some others.
Available data on potential stress-related impacts of anthropogenic noise on marine mammals are
extremely limited, and additional research on this topic is needed. We know of only two specific studies
of noise-induced stress in marine mammals. (1) Romano et al. (2004) examined the effects of single
underwater impulse sounds from a seismic water gun (source level up to 228 dB re 1 µPa · mp–p) and
single short-duration pure tones (sound pressure level up to 201 dB re 1 μPa) on the nervous and immune
systems of a beluga and a bottlenose dolphin. They found that neural-immune changes to noise exposure
were minimal. Although levels of some stress-released substances (e.g., catecholamines) changed
significantly with exposure to sound, levels returned to baseline after 24 hr. (2) During playbacks of
recorded drilling noise to four captive beluga whales, Thomas et al. (1990) found no changes in blood
levels of stress-related hormones. Long-term effects were not measured, and no short-term effects were
detected. For both studies, caution is necessary when extrapolating these results to wild animals and to
real-world situations given the small sample sizes, use of captive animals, and other technical limitations
of the two studies.
Aside from stress, other types of physiological effects that might, in theory, be involved in beaked
whale strandings upon exposure to naval sonar (Cox et al. 2006), such as resonance and gas bubble for-
mation, have not been demonstrated and are not expected upon exposure to airgun pulses (see preceding
subsection). If seismic surveys disrupt diving patterns of deep-diving species, this might perhaps result in
bubble formation and a form of ―the bends‖, as speculated to occur in beaked whales exposed to sonar.
However, there is no specific evidence that exposure to airgun pulses has this effect.
In summary, very little is known about the potential for seismic survey sounds (or other types of
strong underwater sounds) to cause non-auditory physiological effects in marine mammals. Such effects,
if they occur at all, would presumably be limited to short distances and to activities that extend over a
prolonged period. The available data do not allow identification of a specific exposure level above which
non-auditory effects can be expected (Southall et al. 2007), or any meaningful quantitative predictions of
the numbers (if any) of marine mammals that might be affected in these ways.
7. Literature Cited
Akamatsu, T., Y. Hatakeyama, and N. Takatsu. 1993. Effects of pulsed sounds on escape behavior of false killer
whales. Nipp. Suis. Gakkaishi 59(8):1297-1303.
Allen, B.M. and R.P. Angliss. 2010. Alaska marine mammal stock assessments, 2009. U.S. Dep. Commer.,
NOAA Tech. Memo. NMFS-AFSC-206. 276 p.
Anonymous. 1975. Phantom killer whales. S. Afr. Ship. News & Fishing Indus. Rev. 30(7):50-53.
Arnold, B.W. 1996. Visual monitoring of marine mammal activity during the Exxon 3-D seismic survey: Santa
Ynez unit, offshore California 9 November to 12 December 1995. Rep. from Impact Sciences Inc., San
Diego, CA, for Exxon Co., U.S.A., Thousand Oaks, CA. 20 p.

Appendix B. Airgun Sounds and Marine Mammals
Environmental Assessment for L-DEO’s Shatsky Rise Seismic Survey, 2012 Page 147
Au, W.W.L. 1993. The Sonar of Dolphins. Springer-Verlag, New York, NY. 277 p.
Au, W.W.L., A.N. Popper, and R.R. Fay. 2000. Hearing by Whales and Dolphins. Springer Handbook of Auditory
Res. Vol. 12. Springer-Verlag, New York, NY. 458 p.
Au, W.W.L., A.A. Pack, M.O. Lammers, L.M. Herman, M.H. Deakos, and K. Andrews. 2006. Acoustic properties
of humpback whale songs. J. Acoust. Soc. Am. 120(2):1103-1110.
Backus, R.H. and W.E. Schevill. 1966. Physeter clicks. p. 510-528 in K.S. Norris (ed.), Whales, dolphins, and
porpoises. Univ. Calif. Press, Berkeley, CA. 789 p
Bain, D.E. and R. Williams. 2006. Long-range effects of airgun noise on marine mammals: responses as a function
of received sound level and distance. Paper SC/58/E35 presented to the IWC Scient. Commit., IWC Annu.
Meet., 1-13 June, St. Kitts.
Baird, R.W. 2005. Sightings of dwarf (Kogia sima) and pygmy (K. breviceps) sperm whales from the main
Hawaiian Islands. Pacific Sci. 59(3):461-466.
Baird, R.W., D.L. Webster, D.J. McSweeney, A.D. Ligon, G.S. Schorr, and J. Barlow. 2006. Diving behavior and
ecology of Cuvier‘s (Ziphius cavirostris) and Blainville‘s (Mesoplodon densirostris) beaked whales in
Hawaii. Can. J. Zool. 84(8):1120-1128.
Balcomb, K.C., III and D.E. Claridge. 2001. A mass stranding of cetaceans caused by naval sonar in the Bahamas.
Bahamas J. Sci. 8(2):2-12.
Barkaszi, M.J., D.M. Epperson, and B. Bennett. 2009. Six-year compilation of cetacean sighting data collected
during commercial seismic survey mitigation observations throughout the Gulf of Mexico, USA. p. 24-25
In: Abstr. 18th Bienn. Conf. Biol. Mar. Mamm., Québec, Canada, Oct. 2009. 306 p.
Barlow, J. and R. Gisiner. 2006. Mitigating, monitoring and assessing the effects of anthropogenic sound on beak-
ed whales. J. Cetac. Res. Manage. 7(3):239-249.
Bauer, G.B., J.C. Gaspard, K. Dziuk, A. Cardwell, L. Read, R.L. Reep, and D.A. Mann. 2009. The manatee
audiogram and auditory critical ratios. p. 27-28 In: Abstr. 18th Bienn. Conf. Biol. Mar. Mamm., Québec,
Canada, Oct. 2009. 306 p.
Beale, C.M. and P. Monaghan. 2004. Behavioural responses to human disturbance: a matter of choice? Anim.
Behav. 68(5):1065-1069.
Beland, J.A., B. Haley, C.M. Reiser, D.M. Savarese, D.S. Ireland and D.W. Funk. 2009. Effects of the presence of
other vessels on marine mammal sightings during multi-vessel operations in the Alaskan Chukchi Sea. p. 29
In: Abstr. 18th Bienn. Conf. Biol. Mar. Mamm., Québec, Oct. 2009:29. 306 p.
Berta, A., R. Racicot and T. Deméré. 2009. The comparative anatomy and evolution of the ear in Balaenoptera
mysticetes. p. 33 In: Abstr. 18th Bienn. Conf. Biol. Mar. Mamm., Québec, Oct. 2009. 306 p.
Blackwell, S.B., R.G. Norman, C.R. Greene Jr., and W.J. Richardson. 2007. Acoustic measurements. p. 4-1 to 4-
52 In: Marine mammal monitoring and mitigation during open water seismic exploration by Shell Offshore
Inc. in the Chukchi and Beaufort Seas, July-September 2006: 90-day report. LGL Rep. P891-1. Rep. from
LGL Alaska Res. Assoc. Inc., Anchorage, AK, and Greeneridge Sciences Inc., Santa Barbara, CA, for Shell
Offshore Inc., Houston, TX, Nat. Mar. Fish. Serv., Silver Spring, MD, and U.S. Fish & Wildl. Serv.,
Anchorage, AK. 199 p.
Blackwell, S.B., C.R. Greene, T.L. McDonald, C.S. Nations, R.G. Norman, and A. Thode. 2009a. Beaufort Sea
bowhead whale migration route study. Chapter 8 In: D.S. Ireland, D.W. Funk, R. Rodrigues, and W.R.
Koski (eds.). 2009. Joint Monitoring Program in the Chukchi and Beaufort seas, open water seasons, 2006-
2007. LGL Alaska Rep. P971-2. Rep. from LGL Alaska Res. Assoc. Inc. (Anchorage, AK) et al. for Shell
Offshore Inc. (Anchorage, AK) et al. 485 p. plus appendices.

Appendix B. Airgun Sounds and Marine Mammals
Environmental Assessment for L-DEO’s Shatsky Rise Seismic Survey, 2012 Page 148
Blackwell, S.B., C.S. Nations, T.L. McDonald, A.M. Thode, K.H. Kim, C.R. Greene, and M.A. Macrander. 2009b.
Effects of seismic exploration activities on the calling behavior of bowhead whales in the Alaskan Beaufort
Sea. p. 35 In: Abstr. 18th Bienn. Conf. Biol. Mar. Mamm., Québec, Canada, 12-16 Oct. 2009. 306 p.
Bowles, A.E., M. Smultea, B. Würsig, D.P. DeMaster, and D. Palka. 1994. Relative abundance and behavior of
marine mammals exposed to transmissions from the Heard Island Feasibility Test. J. Acoust. Soc. Am.
96(4):2469-2484.Bullock, T.H., T.J. Oshea, and M.C. McClune. 1982. Auditory evoked-potentials in the
West Indian manatee (Sirenia, Trichechus manatus). J. Comp. Physiol. 148(4):547-554.
Britto, M.K. and A. Silva Barreto. 2009. Marine mammal diversity registered on seismic surveys in Brazil,
between 2000 and 2008. p. 41 In: Abstr. 18th Bienn. Conf. Biol. Mar. Mamm., Québec, Oct. 2009. 306 p.
Brodie, P.F. 1981. Energetic and behavioural considerations with respect to marine mammals and disturbance from
underwater noise. p. 287-290 In: N.M. Peterson (ed.), The question of sound from icebreaker operations:
Proceedings of a workshop. Arctic Pilot Proj., Petro-Canada, Calgary, Alb. 350 p.
Bullock, T.H., T.J. O‘Shea, and M.C. McClune. 1982. Auditory evoked potentials in the West Indian manatee
(Sirenia: Trichechus manatus). J. Comp. Physiol. A 148(4):547-554.
Burgess, W.C. and C.R. Greene, Jr. 1999. Physical acoustics measurements. p. 3-1 to 3-63 In: W.J. Richardson
(ed.), Marine mammal and acoustical monitoring of Western Geophysical's open-water seismic program in
the Alaskan Beaufort Sea, 1998. LGL Rep. TA22303. Rep. from LGL Ltd., King City, Ont., and Greene-
ridge Sciences Inc., Santa Barbara, CA, for Western Geophysical, Houston, TX, and Nat. Mar. Fish. Serv.,
Anchorage, AK, and Silver Spring, MD. 390 p.
Calambokidis, J. and S.D. Osmek. 1998. Marine mammal research and mitigation in conjunction with air gun
operation for the USGS `SHIPS' seismic surveys in 1998. Rep. from Cascadia Res., Olympia, WA, for U.S.
Geol. Surv., Nat. Mar. Fish. Serv., and Minerals Manage. Serv.
Caldwell, J. and W. Dragoset. 2000. A brief overview of seismic air-gun arrays. Leading Edge 19(8):898-902.
Cavanagh, R.C. 2000. Criteria and thresholds for adverse effects of underwater noise on marine animals. AFRL-
HE-WP-TR-2000-0092. Rep. from Science Applications Intern. Corp., McLean, VA, for Air Force Res.
Lab., Wright-Patterson AFB, OH.
Christie, K., C. Lyons, W.R. Koski, D.S. Ireland, and D.W. Funk. 2009. Patterns of bowhead whale occurrence and
distribution during marine seismic operations in the Alaskan Beaufort Sea. p. 55 In: Abstr. 18th Bienn.
Conf. Biol. Mar. Mamm., Québec, Canada, 12-16 Oct. 2009.
Citta, J.J., L.T. Quakenbush, R.J. Small, and J.C. George. 2007. Movements of a tagged bowhead whale in the
vicinity of a seismic survey in the Beaufort Sea. Poster Paper, Soc. Mar. Mammal. 17th Bienn. Meet., Cape
Town, South Africa.
Clark, C.W. and W.T. Ellison. 2004. Potential use of low-frequency sounds by baleen whales for probing the
environment: Evidence from models and empirical measurements. p. 564-589 In: J.A. Thomas, C.F. Moss
and M. Vater (eds.), Echolocation in Bats and Dolphins. Univ. Chicago Press, Chicago, IL. 604 p.
Clark, C.W. and G.C. Gagnon. 2006. Considering the temporal and spatial scales of noise exposures from seismic
surveys on baleen whales. Intern. Whal. Commis. Working Pap. SC/58/E9. 9 p.
Cook, M.L.H., R.A. Varela, J.D. Goldstein, S.D. McCulloch, G.D. Bossart, J.J. Finneran, D. Houser, and A. Mann.
2006. Beaked whale auditory evoked potential hearing measurements. J. Comp. Physiol. A 192:489-495.
Cox, T.M., T.J. Ragen, A.J. Read, E. Vos, R.W. Baird, K. Balcomb, J. Barlow, J. Caldwell, T. Cranford, L. Crum,
A. D‘Amico, G. D‘Spain, A. Fernández, J. Finneran, R. Gentry, W. Gerth, F. Gulland, J. Hildebrand,
D. Houserp, R. Hullar, P.D. Jepson, D. Ketten, C.D. Macleod, P. Miller, S. Moore, D.C. Mountain, D. Palka,
P. Ponganis, S. Rommel, T. Rowles, B. Taylor, P. Tyack, D. Wartzok, R. Gisiner, J. Meads, and L. Benner.

Appendix B. Airgun Sounds and Marine Mammals
Environmental Assessment for L-DEO’s Shatsky Rise Seismic Survey, 2012 Page 149
2006. Understanding the impacts of anthropogenic sound on beaked whales. J. Cetac. Res. Manage.
7(3):177-187.
Crum, L.A., M.R. Bailey, J. Guan, P.R. Hilmo, S.G. Kargl, and T.J. Matula. 2005. Monitoring bubble growth in
supersaturated blood and tissue ex vivo and the relevance to marine mammal bioeffects. Acoustic Res.
Lett. Online 6(3):214-220.
Dahlheim, M.E. 1987. Bio-acoustics of the gray whale (Eschrichtius robustus). Ph.D. Dissertation, Univ. British
Columbia, Vancouver, BC. 315 p.
DeRuiter, S.L., P.L. Tyack, Y.-T. Lin, A.E. Newhall, J.F. Lynch, and P.J.O. Miller. 2006. Modeling acoustic prop-
agation of airgun array pulses recorded on tagged sperm whales (Physeter macrocephalus). J. Acoust. Soc.
Am. 120(6):4100-4114.
Di Iorio, L. and C.W. Clark. 2010. Exposure to seismic survey alters blue whale acoustic communication. Biol.
Lett. 6(1):51-54.
Duncan, P.M. 1985. Seismic sources in a marine environment. p. 56-88 In: Proceedings of the Workshop on
Effects of Explosives Use in the Marine Environment, Jan. 1985, Halifax, N.S. Tech. Rep. 5. Can. Oil &
Gas Lands Admin., Environ. Prot. Branch, Ottawa, Ont.
Dunn, R.A. and O. Hernandez. 2009. Tracking blue whales in the eastern tropical Pacific with an ocean-bottom
seismometer and hydrophone array. J. Acoust. Soc. Am. 126(3):1084-1094.
Engel, M.H., M.C.C. Marcondes, C.C.A. Martins, F.O. Luna, R.P. Lima, and A. Campos. 2004. Are seismic
surveys responsible for cetacean strandings? An unusual mortality of adult humpback whales in Abrolhos
Bank, northeastern coast of Brazil. Paper SC/56/E28 presented to the IWC Scient. Commit., IWC Annu.
Meet., 19-22 July, Sorrento, Italy.
Erbe, C. and A.R. King. 2009. Modeling cumulative sound exposure around marine seismic surveys. J. Acoust.
Soc. Am. 125(4):2443-2451.
Fair, P.A. and P.R. Becker. 2000. Review of stress in marine mammals. J. Aquat. Ecosyst. Stress Recov. 7:335-
354.
Fernández, A., M. Arbelo, R. Deaville, I.A.P. Patterson, P. Castro, J.R. Baker, E. Degollada, H.M. Ross, P. Herráez,
A.M. Pocknell, E. Rodríguez, F.E. Howie, A. Espinosa, R.J. Reid, J.R. Jaber, V. Martin, A.A. Cunningham,
and P.D. Jepson. 2004. Pathology: whales, sonar and decompression sickness (reply). Nature 428(6984,
15 Apr.). doi: 10.1038/nature02528a.
Fernández, A., J.F. Edwards, F. Rodriquez, A.E. de los Monteros, P. Herráez, P. Castro, J.R. Jaber, V. Martin, and
M. Arbelo. 2005. ―Gas and fat embolic syndrome‖ involving a mass stranding of beaked whales (Family
Ziphiidae) exposed to anthropogenic sonar signals. Veterin. Pathol. 42(4):446-457.
Finneran, J.J. and C.E. Schlundt. 2004. Effects of intense pure tones on the behavior of trained odontocetes. Tech.
Rep. 1913. Space and Naval Warfare (SPAWAR) Systems Center, San Diego, CA. 15 p.
Finneran, J.J., C.E. Schlundt, D.A. Carder, J.A. Clark, J.A. Young, J.B. Gaspin, and S.H. Ridgway. 2000. Auditory
and behavioral responses of bottlenose dolphins (Tursiops truncatus) and beluga whale (Delphinapterus
leucas) to impulsive sounds resembling distant signatures of underwater explosions. J. Acoust. Soc. Am.
108(1):417-431.
Finneran, J.J., C.E. Schlundt, R. Dear, D.A. Carder, and S.H. Ridgway. 2002. Temporary shift in masked hearing
thresholds in odontocetes after exposure to single underwater impulses from a seismic watergun. J. Acoust.
Soc. Am. 111(6):2929-2940.
Finneran, J.J., R. Dear, D.A. Carder, and S.H. Ridgway. 2003. Auditory and behavioral responses of California sea
lions (Zalophus californianus) to single underwater impulses from an arc-gap transducer. J. Acoust. Soc.
Am. 114(3):1667-1677.

Appendix B. Airgun Sounds and Marine Mammals
Environmental Assessment for L-DEO’s Shatsky Rise Seismic Survey, 2012 Page 150
Finneran, J.J., D.A. Carder, C.E. Schlundt, and S.H. Ridgway. 2005. Temporary threshold shift in bottlenose dol-
phins (Tursiops truncatus) exposed to mid-frequency tones. J. Acoust. Soc. Am. 118(4):2696-2705.
Finneran, J.J., D.S. Houser, B. Mase-Guthrie, R.Y. Ewing and R.G. Lingenfelser. 2009. Auditory evoked potentials
in a stranded Gervais' beaked whale (Mesoplodon europaeus). J. Acoust. Soc. Am. 126(1):484-490.
Fish, J.F. and J.S. Vania. 1971. Killer whale, Orcinus orca, sounds repel white whales, Delphinapterus leucas.
Fish. Bull. 69(3):531-535.
Fox, C.G., R.P. Dziak, and H. Matsumoto. 2002. NOAA efforts in monitoring of low-frequency sound in the
global ocean. J. Acoust. Soc. Am. 112(5, Pt. 2):2260 (Abstract).
Frankel, A. 2005. Gray whales hear and respond to a 21-25 kHz high-frequency whale-finding sonar. p. 97 In:
Abstr. 16th
Bienn. Conf. Biol. Mar. Mamm., San Diego, CA, Dec. 2005. 306 p.
Frantzis, A. 1998. Does acoustic testing strand whales? Nature 392(6671):29.
Frost, K.J., L.F. Lowry, and R.R. Nelson. 1984. Belukha whale studies in Bristol Bay, Alaska. p. 187-200 In: B.R.
Melteff and D.H. Rosenberg (eds.), Proceedings of the Workshop on Biological Interactions among Marine
Mammals and Commercial Fisheries in the Southeastern Bering Sea, Oct. 1983, Anchorage, AK. Univ.
Alaska Sea Grant Rep. 84-1. Univ. Alaska, Fairbanks, AK.
Gabriele, C.M. and B. Kipple. 2009. Measurements of near-surface, near-bow underwater sound from cruise ships.
p. 86 In: Abstr. 18th Bienn. Conf. Biol. Mar. Mamm., Québec, Oct. 2009. 306 p.
Gailey, G., B. Würsig, and T.L. McDonald. 2007. Abundance, behavior, and movement patterns of western gray
whales in relation to a 3-D seismic survey, northeast Sakhalin Island, Russia. Environ. Monit. Assessm.
134(1-3):75-91.
Gedamke, J., S. Frydman, and N. Gales. 2008. Risk of baleen whale hearing loss from seismic surveys: preliminary
results from simulations accounting for uncertainty and individual variation. Intern. Whal. Comm. Working
Pap. SC/60/E9. 10 p.
Gentry, R. (ed.). 2002. Report of the workshop on acoustic resonance as a source of tissue trauma in cetaceans.
April 24 and 25, 2002, Silver Spring, MD. 19 p. Accessed on 7 January 2011 at
http://www.nmfs.noaa.gov/pr/pdfs/acoustics/cetaceans.pdf.
Gerstein, E.R., L.A. Gerstein, S.E. Forsythe, and J.E. Blue. 1999. The underwater audiogram of a West Indian
manatee (Trichechus manatus). J. Acoust. Soc. Am. 105(6):3575-3583.
Gerstein, E., L. Gerstein, S. Forsythe and J. Blue. 2004. Do manatees utilize infrasonic communication or
detection? J. Acoust. Soc. Am. 115(5, Pt. 2):2554-2555 (Abstract).
Ghoul, A., C. Reichmuth, and J. Mulsow. 2009. Source levels and spectral analysis of southern sea otter (Enhydra
lutris nereis) scream vocalizations. p. 90 In: Abstr. 18th Bienn. Conf. Biol. Mar. Mamm., Québec, Canada,
Oct. 2009. 306 p.
Goold, J.C. 1996a. Acoustic assessment of common dolphins off the West Wales coast, in conjunction with 16th
round seismic surveying. Rep. from School of Ocean Sciences, Univ. Wales, Bangor, Wales, for Chevron
UK Ltd., Repsol Exploration (UK) Ltd., and Aran Energy Exploration Ltd. 22 p.
Goold, J.C. 1996b. Acoustic assessment of populations of common dolphin Delphinus delphis in conjunction with
seismic surveying. J. Mar. Biol. Assoc. U.K. 76:811-820.
Goold, J.C. 1996c. Acoustic cetacean monitoring off the west Wales coast. Rep. from School of Ocean Sciences,
Univ. Wales, Bangor, Wales, for Chevron UK Ltd, Repsol Explor. (UK) Ltd, and Aran Energy Explor. Ltd.
20 p.
Goold, J.C. and R.F.W. Coates. 2006. Near source, high frequency air-gun signatures. Paper SC/58/E30 presented
to the IWC Scient. Commit., IWC Annu. Meet., 1-13 June, St. Kitts.

Appendix B. Airgun Sounds and Marine Mammals
Environmental Assessment for L-DEO’s Shatsky Rise Seismic Survey, 2012 Page 151
Goold, J.C. and P.J. Fish. 1998. Broadband spectra of seismic survey air-gun emissions, with reference to dolphin
auditory thresholds. J. Acoust. Soc. Am. 103(4):2177-2184.
Gordon, J., D. Gillespie, J. Potter, A. Frantzis, M.P. Simmonds, R. Swift, and D. Thompson. 2004. A review of the
effects of seismic surveys on marine mammals. Mar. Technol. Soc. J. 37(4):16-34.
Gordon, J., R. Antunes, N. Jaquet and B. Würsig. 2006. An investigation of sperm whale headings and surface
behaviour before, during and after seismic line changes in the Gulf of Mexico. Intern. Whal. Comm.
Working Pap. SC/58/E45. 10 p.
Gosselin, J.-F. and J. Lawson. 2004. Distribution and abundance indices of marine mammals in the Gully and two
adjacent canyons of the Scotian Shelf before and during nearby hydrocarbon seismic exploration program-
mes in April and July 2003. Res. Doc. 2004/133. Can. Sci. Advis. Secretariat, Fisheries & Oceans Canada.
24 p. Available at http://www.dfo-mpo.gc.ca/csas/Csas/DocREC/2004/RES2004_133_e.pdf
Greene, C.R., Jr. 1997. Physical acoustics measurements. p. 3-1 to 3-63 In: W.J. Richardson (ed.), Northstar
marine mammal monitoring program, 1996: marine mammal and acoustical monitoring of a seismic
program in the Alaskan Beaufort Sea. LGL Rep. 2121-2. Rep. from LGL Ltd., King City, Ont., and
Greeneridge Sciences Inc., Santa Barbara, CA, for BP Explor. (Alaska) Inc., Anchorage, AK, and Nat. Mar.
Fish. Serv., Anchorage, AK, and Silver Spring, MD. 245 p.
Greene, C.R., Jr. and W.J. Richardson. 1988. Characteristics of marine seismic survey sounds in the Beaufort Sea.
J. Acoust. Soc. Am. 83(6):2246-2254.
Greene, G.D., F.R. Engelhardt, and R.J. Paterson (eds.). 1985. Proceedings of the Workshop on Effects of
Explosives Use in the Marine Environment, Jan. 1985, Halifax, NS. Tech. Rep. 5. Can. Oil & Gas Lands
Admin., Environ. Prot. Branch, Ottawa, Ont.
Greene, C.R., Jr., N.S. Altman, and W.J. Richardson. 1999a. Bowhead whale calls. p. 6-1 to 6-23 In: W.J. Rich-
ardson (ed.), Marine mammal and acoustical monitoring of Western Geophysical's open-water seismic
program in the Alaskan Beaufort Sea, 1998. LGL Rep. TA2230-3. Rep. from LGL Ltd., King City, Ont.,
and Greeneridge Sciences Inc., Santa Barbara, CA, for Western Geophysical, Houston, TX, and Nat. Mar.
Fish. Serv., Anchorage, AK, and Silver Spring, MD. 390 p.
Greene, C.R., Jr., N.S. Altman and W.J. Richardson. 1999b. The influence of seismic survey sounds on bowhead
whale calling rates. J. Acoust. Soc. Am. 106(4, Pt. 2):2280 (Abstract).
Guerra, M., A.M. Thode, S.B. Blackwell, C.R. Greene Jr. and M. Macrander. 2009. Quantifying masking effects of
seismic survey reverberation off the Alaskan North Slope. J. Acoust. Soc. Am. 126(4, Pt. 2):2230
(Abstract).
Gunn, L.M. 1988. A behavioral audiogram of the North American river otter (Lutra canadensis). M.S. thesis, San
Diego State Univ., San Diego, CA. 40 p.
Haley, B., and W.R. Koski. 2004. Marine mammal monitoring during Lamont-Doherty Earth Observatory‘s
seismic program in the Northwest Atlantic Ocean, July–August 2004. LGL Rep. TA2822-27. Rep. from
LGL Ltd., King City, Ont., for Lamont-Doherty Earth Observatory, Columbia Univ., Palisades, NY, and
Nat. Mar. Fish. Serv., Silver Spring, MD. November. 80 p.
Hanser, S.F., L.R. Doyle, A.R. Szabo, F.A. Sharpe and B. McCowan. 2009. Bubble-net feeding humpback whales
in Southeast Alaska change their vocalization patterns in the presence of moderate vessel noise. p. 105 In:
Abstr. 18th Bienn. Conf. Biol. Mar. Mamm., Québec, Canada, Oct. 2009. 306 p.
Harris, R.E., G.W. Miller, and W.J. Richardson. 2001. Seal responses to airgun sounds during summer seismic sur-
veys in the Alaskan Beaufort Sea. Mar. Mamm. Sci. 17:795-812.
Appendix B. Airgun Sounds and Marine Mammals
Environmental Assessment for L-DEO’s Shatsky Rise Seismic Survey, 2012 Page 152
Harris, R.E., [R.E.] T. Elliott, and R.A. Davis. 2007. Results of mitigation and monitoring program, Beaufort Span
2-D marine seismic program, open-water season 2006. LGL Rep. TA4319-1. Rep. from LGL Ltd., King
City, Ont., for GX Technol. Corp., Houston, TX. 48 p.
Hauser, D.D.W., M Holst, and V.D. Moulton. 2008. Marine mammal and sea turtle monitoring during Lamont-
Doherty Earth Observatory‘s marine seismic program in the Eastern Tropical Pacific, April–August 2008.
LGL Rep. TA4656/7-1. Rep. from LGL Ltd., King City., Ont., and St. John‘s, Nfld, for Lamont-Doherty
Earth Observatory of Columbia Univ., Palisades, NY, and Nat. Mar. Fish. Serv., Silver Spring, MD. 98 p.
HESS Team. 1999. High Energy Seismic Survey review process and interim operational guidelines for marine sur-
veys offshore Southern California. Rep. from High Energy Seismic Survey Team for Calif. State Lands
Commis. and Minerals Manage. Serv., Camarillo, CA. 39 p. + Appendices. Accessed in October 2011 at
http://www.boemre.gov/omm/pacific/lease/fullhessrept.pdf.
Hildebrand, J.A. 2005. Impacts of anthropogenic sound. p. 101-124 In: J.E. Reynolds, W.F. Perrin, R.R. Reeves,
S. Montgomery, and T. Ragen (eds.), Marine Mammal Research: Conservation Beyond Crisis. Johns
Hopkins Univ. Press, Baltimore, MD. 223 p.
Hogarth, W.T. 2002. Declaration of William T. Hogarth in opposition to plaintiff‘s motion for temporary
restraining order, 23 Oct. Civ. No. 02-05065-JL. U.S. District Court, Northern District of Calif., San Fran-
cisco Div.
Holst, M. and M.A. Smultea. 2008. Marine mammal and sea turtle monitoring during Lamont-Doherty Earth
Observatory‘s marine seismic program off Central America, February – April 2008. LGL Rep. TA4342-3.
Rep. from LGL Ltd., King City, Ont., for Lamont-Doherty Earth Observatory of Columbia Univ., Palisades,
NY, and Nat. Mar. Fish. Serv., Silver Spring, MD. 133 p.
Holst, M., M.A. Smultea, W.R. Koski, and B. Haley. 2005a. Marine mammal and sea turtle monitoring during
Lamont-Doherty Earth Observatory‘s marine seismic program off the Northern Yucatán Peninsula in the
Southern Gulf of Mexico, January–February 2005. LGL Rep. TA2822-31. Rep. from LGL Ltd., King City,
Ont., for Lamont-Doherty Earth Observatory of Columbia Univ., Palisades, NY, and Nat. Mar. Fish Serv.,
Silver Spring, MD.
Holst, M., M.A. Smultea, W.R. Koski, and B. Haley. 2005b. Marine mammal and sea turtle monitoring during
Lamont-Doherty Earth Observatory‘s marine seismic program in the Eastern Tropical Pacific Ocean off
Central America, November–December 2004. LGL Rep. TA2822-30. Rep. from LGL Ltd., King City,
Ont., for Lamont-Doherty Earth Observatory of Columbia Univ., Palisades, NY, and Nat. Mar. Fish. Serv.,
Silver Spring, MD.
Holst, M., W.J. Richardson, W.R. Koski, M.A. Smultea, B. Haley, M.W. Fitzgerald, and M. Rawson. 2006. Effects
of large- and small-source seismic surveys on marine mammals and sea turtles. Eos, Trans. Am. Geophys.
Union 87(36), Joint Assembly Suppl., Abstract OS42A-01. 23-26 May, Baltimore, MD.
Hooker, S.K., R.W. Baird, S. Al-Omari, S. Gowans, and H. Whitehead. 2001. Behavioral reactions of northern
bottlenose whales (Hyperoodon ampullatus) to biopsy darting and tag attachment procedures. Fish. Bull.
99(2):303-308.
Hutchinson, D.R. and R.S. Detrick. 1984. Water gun vs. air gun: a comparison. Mar. Geophys. Res. 6(3):295-
310.
IAGC. 2004. Further analysis of 2002 Abrolhos Bank, Brazil humpback whale strandings coincident with seismic
surveys. Intern. Assoc. Geophys. Contractors, Houston, TX. 12 p.
Ireland, D., M. Holst, and W.R. Koski. 2005. Marine mammal monitoring during Lamont-Doherty Earth Obser-
vatory‘s seismic program off the Aleutian Islands, Alaska, July-August 2005. LGL Rep. TA4089-3. Rep.
from LGL Ltd., King City, Ont., for Lamont-Doherty Earth Observatory of Columbia Univ., Palisades, NY,
and Nat. Mar. Fish. Serv., Silver Spring, MD. 67 p.
Appendix B. Airgun Sounds and Marine Mammals
Environmental Assessment for L-DEO’s Shatsky Rise Seismic Survey, 2012 Page 153
IWC. 2007. Report of the standing working group on environmental concerns. Annex K to Report of the Scientific
Committee. J. Cetac. Res. Manage. 9(Suppl.):227-260.
Jefferson, T.A. and B.E. Curry. 1994. Review and evaluation of potential acoustic methods of reducing or elimin-
ating marine mammal-fishery interactions. Rep. from the Mar. Mamm. Res. Progr., Texas A & M Univ.,
College Station, TX, for U.S. Mar. Mamm. Commis., Washington, DC. 59 p. NTIS PB95-100384.
Jepson, P.D., M. Arbelo, R. Deaville, I.A.P. Patterson, P. Castro, J.R. Baker, E. Degollada, H.M. Ross, P. Herráez,
A.M. Pocknell, F. Rodríguez, F.E. Howie, A. Espinosa, R.J. Reid, J.R. Jaber, V. Martin, A.A. Cunningham,
and A. Fernández. 2003. Gas-bubble lesions in stranded cetaceans. Nature 425(6958):575-576.
Jochens, A., D. Biggs, K. Benoit-Bird, D. Engelhaupt, J. Gordon, C. Hu, N. Jaquet, M. Johnson, R. Leben, B. Mate,
P. Miller, J. Ortega-Ortiz, A. Thode, P. Tyack, and B. Würsig. 2008. Sperm whale seismic study in the
Gulf of Mexico/Synthesis report. OCS Study MMS 2008-006. Rep. from Dep. Oceanogr., Texas A & M
Univ., College Station, TX, for U.S. Minerals Manage. Serv., Gulf of Mexico OCS Reg., New Orleans, LA.
323 p.
Johnson, M.P. and P.L. Tyack. 2003. A digital acoustic recording tag for measuring the response of wild marine
mammals to sound. IEEE J. Oceanic Eng. 28(1):3-12.
Johnson, S.R., W.J. Richardson, S.B. Yazvenko, S.A. Blokhin, G. Gailey, M.R. Jenkerson, S.K. Meier, H.R.
Melton, M.W. Newcomer, A.S. Perlov, S.A. Rutenko, B. Würsig, C.R. Martin, and D.E. Egging. 2007. A
western gray whale mitigation and monitoring program for a 3-D seismic survey, Sakhalin Island, Russia.
Environ. Monit. Assessm. 134(1-3):1-19.
Kastak, D. and R.J. Schusterman. 1998. Low-frequency amphibious hearing in pinnipeds: methods, measurements,
noise, and ecology. J. Acoust. Soc. Am. 103(4):2216-2228.
Kastak, D. and R.J. Schusterman. 1999. In-air and underwater hearing sensitivity of a northern elephant seal (Mir-
ounga angustirostris). Can. J. Zool. 77(11):1751-1758.
Kastak, D., R.L. Schusterman, B.L. Southall, and C.J. Reichmuth. 1999. Underwater temporary threshold shift
induced by octave-band noise in three species of pinnipeds. J. Acoust. Soc. Am. 106(2):1142-1148.
Kastak, D., B.L. Southall, R.J. Schusterman, and C. Reichmuth Kastak. 2005. Underwater temporary threshold
shift in pinnipeds: effects of noise level and duration. J. Acoust. Soc. Am. 118(5):3154-3163.
Kastelein, R.A., P. Mosterd, B. van Santen, M. Hagedoorn, and D. de Haan. 2002. Underwater audiogram of a
Pacific walrus (Odobenus rosmarus divergens) measured with narrow-band frequency-modulated signals.
J. Acoust. Soc. Am. 112(5):2173-2182.
Kastelein, R.A., W.C. Verboom, N. Jennings, and D. de Haan. 2008. Behavioral avoidance threshold level of a
harbor porpoise (Phocoena phocoena) for a continuous 50 kHz pure tone (L). J. Acoust. Soc. Am. 123(4):
1858-1861.
Kastelein, R.A., P.J. Wensveen, L. Hoek, W.C. Verboom and J.M. Terhune. 2009. Underwater detection of tonal
signals between 0.125 and 100 kHz by harbor seals (Phoca vitulina). J. Acoust. Soc. Am. 125(2):1222-
1229.
Kasuya, T. 1986. Distribution and behavior of Baird's beaked whales off the Pacific coast of Japan. Sci. Rep.
Whales Res. Inst. 37:61-83.
Ketten, D.R. 1991. The marine mammal ear: specializations for aquatic audition and echolocation. p. 717-750 In:
D. Webster, R. Fay and A. Popper (eds.), The Biology of Hearing. Springer-Verlag, Berlin.
Ketten, D.R. 1992. The cetacean ear: form, frequency, and evolution. p. 53-75 In: J.A. Thomas, R.A. Kastelein,
and A. Ya Supin (eds.), Marine Mammal Sensory Systems. Plenum, New York, NY.

Appendix B. Airgun Sounds and Marine Mammals
Environmental Assessment for L-DEO’s Shatsky Rise Seismic Survey, 2012 Page 154
Ketten, D.R. 1994. Functional analysis of whale ears: adaptations for underwater hearing. IEEE Proc. Under-
water Acoust. 1:264-270.
Ketten, D.R. 1995. Estimates of blast injury and acoustic trauma zones for marine mammals from underwater
explosions. p. 391-407 In: R.A. Kastelein, J.A. Thomas, and P.E. Nachtigall (eds.), Sensory Systems of
Aquatic Mammals. De Spil Publishers, Woerden, Netherlands. 588 p.
Ketten, D.R. 1998. Marine mammal auditory systems: a summary of audiometric and anatomical data and its
implications for underwater acoustic impacts. NOAA Tech. Memo. NOAA-TM-NMFS-SWFSC-256.
Southwest Fisheries Sci. Cent., La Jolla, CA. 74 p.
Ketten, D.R. 2000. Cetacean ears. p. 43-108 In: W.W.L. Au, A.N. Popper, and R.R. Fay (eds.), Hearing by
Whales and Dolphins. Springer-Verlag, New York, NY. 485 p.
Ketten, D.R., J. Lien and S. Todd. 1993. Blast injury in humpback whale ears: evidence and implications.
J. Acoust. Soc. Am. 94(3, Pt. 2):1849-1850 (Abstract).
Ketten, D.R., J. O'Malley, P.W.B. Moore, S. Ridgway, and C. Merigo. 2001. Aging, injury, disease, and noise in
marine mammal ears. J. Acoust. Soc. Am. 110(5, Pt. 2):2721 (Abstract).
Klima, E.F., G.R. Gitschlag, and M.L. Renaud. 1988. Impacts of the explosive removal of offshore petroleum
platforms on sea turtles and dolphins. Mar. Fish. Rev. 50(3):33-42.
Koski, W.R., D.W. Funk, D.S. Ireland, C. Lyons, K. Christie, A.M. Macrander and S.B. Blackwell. 2009. An
update on feeding by bowhead whales near an offshore seismic survey in the central Beaufort Sea. Intern.
Whal. Comm. Working Pap. SC/61/BRG3. 15 p
Kraus, S., A. Read, A. Solov, K. Baldwin, T. Spradlin, E. Anderson, and J. Williamson. 1997. Acoustic alarms
reduce porpoise mortality. Nature 388(6642):525.
Kryter, K.D. 1985. The Effects of Noise on Man. 2nd ed. Academic Press, Orlando, FL. 688 p.
Kryter, K.D. 1994. The Handbook of Hearing and the Effects of Noise. Academic Press, Orlando, FL. 673 p.
Laurinolli, M.H. and N.A. Cochrane. 2005. Hydroacoustic analysis of marine mammal vocalization data from
ocean bottom seismometer mounted hydrophones in the Gully. p. 89-95 In: K. Lee, H. Bain and G.V.
Hurley (eds.), Acoustic monitoring and marine mammal surveys in The Gully and Outer Scotian Shelf
before and during active seismic surveys. Environ. Stud. Res. Funds Rep. 151. 154 p. Published 2007.
Lesage, V., C. Barrette, M.C.S. Kingsley, and B. Sjare. 1999. The effect of vessel noise on the vocal behavior of
belugas in the St. Lawrence River estuary, Canada. Mar. Mamm. Sci. 15(1):65-84.
Ljungblad, D.K., B. Würsig, S.L. Swartz, and J.M. Keene. 1988. Observations on the behavioral responses of
bowhead whales (Balaena mysticetus) to active geophysical vessels in the Alaskan Beaufort Sea. Arctic
41(3):183-194.
Lucke, K., U. Siebert, P.A. Lepper and M.-A. Blanchet. 2009. Temporary shift in masked hearing thresholds in a
harbor porpoise (Phocoena phocoena) after exposure to seismic airgun stimuli. J. Acoust. Soc. Am.
125(6):4060-4070.
Lusseau, D. and L. Bejder. 2007. The long-term consequences of short-term responses to disturbance experience
from whalewatching impact assessment. Intern. J. Compar. Psychol. 20(2-3):228-236.
MacGillivray, A.O. and D. Hannay. 2007a. Summary of noise assessment. p. 3-1 to 3-21 In: Marine mammal
monitoring and mitigation during open water seismic exploration by ConocoPhillips Alaska, Inc., in the
Chukchi Sea, July-October 2006. LGL Rep. P903-2 (Jan. 2007). Rep. from LGL Alaska Res. Assoc. Inc.,
Anchorage, AK, and JASCO Res. Ltd., Victoria, B.C., for ConocoPhillips Alaska Inc., Anchorage, AK, and
Nat. Mar. Fish. Serv., Silver Spring, MD. 116 p.

Appendix B. Airgun Sounds and Marine Mammals
Environmental Assessment for L-DEO’s Shatsky Rise Seismic Survey, 2012 Page 155
MacGillivray, A. and D. Hannay. 2007b. Field measurements of airgun array sound levels. p. 4-1 to 4-19 In:
Marine mammal monitoring and mitigation during open water seismic exploration by GX Technology in the
Chukchi Sea, October-November 2006: 90-day report. LGL Rep. P891-1 (Feb. 2007). Rep. from LGL
Alaska Res. Assoc. Inc., Anchorage, AK, and JASCO Res. Ltd., Victoria, B.C., for GX Technology,
Houston, TX, and Nat. Mar. Fish. Serv., Silver Spring, MD. 118 p.
MacLean, S.A. and B. Haley. 2004. Marine mammal monitoring during Lamont-Doherty Earth Observatory's
seismic study in the Støregga Slide area of the Norwegian Sea, August - September 2003. LGL Rep.
TA2822-20. Rep. from LGL Ltd., King City, Ont., for Lamont-Doherty Earth Observatory, Palisades, NY,
and Nat. Mar. Fish. Serv., Silver Spring, MD. 59 p.
MacLean, S.A. and W.R. Koski. 2005. Marine mammal monitoring during Lamont-Doherty Earth Observatory‘s
seismic program in the Gulf of Alaska, August–September 2004. LGL Rep. TA2822-28. Rep. from LGL
Ltd., King City, Ont., for Lamont-Doherty Earth Observatory, Columbia Univ., Palisades, NY, and Nat.
Mar. Fish. Serv., Silver Spring, MD. 102 p.
Madsen, P.T. 2005. Marine mammals and noise: problems with root mean square sound pressure levels for transi-
ents. J. Acoust. Soc. Am. 117(6):3952-3957.
Madsen, P.T., B. Mohl, B.K. Nielsen, and M. Wahlberg. 2002. Male sperm whale behavior during exposures to
distant seismic survey pulses. Aquat. Mamm. 28(3):231-240.
Madsen, P.T., M. Johnson, P.J.O. Miller, N. Aguilar de Soto, J. Lynch, and P.L. Tyack. 2006. Quantitative mea-
sures of air gun pulses recorded on sperm whales (Physeter macrocephalus) using acoustic tags during
controlled exposure experiments. J. Acoust. Soc. Am. 120(4):2366–2379.
Malakoff, D. 2002. Suit ties whale deaths to research cruise. Science 298(5594):722-723.
Malme, C.I. and P.R. Miles. 1985. Behavioral responses of marine mammals (gray whales) to seismic discharges.
p. 253-280 In: G.D. Greene, F.R. Engelhard, and R.J. Paterson (eds.), Proc. Workshop on Effects of Explo-
sives Use in the Marine Environment, Jan. 1985, Halifax, NS. Tech. Rep. 5. Can. Oil & Gas Lands Admin.,
Environ. Prot. Br., Ottawa, Ont. 398 p.
Malme, C.I., P.R. Miles, C.W. Clark, P. Tyack, and J.E. Bird. 1984. Investigations of the potential effects of
underwater noise from petroleum industry activities on migrating gray whale behavior/Phase II: January
1984 migration. BBN Rep. 5586. Rep. from Bolt Beranek & Newman Inc., Cambridge, MA, for MMS,
Alaska OCS Region, Anchorage, AK. NTIS PB86-218377.
Malme, C.I., P.R. Miles, P. Tyack, C.W. Clark, and J.E. Bird. 1985. Investigation of the potential effects of
underwater noise from petroleum industry activities on feeding humpback whale behavior. BBN Rep. 5851;
OCS Study MMS 85-0019. Rep. from BBN Labs Inc., Cambridge, MA, for MMS, Anchorage, AK. NTIS
PB86-218385.
Malme, C.I., B. Würsig, J.E. Bird, and P. Tyack. 1986. Behavioral responses of gray whales to industrial noise:
feeding observations and predictive modeling. BBN Rep. 6265. OCS Study MMS 88-0048. Outer Contin.
Shelf Environ. Assess. Progr., Final Rep. Princ. Invest., NOAA, Anchorage 56(1988): 393-600. NTIS
PB88-249008.
Malme, C.I., B. Würsig, B., J.E. Bird, and P. Tyack. 1988. Observations of feeding gray whale responses to
controlled industrial noise exposure. p. 55-73 In: W.M. Sackinger, M.O. Jeffries, J.L. Imm, and S.D. Treacy
(eds.), Port and Ocean Engineering Under Arctic Conditions. Vol. II. Symposium on Noise and Marine
Mammals. Univ. Alaska Fairbanks, Fairbanks, AK. 111 p.
Manly, B.F.J., V.D. Moulton, R.E. Elliott, G.W. Miller and W.J. Richardson. 2007. Analysis of covariance of fall
migrations of bowhead whales in relation to human activities and environmental factors, Alaskan Beaufort
Sea: Phase I, 1996-1998. LGL Rep. TA2799-2; OCS Study MMS 2005-033. Rep. from LGL Ltd., King
City, Ont., and WEST Inc., Cheyenne, WY, for U.S. Minerals Manage. Serv., Herndon, VA, and Anchorage,

Appendix B. Airgun Sounds and Marine Mammals
Environmental Assessment for L-DEO’s Shatsky Rise Seismic Survey, 2012 Page 156
AK. 128 p.
Mate, B.R. and J.T. Harvey. 1987. Acoustical deterrents in marine mammal conflicts with fisheries. ORESU-W-
86-001. Oregon State Univ., Sea Grant Coll. Prog., Corvallis, OR. 116 p.
Mate, B.R., K.M. Stafford, and D.K. Ljungblad. 1994. A change in sperm whale (Physeter macrocephalus)
distribution correlated to seismic surveys in the Gulf of Mexico. J. Acoust. Soc. Am. 96(5, Pt. 2):3268-
3269 (Abstract).
McAlpine, D.F. 2002. Pygmy and dwarf sperm whales. p. 1007-1009 In: W.F. Perrin, B. Würsig, and J.G.M.
Thewissen (eds.), Encyclopedia of Marine Mammals. Academic Press, San Diego, CA. 1414 p.
McCall Howard, M.P. 1999. Sperm whales Physeter macrocephalus in the Gully, Nova Scotia: Population, distri-
bution, and response to seismic surveying. B.Sc. (Honours) Thesis. Dalhousie Univ., Halifax, NS.
McCauley, R.D., M.-N. Jenner, C. Jenner, K.A. McCabe, and J. Murdoch. 1998. The response of humpback whales
(Megaptera novaeangliae) to offshore seismic survey noise: preliminary results of observations about a
working seismic vessel and experimental exposures. APPEA J. 38:692-707.
McCauley, R.D., J. Fewtrell, A.J. Duncan, C. Jenner, M.-N. Jenner, J.D. Penrose, R.I.T. Prince, A. Adhitya, J.
Murdoch, and K. McCabe. 2000a. Marine seismic surveys: Analysis of airgun signals; and effects of air
gun exposure on humpback whales, sea turtles, fishes and squid. Rep. from Centre for Marine Science and
Technology, Curtin Univ., Perth, Western Australia, for Australian Petrol. Produc. & Explor. Association,
Sydney, NSW. 188 p.
McCauley, R.D., J. Fewtrell, A.J. Duncan, M.-N. Jenner, M-N., C. Jenner, R.I.T. Prince, A. Adhitya, K. McCabe
and J. Murdoch. 2000b. Marine seismic surveys – a study of environmental implications. APPEA J. 40:
692-708.
McDonald, M.A., J.A. Hildebrand, and S.C. Webb. 1995. Blue and fin whales observed on a seafloor array in the
Northeast Pacific. J. Acoust. Soc. Am. 98(2, Pt. 1):712-721.
McShane, L.J., J.A. Estes, M.L. Riedman, and M.M. Staedler. 1995. Repertoire, structure, and individual variation
of vocalizations in the sea otter. J. Mammal. 76(2):414-427.
Meier, S.K., S.B. Yazvenko, S.A. Blokhin, P. Wainwright, M.K. Maminov, Y.M. Yakovlev, and M.W. Newcomer.
2007. Distribution and abundance of western gray whales off northeastern Sakhalin Island, Russia, 2001-
2003. Environ. Monit. Assessm. 134(1-3):107-136.
Miller, G.W., R.E. Elliott, W.R. Koski, V.D. Moulton, and W.J. Richardson. 1999. Whales. p. 5-1 to 5-109 In:
W.J. Richardson (ed.), Marine mammal and acoustical monitoring of Western Geophysical's open-water
seismic program in the Alaskan Beaufort Sea, 1998. LGL Rep. TA2230-3. Rep. from LGL Ltd., King City,
Ont., and Greeneridge Sciences Inc., Santa Barbara, CA, for Western Geophysical, Houston, TX, and Nat.
Mar. Fish. Serv., Anchorage, AK, and Silver Spring, MD. 390 p.
Miller, G.W., V.D. Moulton, R.A. Davis, M. Holst, P. Millman, A. MacGillivray, and D. Hannay. 2005. Monitor-
ing seismic effects on marine mammals—southeastern Beaufort Sea, 2001-2002. p. 511-542 In: S.L. Arms-
worthy, P.J. Cranford, and K. Lee (eds.), Offshore Oil and Gas Environmental Effects Monitor-
ing/Approaches and Technologies. Battelle Press, Columbus, OH.
Miller, P.J.O., M.P. Johnson, P.T. Madsen, N. Biassoni, M. Quero, and P.L. Tyack. 2009. Using at-sea experiments
to study the effects of airguns on the foraging behavior of sperm whales in the Gulf of Mexico. Deep-Sea
Res. I 56(7):1168-1181.
Mooney, T.A., P.E. Nachtigall, M. Breese, S. Vlachos, and W.W.L. Au, 2009a. Predicting temporary threshold
shifts in a bottlenose dolphin (Tursiops truncatus): the effects of noise level and duration. J. Acoust. Soc.
Am. 125(3):1816-1826.

Appendix B. Airgun Sounds and Marine Mammals
Environmental Assessment for L-DEO’s Shatsky Rise Seismic Survey, 2012 Page 157
Mooney, T.A., P.E. Nachtigall and S. Vlachos. 2009b. Sonar-induced temporary hearing loss in dolphins. Biol.
Lett. 4(4):565-567.
Moore, S.E. and Angliss, R.P. 2006. Overview of planned seismic surveys offshore northern Alaska, July-October
2006. Paper SC/58/E6 presented to IWC Scient. Commit., IWC Annu. Meet., 1-13 June, St Kitts.
Morton A.B. and H.K. Symonds. 2002. Displacement of Orcinus orca (L.) by high amplitude sound in British
Columbia, Canada. ICES J. Mar. Sci. 59(1):71-80
Moulton, V.D. and J.W. Lawson. 2002. Seals, 2001. p. 3-1 to 3-48 In: W.J. Richardson (ed.), Marine mammal and
acoustical monitoring of WesternGeco‘s open water seismic program in the Alaskan Beaufort Sea, 2001.
LGL Rep. TA2564-4. Rep. from LGL Ltd., King City, Ont., and Greeneridge Sciences Inc., Santa Barbara,
CA, for WesternGeco, Houston, TX, and Nat. Mar. Fish. Serv., Anchorage, AK, and Silver Spring, MD.
95 p.
Moulton, V.D. and G.W. Miller. 2005. Marine mammal monitoring of a seismic survey on the Scotian Slope, 2003.
p. 29-40 In: K. Lee, H. Bain, and G.V. Hurley (eds.), Acoustic monitoring and marine mammal surveys in
the Gully and outer Scotian Shelf before and during active seismic programs. Environ. Stud. Res. Funds
Rep. 151. 154 p (Published 2007).
Moulton, V.D., B.D. Mactavish, and R.A. Buchanan. 2005. Marine mammal and seabird monitoring of Chevron
Canada Resources' 3-D seismic program on the Orphan Basin, 2004. LGL Rep. SA817. Rep. by LGL Ltd.,
St. John's, NL, for Chevron Canada Resources, Calgary, Alb., ExxonMobil Canada Ltd., St. John's, Nfld.,
and Imperial Oil Resources Ventures Ltd., Calgary, Alb. 90 p. + appendices.
Moulton, V.D., B.D. Mactavish, R.E. Harris, and R.A. Buchanan. 2006a. Marine mammal and seabird monitoring
of Chevron Canada Limited's 3-D seismic program on the Orphan Basin, 2005. LGL Rep. SA843. Rep. by
LGL Ltd., St. John's, Nfld., for Chevron Canada Resources, Calgary, Alb., ExxonMobil Canada Ltd., St.
John's, Nfld., and Imperial Oil Resources Ventures Ltd., Calgary, Alb. 111 p. + appendices.
Moulton, V.D., B.D. Mactavish, and R.A. Buchanan. 2006b. Marine mammal and seabird monitoring of Conoco-
Phillips‘ 3-D seismic program in the Laurentian Sub-basin, 2005. LGL Rep. SA849. Rep. by LGL Ltd., St.
John‘s, Nfld., for ConocoPhillips Canada Resources Corp., Calgary, Alb. 97 p. + appendices.
Nachtigall, P.E., J.L. Pawloski, and W.W.L. Au. 2003. Temporary threshold shifts and recovery following noise
exposure in the Atlantic bottlenose dolphin (Tursiops truncatus). J. Acoust. Soc. Am. 113(6):3425-3429.
Nachtigall, P.E., A.Y. Supin, J. Pawloski, and W.W.L. Au. 2004. Temporary threshold shifts after noise exposure
in the bottlenose dolphin (Tursiops truncatus) measured using evoked auditory potentials. Mar. Mamm.
Sci. 20(4):673-687
Nachtigall, P.E., A.Y. Supin, M. Amundin, B. Röken,,T. Møller, A. Mooney, K.A. Taylor, and M. Yuen. 2007.
Polar bear Ursus maritimus hearing measured with auditory evoked potentials. J. Exp. Biol. 210(7):1116-
1122.
Nations, C.S., S.B. Blackwell, K.H. Kim, A.M. Thode, C.R. Greene Jr., A.M. Macrander, and T.L. McDonald.
2009. Effects of seismic exploration in the Beaufort Sea on bowhead whale call distributions. J. Acoust.
Soc. Am. 126(4, Pt. 2):2230 (Abstract).
Nieukirk, S.L., K.M. Stafford, D.K. Mellinger, R.P. Dziak, and C.G. Fox. 2004. Low-frequency whale and seismic
airgun sounds recorded in the mid-Atlantic Ocean. J. Acoust. Soc. Am. 115(4):1832-1843.
Nieukirk, S.L., D.K. Mellinger, J.A. Hildebrand, M.A. McDonald, and R.P. Dziak. 2005. Downward shift in the
frequency of blue whale vocalizations. p. 205 In: Abstr. 16th Bienn. Conf. Biol. Mar. Mamm., San Diego,
CA, 12-16 Dec. 2005.

Appendix B. Airgun Sounds and Marine Mammals
Environmental Assessment for L-DEO’s Shatsky Rise Seismic Survey, 2012 Page 158
Nieukirk, S.L., S.L. Heimlich, S.E. Moore, K.M. Stafford, R.P. Dziak, M. Fowler, J. Haxel, J. Goslin and D.K.
Mellinger. 2009. Whales and airguns: an eight-year acoustic study in the central North Atlantic. p. 181-182
In: Abstr. 18th Bienn. Conf. Biol. Mar. Mamm., Québec, Oct. 2009. 306 p.
NMFS. 1995. Small takes of marine mammals incidental to specified activities; offshore seismic activities in
southern California. Fed. Regist. 60(200):53753-53760.
NMFS. 2000. Small takes of marine mammals incidental to specified activities; marine seismic-reflection data
collection in southern California. Fed. Regist. 65(20):16374-16379.
NMFS. 2001. Small takes of marine mammals incidental to specified activities; oil and gas exploration drilling
activities in the Beaufort Sea/Notice of issuance of an incidental harassment authorization. Fed. Regist.
66(26):9291-9298.
NMFS. 2005. Endangered Fish and Wildlife; Notice of Intent to Prepare an Environmental Impact Statement. Fed.
Regist. 70(7):1871-1875.
NOAA and U.S. Navy. 2001. Joint interim report: Bahamas marine mammal stranding event of 15-16 March
2000. Nat. Mar. Fish. Serv., Silver Spring, MD, and Assistant Secretary of the Navy, Installations &
Environ., Washington, DC. 61 p. Available at http://www.nmfs.noaa.gov/pr/acoustics/reports.htm
Nowacek, D.P., L.H. Thorne, D.W. Johnston, and P.L. Tyack. 2007. Responses of cetaceans to anthropogenic
noise. Mammal Rev. 37(2):81-115.
NRC. 2005. Marine Mammal Populations and Ocean Noise: Determining When Noise Causes Biologically
Significant Effects. U. S. Nat. Res. Counc., Ocean Studies Board. (Authors D.W. Wartzok, J. Altmann, W.
Au, K. Ralls, A. Starfield, and P.L. Tyack). Nat. Acad. Press, Washington, DC. 126 p.
Parente, C.L., M.C.C. Marcondes, and M.H. Engel. 2006. Humpback whale strandings and seismic surveys in
Brazil from 1999 to 2004. Intern. Whal. Commis. Working Pap. SC/58/E41. 16 p.
Parente, C.L., J.P. de Araújo and M.E. de Araújo. 2007. Diversity of cetaceans as tool in monitoring environmental
impacts of seismic surveys. Biota Neotrop. 7(1):1-7.
Parks, S.E., C.W. Clark, and P.L. Tyack. 2007a. Short- and long-term changes in right whale calling behavior: the
potential effects of noise on acoustic communication. J. Acoust. Soc. Am. 122(6):3725-3731.
Parks, S.E., D.R. Ketten, J.T. O'Malley and J. Arruda. 2007b. Anatomical predictions of hearing in the North
Atlantic right whale. Anat. Rec. 290(6):734-744.
Parks, S.E., I. Urazghildiiev and C.W. Clark. 2009. Variability in ambient noise levels and call parameters of North
Atlantic right whales in three habitat areas. J. Acoust. Soc. Am. 125(2):1230-1239.
Potter, J.R., M. Thillet, C. Douglas, M.A. Chitre, Z. Doborzynski, and P.J. Seekings. 2007. Visual and passive
acoustic marine mammal observations and high-frequency seismic source characteristics recorded during a
seismic survey. IEEE J. Oceanic Eng. 32(2):469-483.
Reeves, R.R. 1992. Whale responses to anthropogenic sounds: A literature review. Sci. & Res. Ser. 47. New
Zealand Dep. Conserv., Wellington. 47 p.
Reeves, R.R., E. Mitchell, and H. Whitehead. 1993. Status of the northern bottlenose whale, Hyperoodon
ampullatus. Can. Field-Nat. 107(4):490-508.
Reeves, R.R., R.J. Hofman, G.K. Silber, and D. Wilkinson. 1996. Acoustic deterrence of harmful marine mammal-
fishery interactions: proceedings of a workshop held in Seattle, Washington, 20-22 March 1996. NOAA
Tech. Memo. NMFS-OPR-10. Nat. Mar. Fish. Serv., Northwest Fisheries Sci. Cent., Seattle, WA. 70 p.
Reiser, C.M., B. Haley, J. Beland, D.M. Savarese, D.S. Ireland, and D.W. Funk. 2009. Evidence of short-range
movements by phocid species in reaction to marine seismic surveys in the Alaskan Chukchi and Beaufort
seas. p. 211 In:Abstr. 18th Bienn. Conf. Biol. Mar. Mamm., Québec, Canada, Oct. 2009. 306 p.
Appendix B. Airgun Sounds and Marine Mammals
Environmental Assessment for L-DEO’s Shatsky Rise Seismic Survey, 2012 Page 159
Richardson, W.J. and C.I. Malme. 1993. Man-made noise and behavioral responses. p. 631-700 In: J.J. Burns, J.J.
Montague, and C.J. Cowles (eds.), The Bowhead Whale. Spec. Publ. 2, Soc. Mar. Mammal., Lawrence, KS.
787 p.
Richardson, W.J. and B. Würsig. 1997. Influences of man-made noise and other human actions on cetacean
behaviour. Mar. Freshw. Behav. Physiol. 29(1-4):183-209.
Richardson, W.J., B. Würsig, and C.R. Greene. 1986. Reactions of bowhead whales, Balaena mysticetus, to seis-
mic exploration in the Canadian Beaufort Sea. J. Acoust. Soc. Am. 79(4):1117-1128.
Richardson, W.J., R.A. Davis, C.R. Evans, D.K. Ljungblad, and P. Norton. 1987. Summer distribution of bowhead
whales, Balaena mysticetus, relative to oil industry activities in the Canadian Beaufort Sea, 1980-84. Arctic
40(2):93-104.
Richardson, W.J., C.R. Greene, Jr., C.I. Malme, and D.H. Thomson. 1995. Marine Mammals and Noise. Academic
Press, San Diego, CA. 576 p.
Richardson, W.J., G.W. Miller, and C.R. Greene, Jr. 1999. Displacement of migrating bowhead whales by sounds
from seismic surveys in shallow waters of the Beaufort Sea. J. Acoust. Soc. Am. 106(4, Pt. 2):2281
(Abstract).
Richardson, W.J., M. Holst, W.R. Koski and M. Cummings. 2009. Responses of cetaceans to large-source seismic
surveys by Lamont-Doherty Earth Observatory. p. 213 In: Abstr. 18th Bienn. Conf. Biol. Mar. Mamm.,
Québec, Oct. 2009. 306 p.
Riedman, M.L. 1983. Studies of the effects of experimentally produced noise associated with oil and gas explor-
ation and development on sea otters in California. Rep. from Center for Coastal Marine Studies, Univ.
Calif., Santa Cruz, CA, for MMS, Anchorage, AK. 92 p. NTIS PB86-218575.
Riedman, M.L. 1984. Effects of sounds associated with petroleum industry activities on the behavior of sea otters
in California. p. D-1 to D-12 In: C.I. Malme, P.R. Miles, C.W. Clark, P. Tyack, and J.E. Bird. Investiga-
tions of the potential effects of underwater noise form petroleum industry activities on migrating gray whale
behavior/Phase II: January 1984 migration. BBN Rep. 5586. Rep. from BBN Inc., Cambridge, MA, for
Minerals Manage. Serv. Anchorage, AK. NTIS PB86-218377.
Romano, T.A., M.J. Keogh, C.Kelly, P. Feng, L. Berk, C.E. Schlundt, D.A. Carder, and J.J. Finneran. 2004.
Anthropogenic sound and marine mammal health: measures of the nervous and immune systems before and
after intense sound exposure. Can. J. Fish. Aquat. Sci. 61(7):1124-1134.
SACLANT. 1998. Estimation of cetacean hearing criteria levels. Section II, Chapter 7 In: SACLANTCEN
Bioacoustics Panel Summary Record and Report. Rep. from NATO Undersea Res. Center. Available at
http://enterprise.spawar.navy.mil/nepa/whales/pdf/doc2-7.pdf
Scheifele, P.M., S. Andrew, R.A. Cooper, M. Darre, F.E. Musiek, and L. Max. 2005. Indication of a Lombard
vocal response in the St. Lawrence River beluga. J. Acoust. Soc. Am. 117(3, Pt. 1):1486-1492.
Schlundt, C.E., J.J. Finneran, D.A. Carder, and S.H. Ridgway. 2000. Temporary shift in masking hearing thresh-
olds of bottlenose dolphins, Tursiops truncatus, and white whales, Delphinapterus leucas, after exposure to
intense tones. J. Acoust. Soc. Am. 107(6):3496-3508.
Simard, Y., F. Samaran and N. Roy. 2005. Measurement of whale and seismic sounds in the Scotian Gully and
adjacent canyons in July 2003. p. 97-115 In: K. Lee, H. Bain and C.V. Hurley (eds.), Acoustic monitoring
and marine mammal surveys in The Gully and Outer Scotian Shelf before and during active seismic surveys.
Environ. Stud. Res. Funds Rep. 151. 154 p (Published 2007).
Simmonds, M. P. and L.F. Lopez-Jurado. 1991. Whales and the military. Nature 351(6326):448.
Smultea, M.A. and M. Holst. 2008. Marine mammal monitoring during a University of Texas Institute for
Geophysics seismic survey in the Northeast Pacific Ocean, July 2008. LGL Rep. TA4584-2. Rep. from

Appendix B. Airgun Sounds and Marine Mammals
Environmental Assessment for L-DEO’s Shatsky Rise Seismic Survey, 2012 Page 160
LGL Ltd., King City, Ont., for Lamont-Doherty Earth Observatory of Columbia Univ., Palisades, NY, and
Nat. Mar. Fish. Serv., Silver Spring, MD. 80 p.
Smultea, M.A., M. Holst, W.R. Koski, and S. Stoltz. 2004. Marine mammal monitoring during Lamont-Doherty
Earth Observatory's seismic program in the Southeast Caribbean Sea and adjacent Atlantic Ocean, April-
June 2004. LGL Rep. TA2822-26. Rep. from LGL Ltd., King City, Ont., for Lamont-Doherty Earth
Observatory of Columbia Univ., Palisades, NY, and Nat. Mar. Fish. Serv., Silver Spring, MD. 106 p.
Sodal, A. 1999. Measured underwater acoustic wave propagation from a seismic source. Proc. Airgun Environ-
mental Workshop, 6 July, London, UK.
Southall, B.L., A.E. Bowles, W.T. Ellison, J.J. Finneran, R.L. Gentry, C.R. Greene Jr., D. Kastak, D.R. Ketten, J.H.
Miller, P.E. Nachtigall, W.J. Richardson, J.A. Thomas, and P.L. Tyack. 2007. Marine mammal noise expo-
sure criteria: initial scientific recommendations. Aquat. Mamm. 33(4):411-522.
Stone, C.J. 2003. The effects of seismic activity on marine mammals in UK waters 1998-2000. JNCC Rep. 323.
Joint Nature Conserv. Commit., Aberdeen, Scotland. 43 p.
Stone, C.J. and M.L. Tasker. 2006. The effects of seismic airguns on cetaceans in UK waters. J. Cetac. Res.
Manage. 8(3):255-263.
Terhune, J.M. 1999. Pitch separation as a possible jamming-avoidance mechanism in underwater calls of bearded
seals (Erignathus barbatus). Can. J. Zool. 77(7):1025-1034.
Thomas, J.A., R.A. Kastelein and F.T. Awbrey. 1990. Behavior and blood catecholamines of captive belugas
during playbacks of noise from an oil drilling platform. Zoo Biol. 9(5):393-402.
Thompson, D., M. Sjöberg, E.B. Bryant, P. Lovell, and A. Bjørge. 1998. Behavioural and physiological responses
of harbour (Phoca vitulina) and grey (Halichoerus grypus) seals to seismic surveys. p. 134 In: Abstr. 12th
Bienn . Conf. and World Mar. Mamm. Sci. Conf., 20-25 Jan., Monte Carlo, Monaco. 160 p.
Thomson, D.H. and W.J. Richardson. 1995. Marine mammal sounds. p. 159-204 In: W.J. Richardson, C.R.
Greene, Jr., C.I. Malme, and D.H. Thomson. Marine Mammals and Noise. Academic Press, San Diego, CA.
576 p.
Tolstoy, M., J. Diebold, S. Webb, D. Bohnenstiehl, and E. Chapp. 2004a. Acoustic calibration measurements.
Chapter 3 In: W.J. Richardson (ed.), Marine mammal and acoustic monitoring during Lamont-Doherty Earth
Observatory's acoustic calibration study in the northern Gulf of Mexico, 2003. Revised Rep. from LGL
Ltd., King City, Ont., for Lamont-Doherty Earth Observatory, Palisades, NY, and Nat. Mar. Fish. Serv.,
Silver Spring, MD.
Tolstoy, M., J.B. Diebold, S.C. Webb, D.R. Bohenstiehl, E. Chapp, R.C. Holmes, and M. Rawson. 2004b. Broad-
band calibration of R/V Ewing seismic sources. Geophys. Res. Let. 31:L14310. doi: 10.1029/
2004GL020234
Tolstoy, M., J. Diebold, L. Doermann, S. Nooner, S.C. Webb, D.R. Bohnenstiehl, T.J. Crone and R.C. Holmes.
2009. Broadband calibration of the R/V Marcus G. Langseth four-string seismic sources. Geochem.
Geophys. Geosyst. 10(8):1-15. Q08011.
Tyack, P.L. 2008. Implications for marine mammals of large-scale changes in the marine acoustic environment.
J. Mammal. 89(3):549-558.
Tyack, P.L. 2009. Human-generated sound and marine mammals. Phys. Today 62(11, Nov.):39-44.
Tyack, P., M. Johnson, and P. Miller. 2003. Tracking responses of sperm whales to experimental exposures of
airguns. p. 115-120 In: A.E. Jochens and D.C. Biggs (eds.), Sperm whale seismic study in the Gulf of
Mexico/Annual Report: Year 1. OCS Study MMS 2003-069. Rep. from Texas A&M Univ., College Sta-
tion, TX, for U.S. Minerals Manage. Serv., Gulf of Mexico OCS Region, New Orleans, LA.
Appendix B. Airgun Sounds and Marine Mammals
Environmental Assessment for L-DEO’s Shatsky Rise Seismic Survey, 2012 Page 161
Tyack, P.L., M.P. Johnson, P.T. Madsen, P.J. Miller, and J. Lynch. 2006a. Biological significance of acoustic
impacts on marine mammals: examples using an acoustic recording tag to define acoustic exposure of
sperm whales, Physeter catodon, exposed to airgun sounds in controlled exposure experiments. Eos, Trans.
Am. Geophys. Union 87(36), Joint Assembly Suppl., Abstract OS42A-02. 23-26 May, Baltimore, MD.
Tyack, P.L., M. Johnson, N. Aguilar Soto, A. Sturlese, and P.T. Madsen. 2006b. Extreme diving of beaked whales.
J. Exp. Biol. 209(21):4238-4253.
Urick, R.J. 1983. Principles of Underwater Sound. 3rd ed. Peninsula Publ., Los Altos, CA. 423 p.
van der Woude, S. 2007. Assessing effects of an acoustic marine geophysical survey on the behaviour of bottlenose
dolphins Tursiops truncatis. In: Abstr. 17th Bienn. Conf. Biol. Mar. Mamm., 29 Nov.–3 Dec., Cape Town,
South Africa.
Wartzok, D., A.N. Popper, J. Gordon, and J. Merrill. 2004. Factors affecting the responses of marine mammals to
acoustic disturbance. Mar. Technol. Soc. J. 37(4):6-15.
Watkins, W.A. 1977. Acoustic behavior of sperm whales. Oceanus 20(2):50-58.
Watkins, W.A. 1986. Whale reactions to human activities in Cape Cod waters. Mar. Mamm. Sci. 2(4):251-262.
Watkins, W.A. and W.E. Schevill. 1975. Sperm whales (Physeter catodon) react to pingers. Deep-Sea Res.
22(3):123-129.
Watkins, W.A., K.E. Moore, and P. Tyack. 1985. Sperm whale acoustic behaviors in the southeast Caribbean.
Cetology 49:1-15.
Weilgart, L.S. 2007. A brief review of known effects of noise on marine mammals. Intern. J. Comp. Psychol.
20:159-168.
Weir, C.R. 2008a. Overt responses of humpback whales (Megaptera novaeangliae), sperm whales (Physeter
macrocephalus), and Atlantic spotted dolphins (Stenella frontalis) to seismic exploration off Angola.
Aquat. Mamm. 34(1):71-83.
Weir, C.R. 2008b. Short-finned pilot whales (Globicephala macrorhynchus) respond to an airgun ramp-up
procedure off Gabon. Aquat. Mamm. 34(3):349-354.
Weller, D.W., Y.V. Ivashchenko, G.A. Tsidulko, A.M. Burdin, and R.L. Brownell, Jr. 2002. Influence of seismic
surveys on western gray whales off Sakhalin Island, Russia in 2001. Paper SC/54/BRG14, IWC, Western
Gray Whale Working Group Meet., 22-25 Oct., Ulsan, South Korea. 12 p.
Weller, D.W., S.H. Rickards, A.L. Bradford, A.M. Burdin, and R.L. Brownell, Jr. 2006a. The influence of 1997
seismic surveys on the behavior of western gray whales off Sakhalin Island, Russia. Paper SC/58/E4
presented to the IWC Scient. Commit., IWC Annu. Meet., 1-13 June, St. Kitts.
Weller, D.W., G.A. Tsidulko, Y.V. Ivashchenko, A.M. Burdin and R.L. Brownell Jr. 2006b. A re-evaluation of the
influence of 2001 seismic surveys on western gray whales off Sakhalin Island, Russia. Paper SC/58/E5
presented to the IWC Scient. Commit., IWC Annu. Meet., 1-13 June, St. Kitts.
Wieting, D. 2004. Background on development and intended use of criteria. p. 20 In: S. Orenstein, L. Langstaff, L.
Manning, and R. Maund (eds.), Advisory Committee on Acoustic Impacts on Marine Mammals, Final Meet.
Summary. Second Meet., April 28-30, 2004, Arlington, VA. Sponsored by the Mar. Mamm. Commis., 10
Aug.
Winsor, M.H. and B.R. Mate. 2006. Seismic survey activity and the proximity of satellite tagged sperm whales.
Intern. Whal. Comm. Working Pap. SC/58/E16. 8 p.
Wright, A.J. and S. Kuczaj. 2007. Noise-related stress and marine mammals: An Introduction. Intern. J. Comp.
Psychol. 20(2-3):iii-viii.

Appendix B. Airgun Sounds and Marine Mammals
Environmental Assessment for L-DEO’s Shatsky Rise Seismic Survey, 2012 Page 162
Wright, A.J., N. Aguilar Soto, A.L. Baldwin, M. Bateson, C.M. Beale, C. Clark, T. Deak, E.F. Edwards,
A. Fernández, A. Godinho, L.T. Hatch, A. Kakuschke, D. Lusseau, D. Martineau, L.M. Romero, L.S.
Weilgart, B.A. Wintle, G. Notarbartolo-di-Sciara, and V. Martin. 2007a. Do marine mammals experience
stress related to anthropogenic noise? Intern. J. Comp. Psychol. 20(2-3):274-316.
Wright, A.J., N. Aguilar Soto, A.L. Baldwin, M. Bateson, C.M. Beale, C. Clark, T. Deak, E.F. Edwards,
A. Fernández, A. Godinho, L.T. Hatch, A. Kakuschke, D. Lusseau, D. Martineau, L.M. Romero, L.S.
Weilgart, B.A. Wintle, G. Notarbartolo-di-Sciara and V. Martin. 2007b. Anthropogenic noise as a stressor
in animals: A multidisciplinary perspective. Intern. J. Comp. Psychol. 20(2-3): 250-273.
Wright, A.J., T. Deak and E.C.M. Parsons. 2009. Concerns related to chronic stress in marine mammals. Intern.
Whal. Comm. Working Pap. SC/61/E16. 7 p.
Würsig, B., S.K. Lynn, T.A. Jefferson, and K.D. Mullin. 1998. Behaviour of cetaceans in the northern Gulf of
Mexico relative to survey ships and aircraft. Aquat. Mamm. 24(1):41-50.
Würsig, B.G., D.W. Weller, A.M. Burdin, S.H. Reeve, A.L Bradford, S.A. Blokhin, and R.L Brownell, Jr. 1999.
Gray whales summering off Sakhalin Island, Far East Russia: July-October 1997. A joint U.S.-Russian
scientific investigation. Final Report. Rep. from Texas A&M Univ., College Station, TX, and Kamchatka
Inst. Ecol. & Nature Manage., Russian Acad. Sci., Kamchatka, Russia, for Sakhalin Energy Investment Co.
Ltd and Exxon Neftegaz Ltd, Yuzhno-Sakhalinsk, Russia. 101 p.
Yazvenko, S.B., T.L. McDonald, S.A. Blokhin, S.R. Johnson, S.K. Meier, H.R. Melton, M.W. Newcomer, R.M.
Nielson, V.L. Vladimirov, and P.W. Wainwright. 2007a. Distribution and abundance of western gray
whales during a seismic survey near Sakhalin Island, Russia. Environ. Monit. Assessm. 134(1-3):45-73.
Yazvenko, S. B., T.L. McDonald, S.A. Blokhin, S.R. Johnson, H.R. Melton, and M.W. Newcomer. 2007b. Feeding
activity of western gray whales during a seismic survey near Sakhalin Island, Russia. Environ. Monit.
Assessm. 134(1-3):93-106.
Yoder, J.A. 2002. Declaration James A. Yoder in opposition to plaintiff‘s motion for temporary restraining order,
28 October 2002. Civ. No. 02-05065-JL. U.S. District Court, Northern District of Calif., San Francisco Div.

Appendix C. Airgun Sounds and Sea Turtles
Environmental Assessment for L-DEO’s Shatsky Rise Seismic Survey, 2012 Page 163
APPENDIX C:
REVIEW OF THE EFFECTS OF AIRGUN SOUNDS ON SEA TURTLES8
The following subsections review relevant information concerning the potential effects of airgun
sounds on sea turtles. This information is included here as background. Much of this information has
also been included in varying formats in other reviews, assessments, and regulatory applications prepared
by LGL Ltd.
1. Sea Turtle Hearing
Although there have been a limited number of studies on sea turtle hearing (see review by
Southwood et al. 2008), the available data are not very comprehensive. However, these data demonstrate
that sea turtles appear to be low-frequency specialists (see Table B-1).
Sea turtle auditory perception occurs through a combination of both bone and water conduction
rather than air conduction (Lenhardt 1982; Lenhardt and Harkins 1983). Detailed descriptions of sea
turtle ear anatomy are found in Ridgway et al. (1969), Lenhardt et al. (1985), and Bartol and Musick
(2003). Sea turtles do not have external ears, but the middle ear is well adapted as a peripheral
component of a bone conduction system. The thick tympanum is disadvantageous as an aerial receptor,
but enhances low-frequency bone conduction hearing (Lenhardt et al. 1985; Bartol et al. 1999; Bartol and
Musick 2003). A layer of subtympanal fat emerging from the middle ear is fused to the tympanum
(Ketten et al. 2006; Bartol 2004, 2008). A cartilaginous disk, the extracolumella, is found under the
tympanic membrane and is attached to the columella (Bartol 2004, 2008). The columella is a long rod
that expands to form the stapes, and fibrous strands connect the stapes to the saccule (Bartol 2004, 2008).
When the tympanum is depressed, the vibrations are conveyed via the fibrous stapedo-sacular strands to
the sacule (Lenhardt et al. 1985). This arrangement of fat deposits and bone enables sea turtles to hear
low-frequency sounds while underwater and makes them relatively insensitive to sound above water.
Vibrations, however, can be conducted through the bones of the carapace to reach the middle ear.
A variety of audiometric methods are available to assess hearing abilities. Electrophysiological
measures of hearing (e.g., auditory brainstem response or ABR) provide good information about relative
sensitivity to different frequencies. However, this approach may underestimate the frequency range to
which the animal is sensitive and may be imprecise at determining absolute hearing thresholds (e.g.,
Wolski et al. 2003). Nevertheless, when time is critical and only untrained animals are available, this
method can provide useful information on sea turtle hearing (e.g., Wolski et al. 2003).
Ridgway et al. (1969) obtained the first direct measurements of sea turtle hearing sensitivity (Table
B-1). They used an electrophysiological technique (cochlear potentials) to determine the response of
green sea turtles (Chelonia mydas) to aerial- and vibrational-stimuli consisting of tones with frequencies
30 to 700 Hz. They found that green turtles exhibit maximum hearing sensitivity between 300 and 500
Hz Hz, and speculated that the turtles had a useful hearing range of 60–1000 Hz. (However, there was
some response to strong vibrational signals at frequencies down to the lowest one tested — 30 Hz.)
____________________________________
8 By Valerie D. Moulton and W. John Richardson, with subsequent updates (to Feb. 2010) by Mari A.
Smultea and Meike Holst, all of LGL Ltd., environmental research associates.

Appendix C. Airgun Sounds and Sea Turtles
Environmental Assessment for L-DEO’s Shatsky Rise Seismic Survey, 2012 Page 164
TABLE B-1. Hearing capabilities of sea turtles as measured using behavioral and electro-physiological
techniques. ABR: auditory brainstem response; NA: no empirical data available.
Hearing
Sea Turtle Species
Range (Hz)
Highest Sensitivity (Hz)
Technique
Source
Green 60-1000
300-500 Cochlear Potentials
a
Ridgway et al. 1969
100-800 600-700 (juveniles) 200-400 (subadults)
ABR w Bartol & Ketten 2006;
Ketten & Bartol 2006
50-1600 50-400 ABR a,w
Dow et al. 2008 Hawksbill NA NA NA NA Loggerhead 250-1000 250 ABR
a Bartol et al. 1999
Olive ridley NA NA NA NA
Kemp’s ridley 100-500 100-200 ABR w Bartol & Ketten 2006;
Ketten & Bartol 2006 Leatherback NA NA NA NA Flatback NA NA NA NA
a measured in air;
w measured underwater
Bartol et al. (1999) tested the in-air hearing of juvenile loggerhead turtles Caretta caretta (Table B-
1). The authors used ABR to determine the response of the sea turtle ear to two types of vibrational
stimuli: (1) brief, low-frequency broadband clicks, and (2) brief tone bursts at four frequencies from 250
to 1000 Hz. They demonstrated that loggerhead sea turtles hear well between 250 and 1000 Hz; within
that frequency range the turtles were most sensitive at 250 Hz. The authors did not measure hearing sen-
sitivity below 250 Hz or above 1000 Hz. There was an extreme decrease in response to stimuli above
1000 Hz, and the vibrational intensities required to elicit a response may have damaged the turtle‘s ear.
The signals used in this study were very brief — 0.6 ms for the clicks and 0.8–5.5 ms for the tone bursts.
In other animals, auditory thresholds decrease with increasing signal duration up to ~100–200 ms. Thus,
sea turtles probably could hear weaker signals than demonstrated in the study if the signal duration were
longer.
Lenhardt (2002) exposed loggerhead turtles while they were near the bottom of holding tanks at a
depth of 1 m to tones from 35 to 1000 Hz. The turtles exhibited startle responses (neck contractions) to
these tones. The lowest thresholds were in the 400–500 Hz range (106 dB SPL re 1 Pa), and thresholds
in the 100–200 Hz range were ~124 dB (Lenhardt 2002). Thresholds at 735 and 100 Hz were 117 and
156 dB, respectively (Lenhardt 2002). Diving behaviour occurred at 30 Hz and 164 dB.
More recently, ABR techniques have been used to determine the underwater hearing capabilities of
six subadult green turtles, two juvenile green turtles, and two juvenile Kemp‘s ridley (Lepidochelys
kempii) turtles (Ketten and Bartol 2006; Bartol and Ketten 2006; Table B-1). The turtles were physically
restrained in a small box tank with their ears below the water surface and the top of the head exposed
above the surface. Pure-tone acoustic stimuli were presented to the animals, though the exact frequencies
of these tones were not indicated. The six subadult green turtles detected sound at frequencies 100–500
Appendix C. Airgun Sounds and Sea Turtles
Environmental Assessment for L-DEO’s Shatsky Rise Seismic Survey, 2012 Page 165
Hz, with the most sensitive hearing at 200–400 Hz. In contrast, the two juvenile green turtles exhibited a
slightly expanded overall hearing range of 100–800 Hz, with their most sensitive hearing occurring at
600–700 Hz. The most restricted range of sensitive hearing (100–200 Hz) was found in the two juvenile
Kemp‘s ridleys turtles, whose overall frequency range was 100–500 Hz.
Preliminary data from a similar study of a trained, captive green turtle indicate that the animal
heard and responded behaviorally to underwater tones ranging in frequency from 100 to 500 Hz. At 200
Hz, the threshold was between 107 and 119 dB, and at 400 Hz the threshold was between 121 and 131 dB
[reference units not provided] (Streeter 2003; ONR N.D.).
In summary, the limited available data indicate that the frequency range of best hearing sensitivity
of sea turtles extends from ~200 to 700 Hz. Sensitivity deteriorates as one moves away from this range to
either lower or higher frequencies. However, there is some sensitivity to frequencies as low as 60 Hz, and
probably as low as 30 Hz (Ridgway et al. 1969). Thus, there is substantial overlap in the frequencies that
sea turtles detect vs. the dominant frequencies in airgun pulses. Given that, plus the high energy levels of
airgun pulses, sea turtles undoubtedly hear airgun sounds. We are not aware of measurements of the
absolute hearing thresholds of any sea turtle to waterborne sounds similar to airgun pulses. Given the
high source levels of airgun pulses and the substantial received levels even at distances many km away
from the source, sea turtles probably can also hear distant seismic vessels. However, in the absence of
relevant absolute threshold data, we cannot estimate how far away an airgun array might be audible to a
sea turtle.
2. Effects of Airgun Pulses on Behavior and Movement
The effects of exposure to airgun pulses on the behavior and distribution of various marine animals
have been studied over the past three decades. Most such studies have concerned marine mammals (e.g.,
see reviews by Richardson et al. 1995; Gordon et al. 2004; Nowacek et al. 2007; Southall et al. 2007), but
also fish (e.g., reviewed by Thomson et al. 2001; Herata 2007; Payne et al. 2008). There have been far
fewer studies on the effects of airgun noise (or indeed any type of noise) on sea turtles, and little is known
about the sound levels that will or will not elicit various types of behavioral reactions. There have been
four directed studies that focused on short-term behavioral responses of sea turtles in enclosures to single
airguns. However, comparisons of results among studies are difficult because experimental designs and
reporting procedures have varied greatly, and few studies provided specific information about the levels
of the airgun pulses received by the turtles. Although monitoring studies are now providing some
information on responses (or lack of responses) of free-ranging sea turtles to seismic surveys, we are not
aware of any directed studies on responses of free-ranging sea turtles to seismic sounds or on the long-
term effects of seismic or other sounds on sea turtles.
Directed Studies.―The most recent of the studies of caged sea turtles exposed to airgun pulses was
a study by McCauley et al. (2000a,b) off Western Australia. The authors exposed caged green and
loggerhead sea turtles (one of each) to pulses from an approaching and then receding 20 in3 airgun
operating at 1500 psi and a 5-m airgun depth. The single airgun fired every 10 s. There were two trials
separated by two days; the first trial involved ~2 h of airgun exposure and the second ~1 h. The results
from the two trials showed that, above a received level of 166 dB re 1 Pa (rms) 9, the turtles noticeably
____________________________________
9 rms = root mean square. This measure represents the average received sound pressure over the duration of the
pulse, with duration being defined in a specific way (from the time when 5% of the pulse energy has been received
to the time when 95% of the energy has been received). The rms received level of a seismic pulse is typically
Appendix C. Airgun Sounds and Sea Turtles
Environmental Assessment for L-DEO’s Shatsky Rise Seismic Survey, 2012 Page 166
increased their swim speed relative to periods when no airguns were operating. The behavior of the sea
turtles became more erratic when received levels exceeded 175 dB re 1 Pa rms. The authors suggested
that the erratic behavior exhibited by the caged sea turtles would likely, in unrestrained turtles, be
expressed as an avoidance response (McCauley et al. 2000a,b).
O‘Hara and Wilcox (1990) tested the reactions to airguns by loggerhead sea turtles held in a 300 ×
45 m area of a canal in Florida with a bottom depth of 10 m. Nine turtles were tested at different times.
The sound source consisted of one 10 in3 airgun plus two 0.8 in
3 ―poppers‖ operating at 2000 psi
10 and an
airgun-depth of 2 m for prolonged periods of 20–36 h. The turtles maintained a standoff range of about
30 m when exposed to airgun pulses every 15 or 7.5 s. Some turtles may have remained on the bottom of
the enclosure when exposed to airgun pulses. O‘Hara and Wilcox (1990) did not measure the received
airgun sound levels. McCauley et al. (2000a,b) estimated that ―the level at which O‘Hara saw avoidance
was around 175–176 dB re 1 Pa rms.‖ The levels received by the turtles in the Florida study probably
were actually a few dB less than 175–176 dB because the calculations by McCauley et al. apparently did
not allow for the shallow 2-m airgun depth in the Florida study. The effective source level of airguns is
less when they are at a depth of 2 m vs. 5 m (Greene et al. 2000).
Moein et al. (1994) investigated the avoidance behavior and physiological responses of loggerhead
turtles exposed to an operating airgun, as well as the effects on their hearing. The turtles were held in a
netted enclosure ~18 m by 61 m by 3.6 m deep, with an airgun of unspecified size at each end. Only one
airgun was operated at any one time; the firing rate was one shot every 5–6 s. Ten turtles were tested
individually, and seven of these were retested several days later. The airgun was initially discharged
when the turtles were near the center of the enclosure and the subsequent movements of the turtles were
documented. The turtles exhibited avoidance during the first presentation of airgun sounds at a mean
range of 24 m, but the avoidance response waned quickly. Additional trials conducted on the same turtles
several days later did not show statistically significant avoidance reactions. However, there was an indi-
cation of slight initial avoidance followed by rapid waning of the avoidance response which the authors
described as ―habituation‖. Their auditory study indicated that exposure to the airgun pulses may have
resulted in temporary threshold shift (TTS; see later section). Reduced hearing sensitivity may also have
contributed to the waning response upon continued exposure. Based on physiological measurements,
there was some evidence of increased stress in the sea turtles, but this stress could also have resulted from
handling of the turtles.
Inconsistencies in reporting procedures and experimental design prevent direct comparison of this
study with either McCauley et al. (2000a,b) or O‘Hara and Wilcox (1990). Moein et al. (1994) stated,
without further details, that ―three different decibel levels (175, 177, 179) were utilized‖ during each test.
These figures probably are received levels in dB re 1 Pa, and probably relate to the initial exposure
distance (mean 24 m), but these details were not specified. Also, it was not specified whether these
values were measured or estimated, or whether they are expressed in peak-peak, peak, rms, SEL, or some
about 10 dB less than its peak level, and about 16 dB less than its peak-to-peak level (Greene et al. 1997, 2000;
McCauley et al. 1998, 2000a,b).
10 There was no significant reaction by five turtles during an initial series of tests with the airguns operating at the
unusually low pressure of 1000 psi. The source and received levels of airgun sounds would have been
substantially lower when the air pressure was only 1000 psi than when it was at the more typical operating
pressure of 2000 psi.
Appendix C. Airgun Sounds and Sea Turtles
Environmental Assessment for L-DEO’s Shatsky Rise Seismic Survey, 2012 Page 167
other units. Given the shallow water in the enclosure (3.6 m), any estimates based on simple assumptions
about propagation would be suspect.
Lenhardt (2002) exposed captive loggerhead sea turtles while underwater to seismic airgun (Bolt
600) sounds in a large net enclosure. At received levels of 151–161 dB, turtles were found to increase
swimming speeds. Similar to the McCauley et al. studies (2000a,b--see above), near a received level of
~175 dB, an avoidance reaction was common in initial trials, but habituation then appeared to occur.
Based on ABRs measured pre- and post-airgun exposures, a TTS of over 15 dB was found in one animal,
with recovery two weeks later. Lenhardt (2002) suggested that exposure of sea turtles to airguns at water
depths >10 m may result in exposure to more energy in the low frequencies with unknown biological
effects.
Despite the problems in comparing these studies, they are consistent in showing that, at some
received level, sea turtles show avoidance of an operating airgun. McCauley et al. (2000a,b) found
evidence of behavioral responses when the received level from a single small airgun was 166 dB re 1 Pa
rms and avoidance responses at 175 dB re 1 Pa rms. Based on these data, McCauley et al. estimated
that, for a typical airgun array (2678 in3, 12-elements) operating in 100–120 m water depth, sea turtles
may exhibit behavioral changes at ~2 km and avoidance around 1 km. These estimates are subject to
great variation, depending on the seismic source and local propagation conditions.
A further potential complication is that sea turtles on or near the bottom may receive sediment-
borne ―headwave‖ signals from the airguns (McCauley et al. 2000a,b). As previously discussed, it is
believed that sea turtles use bone conduction to hear. It is unknown how sea turtles might respond to the
headwave component of an airgun impulse or to bottom vibrations.
Related studies involving stimuli other than airguns may also be relevant. (1) Two loggerhead
turtles resting on the bottom of shallow tanks responded repeatedly to low-frequency (20–80 Hz) tones by
becoming active and swimming to the surface. They remained at the surface or only slightly submerged
for the remainder of the 1-min trial (Lenhardt 1994). Although no detailed data on sound levels at the
bottom vs. surface were reported, the surfacing response probably reduced the levels of underwater sound
to which the turtles were exposed. (2) In a separate study, a loggerhead and a Kemp‘s ridley sea turtle
responded similarly when vibratory stimuli at 250 or 500 Hz were applied to the head for 1 s (Lenhardt et
al. 1983). There appeared to be rapid habituation to these vibratory stimuli. (3) Turtles in tanks showed
agitated behaviour when exposed to simulated boat noise and recordings from the U.S. Navy‘s Low
Frequency Active (LFA) sonar (Samuel et al. 2005, 2006). The tones and vibratory stimuli used in these
two studies were quite different from airgun pulses. However, it is possible that resting sea turtles may
exhibit a similar ―alarm‖ response, possibly including surfacing or alternatively diving, when exposed to
any audible noise, regardless of whether it is a pulsed sound or tone.
Monitoring Results.―Data on sea turtle behavior near airgun operations have also been collected
during marine mammal and sea turtle monitoring and mitigation programs associated with various
seismic operations around the world. Although the primary objectives concerned marine mammals, sea
turtle sightings have also been documented in some of monitoring projects. Results suggest that some sea
turtles exhibit behavioral changes and/or avoidance within an area of unknown size near a seismic vessel.
However, avoidance of approaching seismic vessels is sufficiently limited and small-scale such that sea
turtles are often seen from operating seismic vessels. Also, average distances from the airguns to these
sea turtles are usually not greatly increased when the airguns are operating as compared with times when
airguns are silent.

Appendix C. Airgun Sounds and Sea Turtles
Environmental Assessment for L-DEO’s Shatsky Rise Seismic Survey, 2012 Page 168
For example, during six large-source (10–20 airguns; 3050–8760 in3) and small-source (up to six
airguns or three GI guns; 75–1350 in3) surveys conducted by L-DEO during 2003–2005, the mean closest
point of approach (CPA) for turtles was closer during non-seismic than seismic periods: 139 m vs. 228 m
and 120 m vs. 285 m, respectively (Holst et al. 2006). During a large-source L-DEO seismic survey off
the Pacific coast of Central America in 2008, the turtle sighting rate during non-seismic periods was
seven times greater than that during seismic periods (Holst and Smultea 2008). In addition, distances of
turtles seen from the seismic vessel were significantly farther from the airgun array when it was operating
(mean 159 m, n = 77) than when the airguns were off (mean 118 m, n = 69; Mann-Whitney U test,
P<0.001) (Holst and Smultea 2008). During another L-DEO survey in the Eastern Tropical Pacific in
2008, the turtle sighting rate during non-seismic periods was 1.5 times greater than that during seismic
periods; however, turtles tended to be seen closer to the airgun array when it was operating, but this
difference was not statistically significant (Hauser et al. 2008).
Weir (2007) reported on the behavior of sea turtles near seismic exploration operations off Angola,
West Africa. A total of 240 sea turtles were seen during 676 h of vessel-based monitoring, mainly for
associated marine mammals mitigation and monitoring observations. Airgun arrays with total volumes of
5085 and 3147 in3 were used at different times during the seismic program. Sea turtles tended to be seen
slightly closer to the seismic source, and at sighting rates twice as high, during non-seismic vs. seismic
periods (Weir 2007). However, there was no significant difference in the median distance of turtle
sightings from the array during non-seismic vs. seismic periods, with means of 743 m (n = 112) and 779
m (n = 57).
Off northeastern Brazil, 46 sea turtles were seen during 2028 h of vessel-based monitoring of
seismic exploration using 4–8 GI airguns (Parente et al. 2006). There were no apparent differences in
turtle sighting rates during seismic and non-seismic periods, but detailed behavioral data during seismic
operations were lacking (Parente et al. 2006).
Behavioral responses of marine mammals and fish to seismic surveys sometimes vary depending
on species, time of year, activity of the animal, and other unknown factors. The same species may show
different responses at different times of year or even on different days (e.g., Richardson et al. 1995;
Thomson et al. 2001). Sea turtles of different ages vary in size, behavior, feeding habits, and preferred
water depths. Nothing specific is known about the ways in which these factors may be related to airgun
sound effects in sea turtles. However, it is reasonable to expect lesser effects in young turtles concentrat-
ed near the surface (where levels of airgun sounds are attenuated) as compared with older turtles that
spend more time at depth where airgun sounds are generally stronger.
3. Possible Effects of Airgun Sounds on Distribution
In captive enclosures, sea turtles generally respond to seismic noise by startling, increasing
swimming speed, and/or swimming away from the noise source. Animals resting on the bottom often
become active and move toward the surface where received sound levels normally will be reduced,
although some turtles dive upon exposure. Unfortunately, quantitative data for free-ranging sea turtles
exposed to seismic pulses are very limited, and potential long-term behavioral effects of seismic exposure
have not been investigated. The paucity of data precludes clear predictions of sea turtle responses to
seismic noise. Available evidence suggests that localized behavioral and distributional effects on sea
turtles are likely during seismic operations, including responses to the seismic vessel, airguns, and other
gear (e.g., McCauley 1994; Pendoley 1997; Weir 2007). Pendoley (1997) summarized potential effects of
seismic operations on the behavior and distribution of sea turtles and identified biological periods and

Appendix C. Airgun Sounds and Sea Turtles
Environmental Assessment for L-DEO’s Shatsky Rise Seismic Survey, 2012 Page 169
habitats considered most sensitive to potential disturbance. The possible responses of free-ranging sea
turtles to seismic pulses could include
avoiding the entire seismic survey area to the extent that turtles move to less preferred habitat;
avoiding only the immediate area around the active seismic vessel (i.e., local avoidance of the
source vessel but remain in the general area); and
exhibiting no appreciable avoidance, although short-term behavioral reactions are likely.
Complete avoidance of an area, if it occurred, could exclude sea turtles from their preferred
foraging area and could displace them to areas where foraging is sub-optimal. Avoidance of a preferred
foraging area may prevent sea turtles from obtaining preferred prey species and hence could impact their
nutritional status. The potential alteration of a migration route might also have negative impacts.
However, it is not known whether avoidance by sea turtles would ever be on a sufficient geographic scale,
or be sufficiently prolonged, to prevent turtles from reaching an important destination.
Available evidence suggests that the zone of avoidance around seismic sources is not likely to exceed
a few kilometers (McCauley et al. 2000a,b). Avoidance reactions on that scale could prevent sea turtles
from using an important coastal area or bay if there was a prolonged seismic operation in the area,
particularly in shallow waters (e.g., Pendoley 1997). Sea turtles might be excluded from the area for the
duration of the seismic operation, or they might remain but exhibit abnormal behavioral patterns (e.g.,
lingering longer than normal at the surface where received sound levels are lower). Whether those that were
displaced would return quickly after the seismic operation ended is unknown.
It is unclear whether exclusion from a particular nesting beach by seismic operations, if it occurred,
would prevent or decrease reproductive success. It is believed that females migrate to the region of their
birth and select a nesting beach (Miller 1997). However, the degree of site fidelity varies between species
and also intra-seasonally by individuals. If a sea turtle is excluded from a particular beach, it may select a
more distant, undisturbed nesting site in the general area (Miller 1997). For instance, Bjorndal et al.
(1983) reported a maximal intra-seasonal distance between nesting sites of 290 km, indicating that turtles
use multiple nesting sites spaced up to a few hundred kilometers apart. Also, it is uncertain whether a
turtle that failed to go ashore because of seismic survey activity would abandon the area for that full
breeding cycle, or would simply delay going ashore until the seismic vessel moved to a different area.
Shallow coastal waters can contain relatively high densities of sea turtles during nesting, hatching,
and foraging periods. Thus, seismic operations in these areas could correspondingly impact a relatively
higher number of individual turtles during sensitive biological periods. Samuel et al. (2005) noted that
anthropogenic noise in vital sea turtle habitats, such as a major coastal foraging area off Long Island, NY,
could affect sea turtle behaviour and ecology. There are no specific data that demonstrate the conse-
quences to sea turtles if seismic operations with large or small arrays of airguns occur in important areas
at biologically important times of year. However, a number of mitigation measures can, on a case-by-
case basis, be considered for application in areas important to sea turtles (e.g., Pendoley 1997).
4. Possible Impacts of Airgun Sounds on Hearing
Noise-induced hearing damage can be either temporary or permanent. In general, the received
sound must be strong for either to occur, and must be especially strong and/or prolonged for permanent
impairment to occur.
Few studies have directly investigated hearing or noise-induced hearing loss in sea turtles. Moein
et al. (1994) used an evoked potential method to test the hearing of loggerhead sea turtles exposed to a
few hundred pulses from a single airgun. Turtle hearing was tested before, within 24 h after, and two

Appendix C. Airgun Sounds and Sea Turtles
Environmental Assessment for L-DEO’s Shatsky Rise Seismic Survey, 2012 Page 170
weeks after exposure to pulses of airgun sound. Levels of airgun sound to which the turtles were exposed
were not specifically reported. The authors concluded that five turtles exhibited some change in their
hearing when tested within 24 h after exposure relative to pre-exposure hearing, and that hearing had
reverted to normal when tested two weeks after exposure. The results are consistent with the occurrence
of TTS upon exposure of the turtles to airgun pulses. Unfortunately, the report did not state the size of the
airgun used, or the received sound levels at various distances. The distances of the turtles from the airgun
were also variable during the tests; the turtle was about 30 m from the airgun at the start of each trial, but
it could then either approach the airgun or move away to a maximum of about 65 m during subsequent
airgun pulses. Thus, the levels of airgun sounds that apparently elicited TTS are not known. Nonethe-
less, it is noteworthy that there was evidence of TTS from exposure to pulses from a single airgun.
However, the turtles were confined and unable to move more than about 65 m away. Similarly, Lenhardt
(2002) exposed loggerhead turtles in a large net enclosure to airgun pulses. A TTS of >15 dB was
evident for one loggerhead turtle, with recovery occurring in two weeks. Turtles in the open sea might
have moved away from an airgun operating at a fixed location, and in the more typical case of a towed
airgun or airgun array, very few shots would occur at or around one location. Thus, exposure to
underwater sound during net-enclosure experiments was not typical of that expected during an operational
seismic survey.
Studies with terrestrial reptiles have demonstrated that exposure to airborne impulse noise can
cause hearing loss. For example, desert tortoises (Gopherus agassizii) exhibited TTS after exposure to
repeated high-intensity sonic booms (Bowles et al. 1999). Recovery from these temporary hearing losses
was usually rapid (<1 h), which suggested that tortoises can tolerate these exposures without permanent
injury (Bowles et al. 1999).
The results from captive, restrained sea turtles exposed repeatedly to seismic sounds in enclosed
areas indicate that TTS is possible under these artificial conditions. However, there are no data to
indicate whether there are any plausible field situations in which exposure to repeated airgun pulses at
close range could cause permanent threshold shift (PTS) or hearing impairment in sea turtles. Hearing
impairment (whether temporary or permanent) from seismic sounds is considered unlikely to occur at sea;
turtles are unlikely to be exposed to more than a few strong pulses close to the sound source, as individ-
uals are mobile and the vessel travels relatively quickly compared to the swimming speed of a sea turtle.
However, in the absence of specific information on received levels of impulse sound necessary to elicit
TTS and PTS in sea turtles, it is uncertain whether there are circumstances where these effects could
occur in the field. If sea turtles exhibit little or no behavioral avoidance, or if they acclimate to seismic
noise to the extent that avoidance reactions cease, sea turtles might sustain hearing loss if they are close
enough to seismic sources. Similarly, in the absence of quantitative data on behavioral responses, it is
unclear whether turtles in the area of seismic operations prior to start-up move out of the area when
standard ramp-up (=soft-start) procedures are in effect. It has been proposed that sea turtles require a
longer ramp-up period because of their relatively slow swimming speeds (Eckert 2000). However, it is
unclear at what distance (if any) from a seismic source sea turtles could sustain hearing impairment, and
whether there would ever be a possibility of exposure to sufficiently high levels for a sufficiently long
period to cause permanent hearing damage.
In theory, a reduction in hearing sensitivity, either temporary or permanent, may be harmful for sea
turtles. However, very little is known about the role of sound perception in the sea turtle‘s normal activ-
ities. While it is not possible to estimate how much of a problem it would be for a turtle to have either
temporary or permanent hearing impairment, there is some evidence indicating that hearing plays an
important role in sea turtle survival. (1) It has been suggested (Eckert et al. 1998; Eckert 2000) that sea

Appendix C. Airgun Sounds and Sea Turtles
Environmental Assessment for L-DEO’s Shatsky Rise Seismic Survey, 2012 Page 171
turtles may use passive reception of acoustic signals to detect the hunting sonar of killer whales (Orcinus
orca), a known predator of leatherback sea turtles Dermochelys coriacea (Fertl and Fulling 2007).
Further investigation is needed before this hypothesis can be accepted. Some communication calls of
killer whales include components at frequencies low enough to overlap the frequency range where sea
turtles hear. However, the echolocation signals of killer whales are at considerably higher frequencies
and may be inaudible to sea turtles (e.g., Simon et al. 2007). (2) Hearing impairment, either temporary or
permanent, might inhibit a turtle‘s ability to avoid injury from vessels. A recent study found that green
sea turtles often responded behaviorally to close, oncoming small vessels and that the nature of the
response was related to vessel speed, with fewer turtles displaying a flee response as vessel speed
increased (Hazel et al. 2007). However, Hazel et al. (2007) suggested that a turtles‘ ability to detect an
approaching vessel was vision-dependent. (3) Hearing may play a role in navigation. For example, it has
been proposed that sea turtles may identify their breeding beaches by their acoustic signature (Lenhardt et
al. 1983). However, available evidence suggests that visual, wave, and magnetic cues are the main
navigational cues used by sea turtles, at least in the case of hatchlings and juveniles (Lohmann et al. 1997,
2001; Lohmann and Lohmann 1998).
5. Other Physical Effects
Other potential direct physical effects to sea turtles during seismic operations include entanglement
with seismic gear (e.g., cables, buoys, streamers, etc.) and ship strikes (Pendoley 1997; Ketos Ecology
2007; Weir 2007; Hazel et al. 2007). Entanglement of sea turtles with marine debris, fishing gear, and
other equipment has been documented; turtles can become entangled in cables, lines, nets, or other objects
suspended in the water column and can become injured or fatally wounded, drowned, or suffocated (e.g.,
Lutcavage et al. 1997). Seismic-survey personnel have reported that sea turtles (number unspecified)
became fatally entrapped between gaps in tail-buoys associated with industrial seismic vessel gear
deployed off West Africa in 2003 (Weir 2007). However, no incidents of entanglement of sea turtles
have been documented during NSF-funded seismic surveys, which since 2003 have included dedicated
ship-based monitoring by trained biological observers, in some cases in areas with many sea turtles
(e.g.,Holst et al. 2005a,b; Holst and Smultea 2008; Hauser et al. 2008).
6. Conclusions
Based on available data concerning sea turtles and other marine animals, it is likely that some sea
turtles exhibit behavioral changes and/or avoidance within an area of unknown size near an operating
seismic survey vessel. There is also the possibility of temporary hearing impairment or perhaps even
permanent hearing damage to turtles close to the airguns. However, there are very few data on temporary
hearing loss and no data on permanent hearing loss in sea turtles exposed to airgun pulses. Although
some information is available about effects of exposure to sounds from a single airgun on captive sea
turtles, the long term acoustic effects (if any) of a full-scale marine seismic operation on free-ranging sea
turtles are unknown. Entanglement of turtles in seismic gear and vessel strikes during seismic survey
operations are also possible but do not seem to be common. The greatest impact is likely to occur if
seismic operations occur in or near areas where turtles concentrate, and at seasons when turtles are con-
centrated there. However, there are no specific data that demonstrate the consequences of such seismic
operations to sea turtles. Until more data become available, it would be prudent to avoid seismic opera-
tions near important nesting beaches or in areas of known concentrated feeding during times of year when
those areas are in use by many sea turtles.
Appendix C. Airgun Sounds and Sea Turtles
Environmental Assessment for L-DEO’s Shatsky Rise Seismic Survey, 2012 Page 172
7. Literature Cited
Bartol, S.M. 2004. Sea turtle hearing and sensitivity to acoustic impact. Appendix H In: Geophysical and
geophysical exploration for mineral resources on the Gulf of Mexico outer continental shelf. OCS EIS/EA
MMS 2004-054. U.S. Minerals Manage. Serv. Gulf of Mexio OCS Region, New Orleans, LA.
Bartol, S.M. 2008. A review of auditory function of sea turtles. Bioacoustics 17(1-3):57-59.
Bartol, S.M. and D.R. Ketten. 2006. Turtle and tuna hearing. p. 98-103 In: Y. Swimmer and R. Brill (eds.), Sea
Turtle and Pelagic Fish Sensory Biology: Developing Techniques to Reduce Sea Turtle Bycatch in Longline
Fisheries. NOAA Tech. Memo. NMFS-PIFSC-7.
Bartol, S.M. and J. A. Musick. 2003. Sensory biology of sea turtles. p. 79-102 In: P.L. Lutz, J.A. Musick and J.
Wyneken (eds.), The Biology of Sea Turtles, Volume 2. CRC Press, Boca Raton, FL. 455 p.
Bartol, S.M., J.A. Musick, and M.L. Lenhardt. 1999. Auditory evoked potentials of the loggerhead sea turtle
(Caretta caretta). Copeia 1999(3):836-840.
Bjorndal K.A., A.B. Meylan, and B.J. Turner. 1983. Sea turtles nesting at Melbourne Beach, Florida, I. Size,
growth and reproduction. Biol. Conserv. 26(1):65-77.
Bowles, A.E., S. Eckert, L. Starke, E. Berg, L. Wolski, and J. Matesic, Jr. 1999. Effects of flight noise from jet
aircraft and sonic booms on hearing, behavior, heart rate, and oxygen consumption of desert tortoises
(Gopherus agassizii). U.S. Air Force Res. Lab., Wright-Patterson AFB, OH. 131 p.
Dow, W.E., D.A. Mann, T.T. Jones, S.A. Eckert, and C.A. Harms. 2008. In-water and in-air hearing sensitivity of
the green sea turtle (Chelonia mydas). Abstract, Acoustic Communication by Animals, 2nd
Intern. Conf., 12-
15 August 2008, Corvallis, OR.
Eckert, S.A. 2000. Letter to M. James, Nova Scotia Leatherback Turtle Working Group, re: possible impacts of
seismic exploration off Nova Scotia on sea turtles. Hubbs-Sea World Res. Inst., San Diego, CA. 4 p.
Eckert, S.A., A. Bowles, and E. Berg. 1998. The effect of seismic airgun surveys on leatherback sea turtles
(Dermochelys coriacea) during the nesting season. Rep. from Hubbs-Sea World Res. Inst., San Diego, CA,
for BHP Petroleum (Trinidad) Ltd. 67 p.
Fertl, D. and G.L. Fulling. 2007. Interactions between marine mammals and sea turtles. Mar. Turtle Newsl.
115:4-8.
Gordon, J., D. Gillespie, J. Potter, A. Frantzis, M.P. Simmonds, R. Swift, and D. Thompson. 2004. A review of the
effects of seismic surveys on marine mammals. Mar. Technol. Soc. J. 37(4):16-34.
Greene, C.R., Jr., with J.S. Hanna and R.W. Blaylock. 1997. Physical acoustics measurements. p. 3-1 to 3-63 In:
W.J. Richardson (ed.), Northstar marine mammal monitoring program, 1996: marine mammal and acoustical
monitoring of a seismic program in the Alaskan Beaufort Sea. LGL Rep. 2121-2. Rep. from LGL Ltd., King
City, Ont., and Greeneridge Sciences Inc., Santa Barbara, CA, for BP Explor. (Alaska) Inc., Anchorage, AK,
and Nat. Mar. Fish. Serv., Anchorage, AK, and Silver Spring, MD. 245 p.
Greene, C.R., Jr. and W.C. Burgess, with R. Norman and R.W. Blaylock. 2000. Physical acoustics measurements,
1999. p. 3-1 to 3-45 In: W.J. Richardson (ed.), Marine mammal and acoustical monitoring of Western Geo-
physical's open-water seismic program in the Alaskan Beaufort Sea, 1999. LGL Rep. TA2313-4. Rep. from
LGL Ltd., King City, Ont., and Greeneridge Sciences Inc., Santa Barbara, CA, for Western Geophysical,
Houston, TX, and U.S. Nat. Mar. Fish. Serv., Anchorage, AK, and Silver Spring, MD. 155 p.
Hauser, D.D.W., M Holst, and V.M. Moulton. 2008. Marine mammal and sea turtle monitoring during Lamont-
Doherty Earth Observatory‘s marine seismic program in the Eastern Tropical Pacific, April – August 2008.
LGL Rep. TA4656/7-1. Rep. from LGL Ltd., St. John‘s, Nfld, for Lamont-Doherty Earth Observatory of
Columbia Univ., Palisades, NY, and Nat. Mar. Fish. Serv., Silver Spring, MD. 98 p.
Appendix C. Airgun Sounds and Sea Turtles
Environmental Assessment for L-DEO’s Shatsky Rise Seismic Survey, 2012 Page 173
Hazel, J., I.R. Lawler, H. Marsh, and S. Robson. 2007. Vessel speed increases collision risk for the green turtle
Chelonia mydas. Endang. Species Res. 3:105-113.
Herata, H. (ed.). 2007. International workshop, Impacts of Seismic Survey Activities on Whales and Other Marine
Biota. Dessau, Germany, Sept. 2006.
Holst, M. and M.A. Smultea. 2008. Marine mammal and sea turtle monitoring during Lamont-Doherty Earth
Observatory‘s marine seismic program off Central America, February – April 2008. LGL Rep. TA4342-3.
Rep. from LGL Ltd., King City, Ont., for Lamont-Doherty Earth Observatory of Columbia Univ., Palisades,
NY, and Nat. Mar. Fish. Serv., Silver Spring, MD. 133 p.
Holst, M., M.A. Smultea, W.R. Koski, and B. Haley. 2005a. Marine mammal and sea turtle monitoring during
Lamont-Doherty Earth Observatory‘s marine seismic program in the Eastern Tropical Pacific Ocean off
Central America, November–December 2004. LGL Rep. TA2822-30. Rep. from LGL Ltd., King City, Ont.,
for Lamont-Doherty Earth Observatory, Columbia Univ., Palisades, NY, and NMFS, Silver Spring, MD.
Holst, M., M.A. Smultea, W.R. Koski, and B. Haley. 2005b. Marine mammal and sea turtle monitoring during
Lamont-Doherty Earth Observatory‘s marine seismic program off the Northern Yucatán Peninsula in the
Southern Gulf of Mexico, January–February 2005. LGL Rep. TA2822-31. Rep. from LGL Ltd., King City,
Ont., for Lamont-Doherty Earth Observatory, Columbia Univ., Palisades, NY, and NMFS, Silver Spring,
MD. 110 p.
Holst, M., W.J. Richardson, W.R. Koski, M.A. Smultea, B. Haley, M.W. Fitzgerald, and M. Rawson. 2006. Effects
of large and small-source seismic surveys on marine mammals and sea turtles. Abstract. Presented at Am.
Geophys. Union - Soc. Explor. Geophys. Joint Assembly on Environ. Impacts from Marine Geophys. &
Geological Studies - Recent Advances from Academic & Industry Res. Progr., Baltimore, MD, May 2006.
Ketos Ecology. 2007. Reducing the fatal entrapment of marine turtles in towed seismic survey equipment. Ketos
Ecology report. Available at www.ketosecology.co.uk/KE2007.pdf. 11 p.
Ketten, D.R. and S.M. Bartol. 2006. Functional measures of sea turtle hearing, ONR Award No: N00014-02-1-
0510. Rep. from Woods Hole Oceanogr. Inst., Woods Hole, MA, and Virginia Inst. Mar. Sci., Gloucester,
VA, for Office of Naval Res., Arlington, VA. 5 p.
Ketten, D.R., I. Fischer, S. Cramer, S.M. Bartol, and J. O‘Malley. 2006. Water, fats, and acoustic impedance: soft
tissue adaptations for underwater hearing in turtles, seabirds and marine mammals. p. 162 In: N.J. Pilcher
(ed.), Proc. 23rd
Symp. on Sea Turtle Biology and Conservation. NOAA Tech. Memo. NMFS-SEFSC-536.
283 p.
Lenhardt, M.L. 1982. Bone conduction hearing in turtles. J. Aud. Res. 22(3):153-160.
Lenhardt, M.L. 1994. Seismic and very low frequency sound induced behaviors in captive loggerhead marine
turtles (Caretta caretta). p. 238-241 In: K.A. Bjorndal, A.B. Bolten, D.A. Johnson and P.J. Eliazar (eds.),
Proc. 14th
Symp. on Sea Turtle Biology and Conservation. NOAA Tech. Memo. NMFS-SEFSC-351. 323 p.
Lenhardt, M. 2002. Sea turtle auditory behavior. J. Acoust. Soc. Amer. 112(5, Pt. 2):2314 (Abstract).
Lenhardt, M.L. and S.W. Harkins. 1983. Turtle shell as an auditory receptor. J. Aud. Res. 23(4):251-260.
Lenhardt, M.L., S. Bellmund, R.A. Byles, S.W. Harkins, and J.A. Musick. 1983. Marine turtle reception of bone-
conducted sound. J. Aud. Res. 23(2):119-125.
Lenhardt, M.L., R.C. Klinger, and J.A. Musick. 1985. Marine turtle middle-ear anatomy. J. Aud. Res. 25(1):66-
72.
Lohmann, K.J. and C.M.F. Lohmann. 1998. Migratory guidance mechanisms in marine turtles. J. Avian Biol.
29(4):585-596.
Appendix C. Airgun Sounds and Sea Turtles
Environmental Assessment for L-DEO’s Shatsky Rise Seismic Survey, 2012 Page 174
Lohmann, K.J., B.E. Witherington, C.M.F. Lohmann, and M. Salmon. 1997. Orientation, navigation, and natal
beach homing in sea turtles. p. 107-135 In: P.L. Lutz and J.A. Musick (eds.), The biology of sea turtles.
CRC Press, Boca Raton, FL. 432 p.
Lohmann, K.J., S.D. Cain, S.A. Dodge, and C.M.F. Lohmann. 2001. Regional magnetic fields as navigational
markers for sea turtles. Science 294(5541):364-366.
Lutcavage, M.E., P. Plotkin, B. Witherington, and P.L. Lutz. 1997. Human impacts on sea turtle survival. p. 387-
409 In: P.L. Lutz and J.A. Musick (eds.), The biology of sea turtles. CRC Press, Boca Raton, FL. 432 p.
McCauley, R.D. 1994. The environmental implications of offshore oil and gas development in Australia – seismic
surveys. p. 19-122 In: M. Swan, J.M. Neff and P.C. Young (eds.), Environmental Implications of Offshore
Oil and Gas Development in Australia - The Findings of an Independent Scientific Review. Australian
Petroleum Explor. Assoc. and Energy Research and Developm. Corp., Sydney, N.S.W.
McCauley, R.D., M.-N. Jenner, C. Jenner, K.A. McCabe, and J. Murdoch. 1998. The response of humpback whales
(Megaptera novaeangliae) to offshore seismic survey noise: preliminary results of observations about a
working seismic vessel and experimental exposures. APPEA J. 38:692-707.
McCauley, R.D., J. Fewtrell, A.J. Duncan, C. Jenner, M-N. Jenner, J.D. Penrose, R.I.T. Prince, A. Adhitya, J.
Murdoch, and K. McCabe. 2000a. Marine seismic surveys – a study of environmental implications.
APPEA J. 40:692-708.
McCauley, R. D., J. Fewtrell, A.J. Duncan, C. Jenner, M.-N. Jenner, J.D. Penrose, R.I.T. Prince, A. Adhitya, J.
Murdoch, and K. McCabe. 2000b. Marine seismic surveys: Analysis and propagation of air-gun signals; and
effects of air-gun exposure on humpback whales, sea turtles, fishes and squid. Curtin Univ. Technol., Centre
for Mar. Sci. and Technol., Bentley, Australia.
Miller, J.D. 1997. Reproduction in sea turtles. p. 51-81 In: P.L. Lutz and J.A. Musick (eds.), The Biology of Sea
Turtles. CRC Press, Boca Raton, FL. 432 p.
Moein, S.E., J.A. Musick, J.A. Keinath, D.E. Barnard, M. Lenhardt, and R. George. 1994. Evaluation of seismic
sources for repelling sea turtles from hopper dredges. Rep. from Virginia Inst. Mar. Sci. [Gloucester Point],
VA, for U.S. Army Corps of Engineers. 33 p.
National Marine Fisheries Service (NMFS). 2007. Endangered Species Act, Section 7 Consultation, Biological
Opinion: Issuance of License to Neptune LNG by MARAD to Construct, Own, and Operate an LNG
Deepwater Port, FINE W2006104000. National Marine Fisheries Service, Northeast Region, Gloucester,
MA.
Nowacek, D.P., L.H. Thorne, D.W. Johnston, and P.L. Tyack. 2007. Responses of cetaceans to anthropogenic
noise. Mammal Rev. 37(2):81-115.
O‘Hara, J. and J.R. Wilcox. 1990. Avoidance responses of loggerhead turtles, Caretta caretta, to low frequency
sound. Copeia 1990(2):564-567.
ONR (Office of Naval Research). N.D. Science and Technology Focus, Oceanography, Ocean Life: Green sea
turtle – Current research. http://www.onr.navy.mil/focus/ocean/life/turtle4.htm. Last update not indicated.
Accessed 3 March 2009.
Parente, C.L., J.D. Lontra, and M.E. de Araújo. 2006. Occurrence of sea turtles during seismic surveys in
Northeastern Brazil. Biota Neotropica 6(1). Available at http://www.biotaneotropica.org.br/
Payne, J.F., C. Andrews, L. Fancey, D. White, and J. Christian. 2008. Potential effects of seismic energy on fish
and shellfish: An update since 2003. Canadian Science Advisory Secretariat Research Document 2008/060.
Department of Fisheries and Oceans Canada. www.dfo-mpo.gc.ca/CSAS/Csas/Publications/ResDocs-
DocRech/2008/2008_060_e.htm. Lasted updated 26 November 2008. Accessed 3 March 2009.

Appendix C. Airgun Sounds and Sea Turtles
Environmental Assessment for L-DEO’s Shatsky Rise Seismic Survey, 2012 Page 175
Pendoley, K. 1997. Sea turtles and management of marine seismic programs in Western Australia. Petrol. Expl.
Soc. Austral. J. 25:8-16.
Richardson, W.J., C.R. Greene, Jr., C.I. Malme, and D.H. Thomson. 1995. Marine mammals and noise. Academic
Press, San Diego, CA. 576 p.
Ridgway, S.H., E.G. Wever, J.G. McCormick, J. Palin, and J.H. Anderson. 1969. Hearing in the giant sea turtle,
Chelonia mydas. Proc. Nat. Acad. Sci. U.S. 64(2):884-890.
Samuel, Y., S.J. Morreale, C.W. Clark, C.H. Greene, and M.E. Richmond. 2005. Underwater, low-frequency noise
in a coastal sea turtle habitat. J. Acoust. Soc. Am. 117(3):1465-1472.
Samuel, Y., S.J. Morreale, C.W. Clark, M.E. Richmond, and C.H. Greene. 2006. Underwater noise and
anthropogenic disturbance in critical sea turtle habitats. p. 93 In: N.J. Pilcher (ed.), Proc. 23rd
Symp. on Sea
Turtle Biology and Conservation. NOAA Tech. Memo. NMFS-SEFSC-536. 283 p.
Simon, M., M. Wahlberg, and L.E. Miller. 2007. Echolocation clicks from killer whales (Orcinus orca) feeding on
herring (Clupea harengus) (L). J. Acoust. Soc. Amer. 121(2):749-752.
Southall, B.L., A.E. Bowles, W.T. Ellison, J.J. Finneran, R.L. Gentry, C.R. Greene Jr., D. Kastak, D.R. Ketten, J.H.
Miller, P.E. Nachtigall, W.J. Richardson, J.A. Thomas, and P.L. Tyack. 2007. Marine mammal noise expo-
sure criteria: initial scientific recommendations. Aquat. Mamm. 33(4):411-522.
Southwood, A., K. Fritsches, R. Brill, and Y. Swimmer. 2008. Sound, chemical, and light detection in sea turtles
and pelagic fishes: sensory-based approaches to bycatch reduction in longling fisheries. Endang. Species
Res. 5:225-238.
Streeter, K. 2003. Studying the hearing capabilities of a green sea turtle. Abstract. Presented at Environmental
Consequences of Underwater Sound (ECOUS) Symposium. San Antonio, TX, May 2003.
Thomson, D.H., J.W. Lawson, and A. Muecke. 2001. Proceedings of a workshop to develop methodologies for
conducting research on the effects of seismic exploration on the Canadian east coast fishery, Halifax, Nova
Scotia, 7-8 September 2000. ESRF Rep. 139. Environ. Stud. Res. Funds, Calgary, AB. 75 p.
Weir, C.R. 2007. Observations of marine turtles in relation to seismic airgun sound off Angola. Mar. Turtle
Newsl. 116:17-20.
Wolski, L.F., R.C. Anderson, A.E. Bowles, and P.K. Yochem. 2003. Measuring hearing in the harbor seal (Phoca
vitulina): Comparison of behavioral and auditory brainstem response techniques. J. Acoust. Soc. Am.
113(1):629-637.
Appendix D: Airgun Sounds and Fish
Environmental Assessment for L-DEO’s Shatsky Rise Seismic Survey, 2012 Page 176
APPENDIX D:
REVIEW OF THE EFFECTS OF AIRGUN SOUNDS ON FISHES11
Here we review literature about the effects of airgun sounds on fishes during seismic surveys. The
potential effect of seismic sounds on fish has been studied with a variety of taxa, including marine,
freshwater, and anadromous species (reviewed by Fay and Popper 2000; Ladich and Popper 2004;
Hastings and Popper 2005; Popper and Hastings 2009a,b).
It is sometimes difficult to interpret studies on the effects of underwater sound on marine animals
because authors often do not provide enough information, including received sound levels, source sound
levels, and specific characteristics of the sound. Specific characteristics of the sound include units and
references, whether the sound is continuous or impulsive, and its frequency range. Underwater sound
pressure levels are typically reported as a number of decibels referenced to a reference level, usually
1 micro-Pascal (µPa). However, the sound pressure dB number can represent multiple types of measure-
ments, including ―zero to peak‖, ―peak to peak‖, or averaged (―rms‖). Sound exposure levels (SEL) may
also be reported as dB. The SEL is the integration of all the acoustic energy contained within a single
sound event. Unless precise measurement types are reported, it can be impossible to directly compare
results from two or more independent studies.
1. Acoustic Capabilities
Sensory systems – like those that allow for hearing – provide information about an animal‘s
physical, biological, and social environments, in both air and water. Extensive work has been done to
understand the structures, mechanisms, and functions of animal sensory systems in aquatic environments
(Atema et al. 1988; Kapoor and Hara 2001; Collin and Marshall 2003). All fish species have hearing and
skin-based mechanosensory systems (inner ear and lateral line systems, respectively) that provide
information about their surroundings (Fay and Popper 2000). Fay (2009) and some others refer to the
ambient sounds to which fishes are exposed as ‗underwater soundscapes‘. Anthropogenic sounds can
have important negative consequences for fish survival and reproduction if they disrupt an individual‘s
ability to sense its soundscape, which often tells of predation risk, prey items, or mating opportunities.
Potential negative effects include masking of key environmental sounds or social signals, displacement of
fish from their habitat, or interference with sensory orientation and navigation.
Fish hearing via the inner ear is typically restricted to low frequencies. As with other vertebrates,
fish hearing involves a mechanism whereby the beds of hair cells (Howard et al. 1988; Hudspeth and
Markin 1994) located in the inner ear are mechanically affected and cause a neural discharge (Popper and
Fay 1999). At least two major pathways for sound transmittance between sound source and the inner ear
have been identified for fishes. The most primitive pathway involves direct transmission to the inner
ear‘s otolith, a calcium carbonate mass enveloped by sensory hairs. The inertial difference between the
dense otolith and the less-dense inner ear causes the otolith to stimulate the surrounding sensory hair
cells. This motion differential is interpreted by the central nervous system as sound.
The second transmission pathway between sound source and the inner ear of fishes is via the swim
bladder, a gas-filled structure that is much less dense than the rest of the fish‘s body. The swim bladder,
being more compressible and expandable than either water or fish tissue, will differentially contract and
____________________________________
11
By John R. Christian and R.C. Bocking, LGL Ltd., environmental research associates (rev. Feb. 2010)
Appendix D: Airgun Sounds and Fish
Environmental Assessment for L-DEO’s Shatsky Rise Seismic Survey, 2012 Page 177
expand relative to the rest of the fish in a sound field. The pulsating swim bladder transmits this
mechanical disturbance directly to the inner ear (discussed below). Such a secondary source of sound
detection may be more or less effective at stimulating the inner ear depending on the amplitude and
frequency of the pulsation, and the distance and mechanical coupling between the swim bladder and the
inner ear (Popper and Fay 1993).
A recent paper by Popper and Fay (2010) discusses the designation of fishes based on sound
detection capabilities. They suggest that the designations ‗hearing specialist‘ and ‗hearing generalist‘ no
longer be used for fishes because of their vague and sometimes contradictory definitions, and that there is
instead a range of hearing capabilities across species that is more like a continuum, presumably based on
the relative contributions of pressure to the overall hearing capabilities of a species.
According to Popper and Fay (2010), one end of this continuum is represented by fishes that only
detect particle motion because they lack pressure-sensitive gas bubbles (e.g., swim bladder). These
species include elasmobranchs (e.g., sharks) and jawless fishes, and some teleosts including flatfishes.
Fishes at this end of the continuum are typically capable of detecting sound frequencies below 1500 Hz.
The other end of the fish hearing continuum is represented by fishes with highly specialized
otophysic connections between pressure receptive organs, such as the swim bladder, and the inner ear.
These fishes include some squirrelfish, mormyrids, herrings, and otophysan fishes (freshwater fishes with
Weberian apparatus, an articulated series of small bones that extend from the swim bladder to the inner
ear). Rather than being limited to 1.5 kHz or less in hearing, these fishes can typically hear up to several
kHz. One group of fish in the anadromous herring sub-family Alosinae (shads and menhaden) can detect
sounds to well over 180 kHz (Mann et al. 1997, 1998, 2001). This may be the widest hearing range of
any vertebrate that has been studied to date. While the specific reason for this very high frequency
hearing is not totally clear, there is strong evidence that this capability evolved for the detection of the
ultrasonic sounds produced by echolocating dolphins to enable the fish to detect, and avoid, predation
(Mann et al. 1997; Plachta and Popper 2003).
All other fishes have hearing capabilities that fall somewhere between these two extremes of the
continuum. Some have unconnected swim bladders located relatively far from the inner ear (e.g.,
salmonids, tuna) while others have unconnected swim bladders located relatively close to the inner ear
(e.g., Atlantic cod, Gadus morhua). There has also been the suggestion that Atlantic cod can detect 38
kHz (Astrup and Møhl 1993). However, the general consensus was that this was not hearing with the ear;
probably the fish were responding to exceedingly high pressure signals from the 38-kHz source through
some other receptor in the skin, such as touch receptors (Astrup and Møhl 1998).
It is important to recognize that the swim bladder itself is not a sensory end organ, but rather an
intermediate part of the sound pathway between sound source and the inner ear of some fishes. The inner
ear of fishes is ultimately the organ that translates the particle displacement component into neural signals
for the brain to interpret as sound.
A third mechanosensory pathway found in most bony fishes and elasmobranchs (i.e., cartilaginous
fishes) involves the lateral line system. It too relies on sensitivity to water particle motion. The basic
sensory unit of the lateral line system is the neuromast, a bundle of sensory and supporting cells whose
projecting cilia, similar to those in the ears, are encased in a gelatinous cap. Neuromasts detect distorted
sound waves in the immediate vicinity of fishes. Generally, fishes use the lateral line system to detect the
particle displacement component of low frequency acoustic signals (up to 160 to 200 Hz) over a distance
of one to two body lengths. The lateral line is used in conjunction with other sensory systems, including
hearing (Sand 1981; Coombs and Montgomery 1999).
Appendix D: Airgun Sounds and Fish
Environmental Assessment for L-DEO’s Shatsky Rise Seismic Survey, 2012 Page 178
2. Potential Effects on Fishes
Review papers on the effects of anthropogenic sources of underwater sound on fishes have been
published recently (Popper 2009; Popper and Hastings 2009a,b). These papers consider various sources
of anthropogenic sound, including seismic airguns. For the purposes of this review, only the effects of
seismic airgun sound are considered.
2.1 Marine Fishes
Evidence for airgun-induced damage to fish ears has come from studies using pink snapper Pagrus
auratus (McCauley et al. 2000a,b, 2003). In these experiments, fish were caged and exposed to the sound
of a single moving seismic airgun every 10 s over a period of 1 h and 41 min. The source SPL at 1 m was
about 223 dB re 1 µPa · mp-p, and the received SPLs ranged from 165 to 209 dB re 1 µPap-p. The sound
energy was highest over the 20–70 Hz frequency range. The pink snapper were exposed to more than 600
airgun discharges during the study. In some individual fish, the sensory epithelium of the inner ear
sustained extensive damage as indicated by ablated hair cells. Damage was more extensive in fish
examined 58 days post-exposure compared to those examined 18 h post-exposure. There was no
evidence of repair or replacement of damaged sensory cells up to 58 days post-exposure. McCauley et al.
(2000a,b, 2003) included the following caveats in the study reports: (1) fish were caged and unable to
swim away from the seismic source, (2) only one species of fish was examined, (3) the impact on the
ultimate survival of the fish is unclear, and (4) airgun exposure specifics required to cause the observed
damage were not obtained (i.e., a few high SPL signals or the cumulative effect of many low to moderate
SPL signals).
The fish exposed to sound from a single airgun in this study also exhibited startle responses to short
range start up and high-level airgun signals (i.e., with received SPLs of 182 to 195 dB re 1 µParms
(McCauley et al. 2000a,b). Smaller fish were more likely to display a startle response. Responses were
observed above received SPLs of 156 to 161 dB re 1 µParms. The occurrence of both startle response
(classic C-turn response) and alarm responses (e.g., darting movements, flash school expansion, fast
swimming) decreased over time. Other observations included downward distributional shift that was
restricted by the 10 m x 6 m x 3 m cages, increase in swimming speed, and the formation of denser
aggregations. Fish behavior appeared to return to pre-exposure state 15–30 min after cessation of seismic
firing.
Pearson et al. (1992) investigated the effects of seismic airgun sound on the behavior of captive
rockfishes (Sebastes sp.) exposed to the sound of a single stationary airgun at a variety of distances. The
airgun used in the study had a source SPL at 1 m of 223 dB re 1 µPa · m0-p, and measured received SPLs
ranged from 137 to 206 dB re 1 µPa0-p. The authors reported that rockfishes reacted to the airgun sounds
by exhibiting varying degrees of startle and alarm responses, depending on the species of rockfish and the
received SPL. Startle responses were observed at a minimum received SPL of 200 dB re 1 µPa0-p, and
alarm responses occurred at a minimum received SPL of 177 dB re 1 µPa0-p. Other observed behavioral
changes included the tightening of schools, downward distributional shift, and random movement and
orientation. Some fishes ascended in the water column and commenced to mill (i.e., ―eddy‖) at increased
speed, while others descended to the bottom of the enclosure and remained motionless. Pre-exposure
behavior was reestablished from 20 to 60 min after cessation of seismic airgun discharge. Pearson et al.
(1992) concluded that received SPL thresholds for overt rockfish behavioral response and more subtle
rockfish behavioral response are 180 dB re 1 µPa0-p and 161 dB re 1 µPa0-p, respectively.
Appendix D: Airgun Sounds and Fish
Environmental Assessment for L-DEO’s Shatsky Rise Seismic Survey, 2012 Page 179
Using an experimental hook and line fishery approach, Skalski et al. (1992) studied the potential
effects of seismic airgun sound on the distribution and catchability of rockfishes. The source SPL of the
single airgun used in the study was 223 dB re 1 µPa · m 0-p, and the received SPLs at the bases of the
rockfish aggregations ranged from 186 to 191 dB re 1 µPa0-p. Characteristics of the fish aggregations
were assessed using echosounders. During long-term stationary seismic airgun discharge, there was an
overall downward shift in fish distribution. The authors also observed a significant decline in total catch
of rockfishes during seismic discharge. It should be noted that this experimental approach was quite
different from an actual seismic survey, in that duration of exposure was much longer.
In another study, caged European sea bass (Dicentrarchus labrax) were exposed to multiple dis-
charges from a moving seismic airgun array with a source SPL of about 256 dB re 1 µPa · m 0-p (unspec-
ified measure type) (Santulli et al. 1999). The airguns were discharged every 25 s during a 2-h period.
The minimum distance between fish and seismic source was 180 m. The authors did not indicate any
observed pathological injury to the sea bass. Blood was collected from both exposed fish (6 h post-
exposure) and control fish (6 h pre-exposure) and subsequently analyzed for cortisol, glucose, and lactate
levels. Levels of cortisol, glucose, and lactate were significantly higher in the sera of exposed fish
compared to sera of control fish. The elevated levels of all three chemicals returned to pre-exposure
levels within 72 h of exposure (Santulli et al. 1999).
Santulli et al. (1999) also used underwater video cameras to monitor fish response to seismic
airgun discharge. Resultant video indicated slight startle responses by some of the sea bass when the
seismic airgun array discharged as far as 2.5 km from the cage. The proportion of sea bass that exhibited
startle response increased as the airgun sound source approached the cage. Once the seismic array was
within 180 m of the cage, the sea bass were densely packed at the middle of the enclosure, exhibiting
random orientation, and appearing more active than they had been under pre-exposure conditions.
Normal behavior resumed about 2 h after airgun discharge nearest the fish (Santulli et al. 1999).
Boeger et al. (2006) reported observations of coral reef fishes in field enclosures before, during and
after exposure to seismic airgun sound. This Brazilian study used an array of eight airguns that was
presented to the fishes as both a mobile sound source and a static sound source. Minimum distances
between the sound source and the fish cage ranged from 0 to 7 m. Received sound levels were not
reported by Boeger et al. (2006). Neither mortality nor external damage to the fishes was observed in any
of the experimental scenarios. Most of the airgun array discharges resulted in startle responses although
these behavioral changes lessened with repeated exposures, suggesting habituation.
Chapman and Hawkins (1969) investigated the reactions of free ranging whiting (silver hake),
Merluccius bilinearis, to an intermittently discharging stationary airgun with a source SPL of 220 dB re 1
µPa · m0-p. Received SPLs were estimated to be 178 dB re 1 µPa0-p. The whiting were monitored with an
echosounder. Prior to any airgun discharge, the fish were located at a depth range of 25 to 55 m. In
apparent response to the airgun sound, the fish descended, forming a compact layer at depths greater than
55 m. After an hour of exposure to the airgun sound, the fish appeared to have habituated as indicated by
their return to the pre-exposure depth range, despite the continuing airgun discharge. Airgun discharge
ceased for a time and upon its resumption, the fish again descended to greater depths, indicating only
temporary habituation.
Hassel et al. (2003, 2004) studied the potential effects of exposure to airgun sound on the behavior
of captive lesser sandeel, Ammodytes marinus. Depth of the study enclosure used to hold the sandeel was
about 55 m. The moving airgun array had an estimated source SPL of 256 dB re 1 µPa · m (unspecified
measure type). Received SPLs were not measured. Exposures were conducted over a 3-day period in a
Appendix D: Airgun Sounds and Fish
Environmental Assessment for L-DEO’s Shatsky Rise Seismic Survey, 2012 Page 180
10 km × 10 km area with the cage at its center. The distance between airgun array and fish cage ranged
from 55 m when the array was overhead to 7.5 km. No mortality attributable to exposure to the airgun
sound was noted. Behavior of the fish was monitored using underwater video cameras, echosounders,
and commercial fishery data collected close to the study area. The approach of the seismic vessel
appeared to cause an increase in tail-beat frequency although the sandeels still appeared to swim calmly.
During seismic airgun discharge, many fish exhibited startle responses, followed by flight from the
immediate area. The frequency of occurrence of startle response seemed to increase as the operating
seismic array moved closer to the fish. The sandeels stopped exhibiting the startle response once the
airgun discharge ceased. The sandeel tended to remain higher in the water column during the airgun
discharge, and none of them were observed burying themselves in the soft substrate. The commercial
fishery catch data were inconclusive with respect to behavioral effects.
Various species of demersal fishes, blue whiting, and some small pelagic fishes were exposed to a
moving seismic airgun array with a source SPL of about 250 dB re 1 µPa · m (unspecified measure type)
(Dalen and Knutsen 1986). Received SPLs estimated using the assumption of spherical spreading ranged
from 200 to 210 dB re 1 µPa (unspecified measure type). Seismic sound exposures were conducted every
10 s during a one week period. The authors used echosounders and sonars to assess the pre- and post-
exposure fish distributions. The acoustic mapping results indicated a significant decrease in abundance of
demersal fish (36%) after airgun discharge but comparative trawl catches did not support this. Non-
significant reductions in the abundances of blue whiting and small pelagic fish were also indicated by
post-exposure acoustic mapping.
La Bella et al. (1996) studied the effects of exposure to seismic airgun sound on fish distribution
using echosounder monitoring and changes in catch rate of hake by trawl, and clupeoids by gill netting.
The seismic array used was composed of 16 airguns and had a source SPL of 256 dB re 1 µPa · m 0-p The
shot interval was 25 s, and exposure durations ranged from 4.6 to 12 h. Horizontal distributions did not
appear to change as a result of exposure to seismic discharge, but there was some indication of a
downward shift in the vertical distribution. The catch rates during experimental fishing did not differ
significantly between pre- and post-seismic fishing periods.
Wardle et al. (2001) used video and telemetry to make behavioral observations of marine fishes
(primarily juvenile saithe, adult pollock, juvenile cod, and adult mackerel) inhabiting an inshore reef off
Scotland before, during, and after exposure to discharges of a stationary airgun. The received SPLs
ranged from about 195 to 218 dB re 1 µPa0-p. Pollock did not move away from the reef in response to the
seismic airgun sound, and their diurnal rhythm did not appear to be affected. However, there was an
indication of a slight effect on the long-term day-to-night movements of the pollock. Video camera
observations indicated that fish exhibited startle responses (―C-starts‖) to all received levels. There were
also indications of behavioral responses to visual stimuli. If the seismic source was visible to the fish,
they fled from it. However, if the source was not visible to the fish, they often continued to move toward
it.
The potential effects of exposure to seismic sound on fish abundance and distribution were also
investigated by Slotte et al. (2004). Twelve days of seismic survey operations spread over a period of 1
month used a seismic airgun array with a source SPL of 222.6 dB re 1 µPa · mp-p. The SPLs received by
the fish were not measured. Acoustic surveys of the local distributions of various kinds of pelagic fish,
including herring, blue whiting, and mesopelagic species, were conducted during the seismic surveys.
There was no strong evidence of short-term horizontal distributional effects. With respect to vertical
distribution, blue whiting and mesopelagics were distributed deeper (20 to 50 m) during the seismic
Appendix D: Airgun Sounds and Fish
Environmental Assessment for L-DEO’s Shatsky Rise Seismic Survey, 2012 Page 181
survey compared to pre-exposure. The average densities of fish aggregations were lower within the
seismic survey area, and fish abundances appeared to increase in accordance with increasing distance
from the seismic survey area.
Fertilized capelin (Mallotus villosus) eggs and monkfish (Lophius americanus) larvae were
exposed to seismic airgun sound and subsequently examined and monitored for possible effects of the
exposure (Payne et al. 2009). The laboratory exposure studies involved a single airgun. Approximate
received SPLs measured in the capelin egg and monkfish larvae exposures were 199 to 205 dB re 1 µPap-p
and 205 dB re 1 µPap-p, respectively. The capelin eggs were exposed to either 10 or 20 airgun discharges,
and the monkfish larvae were exposed to either 10 or 30 discharges. No statistical differences in
mortality/morbidity between control and exposed subjects were found at 1 to 4 days post-exposure in any
of the exposure trials for either the capelin eggs or the monkfish larvae.
In uncontrolled experiments, Kostyvchenko (1973) exposed the eggs of numerous fish species
(anchovy, red mullet, crucian carp, blue runner) to various sound sources, including seismic airguns.
With the seismic airgun discharge as close as 0.5 m from the eggs, over 75% of them survived the
exposure. Egg survival rate increased to over 90% when placed 10 m from the airgun sound source. The
range of received SPLs was about 215 to 233 dB re 1 µPa0-p.
Eggs, yolk sac larvae, post-yolk sac larvae, post-larvae, and fry of various commercially important
fish species (cod, saithe, herring, turbot, and plaice) were exposed to received SPLs ranging from 220 to
242 dB re 1 µPa (unspecified measure type) (Booman et al. 1996). These received levels corresponded to
exposure distances ranging from 0.75 to 6 m. The authors reported some cases of injury and mortality but
most of these occurred as a result of exposures at very close range (i.e., <15 m). The rigor of anatomical
and pathological assessments was questionable.
Saetre and Ona (1996) applied a ―worst-case scenario‖ mathematical model to investigate the
effects of seismic sound on fish eggs and larvae. They concluded that mortality rates caused by exposure
to seismic airgun sound are so low compared to the natural mortality that the impact of seismic surveying
on recruitment to a fish stock must be regarded as insignificant.
2.2 Freshwater Fishes
Popper et al. (2005) tested the hearing sensitivity of three Mackenzie River fish species after
exposure to five discharges from a seismic airgun. The mean received peak SPL was 205 to 209 dB re
1 µPa per discharge, and the approximate mean received SEL was 176 to 180 dB re 1 µPa2 · s per dis-
charge. While the broad whitefish showed no Temporary Threshold Shift (TTS) as a result of the
exposure, adult northern pike and lake chub exhibited TTSs of 10 to 15 dB, followed by complete
recovery within 24 h of exposure. The same animals were also examined to determine whether there
were observable effects on the sensory cells of the inner ear as a result of exposure to seismic sound
(Song et al. 2008). No damage to the ears of the fishes was found, including those that exhibited TTS.
In another part of the same Mackenzie River project, Jorgenson and Gyselman (2009) investigated
the behavioral responses of arctic riverine fishes to seismic airgun sound. They used hydroacoustic
survey techniques to determine whether fish behavior upon exposure to airgun sound can either mitigate
or enhance the potential impact of the sound. The study indicated that fish behavioral characteristics were
generally unchanged by the exposure to airgun sound. The tracked fish did not exhibit herding behavior
in front of the mobile airgun array and, therefore, were not exposed to sustained high sound levels.

Appendix D: Airgun Sounds and Fish
Environmental Assessment for L-DEO’s Shatsky Rise Seismic Survey, 2012 Page 182
2.3 Anadromous Fishes
In uncontrolled experiments using a very small sample of different groups of young salmonids, in-
cluding Arctic cisco, fish were caged and exposed to various types of sound. One sound type was either a
single firing or a series of four firings 10 to 15 s apart of a 300-in3 seismic airgun at 2000 to 2200 psi
(Falk and Lawrence 1973). Swim bladder damage was reported but no mortality was observed when fish
were exposed within 1 to 2 m of an airgun source with source level, as estimated by Turnpenny and Ned-
well (1994), of ~230 dB re 1 µPa · m (unspecified measure).
Thomsen (2002) exposed rainbow trout and Atlantic salmon held in aquaculture enclosures to the
sounds from a small airgun array. Received SPLs were 142 to 186 dB re 1 µPap-p. The fish were exposed
to 124 pulses over a 3-day period. In addition to monitoring fish behavior with underwater video
cameras, the authors also analyzed cod and haddock catch data from a longline fishing vessel operating in
the immediate area. Only eight of the 124 shots appeared to evoke behavioral reactions by the salmonids,
but overall impacts were minimal. No fish mortality was observed during or immediately after exposure.
The author reported no significant effects on cod and haddock catch rates, and the behavioral effects were
hard to differentiate from normal behavior.
Weinhold and Weaver (1972, cited in Turnpenny et al. 1994) exposed caged coho salmon smolts to
impulses from 330 and 660-in3 airguns at distances ranging from 1 to 10 m, resulting in received levels
estimated at ~214 to 216 dB (units not given). No lethal effects were observed.
It should be noted that, in a recent and comprehensive review, Hastings and Popper (2005) take
issue with many of the authors cited above for problems with experimental design and execution, mea-
surements, and interpretation. Hastings and Popper (2005) deal primarily with possible effects of pile-
driving sounds (which, like airgun sounds, are impulsive and repetitive). However, that review provides
an excellent and critical review of the impacts to fish from other underwater anthropogenic sounds.
3. Indirect Effects on Fisheries
The most comprehensive experimentation on the effects of seismic airgun sound on catchability of
fishes was conducted in the Barents Sea by Engås et al. (1993, 1996). They investigated the effects of
seismic airgun sound on distributions, abundances, and catch rates of cod and haddock using acoustic
mapping and experimental fishing with trawls and longlines. The maximum source SPL was about 248
dB re 1 µPa · m 0-p based on back-calculations from measurements collected via a hydrophone at depth
80 m. Nomeasurements of the received SPLs were made. Davis et al. (1998) estimated the received SPL
at the sea bottom immediately below the array and at 18 km from the array to be 205 dB re 1 µPa0-p and
178 dB re 1 µPa0-p, respectively. Engås et al. (1993, 1996) concluded that there were indications of
distributional change during and immediately following the seismic airgun discharge (45 to 64% decrease
in acoustic density according to sonar data). The lowest densities were observed within 9.3 km of the
seismic discharge area. The authors indicated that trawl catches of both cod and haddock declined after
the seismic operations. While longline catches of haddock also showed decline after seismic airgun
discharge, those for cod increased.
Løkkeborg (1991), Løkkeborg and Soldal (1993), and Dalen and Knutsen (1986) also examined the
effects of seismic airgun sound on demersal fish catches. Løkkeborg (1991) examined the effects on cod
catches. The source SPL of the airgun array used in his study was 239 dB re 1 µPa · m (unspecified
measure type), but received SPLs were not measured. Approximately 43 h of seismic airgun discharge
occurred during an 11-day period, with a five-second interval between pulses. Catch rate decreases

Appendix D: Airgun Sounds and Fish
Environmental Assessment for L-DEO’s Shatsky Rise Seismic Survey, 2012 Page 183
ranging from 55 to 80% within the seismic survey area were observed. This apparent effect persisted for
at least 24 h within about 10 km of the survey area.
Turnpenny et al. (1994) examined results of these studies as well as the results of other studies on
rockfish. They used rough estimations of received SPLs at catch locations and concluded that catchability
is reduced when received SPLs exceed 160 to 180 dB re 1 µPa0-p. They also concluded that reaction
thresholds of fishes lacking a swim bladder (e.g., flatfish) would likely be about 20 dB higher. Given the
considerable variability in sound transmission loss between different geographic locations, the SPLs that
were assumed in these studies were likely quite inaccurate.
Turnpenny and Nedwell (1994) also reported on the effects of seismic airgun discharge on inshore
bass fisheries in shallow U.K. waters (5 to 30 m deep). The airgun array used had a source level of 250
dB re 1 µPa · m0-p. Received levels in the fishing areas were estimated to be 163–191 dB re 1 µPa0-p.
Using fish tagging and catch record methodologies, they concluded that there was not any distinguishable
migration from the ensonified area, nor was there any reduction in bass catches on days when seismic
airguns were discharged. The authors concluded that effects on fisheries would be smaller in shallow
nearshore waters than in deep water because attenuation of sound is more rapid in shallow water.
Skalski et al. (1992) used a 100-in3 airgun with a source level of 223 dB re 1 µPa
· m0-p to examine
the potential effects of airgun sound on the catchability of rockfishes. The moving airgun was discharged
along transects in the study fishing area, after which a fishing vessel deployed a set line, ran three echo-
sounder transects, and then deployed two more set lines. Each fishing experiment lasted 1 h 25 min.
Received SPLs at the base of the rockfish aggregations ranged from 186 to 191 dB re 1 µPa0-p. The
catch-per-unit-effort (CPUE) for rockfish declined on average by 52.4% when the airguns were operating.
Skalski et al. (1992) believed that the reduction in catch resulted from a change in behavior of the fishes.
The fish schools descended towards the bottom and their swimming behavior changed during airgun
discharge. Although fish dispersal was not observed, the authors hypothesized that it could have occurred
at a different location with a different bottom type. Skalski et al. (1992) did not continue fishing after
cessation of airgun discharge. They speculated that CPUE would quickly return to normal in the experi-
mental area, because fish behavior appeared to normalize within minutes of cessation of airgun discharge.
However, in an area where exposure to airgun sound might have caused the fish to disperse, the authors
suggested that a lower CPUE might persist for a longer period.
European sea bass were exposed to sound from seismic airgun arrays with a source SPL of 262 dB
re 1 µPa · m0-p
(Pickett et al. 1994). The seismic survey was conducted over a period of 4 to 5 months.
The study was intended to investigate the effects of seismic airgun discharge on inshore bass fisheries.
Information was collected through a tag and release program, and from the logbooks of commercial
fishermen. Most of the 152 recovered fish from the tagging program were caught within 10 km of the
release site, and it was suggested that most of these bass did not leave the area for a prolonged period.
With respect to the commercial fishery, no significant changes in catch rate were observed (Pickett et al.
1994).
4. Literature Cited
Atema, J., R.R. Fay, A.N. Popper, and W.N. Tavolga. 1988. The sensory biology of aquatic animals. Springer-
Boeger, W.A., M.R. Pie, A. Ostrensky, and M.F. Cardoso. 2006. The effect of exposure to seismic prospecting on
coral reef fishes. Braz. J. Oceanog. 54(4):235-239.
Appendix D: Airgun Sounds and Fish
Environmental Assessment for L-DEO’s Shatsky Rise Seismic Survey, 2012 Page 184
Booman, C., J. Dalen, H. Leivestad, A. Levsen, T. van der Meeren, and K. Toklum. 1996. Effecter av luftkanon-
skyting på egg, larver og yngel. Fisken Og Havet 1996(3):1-83 (Norwegian with English summary).
Chapman, C.J. and A.D. Hawkins. 1969. The importance of sound in fish behaviour in relation to capture by
trawls. FAO Fish. Rep. 62:717-729.
Collin, S.P. and N.J. Marshall (eds.). 2003. Sensory processing in aquatic environments. Springer-Verlag, New
York, NY. 446 p.
Coombs, S. and J.C. Montgomery. 1999. The enigmatic lateral line system. p. 319-362 In: R.R. Fay and A.N.
Popper (eds.), Comparative hearing: fish and amphibians. Springer Handbook of Auditory Research 11.
Springer-Verlag, New York, NY. 438 p.
Dalen, J. and G.M. Knutsen. 1986. Scaring effects in fish and harmful effects on eggs, larvae and fry by offshore
seismic explorations. Symposium on Underwater Acoustics, Halifax.
Davis, R.A., D. Thomson, and C.I. Malme. 1998. Environmental assessment of seismic exploration of the Scotian
Shelf. Rep. by LGL Ltd., King City, Ont., and Charles I. Malme, Engineering and Scientific Services,
Hingham, MA, for Mobil Oil Canada Properties Ltd., Shell Canada Ltd., and Imperial Oil Ltd.
Engås, A., S. Løkkeborg, A.V. Soldal, and E. Ona. 1993. Comparative trials for cod and haddock using commer-
cial trawl and longline at two different stock levels. J. Northw. Atl. Fish. Sci. 19:83-90.
Engås, A, S. Løkkeborg, E. Ona, and A.V. Soldal. 1996. Effects of seismic shooting on local abundance and catch
rates of cod (G. morhua) and haddock (M. aeglefinus). Can. J. Fish. Aquat. Sci. 53(10):2238-2249.
Falk, M.R. and M.J. Lawrence. 1973. Seismic exploration: its nature and effects on fish. Tech. Rep. Ser. CEN/T-
73-9. Can. Dep. Environ., Fisheries & Marine Serv., Resource Manage. Br., Fisheries Operations Direct-
orate, Central Region (Environment), Winnipeg, Man.
Fay, R. 2009. Soundscapes and the sense of hearing of fishes. Integr. Zool. 4(1):26-32.
Fay, R.R. and A.N. Popper. 2000. Evolution of hearing in vertebrates: The inner ears and processing. Hearing
Res. 149(1):1-10.
Hassel, A., T. Knutsen, J. Dalen, S. Løkkeborg, K. Skaar, Ø. Østensen, E.K. Haugland, M. Fonn, Å. Høines, and
O.A. Misund. 2003. Reaction of sandeel to seismic shooting: a field experiment and fishery statistics
study. Institute of Marine Research, Bergen, Norway.
Hassel, A., T. Knutsen, J. Dalen, K. Skaar, S. Løkkeborg, O.A. Misund, O. Ostensen, M. Fonn, and E.K. Haugland.
2004. Influence of seismic shooting on the lesser sandeel (Ammodytes marinus). ICES J. Mar. Sci.
61(7):1165-1173.
Hastings, M.C. and A.N. Popper. 2005. Effects of sound on fish. Rep. from Jones & Stokes, Sacramento, CA, for
California Department of Transportation, Sacramento, CA. 28 January.
Howard J, W.M. Roberts, and A.J. Hudspeth. 1988. Mechanoelectrical transduction by hair cells. Annu. Rev.
Biophys. Chem. 17:99-124.
Hudspeth, A.J. and V.S. Markin. 1994. The ear‘s gears: mechanical transduction by hair cells. Physics Today
47(2):22-28.
Jorgenson, J.K. and E.C. Gyselman. 2009. Hydroacoustic measurements of the behavioral response of arctic river-
ine fishes to seismic airguns. J. Acoust. Soc. Am. 126(3):1598-1606.
Kapoor, B.G. and T.J. Hara (eds.). 2001. Sensory biology of jawed fishes: new insights. Science Publishers, Inc.,
Enfield, NH. 404 p.
Kostyvchenko, L.P. 1973. Effects of elastic waves generated in marine seismic prospecting on fish eggs in the
Black Sea. Hydrobiol. J. 9:45-48.
Appendix D: Airgun Sounds and Fish
Environmental Assessment for L-DEO’s Shatsky Rise Seismic Survey, 2012 Page 185
La Bella, G., S. Cannata, C. Froglia, A. Modica, S. Ratti, and G. Rivas. 1996. First assessment of effects of air-gun
seismic shooting on marine resources in the Central Adriatic Sea. p. 227-238 In: Society of Petroleum
Engineers, Intern. Conf. on Health, Safety and Environ., New Orleans, LA, 9-12 June.
Ladich, F. and A.N. Popper. 2004. Parallel evolution in fish hearing organs. p. 95-127 In: G.A. Manley, A.N.
Popper, and R.R. Fay (eds.), Evolution of the vertebrate auditory system. Springer-Verlag, New York, NY.
415 p.
Løkkeborg, S. 1991. Effects of geophysical survey on catching success in longline fishing. Paper presented at
Intern. Council for the Exploration of the Sea (ICES) Annual Science Conf. ICES CM B 40:1-9.
Løkkeborg, S. and A.V. Soldal. 1993. The influence of seismic explorations on cod (Gadus morhua) behaviour and
catch rates. ICES Mar. Sci. Symp. 196:62-67.
Mann, D.A., Z. Lu, and A.N. Popper. 1997. A clupeid fish can detect ultrasound. Nature 389(6649):341.
Mann, D.A., Z. Lu, M.C. Hastings, and A.N. Popper. 1998. Detection of ultrasonic tones and simulated dolphin
echolocation clicks by a teleost fish, the American shad (Alosa sapidissima). J. Acoust. Soc. Am.
104(1):562-568.
Mann, D.A., D.M. Higgs, W.N. Tavolga, M.J. Souza, and A.N. Popper. 2001. Ultrasound detection by clupeiform
fishes. J. Acoust. Soc. Am. 109(6):3048-3054.
McCauley, R.D., J. Fewtrell, A.J. Duncan, C. Jenner, M.-N. Jenner, J.D. Penrose, R.I.T. Prince, A. Adhitya,
J. Murdoch, and K. McCabe. 2000a. Marine seismic surveys: analysis of airgun signals; and effects of air
gun exposure on humpback whales, sea turtles, fishes and squid. Rep. from Centre for Marine Science and
Technology, Curtin University, Perth, WA, for Australian Petroleum Production Association, Sydney, NSW.
McCauley, R.D., J. Fewtrell, A.J. Duncan, C. Jenner, M.-N. Jenner, J.D. Penrose, R.I.T. Prince, A. Adhitya, J.
Murdoch, and K. McCabe. 2000b. Marine seismic surveys – a study of environmental implications.
APPEA J. 40:692-706.
McCauley, R.D., J. Fewtrell, and A.N. Popper. 2003. High intensity anthropogenic sound damages fish ears. J.
Acoust. Soc. Am. 113(1):638-642.
Payne, J.F., J. Coady, and D. White. 2009. Potential effects of seismic airgun discharges on monkfish eggs
(Lophius americanus) and larvae. Environ. Stud. Res. Funds Rep. 170. St. John‘s, NL. 35 p.
Pearson, W.H., J.R. Skalski, and C.I. Malme. 1992. Effects of sounds from a geophysical survey device on
behavior of captive rockfish (Sebastes spp.). Can. J. Fish. Aquat. Sci. 49(7):1343-1356.
Pickett, G.D., D.R. Eaton, R.M.H. Seaby, and G.P. Arnold. 1994. Results of bass tagging in Poole Bay during
1992. Laboratory Leaflet Number 74. Ministry of Agriculture, Fisheries and Food, Directorate of Fisheries
Research, Lowestoft, UK.
Popper, A.N. 2009. Are we drowning out fish in a sea of noise? Marine Scientist 27:18-20.
Popper, A.N. and R.R. Fay. 1993. Sound detection and processing by fish: critical review and major research
questions. Brain Behav. Evol. 41(1):14-38.
Popper, A.N. and R.R. Fay. 1999. The auditory periphery in fishes. p. 43-100 In: R.R. Fay and A.N. Popper (eds.),
Comparative hearing: fish and amphibians. Springer-Verlag, New York, NY. 438 p.
Popper, A.N. and R.R. Fay. 2010. Rethinking sound detection by fishes. Hear. Res. (in press)
doi: 10.1016/j.heares.2009.12.023.
Popper, A.N. and M.C. Hastings. 2009a. The effects of human-generated sound on fish. Integr. Zool. 4(1):43-52.
Popper, A.N. and M.C. Hastings. 2009b. The effects of anthropogenic sources of sound on fishes. J. Fish Biol.
75(3):455-489.

Appendix D: Airgun Sounds and Fish
Environmental Assessment for L-DEO’s Shatsky Rise Seismic Survey, 2012 Page 186
Popper, A.N., M.E. Smith, P.A. Cott, B.W. Hanna, A.O. MacGillivray, M.E. Austin, and D.A. Mann. 2005. Effects
of exposure to seismic airgun use on hearing of three fish species. J. Acoust. Soc. Am. 117(6):3958-3971.
Saetre, R. and E. Ona. 1996. Seismiske undersøkelser og skader på fiskeegg og -larver en vurdering av mulige
effekter pa bestandsniv. [Seismic investigations and damages on fish eggs and larvae; an evaluation of
possible effects on stock level] Fisken og Havet 1996:1-17, 1-8. (in Norwegian with English summary).
Sand, O. 1981. The lateral line and sound reception. p. 459-478 In: W.N. Tavolga, A.N. Popper, and R.R. Fay
(eds.), Hearing and sound communication in fishes. Springer-Verlag, New York, NY.
Santulli, A., C. Messina, L. Ceffa, A. Curatolo, G. Rivas, G. Fabi, and V. Damelio. 1999. Biochemical responses of
European sea bass (Dicentrachus labrax) to the stress induced by offshore experimental seismic prospecting.
Mar. Poll. Bull. 38(12):1105-1114.
Skalski, J.R., W.H. Pearson, and C.I. Malme. 1992. Effects of sounds from a geophysical survey device on catch-
per-unit-effort in a hook-and-line fishery for rockfish (Sebastes spp.). Can. J. Fish. Aquat. Sci. 49(7):1357-
1365.
Slotte, A., K. Hansen, J. Dalen, and E. Ona. 2004. Acoustic mapping of pelagic fish distribution and abundance in
relation to a seismic shooting area off the Norwegian west coast. Fish. Res. 67(2):143-150.
Song, J., D.A. Mann, P.A. Cott, B.W. Hanna, and A.N. Popper. 2008. The inner ears of Northern Canadian
freshwater fishes following exposure to seismic air gun sounds. J. Acoust. Soc. Am. 124(2):1360-1366.
Thomsen, B. 2002. An experiment on how seismic shooting affects caged fish. Thesis, Faroese Fisheries Labor-
atory, University of Aberdeen, Aberdeen, Scotland. 16 August.
Turnpenny, A.W.H. and J.R. Nedwell. 1994. Consultancy Report: The effects on marine fish, diving mammals and
birds of underwater sound generated by seismic surveys. FCR 089/94. Rep. from Fawley Aquatic Research
Laboratories Ltd. for U.K. Offshore Operators Association (UKOOA).
Turnpenny, A.W.H., K.P. Thatcher, and J.R. Nedwell. 1994. Research report: the effects on fish and other marine
animals of high-level underwater sound. FRR 127/94. Rep. from Fawley Aquatic Research Laboratories,
Ltd. for the Defence Research Agency.
Wardle, C.S., T.J. Carter, G.G. Urquhart, A.D.F. Johnstone, A.M. Ziolkowski, G. Hampson, and D. Mackie. 2001.
Effects of seismic airguns on marine fish. Cont. Shelf Res. 21(8-10):1005-1027.

Appendix E: Airgun Sounds and Invertebrates
Environmental Assessment for L-DEO’s Shatsky Rise Seismic Survey, 2010 Page 187
APPENDIX E:
REVIEW OF THE EFFECTS OF AIRGUN SOUNDS ON MARINE INVERTEBRATES12
This review provides a detailed summary of the limited data and available literature on the
observed effects (or lack of effects) of exposure to airgun sound on marine invertebrates. Specific
conditions and results of the studies, including sound exposure levels and sound thresholds of responses,
are discussed when available.
Sound caused by underwater seismic survey equipment results in energy pulses with very high
peak pressures (Richardson et al. 1995). This was especially true when chemical explosives were used
for underwater surveys. Virtually all underwater seismic surveying conducted today uses airguns which
typically have lower peak pressures and longer rise times than chemical explosives. However, sound
levels from underwater airgun discharges might still be high enough to potentially injure or kill animals
located close to the source. Also, there is a potential for disturbance to normal behavior upon exposure to
airgun sound. The following sections provide an overview of sound production and detection in marine
invertebrates, and information on the effects of exposure to sound on marine invertebrates, with an
emphasis on seismic survey sound. In addition, Fisheries and Oceans Canada has published two internal
documents that provide a literature review of the effects of seismic and other underwater sound on
invertebrates (Moriyasu et al. 2004; Payne et al. 2008). The available information as reviewed in those
documents and here includes results of studies of varying degrees of scientific rigor as well as anecdotal
information.
1. Sound Production
Much of the available information on acoustic abilities of marine invertebrates pertains to
crustaceans, specifically lobsters, crabs and shrimps. Other acoustic-related studies have been conducted
on cephalopods. Many invertebrates are capable of producing sound, including barnacles, amphipods,
shrimp, crabs, and lobsters (Au and Banks 1998; Tolstoganova 2002). Invertebrates typically produce
sound by scraping or rubbing various parts of their bodies, although they also produce sound in other
ways. Sounds made by marine invertebrates may be associated with territorial behavior, mating,
courtship, and aggression. On the other hand, some of these sounds may be incidental and not have any
biological relevance. Sounds known to be produced by marine invertebrates have frequencies ranging
from 87 Hz to 200 kHz, depending on the species.
Both male and female American lobsters Homarus americanus produce a buzzing vibration with
the carapace when grasped (Pye and Watson III 2004; Henninger and Watson III 2005). Larger lobsters
vibrate more consistently than smaller lobsters, suggesting that sound production may be involved with
mating behavior. Sound production by other species of lobsters has also been studied. Among deep-sea
lobsters, sound level was more variable at night than during the day, with the highest levels occurring at
the lowest frequencies.
While feeding, king crab Paralithodes camtschaticus produce impulsive sounds that appear to
stimulate movement by other crabs, including approach behavior (Tolstoganova 2002). King crab also
appeared to produce ‗discomfort‘ sounds when environmental conditions were manipulated. These
discomfort sounds differ from the feeding sounds in terms of frequency range and pulse duration.
____________________________________
12
By John Christian, LGL Ltd., environmental research associates (revised Nov. 2009).
Appendix E: Airgun Sounds and Invertebrates
Environmental Assessment for L-DEO’s Shatsky Rise Seismic Survey, 2010 Page 188
Snapping shrimp Synalpheus parneomeris are among the major sources of biological sound in
temperate and tropical shallow-water areas (Au and Banks 1998). By rapidly closing one of its frontal
chelae (claws), a snapping shrimp generates a forward jet of water and the cavitation of fast moving water
produces a sound. Both the sound and the jet of water may function in feeding and territorial behaviors of
alpheidae shrimp. Measured source sound pressure levels (SPLs) for snapping ship were 183–189 dB re
1 µPa · mp-p and extended over a frequency range of 2–200 kHz.
2. Sound Detection
There is considerable debate about the hearing capabilities of aquatic invertebrates. Whether they
are able to hear or not depends on how underwater sound and underwater hearing are defined. In contrast
to the situation in fish and marine mammals, no physical structures have been discovered in aquatic
invertebrates that are stimulated by the pressure component of sound. However, vibrations (i.e., mechan-
ical disturbances of the water) are also characteristic of sound waves. Rather than being pressure-
sensitive, aquatic invertebrates appear to be most sensitive to the vibrational component of sound
(Breithaupt 2002). Statocyst organs may provide one means of vibration detection for aquatic invert-
ebrates.
More is known about the acoustic detection capabilities in decapod crustaceans than in any other
marine invertebrate group, although cephalopod acoustic capabilities are now becoming a focus of study.
Crustaceans appear to be most sensitive to sounds of low frequencies, i.e., <1000 Hz (Budelmann 1992;
Popper et al. 2001). A study by Lovell et al. (2005) suggests greater sensitivity of the prawn Palaemon
serratus to low-frequency sound than previously thought. Lovell et al. (2006) showed that P. serratus is
capable of detecting a 500 Hz tone regardless of the prawn‘s body size and the related number and size of
statocyst hair cells. Studies of American lobsters suggest that these crustaceans are more sensitive to
higher frequency sounds than previously realized (Pye and Watson III 2004).
It is possible that statocyst hair cells of cephalopods are directionally sensitive in a way that is
similar to the responses of hair cells of the vertebrate vestibular and lateral line systems (Budelmann and
Williamson 1994; Budelmann 1996). Kaifu et al. (2008) provided evidence that the cephalopod Octopus
ocellatus detects particle motion with its statocyst. Studies by Packard et al. (1990), Rawizza (1995) and
Komak et al. (2005) have tested the sensitivities of various cephalopods to water-borne vibrations, some
of which were generated by low-frequency sound. Using the auditory brainstem response (ABR)
approach, Hu et al. (2009) showed that auditory evoked potentials can be obtained in the frequency ranges
400 to 1500 Hz for the squid Sepiotheutis lessoniana and 400 to 1000 Hz for the octopus Octopus
vulgaris, higher than frequencies previously observed to be detectable by cephalopods.
In summary, only a few studies have been conducted on the sensitivity of certain invertebrate
species to underwater sound. Available data suggest that they are capable of detecting vibrations but they
do not appear to be capable of detecting pressure fluctuations.
3. Potential Seismic Effects
In marine invertebrates, potential effects of exposure to sound can be categorized as pathological,
physiological, and behavioral. Pathological effects include lethal and sub-lethal injury to the animals,
physiological effects include temporary primary and secondary stress responses, and behavioral effects
refer to changes in exhibited behaviors (i.e., disturbance). The three categories should not be considered
as independent of one another and are likely interrelated in complex ways.
Appendix E: Airgun Sounds and Invertebrates
Environmental Assessment for L-DEO’s Shatsky Rise Seismic Survey, 2010 Page 189
Pathological Effects.―In water, acute injury or death of organisms as a result of exposure to
sound appears to depend on two features of the sound source: (1) the received peak pressure, and (2) the
time required for the pressure to rise and decay. Generally, the higher the received pressure and the less
time it takes for the pressure to rise and decay, the greater the chance of acute pathological effects.
Considering the peak pressure and rise/decay time characteristics of seismic airgun arrays used today, the
associated pathological zone for invertebrates would be expected to be small (i.e., within a few meters of
the seismic source, at most). Few studies have assessed the potential for pathological effects on invert-
ebrates from exposure to seismic sound.
The pathological impacts of seismic survey sound on marine invertebrates were investigated in a
pilot study on snow crabs Chionoecetes opilio (Christian et al. 2003, 2004). Under controlled field
experimental conditions, captive adult male snow crabs, egg-carrying female snow crabs, and fertilized
snow crab eggs were exposed to variable SPLs (191–221 dB re 1 µPa0-p) and sound energy levels (SELs)
(<130–187 dB re 1 µPa2 · s). Neither acute nor chronic (12 weeks post-exposure) mortality was observed
for the adult crabs. However, a significant difference in development rate was noted between the exposed
and unexposed fertilized eggs/embryos. The egg mass exposed to seismic energy had a higher proportion
of less-developed eggs than did the unexposed mass. It should be noted that both egg masses came from
a single female and any measure of natural variability was unattainable (Christian et al. 2003, 2004).
In 2003, a collaborative study was conducted in the southern Gulf of St. Lawrence, Canada, to
investigate the effects of exposure to sound from a commercial seismic survey on egg-bearing female
snow crabs (DFO 2004). This study had design problems that impacted interpretation of some of the
results (Chadwick 2004). Caged animals were placed on the ocean bottom at a location within the survey
area and at a location outside of the survey area. The maximum received SPL was ~195 dB re 1 µPa0-p.
The crabs were exposed for 132 hr of the survey, equivalent to thousands of seismic shots of varying
received SPLs. The animals were retrieved and transferred to laboratories for analyses. Neither acute nor
chronic lethal or sub-lethal injury to the female crabs or crab embryos was indicated. DFO (2004)
reported that some exposed individuals had short-term soiling of gills, antennules and statocysts, bruising
of the hepatopancreas and ovary, and detached outer membranes of oocytes. However, these differences
could not be linked conclusively to exposure to seismic survey sound. Boudreau et al. (2009) presented
the proceedings of a workshop held to evaluate the results of additional studies conducted to answer some
questions arising from the original study discussed in DFO (2004). Proceedings of the workshop did not
include any more definitive conclusions regarding the original results.
Payne et al. (2007) recently conducted a pilot study of the effects of exposure to airgun sound on
various health endpoints of the American lobster. Adult lobsters were exposed either 20 to 200 times to
202 dB re 1μPap-p or 50 times to 227 dB re 1μPap-p, and then monitored for changes in survival, food
consumption, turnover rate, serum protein level, serum enzyme levels, and serum calcium level. Obser-
vations extended over a period of a few days to several months. Results showed no delayed mortality or
damage to the mechanosensory systems associated with animal equilibrium and posture (as assessed by
turnover rate).
In a field study, Pearson et al. (1994) exposed Stage II larvae of the Dungeness crab Cancer
magister to single discharges from a seven-airgun array and compared their mortality and development
rates with those of unexposed larvae. No statistically significant differences were found in immediate
survival, long-term survival, or time to molt between the exposed and unexposed larvae, even those
exposed within 1 m of the seismic source.
Appendix E: Airgun Sounds and Invertebrates
Environmental Assessment for L-DEO’s Shatsky Rise Seismic Survey, 2010 Page 190
In 2001 and 2003, there were two incidents of multiple strandings of the giant squid Architeuthis
dux on the north coast of Spain, and there was speculation that the strandings were caused by exposure to
geophysical seismic survey sounds occurring at about the same time in the Bay of Biscay (Guerra et al.
2004). A total of nine giant squid, either stranded or moribund and floating at the surface, were collected
at these times. However, Guerra et al. (2004) did not present any evidence that conclusively links the
giant squid strandings and floaters to seismic activity in the area. Based on necropsies of seven (six
females and one male) specimens, there was evidence of acute tissue damage. The authors speculated
that one female with extensive tissue damage was affected by the impact of acoustic waves. However,
little is known about the impact of strong airgun signals on cephalopods and the authors did not describe
the seismic sources, locations, and durations of the Bay of Biscay surveys. In addition, there were no
controls, the observations were circumstantial, and the examined animals had been dead long enough for
commencement of tissue degradation.
McCauley et al. (2000a,b) exposed caged cephalopods to noise from a single 20-in3 airgun with
maximum SPLs of >200 dB re 1 µPa0-p. Statocysts were removed and preserved, but at the time of
publication, results of the statocyst analyses were not available. No squid or cuttlefish mortalities were
reported as a result of these exposures.
Physiological Effects.―Biochemical responses by marine invertebrates to acoustic exposure have
also been studied to a limited degree. Such studies of stress responses could possibly provide some indi-
cation of the physiological consequences of acoustic exposure and perhaps any subsequent chronic
detrimental effects. Stress responses could potentially affect animal populations by reducing reproductive
capacity and adult abundance.
Stress indicators in the haemolymph of adult male snow crabs were monitored immediately after
exposure of the animals to seismic survey sound (Christian et al. 2003, 2004) and at various intervals after
exposure. No significant acute or chronic differences were found between exposed and unexposed
animals in which various stress indicators (e.g., proteins, enzymes, cell type count) were measured.
Payne et al. (2007), in their study of the effects of exposure of adult American lobsters to airgun
sound, noted decreases in the levels of serum protein, particular serum enzymes and serum calcium, in the
haemolymph of animals exposed to the sound pulses. Statistically significant differences (P=0.05) were
noted in serum protein at 12 days post-exposure, serum enzymes at 5 days post-exposure, and serum
calcium at 12 days post-exposure. During the histological analysis conducted 4 months post-exposure,
Payne et al. (2007) noted more deposits of PAS-stained material, likely glycogen, in the hepatopancreas
of some of the exposed lobsters. Accumulation of glycogen could be due to stress or disturbance of
cellular processes.
Price (2007) found that blue mussels Mytilus edulis responded to a 10 kHz pure tone continuous
signal by decreasing respiration. Smaller mussels did not appear to react until exposed for 30 min where-
as larger mussels responded after 10 min of exposure. The oxygen uptake rate tended to be reduced to a
greater degree in the larger mussels than in the smaller animals.
In general, the limited studies done to date on the effects of acoustic exposure on marine inverte-
brates have not demonstrated any serious pathological and physiological effects.
Behavioral Effects.―Some recent studies have focused on potential behavioral effects on marine
invertebrates.
Appendix E: Airgun Sounds and Invertebrates
Environmental Assessment for L-DEO’s Shatsky Rise Seismic Survey, 2010 Page 191
Christian et al. (2003) investigated the behavioral effects of exposure to airgun sound on snow
crabs. Eight animals were equipped with ultrasonic tags, released, and monitored for multiple days prior
to exposure and after exposure. Received SPL and SEL were ~191 dB re 1 µPa0-p and <130 dB re
1 µPa2 · s, respectively. The crabs were exposed to 200 discharges over a 33-min period. None of the
tagged animals left the immediate area after exposure to the seismic survey sound. Five animals were
captured in the snow crab commercial fishery the following year, one at the release location, one 35 km
from the release location, and three at intermediate distances from the release location.
Another study approach used by Christian et al. (2003) involved monitoring snow crabs with a
remote video camera during their exposure to airgun sound. The caged animals were placed on the ocean
bottom at a depth of 50 m. Received SPL and SEL were ~202 dB re 1 µPa0-p and 150 dB re 1 µPa2 · s,
respectively. The crabs were exposed to 200 discharges over a 33-min period. They did not exhibit any
overt startle response during the exposure period.
Christian et al. (2003) also investigated the pre- and post-exposure catchability of snow crabs
during a commercial fishery. Received SPLs and SELs were not measured directly and likely ranged
widely considering the area fished. Maximum SPL and SEL were likely similar to those measured during
the telemetry study. There were seven pre-exposure and six post-exposure trap sets. Unfortunately, there
was considerable variability in set duration because of poor weather. Results indicated that the catch-per-
unit-effort did not decrease after the crabs were exposed to seismic survey sound.
Parry and Gason (2006) statistically analyzed data related to rock lobster Jasus edwardsii commer-
cial catches and seismic surveying in Australian waters from 1978 to 2004. They did not find any evi-
dence that lobster catch rates were affected by seismic surveys.
Caged female snow crabs exposed to airgun sound associated with a recent commercial seismic
survey conducted in the southern Gulf of St. Lawrence, Canada, exhibited a higher rate of ‗righting‘ than
those crabs not exposed to seismic survey sound (J. Payne, Research Scientist, DFO, St. John‘s, Nfld.,
pers. comm.). ‗Righting‘ refers to a crab‘s ability to return itself to an upright position after being placed
on its back. Christian et al. (2003) made the same observation in their study.
Payne et al. (2007), in their study of the effects of exposure to airgun sound on adult American
lobsters, noted a trend for increased food consumption by the animals exposed to seismic sound.
Andriguetto-Filho et al. (2005) attempted to evaluate the impact of seismic survey sound on
artisanal shrimp fisheries off Brazil. Bottom trawl yields were measured before and after multiple-day
shooting of an airgun array. Water depth in the experimental area ranged between 2 and 15 m. Results of
the study did not indicate any significant deleterious impact on shrimp catches. Anecdotal information
from Newfoundland, Canada, indicated that catch rates of snow crabs showed a significant reduction
immediately following a pass by a seismic survey vessel (G. Chidley, Newfoundland fisherman, pers.
comm.). Additional anecdotal information from Newfoundland indicated that a school of shrimp observ-
ed via a fishing vessel sounder shifted downwards and away from a nearby seismic airgun sound source
(H. Thorne, Newfoundland fisherman, pers. comm.). This observed effect was temporary.
Caged brown shrimp Crangon crangon reared under different acoustical conditions exhibited
differences in aggressive behavior and feeding rate (Lagardère 1982). Those exposed to a continuous
sound source showed more aggression and less feeding behavior. It should be noted that behavioral
responses by caged animals may differ from behavioral responses of animals in the wild.
McCauley et al. (2000a,b) provided the first evidence of the behavioral response of southern
calamari squid Sepioteuthis australis exposed to seismic survey sound. McCauley et al. reported on the

Appendix E: Airgun Sounds and Invertebrates
Environmental Assessment for L-DEO’s Shatsky Rise Seismic Survey, 2010 Page 192
exposure of caged cephalopods (50 squid and two cuttlefish) to noise from a single 20-in3 airgun. The
cephalopods were exposed to both stationary and mobile sound sources. The two-run total exposure
times during the three trials ranged from 69 to 119 min. at a firing rate of once every 10–15 s. The
maximum SPL was >200 dB re 1 µPa0-p. Some of the squid fired their ink sacs apparently in response to
the first shot of one of the trials and then moved quickly away from the airgun. In addition to the above-
described startle responses, some squid also moved towards the water surface as the airgun approached.
McCauley et al. (2000a,b) reported that the startle and avoidance responses occurred at a received SPL of
174 dB re 1 µParms. They also exposed squid to a ramped approach-depart airgun signal whereby the
received SPL was gradually increased over time. No strong startle response (i.e., ink discharge) was
observed, but alarm responses, including increased swimming speed and movement to the surface, were
observed once the received SPL reached a level in the 156–161 dB re 1 µParms range.
Komak et al. (2005) also reported the results of a study of cephalopod behavioral responses to local
water movements. In this case, juvenile cuttlefish Sepia officinalis exhibited various behavioral responses
to local sinusoidal water movements of different frequencies between 0.01 and 1000 Hz. These responses
included body pattern changing, movement, burrowing, reorientation, and swimming. Similarly, the
behavioral responses of the octopus Octopus ocellatus to non-impulse sound have been investigated by
Kaifu et al. (2007). The sound stimuli, reported as having levels 120 dB re 1 μPa rms, were at various
frequencies: 50, 100, 150, 200 and 1000 Hz. The respiratory activity of the octopus changed when
exposed to sound in the 50–150 Hz range but not for sound at 200–1,000 Hz. Respiratory suppression by
the octopus might have represented a means of escaping detection by a predator.
Low-frequency sound (<200 Hz) has also been used as a means of preventing settling/fouling by
aquatic invertebrates such as zebra mussels Dreissena polymorpha (Donskoy and Ludyanskiy 1995) and
balanoid barnacles Balanus sp. (Branscomb and Rittschof 1984). Price (2007) observed that blue mussels
Mytilus edulis closed their valves upon exposure to 10 kHz pure tone continuous sound.
Although not demonstrated in the invertebrate literature, masking can be considered a potential
effect of anthropogenic underwater sound on marine invertebrates. Some invertebrates are known to
produce sounds (Au and Banks 1998; Tolstoganova 2002; Latha et al. 2005). The functionality and
biological relevance of these sounds are not understood (Jeffs et al. 2003, 2005; Lovell et al. 2005;
Radford et al. 2007). If some of the sounds are of biological significance to some invertebrates, then
masking of those sounds or of sounds produced by predators, at least the particle displacement compon-
ent, could potentially have adverse effects on marine invertebrates. However, even if masking does occur
in some invertebrates, the intermittent nature of airgun sound is expected to result in less masking effect
than would occur with continuous sound.
4. Literature Cited
Andriguetto-Filho, J.M., A. Ostrensky, M.R. Pie, U.A. Silva, and W.A. Boeger. 2005. Evaluating the impact of
seismic prospecting on artisanal shrimp fisheries. Cont. Shelf Res. 25:1720-1727.
Au, W.W.L. and K. Banks. 1998. The acoustics of snapping shrimp Synalpheus parneomeris in Kaneohe Bay.
J. Acoust. Soc. Am. 103:41-47.
Boudreau, M., S.C. Courtenay, and K. Lee (eds.). 2009. Proceedings of a workshop held 23 January 2007 at the
Gulf Fisheries Center, Potential impacts of seismic energy on snow crab: An update to the September 2004
review. Can. Tech. Rep. Fish. Aquat. Sci. 2836.
Branscomb, E.S. and D. Rittschof. 1984. An investigation of low frequency sound waves as a means of inhibiting
barnacle settlement. J. Exp. Mar. Biol. Ecol. 79:149-154.

Appendix E: Airgun Sounds and Invertebrates
Environmental Assessment for L-DEO’s Shatsky Rise Seismic Survey, 2010 Page 193
Breithaupt, T. 2002. Sound perception in aquatic crustaceans. p. 548-558 In: K. Wiese (ed.), The crustacean
nervous system. Springer-Verlag, Berlin-Heidelberg, Germany. 623 p.
Budelmann, B.U. 1992. Hearing in crustacea. p. 131-139 In: D.B. Webster, R.R. Fay, and A.N. Popper (eds.),
Evolutionary biology of hearing. Springer-Verlag, New York, NY.
Budelmann, B.U. 1996. Active marine predators: the sensory world of cephalopods. Mar. Freshw. Behav. Phys-
iol. 27:59-75.
Budelmann, B.U. and R. Williamson. 1994. Directional sensitivity of hair cell afferents in the octopus statocyst.
J. Exp. Biol. 187:245-259.
Chadwick, M. 2004. Proceedings of the peer review on potential impacts of seismic energy on snow crab. Gulf
Region, Department of Fisheries and Oceans Canada, Science Advisory Secretariat Proceedings Series
2004/045.
Christian, J.R., A. Mathieu, D.H. Thomson, D. White, and R.A. Buchanan. 2003. Effect of seismic energy on snow
crab (Chionoecetes opilio). Environ. Stud. Res. Funds Rep. 144. Calgary, Alberta.
Christian, J.R., A. Mathieu, and R.A. Buchanan. 2004. Chronic effects of seismic energy on snow crab
(Chionoecetes opilio). Environ. Stud. Res. Funds Rep. 158, Calgary, Alberta.
DFO. 2004. Potential impacts of seismic energy on snow crab. Canadian Science Advisory Secretariat Habitat
Status Report 2004/003.
Donskoy, D.M. and M.L. Ludyanskiy. 1995. Low frequency sound as a control measure for zebra mussel fouling.
Proc. 5th Int. Zebra Mussel and Other Aquatic Nuisance Organisms Conference, February 1995, Toronto,
Ont.
Guerra, A., A.F. González, and F. Rocha. 2004. A review of the records of giant squid in the north-eastern Atlantic
and severe injuries in Architeuthis dux stranded after acoustic explorations. Paper presented at the
International Council for the Exploration of the Sea (ICES) Annual Science Conference, 22–25 Sept. 2004,
Vigo, Spain. ICES CM 2004/CC:29.
Henninger, H.P. and W.H. Watson, III. 2005. Mechanisms underlying the production of carapace vibrations and
associated waterborne sounds in the American lobster, Homarus americanus. J. Exp. Biol. 208:3421-3429.
Hu, M.Y., H.Y. Yan, W-S Chung, J-C Shiao, and P-P Hwang. 2009. Acoustically evoked potentials in two
cephalopods inferred using the auditory brainstem response (ABR) approach. Comp. Biochem. Physiol. A
153:278-283.
Jeffs, A., N. Tolimieri, and J.C. Montgomery. 2003. Crabs on cue for the coast: the use of underwater sound for
orientation by pelagic crab stages. Mar. Freshw. Res. 54:841-845.
Jeffs, A.G., J.C. Montgomery, and C.T. Tindle. 2005. How do spiny lobster post-larvae find the coast? N.Z. J.
Mar. Fresh. Res. 39:605-617.
Kaifu, K., S. Segawa, and K. Tsuchiya. 2007. Behavioral responses to underwater sound in the small benthic
octopus Octopus ocellatus. J. Mar. Acoust. Soc. Japan 34:46-53.
Kaifu, K., T. Akamatsu, and S. Segawa. 2008. Underwater sound detection by cephalopod statocyst. Fish. Sci.
74:781-786.
Komak, S., J.G. Boal, L. Dickel, and B.U. Budelmann. 2005. Behavioural responses of juvenile cuttlefish (Sepia
officinalis) to local water movements. Mar. Freshw. Behav. Physiol. 38:117-125.
Lagardère, J.P. 1982. Effects of noise on growth and reproduction of Crangon crangon in rearing tanks. Mar.
Biol. 71:177-186.
Latha, G., S. Senthilvadivu, R. Venkatesan, and V. Rajendran. 2005. Sound of shallow and deep water lobsters:
measurements, analysis, and characterization (L). J. Acoust. Soc. Am. 117: 2720-2723.

Appendix E: Airgun Sounds and Invertebrates
Environmental Assessment for L-DEO’s Shatsky Rise Seismic Survey, 2010 Page 194
Lovell, J.M., M.M. Findley, R.M. Moate, and H.Y. Yan. 2005. The hearing abilities of the prawn Palaemon
serratus. Comp. Biochem. Physiol. A 140:89-100.
Lovell, J.M., R.M. Moate, L. Christiansen, and M.M. Findlay. 2006. The relationship between body size and
evoked potentials from the statocysts of the prawn Palaemon serratus. J. Exp. Biol. 209:2480-2485.
McCauley, R.D., J. Fewtrell, A.J. Duncan, C. Jenner, M.-N. Jenner, J.D. Penrose, R.I.T. Prince, A. Adhitya, J.
Murdoch, and K. McCabe. 2000a. Marine seismic surveys: analysis of airgun signals; and effects of air gun
exposure on humpback whales, sea turtles, fishes and squid. Rep. from Centre for Marine Science and
Technology, Curtin University, Perth, Western Australia, for Australian Petroleum Production Association,
Sydney, NSW.
McCauley, R.D., J. Fewtrell, A.J. Duncan, C. Jenner, M.-N. Jenner, J.D. Penrose, R.I.T. Prince, A. Adhitya,
J. Murdoch, and K. McCabe. 2000b. Marine seismic surveys – a study of environmental implications.
APPEA J. 40:692-706.
Moriyasu, M., R. Allain, K. Benhalima, and R. Claytor. 2004. Effects of seismic and marine noise on invertebrates:
A literature review. Fisheries and Oceans Canada, Science. Canadian Science Advisory Secretariat
Research Document 2004/126.
Packard, A., H.E. Karlsen, and O. Sand. 1990. Low frequency hearing in cephalopods. J. Comp. Physiol. A 166:
501-505.
Parry, G.D. and A. Gason. 2006. The effect of seismic surveys on catch rates of rock lobsters in western Victoria,
Australia. Fish. Res. 79:272-284.
Payne, J.F., C.A. Andrews, L.L. Fancey, A.L. Cook, and J.R. Christian. 2007. Pilot study on the effects of seismic
air gun noise on lobster (Homarus americanus). Can. Tech. Rep. Fish. Aquatic Sci. 2712.
Payne, J.F., C. Andrews, L. Fancey, D. White, and J. Christian. 2008. Potential effects of seismic energy on fish
and shellfish: An update since 2003. Fisheries and Oceans Canada Science, Canadian Science Advisory
Secretariat Research Document 2008/060.
Pearson, W., J. Skalski, S. Sulkin, and C. Malme. 1994. Effects of seismic energy releases on the survival and
development of zoeal larvae of Dungeness crab (Cancer magister). Mar. Environ. Res. 38:93-113.
Popper, A.N., M. Salmon, and K.W. Horch. 2001. Acoustic detection and communication by decapod crustaceans.
J. Comp. Physiol. A 187:83-89.
Price, A. 2007. The effects of high frequency, high intensity underwater sound on the oxygen uptakes of Mytilus
edulis (L.). B.Sc.(Hons.) Thesis, Heriot-Watt Univ., Scotland.
Pye, H.J., and W.H. Watson, III. 2004. Sound detection and production in the American lobster, Homarus amer-
icanus: sensitivity range and behavioral implications. J. Acoust. Soc. Am. 115 (Part 2):2486.
Radford, C.A., A.G. Jeffs, and J.C. Montgomery. 2007. Orientated swimming behavior of crab postlarvae in
response to reef sound. Poster at First Intern. Conf. on Effects of Noise on Aquatic Life, Nyborg, Denmark,
Aug. 2007.
Rawizza, H.E. 1995. Hearing and associative learning in cuttlefish, Sepia officinalis. Hopkins Marine Station
Student Paper. Stanford Univ., Palo Alto, CA.
Richardson, W.J., C.R. Greene, Jr., C.I. Malme, and D.H. Thomson. 1995. Marine mammals and noise. Academic
Press, San Diego, CA. 576 p.
Tolstoganova, L.K. 2002. Acoustical behavior in king crab (Paralithodes camtschaticus). p. 247-254 In: A.J. Paul,
E.G. Dawe, R. Elner, G.S. Jamieson, G.H. Kruse, R.S. Otto, B. Sainte-Marie, T.C. Shirley, and D. Woodby
(eds.), Crabs in cold water regions: biology, management, and economics. University of Alaska Sea Grant,
AK-SG-02-01, Fairbanks, AK.