environmental assessment for the satellite power system
TRANSCRIPT

DOE/ER/10003-T2 · Dist. Category UC-34b
Environmental Assessment for the Satellite Power System - Concept Development and Evaluation Program - Effects of Ionospheric Heating on Telecommunications
August 1980
Prepared by: Institute for Telecommunication Sciences National Telecommunications and Information Administration U.S. Department of Commerce Boulder, Co. 80303 Under Contract A 102-79CH10003
Prepared for: U.S. Department of Energy Office of Energy Research Satellite Power System Project Division Washington, D.C. 20545
DOE/NASA Satellite Power System Concept Development and Evaluation Program

TABLE OF CONTENTS
LIST OF TABLES LIST OF FIGURES ACKNOWLEDGEMENTS EXECUTIVE SUMMARY ABSTRACT 1. INTRODUCTION - GENERAL BACKGROUND 2. SPECIFIC BACKGROUND 3. IONOSPHERIC HEATING-PRE-CONCEPT DEVELOPMENT AND EVALUATION
PROGRAM (CDEP)
4.
5.
3. 1 3.2
3.3 3. 3. l
3.3.2 3.3.3
Background Experimental Results Related to the Physics of Overdense Heating Telecommunication Effects Due to Overdense Heating Effects Observed at Very Low Frequency (VLF) and Low Frequency (LF) Effects Observed at Medium Frequency (MF) Effects Observed at High Frequency (HF)
3.3.4 Effects Observed at Very High Frequency (VHF) and Ultra High Frequency (UHF)
3.3.5 Effects Observed on Satellite-Ground Signals 3.4 Sunmary IONOSPHERIC HEATING - STUDIES UNDERTAKEN DURING CONCEPT DEVELOPMENT AND EVALUATION PROGRAM (CDEP) - BACKGROUND TELECOMMUNICATION SYSTEM STUDIES IN A SIMULATED SPS ENVIRONMENT 5.1 Telecorrmunication System Impacts Due to Ohmic Heating 5.1.1 VLF System Effects 5.1 .2 LF System Effects 5.1.3
5. l .4
5.1.5
MF System Effects Andllary Telecommunication System Diagnostics Summary of Telecorrmunication Effects in the Lower Ionosphere
5.2 Telecommunication System Impacts due to Self-Focusing Instabi 1 iti es
5. 2. 1
5.2.2 5.2.3
5.2.4
Satellite-to-Aircraft Measurements Satellite-to-Ground Observations HF Observations Summary of Telecommunication Impacts in the Upper Ionosphere
i
PAGE iii iv vi
vii xi
1
2
6
6
7
7
10
10
10
12
13
13
13
17
17
21
26
33
33 40
43
45
51 57
57

6. THEORETICAL STUDIES OF CHANGES IN THE IONOSPHERE AND TELECOMMUNICATION SYSTEMS IN AN SPS ENVIRONMENT 58
6.1 Theoretical Studies of SPS Ionospheric Heating Effects 58 6.1. l Radio Wave Heating of the Ionospheric Plasma 58 6.1.2 Studies of Enhanced Heating in the Lower Ionosphere 63 6.1.3 Thermal Self-Focusing Studies 64
6.2 Numerical Simulations of Teleconmunication Systems Perfonnance 68
6.2. l Simulations of Effects of Electron Density Changes 68 6.2.2 Simulations of Effects of Electron Temperature Changes 69 6.3 Sunmary 72
7. EXPERIMENTAL STUDIES OF THE PHYSICS OF IONOSPHERIC HEATING 72 7 .1 Observations of Enhanced Heating in the Lower Ionosphere 73 7.2 Experimental Studies of Self-Focusing Effects 74 7.3 Sunmary 76
8. OVERALL CONCLUSIONS 76 REFERENCES 83
11

LIST OF TABLES
Table 1. SPS·Equivalent Power Density and Size of Heated Region for Existing Platteville and Arecibo Facilities at Three Altitudes
Table 2. Antenna Characteristics of Platteville Facility and SPS Comparable Power Densities Reduced Using Equation (2)
Table 3. Data on Facilities and Field Sites Used in the Experimental Simulation of SPS Operation
Table 4. Average Values of OMEGA·Hawaii Amplitude and Phase Data Recorded at Brush, Colorado. During Times of Platteville Facility 11 0N 11 and "OFF" Period
Table 5. Average Values of the Fallon, Nevada, LORAN-C Phase and Amplitude Data Recorded at Brush, Colorado_ During Times of Platteville Facility "ON" and "OFF" Periods
Table 6. Experimental Sunmary for Cross-Modulation Effects
Table 7. D Region Electron Density Models
Table 8. Relative Amplitude in Volts/meter (top line} and phase in degrees (second line) calculated for VLF (10 kHz) and LF (100 kHz) circuits using the indicated electron density profiles listed in Table 7.
iii

Figure 1.
Figure 2.
Figure 3.
Figure 4.
Figure 5.
Figure 6.
Figure 7.
Figure 8.
Figure 9.
Figure 10.
LIST OF FIGURES
Typical electron density profiles for the daytime and nighttime midlatitude ionosphere.
Artist's concept of SPS effects on the ionosphere and telecommunication systems.
Temperature changes in the ionosphere as the result of overdense heating at Arecibo, Puerto Rico (provided by L. Duncan, 1980).
Example of self-focusing instabilities created during overdense heating in the ionosphere above Arecibo, Puerto Rico, on June 6, 1977 (provided by L. Duncan, 1980).
Map of signal sources and recording sites in relationship to the Platteville Facility.
OMEGA phase and amplitude data recorded at Brush, co, from Hawaii 11.8 kHz on August 16, 1979.
OMEGA phase and amplitude data recorded at Brush, co, from Ha wa i i 11.8 kHz on August 24, 1979.
at
at
LORAN-C phase data recorded at Brush, CO, from Fallon, NV, at 100 kHz on August 16 and 17, 1979.
LORAN-C amplitude and phase data recorded south of Brush, CO, from Fallon, NV, at 100 kHz on September 26, 1979.
LORAN-C phase and amplitude data recorded at Boulder, CO, from Dana, IN, at 100 khz on August 23, 1979.
Figure 11. Amplitude signals recorded from KSL (1160 kHz, SLC, UT--upper trace), and KREX (1100 kHz, Grand Junction, CO--lower trace), at Brush, CO, on August 24, 1979.
Figure 12. Ionosonde data recorded on October 4, 1979. Modifier frequency = 5.2 MHz, 1.7 MW cw input power. Ionosonde probe frequency= 4.6 MHz.
Figure 13. Recorded relative phase data from LORAN-C station at Fallon, NV, at Boulder, CO, and from LORAN-C station at Dana, IN, at Boulder, CO, on August 20, 1979.
Figure 14. Relative phase records from OMEGA, Hawaii, recorded at Boulder, CO, on August 16, 17, 18, 19, and 20, 1979.
Figure 15. Geometry of Platteville Heater test.
Figure 16. Deep scintillation fading during overdense heating.
iv

Figure 17.
Figure 18.
Figure 19.
Figure 20.
Figure 21.
Figure 22.
Figure 23.
Figure 24.
Figure 25.
Residual scintillation fading after overdense heating.
Noisy fading during underdense heating.
Lack of fading during 11 0FF 11 period of underdense heating.
LES-8 amplitude data observed at Carpenter, WY, on March 12, 1980, during overdense heating.
LES-8 amplitude data observed at Carpenter, WY, on March 12, 1980, during underdense heating.
LES-8 amplitude data observed at Carpenter, WY, on March 13, 1980, during underdense heating.
Theoretical values of electron density calculated using the PerkinsRoble code for the Platteville Facility 11 0FF 11 and 11 0N. 11
Theoretical values of electron temperature calculated using the Perkins-Roble code for the Platteville Facility "OFF" and "ON. 11
Values of electron temperature as a function of time after start of Platteville heating for noon and midnight conditions. Values calcu-lated using the Perkins-Roble code.
Figure 26. Calculated temperature as a function of power flux at 2.45 GHz.
Figure 27. Calculated electron temperatures and electron densities for the SPS power beam and a 5 ~1Hz extraordinary frequency at the Platteville Facility.
Figure 28. Enhanced electron heating observations. Heater source is the 430 MHz Arec ·j bo radar.
Figure 29. Plasma-line spectrum (in contour format) of the F Region observed under normal conditions.
Figure 30. Plasma-line spectrum (in contour format) of the F Region heated in an underdense manner.
Figure 31. High resolution spectrum of a portion of Figure 30.
v

ACKNOWLEDGEMENTS
Many individuals contributed information that has been included into this document. Gratitude must be expressed to Ors. Santimay and Sunanda Basu, Emmanuel College; Dr. Frank Djuth, Rice University; Dr. Lewis Duncan, Los Alamos Scientific Laboratory; Professor Martin Goldman, University of Colorado: Dr. Gerry Meltz, United Technologies Research Center· Dr. Francis Perkins, Princeton University Plasma Physics Laboratory; and Dr. Robert Showen, SRI, International, for their willingness to share their results.
The overall quality of the manuscript was vastly improved by the critical comments on the original provided by Mr. Martin Abromavage, Argonne National Laboratory, Washington, D. C., Professor William Gordon, Dean of Natural Sciences, William Marsh Rice University; Dr. Gerry Meltz, United Technologies Research Center; Mr. Ernest Morrison, Institute for Telecommunication Sciences; Dr. Larry Sweeney, SRI, International; and Dr. William Utlaut, Institute for Telecommunication Sciences.
During the entire course of the work discussed herein, Dr. Anthony Valentino, Argonne National Laboratory; Mr. Michael Riches, Department of Energy; and Mr. Frederick Koomanoff, SPS Project Officer, have been most helpful and supportive. We are very grateful.
vi

EXECUTIVE SUMMARY The passage of the Satellite Power System (SPS) microwave power beam through
the ionosphere may give rise to enhancements in the temperature of electrons in the earth's ionosphere and to the formation of irregularities in the structure of the ambient ionospheric electron density. These changes in the characteristics of the ionosphere could result in adverse impacts upon the performance of telecommunication systems that rely upon the ionosphere as a medium of propagation. The purpose of this portion of the overall SPS Environmental Assessment is to determine the degree to which the ionosphere would be modified by the passage of the SPS power beam and what effects, if any, will result on telecommunication system performance.
In order to perform this assessment, a program of national scope involving Government laboratories, industrial resources, and university personnel, had been formulated. The program focused upon simulating the effect of SPS operation upon the ionosphere by use of existing ground-based high-power transmitter facilities and developing the necessary formulations to permit the extrapolation of the simulations to the SPS operational scenario. The programs of research and exploratory development undertaken for this assessment were grouped into three categories: simulation of telecomnunication impacts, experimental studies of the physics of heating the ionosphere by radio waves, and theoretical studies.
The telecommunication simulations and the experimental physics programs centered around the high-powered high-frequency transmitter facilities located at Platteville, Colorado, and at Arecibo, Puerto Rico, respectively. The use of these facilities was made possible by the fact that the processes believed to emanate in the ionosphere from SPS operation will stem from ohmic heating and self-focusing interactions. It is believed that these interactions--ohmic heating and self-focusing--can be scaled according to frequency-dependent laws. The simulations of SPS effects on the ionosphere were conducted using much lower frequencies and power densities than would be associated with SPS operation. The effects in the ionosphere produced by the ground-based facilities are, however, directly comparable to those associated with SPS operation. Studies and experiments were conducted to investigate self-focusing interactions in the upper ionosphere and ohmic heating interactions in the lower ionosphere.
A wide range of telecommunication system performance data has been gathered under conditions of simulated SPS ionospheric heating. Measurements of VLF, LF, and MF teleco1T111unication systems yielded results that indicate such systems will not be adversely impacted by SPS operation. Results of studies of satellite transmissions received on the ground and in an aircraft during times of simulated SPS heating
vii

indicate that discernible changes in signal level can occur for radio waves passing through the upper ionosphere when it is heated with SPS-comparable power density.
Studies undertaken to theoretically explain experimental observations focusing on the physical mechanisms at work during ionospheric heating have yielded results in which theory and experiment are in quantitative agreement. In addition, the latest theoretical simulations have shown that the Platteville and Arecibo facilities can provide SPS-comparable power density to a wide range of ultitudes in the lower ionosphere. The agreement between observation and theory is felt to be quite good for processes occurring in the lower ionosphere. Theoretical results for proces--particularly those following from self-focusing instabilities--of importance in the upper ionosphere are now becoming available.
Despite the fact that much has been accomplished to assess the behavior of the ionosphere subjected to the passage of the SPS microwave power beam, more remains to be done. The current ground-based facilities can provide SPS-comparable ohmic heating only to the lower ionosphere up to about 100 km. The processes of importance in the ionosphere well above 100 km are believed to follow from self-focusing mechanisms. The existinq facilities can simulate SPS self-focusing effects in the upper ionosphere because such effects follow a 1/f3 scaling law compared to the 1/f2
scaling law applicable to the ohmic heating processes. However, in order to realistically simulate the SPS power beam passage through the entire ionosphere, SPS-comparable ohmic heating must be provided over all ionospheric heights. In order to accomplish this, existing ground-based facilities must be made more powerful.
Further study is needed in order to assess the impact of SPS operation upon HF, VHF, and UHF telecommunication systems. Observations of electron density and electron temperature changes throughout the entire ionosphere under conditions of SPS-comparable power densities must be made. These studies need to be undertaken with enhanced ground-based facilities.
Theoretical studies directed toward explaining the genesis and maintenance of irregularities by self-focusing mechanisms need to be continued. The results must be directed toward all facets of SPS operation. The theoretical work thus far undertaken provides justification for the frequency-scaling laws used as a basis for this assessment program. These scaling laws have to be experimentally validated in order to provide the final bit of evidence that the simulations undertaken to
date are indeed applicable to the SPS operational scenario.
viii

ABSTRACT The microwave power beam that is associated with the operation of the
Satellite Power System (SPS) will provide a continuous source of power density into the earth 1 s ionosphere. As currently conceptualized, the power density at the center of the beam would be 23 mW/cm2. This power density may be of sufficient mJ~nitude to give rise to changes in the structure of the ionosphere and to increases in the electron temperature in the ionosphere. The work described in this report was undertaken to assess the degree to which the ionosphere and ionospheric-dependent telecommunication systems would be impacted by the passage of the Satellite Power System microwave power beam. The program of study utilized resources from Government, industry, and universities in order to conduct theoretical and experimental investigations that relate to the operational scenario surrounding the Satellite Power System concept. The results of the numerous 1nvestigations that were undertaken are summarized in this document and areas in which further study is required are pointed out.
xi

1. INTRODUCTION - GENERAL BACKGROUND
The United States Department of Energy is currently investigating a number of different alternatives in order to meet the energy needs of the Nation in the twenty-first century. One of the alternatives currently under study centers around a Satellite Power System (SPS). The current systems concept with regard to the SPS is the placing into geostationary orbit of one or more satellites equipped with photovoltaic cells to produce direct current from solar radiant energy. A reference system concept has been defined to serve as a common basis for research and evaluation (U. S. Department of Energy, 1978). Each satellite which will be 10 km long, 5 km wide, and 0.5 km thick would be equipped with instrumentation to transfonn the de produced by the solar photovoltaic cells to microwave energy at the satellite. The microwave energy would be transmitted to the surface of the earth at a frequency of 2.45 GHz which currently falls within an industrial, scientific, and medical band (ISM) allocation of the electromagnetic spectrum. At the surface of the earth, the microwave energy would be rectified and conditioned to interface with utility grids. The input into the utility grid would be about 5,000 megawatts of continuous power for each satellite/rectenna combination. Other system concepts also are being studied, but the microwave-based reference system is currently the basis for the SPS Concept Development and Evaluation Program (CDEP).
There is concern that the operation of the SPS may result in substantial changes to the earth's environment and that it may impact upon the earth's inhabitants. In its quest to obtain a viable program directed toward investigating the overall feasibility of a Satellite Power System, the Department of Energy is conducting an environmental assessment of the impact of SPS operation. This assessment provides the mandate for various organizations to investigate environmental effects of SPS operation from the perspective of biological, non-ionizing radiation, atmospheric, ionospheric, radio interference, and other impacts. In this report, the studies undertaken to assess the impact of the operation of the SPS upon the ionosphere are discussed. The material presented here is directed toward effects in the ionosphere resulting from heating induced by the passage of the SPS microwave beam. Changes in the ionospheric structure resulting from chemical effluents associated with the launch
of heavy left launch vehicles are discussed in a companion report addressing atmospheric effects due to SPS operation.

2. SPECIFIC BACKGROUND
The power density associated with the passage of the SPS microwave power beam as it is transmitted from geostationary orbit to the surface of the earth is 23 mW/cm2 at the beam center. Such power densities are of sufficient intensity to give rise to changes in the electron temperature and electron density in the earth 1 s ionosphere. These changes, in turn, can affect the performance of telecommunications systems that rely upon the ionosphere as a medium for electromagnetic propagation.
The ionosphere is commonly defined as that portion of the earth's upper atmosphere where sufficient numbers of free electrons exist so as to affect radio-wave propagation. Electromagnetic radiation propagating through this region is collisionally damped by the free electrons. For microwave frequencies, the fraction of wave energy absorbed by the plasma is expected to be relatively small. However, the resulting heating of the plasma can significantly affect the local ionosphere thermal budget. Strong microwave radiation can initiate rapid enhancements in electron temperature, also affecting ionospheric densities and structure. In addition, differential heating of the plasma gives rise to electron temperature gradients, convective plasma motions, and macroscopic thermal forces capable of exciting large-scale plasma instabilities.
Numerous telecommunications systems rely on ionospheric reflections or transionospheric propagation as part of their communication signal path. Any system that can significantly modify the ionosphere has the potential to produce wideranging telecommunications interference. In addition, the role of the ionosphere in solar-terrestrial coupling and climate change is not well understood. As a result, modification of the ionosphere by the SPS microwave beam is of general concern.
Figure 1 shows the altitude variation of typical electron density values during daytime and nighttime conditions. The ionosphere is commonly discussed in terms of three distinct regions: the D, E, and F regions. The D region, roughly 60 to 85 km, is characterized by low electron densities and collision dominated processes. Ionospheric heating from the SPS microwave beam is expected to be greatest in this layer. The altitude range from 85 to 140 km is designated the E region. Collisions and conduction exert equal control on the dynamic processes in this region. The F
region, extending 140 km to approximately 2,000 km contains the greatest electron concentrations in the ionosphere. The large-scale processes in this region are controlled by plasma conduction, and therefore are strongly affected by the geomagnetic field. Because of the differing characteristics of these regions, the physics of ionosphere/microwave interactions can vary greatly. The energy density
2

1000
e ~ -i 500 -; 15
0
1000
-e ~ -.g 500 .a :;:: a
0
102
102
Regions of interest
105 104 105 10• 107
daytime ne
F
105 104 105 108 107
nighttime n8
Figure 1. Typical electron density profiles for the daytime and nighttime mid~ latitude ionosphere.
3

associated with the passage of the SPS power beam through the ionosphere (23 mW/cm2
at the beam center) is the same order as the energy density required to give rise to substantial heating of the lower ionosphere and to the creation of irregularities and striations in the ionospheric plasma at F-region heights 250 to 400 km (Meltz et al.,1974). The heating of the lower ionosphere that is associated with the passage of the SPS microwave power beam is believed to result from ohmic type interactions between the microwave beam and the ionospheric electrons. In the upper ionosphere (the F region), the heating effects associated with the passage of the SPS beam are believed to give rise to the phenomenon of thermal self-focusing.
Thermal self-focusing can arise because small natural density fluctuations in the ionosphere cause a variation in the plasma index of refraction. As a result, an electromagnetic wave propagating through the plasma is slightlY focused and defocused, with the local electric field intensity increased as the incident wave refracts into regions of comparatively underdense plasma. Differential ohmic heating of the plasma gives rise to a temperature gradient, driving plasma from the focused region and amplifying the initial densjty perturbation. This self-focusing instability continues until hydrodynamic equilibrium is reached, creating largesca 1 e ionospheric irregularities similar to natura 1 spread-F conditions. Therma 1 self-focusing has also been referred to as thermal diffusive scattering, thermallydriven stimulated Brillouin scattering, or collisionally coupled, purely growing, parametric instability in ionospheric modification theories. In nonlinear optics, it is called stimulated Rayleigh scattering; as applied to laser technology, it is described as beam filamentation. The effect of the self-focusing instability is to cause ionospheric irregularities or plasma striations. The effect of selffocusing is frequently referred to as "hot spots 11 in laser-plasma coupling, 11 solitons11 in astrophysical and controlled fusion research, and 11 cavitons 11 in some laboratory plasma studies. Nevertheless, despite subtle differences, the physics of self-focusing is essentially the same for each of these applications.
The SPS microwave beam may generate ionospheric changes. The environmental and system impacts will depend on the degree of beam self-focusing, the size of the resulting large-scale density striations, and the change in ionospheric temperature. Figure 2 provides an artist's concept of how telecommunication systems could be impacted by the operation of the Satellite Power System. The figure shows an SPS beaming energy to the surface of the earth and giving rise to an enhanced electron temperature in the D region and the formation of irregularities in the F region. Telecommunication systems whether they be situated on the surface of the earth or in space can be affected by the modified ionosphere. The modifications
4

c.n
D REGION
::- --' ......... -....__
"V COMMUNICATIONS
SPS
IONOSPHERIC IRREGULARITIES
4'4G'~ ~->ic
t</~ (.()
Figure 2. Artist's concept of SPS effects on the ionosphere and telecommunication systems.

in the ionosphere result from the heating of the ionosphere as the SPS microwave power beam is transmitted from satellite orbit to the surface of the earth.
3. IONOSPHERIC HEATING-PRE-CONCEPT DEVELOPMENT AND EVALUATION PROGRAM (CDEP) 3. 1 Background
Heating the ionosphere with high powered radio waves has been conducted on an intentional basis since the late 1960 1 s. This heating has been undertaken principally using radio waves whose frequencies are confined to the HF (3-30 MHz) portion of the spectrum. The radio waves used in most of the HF heating experiments were transmitted into the ionosphere and at a height where the ionospheric plasma frequency, f p equalled the frequency of the heater wave, f, the heater wave was reflected back to the surface of the earth. The height of reflection varies with the electron density since f p is related to electron density, Ne, through the equation: .
Ne (cm-3) = 1.24 x 10⁴ fp2 (MHz) 2 (1)
The heating of the ionosphere with HF waves has been performed for the most part under conditions in which the electron density in the ionosphere was sufficiently great or dense enough to reflect the heater wave. Such ionospheric heating is referred to as overdense heating. In the case of heating resulting from SPS operation, the radio wave giving rise to the heating will pass through the ionosphere. The ionosphere will not be dense enough to reflect the SPS microwave beam. The heating that results in this case is referred to as underdense heating. The heating of the ionosphere by underdense radio waves results from ohmic interaction between the heater wave and the ionospheric electrons. This type of heating leads to changes in electron density and the onset of instabilities in the ionospheric plasma that result from thermal processes.
High-power HF facilities located at Platteville, Colorado, and Arecibo, Puerto Rico, have been extensively used to increase the knowledge of the physical mechanisms that lead to changes in the plasma concentration of an ionosphere that is subjected to intense electromagnetic radiation. A review by Utlaut (1975) describes the status of knowledge garnered by intentionally heating and modifying the ionosphere. This review significantly updates the discussions provided by Utlaut and Cohen (1971) and Gordon and Carlson (1974). In recent years, a great deal of theoretical emphasis has been placed on the understanding of plasma processes that lead to instabilities and irregularities in the ionospheric electron density that proceed as the result of the application of intense heating by radio waves (Fejer~
1979; Gurevich, 1978).
6

3.2 Experimental Results Related to the Physics of Overdense Heating Despite the fact that results of overdense ionospheric heating studies can
not be related in a direct manner to underdense effects, it is useful, nonetheless, to consider what the overdense results demonstrate with regard to ionospheric processes and impacts upon the performance of telecommunication systems. Figure 3 shows the results of heating the ionosphere in the overdense mode at Arecibo, Puerto Rico. The radiated power flux density near the HF reflection altitude was estimated at 20 µW/m 2 (about l/lOOOth of the power density expected from a single SPS). Electron temperature increases of several hundred degrees were observed near this height of reflection, as shown in the figure. The temperature measurements were made using the 430-MHz incoherent backscatter radar located at Arecibo.
The Arecibo Facility has also been used to investigate the excitation of parametric instabilities in an ionosphere heated by overdense radio waves. The results of a self-focusing experiment conducted at Arecibo from June 2 through 17, 1977, are shown in Figure 4. When the radar beam is fixed (Fig. 4a), signal modulations are induced by the natural drift of striations through the beam. Immediately afterward, rapid scanning of the radar beam (as shown in Fig. 4b) detected a series of striations in the interaction region. Typical striation dimensions deduced from observations over many such scans are 1.2 km in the north-south plane and 1.0 km in the east-west plane, in good agreement with thermal self-focusing theory. Striation velocities are on the order of 25 m/s, with components of 20 m/s to the east, and smaller than 15 m/s in the north-south direction. Northsouth velocity measurements are complicated by the strong spatial dependence of the striation width in the magnetic meridian plane. The magnitude of the electron density fluctuations in the striation is estimated at ~ 5%. Induced large-scale structuring of the ionosphere by self-focusing, therefore, is much like naturally occurring spread-F.
3.3 Telecommunication Effects Due to Overdense Heating The effects of overdense heating an ionospheric-dependent teleconvnunications
systems were studied principally in the early 1970's using as a principal source of overdense heating the HF Facility at Platteville, Colorado, and operated by the Institute for Telecommunication Sciences. The results obtained from these studies demonstrate the degree to which ionospheric heating can impact on the performance
of specific telecommunication systems.
1

C;,
1200
i'" 1100
I "' ~ 1000 ... c a: '*' t IOO
"' ...
IOO
• • • • • ••
• • •• •
• ••• • •
••• • •
I I I I
' •I •• • • • ••• • •
••
••• •
• •
• • • •
• • • •• • • • • • • • •
0 IO 120 llO 240 300
TIME-1
Fiqure 3. Temperature chan~es in the ionosphere as the result of overdense heatin~ at Arecibo, Puerto Rico (provided by L. Quncan, 1980).

C7,.....------------------------------------------......-----.
o.e
03
145800
I.
QI
I QI
I 0.4
,.... .
Beam fiaed at 3.2• N 6 June 1977 tr• 12.S%
145830 14S900
Time 14S930
Blom ICOftftinQ (north)
6 June 1977 tr• 12.5%
,....._... km ICOll
150000
= ::r:a.~ . .__ ___ ....._ ___ ___.. ____ & .... 0' ____ 1 ...... 0_·_
Figure 4. Example of self-focusing instabilities created during overdense heating in the ionosphere above Arecibo, Puerto Rico, on June 6, 1977 (provided by L. Duncan, 1930).
9

3.3.1 Effects Observed at Very Low Frequency (VLF) and Low Frequency (LF) Observations have indicated that the modulation radiated by a high-frequency,
high-powered radio transmitter can be transferred to VLF and LF radio waves reflected from the D region of the ionosphere (Jones et al., 1972). The observations reported were of conventional cross-modulation effects wherein the modulation of a high-powered radio wave was transferred to another wave that passed through the region of the ionosphere that was disturbed by the modulating wave. Crossmodulation effects were observed on frequencies of 20 kHz and 60 kHz when the Platteville high-powered transmitter was operating at 5.1 MHz and 7.4 MHz.
The heating frequencies used in the experiments (5-10 MHz) were not reflected by the lower ionosphere but passed through it. The lower ionosphere was heated using frequencies that give rise to processes that rather closely approximate ohmic processes. The increase in electron temperature in the lower ionosphere resulted in an increase in electron-collision frequency, which in turn affected the propagation characteristics of the VLF and LF waves that were reflected from the region where substantial heating was taking place. The ionospheric heating was produced by processes that are believed to be similar to those expected for the underdense SPS ionospheric heating. More recent analysis of VLF and LF data taken during times of high-powered, HF heating has been undertaken (Chilton, NTIA TM 79-4, limited distribution). A theory has been developed that demonstrates that the reflection process of VLF and LF waves in the D region is changed by the passage of high-powered, HF waves through the D region.
3.3.2 Effects Observed at Medium Frequency (MF) No observations of telecommunication systems operating at medium frequency in
conjunction with intentional ionospheric heating have been reported in the literature.
3.3.3 Effects Observed at High Frequency (HF) A substantial amount of data has been collected that deals with the effects
of F region changes induced by overdense heating on the performance of HF radio systems. The first direct evidence of intentional ionospheric modification was obtained using a vertical-incidence ionosonde (Utlaut and Violette 1974). The ionosonde measures the time delay between transmission and subsequent reception of a radio wave after it is propagated vertically into and reflected by the ionosphere. Such phenomena as artificial spread-F (a manifestation of heater-induced irregu-1 arities in electron density) and wide-band attenuation appeared to be regular and repeatable occurrences.

Substantial ionospheric effects caused by heating have been observed using a high-frequency, phased-array radar (Allen et al., 1974). The phased-array radar was chosen for the experiment because of its sensitivity to heat-induced changes in the ionosphere. The radar was used to study the angular spectrum of spread-F returns from the ionosphere modified by the Platteville Facility. The observations obtained indicated that the radar signal was broadened in range and Doppler and angular extent by the irregularities produced by the heater.
High-frequency (and VHF) backscatter-radar observations have been made in experiments that used the Platteville Facility along with radar located in New Mexico (Thome and Blood, 1974). Irregularities produced by the heater gave rise to signals that were scattered back to the radar (backscatter) directly from the modified region of the ionosphere. The principal characteristics of the scattered return signals included:
--The echos generally appeared and disappeared with the turning-on and turning-off of the heater.
--The range depth of the scattered return was comparable to the size of the heater beam in the ionosphere.
--The Doppler spectrum of the returns was narrow {2 Hz at 30 MHz).
--The equivalent scattering cross-section of the heated volume varied substantially with time of day and decreased monotonically with increasing frequency.
These measurements, as well as others using a network of oblique HF sounder paths operating in the Southwest United States (Fialer, 1974) clearly demonstrated that the ionospheric irregularities that caused the observed HF effects were aligned along the earth 1 s magnetic field lines. The results of the experiments using the network of sounder paths demonstrate a strong aspect sensitivity, i.e., the propagation path was nearly perpendicular to the field line that contained the electron-density irregularities. The radar cross-sections obtained from both of the studies mentioned above indicate that cross-sections on the order of l07m2
between frequencies of 20 MHz and 120 MHz could result from the heated ionospheric volume.
Detailed models of the irregularities that give rise to scattering of radio waves in the HF (and VHF and UHF) portion of the frequency spectrum have been developed (Rao and Thome, 1974; Minkoff, 1974). These models are based on the
observations discussed above and are dependent upon the fact that the radio waves heating the ionosphere are reflected from the ionosphere.

3.3.4 Effects Observed at Very High Frequency (VHF) and Ultra High Frequency (UHF) Radio waves propagated at VHF and UHF have been observed to be scattered by
irregularities in electron density that were created by overdense ionospheric heating. Radar located at White Sands, New Mexico, that illuminated the ionosphere above the high-powered Platteville transmitter was used to observe backscatter at VHF and UHF (Minkoff et al., 1974). The frequencies employed were 157.5 MHz and 435 MHz. Two distinct scattering modes were determined: one at the radar frequency; f R' and the other at a frequency shifted from fR by an amount equal to the heater frequency f H. The scatter mode observed at f R was highly aspect-sensitive. The mode corresponding to the shifted frequency, f R ~ f H' depended much less on the magnetic aspect. Both of the scatter modes were found to turn off and on in response to ionospheric heating and the spectral width of both modes was observed to be rather narrow - on the order of 10 Hz.
VHF and UHF scatter modes of propagation have also been observed using a bistatic radar system (Carpenter, 1974). These experiments utilized transmitters and receivers located at White·sands, New Mexico, and Stanford, California. The results obtained support the findings mentioned above that there are two different scatter modes. The scatter cross-section for the mode that was highly aspectsensitive was found to be largest for the lower frequencies employed in the experiment: 4 x 10⁶ m2 at 49.8 MHz compared to 3.2 x 10³ m2 at 423.3 MHz. The scatter cross-section for the mode that was independent of the geomagnetic aspect was found to increase with increasing frequency (4 m2 at 49.8 MHz to 16 m2 at 435 MHz).
The aspect-sensitive, field-aligned ionospheric irregularities created by overdense ionospheric heating could be used to design point-to-point VHF corrmunication circuits (Stathocopoulos and Barry, 1974). Experiments have shown, for example, that facsimile can be transmitted via 30 MHz and 50 MHz scatter from heater-induced ionospheric irregularities (Barry, 1974). WMle the usefulness of such a communication system would be severely limited by the geometrical considerations concerning irregularity location and aspect sensitivity, as well as by the locations of the transmitter and receiver, inadvertent interference to existing systems would be possible, particularly under selected geometrical conditions.
Detailed studies have been undertaken to obtain realistic estimates of the
scattering cross-section of the irregularities created by overdense ionospheric heating. In addition to the references already mentioned, two other articles have described attempts to model VHF/UHF scattering cross-sections (Utlaut et al., 1974). The scattering cross-section is very dependent on the electron-density irregularity,
12

which in turn depends on the causative mechanisms accompanying overdense ionospheric heating.
3.3.5 Effects Observed on Satellite-Ground Signals A limited program of satellite-ground reception observations has been under
taken, including an experiment that obtained observations from both geostationary and orbiting satellites whose signals passed through a region of the ionosphere modified by the high-powered Platteville transmitter (Bowhill, 1974). The observations indicate that scintillation (rapid fading of signal amplitude) of VHF/UHF signals occurs and that the depth of scintillation varies inversely with frequency and is in agreement with the phase-path theory of satellite scintillation.
3.4 Summary Prior to the interest in the SPS energy concept, the effects of heating on the
ionosphere and resultant telecommunications system performance studies have generally been obtained only for the case of overdense heating. The results reported pertaining to effects observed in the F region are valid only for ionospheric heating wherein the heating wave is reflected from the ionosphere. The SPS microwave beam heats the ionosphere as it passes through the earth's atmosphere. Currently there is no physically-based rationale to extend the observed overdense results to the SPS operational scenario.
4. IONOSPHERIC HEATING - STUDIES UNDERTAKEN DURING CONCEPT DEVELOPMENT AND EVALUATION PROGRAM (CDEP) - BACKGROUND
The ionospheric heating studies undertaken during CDEP to assess the impact of the operation of the Satellite Power System centered around simulating SPS operation using ground-based high-power HF facilities.
Because of the frequency involved {2.45 GHz), the heating that the SPS power beam will provide to the ionosphere is believed to be that arising from ohmic interactions between the power beam and the electrons, ions, and neutral particles comprising the ambient ionosphere. The rate of energy that is input into the ionosphere by ohmic heating due to radio waves is given:
f 2
P •(v + iJ ) -[(f + f ·cos e)2 + (v . + v ) 2 /4nLJ ei en - H ei en
where, Q = the energy input; E = the electric field amplitude of the perturbing (heating)
wave;
13
(2)

f P - the local plasma frequency; f H = electron gyrofrequency; f = the wave frequency; e - the angle between the propagation direction and the
magnetic field; vei = the electron-ion collision frequency; and ven = the electron-neutral collision frequency.
For sufficiently high frequencies and altitudes, the resulting power flux at microwave frequencies can be related to the resulting power flux at another frequency through the relationship (Gordon and Duncan, 1978):
= (3)
where PSPS and f SPS are the SPS microwave power density and frequency and PHF and f HF are the power density and frequency at another frequency in the spectrum. It follows from Equation (3) that heating the ionosphere using radio waves at a lower frequency than that of the SPS requires a smaller amount of power density to achieve a SPS-comparable effect. Provided the heating is accomplished by radio waves that pass through the ionosphere (the underdense case) high-powered HF waves can be used to simulate SPS heating.
In addition to heating the ionosphere through ohmic processes, the SPS microwave beam can generate instabilities that are driven by the heating of the power beam with a scattered electromagnetic wave, creating a ripple of Joule heating. This heating can give rise to successive perturbations in the temperature and electron density. The electron density perturbation leads to changes in the index of refraction which in turn divert the microwave beam into the troughs of the density perturbations. The process is self-consistent and unstable, hence the name thermal self-focusing instability (Perkins and Valeo, 1974).
The threshold for the onset of thermal self-focusing is proportional to the cube of the wave frequency (Perkins and Goldman, 1980). Thus, we can write an expression for the rate at which energy is imparted into the self-focusing instability that is analogous to equation (3), vis
PSPS = PHF (4)
f sps fHF
Equations (3) and (4) indicate that the amount of energy associated with the operation of the SPS that goes into heating the ionospheric plasma and that goes into
generating the thermal self-focusing instability can be realistically simulated
14

using much lower frequencies and power densities provided that the lower frequencies pass through the ionosphere.
The validity of equations (3) and (4) are crucial to the ground-based simulations of the SPS operation. The results obtained by heating the ionosphere with HF waves must be extrapolated over a frequency range of nearly 1000 in order to arrive at the SPS operational frequency. It is possible that instabilities in the ionosphere will result from the passage of the SPS power beam that can not be simulated using ground-based HF facilities. However, the current understanding of the processes that are anticipated to occur in the SPS environment, indicates that the ohmic heating (l/f2) and thermal self-focusing instability (l/f3) scaling laws are valid (Goldman private communication; Monte Giles private communication). These scaling laws have still to be experimentally verified.
The ground-based heating facility located at Platteville, Colorado, and the soon to be completed heater facility located at Arecibo, Puerto Rico, funded by the United States National Science Foundation, are capable of producing continuous SPS equivalent ohmic heating in the lower ionosphere. At higher heights, the delivered power flux density is significantly less than the frequency-scaled SPS microwave beam, following a (l/f2) scaling law. The energy density that scales to the SPS scenario for the onset of self-focusing (l/f3) is greater than the SPS power density at all ionospheric heights up to 700 km, however. Table 1 shows the SPS comparable power density and size of the modified ionospheric region associated with a 5 and 10 MHz operation at Platteville and Arecibo.
At the Arecibo Facility, a full complement of ionospheric diagnostics are used to monitor the atmospheric response to the ionosphere/radio wave interactions. The principal diagnostic is an incoherent backscatter radar, capable of measuring ionospheric winds, and currents and composition as functions of altitude and time. This radar is also capable of SPS-equivalent ionospheric heating in a very narrow beam, but cannot provide the pulse length to achieve heating equilibrium. Other supporting diagnostics include periodic ionosonde measurements, airglow observations, scintillation studies, and off-site 50-MHz radar investigations of field-aligned scatter.
The high-power, high-frequency, ionospheric heat"ing facility located at Platteville, Colorado, is the focus for studying telecommunications impacts. This
facility is excellently located for studies of the effects of the associated ionospheric disturbances on existing telecommunications systems. The Arecibo and Platteville experimental studies are yielding complementary results, which together form the basis of the SPS ionospheric environmental-impact assessment.

Table 1. SPS-Equivalent Power Density and Size of Heated Re~fon for Existing Platteville and Arecibo Facilities at Three Altitudes.
5 MHz 10 MHz Facility
100 km 200 km 300 km 100 Ian 200 Ian 300 1111
Platteville SPS-Equivalent 23. 5.8 2.6 4.3 1.1 0.48 Power Density (mW/cm 2
)
Diameter of Heated 40. 79. 118. 21. 42. 62. Region (km)
Arecibo
SPS-Equivalent 24. 6.0 2.7 6.1 1.5 0.7 Power Density (mW/cm 2
)
Size of Heated 18x9 35x17 53x27 9x4 18x9 27x13 Region (km)
1G

5. TELECOMMUNICATION SYSTEM STUDIES IN A SIMULATED SPS ENVIROl'lMENT A number of studies of the performance of telecommunication systems in an
experimentally simulated SPS environment were undertaken as part of CDEP. For the most part these studies were centered around the Platteville HF Facility. Two series of experiments were conducted. The objective of one series was to determine the degree to which ionospheric changes ·induced by ohmic heating due to SPS operation would impact upon telecol11l\unication system performance. Since the Platteville Facility provides SPS-comparable power density due to ohmic heating (l/f2) only to the lower ionosphere, teleco1TUY1unication systems whose radio energy is reflected and controlled by the lower ionosphere were investigated. The lower ionospheric studies were conducted during August, September, and October 1979. The objective of the second series of experiments was to determine if thermal self-focusing effects could be produced using underdense radio waves. The primary diagnostics of telecommunication system performance used were satellite transmissions in the very high frequency (VHF, 30 MHz - 300 MHz) band. The self-focusing studies were conducted in March and April 1980.
5.1 Telecol11llunication System Impacts Due to Ohmic Heating The effects of SPS-induced ohmic heating on the performance of ionospheric
dependent telecorrmunication systems were studied using the Platteville Facility as the source of experimental simulation of SPS operation. The current Platteville high-power HF Facility is essentially the same as that described by Carroll et al., (1974). The Facility is equipped with a transmitter consisting of ten identical amplifier channels that are tuneable in the frequency range from 2.7 to 25 MHz. However, because of the limitations imposed by the availability of current antennas, the effective upper frequency is only 10 MHz. The transmitter is connected to a 10-element, ring-array antenna. The average input power to the transmitter is about 2 MW. The antenna used in the current experiments is a 10-element, ringarray consisting of crossed double-conical dipoles made using a wire-cage design that contains 24 wire elements. Each dipole is 30 m in overall length and is 6.9 m at the point of maximum diameter (Arnold, 1973).
Using antenna characteristics of the Platteville Facility as listed in Table 2 (Mark Ma, private communication) and assuming that the total output power of the transmitter that is delivered to the antenna is 2.0 MW and that the antenna effi
ciency is on the order of 60%, the power density at any height in the ionosphere and for any frequency between 5 and 10 MHz can be calculated. The SPS equivalent power density resulting from ohmic heating was determined by multiplying the appropriate values of PHF and fHF in Equation (2) by fsps = 6 x 10⁶ Mhz 2
• It can be seen that for frequencies near 5 MHz the Platteville Facility provides SPS
17

__, co
Table 2. Antenna Characteristics of Platteville Facility and SPS Comparable Power Densities Reduced Using Equation (2)
Frequency Beamwidth Element Gain Array Directivity Power Density (mW/cm 2)
(MHz) (degrees) (dB) (dB) 75 km 100 km
5 22.0 6.93 13.08 40.9 23.0
6 19. 0 7.70 10.43 19 .2 10 .8
7 17.0 9.22 l 0.18 18. 3 10. 3
8 14. 8 10. 05 , 0.68 18.8 10.6
9 13.2 lo. 18 9.41 11.6 6.5
10 11. 9 9.54 9. 14 7.6 4.3
300 km
2.60
1.20
1.14
1.18
0.73
0.48

comparable power densities to the lower ionosphere. Frequencies on the order of 5 MHz almost always pass through the lower ionosphere when transmitted vertically from the ground. Hence, they can be regarded as heating the ionosphere in an underdense fashion. It should be pointed out that the power densities given in Table 2 were deduced under the assumption that there was no absorption of the heater wave as it passes through the lower ionosphere {75 - 90 km). This is not valid during daytime hours when a significant portion of the radio energy can be absorbed at altitudes between 60 and 80 km leading to enhanced heating in the lower ionosphere. Telecommunications systems operating in the VLF and LF portions of the spectrum rely upon propagation of energy that is principally affected by the structure of the lower ionosphere during daylight hours. Therefore, even though absorption of the heater ~ve occurs low in the ionosphere, it is occurring at the height where the telecommunications systems of interest in this study are impacted by the ionospheric structure. During nighttime hours, however, it is felt that little absorption of the radio waves used to heat the lower ionosphere takes place below 100 km and the power densities are as given in Table 2.
The Platteville Facility provides SPS comparable power density at 5 MHz to an area of the lower ionosphere that is 30 km in diameter at 75 km and 40 km in diameter at 100 km. This area is three to four times larger than that anticipated from the SPS microwave beam as it passes through the ionosphere. Because the Facility provides SPS comparable power density by ohmic heating only to the lower ionosphere, the telecommunication effects due to ohmic heating were investigated for those systems whose radio waves are significantly affected by the structure of the lower ionosphere. The telecommunication systems chosen for investigation were representative of those operating in the very low frequency (VLF, 3 kHz - 30 kHz), low frequency (LF, 30 kHz - 300 kHz), and medium frequency (MF, 300 kHz - 3 MHz) portions of the electromagnetic spectrum.
The following sources were used to assess the potential impact of SPS operation on telecommunication systems operating in the lower ionosphere:
1. VLF Signal Sources - OMEGA 2. LF Signal Sources - LORAN-C Stations 3. MF Signal Sources - AM Broadcast Stations 4. Receiving Sites - Brush, Boulder, and Bennett, Colorado.
At each of the receiving sites, one or more of the source signals were recorded to test specific objectives.
Table 3 provides pertinent information on each of the sources and receiving sites used in the experiments. Station function, operating frequency, station power, coordinates, and range and bearing between the source and receiving site are
19

Table 3.
Station
Platteville
Brush
Boulder Bennett
OMEGA (Hawaii)
LORAN-C Fallon, NV
LORAN-C Dana, IN
KIIX Fort Co 11 ins
KHOW Denver
KERE Denver
KOA Denver
KLMO Longmont
KNX (CA) Los Angeles
KREX Grand Junction
KSL (UT) Salt Lake City
KADE Boulder
KFKA Greeley
KSIR Estes Park
KBOL Boulder
Data on Facilities and Field Sites Used in the Experimental Simulation of SPS Operation
Function Frequency Power (Watts) Coordinates Bearing from Distance to Lat. (N) Long. (W) Field Site (•) Field Site (lcm)
5-10 MHz 1.6 Megawatts 40.18 104.6 Brush 258.0 Brush 78.2 Heater Boulder 71 .2 Boulder 62.8
Field Site #1 ___ ... _____
40.33 l 03. 7 ----------- ------ .. ---Field Site #2 .................... 39.8523 l OS. 263 ----------- ----------Field Site #3 --------- 39.8 104.4 ----------- ......................
VLF 11.8 kHz 21.4 157 .83 Brush 264.33 Brush 5481.16 Source ------·-- Boulder 263. l Boulder 5345.27
LF 100.0 kHz ........................ 39.S 118.8 Brush 270.79 Brush 1289.25 Source
LF 100.0 kHz --------- 39.8523 87.4869 Boulder 84.87 Boulder 1516.16 Source
AM 600 kHz 40.5 105.1 Brush 279.52 Brush 119. 99 Broadcast l,000
AM 630 kHz 39.7 105.1 Brush 238.09 Brush 130.98 Broadcast 5,000
AM 710 kHz 39.7 105. l Brush 238.09 Brush 130.98 Broadcast 5,000
AM 850 kHz 50,000 . 39.7 105.1 Brush 238.09 Brush 130.98 Broadcast
AM 1060 kHz 40.15 105. ls Brush 261.23 Brush 124.66 Broadcast 10,000
AM 1070 kHz 34.0 118.5 Brush 246.42 Brush 1485.26 Broadcast 50,000
AM 1100 kHz 39.1 108.5 Brush 253.12 Brush 432.5B Broadcast 50,000
AM 1160 kHz 50,000 41.7 112.0 Brush 285.41 Brush 712.37 Broadcast
AM 1190 kHz 40 105.3 Brush 255.41 Brush 140.79 Broadcast 1,000
AM 1310 kHz 40.3 104.7 Brush 268.07 Brush 84.83 Broadcast 5,000
AM 1470 kHz 40.25 105.55 Brush 267.35 Brush 157 .12 Broadcast 5,000
AM 1490 kHz 1,000 Broadcast 40 105.3 Brush 255.41 Brush 140.79
20

given. Figure 5 provides an indication of the geometry of each source relative to the region of the ionosphere at 100 km that is heated by the Platteville Facility and the receiving sites.
Approximately 40 hours of Platteville operating time (Platteville Facility in "on-the-air" mode) was accomplished during the months of August, September, and October 1979. The operating times occurred maihly between the hours of 1300 and 0400 hours UT. The normal or basic mode of operation for the Platteville Facility was with the 10 transmitters "ON" and the antenna array phased to beam the transmitted energy vertically. The basic mode of operation was to transmit a continuous wave (cw) with the output power control adjustable between half-power and fullpower. Various on-off schemes, including short duration pulse modulation was also employed. 5.1.l VLF System Effects
The only source of the VLF signals used was the OMEGA navigation station at Hawaii. OMEGA is a very-low-frequency (VLF) radio navigation system operating in the internationally allocated frequency band between 10 and 14 kHz. It is designed to provide a precise position location capability over the entire earth, with eight strategically located transmitters. The system is useful for general navigation by ships, aircraft, and land vehicles. OMEGA signals are relatively stable, and the system provides good accuracy considering its long range (extending to over 8,000 kilometers). With propagation corrections, fix errors can be reduced to two or three kilometers under almost any conditions.
The main receiving locations for the OMEGA-Hawaii signals were in the vicinity of Brush, Colorado. The frequency of 11.8 kHz was monitored. The field sites near Brush were chosen in order to locate the modified regions of the ionosphere above Platteville on or near the signal path between Hawaii and the respective field sites. The first Fresnel zone of the OMEGA-Hawaii path is on the order of 45 km. The data were received using a standard VLF/LF tracking receiver (TRACOR Model 599J) with a sensitivity of 0.01 microvolts (µv) and a maximum phase tracking rate of 10-7 for a 50 second time constant. The longterm stability of the receiver is better than 0.25 µsec relative to the received carrier.
From Figure 5 it can be seen that the disturbance in the ionosphere created
by the Platteville Facility was not in general centered on the great-circle Hawaii to Brush path. Crombie (1964) has investigated the effects on VLF propagation of ionospheric disturbance that are not centered on the radio path under study. He found that as the distance of the center of the disturbance from the path increases, the VLF amplitude and phase oscillate about the values observed when the disturbance
21

N r.:i
...h1r ,_ 112"(,,, ···-.£.iJ,
hit on
--- --. -Fort Collins
• N. Brush
-- --- ---- ,·· /~!//'' ,..._ -- W B , '/ · /, - · rush
a1111ii . Breol /, - - •.• ..,.-•• a.n: - - --r ' · · •Y //- -- - - Br11h .... ... . . / --. " ' . '/ ---- /
~-· 1290 km Estes Park
• Longmont \ Platte.vi lie>'/.- /
'
Boulder ..---'- / j[,,~,, _/ -' //' // __ .-:.-ee::::::;:;.... . ,'" ' / ... ,.. - ---:· ... ,, - -· -
tsi•"M\l ~ Boulder ~ ~t,l'l ~~ _/
.,.~~ .... , \..~- .... ~ ~ , .. ,,~ r/enver
•Bennett
-• s. Brush
• • •
I
0
--Platteville
Field Sites
Stations
I 25 km
Figure 5. Map of signal sources and recording sites in relationship to the Platteville Facility.
~·-~ 1516 kU\
., 50

is not present. When the center of the disturbance is beyond a certain distance from the path, only changes in the amplitude of the VLF signal will be observed. Crombie (1964) also found that the effects of ionospheric disturbance on VLF signals are greater when the disturbance is nearer one end of the path as is the case for the disturbance in the ionosphere generated by the Platteville Facility. Thus, it can reasonably be anticipated that changes in the OMEGA-Hawaii signal should be discernible if changes in the ionospheric structure result from the SPS-comparable power densities associated with the operation of the Platteville Facility.
Approximately 40 hours of recordings of amplitude and relative phase of the OMEGA signals from Hawaii were made during the operation of the Platteville Facility.· Figure 6 shows an example of the received amplitude and phase recorded at Brush, Colorado. The data were obtained for the times indicated on August 16, 1979. The hatched blocks immediately above the time scale indicate that the Platteville Facility was operating in a continuous mode, and the shaded blocks indicate square-wave (50% ON - 50% OFF) modulation, with the modulation rate given in events per second. The amplitude and phase scales are indicated. The phase output from the receiver was designed such that, when either the zero or full scale (10 µs) outputs were reached, a reset occurs which placed the record pen at the opposite limit and another 10 µs of trace was then possible.
The OMEGA data shown in Figure 6 were observed during a period of time that the entire path from Hawaii to Brush, Colorado, was sunlit (1600 to 1830 hours ~untain Daylight Time (MDT)). In Figure 7, results are shown for observations recorded on August 24, 1979, during a period in which sunset occurred across the Hawaii to Brush, Colorado, path {2000 to 2210 hours MDT). It is rather apparent in both Figures 6 and 7 that there are no observable changes in the OMEGA phase or amplitude that could be associated with the operation of the Plattev·ille Facility. The amplitude of the signal does not vary by more than 5 to 10 dB. The relative phase used in the navigation systems has a diurnal change of approximately 60 µs for the Hawaii to Brush path. A segment of this change is observed in Figure 7 between the sunset hours of 0200 and 0400 (UT).
The Platteville Facility "ON-OFF" time periods were varied from five minutes to fifteen minutes and the transmitter modulation rates were varied from 10 to 40 11 0N-OFF 11 periods per second during the August, September, and October period. Data were also recorded at locations south, north, and west of Brush. These locations were chosen in an attempt to determine if off-angle enhancements of signals propagated through the modified region might be detectable. Analysis of all the OMEGA data was undertaken in order to determine if the amplitude and phase changed on average when the heater was "ON" compared to when it was 11 0FF. 11 For each day
23

N +::-
Iv
" .,_ .... .c :i 5 ... -
0
+30
" "' " .,_ ... ., 0 ,...,.., c.-~
" .,_ .. ., .c ;1 ... -
-8 " ...,_ .... ., ""'"' '1.-
!!
-30
,e-i-111-11J1·1rn-r1r111-r-i:1ii:i~··11r1~111-1lt·1111·11-111-1-11,1-1-1 nm~, I.· • ~ - ... +"~ .FRlVlIH 1-11 ttlkllll llJ 1·11·111 +111·1 I I I 1- 1-1--1 1- 1--1 J____LJ_ - - - - -
--t::O....-•·-··•-:-:.;J;-;-i.' ::t•l"r'' F"- r H -l -LI ! t;;tLtt··
" =t.i.:.:1.-'
-·,:.;--+ I 1.·
Gould Inc., "-"""*" .,...._ DWIMon
Cleveland.OhlO Pr.ntedu'1 USA I EC H-J m1-··~. :-1-•·=.-.•. -J~1~~ ;:..1.:.• ·_--~···.=--•···•·r··~••·~··;-....... "."-·-·--r11uar11n·r mttml, · · · · · · · · · · · · · · ·
._t.._J ___ t-:- ___ --- --· .• - - . - . -- - - ' l j - - ____ , -'; - ::: .,..,, •. __ : . ;::. -
-d 1-T'f+! I I I I. f -1 • I . I ·1 Hi I I I I I I I I I I I :["'i."
1zJ.o
2230 TIME (UT)
10 i'f:,c:f i :;j I I ; I :I I ' I I j·· f :f . t :f :·I ·f . I -1 I ' I I ! I I I I I I I I I I I ! ! I - f I f· . I ··+- f ···t I I ! I I I I I I - I - 1-•-1 .. I ···t . I r . j· T ·j . I ... ,. r fr·
5
~tM44J$Btt~--H+t+t1tH1tt1itft41tMtftrtrr:n1:•Pr.Tl~-:1sr:!]:.:1::11 0 I _j • I ! ... ! ... ! j .: l .·! l. f l .! I··.{- I I . I t I ! I. I I i ! i I !. .! !. I ·.:l ! . , . ! I I I I· ! I 'T :-i: =r :·1 . I I r . I . I .-i:;if;. :r:; ~F
GowM lne., ....._.. ......... ~
Figure 6.
Cleveland. OhlO
::::::::::::::::::::::::::::::::::::::: ....................................... ::::::::::::::::::::::::::::::::::::::: ....................................... ::::::::::::::::::::::::::::::::::::::
2330 0000
TIME (UT)
OMEGA phase and amplitude data recorded at Brush, CO, from Hawaii at 11.8 kHz on August 16, 1979.
0030

N c...,
CV .,_ .. ., .t:." i>.-
II> 'O
" ..,_ .... al ..... 'tl a.-~
II> .,_ "'Ill .t:."' i>.-
CV 'tl
" ..,_ .... al ..... 'tl a.-~
.. t1 :trnn:rflni11ur1 JmttiwhnH+t _ U"
~ ~, ,-t'.f'-l-~-1---+ --+-::I'. 'mt' I I·~··' ·u·; :·;;: :~-·-~:'a'~·:: :_L·~·; ~~i -·-!-+-+±r--+-- +-~ -- - - -- +--t='--i ~ -+ - -- I 0
~-~ti1+1:t·t~-+ - --~ t-+~i+h•~==~~T .:;.; ---... --~--BllUSH ACCUCHAllT ( :1cyelanc1 Otl+u Pr.nled .n U 5 A
.,.t;D-:-1t-l-LG A [tr=fI~~ftUfU±ttf- ;:=1:rtttfTTT~ I I ! ! I ' I I I I I I I I I I I I
o-+ ; ·:-: ~~ • '~ - .11'.J~:~
r ; : : iJ-W---r-) I I
_30
-t-+ ; : ' : , - - 1 I I I I I I . I I I I l , I I I I ~ cb.J - 02'00
10-,, : I 1
oi30 TIME (UT)
·-1- -~
0300
-·-r-.. 1
'
;
Ii m. I I -.
5- loi I...-.-.I 1~ft+fttt 111 f ! Hitit-tfl 111111111 +Ill I I IJ2t:k<kk1TT Ill I I I 1111 I ldl 11 lnll I Ii II I I I I f I I I I I- I 11 -l----1--+ I I I i I I i II I I I+
I.Ai
0 .-:-, I
+30 l i
~ i
-30
"" .
Figure
I I
'"""" I ..... I
-~ "'d---+.' I ·-1 '"" I :+'-:j
-ACCUCHMT
±-t=t-_±1 I l -·
I I
+-I ! -!- I -I I- ! I I I I I I I I I ! I I- 1-1-1 I -1-1 .1 .. J.J Liif::I _, ~~
--t-t---'+-1 I 1-+--+--t-1111 -' . . ' I I ! I i I ! I I 11 I +-Htt r 11-11 f I I 111 "I. f "i<I r l 11 l r :I l Fl r I :1 !<I ll{"l l'f Jl!lft : I I I l I I I t I f . . .... ,
.1·:
7.
0330 0400
TIME (UT)
OMEGA phase and amplitude data recorded at Brush, CO, from Hawaii at 11.8 kHz on August 24, 1979.
I

that observations were made, five minute averages of the amplitude and phase were determined. These averages were then summed and grouped according to whether the Platteville Facility was "ON" or "OFF" and a daily average for Facility "ON" and Facility "OFF" periods was determined. Table 4 lists the averaqe values for the days indicated. The results clearly demonstrate that there was no siqnificant change in the performance of the OMEGA system that could be related in the operation of the Platteville Facility. 5.1.2 LF System Effects
The source of LF telecommunication systems used in the investigation of ohmic heating effects study was LORAN-C transmitters. Several LORAN-C chains are currently in operation as navigation systems. In the United States, LORAN-C navigation depends on the highly stable ground-wave portion of its propagated signal for system accuracy. The LORAN-C signals were chosen as LF signal sources not because interference to LORAN-C navigation was anticipated from the heater-induced ionospheric modification, but because the LORAN-C stations provided a convenient stable source of signals at 100 kHz.
Two LORAN-C stations were used as sources: the East Coast-chain station at Dana, Indiana, recorded at the Boulder, Colorado, site, and the West Coast-chain station at Fallon, Nevada, recorded at the Brush, Colorado site. In Figure 5, the relationship of the Platteville modified region to the Dana-to-Boulder propagation path and the Fallon-to-Brush propagation path can be seen. Both these paths only pass through the edges of the ionospheric volume that is modified by the Platteville Facility. The wavelength of the LORAN-C signal is 3 km and the first Fresnel zone of the Fallon-Brush and Dana-Boulder path is about 15 km. Although the effects of the disturbance induced by the Platteville Facility or the LORAN-C signal are expected to be small, the sensitivity of the LORAN-C monitors (AUSTON, Model 2000)
is 50 nanoseconds and 10 nanovolts, and is felt to be sufficient to detect significant changes in the performance of the LORAN-C system due to operation of the Platteville Facility. Approximately 19 hours of relative phase data and 13 hours of relative phase and amplitude recordings were made of the LORAN-C signals from Fallon, Nevada, during the operation of the Platteville Facility. A total of 35 hours of recorded amplitude and relative phase were made of the LORAN-C signal from the Dana, Indiana, station.
The LORAN-C monitor receivers are normally set to lock to one of the cycles (3rd) of the leading slope of the LORAN-C ground-wave pulse. The receiver is then used to track and monitor relative phase from this point. This signal is generally very stable both in amplitude and phase when monitored in a LORAN-C coverage area. To record the sky-wave signals for this study, the receiver lock point was moved
26

I\,) .....,
Table 4. Average Values of OMEGA-Hawaii Amplitude and Phase Data Recorded at Brush, Colorado, During Times of Platteville Facility 11 0N 11 and "OFF" Period
Date of Start of Observations
August 16, 1979 August 17, 1979 August 19, 1979 August 20, 1979 August 22, 1979 August 23, 1979 September 26, 1979 October 3, 1979
Amplitude Facility 11 0N 11
(dB)
14. 9 + 1. 30 12.4 + 2.72 14.9 + 0.59 13.8 + 1.34 9.7 + 1.83
9.39 + 1.69 16.7 + 1.20 1 . 54 + 5. l 0
Amplitude Faci 1 i ty 11 0FF11
(dB)
15 .1 +. 0. 90 13 .1 + 3. 07 -14.~: 0.76 14 .1 + 1 . 50 10.0 + 1.51 9.08 + 1 .83 16.9 + 1.20 1.83 + 5.50
Phase Facility 11 0N 11
(µs)
3.82 + 1.54 4.05 + 3.33 - . 2. 35 + 2. 07 7.05 + 2.38 6.28 + 2.14 -4.59 + 3.12 6. 93 + 1 . 55 2.73 + 2.88
Phase Facility 11 0FF 11
(µs)
2.82 + 1 .45 4.17 + 3.50 3.10+1.89
8.00 + 1.70 6.02 + 2.28 3.63 + 2.70 7.73 + 1.32 2.56 + 2.54 -
Time Covered (UT)
2210 - 0030 1540 - 1000 1910 - 0000 1400 - 1900 2100 - 0150 2100 - 0150 1720 - 2020 2000 - 2220

to a point on the lagging slope of ground-wave propagated and the sky-wave propagated signals. Because this combination of signals is not very stable with time, only short term variations that are highly correlatable to the Platteville operating schedule could be attributable to ionospheric changes induced by the Platteville Facility.
Figure 8 shows the relative phase (in µs) recorded at Brush, Colorado, from the LORAN-C signal transmitted from Fallon, Nevada, on August 16, 1979 (top two panels) and on August 17, 1979 (bottom two panels). Times at which the Platteville Facility was 11 0N 11 are indicated above the time scale by hatching or shading as was the case for Figures 6 and 7. The upper two records taken on the 16th of August are very stable over the period shown and exhibit no variations attributable to Platteville operation. The offsets that occur at 10 minutes after the start of each hour and last for 5 minutes are interference due to the strong 60 kHz time and frequency signal (WWVB) from Fort Collins, Colorado, getting into the front end of the receiver. This effect is readily apparent in several of the LORAN-C records. The data in the lower two recor-ds of Figure 8 show a slowly varying phase change which may be a manifestation of the normal diurnal change in the LORAN-C phase effect but again no effects associated with Platteville operations are seen. The data for August 16 were obtained during local times corresponding to late afternoon (1610 to 1830 hrs. MDT) and those for August 17 were obtained during morning hours (0940 to 1200 hrs. MDT).
Figure 9 shows Fallon, Nevada, amplitude as well as relative phase data observed on September 26, 1979 at a location south of Brush, Colorado. These data were observed during the noon-early afternoon time period. As was the case for the data shown for August 16 and 17 in Figure 8, there are no apparent changes in the LORAN-C signal that are related to the operation of the Platteville Facility.
Figure 10 is an illustration of the LORAN-C signal transmitted from Dana, Indiana, and received at Boulder, Colorado. The data shown in the figure were recorded on August 23, 1979 during the late afternoon-evening hours (1500 to 1900 hrs. MOT). The Platteville Facility was operated in a five minute "ON" - 11 0FF 11
mode during most of this period. No changes in the LORAN-C signal that could be related to the Platteville operation can be discerned from the figure.
A detailed study of the. LOR/l.N-C records was undertaken to determine daily average values of phase and amplitude during Facility "ON" and Facility "OFF" periods. The daily average values were calculated in the same manner as for the OMEGA data. The results of this analysis are summarized in Table 5 for the Fallon, Nevada, to Brush, Colorado, path. Comparable results for the Dana, Indiana, to Boulder, Colorado, were obtained and need not be presented here. The results
28

N l.O
.. m-" m .c ;1 o.-
" ,._ " . .c ;1 .. -
,,_ ., ., ""' .c-..
.,_ ... ~ ;1 .c..
±+: ri-1 i l I I : l:l.l:h f I ! : ' ii ; i I ! i r-; T----r / -T I ! I I! .. lff ! ! ! ! ! ffl-H I I Ii !r~ · , , 1 i , 1 1 1 i : 1 =r1 i l 1 1 H: 1 IT 1 Fl 1 n 1 r 1 1 rr1 n rn 1 n
.:1 ..
2210 Imfrf£1f&. ,.,,0 -+-22JO ' 2300
~ ·+-1---+--+-~--'-~-,--<---L-+--+--f~-+-'-'-
tt=rt1·1 I ; I I I I i ; t ! I l ; i i ! ; i H I i I I I I 11 I I I I I 11 I J !qi I LI I I I I I.I
l.D •
1790
Figure 8.
2330
1131 TIME [UT)
0000
LORAN-C phase data recorded at Brush, CO, from Fallon, NV, at 100 kHz on August 16 and 17, 1979.
HU

w 0
QI 'ti :I ., -
.... Ill -<'ti a.-~
41-•• "';1 .c-
"'
IM Q ;:>-E-o c:: .... 't ...:i-0.
~
+ ·r~·-..-~~~-~~---,--,~,.-,--
1 i r I
0 F=$ . . . t rt: rt t T lTf ~l~-r--1=ir~if~lttl:a:ta f l'~f~l~$$~~ ~--· .,-+---L-l--+>l+-+--+--+-- -==> .. );;J,QQ:. --++ ~~--- \?9~05 . - : ' ' l I ' ' ' .•. ' ,,, . ,,,.,.,,, . .,,,.,,. ..... .
"'"'''-""" T "' :H .. ... Yu:rni:• ,., ,_,, ..
m m m m m imm~ m m m m I --·-f-
1730 1100
TIME (UT)
+5 . .... . .................. ..
ii;'.'l':i'r";I .. H'I "I' l . I -1-~4-
:;a;;:11;,::PT l I , L r + ..
;;;H;;:Lil":l' .. I'"
I 1130
1.08=~--~:--~-~-:~i±-+-i--Lj 11~~~~·11~~-''l!M :_ __ : ________ ;_: ·m I j '"~l:@@§JEil , . '- .. ,, . ,, .. .. .. :·: :::: + :: :·I:::,;--';;:" ;'.
j ~ .5 I 1 I ; 1 I i 1 I I I I I .. ll I I -1 I I I I 1-- I . I ' I T "I ila'"l "l'ii!'iiil'!ii!'"I iiill!llldiliH l"!'lt:li ""
0 , 1 1 , , , , .. 1 ·, , ·::1 ::t :. , . . :1 1 ... 11::1 :. 1 :;:t= 1 :::1 .. -1 .. 1 .::1 .,+ ii•!i :1wa: :.1 1 , 1 .. ·1 q;r:1
...
Figure 9.
m mmmmmmmrnmmimrnmmm 1930 2000
TIME (UT)
LORAN-C amplitude and phase data recorded south of Brush, CO, from Fallon, NV, at 100 kHz on September 26, 1979.

w ___,
~
j
a::i -0
cu -0
i
\ll~tl 1111:111 t~\111\ 2100 2200 2300 0000
Time (UT)
Figure 10. LORAN-C phase and amplitude data recorded at Boulder, CO, from Dana, IN, at 100 kHz on August 23, 1979.
0108

w I'\)
Table 5. Average Values of the Fallon, Nevada, LORAN-C Phase and Amplitude Data Recorded at Brush, Colorado, During Times of Platteville Facility 11 0N 11 and "OFF" Periods
Date Phase Phase Amplitude Amplitude Facility 11 0N 11 Facility "OFF" Facility "ON" Facility 11 0FF 11 Time Covered
( µs} ( µs) (dB) (dB) (UT)
August 16, 1979 0.91 + 0.02 0.90 + 0.04 2210 - 0030 August 17, 1979 0.46 + 0.30 0.46 + 0.26 1540 - 1810 August 19, 1979 0.65 + 0.17 0.71 + 0.12 1950 - 0000 August 20, 1979 0.50 + 0.23 0.49 + 0.24 I 2100 - 2320 August 23, 1979 0.26 + 0.06 0.49 + 0.28 1400 - 1920 Sept. 26, 1979 .0.53 + 0.32 0.32 + 0.24 -0. 21 + l • 06 -0.58 + 0.85 . 1720 - 2020
Oct. 3, 1979 0.37 + 0.21 0.57 +0.27 0.62 + 1 .48 -0.17 + 1.78 2000 - 2220

shown in Table 5 demonstrate that the operation of the Platteville Facility did not cause propagation effects of sufficient magnitude to be observed in the LORAN-C skywave-propagated phase and arnpl itude records.
5.1.3 MF System Effects In addition to the OMEGA and LORAN-C data recorded at the Brush, Colorado,
site, two receivers {SP-600-JX) were used to monitor amplitude signals from sta-tions in the AM broadcast band. The relative positions of the broadca~t stations selected for study are also shown in Figure 5. Signals were recorded from a total of 11 stations of which eight were local (less than 100 km) and three were remote. The remote stations KREX (Grand Junction, Colorado), KNX (Los Angeles, California), and KSL (Salt Lake City, Utah) are sources of skywave signals received at Brush, Colorado. The groundwave signal from the local stations was so strong that skywave signals could not be discerned in the data. Since the operation of the Platteville Facility does not impact on groundwave radio propagation, only the effects on skywave signals need to be considered. However, only during the early morning hours (UT)
of August 23 and 24 did conditions permit recordings of skywave signals from the remote stations. During the other operating times, inadequate skywave paths and local station interference prohibited the monitoring of the remote stations.
The data in Figure 11 recorded on August 24 are examples of signals propagated via skywave. The upper trace shows amplitude signals from KSL (Salt Lake City, Utah), and the 1ower trace is from KNX (Los Angeles, California), and KREX (Grand Junction, Colorado). Referring to Figure 5, it can be seen that the KSL-path does not pass through the modified ionosphere whereas the KNX and KREX-paths do. As can be seen in Figure 11, there appears to be little difference between the KSL results and those for KNX and KREX when the Facility was operating and when it was not. Some receiver gain adjustments and retuning are indicated on the charts, but these data do not show changes that are correlatable with operation of the Platteville Facility. The average amplitude of the KSL signal was 0.35 ~ 0.07 dB with the Facility "ON" and 0.41 ~ 0.17 dB with the Facility "OFF"; the average value of the KNX signal was 0.17 ~ 0.12 dB with the Facility 11 0N 11 and 0.13 ~ 0.06 dB with the Facility "OFF"; and the average value of the KREX signal was 0.63 ~ 0.34 dB with the Facility "ON" and 0.63 ~ 0.36 dB with the Facility 11 0FF. 11
5.1.4 Ancillary Telecommunication System Diagnostics During the time that the Platteville high-power HF Facility was operating in
a mode to simulate SPS ohmic heating of the lower ionosphere, a number of experiments were conducted in order to determine how the ionosphere responded to the high power transmissions. These experiments were designed to provide information about
33

w .J::>o
"'" "> :::> .... .. ., H m ..., .... 0." ~-'.:'.
..,-; " > ,, .... .. ., H OI ....... ~.;
.... "> ,, ....
.s 11 \!.' '. p, P.. I ~ V 1, I I "' .. f l 'f\, I \ ! v \ ! "' \ J i \ i
~-~-·--=-- =-:=- ~~
o, r--·---·---~----!.--~-+--r--+--+
,J f"!jJt -~~*~~E#ttttHR?~P.T .... ran ii! l ! i!rilJIJI ti 0200 0230 ono
TIME (UT)
olI_.,.-·--' , ' . : . : ! ! .• I ' ... A' , ;;.. ~ . I : I ! I i : I : I !' i I ! i ! : I !
~ E .s L . I ...... . -.., . '( . I b': II' \_,_r ! vv . \ ,;/ : \ : !A : r 'if I ..
~.;
.,-; " > ,, ....
1.0 .--i.-......:. --?-T---t-------t-:----r
0 I ' .• ! : lfV--1- {ti ~ i I : i ' w i i I i I ! : I ! I ~...J: i ! i I ! k ik'\k I I i I kW I lf I+ RJ4\;\ I I iA 1 l I i I I I I rr ~: ,~ ' ! a: ! ' . ' - . -' ' L ..._ A ,, - ! • t ·' ,/, L i ' . . . . .. '
i:: ~ .s I ' ; I" 'A'm !A i : I i i i 1 • - ' v • : l : , I ; 1 1 l ~ 1 ; ' ! 1 : 1 1 I 1 I I i 11 I I I H• I I i ....... 0." ~.!:!
I.Al~!' fl'' 11 '\I IJ~ 11 !!!'' c'Nll jji 1 tfli 1 ' ' 'f' fi I j6'1111~1 ';it'' l'lijl•t.111.111
Figure 11 •
0330
TIME (UT)
Amp1itude signals recorded from KSL Grand Junction, and KREX (1100 kHz,
on August 24, 1979.
0400
(1160 kHz, SLC, UT--upper trace), CO--lower trace), at Brush, CO,

ionospheric temperature and structure changes in a more direct manner than can be inferred from analysis of telecommunication data alone. The experiments undertaken included ionosonde observations and cross-modulation observations.
The ionosonde which was employed as a diagnostic tool was operated in a pulsed mode. The ionosonde can record signal amplitude at a 60 kHz rate with a 0.2 dB resolution, signal phase at 4 degree increments, and signal delay time at 0.1 km increments of altitude. Maximum pulse repetition frequency is 500 pulses per second.
There is evidence that an increase in electron temperature and, consequently, electron collision frequency at D-region heights occur when a large amount of rf power passes through the D region--70 to 90 km--(Utlaut, 1970; Jones et al., 1972). This change in collision frequency will affect the propagation characteristics of signals passing through the region. Both signal amplitude and signal phase will be affected. The change in amplitude is due to an increase in absorption, and the change in signal phase is due to a change in refractive index (Davies, 1965, p. 80). The ionosonde provides a rf pulse probe which can be positioned so that the transmitted diagnostic signal will pass through the-modified D-region and reflect from the higher F-region and return again through the modified D-region to the colocated diagnostic receiver. Because the rf pulse passes through the modified region twice, any resulting signal attenuation and propagation delay will be doubled.
For the purpose of determining the extent to which the D-region is modified by the intense rf field generated by the Platteville Facility, the diagnostic ionosonde was located near the same site. Crystal filters were designed to prevent ionosonde receiver overload for those frequencies chosen for utilization at the Facility. A calibration procedure was undertaken in order to determine the changes in amplitude and phase of the ionosonde signal due to direct coupling of radio energy from the Facility operation into the ionosonde. This calibration was performed by lightly coupling a co-ax cable link between the transmitter, terminated in a resistive dummy load, and the receiving antenna while the Facility cycled 11 0N 11
and "OFF. 11 The calibration procedure showed that changes of 0.9 dB in amplitude (0.2 dB quantitizing error plus 0.7 dB gain variation) and eight degrees in phase (four degrees in quantitizing error plus four degrees in gain variation) were associated with operation of the Plattev"ille high-power Facility. For the purpose of determining if significant telecommunication effects occur when a very high-powered rf beam is propagated through the D region, this resolution should be quite adequate.
Figure 12 is a typical data record during the transition period of Facility 11 0N 11 to Facility "OFF". For these time series of data, the ionosonde probe frequency was 4.6 MHz. The top plot, labeled virtual height, indicates the apparent reflection height of the recorded signal which propagates through the D region.

w c·,
-.s::. "'
300
. 'I 211 '13 SI
! ] 25or · · ""' .. -· · · o_ :t
t: 225 > G>
"O
~ a. e~ ~m cu "O -~ ~
0 •
-IOF· " ,. " 1· " " " " ,-. !'. " " ~ "'.: '.~ I\/\ J\: -:..: . ~: v ;,: .· ..,., : '.. .. ,.. ' :: : . : : : !\ • 'i ., : ! '! ::r .. ~ :! ~ \ t; : .• ~;'\ .. : ~: ~ -; ·~ :: ::,:'\
L •• • ' •• . • . •.a • ~. • .... ..,
-20r ·· ' , ·i <~ ~ • ·• •
E -3o G> a:
cu Ill 0
.s::. Q.
360 \ ~. • \ \ . : : " . i f i ! ! ; ! / : ! : I ! ! f ! I •• \ ~ : " ~ ~ " • : I • I I • J. : I #' ; : ; • • :
.~ £ 180 E
\' ~
:".
:;· ~ , \ .\ ;,, ," \ ; / I 1 I / I I / / I I ! I I I I .
""\ • \ ~ • # • : : • I ., : I I l J I • , ; :
'· ; ·. , "\ cu
a: 0 I- : ;-:., ~-. \ i \ •. ;, 7 ' : \. : : ! / ! / . ! ! / / / j / j / ! j / 2043:51 2044:31 2045:11 2045:51 2046:31 2047:11 2047:51
I p II ff" ~ ~~ 0 TI~
Note: Modifier "on" full power at 2030:00
Figure 12. Ionosonde data recorded on October 4, 1979. Modifier frequency= 5.2 MHz, 1 .7 MW cw input power. Ionosonde probe frequency = 4.6 MHz.

A gate of approximately 50 km in width was applied to eliminate all echoes from heights outside the gate. The lower continuous sets of points at about 240 km indicate the desired reflection and the irregular points at greater heights show an occasional echo which are probably slant path reflections from roughness generated in the F region when the Facility is "ON. 11 This record begins at 2043:50 UT (1443:50 MDT) on the 4th of October 1979 while the Facility was radiating 1.7 MW of cw power at 5.2 MHz with the extraordinary mode of polarization. At 2043 the critical frequency of the F2 region, foF2, was about 12.6 MHz and the ionograms showed no spread-F even though the Facility had been 11 0N 11 for 13 minutes.
On Figure 12, the relative amplitude and phase of the probe signal are recorded on the middle and bottom plots of the time series recording. It is quite obvious that the Facility is producing an unstable condition in the ionosphere up to 2045:00 UT, the time the Facility was turned 11 0FF 11
, plus an additional five to ten seconds. The amplitude of the signal with Facility 11 0N 11 shows a series of enhancements and fades at an almost constant period of 2.6 seconds. However, there are no millisecond responses visible-in these data series to suggest significant D region effects and, in fact, the average amplitude showed no suggestion of decreasing as one would expect if enhanced D region absorption was present. There may even be a hint of reduced average amplitude with the Facility 11 0FF 11 which could be determined by averaging signal amplitudes for each case.
The phase plot (bottom time series, Figure 12) also shows considerably more fluctuations with the Facility 11 0N 11
• There is a definite trend of advancing phase, indicating an apparent decreasing height of the reflection point with the Facility 11 0N. 11 In contrast, with the Facility 11 0FF 11
, a retarding phase or an increasing height of reflection is indicated. However, there was no change detectable on the ionograms with or without the Facility operating. In contrast, when the ordinary mode (O-mode) of heating is used, very apparent spread-F or field-al igned irregularities are always seen on the ionograms (Utlaut and Violette, 1974).
Amplitude and phase data were recorded for nearly all the September-October observations during the regular experiment schedule. The D region effects on the vertical rf probe signal due to the ionosonde were much smaller than anticipated and the results indicate that the impact on VLF, LF, and MF signals used in teleco11111unication systems would be slight.
Another diagnostic that was employed in order to determine the effect of ohmic heating in the lower ionosphere was cross-modulation measurements. It is wellknown that when a high-powered HF radio wave is amplitude modulated and is propagated into the ionospheric plasma, the plasma itself becomes modulated (Gurevich 1978, p. 176). This modulation of the ionosphere can be transferred to other radio
37

waves that pass through the'region perturbed by the high-power radio wave. The process known as cross-modulation results from changes in the electron temperature induced by the modulated radio wave which, in turn, lead to changes in electron collision frequency and electron density. By observing the behavior of radio waves propagated from a known source and passing through the region of the ionosphere heated by transmissions from the Platteville Facility, it is possible to utilize cross-modulation observations to deduce whether or not the electron temperature in the lower ionosphere was substantially changed during times of operation of the Facility. Studies by Jones et al., (1972} and Chilton (NTIA TM79-4, limited distribution) have shown that significant ionospheric cross-modulation depths up to 30 percent.
In conjunction with the SPS simulation experiments conducted at Platteville, the Remote Measurements Laboratory of Stanford Research Institute, International, conducted tests of cross-modulation effects. The tests were designed to determine the possible effects of changes in the D region due to ionospheric heating. Details of the experiments and the results obtained are discussed elsewhere (Showen, 1980). In this report we briefly describe the pertinent results. Transmissions of opportunity were used, and four receiver sites near Platteville were selected so that the propagation paths would pass through the volume heated by the Platteville Facility. Sources used in the cross-modulation experiments were OMEGA (10.2, 131 kHz), WWVB (60 kHz), ADF (387 kHz), AM broadcasts (1060, 1410 kHz), and WWV (2.5, 5.0 MHz). Table 6 taken from Showen (1980) gives the operating parameters for these sources, and also indicates if any effects were seen on each path.
The experimental studies show that the electron temperature was changing in the D and E regions during the time the Platteville Facility was operating. Studies by Chilton (NTIA TM 79-4, limited distribution) indicate that the electron temperature above Platteville can be raised from a background level of 200° K to between 300 and 500° K using powers such as employed in the experiments. This change in electron temperature corresponds very closely to recent theoretical calculations of changes in D region electron temperatures due to the passage of a 23 mW/cm2 SPS power beam (Meltz and Nighan, 1980). The same studies show,electron density increases of 10 - 20 percent in the E region and decreases of up to 50 percent below 80 km. The cross-modulation data as well as the telecolTl!lunication data seem to indicate that the electron density changes in the lower ionosphere due to operation of the Platteville Facility, were not significant in terms of adverse telecommunication system impact.
38

w U) I
'
Location
Longmont Ft. Co 11 ins Ft. Collins Ft. Co 11 ins Ft. Co 11 ins Ft. Co 11 ins N. Dakota N. Dakota N. Dakota
Table 6. Experimental Summary for Cross Modulation Effects
Transmitter Receiver Results
Call Frequency Location Type
KLMO l 060 kHz Brush Spectrum negative KCOL 1410 kHz Bennett Spectrum cross-mod. WWVB 60 kHz Bennett Spectrum cross-mod. WWVB 60 kHz Bennett Phase negative W~lV 2.5, 5.0 MHz Bennett Spectrum cross-mod. LLD 387 kHz Bennett Spectrum negative OMEGA l 0. 2 kHz N. Denver Phase negative OMEGA 10. 2 kHz Conifer Phase negative OMEGA 1 0. 2 , l 3. l kHz Conifer Spectrum negative

5.1.5 Summary of Telecommunication Effects in the Lower Ionosphere The results described above provide strong evidence that ohmic heating of the
lower ionosphere with radio waves having power densities comparable to the SPS microwave power beam will not lead to adverse impacts upon the performance of VLF, LF, and MF telecorT111unication systems. On numerous occasions in August, September, and October 1979, the D and lower E regions of the ionosphere above Platteville, Colorado, were illuminated with radio waves in the high frequency portion of the spectrum whose ohmic heating power density scales to 23 mW/cm2 - the conceptual power density of the SPS microwave beam. Signals from VLF, LF, and MF transmitters that propagated through and near D and E regions illuminated by the Platteville Facility displayed no obvious change that could lead one to suspect adverse system performance attributed to SPS operation.
During the course of the SPS simulation us"ing the Pl attevi 11 e Faci 1 ity, the lower ionosphere was heated with HF radio waves whose power density corresponds to the SPS equivalent power density of 23 mW/cm2. It is possible that during the daytime hours, the HF radio waves used to heat the D and E regions suffered absorption at lower altitudes in the ionosphere with the result that SPS equivalent power densities were less than 23 ml·J/cm2 at 100 km. While this is a distinct possibility, it does not vitiate the conclusions reached here. During daytime hours telecommunication systems operating in the VLF and LF portions of the spectrum that rely upon skywave propagation are reflected low in the ionosphere (60 -80 km). This is the height region where most of the energy associated with the Facility operation is deposited. During the nighttime hours when the performance of VLF, LF, and MF systems is dependent upon radio waves reflected at higher ionospheric heights, the current Platteville Facility provides the SPS power density equivalent of 23 mW/cm2 to the pertinent heights in the ionosphere.
The distances that radio waves propagate in the telecolT8llunications systems monitored during the study are large compared to the size of the ionosphere that was modified by the Platteville Facility. The size of the ionosphere that was modified by the Facility is, however, about three to four times the size of the modified area associated with the passage of the SPS microwave power beam through the ionosphere. The first Fresnel zone for the OMEGA-Hawaii radio path to Brush, Colorado, is about 45 km. Taking into account that the path passes to the north
of the center of the ionospheric area modified by the Platteville Facility (See Figure 5), it can be conservatively estimated that at least one-quarter of the modified region or about 7-8 km at D region altitude? lies within the first Fresnel zone. This is rather close to the actual SPS operational scenario for a VLF radio
wave directly encountering the ionosphere throuqh which the SPS power beam passed.
40

The first Fresnel zone for the LORAN-C path from Fallon, Nevada, to Brush, Colorado, is 14.8 km and for the path from Dana, Indiana, to Boulder, Colorado, is 13.5 km. Referring again to Figure 5, it can be estimated that about 2 to 3 km of the modified ionosphere above Platteville lies with the first Fresnel zone of
the LORAN-C paths. This is probably a fair example of the average intersection
resulting from passage of the SPS beam through the ionosphere and the propagation of radio signals from LF systems. It must be appreciated that a LF system whose radio energy passes directly through the center of the ionosphere modified by the SPS microwave power beam may suffer changes in system performance. This is not expected to occur too often in actual practice, however.
The first Fresnel zone of the MF signals whose skywaves can pass through the ionosphere modified by the Platteville Facility - KNX from Los Angeles and KREX from Grand Junction - is on the order of 4 km. The ionosphere that is modified by the Plattev·ille Facility lies completely within the first Fresnel zone of the KNX and KREX skywave signals (See Figure 5). This is exactly what would be the case for an MF skywave signal encountering the c~nter of an ionospheric region irradiated by the SPS microwave power beam.
The telecorrmunication systems that were monitored during the operation of the Platteville Facility were done so in a manner that realistically simulates the propagation of VLF, LF, and MF radio waves in an ionosphere impacted by the SPS microwave power beam. No changes in system performance were noted that could be associated with ionospheric-heating induced disturbances. Changes in the amplitude and phase of the OMEGA, LORAN-C, and MF signals were observed that were associated with normal day-to-day changes in propagation conditions. These changes obviously are much greater than any changes in system performance due to ionospheric heating which were undetectable. During the time periods for which VLF, LF, and MF data were collected, large-scale geophysical disturbances--notably solar flares--occurred. These disturbances produced changes in telecommunication systems performance that far exceeded any possible changes induced by intentional ionospheric heating.
Figure 13 shows a record of the phase changes seen in LORM-C signals propagated from Fallon, NV, to Brush, CO (top curve), and from Dana, IN, to Boulder, CO (bottom curve), between 1700 and 1835 hours (UT) on August 20, 1979. At 1731 hours a small solar flare was reported. This flare produced a phase shift of more than
µsin the Fallon-Brush signal and 0.5 µsin the Dana-Boulder signal. The small
phase shifts of five minute duration commencing at 1710 and 1810 hours were caused by interference from the 60 kHz time and frequency standard (WWVB) at Fort Collins CO. The times during which the Platteville Facility was "ON" are also indicated on the time scale beneath the Dana-Boulder trace.
41

~ N
(.)
z <t 0:: g
FALLON SKYWAVE (Brush)
-en ::I.. io \ ~- \. ~ I _g a..
-1'--~~---''---~~---'-~~~--'-~~~---'-~~~_,_~~~-L-~~~...._~~~"'--~~~.......___,
DANA SKYWAVE (Boulder)
en ::I..
mo~ -... r= --~ _J ~ ~ ~ c .s:::. a..
Time (UT}
Figure 13. Recorded relative phase data from LORAN-C station at Fallon, NV, at Boulder, CO, and from LORAN-C station at Dana, IN, at Boulder, CO, on August 20, 1979.
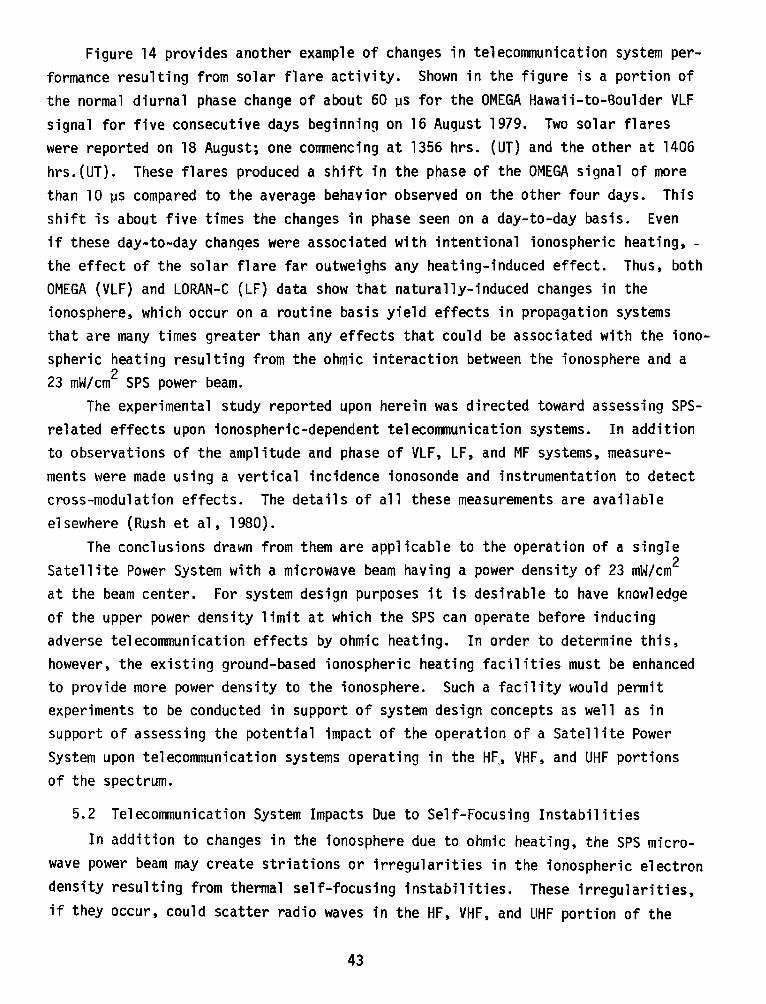
Figure 14 provides another example of changes in telecommunication system performance resulting from solar flare activity. Shown in the figure is a portion of the normal diurnal phase change of about 60 µs for the OMEGA Hawaii-to-Boulder VLF signal for five consecutive days beginning on 16 August 1979. Two solar flares were reported on 18 August; one conmencing at 1356 hrs. (UT) and the other at 1406 hrs.(UT). These flares produced a shift in the phase of the OMEGA signal of more than 10 µs compared to the average behavior observed on the other four days. This shift is about five times the changes in phase seen on a day-to-day basis. Even if these day-to-day changes were associated with intentional ionospheric heating, -the effect of the solar flare far outweighs any heating-induced effect. Thus, both OMEGA (VLF) and LORAN-C (LF) data show that naturally-induced changes in the ionosphere, which occur on a routine basis yield effects in propagation systems that are many times greater than any effects that could be associated with the ionospheric heating resulting from the ohmic interaction between the ionosphere and a 23 mW/cm2 SPS power beam.
The experimental study reported upon herein was directed toward assessing SPSrelated effects upon ionospheric-dependent telecommunication systems. In addition to observations of the amplitude and phase of VLF, LF, and MF systems, measurements were made using a vertical incidence ionosonde and instrumentation to detect cross-modulation effects. The details of all these measurements are available elsewhere (Rush et al, 1980).
The conclusions drawn from them are applicable to the operation of a single Satellite Power System with a microwave beam having a power density of 23 mW/cm2
at the beam center. For system design purposes it is desirable to have knowledge of the upper power density limit at which the SPS can operate before inducing adverse telecommunication effects by ohmic heating. In order to determine this, however, the existing ground-based ionospheric heating facilities must be enhanced to provide more power density to the ionosphere. Such a facility would permit experiments to be conducted in support of system design concepts as well as in support of assessing the potential impact of the operation of a Satellite Power System upon telecommunication systems operating in the HF,, VHF, and UHF portions of the spectrum.
5.2 Telecommunication System Impacts Due to Self-Focusing Instabilities
In addition to changes in the ionosphere due to ohmic heating, the SPS microwave power beam may create striations or irregularities in the ionospheric electron density resulting from thermal self-focusing instabilities. These irregularities, if they occur, could scatter radio waves in the HF, VHF, and UHF portion of the
43

.i:;:.
.i:;:.
3Qr---,----r-~...-----.-----,-~~~~-,-~~~-,--,-~
20
10
0
-10
-20
-40
16th =-- - -- 17th
----19th 19th
··············20th
0030 0430 0830
\ '
l I
'-'\
1230
\~ I
\ I
\ ' \
\ ... "\_/~--~ ..,_.-- -
1630
Figure 14. Relative phase records from OMEGA, Hawaii, recorded at Boulder, CO, on August 16, 17, 18, 19, and 20, 1979.

spectrum. TeleconJT1unications systems operating in the.se bands could suffer performance degradation due to interference from scattered signals. The scattered signal could travel over great distances and give rise to interference to systems operating remote from the SPS power beam.
In earlier sections, the physical mechanisms involved in the generation of the self-focusing instability were described. It was pointed out that the threshold for the onset of the instability varied as (1/f3). The existing Platteville Facility has sufficient energy density to provide more than 5 times SPS equivalent power density to the ionosphere at 300 km for a 10 MHz scaling to the SPS operational scenario (l/f3 scaling). At 5 MHz the SPS equivalent power energy is more than 50 times the SPS operational power density of 23 mW/cm2. It is for this reason that recent measurements were undertaken in order to determine if self-focusing "instabilities could be generated using underdense radio waves and what effect these instabilities would have upon specific telecommunication systems.
The effects of thermal self-focusing are anticipated to be most pronounced at F region heights. The stabilities could lead to striations in the electron density resulting from electrons aligning along the geomagnetic field lines. The experimental arrangement, therefore, emphasized use of telecommunication systems operating at frequencies that are sensitive to the electron distribution in the F region. The systems utilized were satellite-to-ground and satellite-to-aircraft transmissions operating in the VHF (30-300 MHz) portion of the spectrum. Such transmissions are rather sensitive to irregularities in the electron density structure along the satellite-to-observer radio path. These irregularities give rise to fading and fluctuations in signal amplitude and phase similar to distructive interference resulting from diffraction of the signal about an object (Crane, 1977). The fading of the signal under these conditions has been termed scintillation in ionospheric parlance. Naturally occurring scintillation has been the subject of great study in recent years (Aarons, 1977, Basu et al., 1976, for excellent reviews). In addition to the satellite scintillation measurements, observations of HF (3-30 MHz) signals backscattered from the ionospheric irregularities were obtained at Hollaman Air Force Base, New Mexico.
The self-focusing experiments were conducted in March and April 1980, and only preliminary results are available at this time.
5.2.1 Satellite-to-Aircraft Measurements The satellite-to-aircraft transmission measurements were made possible using
the Air Force Avionics Laboratory Cl35/662 aircraft operated by the 4950 Test Wing
45

at Wright-Patterson Air Force Base, Ohio. This aircraft is equipped to monitor signals transmitted from the LES-8 satellite (249.2 MHz) and the FLEETSATCOM satellite (244.0 MHz). Both amplitude and phase can be measured under test conditions (Johnson, 1979). Figure 15 provides a simplified illustration of the aircraft reception of a satellite signal that passed through a portion of the ionosphere modified by the Platteville Facility.
The flight track of the aircraft was coordinated with the operation of the Platteville Facility in order that East-HesCand North-South tracks could be obtained during times of Facility 11 0N. 11 This enabled estimates to be obtained of the horizontal extent of the ionospheric scintillation induced by the Facility operation. In addition to transmitting underdense radio waves, periods of time were allotted at the Facility to the transmission of overdense radio waves. This was done because previous studies (Bowhill, 1974, for example) have shown that overdense heating produces obvious scintillation effects and the overdense observations can provide a realistic comparison for the underdense observations.
An example of the depth of scintillation observed on the aircraft when the Facility was operating in an overdense mode is given in Figure 16. The figure shows the amplitude (in dB) as a function of time for the LES 8 signal {249.2 MHz) that was received between 0202 and 0212 UT on March 13, 1980. The aircraft was heading east during this time. The Facility was operating at 9.9 MHz and the critical frequency of the F2 region, foF2, was 11.5 MHz. The peak-to-peak scintillation that was observed was 10 dB. Figure 17 shows the character of the received signal when the Facility was not operating. The data displayed in this figure were recorded between 0218 and 0226 UT on March 13, 1980 when the aircraft was heading west. The Facility was turned 11 0FF11 at 0215 UT, but residual scintillation effects were observed until near 0224 UT. The data in Figure 17 start 6 minutes after the data shown 1n Figure 16 end. It is very apparent that the LES 8 signal observed on the aircraft is modifed by the operation of the Platteville Facility when the Facility is operating in the overdense mode.
The SPS operation involves the transmission of a microwave beam that passes through the ionosphere. The simulation of importance to the SPS scenario is, therefore, the operation of the Facility in the underdense mode. Figure 18 provides an example of the LES-8 signal observed on the aircraft at a time, 0809 to 0818 UT on March 14, 1980, when the Platteville Facility was operating in the underdense mode. The Facility was operating on the frequency of 6.2 MHz and the value of foF2 during the period was 4.5 MHz. Using a l/f3 scaling law, the comparable SPS power density is about 280 mW/cm2. The satellite signal displays a rapid, almost
46

.i::-.....1
--
Satellite
\ \ \
Ionospheric Irregularities
\ I \ I I I \ I I I \ I \ I I I \ I I I v
Platteville Figure 15. Geometry of Platteville Heater test.
~ Aircraft

.J:::> CX>
12/13 March 1980 AC C-135/662 Overdense - Heater On East Run
Les 8 -70° Elev Angle 0202 - 0212Z 40°5l'N 105°W to 41°02'N l03°48'W
---+I ONE MINUTE ..-14 -
11 II fl' Ill 11' I
11
Figure 16. Deep scintillation fading during overdense heating.

.i::-1.0 •. J. 1.AL.iL.Ll d.1.1. ·
rr"'r'""'rJ'r '"1'¥U'" l".'rr'P ii··1
12/13 MARCH 1980 AC C-135/662 0VERDENSE - HEATER OFF
WEST RUN
LES 8 - 70° ELEV ANGLE
0218 - 0226Z 41·os'N 103°44'W To 41·os'N 104°4S'W
~ ONE MINUTE i-+-
.l.ld.il...t..1fllJ~.JT,,j.11Illi • .li~lT•-r.:-.~r-.-il- ~J..1.~ .J L.::Ll •• I ... IL
·rnp•1•r r·.,.r • 11111tn•p"r'V"'l'1 'P'""r'1'r1"r' , ...... , ···•· :1::::1: .J:
• 1 1
, . 1 1
• , 1 1 oe PER sTEP 1 .1 1:~::1: r v.1 i: l 1 1 ::T 1 H l<J;:t::i: ::c+: -1-11 11 1 1 1 11
:,:q::.:r:,''"··.
FIGURE 17. RESIDUAL SCINTILLATION FADING AFTER 0vERDENSE HEATING

<J1 0
13/14 MARCH 1980 AC C-135/662 LiNDERDENSE - HEATER ON
:foRTH RUN
LES 8 - 30° ELEV ANGLE
0809 - 0818Z ....... ONE MINUTE 42°28'N 104°24'W TO 43°29'N 104°12'W
I DB PER STEP ····• -··•· ::L
, I I • I I . I I I I 1. I I I I: : . f: co: f: ' ... , .... , ....
. •• •. :...1 .. :: 1: :;: t': "t';::. -· ·-. . •·...... • . . • - • .. • . •· - ....
~~~,-~~~'*"-· -,-I I I I I I I I I I I 1-1---i I I I I
FIGURE 18. NOISY FADING DURING UNDERDENSE HEATING
I

noise-like fading character. Compared to Figure 16, which shows the received LES-8 signal during a period of overdense heating, the amplitude of the scintillation is much less about 3 dB peak-to-peak. Figure 19 shows the LES-8 signal recorded between 0822 and 0828 UT on March 14, 1980. At this time, the Platteville Facility was "OFF." The aircraft was heading toward the south and the record shows the typical behavior of the LES-8 signal received during time periods when the Facility was not operating.
The results shown in Figure 18 would appear to indicate that ionospheric irregularities were created at a time the Platteville Facility was operating in an underdense mode and that these irregularities induced scintillation on the LES-8 signal that was received on-board the Air Force Avionics Laboratory aircraft. The observations of LES-8 transmissions at 249.2 MHz were repeated on April 14, 1980. The results obtained indicate that signal fluctuations of the type seen in Figure 18 were observed during periods of underdense heating lending credence to the results obtained in March 1980.
5.2.2 Satellite-to-Ground Observations During the time period that measurements of satellite-to-aircraft measurements
were made, several satellite-to-ground experiments were performed. These experiments were conducted at Douglas, Hyoming, and Carpenter, Wyoming. The measurements program at Douglas involved the monitoring of the ATS-3 satellite transmission at 137 MHz using a polarimeter and monitoring the FLEETSATCOM transmission at 244.5 MHz using a 3-spaced receiver network. The experiment at Carpenter, Wyoming, was directed toward monitoring the transmissions from the LES-8 satellite at 249.2 MHz. The emphasis of the Douglas-based experiments was on overdense heating effects. The Carpenter, Wyoming, observations, on the other hand, were optimized to detect underdense heating effects, and for this reason, the only results discussed are the ones obtained at Carpenter.
The experimental set-up at Carpenter, Wyoming, consisted of continuously monitoring the LES-8 transmissions from ~~arch 4, 1980, to March 15, 1980. All data were recorded on a strip-chart recorder and on magnetic tape. The LES-8 satellite has an inclination of 25° and for this reason, it can be viewed from Carpenter, Wyoming, through the heated volume in a direction parallel to the earth's magnetic field. This geometry held between 0000-0400 UT. Since theoretical studies
of ionospheric heating predict irregularities in electron density that are aligned along magnetic field lines, this geometry provided a sensitive experiment to detect amplitude and phase fluctuations in response to ionospheric heating.
51

01 N
. .I.ii.I. I •• 1 •• _.j '.'
l*'f' '. '"..-"
ONE MINUTE~
13/14 MARCH 1980 AC C-135/662 UNDERDENSE - HEATER OFF
SOUTH RUN
LES 8 - 25° ELEV ANGLE 0822 - 0828Z 43°37'N 104°23'W TO 42°38'N 104°26'W
. ..J .. __ 1 ••• ._ ... ,_! •• •
.~..,..........,.-,· •1r • 'l'"'"l·...,.,...rr'1'"""lf"1T•. • ~ T~tl" r· ,~·-r '!'f '··1 ~··1':'"r-l'J •
. ·•· ..•. "-:-t:. :::·.1·::·1.· ..•
, :·1:: LrJ : H .. 1 , , oe PER sTEPI 1 .. :.1_,t;:t LU>l 't t:t::i _J::J:J~u~J .k L:t:: 1,1.1,., 1: J ···•···•··:I·: .• ··-· ·::1:,::L.T: ..... :·: I:::: 1::::i-.:. +:·::1:: ::1:;. :t:: · 1: ~::!::: :\ :,: L: .•....•..
... · · · 1.-::1:::·1 •.. 1:':.1:.::1::,:r::.1 :::1< ···· ·· J:. I... . • . 1 ... ~I . 1 •. . ; l: .
FIGURE 19. LACK OF FADING DURING OFF PERIOD OF UNDERDENSE MODE

Figure 20 provides and example of the LES-8 signal observed on March 12, 1980, between the hours of 0024 to 0100 UT at Carpenter, Wyoming. At 0030 UT the Platteville Facility was turned 11 0N 11 at a frequency of 9.9 MHz with an input power of 1.5 MW. The Facility remained on tA1til 0045 UT. During this entire time period, foF2 was near 12 MHz, thus the case illustrated represents overdense heating effects. The fluctuations seen between 0030 and 0045 UT are definitely associated with the Platteville Facility operation. Peak-to-peak changes of 5 dB are seen when account is taken of the signal calibration. The fading rates and the coincidence of the onset in the fading period with the 11 0N 11 time of the Faci 1 ity are typical of all overdense heating cases observed on the LES-8 (and other earlier) signals.
Figure 21 shows the LES-8 signal recorded between the times 0256 and 0335 UT on March 12, 1980. The Platteville Facility was turned on at a frequency of 9.9 MHz
with an input power of 1.5 MW at 0300 UT. Between the times 0045 and 0300 UT the Facility was 11 0FF. 11 At 0258 UT, foF2 at Platteville was observed to be 8.1 MHz
and at 0312 UT, foF2 was observed to be 7.9 MHz. The entire period of heating was therefore underdense. It is readily apparent that about 5 minutes after the on-set of underdense heating, the LES-8 signal started to fluctuate considerably. Peakto-peak fluctuations of 10 dB were observed and at 0315 UT when the Facility was turned "OFF" the LES-8 immediately started to settle back to its pre-heating level.
The magnitude of the fluctuations seen in Figure 21 is not typical of all the cases observed. In Figure 22, the LES-8 recorded signal is displayed for the period between 0253 and 0318 UT on March 13, 1980. Again at 0300 UT the Platteville Facility was turned 11 0N 11 at a frequency of 9. 9 MHz with an input power at 1. 5 MW.
The Facility remained on until 0315 UT. A 4 dB peak-to-peak fluctuation is observed in the signal corresponding to the time the Facility is "ON". The value of foF2 observed at Platteville was 8.5 MHz at 0310 UT. When the Facility was turned "OFF" the signal again quickly returns to the pre-heating level.
The results shown in Figures 21 and 22 tend to display obvious effects of underdense heating on the LES-8 satellite signals. The experiment at Carpenter, Wyoming was repeated on April 14 and 15, 1980. At that time the Platteville Facility was operating in an underdense mode for half hour periods as opposed to the 15 minute periods during the March 1980 operation. The results obtained in April corroborate those obtained in March regarding underdense heating effects on satellite-toground telecommunication circuits.
In extrapolating these results to the SPS scenario, the observed scintillations must be scaled to 2.45 GHz. The exact scaling procedures have yet to be determined. In addition, it must be borne in mind in interpreting these results for application to an SPS environment that the experimental observations were conducted in a manner
53

(J1 .j:>.
Figure 20. LES-8 amplitude data observed at Carpenter, WY, on March 12, 1980, during overdense heating.

Ul Ul
Figure 21. LES-8 amplitude data observed at Carpenter, WY, on March 12, 1980, during ~nderdense heating.

U1 en iiiiliiiil'''-:l;rn!. ~~:;;Di~~:;;rtii =,;=::£;i.
t
Figure 22. LES-8 amplitude data observed at Carpenter, WY, on March 13, 1980, during underdense heating.
• I oP.
•

designed to maximize the impact of any irregularities created by the heating of the ionosphere. The propagation path of the satellite signal is directed along the earth's magnetic field lines thereby reinforcing any scintillation producing effects. The observations indicate that irregularities in the electron density in the ionosphere are formed as a result of underdense heating. The form of the irregularities are very different from those created by overdense heating as is manifested in the differences in the fading rates during overdense (fast) and underdense (relatively slow) heating. Although the results do not establish the viability of the thermal self-focusing instability as a generator of an SPS impact per se, they do, nonetheless, indicate a potential effect. It should be mentioned, however, that if the l/f3 scaling for the self-focusing instability is correct, then for the frequency (9.9 MHz) and power (1.5 MW) used in the experiments, the equivalent 2.45 GHz power density is about 90 mW/cm2 or almost 4 times the current SPS power density. Clearly, further study and observation is required.
5.2.3 HF Observations As part of the coordinated heating program to investigate the effects of the
thermal self-focusing instability in the upper ionosphere, observations were made using a HF backscatter radar. The radar used was located at Hollaman Air Force Base, New Mexico, and was operated in a backscatter mode. The radar could transmit signals in the range 6 to 30 MHz. The radar signals were directed toward the volume of the ionosphere heated by the Platteville Facility. If irregularities in the ionospheric structure were produced by the Facility, part of the radar energy would be scattered back to the radar site. The amount of backscatter energy depends upon the intensity of the radar energy, the direction the energy propagates with respect to the magnetic field, and the radar frequency.
Backscatter of signals at HF, VHF, and UHF were used to discern properties of overdense heating ionospheric changes since the early days of intentional heating (See Section 3.3). The results obtained during the coordinated experiments discussed in 5.2.1 and 5.2.2 indicate substantial backscatter of energy from overdense ionospheric irregularities. For the underdense heating cases, the radar provided no evidence of backscatter from ionospheric irregularities. This may not be too surprising since the scale sizes at the irregularities generated by the self-focusing instability using underdense HF radio waves could be such that HF
radars are insensitive to them. Further work is certainly warranted.
5.2.4 Summary of Telecommunication Impacts in the Upper Ionosphere Results obtained from experimental simulation of the SPS operational scenario
to measure thermal self-focusing impacts have revealed potential underdense heating
57

effects on satellite signals propagated in the VHF band. The observations thus far investigated are preliminary, and further work is required before a final assessment regarding realistic impact on telecommunication system perfonnance can be made. Studies using various levels of input power and frequencies need to be undertaken in order to establish the theshold for the onset of ionospheric irregularities generated by underdense thermal self-focusing instabilities.
6. THEORETICAL STUDIES OF CHANGES IN THE IONOSPHERIC AND TELECOMMUNICATION SYSTEMS IN AN SPS ENVIRONMENT
The assessment of the impact of SPS operation on the ionosphere has been undertaken in the absence of direct experimental information. The effects of a 5 to 10 GW radio beam operating at a frequency of 2.45 GHz must be assessed without doing experiments with such a beam. The assessment of ionospheric effects relies upon a sequence of scaled experiments and theoretical extrapolations to the SPS operational scenario. The extrapolations are performed over large factors: · 200 to 1000 in frequency and 5000 in total power. It is clear that well-developed and experimentally verified theoretical models are needed in order to carry out the extrapolation and assessment. Theoretical studies permit the identification of the physical process that will occur as the result of SPS operation as well as the circumstances under which the processes occur. In addition, theoretical studies are needed in order to identify what physical phenomena are artifacts of performing experiments at lower frequencies and will not persist at the SPS frequencies.
During the course of this assessment, a number of studies have been undertaken that are directed toward theoretically investigating SPS effects on the ionosphere.· These studies have tended to emphasize changes in the distr·ibution, structure, and temperature of the ionospheric electrons resulting from the passage of high power radio waves through the ionosphere. Studies have also been undertaken that address the numerical simulation of how telecommunication system performance will change under SPS conditions. The latter studies utilize the results of the theoretical studies as well as observed ionospheric data to numerically simulate the performance of telecommunication systems that is applicable to the SPS operation.
6.1 Theoretical Studies of SPS Ionospheric Heating Effects 6.1.l Radio Wave Heating of the Ionospheric Plasma
The effect of ohmic heating by radio waves on the ionospheric electron tempera
ture and density was investigated by Perkins and Roble (1978) using numerical ionospheric structure and heat balance codes. The work by Perkins and Roble (1978) was directed toward studying resistive heating effects in an underdense ionosphere.
58

The.Y chose for investigation the operation of a 15 MHz, 3 MW ground-based facility located at Arecibo, Puerto Rico, and the operation of a 3 GHz, 10 GW satellite power station.
The results obtained by Perkins and Roble (1978) were realistic simulations of an ionosphere subjected to intense radio energy. Use was made of the latest values of the various coefficients needed to describe the physical processes involved in ionospheric heating and full account was taken of the effects of the geomagnetic field in the control of the electron density distribution. The results indicate that the largest amounts of radio wave heating occurs when the beam of radio energy is parallel to the geomagnetic field lines. The electron density in the F2 region tends to decrease slightly near the height of the F2 region peak, but it increases in the region above the peak because of thermal expansion. The electron density in the D and E region increases in value as a result of the application of the intense radio energy. Maximum increases in electron temperature were found in the lower D and E regions.
The simulation performed by Perkins and Roble (1978) for a ground-based experiment and a satellite-borne power system are in quantitative agreement. This is certainly not surprising in light of the fact that the current SPS Ionospheric Heating Environmental Assessment is centered around ground-based simulations of SPS operations. The changes in electron density and electron temperature calculated for the Platteville Facility using the Perkins-Roble code are shown in Figures 23 and 24. In this simulation, the Platteville Facility was assumed to operate continuously from the time it was turned 11 0N" at 1200 hrs. The changes in the electron density resulting from Platteville heating (and SPS) operations are rather small: no discernible differences in the D and E region, a slight decrease in the F region, and a slight increase at constant altitudes in the topside ionosphere. Changes in the electron temperature (Figure 24) are much more dramatic. The effect of the Facility operation is to raise the electron temperature by as much as a factor of 5 in the lower ionosphere and to smooth out the normal diurnal variation in the upper ionosphere.
The response of the ionospheric temperature to the radio wave heating is very rapid. This is seen by the overlapping of the contours in Figure 24. Figure 25 shows the change in electrons temperature as a function of time following the onset of a 1.6 MW transmission at 10 MHz from the Platteville Facility at noon (Figure 25a) and a 5 MHz transmission at midnight (Figure 25b). It can be seen that within a period of 10 to 100 seconds after Facility 11 0N 11
, the electron temperature has reached its new "equilibrium" value.
59

en 0
Facility 110FF11
- LOG NE • 4 '!.
500.
400.
SE ~ 300 >-=
200.
IOO. .
500.
400.
-. . •
ii ,,,,,,,,,,,,,. ~ 300.~ >:c
200.
100 ----.
Facility 110N11
LOG NE
50. ;. -.·-r··T-,-.--,--.--,--~-~..-.-T-,--.T-,. ·-,--. - r . t I ' I
50. ;. T - l 'I - f T -· r· r -·1 T""""""T··- r ·1·- .,- ·1 -., - T -y·· 1 1
0 2. 4. 6 8. 10 12. 14. 16. 18 20. 22 24. 0. 2. 4. 6. 8. 10 12. 14 16 18. TIME HR TIME HR
Figure 23. Theoretical values of electron density calculated using the PerkinsRoble code for the Platteville Facility 11 0FF11 and 11 0N. 11
r ' I ' I 20. 22 24
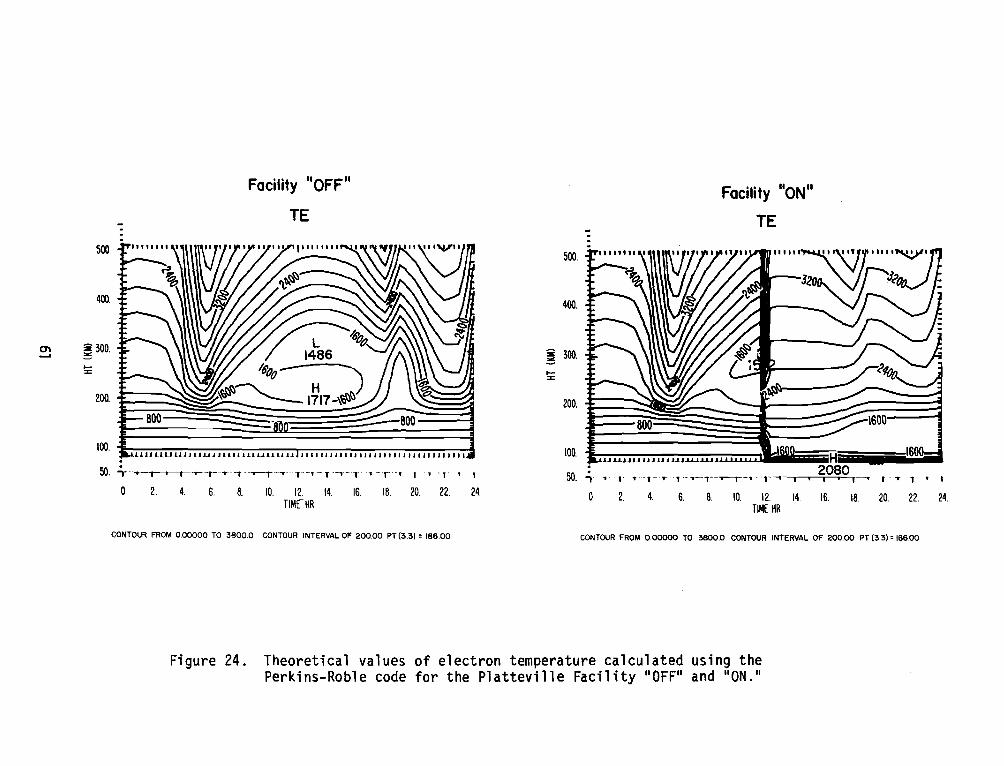
0\ __,
Facility "OFF"
TE ---~ 500.
400.
~ 300. I-::c
200.
100. J.!JJLJ.U UJJl.JLJJJllll11-llllJJ1 JJj_JJJ_J JJ.JJ.I J 11 t!J J.111111IJ1111111111
500.
400.
~ 300. ,_ ::c
200.
100. J..JLl.LJ l.J I.I I IJ J J.J.J..J...J...J....JJ.
Facility "ON"
TE
H 50. , ... ,. I • I ..--r-...--,--,.---,---.---r··-T·-,-·r .. -T·--·- I ., --, ' I • 2080 50. ,. ' 1- T--1-·r ·1·-·-·r-~--,--r.., 1 • 1 • 1 I - .,. ·1 ' I
0 2. 18. 20. 22. 4. 6. 8. 10. 12. 14. TIMnR
16. 24. 0 2. 18. 20. 22. 24. 4. 6. 8 10. 12. 14. 16. TIME HR
CONTOUR FROM 0.00000 TO 3800.0 CONTOUR INTERVAL OF 200.00 PT (3.3) : 186.00 CONTOUR FROM 0.00000 TO 3800.0 CONTOUR INTERVAL OF 200.00 PT (3.3) = 186.00
Figure 24. Theoretical values of electron temperature calculated using the Perkins-Roble code for the Platteville Facility "OFF" and "ON."

O'\ N
500.
400.
:iE ""'
.
Noon TE
I 1 1It111\11t11f1111111111111UIUU11Ut111UIHI'
----2400-----:
Midnight TE
. 500.
400.
:iE ""' ;::: 300. ~ 300. -!I = ---1600--- :::c:
200. ::i 200.
----1600---11 100.
50 . .:,
100. ~ 50.; T'-~ 1 ''"''"' -T--r-r~~~--r-T""'T"'T'TT'ft'f--,-·--r-r1T'T'"J
1' ' ", "''"' ....... 2Q66 ....... , ; i I iiiiij . ... ......, ... ,..-6-~r~~
OJE-02 OIE-01 O.IE•OO O.IE•OI TIME (S)
UIE+02 OIE-•03 O.IE+04 O.IE-OI O.IE •00 O.IE•OI O.IE •02 O.IE+03 TIME (Sl
CONTOUR FROM 0.00000 TO 3400.0 CONTOUR INTERVAL OF 200.00 PT (3.3): 30704 CONTOUR FROM 100.00 TO 2900.0 CONTOUR INTERVAL OF 100.00 PT (3.3): 356.!54
Figure 25. Values of electron temperature as a function of time after start of Platteville heating for noon and midnight conditions. Values calculated using the Perkins-Roble code.
O.IE•04

The implications for telecommunication system performance of the changes in electron density and electron temperature resulting from the numerical simulations will be discussed in Section 6.2.
6.1.2 Studies of Enhanced Heating in the Lower Ionosphere The values of electron temperature that are calculated from the work of Perkins
and Roble(l978) indicate that temperatures in the lower ionosphere on the order of 3 to 5 times the normal value should ensue from SPS and ground-based heater facility operation. Such increases in temperature should be associated with large-scale changes in absorption of radio sugnals involved in telecommunication systems. However, to date, no absorption effects associated with heater operation have been observed that corroborate such a large change in electron temperature (and, hence, collision frequency).
Most estimates of the expected electron temperature increase due to microwave and HF absorption in the lower ionosphere have been based on the assumption that the steady-state temperature distr·ibution is Maxwellian. This is questionable because the degree of ionization in the D and E regions is too low to obtain a true Maxwellian distribution. Under these conditions, the detailed energy dependence of the cross-sections for momentum transfer influence the form of the distribution function. Following the approach of Engelhardt and Phelps (1963}, a computer code to numerically solve the Boltzmann equation appropriate to heating of slightly ionized air has been developed (Meltz and Nighan, 1980). The Boltzmann equation must be solved parametrically in E/N and w/N, where N is the total neutral density, w/2n is the heating wave frequency and E is the rms electric field. If w is much greater than the electron collision and gyro-frequencies, then energy gain per electron and the form of the distribution function depend on the effective electric field E/w and the neutral composition, but not on the total density.
The accuracy of any prediction for electron temperature, rests on the valid-ity of the relevant electron cross-section data for the primary atmospheric constituents N2, o2, and O. In the course of developing the kinetic theory model, a thorough examination and comparison of the various estimates of the cross-sections and the equilibrium cooling losses based on these values were made. The published data for N2 and 0 are reliable and accurate; however, the cross-section for the vibrational excitation of o2, an important cooling mechanism in the D and E layers, is
not as well established. A new model for this cross-secion was formulated on the basis of the information contained in a recent paper by Lawton and Phelps (1978}. The new model has been selected to be consistent with drift tube and electron beam
63

measurements. It has been found that use of the cooling rates and cross-sections in the aeronomy literature leads to serious disagreement with measured electron transport coefficients (Meltz and Nighan, 1980).
The results of the initial kinetic theory computations are shown in Figure 26. For a flux of 23 mW/cm2, the temperature increase is about a factor of two to three times ambient. This computation was based on the o2 vibrational cooling rate due to Lawton and Phelps (1978). Detailed calculations have also been made to determine how rapidly the electron temperature at various ionospheric heights obtain its equilibrium value after ground-based Facilities have been turned 11 0N. 11
Figure 27 shows the results of calculations of the electron temperature and electron density changes in the ionosphere due to heating by the SPS power beam and a 5 MHz extraordinary Platteville frequency. The results show that the Platteville Facility operating near 5 MHz can provide more heating to certain heights of the ionosphere than will be provided by operation of the SPS. Changes in the electron density resulting from SPS operation are seen to be well simulated using the 5 MHz Platteville frequency. These results indicate that the Platteville Facility provides a realistic simulation of SPS heating. Further, comparisons between calculations and observations need to be undertaken and the results used to determine the altitudes at which the maximum changes in ionospheric propagation is predicted to occur. This is particularly important for heating by ground-based facilities where the nonlinear increase in absorption at lower altitudes may reduce the amount of energy going into the heating of the E region.
6.1.3 Thermal Self-Focusing Studies The work reported upon by Perkins and Roble (1978) was confined to the study
of the physical effects resulting from resistive heating when a radio wave is incident on an underdense ionosphere. When radio waves heat an underdense ionosphere, there are two general classes of resulting physical phenomena: resistive heating and self-focusing instabilities. The resistive heating, or ohmic heating, has been discussed in previous sections. In this section, attention is focused upon the mechanisms giving rise to thermal self-focusing instabilities.
Self-focusing of radio waves has been reported in many overdense ionospheric modification studies (Thome and Perkins, 1974; Duncan and Behmke, 1978) and its principles are well understood in terms of theoretical studies (Perkins and Valeo,
1974; Cragin and Fejer, 1974; Gurevich, 1978). The theoretical studies indicate that self-focusing should also occur in underdense ionospheric conditions.
Recently Perkins and Goldman (1980) specifically addressed the issue of self-focusing instabilities resulting from SPS operation. They derived expressions
64

POWER FLUX AT 2.45 GHz mW/crn2
0 5 10 20 50 100
r 2000
Q 0 --UJ a: 1000 :::> I- 800 en <(
U"1 a: UJ 600 Cl. ::2 UJ
400 t-
z r-- --/ 0 85 km CI:
- - 115 krr1 I-u UJ .....J w
100 0 1 2 3 4
E/w x 1010 V/cm - sec
Figure 26. Calculated temperature as a function of power flux at 2.45 GHz.

--SPS
- - - - Platteville 5 MHz X-mode
Fractional electron temp. increase
120---------------------
'
Relative electron density change
~ 100 ' ', , __
Altitude (km)
80
601
Figure 27.
--
-- --2 3
Te/Tn
.... ' ' ' \
---- --~
4 -60 -40 -20 0 20 ~ne/neo (percent)
Calculated electron temperatures and electron d~nsities for the SPS Power Beam and a 5 f1Hz extraGrdinary frequency at the Platteville Facility.

for the threshold of the onset of self-focusing instabilities and for the characteristic scale length of the irregularities resulting from the self-focusiag mechanism. For self-focusing to occur in the F region of the ionosphere, the following inequality must be satisfied (Perkins and Goldman, 1980):
where,
wp 2 i
4 k c 2
0
> 1
wp = 2nf p, fp is_plasma frequency
(4)
i = the spatial growth length of the instability along the direction of the heater beam, taken to be 25 km
k0
= the wavenumber of the heater beam, and c = the velocity of light.
By substituting values into the inequality that are appropriate for a 10 MHz and a 2.45 GHz heater beam, the following inequalities result:
and
where,
1 050 ( no ) ( i ) ( 1 0 MHZ ) .> 1 106cm- 3 25 km f
4. 4 (l O::m-,) c5 i km) (2.4~ GHz) > l n
0 = background electron density, and
f = the wave (heater) frequency.
(5)
(6)
The inequality (5) is strongly satisfied for HF transmissions but the inequality (6) is not in general. The ionosphere is, however, usually just dense enough to permit self-focusing at the SPS frequency. In addition to inequality (4), selffocusing will occur only if the perturbing radio wave surpasses a critical power flux value that is dependent upon the wave frequency, ionospheric electron density, and electron temperature. The critical power flux, Pcf for the SPS operation is given as (Perkins and Goldman, 1980):
(7)
where T0
= the background electron temperature.
67

For values of the electron density greater than 2.6 x 104 cm-3 and electron temperatures less than 2500° K, the operation of the SPS with a power density of 23 mW/cm2
exceeds the critical power flux, Pcf" The wavelength of the striations created by SPS self-focusing is predicted to be on the order of 100 meters. The effects of such striations on the stability of the SPS pilot beam requires further detailed experimental and theoretical study.
The results showing underdense ionospheric scintillation on the LES-8 satellite signal described in Section 5.2 are in quantitative agreement with the theory proposed by Perkins and Goldman (1980). Because of its importance in terms of the performance of telecommunication systems operating in an SPS environment, further study must be devoted to the self-focusing instability. These studies must be directed toward verifying the threshold for onset of the instability both theoretically and experimentally.
6.2 Numerical Simulations of Telecommunication Systems Performance Attempts to simulate the performance of telecommunication systems operating
in an environment in which the ionosphere is modified by the passage of high power radio waves are crucial to the overall SPS ionospheric heating assessment. Such simulations provide a means to corroborate theory and experiment. The extent that performance data pertaining to telecommunication systems operating in an SPSsimulated environment can be numerically calculated, is directly related to the degree that theoretical models of the ionosphere can reproduce ionospheric heating effects. Numerical simulations of telecommunications systems also provide a means to study the behavior of a number of systems under varying situations without having to undertake all possible experimental scenarios. 6.2.l Simulations of Effects of Electron Density Changes
The validity of any numerical simulation of the performance of an ionospheric teleconmunication system is dependent upon the validity of the electron density model that is used in the simulation. There is still quite a bit of uncertainty in the various theoretical models to hope to simulate the observed teleconmunication data with any reasonable accuracy. However, it is worthwhile to utilize simulations of telecorrmunication systems to infer the magnitude of changes in ionospheric structure that gives rise to a given change in system performance. If the changes in ionospheric structure that appear to be reasonable from the theoretical models yield simulated performance values that are in concert with observed telecommunications data, then an improved level of confidence in both the experimental and theoretical data can be attained.
Numerous calculations were made in an attempt to simulate the performance of telecommunication systems operating in the VLF and LF portion of the spectrum.
68

The calculations were performed using the method of Berry and Hennan (1971}. For a given electron density (assumed constant over the entire propagation path), the method allows the calculation of the amplitude and phase of the ground-wave and waves reflected from the ionosphere. The electron density models given in Table 7 were taken as indicative of the SPS effects on the D and E region of the ionosphere. The normal electron density at each height was modified according to the values given in Table 7 as a rough approximation of the changes in electron density due to SPS operation. The values agree in general with the results discussed in Section 6.1.2. Table 8 provides a summary of the amplitude and phase calculated for two signals, 10 kHz and 100 kHz, operating over 1000, 2000, and 5000 km paths. The 10 kHz, 5000 km results simulate the VLF (OMEGA) telecommunication data and the 100 kHz, 1000 km results simulate the LF (LORAN-C) data. The results shown in Table 8 indicate that little change in the performance of the VLF and LF systems ensues from the SPS-induced ionospheric changes. When one considers that the SPS operation will at best result in changed electron densities only in the vicinity of the power beam in its passage through the ionosphere, the changes seen in Table 8 are worst case approximations to the SPS scenario. The results in Table 8 provide corroboration of the lack of obvious SPS-related changes in VLF and LF systems performance data discussed in Section 5.1.
Studies were also undertaken to investigate the changes in the performance of HF systems operating in an SPS environment. Using the electron density profiles generated by Perkins and Roble (1978) as indicative of the ionospheric structure resulting from the passage of an SPS power beam, the performance of a high-frequency circuit operating from Washington, D. C., to Albuquerque, New Mexico, has been simulated. The SPS operation was assumed to impact upon the entire propagation path. Profiles generated for conditions when SPS operation is absent have also been used in order to assess SPS impact on such circuits. The results show that the changes in HF circuit performance (the maximum usable frequency) are small for SPS-related electron density changes. These results agree quantitatively with similar simulations performed by Rush et al., {1974) for HF circuit performance in general.
6.2.2 Simulations of Effects of Electron Temperature Changes The principal effect of the electron temperature changes in the ionosphere
insofar as the performance of telecommunication systems is concerned, is to change the electron collision frequency. At lower heights in the ionosphere, the electron collision frequency is determined essentially by electron-neutral interactions. The electron-neutral collision frequency depends upon the square root of the electron temperature. A four-fold increase in electron temperature results in a

Height
50 54 58
62 66 70
74 78 82 86
90 94 98
102
Table 7. D Region Electron Density Models
Density (1) Density (2) Density (3) Density (4)
6 x l 0° 6.6 x l 0° 7.2 x 10° 4.5 x 1 . 05 x 10 1 1 . 16 x 1 O' 1.26 x 10' 7.9 x 2 .14 x 10 1 2.35 x 1 O' 2.57 x 10 I 1.6 x 5.2 x 10' 5.72 x l O' 6.24 x 10' 3.9 x 8.3 x l 0 I 9. 13 x 10 I 1. 96 x l 0' 6.2 x 5.4 x 10 1 5.94 x 10 I 6.48 x l 0 I 4.05 x 7.3 x 1 O' 8.03 x 10 I 8.76 x 10 I 5.5 x
1. 50 x 102 1. 65 x 102 1.8 x l 02 1 .65 x 3.2 x l 03 3.52 x l 02 3.84 x l 02 3.52 x 5.6 x l 02 6.16 x 10² 6. 72 x 102 6. 16 x
l . 01 x l 03 1 .11 x 10 3 1. 21 x 10 3 1.11 x 2.5 x 103 2.75 x 10³ 3.00 x l 03 2.75 x 9.5 x l 03 l .05 x l 04 1. 14 x 10 4 l. 05 x 2.8 x 10 4 3.08 x l 04 3.36 x 10 4 3.08 x
Density (1) = undisturbed profile (2) = 10% increase over Density (1) (3) = 20% increase over Density (1) (4) = 25% reduction in Density (1) below
74 km and 10% increase in Density (1) above 74 km.
70
l 0° 10° 10 1
1 O'
l 0' 10' 10 1
l 02
102
102
103
l 03
l 04
.10 4

Table 8. Relative Amplitude in volts/meter (top line) and phase in degrees (second line) calculated for VLF (10 kHz} and LF (100 kHz) circuits using the indicated electron density profiles listed in Table 7
Frequency Distance (km) Density (1) Density (2) Density (4)
10 kHz 1000 3.3 x 10-'+ 3.36 x 10- 2 3.19 x 10-'+ -0.48 -0. 51 -0.39
2000 i. 54 x 1 o-'+ 1. 58 x lo- It 1. 53 x lo-'+ -0. 76 -0. 78 -0.69
5000 2. 95 x 1 o-s 3.09 x 10- 5 2.77 x 10- 5
3 .10 3.03 -1.26
l 00 kHz l 000 2.08 x 10- 5 2. 12 x l o-s 1 . 95 x lo- 5
-0.60 -0. 72 -0.27
2000 l • 11 x 1 o-s 1.13 x 10- 5 l . 04 x lo- 5
-1. 71 -1. 81 -1.44
5000 4. 01 x 1 o-a 4. 12 x l 0- 8 3.64 x 10- 8
-1.63 -1. 82 -1.14
71

factor of two increase in the electron-neutral collision frequency. It is expected that a factor of two increase in collision frequency would result in a factor of two increase in the absorption of a radio wave passing through the modified ionosphere at D and E region heights.
At F region heights, the electron collision frequency is determined by electron-ion interactions. Because of Coulomb-type interactions, an increase in electron temperature results in a decrease in the electron-ion collision frequency. The decreased electron-ion coll is ion frequency yields corresponding decreases "in the absorption of radio waves passing through the modified region as has been demonstrated by Rush and Elkins (1975).
6.3 Summary Theoretical studies are just now providing results that can be utilized in
corroborating telecommunication experiments. Simulations of the performance of selected telecommunication systems have shown that observed results are in qualitative agreement with theory. Further work in the area of theoretical modelling and telecommunication simulation must be undertaken in order to properly place bounds on the potential impact of SPS operations on the ionosphere.
7. EXPERIMENTAL STUDIES OF THE PHYSICS OF IONOSPHERIC HEATING The purpose of the experimental physics of ionospheric heating studies is to
determine the physical processes associated with the operation of the proposed SPS microwave power transmission system and with ground-based high-power transmission systems. The experimental program is focused on finding ways to simulate the SPS microwave beam interactions with the ionosphere.
An understanding of the physics of the specific interactions excited by the SPS microwave beam is an important part of the SPS Assessment. The experimental physics studies are designed to determine instability thresholds, the growth rates and spatial extent of the resultant ionospheric disturbances, and the frequency and power dependences of the interactions. How these interactions are affected by variations in the natural ionospheric conditions, how different instabilities occurring simultaneously may affect each other, and how distinct microwave beams might mutually interact must be determined.
The experimental studies of the physics of ionosphere/microwave beam interactions have been conducted primarily using the facilities of the Arec·ibo Observatory (National Astronomy and Ionosphere Center, Arecibo, Puerto Rico). The soon-to-be completed high-power, high-frequency ionospheric heating facility is capable of producing continuous SPS-equivalent heating in the lower ionosphere following a l/f2 scaling. A full complement of ionospheric diagnostics is used to monitor
72
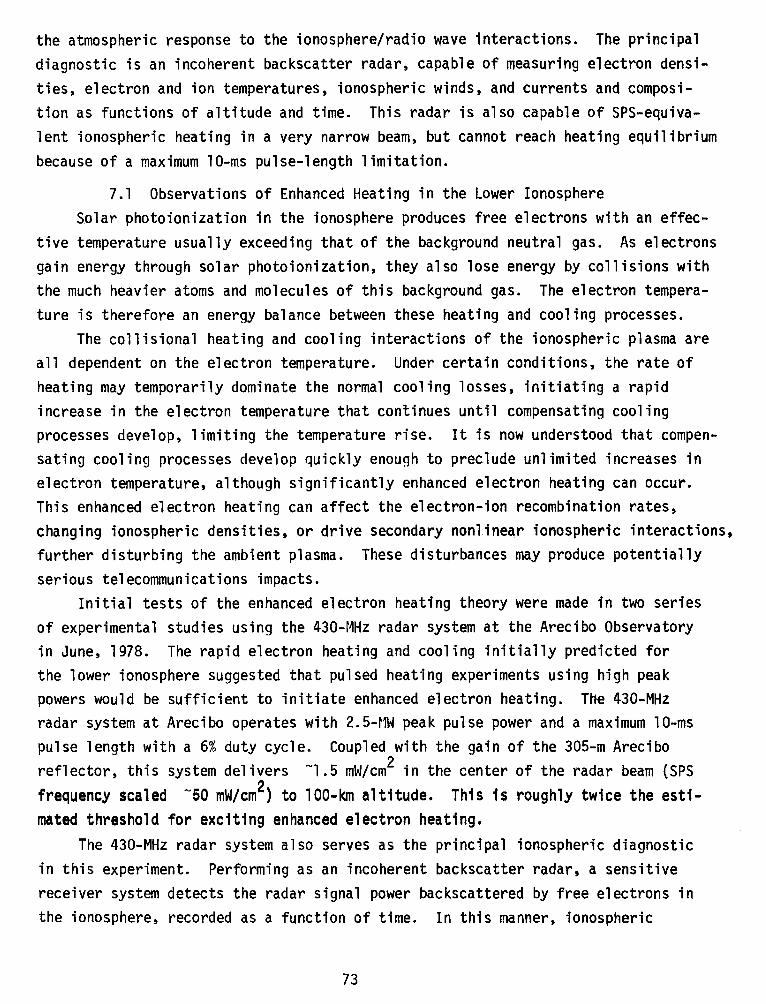
the atmospheric response to the ionosphere/radio wave interactions. The principal diagnostic is an incoherent backscatter radar, capable of measuring electron densities, electron and ion temperatures, ionospheric winds, and currents and composition as functions of altitude and time. This radar is also capable of SPS-equivalent ionospheric heating in a very narrow beam, but cannot reach heating equilibrium because of a maximum 10-ms pulse-length limitation.
7.1 Observations of Enhanced Heating in the Lower Ionosphere Solar photoionization in the ionosphere produces free electrons with an effec
tive temperature usually exceeding that of the background neutral gas. As electrons gain energy through solar photoionization, they also lose energy by collisions with the much heavier atoms and molecules of this background gas. The electron temperature is therefore an energy balance between these heating and cooling processes.
The collisional heating and cooling interactions of the ionospheric plasma are all dependent on the electron temperature. Under certain conditions, the rate of heating may temporarily dominate the normal cooling losses, initiating a rapid increase in the electron temperature that continues until compensating cooling processes develop, limiting the temperature rise. It is now understood that compensating cooling processes develop quickly enou~h to preclude unlimited increases in electron temperature, although significantly enhanced electron heating can occur. This enhanced electron heating can affect the electron-ion recombination rates, changing ionospheric densities, or drive secondary nonlinear ionospheric interactions, further disturbing the ambient plasma. These disturbances may produce potentially serious telecommunications impacts.
Initial tests of the enhanced electron heating theory were made in two series of experimental studies using the 430-MHz radar system at the Arecibo Observatory in June, 1978. The rapid electron heating and cooling initially predicted for the lower ionosphere suggested that pulsed heating experiments using high peak powers would be sufficient to initiate enhanced electron heating. The 430-MHz radar system at Arecibo operates with 2.5-r1W peak pulse power and a maximum 10-ms pulse length with a 6% duty cycle. Coupled with the gain of the 305-m Arecibo reflector, this system delivers -1.5 mW/cm2 in the center of the radar beam (SPS frequency scaled -50 mW/cm2) to 100-km altitude. This is roughly twice the estimated threshold for exciting enhanced electron heating.
The 430-MHz radar system also serves as the principal ionospheric diagnostic in this experiment. Performing as an incoherent backscatter radar, a sensitive receiver system detects the radar signal power backscattered by free electrons in the ionosphere, recorded as a function of time. In this manner, ionospheric
73

electron density altitude profiles were measured before and after a long (0.4- to 9-ms) radar heating pulse. On these short time scales, electron number density variiitions are very small. As a result, differences in these "hot" and "cold" profiles can be interpreted as due to changes in the electron scattering crosssection. Because of the known temperature dependence of this cross-section, the effective electron heating averaged across the beam could be determined. The heating and short diagnostic radar pulses were separated slightly in frequency to avoid signal contamination, with an altitude resolution of 3 km. Figure 28 shows results of this experiment.
Although increases in electron temperature of over 100° K were observed, this was much less than the predictions of enhanced electron heating theory at the time. This discrepancy was resolved by explicitly comput"ing the heating time dependence as a function of power, and accurately treating the radar power distribution across the heating and diagnostic beam. Using these improvements, agreement between theory and observations is good, as shown in Figure 28. The remaining differences at the lowest altitudes result from complications in interpreting the radar backscatter data when the local plasma Debye length and the radar wavelength become comparable.
Although these experiments usefully provided the first test of enhanced electron heating theory, the results are limited by the restriction to 10-ms pulsed heating. As discussed in Section 6.1.2, this heating would not have led to an equilibrium temperature change which requires at least 25-30 msec.
Enhanced electron heating of the lower ionosphere was observed during the recent Arecibo HF ionospheric heating program conducted in March, 1980. The HF facility radiated 200 kw at 3.175 MHz (-63.2 MW effective radiated power) and 5.1 MHz (31.6 MW effective radiated power). This provided $PS-equivalent heating (l/f2 scaling) through 100 km altitude at 3.175 MHz, and somewhat less than SPS-equivalent heating at 5.1 MHz (frequency-scaled 10 mW/cm2 at 75 km). One series of results show that electron heating with radio waves at 5.1 MHz was observed to peak at 75 km. Electron density increases were also observed during this heating. The preliminary results are in very good agreement with theoretical heat"ing models at heights above 80 km. The measured electron temperatures are slightly higher than expected below this altitude.
7.2 Experimental Studies of Self-Focusing Effects No short-scale plasma striations were detected at either E or F region heights
for underdense ionospheric heating conducted thus far at Arecibd. However, preliminary results indicate that large-scale (kilometer-size) irregularities did develop in the nighttime F region for underdense heating. These irregularities disappeared
74
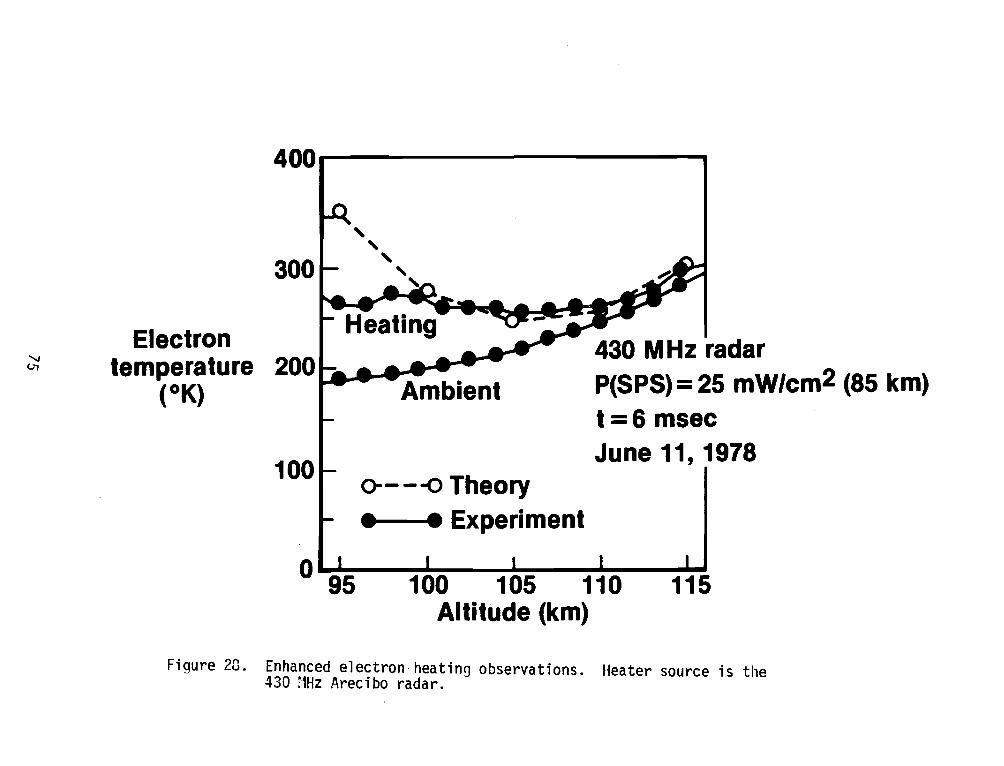
......, (,,-,
400---------------------------.
300
Electron temperature 200 b. • • • • • ....,.
(OK) a -L!--•
100 o----o Theory
• • Experiment
430 MHz radar P(SPS) = 25 mW/cm2 (85 km) t =6 msec June 11, 1978
0 95 100 105 110 115
Figure 20.
Altitude (km)
Enhanced electron-heating observations. 430 r1Hz Arecibo radar.
Heater source is the

abruptly near sunrise. Electron density variations as large as 2 percent were observed within the irregularities having fading period of several minutes. It is not known if the observed irregularities resulted directly from HF wave self-focusing, or if they were a HF-triggered natural spread-F condition.
The underdense ionospheric heating irregularities are shown in Figures 29, 30, and 31. The electron density near the F region peak is usually a smoothly varying distribution and the plasma-line spectral analysis methods available at Arecibo show the structure of the F region peak density. The normal F region plasma-line spectrum (in contour format) is shown in Figure 29. For underdense HF heating, a much more disturbed spectrum was observed, as seen in Figure 30. Near sunrise, the spectrum abruptly returned to its normal shape. A closer look at a small portion of this disturbed region reveals multiple peak densities within the radar beam. Typical density variations are of the order of 2 percent, with some observations showing changes as large as 4 percent. These high-resolution data are shown in Figure 31. Fading periods of several minutes were observed. These periods are of similar magnitude as those observed at Carpenter, Wyoming, during the underdense heating experiments discussed in Section 5.2.2.
7.3 Summary Results are now starting to be obtained as a result of experimentally observing
the physical processes of ionospheric heating that relate to the SPS operational scenario. It is expected that the agreement between theoretical predictions, observed teleconmunication system impacts, and experimental physics results will present a coherent and cohesive picture when the full operation of the Arecibo Heating Facility commences.
8. OVERALL CONCLUSIONS The program of research and exploratory development undertaken in order to
assess the impact of the operation of the Satellite Power System on the ionosphere and telecommunication systems has relied upon SPS simulation, theoretical studies, and experimental observations. The program has been directed toward obtaining corroborative evidence of ionospheric heating phenomena that pertain to the SPS operational scenario.
Current understanding of the processes involved in the heating of the ionosphere by the Satellite Power System predict that ohmic interactions and self-focusing instabilities will proceed as a result of the passage of the microwave power beam through the ionosphere. These processes could lead to enhanced heating in the ionosphere and to the formation of electron density irregularities. The extent to which ohmic heating and self-focusing instabilities affect the normal ionosphere
76

-....J -....J
0620 I 1 nrv '• - .:;r:;::=I
w ~ i=0610
0600-f---! 4.85 5.05 )
FREQUENCY (MHz Figure 29. Plasma-line spectrum (in contour format) of the F Region observed under
normal conditions.
5.25

..... 00
0610-+-------~~--~~~----~....._--------~~~--~-------+-
w ~ 0600 -I- Po
. ~
0550 .
3.9 4.1
FREQUENCY (MHz) Figure 30. Plasma-line spectrum (in contour format) of the F Region heated in
an underdense manner.
4.3
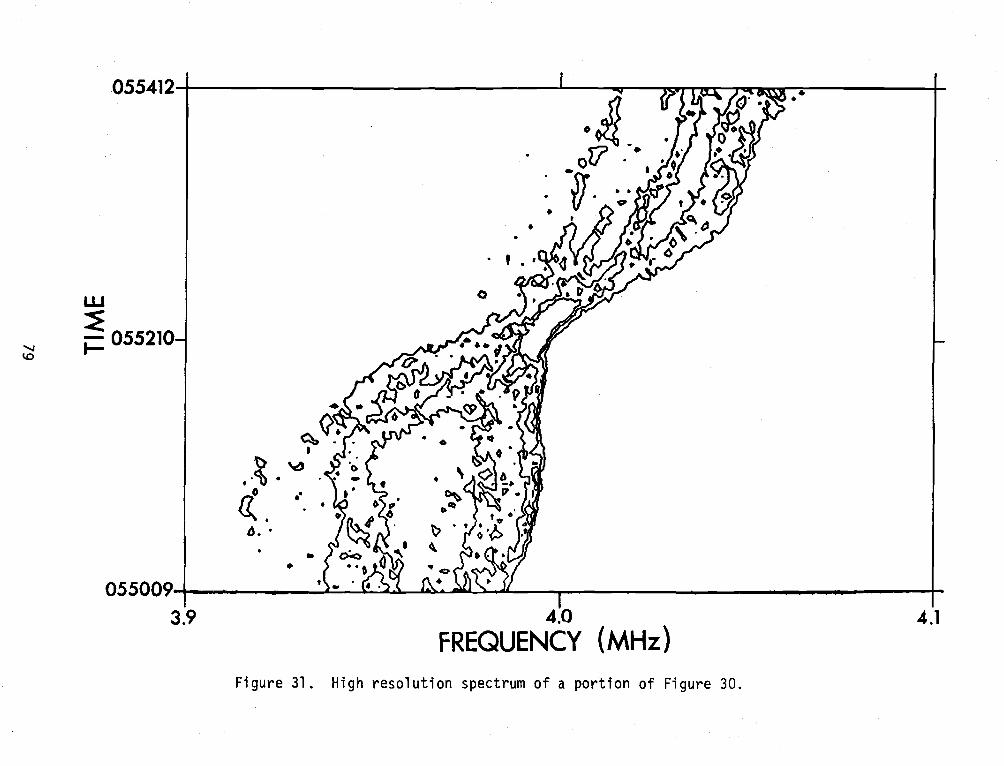
'.J \0
055412 I I zq i9'J [ tt:L: 1 C\ &<\V: • • I
w ~ ~ 055210
'() "=' . ·~ . « . . . .0 • •
• • 055009 t ,_ , .. '\ '·'* nM..! ') JI I I
3.9 4.0 FREQUENCY (MHz)
Figure 31. High resolution spectrum of a portion of Figure 30.
4.1

and the performance of telecommunication systems that rely upon the ionosphere, will determine how the SPS operation will modify telecommunication system perform-ance.
Using the fact that processes emanating from ohmic and self-focusing interaction in the ionosphere can be scaled according to frequency-dependent laws, ground-based simulations of SPS heating in the ionosphere has been performed. This heating has been performed using the high-powered, high-frequency transmission facilities operating at Platteville, Colorado, and at Arecibo, Puerto Rico. Because of facility limitations, ohmic heating experiments can only be performed in the lower ionosphere.
Studies that investigated the performance of VLF, LF, and MF telecommunication systems operating in an experimentally simulated SPS environment, have yielded results indicating that VLF, LF, and MF systems will not be adversely impacted by SPS operation. These studies were conducted using actual operating teleconmunication system signals. The effects of SPS heating on HF, VHF, and UHF systems need to be studied also.
Results have recently become available indicating that underdense self-focusing (the case of interest to the SPS) can produce changes in the signal level of satel-1 ite transmissions received on the ground and in aircraft. The preliminary results show that changes in signal level are much slower and much smaller than those associated with overdense (radio wave reflected from the ionosphere) heating processes.
Theoretical studies have resolved early observations of enhanced electron heating at the Arecibo Facility. Current predictions indicate that the existing facilities at Platteville and Arecibo are just powerful enough to produce SPS heating during the daytime at lower ionospheric heights by the ohmic processes.
Observations of electron density and electron temperature changes made at Arecibo under conditions of SPS-comparable underdense heating are now becoming available. Preliminary results provide first order agreement with theoretical estimates.
Clearly there are areas in the entire assessment program in which further work is required. The performance of HF and VHF telecommunication systems operating in a SPS-heated environment must be assessed. These systems, however, rely upon propagation of radio signals in the upper ionosphere and improved experimental facil
ities are required in order to investigate possible SPS effects.
The initial results showing fluctuations in satellite signals passing through an underdense-heated ionosphere need to be studied further in terms of theoretical prediction. Efforts must also be undertaken to corroborate that such signal
80

fluctuations are smaller than naturally induced fading of satellite-to-ground signals. The results of the ground-based observations of the satellite sianals need to be interpreted in terms of operational impacts on the SPS pilot beam required for satellite transmitting antenna control.
Further effort must be undertaken to achieve a fully acceptable theoretical model of the ionosphere under SPS operational conditions. Current studies appear to be yielding results that agree in principle with observations of ohmic heating in the lower ionosphere. The ohmic loss rate and the absorption both depend on an effective frequency f e defined by:
f 2 = f 2 [(1 + fH/f cos e) 2 + (v /2Tif) 2] (8) e - en
where e is the angle between the propagation direction and the magnetic field, the other terms are as defined previously. It can be seen from (8) that unless (f H/f) • cos e <<l and (ven/2Tif) <<l ohmic loss and absorption will not scale as simply as l/f2
• In general the scaling from SPS to HF frequencies is quite complicated and nonlinear since an increase in temp.erature changes ven and thus f~.
The scaling is further complicated by the fact that the absorption coefficient is directly proportional to the electron density and thus depends on the ambient D and E layer electron density distributions.
Efforts directed toward a full application of the self-focusing instability in an underdense ionosphere need to be undertaken. Also, studies directed toward determining the likelihood of occurrence of other plasma processes unique to the SPS operation must be addressed. More observations of electron density and electron temperature need to be obtained under SPS-simulated conditions. These observations need to be tied directly to the theoretical estimates of changes in electron density and temperature. Only then can a fully acceptable theory emerge.
Since a critical portion of the Ionospheric Heating Assessment relies upon frequency-scaling laws for ohmic heating and self-focusing instabilities, these laws must be verified with experimental observation. Ground-based transmitters operating at higher powers and higher frequencies than those presently at Platteville and Arecibo need to be constructed. Such facilities would provide the means to corroborate frequency-sealing laws as well as permit further study of tel ecornmunications impacts in the upper portion of the frequency spectrum.
The results obtained thus far are applicable to the operation of a single Satellite Power System operating with a microwave beam having a power density of
23 mW/cm2 at the beam center. Studies need to be directed toward assessing the effect of multiple satellites on the ionosphere. In addition, it is desirable to
know the upper power density limit at which the SPS can operate before inducing
31
adverse telecommunication effects. Studies undertaken indicate that 23 mH/cm2 may be below the threshold for the onset of ionospheric changes. If higher power flux densities can be tolerated, then major system design criteria will have to be reviewed and, possibly, revised. These await the future.
82

REFERENCES
Aarons, J. (1977), Equatorial scintillations: A review, IEEE Trans.Ant. Prop., AP25, 729-736.
Allen, E. M., G. D. Thome, and P. B. Rao (1974), HF phased array observations of heater-induced spread-F, Radio Sci.,~' 905-916.
Arnold, P. w. {1973), An HF high-power vertically directed array for ionospheric modification, OT Report 73-21.
Barry, G. H. (1974), HF-VHF communications experiments using man-made field-aligned ionospheric scatterers, Radio Sci.,~' 1025-1032.
Basu, Sunanda, S. Basu, and B. K. Khan (1976), Model of equatorial scintillations from in situ measurements, Radio Sci., .J..l, 821-832.
Berry, L.A. and J. E. Herman (1971), A wave hop propagation program for an anistropic ionosphere, OT/ITS Research Report 11, U.S. Government Printing Office (Stock No. 0300-0316), Washington, D. C.
Bowhil 1, S. A. (1974), Satellite transmission studies of spread-F produced by artificial heating of the ionosphere, Radio Sci.,~. 974-986.
Carpenter, G. B. (1974), VHF and UHF bistatic observations of a region of the ionosphere modified by a high power radio transmitter, Radio Sci.,~' 965-969.
Carroll, J. C., E. J. Violette, and W. F. Utlaut (1974), The Platteville high-power facility, Radio Sci.,~. 889-894.
Cragin, B. L. and J. A. Fejer (1974), Generation of large-scale field-aligned irregularities in ionospheric modification experiments, Radio Sci., 9, l 071 -1 07 5. -
Crane, R. K. (1977), Ionospheric scintillation, Proc. IEEE, 65, 180-199.
Crombie, D. D. (1964), The effects of a small local change in phase velocity on the propagation of a VLF radio system, Radio Sci., 680, 709-715.
Duncan, L. M. and R. A. Behnke (1978), Observations of self-focusing electromagnetic waves in the ionosphere, Phys. Rev. Letters, .1.l_, 998-1001.
Engelhardt, A. G. and A. V. Phelps {1963), Elastic and inelastic collision crosssections in hydrogen and deuterium from transport coefficients, Phys. Rev., 131, 2115-2128.
Fejer, J. A. (1979), Ionospheric modification and parametric instabilities, Rev. Geo phys. Space Sci. , ll., 135-153.
Fialer, P. A. (1974), Field-aligned scattering from a heated region of the ionosphere - observations at HF and VHF, Radio Sci.,~. 294-340.
Gordon, W. E. and H. C. Carlson, Jr. (1974), Arecibo heating experiments, Radio Sci . , ~. 1 041 -1 04 7 .

Gordon, w. E. and L. M. Duncan (1978), Ionosphere/Microwave beam interaction study, William Marsh Rice University Report DRL T01349, Houston, TX.
Gurevich, A. V. (1978), Nonlinear Phenomena in the Ionosphere, Springer-Verlag, New York, Incorporated, New York, NY.
Jones, T. B., K. Davies, and B. Wieder (1972), Observations of D region modifications at low and very low frequencies, Nature, 238, 33-34.
Lawton, S. A. and A. V. Phelps (1978), Excitation of the b1L; state of o2 by low energy electrons, J. Chem. Phys. 69, 1055-1068. ·
Meltz, G., L. H. Holway, Jr., and N. M. Tomljanovich (1974), Ionospheric heating by powerful radio waves, Radio Sci.,~, 1049-1063.
Meltz, G. and W. L. Nighan (1980), Microwave heating of the lower ionosphere, Proc. OoE/NASA Satellite Power System Program Review, April 22-25, 1930. Obtainable from Johnson Environmental and Energy Center, University of Alabama, Huntsville.
Minkoff, J. (1974), Radio frequency scattering from a heated io'nospheric volume, 3, cross section calculations, Radio Sci., 2_, 997-1004.
Minkoff, J., P. Kugelman, and I. Weissman (1974), Radio frequency scattering from a heated ionospheric volume, 1, VHF/UHF field-aligned and plasma-line backscatter measurements, Radio Sci.,~, 941-~55.
Perkins, F. W. and M. V. Goldman {1980), Self-focusing of radio waves in an underdense ionosphere, Submitted to J. Geophys. Res.
Perkins, F. W. and R. G. Roble (1978), Ionospheric heating by radio waves: predictions for Arecibo and the satellite power station, J. Geophys. Res., 83, 1611-1624. ~
Perkins, F. W. and E. J. Valeo (1974), Thermal self-focusing of electromagnetic waves in plasmas, Phys. Rev. Letters, 32, 1234-1237.
Rao, P. B., and G. D. Thome, A model for RF scattering from field-aligned heater·induced irregularities, Radio Sci., ~' 987-996.
Rush, c. I~. and T. J. Elkins (1975), An assessment of the magnitude of the F region absorption on HF radio waves using realistic electron density and collision frequency models, ITU Telecommunication J., 42, 476-488.
Rush, C. M., D. Miller, and J. Gibbs (1974), The relative daily variability of foF2 and hmF2 and their implications for HF radio propagation, Radio Sci •• 8,9, 749-756.
Rush, c. M., E. J. Violette, R. E. Espeland, J. c. Carroll, and K. C. Allen (1980), Impact of SPS heating on VLF, LF, and MF telecommunication systems, NTIA Technical Report, NTIA-R-80-37.
Showen, R. L. (1980), Measurements of poss·ible D and E region telecommunications effects during ionospheric heating, SRI, International Report, In Press.
Stathacopoulos, A. D., and G. H. Barry (1974), Geometric considerations in the design of communications circuits using field-aligned ionospheric scatter, Radio Sci.,~' 1021-1024.

Thome, G. D., and D. w. Blood (1974), First observations of RF backscatter from field-aligned irregularities produced by ionospheric heating, Radio Sci., ~' 917-921.
Thome, G. D. and F. w. Perkins (1974), Production of ionospheric striations by thermal self-focusing, Phys. Rev. Letters, ~' 1238.
U. S. Department of Energy (1978), Satellite Power System Concept Development and Evaluation Program Reference System Report, DoE/ER-0023.
Utlaut, w. F. (1970), An ionospheric modification experiment using very high-power high frequency transmission, J. Geophys. Res., 74, 6402-6405.
Utlaut, w. F. (1975), Ionospheric modification induced by high-power HF transmitters--A potential for extended range VHF-UHF communications and plasma physics research, Proc. IEEE, 63, 1022-1043.
Utlaut, w. F. and R. Cohen (1971), Modifying the ionosphere with intense radio waves, Science, 174, 245-249.
Utlaut, w. F., and E. J. Violette (1974), A summary of vertical incidence radio observations of ionospheric modification, Radio Sci.,~' 895-903.
Utlaut, W. F., E. J. Violette, and L. L. Melanson (1974), Radar cross section measurements and vertical incidence effects observed with Platteville at reduced power, Radio Sci.,~' 1033-1040.
85