entrepreneurship programs in developing countries · entrepreneurship programs . in developing...
TRANSCRIPT

Policy Research Working Paper 6402
Entrepreneurship Programs in Developing Countries
A Meta Regression Analysis
Yoonyoung Cho Maddalena Honorati
The World BankHuman Development NetworkSocial protection and Labor UnitApril 2013
WPS6402P
ublic
Dis
clos
ure
Aut
horiz
edP
ublic
Dis
clos
ure
Aut
horiz
edP
ublic
Dis
clos
ure
Aut
horiz
edP
ublic
Dis
clos
ure
Aut
horiz
edP
ublic
Dis
clos
ure
Aut
horiz
edP
ublic
Dis
clos
ure
Aut
horiz
edP
ublic
Dis
clos
ure
Aut
horiz
edP
ublic
Dis
clos
ure
Aut
horiz
ed
Produced by the Research Support Team
Abstract
The Policy Research Working Paper Series disseminates the findings of work in progress to encourage the exchange of ideas about development issues An objective of the series is to get the findings out quickly even if the presentations are less than fully polished The papers carry the names of the authors and should be cited accordingly The findings interpretations and conclusions expressed in this paper are entirely those of the authors They do not necessarily represent the views of the International Bank for Reconstruction and DevelopmentWorld Bank and its affiliated organizations or those of the Executive Directors of the World Bank or the governments they represent
Policy Research Working Paper 6402
This paper provides a synthetic and systematic review on the effectiveness of various entrepreneurship programs in developing countries It adopts a meta-regression analysis using 37 impact evaluation studies that were in the public domain by March 2012 and draws out several lessons on the design of the programs The paper observes wide variation in program effectiveness across different interventions depending on outcomes types of beneficiaries and country context Overall entrepreneurship programs have a positive and large
This paper is a product of the Social protection and Labor Unit Human Development Network It is part of a larger effort by the World Bank to provide open access to its research and make a contribution to development policy discussions around the world Policy Research Working Papers are also posted on the Web at httpeconworldbankorg The authors may be contacted at ycho1worldbankorg and mhonoratiworldbankorg
impact for youth and on business knowledge and practice but no immediate translation into business set-up and expansion or increased income At a disaggregate level by outcome groups providing a package of training and financing is more effective for labor activities In addition financing support appears more effective for women and business training for existing entrepreneurs than other interventions to improve business performance
Entrepreneurship Programs in Developing Countries A Meta
Regression Analysislowast
Yoonyoung Cho and Maddalena Honoratidagger
Keywords Meta Regression Analysis Entrepreneurship Programs Microenterprise Development
Training Financing Counseling
JEL codes O12 O16 J24
Sector Board Social Protection (SOCPT)
lowast This paper has been prepared as a part of broader ldquoentrepreneurship projectrdquo at the Social Protection and Labor Unit World Bank Washington DC It is also a background paper for the World Bankrsquos 2013 World Development Report on Jobs The study was funded by the Governments of Austria Germany Norway South Korea and Switzerland under the auspices of the Multi Donor Trust Fund on Labor Markets Job Creation and Economic Growth The findings interpretations and conclusions expressed here are personal and should not be attributed to the World Bank its management its Executive Board of Directors or any of its member countries We thank David Robalino and David Margolis for their support and insights Jesko Hentschel and team members of the World Development Report on Jobs for their valuable comments and Eshrat Waris for assistance in constructing the data We also thank Jamele Rigolini for a thorough review and thoughtful suggestions and IZAWB conference participants for their valuable comments dagger Yoonyoung Cho(Corresponding) The World Bank and IZA email ycho1worldbankorg Maddalena Honorati The World Bank email mhonoratiworldbankorg
2
1 Introduction
Fostering entrepreneurship is widely perceived to be a critical policy agenda to expand
employment and earning opportunities and to reduce poverty Sound macroeconomic conditions
and business environment including infrastructure regulation and legal environment have
typically been emphasized to increase entrepreneurial activities and create jobs While these
remain relevant in developing countries increasing attention is being paid to the role of labor
policies that aim to reduce constraints and enhance productivity among the self-employed and
small-scale entrepreneurs1 This is particularly pressing in developing countries where wage and
salary employment is limited and the majority of jobs are created and operated in self-employment
(Haltiwanger et al 2010 Ayyagari et al 2011 Gindling and Newhouse 2012) The demographic
pressure including youth bulge in many countries in Africa and South Asia adds urgency to
creating more jobs and provides a justification of entrepreneurship promotion to absorb the large
inflow of workers
In recognition of the importance of self-employment in job creation interventions to
promote entrepreneurial activities (hereafter ldquoentrepreneurship programrdquo) are increasingly being
implemented around the developing world Such entrepreneurship promotion programs largely
vary by objectives target groups and implementation arrangements and often combine different
types of interventions depending on the constraints to entrepreneurial activities that each program
aims to address Based on the evidence that some entrepreneurial traits and skills are strongly
related to business set-up and success2 and that access to finance is a dominating constraint to
1Note that the terms ldquoself employedrdquo and ldquoentrepreneursrdquo are used interchangeably Also small-scale entrepreneurship is used instead of microenterprise or subsistence business 2For example Ciavarella et al (2004) using data from the United States find a strong relationship between some attributes of personality (measured by the Big Five conscientiousness emotional stability openness agreeableness and extroversion) and business survival Crant (1996) also points to personality as a predictor of entrepreneurial intentions
3
entrepreneurship programs have provided individuals in the labor market with the opportunities of
training counseling and access to finance Frequently used interventions include technical
(vocational) business (managerial) and financial skills training financing support such as
microcredit loans and grants and counseling ranging from mentoring and advisory services to
post-program consulting3 Outcomes of interest range from labor market performance such as
employment business creation hours of work earnings and profits and business performance to
supply side changes such as improved technical and non-cognitive skills business knowledge and
practice attitudes aspirations and more active financial behavior (borrowing saving) Target
groups are also very diverse with different population groups facing different barriers to
entrepreneurship and self-employment (women youth social assistance beneficiaries etc) Some
programs target potential entrepreneurs (the unemployed school drop-outs or graduating
individuals) to foster self-employment and new business creation others target existing
microentrepreneurs or microfinance clients to increase their productivity Programs can be further
modified according to the context of the policy environment reflecting cultural factors (fear of
failure or beliefs on gender roles) infrastructure (water and electricity) and legal and regulatory
conditions (high entry barrier due to administrative hassles) among others that can hinder
individuals from starting and growing a business4
Evidence on the effectiveness of entrepreneurship promotion programs is still scarce and
findings from existing impact evaluations are widely heterogeneous Early evaluations from Latin
Americarsquos Jovenes programs targeted to vulnerable youth though not conventional
entrepreneurship programs suggested that vocational and life skills training combined with an
3 In addition microfranchising value chain inclusion small business networks support for technology transfer business incubation and many others are being implemented 4 Microfinance programs for instance often target female entrepreneurs in order to address issues related to a cultural factor while relieving credit constraints
4
internship in private firms could be potentially useful for self-employment promotion as well
(Attanasio et al 2011 Card et al 2011) More recent impact evaluations of skills training for self-
employment and business development targeted at vulnerable individuals in Malawi Sierra Leone
and Uganda for instance found generally positive effects on psycho-social well-being but mixed
results in labor market outcomes (Cho et al 2012 Blattman et al 2012 Casey et al 2011
respectively) The complexity increases as the training programs combine other financial and
advisory support especially for social assistance beneficiaries (Almeida and Galasso 2009
Carneiro et al 2009 Macours et al 2012) And even the seemingly similar programs have
heterogeneous results in different places (in Peru business training programs from Karlan and
Valdiva 2011 in Tanzania Berge et al 2011 in Bosnia and Herzegovina Bruhn and Zia 2011)
Likewise the effects of financing through microcredit or grants vary widely across studies A
series of studies in Sri Lanka suggest that the returns to capital were large and grants significantly
improved labor market (business) outcomes (De Mel et al 2008a 2008c 2012) However
evaluations on the effects of expanding access to credit in Mongolia Bosnia and Herzegovina
India South Africa Morocco and Philippines (Attanasio et al 2012 Augsburg et al 2012
Banerjee et al 2009 Karlan and Zinman 2010 Crepon et al 2011 Karlan and Zinman 2011
respectively) suggest that access to credit did not automatically improve entrepreneurial activities
In this paper we exploit the heterogeneity of design and implementation features to shed
light on the effectiveness of the programs We synthesize the impacts of different entrepreneurship
programs and disentangle the effects of design factors from those of context and study
characteristics using a meta regression analysis A meta analysis is a statistical procedure of
combining the estimated impacts of multiple studies in order to draw more insights and greater
5
explanatory power in probing differential program effects5 Since a meta analysis examines the
extent to which different program and study characteristics ndash design and implementation features
data sets and methods of analysis ndash affect estimated results it is particularly useful to synthesize
the findings from various studies on a similar topic
An important contribution of this paper lies in the coverage of programs and methodology
in the meta analysis Although many entrepreneurship programs are being implemented and
evaluated in developing countries to our knowledge few attempts have been made to review the
impacts of such interventions in order to synthesize emerging lessons David Roodmanrsquos open
blog reviews existing microfinance and saving programs and concludes that such programs do
little to reduce poverty on average with large heterogeneity McKenzie and Woodruff (2013)
provide narrative reviews on business training programs and find that their overall impact is
generally small and that a knowledge gap exists in understanding what programs work better and
how Karlan et al (2012) also review microenterprise development programs that include business
training and capital infusion and highlight heterogeneity in results Our paper by cross-examining
the effectiveness of diverse entrepreneurship programs and by disentangling the contribution of
various factors in explaining success provides a systematic review based on impact evaluation
results that are available and draws synthetic lessons In this sense this paper is in line with recent
studies such as Card et al (2010) and Kluve (2010) which examine the effectiveness of various
active labor market programs in developed countries based on meta analysis However unlike
Card et al (2010) and Kluve (2010) we move beyond positive significance in examining program
effects We indeed construct the effect size for each observation based on the coefficients standard
5 See Stanley (2001) for discussion on the methodology of meta analysis in synthesizing multiple studies There has been useful synthetic research that employed this meta analysis method in the field of labor market analysis For example Jarrell and Stanley (1990) and Stanley and Jarrell (1998) examined the magnitude of wage gaps between union-nonunion and male-female workers respectively using multiple studies that estimated the gap
6
errors and sample size reported in each study This allows us to discuss program success without
confounding it with statistical power from sample size and obtain more robust measures to assess
the effectiveness of the programs which we will discuss below in more detail
We find that the impacts of differential combinations of interventions vary depending on
the outcomes of interest and target groups as well as the specific context Overall entrepreneurship
programs have a positive and large impact for youth and on business knowledge and practice but
no immediate translation into business set-up and expansion or increased income At a
disaggregate level by outcome groups providing a package of training and financing is more
effective for labor activities Additionally financing support appears more effective for women
and business training for existing entrepreneurs than other interventions to improve business
performance Our findings suggest that involving the private sector in program delivery can
enhance the effectiveness
The meta analysis of course is unable to completely resolve the technical issues that are
embedded in the original studies6 It is unclear whether a programrsquos performance is driven by its
design or implementation from an individual study By synthesizing multiple studies we can infer
which design and implementation features are more associated with positive impacts on average
However because available information differs across studies it is possible that the meta analysis
may omit important determinants of program performance We undertake estimations based on
different models to address unobservable variables Another caveat of meta analysis is that the
6 It may be the case that if the impact evaluation was not well powered against certain outcomes due to insufficient sample size it will more likely yield insignificant impacts even when the true impact exists Even if an overall impact is well examined for the general target group heterogeneous impacts on subgroups may suffer more from insufficient power (Card and Krueger 1995) Similarly insignificant results are less likely to be written up and reported in a study Since in the meta regression we use all significant and insignificant estimates in the study that are relevant in terms of outcome of interest (we report on average 25 estimated per study) we are automatically absorbing the methodological bias originally present in the study
7
results may change if more impact evaluation studies are added7 Therefore findings and
conclusions of this meta analysis need to be interpreted with caution keeping these limitations in
mind
The next section describes the procedure for constructing data and discusses main features
of the entrepreneurship programs in our sample studies Section 3 presents a standardization and
estimation strategy using meta regressions and discusses methodology Section 4 then discusses
the main findings of the meta analysis Finally Section 5 concludes the study
2 Constructing a Data Set for the Meta Analysis
21 Selection Criteria and Search Strategy
To comprehensively collect studies that evaluate entrepreneurship programs we apply the
following selection criteria First we include impact evaluations of interventions that aim at
promoting entrepreneurial activities of potential or current entrepreneurs These are interventions
targeted to address various external and individual constraints to entrepreneurship such as skills
7 There are quite a few studies in the pipeline that did not meet our March 2012 criteria but are advanced in presenting results Cho et al (2012) examined the effects of vocational and business training through apprenticeship on vulnerable youth in Malawi and found little impact on business set-up despite large positive impacts on intermediate outcomes such as business knowledge and psycho-social well-being De Mel et al (2012) investigated the impacts of business training and grants on the set-up and growth of female enterprises in Sri Lanka and found that the training expedited business set-up for potential entrepreneurs and the package of training and grants improved the performance of the existing enterprises Karlan et al (2012) investigated the role of business and managerial skills improvement through business consulting in improving the performance of microenterprises in Ghana and found little evidence of profit increases and the entrepreneurs revert back to their old practices after about a year Abraham et al (2011) investigated the access to savings on consumption smoothing and insurance against risks for micro-entrepreneurs in Chile and found positive impacts Bandiera et al (2012a) examined the effectiveness of the BRACrsquos ultrapoor entrepreneurship training and coaching intervention targeted to poor women in Bangladesh and found substantial increases in assets savings and loans and improved welfare Similarly Bandiera et al (2012b) found that combining vocational training for business creation with information on risky behavior and health and providing a place to socialize increase the likelihood of engaging in income generating activities by 35 percent for adolescent girls in Uganda
8
credit information cultural norm and regulations8 including training related active labor market
programs (ALMPs) designed to enhance technical skills for self-employment and small-scale
entrepreneurship as well as financial support intervention However pre-employment technical
and vocational education and training (TVET) and programs solely promoting wage employment
or large-scale firms are not considered here9 Similarly evaluations of interventions facilitating
access to financial products including micro-insurance or saving are excluded unless they focus on
the outcomes of entrepreneurial activities10
Second only impact evaluation studies that rigorously estimate the effects using a
counterfactual based on experimental or quasi-experimental design are selected Many programs
whose evaluation is dependent on anecdotal evidence or tracer studies without appropriate
comparison between treatment and control groups are not considered Unfortunately renowned
programs such as Grameen Bankrsquos microcredit program large-scale programs such as Know
About Business (KAB) that are being implemented in many countries by the International Labour
Organization (ILO) and many programs by innovative non-governmental organizations (NGO)
including Accion International Ashoka and Youth Business International could not be
considered
Third given that the main interest of this paper is to examine the effects of
entrepreneurship interventions as a tool to reduce poverty and improve the livelihoods of
individuals in developing countries we focus only on the studies undertaken in developing
8 See Banerjee and Newman (1993) for occupational choice model and its constraints 9 Examples include De Mel et al (2010) impact evaluation of a wage subsidy program and Bloom et al (2012) study on the effects of supporting a large firm in India 10 Among the programs to insure individuals against risks they are included for example if they hedge the negative impacts of weather on their agri-business but are excluded if they provide access to health insurance
9
countries over the past ten years Some well-documented studies on developed countries are
excluded here11
Finally manuscripts are included in this analysis only when they are available in the public
domain as a working paper or published paper by the end of March 2012 Ongoing studies where
project description impact evaluation design and some preliminary results are available but the
draft paper is not are excluded for now Adding these studies in the future could change the
overall findings from our analysis
Based on the above-mentioned criteria we first collected papers from the literature review
and references in early studies We also used web-based search functions such as Google Scholar
and Ideas to find recent working papers In doing so we relied on the major working paper
domains such as the National Bureau of Economic Research World Bank Policy Research
Working Paper Series and IZA Working Papers
22 Coding and Sample Overview
Using the selected papers we gather detailed information on outcomes of interest and intervention
and study characteristics Intervention characteristics include intervention types (training or
financing for example) duration of intervention location (country urbanrural) and target group
(youth women microcredit clients) Study characteristics include methodology (experimental vs
quasi-experimental) sample size used in the study and publication format (peer reviewed journals
vs working papers) Other information we extract includes whether government agencies
international donor agencies NGOs and community organizers universities and researchers or
11 Examples include Cole and Shastry (2009) on the United States and Ooseterbeek et al (2010) on the Netherlands
10
microfinance institutes (MFI) and banks deliver the interventions When the core information
could not be obtained from the paper we directly contacted authors to provide supplementary
information
And more importantly we extract information on the effect of the program The primary
measures of the effect that are comparable across studies include an indicator whether the
program had a positive and significant effect and a lsquostandardized effect sizersquo reflecting the size of
effects on the treatment compared to the control group as a proportion of its standard deviation ndash
whether it be probability difference percentage growth or changes in levels An indicator of
positively significant effect measures whether the program works whereas the standardized effect
size measures the extent to which the program affects the outcomes We use both measures to
conduct our meta regression analysis as discussed in more detail in Section 4
Most of the studies contribute multiple observations because they examine more than one
outcome and different beneficiary groups For example when the impact of a particular
intervention on business practice is examined and the business practice is reflected in two
measures ndash indicators of book keeping and separation of personal and business account ndash both
observations are counted for the outcomes of business practice Whenever available we record
separate estimates for subgroups such as women and youth which multiplies the number of
observations However when multiple specifications are used to estimate a particular outcome we
use a weighted average of the estimates applying the number of observations as weights instead of
counting them as separate observations
The final data set includes 37 impact evaluation studies and 1116 estimates for six
different types of outcomes12 The number of estimates collected from each study is larger than
12 See Table A1 in the Appendix for the complete list of studies that are used here
11
Card et al (2010) given a broader set of outcomes of interest and the diversity of programs
considering the nature of labor markets in developing countries13 The studies are from 25
countries across all six regions ndash AFR EAP ECA LAC SAR and MENA14 Most of the
estimates are concentrated in LAC (28 percent) SAR (19 percent) and AFR (17 percent) and two
thirds of the interventions come from low income or lower middle income countries (see Figure 1)
Out of 37 studies 16 are published in peer reviewed journals while the remaining 21 studies are
working papers About three quarters of the studies and 80 percent of the estimates are obtained
from experimental interventions
23 Constructing Key Variables
231 Outcomes of Interest
Table 1 presents a summary of the distribution and definitions of the main outcomes of interest
The most commonly measured outcomes are labor market income and profits (277 percent)
followed by labor market activities (217 percent) Business start-up or expansion increased
employment and hours of work and reduced inactivity are coded as positive outcomes for labor
market activities With respect to income and profits a range of variables from individual salary to
business profits and assets and to household consumption that captures broad welfare is included
Given that most small businesses operate at the household level and that individual earnings from
self-employment are often indistinguishable from business profits they are coded together as labor
13 For comparison Card et al (2010) collected 197 estimates from 97 studies focusing only on labor market outcomes In our study we broaden our estimates of interest to other outcomes in addition to labor market ones we collect 1116 estimates from 37 studies out of which the number of estimates for labor market outcomes are about 530 On average we collect 25 estimates per study 14 The regional category follows the classification of the World Bank AFR presents Sub-Saharan Africa EAP- East Asia and Pacific ECA- Eastern Europe and Central Asia LAC- Latin America and the Caribbean SAR ndash South Asia and MENA- Middle East and North Africa
12
income Business performance then includes measures to capture the size and revenue of business
activities such as sales number of employed workers and size of inventories Business knowledge
and practice includes record keeping registration and separation of individual and business
accounts that could potentially affect business performance Acquisitions of business loans saving
accounts and insurance plans that could affect the resource allocation of a business fall into the
category of financial behavior (savingborrowing) Finally attitudes toward risk confidence and
optimism and time preference that may be related to entrepreneurial traits are coded as attitudes
232 Type of Intervention
The interventions analyzed in the sample of our studies can be broadly classified in the following
types training financing counseling and the combinations of them Training is disaggregated into
three subcategories technical and vocational business and managerial and financial skills
training Technical and vocational training includes basic skills that would be essential for self-
employment in certain occupations ndash such as electricians mechanics tailors bakers plumbers and
handy men The distinction between business and financial training is not always clear Business
training teaches general practice and business applications including for example book keeping
calculating profits separating personal and business accounts and managing inventory financial
training is usually more specifically tailored to managing profits making inter-temporal decisions
on investment and saving and accounting
With respect to financing it is disaggregated into (micro)credit for business or consumer
loans15 cash and in-kind grants and access to financial products such as saving accounts and
15 We code ldquomicrocreditrdquo also as those interventions that test specific design features of a microcredit program For example when the ldquotreatmentrdquo under evaluation is a change in the rule or structure of the loan repayment bigger size loans or group liability versus individual liability we consider them ldquomicrocreditrdquo treatment for ldquomicrocredit clientsrdquo
13
micro-insurance Counseling is seldom used as a stand-alone program rather it usually is added to
the main intervention About 41 percent of estimates include training 67 percent financing
support and 21 percent combine counseling (See Table 2) Among the different types of
interventions microcredit programs are by far the most common followed by business training
(See Figure 2) Depending on the outcomes of interest certain interventions are more frequently
used than others financial training seems more relevant for business outcomes whereas technical
and vocational training can be useful for labor market outcomes (See Table A3 in the Appendix
for the distribution of type of intervention by outcome groups)
233 Beneficiaries
Programs are often targeted to women youth microcredit clients social assistance beneficiaries
and existing business owners (See Table A1 in the Appendix for the target group of each paper
used here) In cases where programs are not targeted to a certain group studies report outcomes by
gender region or education and it is not uncommon that the effectiveness of programs is
heterogeneous across different groups For example studies that examine the returns to financing
support for microenterprise owners in Sri Lanka (De Mel et al 2008a 2008b) found that the
impacts were not as strong for women Such gender disparity in program effects is also found in
training programs (Cho et al 2012 Berge et al 2011) In order to capture the heterogeneous
effectiveness by types of beneficiaries we construct mutually non-exclusive indicators for female
youth microcredit clients social assistance beneficiaries business owners individuals with
primary or higher education and individuals in urban areas using information on target population
and the subgroup of estimation Therefore the dummy variable ldquofemalerdquo is equal to one either
14
when the outcome has been estimated for the subsample of female or by definition when the
program is targeted to women
234 Service Providers and Delivery Mode
Whether different delivery modes of service make a difference is of interest as implementation
quality is deemed as important as the design of programs Bali Swain and Varghese (2011)
examine the effects of business training for microcredit clients and compare the effectiveness by
delivery modes Their findings suggest that an NGO linkage model seems to yield better results
than programs organized and delivered by the banks In line with this we group service providers
into government agencies international donor agencies NGOs and community organizers
universities and researchers and microfinance institutes (MFI) and banks It is noted that programs
often rely on multiple service providers and the indicators of service providers are not mutually
exclusive (See Table 3)16 In addition we construct an indicator to identify whether the main
program is delivered by the private sector
3 Standardization and Estimation Strategy
31 Standardization
The effects of the particular interventions that we measure differ across indicators and studies and
need to be standardized for comparability Given that the sign and significance are neutral to the
unit of measurement yet indicate whether the program worked one simple way of standardization
16 When multiple agencies are involved it is usually the case where government agencies are working with NGOs or researchers are collaborating with government agencies or NGOs
15
is to focus on the sign and significance of the outcomes As used in Card et al (2010) and Kluve
(2010) ordinal indicators of positively significant insignificant and negatively significant effects
can be compared across different variables and studies Noting that relatively few observations
have negatively significant effects (about 4 percent of the entire sample) we focus on the indicator
of positively significant outcomes versus non-positive outcomes
The second measure to synthesize the findings across studies is to use a standardized effect
size thereby allowing diverse studies and outcomes to be directly comparable on the same
dimensionless scale While the statistical significance provides an answer for the ldquowhether the
program worked or notrdquo question the effect size provides a measure of ldquohow well did it workrdquo
without confounding the effectiveness of a program with the sample size used in a study Given
that there is a large variation in the sample size of studies used here the standardized effect sizes
would provide a more reliable comparable measure of program success
The true effect size ( ) is the mean difference between the treatment (120583119879) and control
groups (120583119862) as a proportion of the standard deviation(120590)
(1)
The simplest and most intuitive form of its measurement would be based on mean differences in
data called Cohenrsquos g (Cohen 1988) defined as
(2)
where is the mean of the experimental group is the mean of the control group and is
the pooled sample standard deviation using each grouprsquos number of observations ( for treatment
and for control group) and standard deviations ( for treatment and for control group)
θ
TY CY Ps
Tn
Cn Ts Cs
p
CT
sYYg minus
=
σmicromicro
θ CT minus=
16
(3)
The effect size then captures the magnitude of an impact of treatment compared to the
reference group regardless of the unit of measurement Though intuitively simple Cohenrsquos g is a
biased estimator because the pooled standard deviations of the two groups may not capture the
true population value and may produce estimates that are too large especially when the sample size
is small We use the following Hedgersquos d to correct the upward bias17
(4)
Note that d is the ldquoeffect sizerdquo of the intervention that we use throughout the paper
32 Distribution of Program Effectiveness
As mentioned above the positive significance and effect size of interventions are the two statistics
that we focus Table 4 presents summary of the estimated impacts by outcome groups18 A few
stylized facts are observed First the proportion of insignificant estimates is quite high In
particular about 28 percent of the estimates are positively significant while 68 percent
insignificant19 and the average effect size for positively significant outcomes is 0183 Looking
only at estimates on the outcome of labor market activities the average effect size for positively
17 See Cooper and Hedges (1994) for detailed discussion and derivation of Hedgersquos d 18 See Table A2 in Appendix for average effect sizes by intervention types population groups providers regions and country income levels 19 These numbers are calculated at 10 percent statistical significance level which will be our measure of statistical significance from here
)9)(4
31(minus+
minus=CT nn
gd
)1()1()1()1( 22
minus+minusminus+minus
=CT
CCTTp nn
snsns
17
significant impacts is 0192 Compared to the effects of ALMPs on labor market activities in
OECD countries summarized in Card et al (2010) where 39 percent are positively significant 36
percent are insignificant and the average effect size for positively significant outcomes is about
021 the estimates in our study show greater prevalence of insignificant outcomes and slightly
lower effect size among the programs with better results While highlighting the overall difficulty
of promoting entrepreneurship in developing countries this reality again emphasizes the
importance of learning what types of programs work for whom and in which context
Second the success rates (proportion of estimates that is positively significant and whose
effect size is greater than 01) as well as the dominant type of intervention largely vary with the
outcomes of interest We plot our two measures of program success ndash significance and effect size ndash
by types of interventions and outcomes of interest (See Figure 3) The type of intervention based
on its main component is broadly categorized as training financing and combinations of the two
We observe that training is more common than financing in promoting good business practice
which tends to show more successful results but less common in changing attitudes which shows
a lower success rate Obviously these are stylized facts from which it is unclear whether the
differences in performance are due to the different type of intervention or the nature of outcomes
Third stand-alone financing programs are associated with poorer results compared to the
programs with a training component However this may mask heterogeneity among the large
number of microcredit interventions Some programs merely estimate the effects of change in the
rule of the loan including the repayment structure and unit of clients rather than that of the loan
provision20 In such cases the effects can be smaller than other programs comparing the outcomes
20 Such studies include those investigating group versus individual loans or ordinary versus commitment group without a control group that does not have any access to loans (Gine and Karlan 2009 Brune et al 2011) and those evaluating the changes of the rule of the loan (Field et al 2010b Gine and Yang 2009)
18
with and without the loan and therefore whether the program is provided to already existing
microcredit clients needs to be considered
Finally the effect size and t-statistics do not always yield the same conclusion about the
effectiveness of a program as mentioned above although they are highly correlated in all the six
plots We observe some estimates whose effect sizes are large but not significant probably due to
low statistical power and vice versa
33 Estimation Strategy
We now turn to a regression analysis to examine the relationship between program effectiveness ndash
measured by the significance and effect size ndash and characteristics The observable characteristics
of programs are broadly categorized as outcome groups such as labor market activities and
financial behavior design factors such as the types of interventions beneficiaries and service
providers and study characteristics such as an indicator of journal publication The outcome
groups and design factors vary across and within studies whereas study characteristics remain
constant within studies Our main interest would be to infer the impact of design factors on
program effectiveness
Assuming that the program effectiveness (119864) is on average explained by exogenous
observable characteristics the measure 119864 of an individual outcome 119894 of a study 119895 is written as a
linear form as
(5) 119864119894119895 = 120572 + 119883119894119895119900120573119900 + 119883119894119895119889120573119889 + 119883119895119904120573119904 + 120576119894119895
19
where 119883119900 119883119889 and 119883119904contain observable characteristics of outcome groups design features and
study characteristics respectively and 120576119894119895 denotes an error term that is assumed to be independent
from the vector 119883 = 1119883119900 119883119889 119883119904 We use the standard probit and Ordinary Least Squares (OLS)
model to estimate the positive significance and effect size based on equation (5)
However assuming that some studyprogram heterogeneity cannot readily be modelled by
the observable variables we also incorporate the unobservables into our estimation Unobservable
characteristics such as implementation quality (θj) ndash how well the service is delivered to the
beneficiaries ndash may affect program effectiveness even after controlling for the observable duration
and service providers of training for instance Then equation (5) is modified as the following
(6) 119864119894119895 = 120572 + 119883119894119895119900120573119900 + 119883119894119895119889120573119889 + 119883119895119904120573119904 + θj + 119906119894119895
where 119906119894119895 is a white noise independent of 119883 and θj
If unobserved characteristics are deemed to be invariant within each study regardless of the
outcomes a study fixed effect model can be used to estimate the equation (6) For example if the
implementation quality affects all beneficiaries in the same way within the program the study
fixed effect model would remove the effects of unobservable implementation quality capturing
only the differential effects of observable characteristics Meanwhile if θj varies even within a
study as well as across studies and is assumed to be taken by a random draw the effect of θj also
needs to be measured and a random effect model can be used Whether the unobserved part of the
study is fixed or variant is not straightforward a priori We examine the robustness of the results
based on the different models described here
20
4 Results of the Meta Regression Analysis
As discussed in the previous section there are considerable variations in effect sizes across
outcome indicators types of programs and beneficiaries Now we move on to a meta-regression
framework to analyze how differences in the magnitude and significance of estimated impacts are
associated with differences in outcomes variables intervention design and implementation
features country and study characteristics The richness of our database allows us to include in the
model specification many potential determinants of program success apart from outcome category
At the program level covariates include the key variables discussed above such as types of
interventions and beneficiaries and service providers At the study level we look at variables
including the impact evaluation design publication format study sample size and the time interval
between program completion and end-line data collection We begin with a pooled regression that
allows statistical power with a large number of observations and move on to a more disaggregated
analysis that provides more detailed information with reduced statistical power
41 Pooled Regressions
We analyze how the likelihood of yielding positive and significant effects is associated with the
potential determinants of program success The probability of observing significant positive
outcomes can be described by a probit model for the event of a positive significant impact Table
5 presents a series of probit models results to fit the likelihood of a significantly positive program
estimate We examine the main dimensions of program heterogeneity separately (first 4 columns)
21
and simultaneously (5th column) controlling for region country income and study characteristics
throughout all specifications 21
We find that business practice and labor market activity outcomes are more associated with
positively significant impacts than labor income outcomes (omitted category) by 467 and 354
percentage points respectively (column 1) On the other hand the likelihood of yielding a positive
and significant impact is not statistically different among labor income business performance
financial behavior and attitudes outcomes which is consistent with Figure 3 shown above This
suggests that changing business knowledge and practice may be relatively easier than changing
behavior and increasing income at least for the short term22 This finding may be different if the
long term impacts are estimated as knowledge fades away and impacts on labor market outcomes
are materialized
The model in column 2 examines the probability of program success by intervention
types23 We classify programs into lsquoTraining Onlyrsquo lsquoTraining + Counselingrsquo lsquoFinancing Onlyrsquo
lsquoFinancing + Counselingrsquo and lsquoFinancing + Trainingrdquo (omitted group)24 Results show that
differences across interventions in the chances of success are not significant on average although
the sign and magnitude of the coefficients suggest that training combined with counseling is more
promising than the others
A clear pattern emerges when comparing program estimates by population groups (column
3) Program impacts estimated for youth and the urban population are more likely to be positive
and significant than estimates for the general population To the contrary programs for
21 Given the large variation in the number of estimates coded per study (from 2 to 70) we weigh regressions by the inverse of the number of observationsestimates per study in all models to increase the relative weight of under-represented studies 22 End-line surveys for our sample of impact evaluations take place on average 18 months after the completion of the program and about three quarters of estimates are measured within two years 23 Note that we are using ldquoprogram successrdquo for having positively significant impacts at 10 percent level 24 See Appendix Table A3 for the distribution of estimates by types of intervention and outcomes of interest
22
microfinance clients are less likely to yield positive impacts Differences in program results by
gender education enterprise ownership and social assistance dependency are statistically
insignificant It is worth clarifying that the model includes dummy variables for the population
group for which the effect has been estimated it does not necessarily capture whether the program
is targeted to that particular group
Compared to the case of having multiple agencies involved in program delivery (omitted
category) the programs delivered solely by banks or MFIs are less likely to be associated with
program success (column 4) NGOs are associated though weakly with better performance This
finding suggests that programs could work better when delivered by providers that have strong
connections with the beneficiaries and are familiar with local contexts
Column 5 presents a model including all four dimensions of the covariates analyzed in
columns 1-4 That the intermediate outcomes such as business practice are more associated with
program success than the final outcome is actually reinforced in this full model Consistent with
the simpler models youth the higher education group and urban beneficiaries seem to benefit
most from programs supporting entrepreneurship while microcredit clients experience smaller
impacts compared to the general population In addition when controlling for all other
characteristics private sector delivery appears to make a difference in improving programs Again
the differences in the likelihood of positive significance across interventions are not significant on
average This may be because heterogeneous programs are lumped into broad categories When we
regroup intervention type in a more disaggregated manner and repeat the analysis financial
training seems to perform poorly compared to other types of programs25 We will discuss
heterogeneous program effects in more detail in subsequent sections
25 We disaggregate programs as in Table A3 in the Appendix
23
Although not presented in the table basic characteristics including region and study
features are also associated with program success In fact experimental results are generally more
robust than quasi-experimental ones Interestingly whether the study has been published in a
journal is statistically insignificant in explaining program success suggesting that little publication
bias is observed in our sample of studies Programs seem to work better in the longer term The
period between the completion of the program and the end-line survey is positively related to
finding positively significant impacts In general the effectiveness of programs across country
income groups when controlling for the region reveals no statistical differences
Next we examine how well the program works by also looking at the magnitude of
estimated program impacts and investigate whether the results from effect size are consistent with
those of significance (See Table 6) We use linear regression models to fit standardized effect
sizes the OLS random effects (RE) and study fixed effects (FE) model The first and second
columns replicate column 5 in Table 5 at the10 and 5 percent significance level respectively
Columns 3 through 5 present the results from the OLS RE model and study FE model
The results across different models are quite consistent Coefficients from the probit
models seem proportional to those from the linear RE model although significance slightly differs
across specifications (See Figure 4) In terms of FE and RE models it is useful to recall the
assumptions based on which each model is identified Given that the study FE model drops
observations that do not vary within studies and relies on within-study variations for identification
it would be indeed useful in identifying the impacts of design features without compounding
factors if one program has many subcomponents with variations in design features However if
design features do not greatly vary within studies caution is needed in interpreting the FE model
because the results may be drawn from very few estimates Studies tend to measure the effects of
24
an intervention on different subpopulations regarding a series of outcomes Therefore the types of
outcomes and beneficiaries have sufficient within-study variations for identification and the
results are encouragingly consistent with other models However the type of intervention or
service provider tends to be constant within a program except when the study examines the
impacts of differential intervention type or mode of delivery For example the FE result on service
delivered by ldquogovernmentrdquo solely relies on the within-study variation of Bali Swain and Varghesse
(2011) which evaluates different modes of service delivery With this in mind we discuss the RE
linear regression model in further detail using the effect size as the dependent variable in the
following sections
42 Delving Deeper into Training and Financing Programs
In order to better understand which program or program component is associated to greater
success we disaggregate programs into training and financing Table 7 presents results from an RE
model for effect sizes restricting the sample to programs with at least one training component The
three main training components include vocational business and financial training26 Among
these business training is most common and often is provided with vocational or financial
training Counseling services are often added for further guidance and may vary ranging from job
search or business set-up assistance to business consulting and to psycho-social support Of
course financing support is frequently combined with training and provided as a package
26 Different types of training and combinations of interventions are used for different outcomes of interest (See Appendix Table A3) Vocational training such as in Jovenes programs and Uganda NUSAF are used almost exclusively to improve labor market activities and incomes unless combined with financing Business and financial training tend to aim to improve business practices and knowledge as well as business performance When business training is combined with counseling it addresses labor market activities to set up a new business however financial training combined with counseling tends to focus more on business practice and knowledge and performance
25
The duration of training varies widely In general vocational training programs have a
longer span (about 5-6 months) as they cover skills training for certain occupations while business
training shows the shortest duration Although duration is an important dimension of
characterizing the training program it is not always comparable across studies27 Some training
lasts for a longer period with shorter sessions (22 weeks of training for microcredit clients meeting
one time per week for one hour Karlan and Valdiva 2010) others last similar lengths with greater
intensity (6-8 hours of training at a weekly meeting for six months Attanasio et al 2011 and
Almeida and Galasso 2009) and still others consist of a very short session for a shorter period
(two four-hour meetings per week for six weeks Calderon et al 2011)
The first column of Table 7 includes dummies for the different training components and
their combinations with counseling and financial services the second and third add the outcomes
of interest and types of beneficiaries respectively and the fourth model includes all covariates As
in the previous specifications we include study characteristics region and country income
classification dummies in all specifications The combination of business and financial training is
used for the omitted category First results consistently show that vocational training has the best
chance of program success especially when it is complemented with either counseling or
financing services This is consistent with evidence that ldquocomprehensiverdquo models work better
(Fares and Puerto 2009) Second general business training provided as a stand-alone intervention
or in combination with mentoringcounseling seems more effective than financial training28
However adding financing support to business training seems to do little
27 Not all the studies provide information on the duration of training For such cases we contacted authors for data 28 This implication is consistent with the finding from Drexler et al (2011) that a simplified version of training works better than full technical training
26
Duration of training program when considered with the quadratic form shows that the
relationship between the likelihood of success and duration of training is a flat U-shape This
suggests that either intensive short training or substantially extended training would be
appropriate although the optimal length of training may vary by the outcomes of interest and goal
of the programs It is worth noting that regardless of specifications private sector delivery seems
highly correlated with program success Finally the effects of training generally tend to fade as the
period between completion of intervention and end-line survey becomes longer
Now we turn to programs with a financing component (See Table 8) We disaggregate
estimates from financing programs into microcredit and grants as stand-alone programs grants
combined with training microcredit combined with training and financing (either microcredit or
grants) combined with counseling29 The impacts of financing programs seem less heterogeneous
than those of training intervention Cash and in-kind transfers combined with training seem to
yield larger impacts than microcredit No statistical differences are observed comparing
microcredit programs with microcredit combined with training or counseling (omitted category)
Like the case of training private sector delivery has a strong positive association with program
success The interval between the intervention and the end-line survey is much longer for financing
than training and unlike training a longer interval is more associated with higher chances of
success suggesting that it takes time for the use of a loan or grant to emerge as changed outcomes
43 Regressions on Subsample by Outcome Groups
29 Given that only four observations from one study combine microcredit with counseling (information session) without training (De Mel et al 2011) we merge microcredit and grants when combined with counseling
27
Pooling all estimates though providing sufficient power for identification does not allow us to
examine the determinants of program success for each particular outcome of interest if the
determinants differ by the outcomes A particular intervention may be more frequently used and
relevant for one outcome than the other and its effectiveness can also vary by the outcome
measures30 Moreover the effects of covariates on the effect size may be specific to the outcome of
interest For instance youth may benefit more from interventions in improving labor market
outcomes than changing saving behavior Examining the sample according to the six outcome
groups separately would reduce heterogeneity across outcome types and provide specific
information on the outcome of interest With respect to the type of intervention however we focus
on broader grouping to accommodate the reduced number of observations
The overall findings are as follows (See Table A4-A6 in the Appendix) For nearly all
outcomes particularly labor market activities and business performance youth is highly associated
with program success This is largely driven by youth-targeted programs that present strong
impacts such as Ugandarsquos vocational training program (Blattman et al 2012) and Tunisiarsquos
business training for college graduates (Premand et al 2011) To the contrary women are not
associated with any large and significant impacts other than the outcome of attitudes indicating
that entrepreneurship programs seem useful for female empowerment but may not be sufficient to
address various barriers faced by women Existing entrepreneurs also seem to benefit from the
programs in improving their business knowledge and practice but this is indeed negatively
associated with business performance This is in line with the finding from a recent study Karlan
30 Recall the distribution of intervention type by outcome classification (See Appendix Table A3) Vocational training is commonly used to improve labor market activities and income but rarely for business outcomes unless combined with financing Business and financial training tend to focus more on financial behavior and business outcomes but often are addressed to labor market activities combined with counseling While microfinance is widely used to improve all the outcomes considered here it is more directed to labor market outcomes when combined with counseling
28
et al (2012) that microenterprise development intervention acted as a catalyzer to adopt good
business practice in the short run but led to little changes in performance
When it comes to intervention type as discussed above a package providing both training
and financing seems to perform better in promoting labor market activities However training
alone can be quite useful to improve business knowledge and practice and financing alone does
well in enhancing business performance by releasing credit constraints This suggests that more
customized interventions can enhance cost effectiveness depending on the outcomes of interest and
the constraints In the next two sections we investigate the heterogeneous effects of each
intervention by target group for different outcomes focusing on labor and business outcomes
431 Labor Market Outcomes
Table 9 presents the results from random effects models of effect sizes estimated on the labor
market activities and income in Panel A and B respectively In each panel the first row shows the
overall effects of each intervention that is relevant for labor market outcomes training
combination of training and financing and financing The subsequent rows present the
heterogeneous impacts of each intervention along the types of beneficiaries obtained from
regressions that include interactions between intervention and each variable in the first column
As mentioned a package approach is found to be more effective to improve labor market
activities on average but the extent varies by the type of beneficiary This finding is strongest for
youth and social assistance beneficiaries but does not hold among women For women the impacts
from microcredit interventions such as the expansion of access to loans for rural households in
Mongolia (Attanasio et al 2012) seem higher than training programs Women are generally more
severely credit constrained and this in turn can hamper their potential gains from skills training as
29
observed in Malawirsquos apprenticeship training program31 Financing support indeed performs better
for women throughout all outcomes Meanwhile for business owners gaining access to finance
does little to increase their activities than receiving business training
Panel B presents the results of heterogeneity analysis on labor market income Unlike labor
market activities with respect to improving labor earnings and profits there are no significant
differences across intervention types Training seems to have greater impacts especially for the
higher education group in increasing their income although this was less evident in the case for
labor market activities Examples of business training interventions that work well for educated
group are in Tunisia and Bosnia and Herzegovina (Premand et al 2011 Bruhn and Zia 2011) A
package approach to provide both training and financing seems to be a promising graduation
strategy for social assistance beneficiaries as it increases both labor market activities and income
Finally we now consider both significance and effect size to learn from the characteristics
of successful and unsuccessful programs As seen in Figure 3 we focus on successful programs
that yield outcomes with positive significance at 10 percent statistical level and effect size greater
than 01 and unsuccessful ones with t-statistics and effect size smaller than 0 It is noticed that
vocational training in Colombia Nicaragua and Uganda consistently yields more successful
outcomes than unsuccessful ones All three of these programs target disadvantaged populations to
promote employment through skills development To the contrary the outcomes from microcredit
are more heterogeneous Expansion of access to credit in Bosnia and Herzegovina and the
Philippines presents modest performance with more of their estimates positioning in the successful
category while experiences in India and Mongolia do not appear to be as strong Programs
targeting social assistance beneficiaries from Argentinarsquos Jefes and Chilersquos Solidario contribute
31 See Cho et al (2012) that find a large gender disparity in participation experiences and outcomes from an apprenticeship training program
30
more to unsuccessful outcomes than successful ones suggesting that helping the poor exit from
social assistance programs by promoting self-employment is a challenging task
432 Business and Behavioral Outcomes
We now move onto business outcomes such as business knowledge and practice and business
performance which are important intermediate outcomes that may lead to successful business and
increased income (See Table 9)32 We again look into training financing and the combination of
the two33 Panel A suggests that business training alone can be quite effective in improving
business knowledge and practice This is particularly true for those who already have their own
businesses For women however training does little but financing matters in changing their
business practice suggesting that women may not be the decision maker in business practice
unless they have capital under their control
With respect to business performance (Panel B) financing seems to be the most relevant
and effective intervention Recall that business performance is captured by measures such as sales
inventories number of paid employees and business expenses Thus access to credit probably
plays a greater role in improving business performance than training That being said training
alone is strongly associated with business performance of youth and higher education individuals
especially in the studies where business training was provided for these entrepreneurs (Bruhn and
Zia 2011 for business training targeted to young entrepreneurs in Bosnia and Herzegovina
Drexler et al 2011 for business training for microenterprise owners in Dominican Republic)
32 Full results of regression are presented in Table A5 in the Appendix 33 Unlike the above case of labor outcomes when it comes to business outcomes most of training observations are from business training intervention
31
suggesting that a more efficient use of resources can achieve outcomes as effectively when
targeted to these groups of entrepreneurs
In the same manner as above we consider which programs yield successful and
unsuccessful outcomes As discussed above many training programs result in improved business
knowledge and practice but are unsuccessful when it comes to business performance Such
examples include business training with the lottery of winning larger amount of loans provided to
microcredit clients in Pakistan (Gine and Mansuri 2011) and training for microenterprise owners
in the Dominican Republic (Drexler et al 2011)
5 Conclusion and Discussion
Entrepreneurship programs will continue to constitute an important policy tool in the developing
world as long as self-employment exists as a critical alternative for rationed wage employment A
fundamental question is then which interventions and combinations of programs are more effective
in enabling the poor to start up and grow their own business As this will depend on the types of
skills (business technical ldquosoft skillsrdquo) and capital (cash in-kind credit) constraints which vary
by individuals we began this study by asking ldquowhich type of intervention is more effective for
whom and for which outcomesrdquo In order to answer this we collected information on program
effects from rigorously evaluated studies around developing countries and compiled a large and
rich data set with program details We examined the impact of interventions promoting
entrepreneurial activities on a variety of outcomes such as labor market activities and income as
well as on business practice and performance We also examined attitudes and financial behavior
outcomes Given the specificity of each program we considered the design and implementation
32
features of each program the context and policy environment of each country and finally the
study characteristics potentially affecting the estimates of outcomes
Our meta analysis suggests a number of important implications Combinations of different
intervention types matter for different beneficiaries under different contexts With respect to
training programs it seems that vocational and business training work better than financial
training and can be further improved by combining financing support or counseling Business
training for entrepreneurs in particular appears to be a relatively cost-effective way of promoting
business performance and growth with a short intervention period although improved knowledge
and practice through training does not always materialize as increased income In terms of
financing there are little variations in effectiveness of cash in-kind grants and microcredit
Investigating the effects of programs separately by outcome group suggests that programs
need to be customized for each outcome of interest addressing the specific constraints relevant for
the outcome We find that a package promoting skills with financing support seems to have larger
impacts on labor market activity However training alone can be quite useful to improve business
knowledge and practice and financing alone does well in enhancing business performance by
releasing credit constraints For women the largest effects come from providing access to credit
suggesting that access to credit may have been the largest constraint to women in their earning
opportunities Overall involving the private sector for the delivery of programs and evaluating the
program in the longer term appear to be more closely associated with improved effects of
programs
Our results have important policy implications First programs promoting self-employment
opportunities and small-scale entrepreneurship can lead to increases in labor market outcomes with
important welfare gains Second providing relevant combinations of skills capital and counseling
33
support based on the target grouprsquos main constraints is important to achieve better results Third
among widely heterogeneous effects it is noteworthy that the impacts on both labor market and
business outcomes are significantly higher for youth This is especially relevant in many parts of
the developing world that are facing the lsquoyouth bulgersquo and aspiring to provide meaningful
opportunities to their young populations
References
Abraham R F Kast and D Pomeranz (2011) ldquoInsurance through Savings Accounts Evidence
from a Randomized Field Experiment among Low-Income Micro-Entrepreneurs in Chilerdquo
mimeo Harvard University
Almeida R and E Galasso (2009) ldquoJump-starting Self-employment Evidence for Welfare
Participants in Argentinardquo World Development 38(5)
Attanasio O B Augsburg R de Haas E Fitzsimons and H Harmgart (2012) Group Lending
or Individual Lending Evidence from a Randomized Field Experiment in Mongolia
mimeo London European Bank for Reconstruction and Development
Attanasio O A Kugler and C Meghir (2011) Subsidizing Vocational Training for
Disadvantaged Youth in Developing Countries Evidence from a Randomized Trial
American Economic Journal Applied Economics 3188-220
Augsburg B R de Haas H Harmgart and C Meghir (2012) Microfinance at the Margin
Experimental Evidence from Bosnia and Herzegovina mimeo London European Bank
for Reconstruction and Development
Ayyagari M A Demirguumlccedil-Kunt and V Maksimovic (2011) ldquoYoung vs Small Firms across the
World Contribution to Employment Job Creation and Growthrdquo World Bank Policy
Research Working Paper No 5631 Washington DC World Bank
Bali Swain R and A Varghese (2011) Delivery ldquoMechanisms and Impact of Microfinance
Training in Indian Self Help Grouprdquo Journal of International Development
Bandiera O R Burgess S Gulesci I Rasul and M Sulaiman (2012a) ldquoCan Entrepreneurship
Programs Transform the Economic Lives of the Poorrdquo mimeo London London School of
Economics
Bandiera O R Burgess S Gulesci I Rasul M Goldstein and M Sulaiman (2012b)
ldquoParticipating in Adolescent Training Programs New Evidence from Ugandardquo mimeo
London London School of Economics
Banerjee A E Duflo R Glennerster and C Kinnan (2009) ldquoThe Miracle of Microfiance An
Evidence from Randomized Evaluationrdquo mimeo Cambridge Mass Massachusetts
Institute of Technology
Banerjee A and E Duflo (2008) Do Firms Want to Borrow More Testing Credit Constraints
Using a Directed Lending Program mimeo Cambridge Mass Massachusetts Institute of
Technology
Banerjee A and A Newman (1993) ldquoOccupational Choice and the Process of Developmentrdquo
Journal of Political Economy 101(2)274-98
Berge L I Oppedal K Bjorvatn and B Tungodden (2011) ldquoHuman and Financial Capital for
Microenterprise Development Evidence from a Field and Lab Experiment mimeo
Continuous Mortality InvestigationWorking Paper Bergen The Actuaries
Bjorvatn K and B Tungodden (2010) ldquoTeaching Business in Tanzania Evaluating Participation
and Performancerdquo Journal of the European Economic Association 8 (2-3)
Blattman C N Fiala and S Martinez (2012) Can Employment Programs Reduce Poverty and
Social Stability Experimental Evidence from Uganda Aid Program mimeo Washington
DC World Bank
Bloom N B Eifert A Mahajan D McKenzie and J Roberts (2012) ldquoDoes Management
Matter Evidence from Indiardquo presented at the NBER Summer Institute Cambridge
Massachusetts
Bruhn M and B Zia (2011) ldquoStimulating Managerial Capital in Emerging Markets The Impact
of Business and Financial Literacy for Young Entrepreneursrdquo World Bank Policy Research
Working Paper No 5642 Washington DC
Brune L X Gine J Goldberg and D Yang (YEAR) ldquoCommitments to Save A Field
Experiment in Rural Malawirdquo World Bank Policy Research Working Paper No 5748
Washington DC
Calderon G J Cunha and G de Giorgi (2011) ldquoBusiness Literacy and Development Evidence
from a Randomized Trial in Rural Mexicordquo mimeo Palo Alto Calif Stanford University
Card D P Ibarraran F Regalia D Rosas-Shady and Y Soares (2011) ldquoThe Labor Market
Impacts of Youth Training in the Dominican Republicrdquo Journal of Labor Economics
29(2)
Card D J Kluve and A Weber (2010) ldquoActive Labour Market Policy Evaluations A Meta-
Analysisrdquo Economic Journal 120F452-F477
Card D and A Kruger (1995) ldquoTime Series Minimum-Wage Studies A Meta-analysisrdquo
American Economic Review 85(2)238-43
Carneiro P E Galasso and R Ginja (2009) ldquoThe Impact of Providing Psycho-Social Support to
Indigenous Families and Increasing their Access to Social Services Evaluating Chile
Solidario Mimeo Washington DC World Bank
Casey C R Glennerster and E Miguel (2011) Reshaping Institutions Evidence on External Aid
and Local Collective Action NBER Working Paper No 17012 Cambridge Mass
National Bureau of Economic Research
Cho Y D Kolomba M Mobarak and V Orzco (2012) ldquoDifferential Effects of Vocational
Training on Men and Women and the Bias from Program Drop-outsrdquo mimeo Washington
DC World Bank
Ciavarella M A Buchholtz C Riordan R Gatewood and G Stokes (2004) ldquoThe Big Five and
Venture Survival Is there a linkagerdquo Journal of Business Venturing 19465-83
Cohen J (1988) Statistical Power Analysis for the Behavioral Sciences (2nd ed) Hillsdale NJ Erlbaum
Cole S and G Kartini Shastry (2009) ldquoSmart Money The Effects of Education Cognitive
Ability and Financial Literacy on Financial Market Participationrdquo Harvard Business
School Working Paper No 09-071 Cambridge Mass Harvard University
Cole S A Sampson and B Zia 2010 Prices or Knowledge What Drives Demand for Financial
Services in Emerging Markets Harvard Business School Finance Working Paper Series
October Cambridge Mass Harvard University
Cooper H and L Hedges (1994) The Handbook of Research Synthesis New York Russell Sage
Foundation
Crant J (1996) ldquoThe Proactive Personality Scale as a Predictor of Entrepreneurial Intentionsrdquo
Journal of Small Business Management 34(3)42-49
Crepon B F Devoto E Duflo and W Pariente (2011) ldquoImpact of Microcredit in Rural Areas of
Morocco Evidence from a Randomized Evaluationrdquo mimeo Paris Abdul Latif Jameel
Poverty Action Lab (J-PAL) Europe
De Mel S D McKenzie and C Woodruff (2012) Business Training and Female Enterprise
Start-up Growth and Dynamics Experimental Evidence from Sri Lanka mimeo
Washington DC World Bank
De Mel S D McKenzie and C Woodruff (2010) ldquoWage Subsidies for Microenterprisesrdquo
American Economic Review Papers and Proceedings 100 (2)614-18
De Mel S D McKenzie and C Woodruff (2008a) ldquoAre Women More Credit Constrained
Experimental Evidence on Gender and Microenterprise Returnsrdquo American Economic
Journal Applied Economics 1(3)1-32
De Mel S D McKenzie and C Woodruff (2008b) Who are the Microenterprise Owners
Evidence from Sri Lanka on Tokman v de Soto Bureau for Research in Economic
Analysis of Development (BREAD) Working Paper No 174 Durham North Carolina
Duke University
De Mel S D McKenzie and C Woodruff (2008c) ldquoReturns to Capital Results from a
Randomized Experimentrdquo Quarterly Journal of Economics 123(4)1329-72
Drexler A G Fischer and A Schoar (2011) ldquoKeeping it Simple Financial Literacy and Rules of
Thumbrdquo mimeo Cambridge Mass Abdul Latif Jameel Poverty Action Lab (J-PAL) at
MIT
Fafchamps M D McKenzie S Quinn and C Woodruff (2011) ldquoWhen Is Capital Enough to Get
Female Microenterprises Growing Evidence from a Randomized Experiment in Ghanardquo
NBER Working Paper No 17207 Cambridge Mass National Bureau of Economic
Research
Fares J and O Puerto (2009) ldquoToward Comprehensive Trainingrdquo Social Protection Discussion
Paper No 0924 Washington DC World Bank
Field E S Jayachandran and R Pande (2010a) ldquoDo Traditional Institutions Constrain Female
Entrepreneurship A Field Experiment on Business Training in Indiardquo American Economic
Review Papers amp Proceedings 100(2)125-29
Field E R Pande J Papp and N Rigol (2010b) ldquoTerm Structure of Debt and Entrepreneurial
Behavior Experimental Evidence from Microfinancerdquo mimeo
Gine X and G Mansuri (2011) Money or Ideas A Field Experiment on Constraints to
Entrepreneurship in Rural Pakistan mimeo Washington DC World Bank
Gine X and D Karlan (2009) ldquoGroup versus Individual Liability Long Term Evidence from
Philippine Microcredit Lending Grouprdquo mimeo New Haven Conn Yale University
Gine X and D Yang (2009) ldquoInsurance Credit and Technology Adoption Field Experimental
Evidence from Malawirdquo Journal of Development Economics 891-11
Gindling T H and DL Newhouse (2012) ldquoSelf-Employment in the Developing Worldrdquo World
Bank Policy Research Working Paper No 6201
Haltiwanger J R Jarmin and J Miranda (2010) ldquoWho Creates Jobs Small vs Large vs
Youngrdquo NBER Working Paper No 16300 Cambridge Mass National Bureau of
Economic Research
Jarrell S and T Stanley (1990) ldquoA Meta-Analysis of the Union-Nonunion Wage Gaprdquo Industrial
and Labor Relations Review 44(1)54-67
Karlan D R Knight and C Udry (2012) ldquoHoping to Win Expected to Lose Theory and
Lessons on Micro Enterprise Developmentrdquo mimeo New Haven Conn Yale University
Karlan D and M Valdivia (2011) ldquoTeaching Entrepreneurship Impact of Business Training on
Microfinance Clients and Institutionsrdquo The Review of Economics and Statistics 93(2)510-
527
Karlan D and J Zinman (2011) Microcredit in Theory and Practice Using Randomized Credit
Scoring for Impact Evaluation Science 332(6035) 1278-1284
Karlan D and J Zinman (2010) ldquoExpanding Credit Access Using Randomized Supply Decisions
to Estimate the Impactsrdquo Review of Financial Studies 23(1)
Klinger B and M Schundlen (2007) Can Entrepreneurial Activity Be Taught Quasi
Experimental Evidence from Central America mimeo Cambridge Mass Harvard
University
Kluve J (2010) The Effectiveness of European Active Labor Market Programs Labour
Economics 17904-18
McKenzie D and C Woodruff (2013) What Are We Learning from Business Training and
Entrepreneurship Evaluations around the Developing World mimeo Coventry England
University of Warwick
Macours K P Premand and R Vakis (2012) Transfers Diversification and Household Risk
Strategies Experimental Evidence with Lessons for Climate Change Adaptation Policy
Research Working Paper Series No 6053 Washington DC World Bank
Mano Y A Iddrisu Y Yoshino and T Sonobe (2011) How Can Micro and Small Enterprises
in Sub-Saharan Africa Become More Productive The Impacts of Experimental Basic
Managerial Training Washington DC World Bank
Ooseterbeek H M van Praag and A Ijsselstein (2010) ldquoThe Impact of Entrepreneurship
Education on Entrepreneurship Skills and Motivationrdquo European Economic Review 54 (3)
Pitt M S Khandker and J Cartwright (2003) ldquoDoes Micro-Credit Empower Women Evidence
from Bangladeshrdquo Policy Research Working Paper Series No 2998 Washington DC
World Bank
Premand P S Brodmann R Almeida R Grun and M Barouni (2011) ldquoEntrepreneurship
Training and Self Employment among University Graduates Evidence from a Randomized
Trial in Tunisiardquo Policy Research Working Paper Series No 6285 Washington DC World
Bank
Stanley T (2001) Wheat from Chaff Meta-Analysis as Quantitative Literature Review
Journal of Economic Perspectives 15(3)131-150
Stanley T and S Jarrell (1998) Wage Discrimination Bias A Meta-Regression Analysis
Journal of Human Resources 33(4)947-73
Table 1 Distribution and Definitions of the Outcomes of Interest
Outcomes of interest Definitions Frequency1 Labor market activities 242 [217]
Business set up and expansion Binary indicator of business setup or exansionEmployment (self employment) Binary indicator of employment status or employment ratesHours of work Hours of work in labor market or businessUnemployment Binary indicator of unemployment statusBusiness closing Binary indicator of business closing
2 Labor market income 309 [277]Household income Household income from various sourcesHousehold assets Household assets (durable and nondurable)Profits (from household business) Profits from businessEarnings Salary and payment for laborConsumptions Household expenditureconsumption on durablenon-
durable goods
3 Financial behavior 126 [113]Having a loan (formal informal) Binary indicator of having a (formalinformal) loanHaving an insurance or savings Binary indicator of having insurance scheme or savingAmount of loansaving changed Amount of loansavings
4 Business knowledge and practice 155 [139]Business knowledge General business knowledge including the abilities to
calculate profits manage stocks and make investmentInnovation Binary indicator of adopting new technology or developing
new productAccess to network Binary indicator of having an access to the network of
individuals with businesses or marketAccounting practice Binary indicator of book and record keeping and separation
of individual and business accounts
5 Business performance 184 [165]Business expenses Amount of business expenses (inventory salary etc)Sales from the business Size of the salesNumber of employees The number of (paidunpaid) employeesCapital and investment Size of stocks investment and inventories
6 Attitudes 100 [90]Attitude torward business Attitude toward entrepreneurial activities and traitsConfidence and optimism Changes in confidence or positivity toward labor market
prospect and futureRisk and time preference Risk taking attitude and discount rate of future benefitsDecision making and reservation wage
Changes in decision making process and reservation wage
Notes The frequency indicates the number of observations of each outcome category The proportions of each category are specified in the brackets
Table 2 Distribution and Definitions of the Interventions of Interest
Outcomes of Interventions Definitions Frequency1 Training 458 [410]
Vocational training (In-class or apprenticeship) training on various professionsLifeskills training Usually in-class training for problem solving and critical
thinkingBusiness training General knowledge on business management including
customer relations inventory and financial management and marketing
Financial training Specific knowledge on accounting and inter-temporal decision making on investment
2 Financing 742 [665]Cash grant Cash transfer for businessIn-kind grant Transfer in the form of tools goods and equipmentMicrocredit Loan for business for future repaymentSavings Access to saving arrangement
3 Counseling 238 [213]Mentoring in business Follow up advice in the process of business operationArrangements for on-the-job advice
Guidance provided on-the-job
Notes Counseling is added to either training or financing it is never a stand-alone intervention In many cases training and financing are provided in combination The frequency column specifies the number and proportion of observations that estimate the effect of each intervention Due to the combinations of interventions the proportions do not sum up to 100
Table 3 Sample Characteristics by Region
All sample AFR EAP ECA LAC MENA SARTotal number of estimates 1116 185 119 180 318 96 218Type of intervention ( )Training only 223 216 67 211 377 - 197Training+Counseling 112 - - - 208 615 -Financing only 501 584 933 789 91 385 606Financing+Counseling 89 - - - 299 - 18Training+Financing 63 168 - - - - 179
Outcome Groups ( )LM Activity 217 103 202 367 292 313 46
LM Income 277 227 353 217 318 198 303
Financial Behavior 115 205 294 100 28 42 110
Business Knowledge and Practice 139 108 - 111 164 167 216
Business Performance 165 200 101 167 167 115 188
Attitudes 90 157 67 39 31 167 138
Population Groups ( )Female 263 270 748 67 157 115 372
Youth 146 114 - 278 104 615 -
High Education 168 86 218 200 129 615 41
SA beneficiaries 143 114 - - 437 - -
Entrepreneurs 346 503 261 267 453 83 284
Microcredit clients 273 243 34 211 349 - 491
Urban 439 768 176 211 525 615 289
Providers ( )Government agencies 214 119 - - 491 615 09NGOs and community organizers 352 157 790 - 569 - 408
Universitiesresearchers 207 389 176 - 22 615 330
MFIs or banks 565 497 1000 1000 349 385 417Notes Type of interventions and outcomes include mutually exclusive categories while the type of beneficiaries and providers of the programs are not defined in a mutually exclusive way The categories of beneficiaries can overalp and the programs are often delivered by multiple agencies
Table 4 Summary of Estimated Impacts by Outcome
Outcomes LM Activity LM IncomeFinancial Behavior
Business Practice
Business Performance Attitudes Total
Significance at 10negative 25 32 95 52 43 30 42insignificant 682 728 675 548 712 630 676positive 293 239 230 400 245 340 282Significance at 5negative 17 23 79 19 27 20 28insignificant 760 780 746 665 804 730 755positive 223 197 175 316 168 250 217
Effect SizeOverall average 0065 0036 0034 0106 0044 0090 0058Average among positvely signicant at 10
0181 0136 0204 0254 0154 0180 0183
Average among positvely signicant at 5
0192 0147 0224 0283 0173 0200 0200
Table 5 Probit Model Regressions for Positively Significant Impacts
(1) (2) (3) (4) (5)MESE MESE MESE MESE MESE
LM activities 0354 0228(0171) (0173)
Business practice 0467 0756(0185) (0217)
Business performance -0024 0143(0169) (0192)
Financial behavior 0009 0302(0165) (0185)
Attitudes 0111 0283(0160) (0197)
Training only -0042 0343(0298) (0367)
Training+counseling 0336 -0419(0451) (0437)
Financing only -0094 0182(0283) (0400)
Financing+counseling -0357 0329(0366) (0348)
Female -0102 -0176(0199) (0239)
Youth 0567 0676(0126) (0202)
High education 0177 0270(0115) (0130)
Microenterprise owners -0044 -0123(0106) (0155)
Social assistance beneficiaries 0210 0253(0222) (0384)
Microfinance clients -0507 -1161(0136) (0306)
Urban 0294 0392(0119) (0221)
Government only -0256 -0092(0359) (0224)
NGOs only 0057 -0158(0300) (0279)
Universities only -0439 -0146(0286) (0269)
MFI or banks only -0425 -0372(0213) (0225)
Private sector delivery -0054 0467(0241) (0283)
Number of observations 1097 1097 1097 1097 1097
Adjusted R2 0099 0091 0124 0097 0155
note plt001 plt005 plt01
Dependent Variable=Indicator of Positively Significant Impact at 10
All specifications include study characteristics (period between the completion of intervention and estimation journal publication experimental design and the square root of number of observations) region and income dummies which are not reported here Column (1) specifies only with outcomes of interest (2) with the types of intervention (3) with the type of beneficiaries (4) with the type of delivering agencieis and (5) with all of above Omitte categories include labor income (type of outcomes) Training+Financing (type of intervention) and multiple providers (program providers)
Marginal effects (ME) are reported Standard errors (SE) are clustered by study id and reported in parenthesis Regressions are weighted by the inverse of the number of estimates per study in the database
Table 6 Comparisons of Different Models
Probit (10 ) Probit (5 ) OLS Random Effects
Fixed Effects
(1) (2) (3) (4) (5)mese mese coefse coefse coefse
LM activities 0228 0190 -0007 0004 -0013(0173) (0156) (0021) (0020) (0022)
Business practice 0756 0556 0074 0082 0070(0217) (0284) (0037) (0040) (0039)
Business performance 0143 -0012 0002 0012 0009(0192) (0222) (0019) (0022) (0019)
Financial behavior 0302 0146 -0007 -0002 0017(0185) (0200) (0019) (0020) (0024)
Attitude and traits 0283 0073 0020 0035 0032(0197) (0228) (0022) (0024) (0023)
Training only 0343 0523 0033 0029 -0004(0367) (0380) (0028) (0022) (0021)
Training+counseling -0419 -0095 0053 0016 -0045(0437) (0445) (0043) (0033) (0021)
Financing only 0182 0474 0025 0037 0028(0400) (0453) (0033) (0026) (0023)
Financing+counseling 0329 -0007 0003 0021 -(0348) (0390) (0034) (0036)
Female -0176 -0251 0002 -0001 0003(0239) (0279) (0019) (0017) (0031)
Youth 0676 0721 0051 0070 0060(0202) (0234) (0022) (0017) (0026)
High education 0270 0218 0039 0028 0025(0130) (0235) (0013) (0012) (0011)
Microenterprise owners -0123 -0090 -0000 -0007 -0002(0155) (0149) (0014) (0012) (0011)
Social assistance beneficiaries 0253 0514 0022 -0047 -(0384) (0474) (0043) (0042)
Urban -1161 -0707 -0041 -0042 -0004(0306) (0328) (0021) (0022) (0006)
Microfinance clients 0392 0598 -0019 -0023 -(0221) (0234) (0022) (0019)
Government only -0092 -1047 -0019 -0000 -0096(0224) (0208) (0030) (0029) (0009)
NGOs only -0158 0184 -0016 -0034 -0046(0279) (0316) (0021) (0019) (0000)
Universities only -0146 -0191 -0006 -0049 -(0269) (0279) (0035) (0033)
MFI or banks only -0372 -0117 -0004 -0023 -0155(0225) (0212) (0033) (0029) (0019)
Private sector delivery 0467 -0106 0017 -0005 0018(0283) (0309) (0028) (0027) (0009)
Number of observations 1097 1097 1097 1097 1097Adjusted R2 0155 0166 0155 0175 0029
Dependent variable in columns 1(2) is a dummy for positive significance of estimates at 10 (5) Dependent variable in column 3-5 is the estimated effect sizeStandard errors are clustered by study id and reported in parenthesisAll specifications include study characteristics (period between the completion of intervention and estimation journal publication experimental design and the square root of number of observations) region and income dummies which are not reported here
note plt001 plt005 plt01
Table 7 Random Effect Models for Effect Sizes of Estimates Training
(1) (2) (3) (4)coefse coefse coefse coese
Business training only 0077 0061 0028 0025(0031) (0025) (0008) (0008)
Business training+Counseling 0214 0214 0228 0236(0096) (0080) (0076) (0075)
Business training+Financing 0073 0035 -0010 -0027(0040) (0048) (0025) (0035)
Vocational training only 0217 0198 0254 0244(0124) (0098) (0073) (0059)
Vocational training+Counseling 0202 0251 0509 0517(0057) (0062) (0141) (0120)
Vocational training+Financing 0125 0125 0501 0438(0077) (0071) (0076) (0086)
Financial training only -0003 -0012 -0051 -0053(0035) (0029) (0009) (0008)
Financial training+Counseling -0033 -0038 -0051 -0050(0033) (0029) (0016) (0017)
Duration of training 0007 0007 -0036 -0027(0013) (0011) (0007) (0008)
Duration squared -0001 -0001 0000 0000(0000) (0000) (0000) (0000)
Private sector delivery 0150 0129 0081 0077(0071) (0054) (0019) (0019)
Months since completion100 0204 0014 -0089 -0211(0221) (0383) (0298) (0390)
Outcomes of interest No Yes No YesType of beneficiaries No No Yes YesNumber of observations 439 439 439 439note plt001 plt005 plt01Standard errors are clustered by study id and reported in parenthesis Dependent variable is the effect sizeThe omitted category of training is Business + financial training combinedAll specifications include dummies for study characteristics (journal publication experimental design and the square root of study sample) region and country income dummies which are not reported here
Table 8 Random Effect Models for Effect Sizes of Estimates Financing
(1) (2) (3) (4)coefse coefse coefse coefse
Grant only 0015 -0009 0014 -0010(0027) (0030) (0023) (0028)
Grant + Training 0068 0053 0063 0053(0055) (0052) (0036) (0034)
Microcredit only -0001 -0015 0013 0001(0021) (0020) (0016) (0016)
Microcredit + Training -0004 -0017 -0003 -0020(0022) (0021) (0019) (0019)
Private sector delivery 0058 0053 0071 0064(0017) (0020) (0017) (0019)
Months since completion100 0227 0214 0170 0148(0039) (0040) (0033) (0041)
Outcomes of interest No Yes No YesType of beneficiaries No No Yes YesNumber of observations 734 734 734 734note plt001 plt005 plt01
All specifications include dummies for study characteristics (journal publication experimental design and the square root of study sample) region and country income dummies which are not reported here
Standard errors are clustered by study id and reported in parenthesis Dependent variable is the effect size The omitted category of financing is Microcreditgrants +Counseling
Table 9 Random Effect Regression Model for Labor Market Outcomes
A LM Activity Training Only Training+Financing Financing only1 Overall -0050 0184 Omitted Variable
(0002) (0025)2 Type of beneficiaries
Female -0018 -0106 0023(0048) (0000) (0011)
Youth 0006 0208 0066(0004) (0024) (0014)
High Education 0028 - -0002(0080) (0007)
SA beneficiaries -0043 0169 -0013(0041) (0060) (0046)
Entrepreneurs -0002 - -0016(0034) (0004)
Microcredit clients -0074 - -0001(0033) (0085)
Urban -0014 - 0010(0062) (0004)
Num of observation
B LM Income Training Only Training+Financing Financing only1 Overall -0031 -0021 Omitted Variable
(0031) (0018)2 Type of beneficiaries
Female -0007 -0114 -0019(0038) (0021) (0032)
Youth 0047 0108 -0009(0043) (0050) (0012)
High Education 0269 - 0029(0061) (0013)
SA beneficiaries -0073 0078 0027(0047) (0028) (0046)
Entrepreneurs -0002 -0049 -0018(0074) (0049) (0024)
Microcredit clients 0038 -0052 0010(0040) (0040) (0035)
Urban 0086 -0016 0031(0035) (0028) (0021)
Num of observation
Standard errors are clustered by study idnote plt001 plt005 plt01
Type of Beneficiaries Interacted with
Type of Beneficiaries Interacted with
309
All specifications include study characteristics (period between the completion of intervention and estimation journal publication experimental design and the square root of number of observations) region and income dummies which are not reported here
Table 10 Random Effect Regression Model for Business Outcomes
A Business practice Training only Training+Financing Financing only1 Overall 0075 0012 Omitted
(0041) (0012) category2 Type of beneficiaries
Female -0112 -0257 0335(0057) (0000) (0000)
Youth 0467 0104 -(0298) (0084)
High Education 0011 - -(0019)
SA beneficiaries - -0363 -(0226)
Entrepreneurs 0084 -1069 -(0039) (0525)
Microcredit clients 0037 0400 -0739(0093) (0318) (0288)
Urban 1037 -0115 -(0550) (0110)
Num of observation
B Business performance Training only Training+Financing Financing only1 Overall -0075 -0142 Omitted
(0024) (0032) category2 Type of beneficiaries
Female -0001 -0140 -0042(0022) (0000) (0049)
Youth 0155 0044 -(0027) (0037)
High Education 0049 - -0046(0005) (0026)
SA beneficiaries - -0111 -(0056)
Entrepreneurs 0081 0024 -0031(0047) (0064) (0017)
Microcredit clients -0079 0100 0013(0032) (0055) (0055)
Urban -0058 0007 -0092(0037) (0036) (0027)
Num of observationnote plt001 plt005 plt01
All specifications include study characteristics (period between the completion of intervention and estimation journal publication experimental design and the square root of number of observations) region and income dummies which are not reported here
Interacted with
Interacted with155
184
Standard errors are clustered by study id
Figure 1 Distribution of Estimates Region and Income
Figure 2 Proportion of Estimates by Intervention Type
Figure 3 Significance and Effect Size by Types of Intervention and Outcome
-40
48
12t-
valu
e
-6 -4 -2 0 2 4 6 8effect size
Labor Activities
-40
48
12t-
valu
e
-6 -4 -2 0 2 4 6 8effect size
Labor Income-4
04
812
t-va
lue
-6 -4 -2 0 2 4 6 8effect size
Business Practice
-40
48
12t-
valu
e
-6 -4 -2 0 2 4 6 8effect size
Business Performance
-40
48
12t-
valu
e
-6 -4 -2 0 2 4 6 8effect size
training financing combined
Financial Behavior
-40
48
12t-
valu
e
-6 -4 -2 0 2 4 6 8effect size
training financing combined
Attitudes
Figure 4 Comparison of Probit and Random Effects Models
-15
-1-5
05
1C
oeffi
cien
ts fr
om P
robi
t Mod
el o
f Effe
ct S
igni
fican
ce
-15 -1 -05 0 05 1Coefficients from Random Effects Model of Effect Size
coef = 55857511 se = 92974551 t = 601
Appendix
Table A1 Studies used for meta analysis and main results
Study id Group country Income region Year Interval (months)
Main intervention Outcomes
Almeida and Galasso (2009)
SA beneficiaries
Argentina Upper middle income
LAC 2005 13 in-kind grants and technical assistance for graduation of Jefes program
LM activities -LM income 0
Attanasio et al (2011)
Youth Colombia Upper middle income
LAC 2006 14 3 month vocational training 3 months on the job training
Female LM outcomes +Male LM outcomes 0
Banerjee and Duflo (2008)
SMEs India Lower middle income
South Asia
2002 24 Policy change that increases an influx of credit on SMEs
Profit sales0
Banerjee et al (2010)
Women India Lower middle income
South Asia
2008 22 Expansion of microfinance institute
Business setup profits +
Bali Swain and Varghese (2011)
Microfinance clients
India Lower middle income
South Asia
2003 36 Comparing different delivery modes of training for microfinance clients Model 1 (bank-formed and financed group) Model 2(NGO formed but bank financed) Model 3(NGO formed and financed)
Income 0Assets +NGO linkage model +
Berge et al (2011) Microfinance clients
Tanzania Low income
Africa 2009 7 Impacts of business training and grants (cash) among PRIDE (microfinance) clients
Knowledge+Sales+Profits + (male)
Bjorvatn and Tungodden (2010)
Microfinance clients
Tanzania Low income
Africa 2009 7 Business training among microcredit clients microenterprise owners
Knowledge+
Blattman et al (2011)
Youth Uganda Low income
Africa 2011 13 Vocational training and toolsmaterials for self emploment
LM activities +Profits +
Brune et al (2011) Small holder farmers
Malawi Low income
Africa 2010 17 Access to bank account ordinary vs commitment group
Profit 0Sales income + (only for commitment group)
Bruhn et al (2011) Young entrepreneurs
Bosnia and Herzegovina
Upper middle income
ECA 2010 7 Business and financial training Profit sales new business practice 0
Carneiro et al (2009)
SA beneficiaries
Chile Upper middle income
LAC 2007 48 Chile Solidario providing psycho-social support as well as transfers
LM activities income 0Optimism +
Calderon et al (2011)
Female entrepreneurs
Mexico Upper middle income
LAC 2010 10 Basic business training Profits revenues number of clients served +
Card et al (2011) Youth Dominican Republic
Upper middle income
LAC 2005 11 Vocational training+internship LM activities 0Earnings when working +
Table A1 (Continued)
Study id Group country Income region Year Interval (months)
Main intervention Outcomes
Cole et al (2010) Unbanked households
Indonesia Lower middle income
EAP 2010 26 Financial literacy training subsidies (small medium high) contingent upon bank account
Bank account+ savings 0(higher effects of incentives than training)
Crepon et al (2011)
Rural households
Morocco Lower middle income
MENA 2009 22 Expansion of MFI (and access to credit)
Business setup 0Income sales +
De Mel et al (2008a)
Microenterprise owners
Sri Lanka Lower middle income
South Asia
2008 39 Cashin-kind transfer Profits + (male)
De Mel et al (2008b)
Microenterprise owners
Sri Lanka Lower middle income
South Asia
2007 26 Small or large cash or in-kind equipment
Profits capital stock + (male)
De Mel et al (2011) Microenterprise owners
Sri Lanka Lower middle income
South Asia
2010 73 Provision of information on loans prodedures of getting the loan (applications requirements of guarantorsetc)
Take up of loan + Profits 0
Drexler et al (2011)
Microenterprise owners
Dominican Republic
Upper middle income
LAC 2008 13 Compare the impacts of full version of financial training simplified version of training and on-site visits for counseling
Business practice + (simplified version) income 0
Dupas and Robinson (2009)
Market vendors (women) and bicycle-taxi drivers (men)
Kenya Low income
Africa 2009 42 Access to non-interest bearing bank account Significant effects on women (vendors) but no impacts on men (bike-taxi drivers)
saving investment expenditure +revenue hours worked 0
Fafchamps et al (2011)
Microenterprise owners
Ghana Lower middle income
Africa 2010 13 Cash grant or in-kind subsidies Profits + cashltin-kind (especially women)
Field et al (2010a) Women India Lower middle income
South Asia
2007 4 Financial and business skills training
Income loan +Business plan0Results varying by social status
Field et al (2010b) Women India Lower middle income
South Asia
2010 37 Changes in term structure from short to longer term repaymentThere is a significantly positive impacts of giving grace period for repayment on those business owners
Profit business setup income +
Gine and Yang (2009)
Farmers Malawi Low income
Africa 2006 1 Provision of credit for technology adoption with or without weather insurance
Take up of loan+ (only without insurance purchase)
Gine and Karlan (2010)
Microfinance clients
Philippines
Lower middle income
EAP 2006 19 Changes from group to individual liability of repayment
Default 0
Table A1 (Continued)
Study id Group country Income region Year Interval (months)
Main intervention Outcomes
Gine and Mansuri (2011)
Microfinance clients
Pakistan Lower middle income
South Asia
2008 18 Business training+lottery of winning larger amount of loans
Knowledge business practice psychological wellbeing+ Profits 0
Karlan and Zinman (2010)
Marginally rejected loan applicants
South Africa
Upper middle income
Africa 2006 27 Expansion of access to consumer credits
LM activities income consumption wellbeing+
Karlan and Zinman (2011)
Marginally rejected loan applicants
Philippines
Lower middle income
EAP 2007 1351233 Expansion of access to consumer credits
Number of business activities or employees -
Karlan and Valdivia (2011)
Female microfinance clients
Peru Upper middle income
LAC 2005 20 Business training added to microcredit
knowledge+profits revenue employment 0
Klinger and Schuumlndeln (2007)
(Potential) Business owners
GampN Lower middle income
LAC 2005 Business training and monetary prize
Business expansion +
Mano et al (2011) Microenterprise owners
Ghana Lower middle income
Africa 2008 13 Business training Profit practice revenue +
Macours et al (2011)
SA beneficiaries
Nicaragua Lower middle income
LAC 2009 32 Vocational training grants LM activities income profits + (grants)
McKenzie and Woodruff (2008)
Small retail firms
Mexico Upper middle income
LAC 2006 3 Cash or in-kind transfers on retail firms
Profits + (financially constrained)
Pitt et al (2006) Microfinance clients
Bangladesh
Low income
South Asia
1999 96 Microcredit Womens empowerment +
Premand et al (2011)
Youth Tunisia Upper middle income
MENA 2011 3 Entrepreneurship education (proposal) for college graduates
Knowledge self employment +LM income 0
Attanasio et al (2012)
Rural households
Mongolia Lower middle income
EAP 2009 2 Microcredit (group vs individual lending vs no lending)
Profit + (group lending)Business setup +LM income 0
Augsburg et al (2012)
Marginally rejected loan applicants
Bosnia and Herzegovina
Upper middle income
ECA 2010 15 Expansion of access to loan LM activities +Consumption 0saving-
Table A2 Summary of effect size by program characteristics and estimates significance
Effect Size Overall Insignificant or negative at 10
Significantly positive at 10
Proportion 100 7180 2820Average 0058 0009 0183
Intervention TypesTraining only 0057 0002 0212Training+Counseling 0095 0019 0232Financing only 0052 0007 0164Financing+Counseling 0011 -0002 0103Training+Financing 0104 0052 0181
Outcomes of interestLM Activity 0065 0017 0181LM Income 0036 0005 0136Financial Behavior 0034 -0017 0204Business Practice 0106 0007 0254Business Performance 0044 0009 0154Attitudes 0090 0044 0180
BeneficiariesFemale 0048 0011 0158Youth 0102 0010 0226High Education 0082 0016 0223SA beneficiaries 0046 0001 0150Entrepreneurs 0063 0012 0201Urban 0036 0013 0104
ProvidersGovernment only 0036 0013 0104NGO only 0081 0031 0164University only 0067 0011 0161MFI and banks only 0055 0008 0195Mutilple providers 0058 0001 0213
RegionsAFR 0122 0033 0258EAP 0003 -0009 0138ECA 0039 0005 0198LAC 0053 0017 0168MENA 0084 -0003 0206SAR 0046 -0002 0121
Income levelLow income 0130 0019 0273Lower middle income 0043 0005 0127Upper middle income 0057 0010 0210
Table A3 Distribution of Type of Intervention by Outcomes of Interest
Type of intervention Disaggregated intervention
LM Activity LM Income Business Practice
Business Performance
Financial Behavior
Attitudes
(1) vocational 6 16
(2) business+financial 1 13 60 44 30
(3) business 11 33 17 6 12
(4) vocational+counseling 18 17
(5) business+counseling 38 3 16 13
(6) financial+counseling 10 10
(7) vocational+financing 9 18 3 3
(8) business+financing 8 11 16 9 3 4
(9) grant (cash in-kind) 10 36 12
(10) microcredit 109 116 17 81 83 61
Financing+counseling (11) financing+counseling 43 68 8 4 10
Total 242 309 155 184 126 100Note the number of observations are specified in the table
Financing only
Training+financing
Training only
Training+counseling
Table A4 Random Effect Regression Model Labor Outcomes
LM Activity LM Income(1) (2)
coefse coefseTraining -0050 -0031
(0002) (0031)Training+Financing 0184 -0021
(0025) (0018)Female -0009 -0021
(0027) (0024)Youth 0060 0028
(0015) (0023)High education -0002 0049
(0007) (0025)Microenterprise owners -0015 -0016
(0003) (0024)Social assistance beneficiaries -0027 0017
(0017) (0037)Microfinance clients -0054 0019
(0022) (0034)Urban 0008 0040
(0005) (0020)Private sector delivery 0018 0031
(0015) (0024)Months since completion100 0109 0175
(0054) (0085)Number of observations 223 309Adjusted R2 0373 0179note plt001 plt005 plt01Standard errors are clustered by study id and reported in parenthesis Dependent variable is the estimated effect size The omitted category is Financing only All specifications include study characteristics (journal publication experimental design and the square root of number of observations) region and income dummies which are not reported here
Table A5 Random Effect Regression Model Business Outcomes
Business Practice Business Performance(1) (2)
coefse coefseTraining 0075 -0075
(0041) (0024)Training+Financing 0012 -0142
(0012) (0032)Female -0064 -0032
(0076) (0028)Youth 0467 0155
(0298) (0027)High education 0011 0014
(0019) (0033)Microenterprise owners 0078 -0037
(0037) (0017)Social assistance beneficiaries -0363 -0111
(0226) (0056)Microfinance clients 0037 -0034
(0093) (0037)Urban -0044 -0077
(0116) (0023)Private sector delivery -0313 0021
(0189) (0031)Months since completion100 -0509 0347
(0353) (0134)Number of observations 155 184Adjusted R2 0328 0445note plt001 plt005 plt01Standard errors are clustered by study id and reported in parenthesis Dependent variable is the estimated effect size The omitted category is training combined with financing All specifications include study characteristics (journal publication experimental design and the square root of number of observations) region and income dummies which are not reported here
Table A6 Random Effect Regression Model Behavioral Outcomes
Financial Behavior Attitudes(1) (2)
coefse coefseFinancing (Microcredits) -0019 -0003
(0039) (0035)Female 0017 0133
(0029) (0064)Youth 0237 -0010
(0074) (0037)High education -0109 0305
(0013) (0171)Microenterprise owners 0045 0044
(0065) (0030)Social assistance beneficiaries (dropped) (dropped)
Microfinance clients -0018 0028(0048) (0049)
Urban 0026 0016(0068) (0010)
Private sector delivery 0036 0129(0036) (0072)
Months since completion100 0322 0115(0292) (0322)
Number of observations 126 100Adjusted R2 0287 0458note plt001 plt005 plt01Standard errors are clustered by study id and reported in parenthesis Dependent variable is the estimated effect size The omitted category is business training All specifications include study characteristics (journal publication experimental design and the square root of number of observations) region and income dummies which are not reported here
- Entrepreneurship Programs in Developing Countries A Meta Regression Analysis0F(
-
- 42 Delving Deeper into Training and Financing Programs
- 43 Regressions on Subsample by Outcome Groups
-
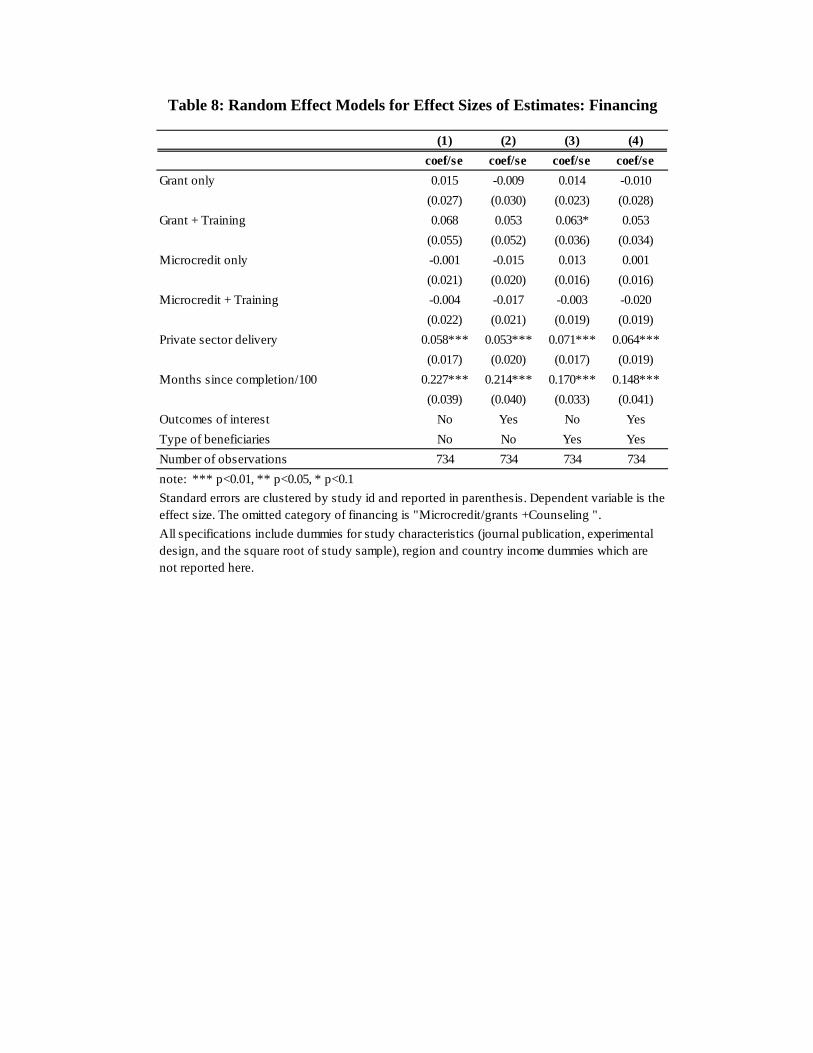

Table A1 (Continued)
Study id Group country Income region Year Interval (months)
Main intervention Outcomes
Cole et al (2010) Unbanked households
Indonesia Lower middle income
EAP 2010 26 Financial literacy training subsidies (small medium high) contingent upon bank account
Bank account+ savings 0(higher effects of incentives than training)
Crepon et al (2011)
Rural households
Morocco Lower middle income
MENA 2009 22 Expansion of MFI (and access to credit)
Business setup 0Income sales +
De Mel et al (2008a)
Microenterprise owners
Sri Lanka Lower middle income
South Asia
2008 39 Cashin-kind transfer Profits + (male)
De Mel et al (2008b)
Microenterprise owners
Sri Lanka Lower middle income
South Asia
2007 26 Small or large cash or in-kind equipment
Profits capital stock + (male)
De Mel et al (2011) Microenterprise owners
Sri Lanka Lower middle income
South Asia
2010 73 Provision of information on loans prodedures of getting the loan (applications requirements of guarantorsetc)
Take up of loan + Profits 0
Drexler et al (2011)
Microenterprise owners
Dominican Republic
Upper middle income
LAC 2008 13 Compare the impacts of full version of financial training simplified version of training and on-site visits for counseling
Business practice + (simplified version) income 0
Dupas and Robinson (2009)
Market vendors (women) and bicycle-taxi drivers (men)
Kenya Low income
Africa 2009 42 Access to non-interest bearing bank account Significant effects on women (vendors) but no impacts on men (bike-taxi drivers)
saving investment expenditure +revenue hours worked 0
Fafchamps et al (2011)
Microenterprise owners
Ghana Lower middle income
Africa 2010 13 Cash grant or in-kind subsidies Profits + cashltin-kind (especially women)
Field et al (2010a) Women India Lower middle income
South Asia
2007 4 Financial and business skills training
Income loan +Business plan0Results varying by social status
Field et al (2010b) Women India Lower middle income
South Asia
2010 37 Changes in term structure from short to longer term repaymentThere is a significantly positive impacts of giving grace period for repayment on those business owners
Profit business setup income +
Gine and Yang (2009)
Farmers Malawi Low income
Africa 2006 1 Provision of credit for technology adoption with or without weather insurance
Take up of loan+ (only without insurance purchase)
Gine and Karlan (2010)
Microfinance clients
Philippines
Lower middle income
EAP 2006 19 Changes from group to individual liability of repayment
Default 0
Table A1 (Continued)
Study id Group country Income region Year Interval (months)
Main intervention Outcomes
Gine and Mansuri (2011)
Microfinance clients
Pakistan Lower middle income
South Asia
2008 18 Business training+lottery of winning larger amount of loans
Knowledge business practice psychological wellbeing+ Profits 0
Karlan and Zinman (2010)
Marginally rejected loan applicants
South Africa
Upper middle income
Africa 2006 27 Expansion of access to consumer credits
LM activities income consumption wellbeing+
Karlan and Zinman (2011)
Marginally rejected loan applicants
Philippines
Lower middle income
EAP 2007 1351233 Expansion of access to consumer credits
Number of business activities or employees -
Karlan and Valdivia (2011)
Female microfinance clients
Peru Upper middle income
LAC 2005 20 Business training added to microcredit
knowledge+profits revenue employment 0
Klinger and Schuumlndeln (2007)
(Potential) Business owners
GampN Lower middle income
LAC 2005 Business training and monetary prize
Business expansion +
Mano et al (2011) Microenterprise owners
Ghana Lower middle income
Africa 2008 13 Business training Profit practice revenue +
Macours et al (2011)
SA beneficiaries
Nicaragua Lower middle income
LAC 2009 32 Vocational training grants LM activities income profits + (grants)
McKenzie and Woodruff (2008)
Small retail firms
Mexico Upper middle income
LAC 2006 3 Cash or in-kind transfers on retail firms
Profits + (financially constrained)
Pitt et al (2006) Microfinance clients
Bangladesh
Low income
South Asia
1999 96 Microcredit Womens empowerment +
Premand et al (2011)
Youth Tunisia Upper middle income
MENA 2011 3 Entrepreneurship education (proposal) for college graduates
Knowledge self employment +LM income 0
Attanasio et al (2012)
Rural households
Mongolia Lower middle income
EAP 2009 2 Microcredit (group vs individual lending vs no lending)
Profit + (group lending)Business setup +LM income 0
Augsburg et al (2012)
Marginally rejected loan applicants
Bosnia and Herzegovina
Upper middle income
ECA 2010 15 Expansion of access to loan LM activities +Consumption 0saving-
Table A2 Summary of effect size by program characteristics and estimates significance
Effect Size Overall Insignificant or negative at 10
Significantly positive at 10
Proportion 100 7180 2820Average 0058 0009 0183
Intervention TypesTraining only 0057 0002 0212Training+Counseling 0095 0019 0232Financing only 0052 0007 0164Financing+Counseling 0011 -0002 0103Training+Financing 0104 0052 0181
Outcomes of interestLM Activity 0065 0017 0181LM Income 0036 0005 0136Financial Behavior 0034 -0017 0204Business Practice 0106 0007 0254Business Performance 0044 0009 0154Attitudes 0090 0044 0180
BeneficiariesFemale 0048 0011 0158Youth 0102 0010 0226High Education 0082 0016 0223SA beneficiaries 0046 0001 0150Entrepreneurs 0063 0012 0201Urban 0036 0013 0104
ProvidersGovernment only 0036 0013 0104NGO only 0081 0031 0164University only 0067 0011 0161MFI and banks only 0055 0008 0195Mutilple providers 0058 0001 0213
RegionsAFR 0122 0033 0258EAP 0003 -0009 0138ECA 0039 0005 0198LAC 0053 0017 0168MENA 0084 -0003 0206SAR 0046 -0002 0121
Income levelLow income 0130 0019 0273Lower middle income 0043 0005 0127Upper middle income 0057 0010 0210
Table A3 Distribution of Type of Intervention by Outcomes of Interest
Type of intervention Disaggregated intervention
LM Activity LM Income Business Practice
Business Performance
Financial Behavior
Attitudes
(1) vocational 6 16
(2) business+financial 1 13 60 44 30
(3) business 11 33 17 6 12
(4) vocational+counseling 18 17
(5) business+counseling 38 3 16 13
(6) financial+counseling 10 10
(7) vocational+financing 9 18 3 3
(8) business+financing 8 11 16 9 3 4
(9) grant (cash in-kind) 10 36 12
(10) microcredit 109 116 17 81 83 61
Financing+counseling (11) financing+counseling 43 68 8 4 10
Total 242 309 155 184 126 100Note the number of observations are specified in the table
Financing only
Training+financing
Training only
Training+counseling
Table A4 Random Effect Regression Model Labor Outcomes
LM Activity LM Income(1) (2)
coefse coefseTraining -0050 -0031
(0002) (0031)Training+Financing 0184 -0021
(0025) (0018)Female -0009 -0021
(0027) (0024)Youth 0060 0028
(0015) (0023)High education -0002 0049
(0007) (0025)Microenterprise owners -0015 -0016
(0003) (0024)Social assistance beneficiaries -0027 0017
(0017) (0037)Microfinance clients -0054 0019
(0022) (0034)Urban 0008 0040
(0005) (0020)Private sector delivery 0018 0031
(0015) (0024)Months since completion100 0109 0175
(0054) (0085)Number of observations 223 309Adjusted R2 0373 0179note plt001 plt005 plt01Standard errors are clustered by study id and reported in parenthesis Dependent variable is the estimated effect size The omitted category is Financing only All specifications include study characteristics (journal publication experimental design and the square root of number of observations) region and income dummies which are not reported here
Table A5 Random Effect Regression Model Business Outcomes
Business Practice Business Performance(1) (2)
coefse coefseTraining 0075 -0075
(0041) (0024)Training+Financing 0012 -0142
(0012) (0032)Female -0064 -0032
(0076) (0028)Youth 0467 0155
(0298) (0027)High education 0011 0014
(0019) (0033)Microenterprise owners 0078 -0037
(0037) (0017)Social assistance beneficiaries -0363 -0111
(0226) (0056)Microfinance clients 0037 -0034
(0093) (0037)Urban -0044 -0077
(0116) (0023)Private sector delivery -0313 0021
(0189) (0031)Months since completion100 -0509 0347
(0353) (0134)Number of observations 155 184Adjusted R2 0328 0445note plt001 plt005 plt01Standard errors are clustered by study id and reported in parenthesis Dependent variable is the estimated effect size The omitted category is training combined with financing All specifications include study characteristics (journal publication experimental design and the square root of number of observations) region and income dummies which are not reported here
Table A6 Random Effect Regression Model Behavioral Outcomes
Financial Behavior Attitudes(1) (2)
coefse coefseFinancing (Microcredits) -0019 -0003
(0039) (0035)Female 0017 0133
(0029) (0064)Youth 0237 -0010
(0074) (0037)High education -0109 0305
(0013) (0171)Microenterprise owners 0045 0044
(0065) (0030)Social assistance beneficiaries (dropped) (dropped)
Microfinance clients -0018 0028(0048) (0049)
Urban 0026 0016(0068) (0010)
Private sector delivery 0036 0129(0036) (0072)
Months since completion100 0322 0115(0292) (0322)
Number of observations 126 100Adjusted R2 0287 0458note plt001 plt005 plt01Standard errors are clustered by study id and reported in parenthesis Dependent variable is the estimated effect size The omitted category is business training All specifications include study characteristics (journal publication experimental design and the square root of number of observations) region and income dummies which are not reported here
- Entrepreneurship Programs in Developing Countries A Meta Regression Analysis0F(
-
- 42 Delving Deeper into Training and Financing Programs
- 43 Regressions on Subsample by Outcome Groups
-
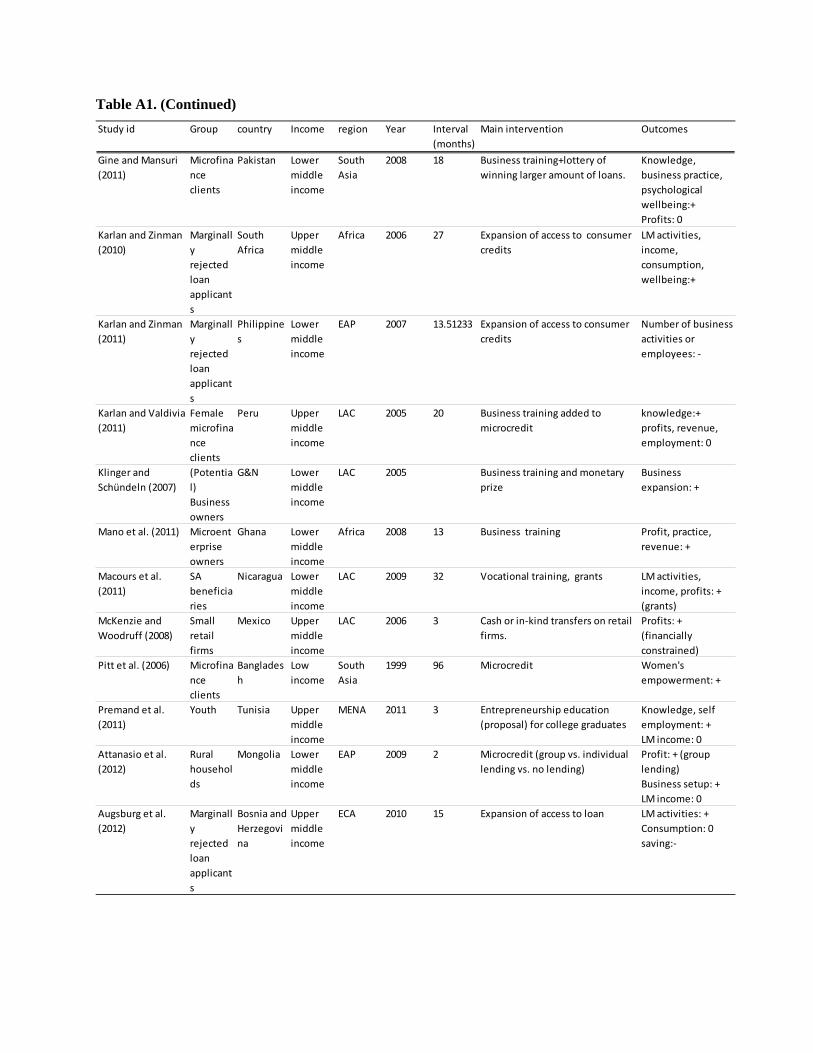
Table A1 (Continued)
Study id Group country Income region Year Interval (months)
Main intervention Outcomes
Gine and Mansuri (2011)
Microfinance clients
Pakistan Lower middle income
South Asia
2008 18 Business training+lottery of winning larger amount of loans
Knowledge business practice psychological wellbeing+ Profits 0
Karlan and Zinman (2010)
Marginally rejected loan applicants
South Africa
Upper middle income
Africa 2006 27 Expansion of access to consumer credits
LM activities income consumption wellbeing+
Karlan and Zinman (2011)
Marginally rejected loan applicants
Philippines
Lower middle income
EAP 2007 1351233 Expansion of access to consumer credits
Number of business activities or employees -
Karlan and Valdivia (2011)
Female microfinance clients
Peru Upper middle income
LAC 2005 20 Business training added to microcredit
knowledge+profits revenue employment 0
Klinger and Schuumlndeln (2007)
(Potential) Business owners
GampN Lower middle income
LAC 2005 Business training and monetary prize
Business expansion +
Mano et al (2011) Microenterprise owners
Ghana Lower middle income
Africa 2008 13 Business training Profit practice revenue +
Macours et al (2011)
SA beneficiaries
Nicaragua Lower middle income
LAC 2009 32 Vocational training grants LM activities income profits + (grants)
McKenzie and Woodruff (2008)
Small retail firms
Mexico Upper middle income
LAC 2006 3 Cash or in-kind transfers on retail firms
Profits + (financially constrained)
Pitt et al (2006) Microfinance clients
Bangladesh
Low income
South Asia
1999 96 Microcredit Womens empowerment +
Premand et al (2011)
Youth Tunisia Upper middle income
MENA 2011 3 Entrepreneurship education (proposal) for college graduates
Knowledge self employment +LM income 0
Attanasio et al (2012)
Rural households
Mongolia Lower middle income
EAP 2009 2 Microcredit (group vs individual lending vs no lending)
Profit + (group lending)Business setup +LM income 0
Augsburg et al (2012)
Marginally rejected loan applicants
Bosnia and Herzegovina
Upper middle income
ECA 2010 15 Expansion of access to loan LM activities +Consumption 0saving-
Table A2 Summary of effect size by program characteristics and estimates significance
Effect Size Overall Insignificant or negative at 10
Significantly positive at 10
Proportion 100 7180 2820Average 0058 0009 0183
Intervention TypesTraining only 0057 0002 0212Training+Counseling 0095 0019 0232Financing only 0052 0007 0164Financing+Counseling 0011 -0002 0103Training+Financing 0104 0052 0181
Outcomes of interestLM Activity 0065 0017 0181LM Income 0036 0005 0136Financial Behavior 0034 -0017 0204Business Practice 0106 0007 0254Business Performance 0044 0009 0154Attitudes 0090 0044 0180
BeneficiariesFemale 0048 0011 0158Youth 0102 0010 0226High Education 0082 0016 0223SA beneficiaries 0046 0001 0150Entrepreneurs 0063 0012 0201Urban 0036 0013 0104
ProvidersGovernment only 0036 0013 0104NGO only 0081 0031 0164University only 0067 0011 0161MFI and banks only 0055 0008 0195Mutilple providers 0058 0001 0213
RegionsAFR 0122 0033 0258EAP 0003 -0009 0138ECA 0039 0005 0198LAC 0053 0017 0168MENA 0084 -0003 0206SAR 0046 -0002 0121
Income levelLow income 0130 0019 0273Lower middle income 0043 0005 0127Upper middle income 0057 0010 0210
Table A3 Distribution of Type of Intervention by Outcomes of Interest
Type of intervention Disaggregated intervention
LM Activity LM Income Business Practice
Business Performance
Financial Behavior
Attitudes
(1) vocational 6 16
(2) business+financial 1 13 60 44 30
(3) business 11 33 17 6 12
(4) vocational+counseling 18 17
(5) business+counseling 38 3 16 13
(6) financial+counseling 10 10
(7) vocational+financing 9 18 3 3
(8) business+financing 8 11 16 9 3 4
(9) grant (cash in-kind) 10 36 12
(10) microcredit 109 116 17 81 83 61
Financing+counseling (11) financing+counseling 43 68 8 4 10
Total 242 309 155 184 126 100Note the number of observations are specified in the table
Financing only
Training+financing
Training only
Training+counseling
Table A4 Random Effect Regression Model Labor Outcomes
LM Activity LM Income(1) (2)
coefse coefseTraining -0050 -0031
(0002) (0031)Training+Financing 0184 -0021
(0025) (0018)Female -0009 -0021
(0027) (0024)Youth 0060 0028
(0015) (0023)High education -0002 0049
(0007) (0025)Microenterprise owners -0015 -0016
(0003) (0024)Social assistance beneficiaries -0027 0017
(0017) (0037)Microfinance clients -0054 0019
(0022) (0034)Urban 0008 0040
(0005) (0020)Private sector delivery 0018 0031
(0015) (0024)Months since completion100 0109 0175
(0054) (0085)Number of observations 223 309Adjusted R2 0373 0179note plt001 plt005 plt01Standard errors are clustered by study id and reported in parenthesis Dependent variable is the estimated effect size The omitted category is Financing only All specifications include study characteristics (journal publication experimental design and the square root of number of observations) region and income dummies which are not reported here
Table A5 Random Effect Regression Model Business Outcomes
Business Practice Business Performance(1) (2)
coefse coefseTraining 0075 -0075
(0041) (0024)Training+Financing 0012 -0142
(0012) (0032)Female -0064 -0032
(0076) (0028)Youth 0467 0155
(0298) (0027)High education 0011 0014
(0019) (0033)Microenterprise owners 0078 -0037
(0037) (0017)Social assistance beneficiaries -0363 -0111
(0226) (0056)Microfinance clients 0037 -0034
(0093) (0037)Urban -0044 -0077
(0116) (0023)Private sector delivery -0313 0021
(0189) (0031)Months since completion100 -0509 0347
(0353) (0134)Number of observations 155 184Adjusted R2 0328 0445note plt001 plt005 plt01Standard errors are clustered by study id and reported in parenthesis Dependent variable is the estimated effect size The omitted category is training combined with financing All specifications include study characteristics (journal publication experimental design and the square root of number of observations) region and income dummies which are not reported here
Table A6 Random Effect Regression Model Behavioral Outcomes
Financial Behavior Attitudes(1) (2)
coefse coefseFinancing (Microcredits) -0019 -0003
(0039) (0035)Female 0017 0133
(0029) (0064)Youth 0237 -0010
(0074) (0037)High education -0109 0305
(0013) (0171)Microenterprise owners 0045 0044
(0065) (0030)Social assistance beneficiaries (dropped) (dropped)
Microfinance clients -0018 0028(0048) (0049)
Urban 0026 0016(0068) (0010)
Private sector delivery 0036 0129(0036) (0072)
Months since completion100 0322 0115(0292) (0322)
Number of observations 126 100Adjusted R2 0287 0458note plt001 plt005 plt01Standard errors are clustered by study id and reported in parenthesis Dependent variable is the estimated effect size The omitted category is business training All specifications include study characteristics (journal publication experimental design and the square root of number of observations) region and income dummies which are not reported here
- Entrepreneurship Programs in Developing Countries A Meta Regression Analysis0F(
-
- 42 Delving Deeper into Training and Financing Programs
- 43 Regressions on Subsample by Outcome Groups
-
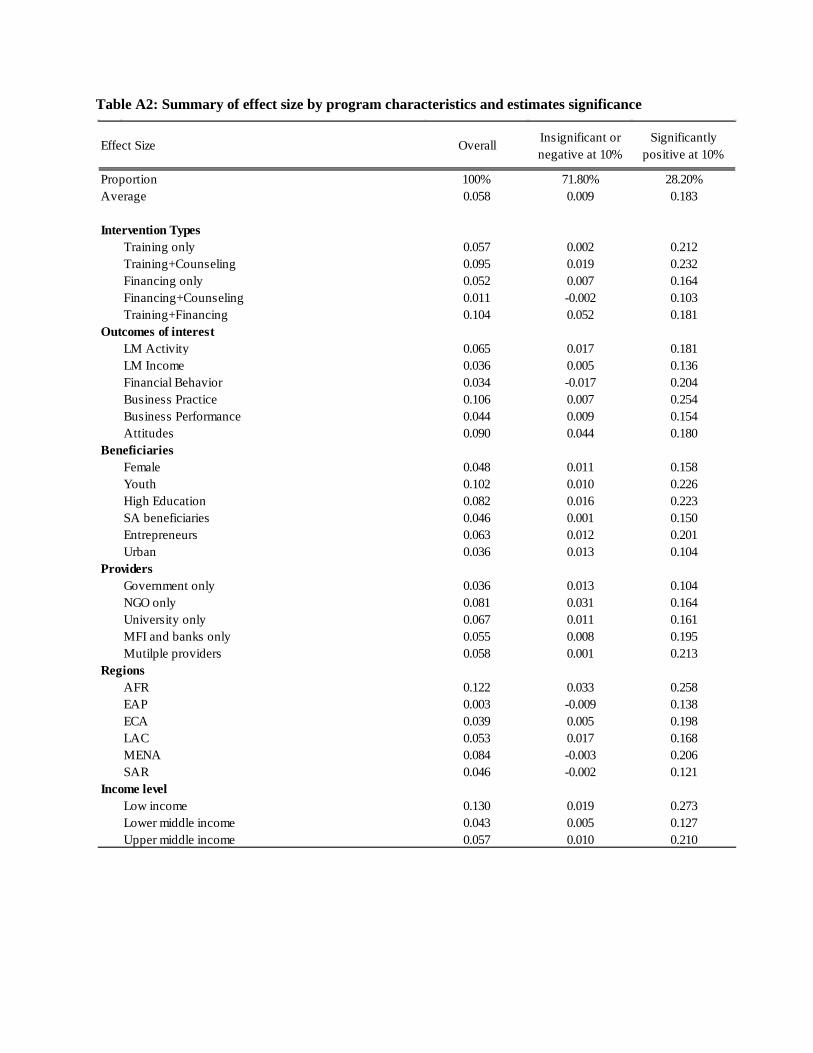