enthalpy of solution of sodium nitrite - nvlpubs.nist.gov · journal of research of the national...
TRANSCRIPT
JOURNAL O F RESEARCH of the National Bureau of Standards Vo lume 82 , No.1, July- August 1977
Enthalpy of Solution of Sodium Nitrite
Jaime C. Cases*
Departamento de Quimica, Universidad de Chile, Casilla 2777, Santiago, Chile
and
Vivian B. Parker** and Marthada V. Kilday
Institute for Materials Research, National Bureau of Standards, Washington, D.C. 20234
(June 13, 1977)
An adiabat ic solution ca lorimete r was used to measure e ntha lpi es of solution and dilution of sod ium ni trite in wa ter in the concentration range or5 to 200 mmol· kg- I. For the solution reaction whe re mola lit y, m = 100 mmol·kg- I, t:.C" = - 1. 394 ± 0.014 J' g- I·K- I (- 23 .0 ± 0 .2 c"l·mol- I·K- I). Othe r de p va lues for some dilution reac tions we re a lso measured. The va lue se lected for the enthalpy of solut ion at infinite dilution is
Mfoo (298.1 5 K) = 14 .006 ± 0.01 5 kJ · mol - I = 3 .347 ± 0.004 kcal' mol- I
Values for the re lat ive appa rent molal heat conte nt <PL, are tabu lated and th e entha lpy of tran s ition and of fu s ion derived from diffe rential thermal analys is measure ments are a lso give n.
Key Words: Ca lorime try , soln.; Na N02 , enthalpy of dilution; NaN02 , entha lpy of soln. ; Na N02 , rel ative appare nt molal heat content; NaN02 , enthalpies of trans ition and fus ion; NaN02 , me lt ing tempe ra ture .
1. Introduction
In the evaluation of th e the rmal properties of aqu eous uniunivalent electrolyte solutions [1] , I the tabula ti on of the relative appa rent molal hea t con tent , ¢>L , of NaN02 in H20 revea ls the absence of data for co ncentrations between 185 mmol ' kg- I and infinite dilution . The only data avail able for this evaluation was the work of Perreu [2] who measured the enthalpies of soluti on and dilution at 287 K between 11.87 and 0. 188 mol, kg- I. The evaluation of th e enthalpy of solution at infinite dilution, /).11"00, was based on very limited data from various measurements between 130 and 170 mmol' kg- I in the temperature range , 291 to 298 K. Therefore, a large uncertainty, 1.2 percent, was assigned to the " best" value for M "oo .
In this work we have measured enthalpies of sol ution and di lution of NaN02 in the dilute region where data were not previously available, as well as in the same concentrations previously measured, for confirmation of earli er work. We have also measure d /1Cp ' s for th e reactions. These provide more accurate corrections for the earli er work on en thalpy of solution to the standard temperatu re.
2. The NaN02 Sample
The "unpurified" sample was the ACS reagent grade from a commercial sou rce with spec ifi cati ons of purity of at least 97
• Cuesl work er al NUS. Jlll y 1972 10 Jnnuary 1973 , who received partial support from the Regional Sc ientific and Technological Program of the Orgnni zlltion of American States.
** Refer ilHluiries about this paper to this author. , Figures in bracke ts indicat e lileralUre references at the end of this paper.
19
percent. The method for purifi cation used for thi s sample was described previously 13]. It consi sted of rec rystallization from aqu eous solu ti on 3 times , filtration through sin tered glass, and finally drying at 383 K under vacuum for more tha n 72 hours . The material was transferred to a glove box with an argon atmosphere where it was crushed and placed in glassstoppered bottles in a des icca tor for storage. The color of the sample was white with a slight yellow tinge.
When a small portion of this material was exposed to the laboratory atmosphere for 17 hours , no significant change in weight was observed. Therefore, calorime tric samples were transferred to the sample holder in the room air.
The purity of the sample was determined by Gaylon Ross, Office of the Director of the Institute for Materials Research , on the basis of its melting behavior, us ing a differential thermal analysis instrument of high prec ision which is commercially available. It was estimated that the purity of the NaN02 sample was at least 99.9 mol percent providing all of the impuriti es a re liquid soluble and solid insoluble. 2 The accuracy of the instrument was carefull y checked by comparison with melting temperatures of samples of certified hi ghpurity (99.99+ mol%) lead and indium. Using the indium sample as the calibration material, the lead thermogram was analysed (and vice versa); the observed melting temperatures
2 The purity analysis of nearly pure materials involves the use of a plot of T.r ve rsus F- ' . whe re T.r is the te mperature of the sample and F is the fraction me lted. The s lope reOeets the impurit y in the relationship: T.r = 7/rJ - NfRT J02 (4H/ }- 'F- ' . M/ is the enthalpy affus ion, Nf is the mole fraction of the impurity, and T /0 is the melting temperature of the pure major component. When F- ' = I , T z = TI = the mehing temperature where an infinitesimal amount of the solid major componenl is in thermodynamic eq uilibrium with the liquid . Analysis of the thennograms resulting from the mehing of the NaNO! samples indicated that the sample temperature did not change, within the sensitivily of the instrument. during the melting process; the slope was zero for the plot ofT z versus F- ' . Therefore, T z = T /0. N! = 0, and the NaNO! was pure . The instrument does not have the temperature measurement capabilit y of distinguishing between a sample purity of 99.9 and 99.99 mol percent; consequentl y, 99.9 mol percent is the lower li mit of purity.
were in error by not more than 0.1 K relative to accepted values and the calculated MIl was in error by less than 2 percent.
From his measurements, Ross also reports the following data (where the uncertainties in the enthalpies are twice the standard deviation of the mean of four measurements): for the solid-solid transi ti on at 436.35 ± 0.20 K (163.2 ± 0.2 0q, MI = 2.058 ± 0.126 kJ· mol-I (492 ± 30 cal, mol- I); for the solid-liquid transition at the melting temperature, 554.28 ± 0 .1 K (281.13 ± 0.1 0q, MI = 14.16 ± 0.42 kJ'mol- 1
(3.38 ± 0 .10 kcal·mol - I). A small evolution of gas was observed during heating of the
sample to the melting point; however, the loss in sample mass was approximately 0.1 percent which is about the weighing uncertainty for the 10 mg samples. Subsequent reruns of the same samples showed evidence of thermal degradation with each heating, but the first run indicated that the sample was "pure." In view of the apparently hi gh purity of the sample, the calorimetric data reported here are not corrected for sample impurities.
3. Apparatus and Procedures
The platinum-lined adiabatic solution calorimeter used for these enthalpy measurements was described previously [4]. The reactions were endothermi c and required the addition of electrical energy during the chemical reaction to prevent a drop in the temperature of the calorimeter vessel as described in an earli er paper [5]. In each experiment the initial and final systems were calibrated electrically;3 details of these procedures and calculations have been given [4].
The experiments described in this paper were completed between October and December 1972. The calorimeter temperature was measured with a quartz-oscillator using an electronic counter with reference to an NBS standard frequency. The qua rtz-oscillator was calibrated in June 1972 by comparison with a platinum resistance thermometer. The time and calorime ter temperature readings were automatically recorded on punch ed tape and a typewriter at precisely 100-s intervals throughout an experiment. Rating period slopes were obtained from a least squares fit to a linear eq uation of 15 to 20 of the time-temperature readings . Extrapolation of these slopes to the time of initiating the electrical heating gave the initial and final temperatures for the reaction. The difference between these temperatures is the corrected temperature rise, flTc (for details, see [4]).
The molecular masses of NaN02 , 68.9953, and of H20, 18.0154, used in the calculations were tak en from the 1969 Table of Atomic Weights [6]. For NaN02 (c) the density, 2.14 g' cm- 3 [7] was used in calculating buoyancy corrections, and for the aqueous solutions of NaN02 the densiti es were taken from the International Critical Tables [8]. A density of 0.00118 g'cm- 3 was used for air under the average atmospheric conditions in this laboratory, 22.5 ± 0.5 °C, 0 .10 ± 0.001 MPa (750 ± 10 mm Hg) , and a relative humidity of 35 ± 15 percent. For en ergy conversions, 4.184 joules = 1 thermochemical calorie .
4. Experimental Results
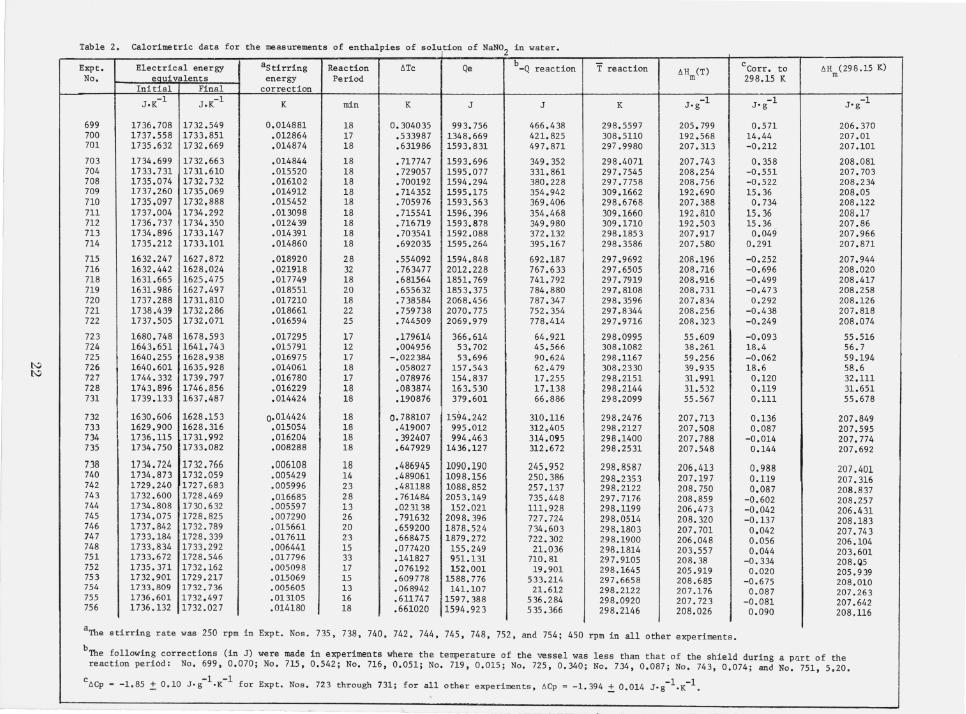
The composition and calorimetric data are given in tables 1 and 2 for the experiments in which enthalpi es of solution and
3 The 0.1-0, 10-0, and 10-k11 standard res is tors were lasl calibrated at NBS in June 1969. The lasl NBS calibration (based on the 1968 NBS volt ) of the saturated standard cell s was in luly 1969. The record of these calibrations over Ihe years indicates consistent trends which provide confidence in the values used.
dilution of NaN02 were measured. The Expt. No. is a serial number for experiments with this calorimeter.
In the first three experiments, the NaN02 reagent before . purification (see sec. 2) was dissolved in water. In Expts. 703
through 714, the purified crystalline sample was dissolved in water. The flCp for the reaction, -1.394 ± 0.014 J . g-I. K-l, was obtained from Expts. 709, 711 , and 712 (at 309 K) and Expts. 708, 713, and 714 (at 298 K); the average final concentrations for the two groups are essentially equal. The uncertainty in the flCp is estimated to be 1 percent. An estimate of the experimental imprecision may be obtained from Expts. 703-714 where Mlm .(298.15 K) = 208.01 ± 0.13 J. g-I. The 0.06 percent uncertainty is at the 95 percent confidence level.
It was desirable to measure the enthalpy at a final concentation of 180 mmol' kg- I in order to compare our results directly with earlier measurements. However , the volume of the largest of the three interchangeable cylinders for the platinum sample holder (see [4]) was only 2.7 cm3; the maximum amount of the crystalline sample which it contained resulted in a final concentration of less than 120 mmol' kg- I. In order to obtain the desired concentration , it was necessary in Expts. 715-719 to reduce the calorimetric solution from 16.8 to 15.4 moles of H20 and to compress the sample into a pellet 1.2 cm in diameter, 0.9 cm in depth, and weighing approximately 2.5 g . The remaining space in the sample cylinder was filled with the loose crystalline material. Expts. 720-722 were similar to the above except that the standard amount of water (16.8 moles) was used for the calorimetric solution . In Expts. 732-735, the pelleted sample with no loose crystalline material was used. These experiments showed that reducing the amount of water for the calorimetric solution and pelle ting the NaN02 sample had no significant effect on the enthalpy of solution calculated at infinite dilution (to be discussed later).
In Expts. 723-731, enthalpies of dilution of aqueous solutions of NaN02 in the sample holder were measured. The three aqueous solutions were prepared by mixing weighed amounts of the components as follows: No. 1 was 36.78 wI. percent NaN02 (m = 8.432 mol, kg- I); No.2, 18. 53 wI. percent (m = 3. 297 mol· kg-I); and No.3, 45.47 wt. percent (m = 12.087 mol, kg- I). flCp , -1.75 J 'g- I 'K-I, for the dilution of Soln. No. 1 was obtained from Expts. 724 and 731, and -1.91 J . g- I . K- I, for the dilution of Soln . No.3, from Expts. 725 and 726. The uncertainty in these measurements is relatively large because of the small amount of energy absorbed by the reaction. The refore, for all of the dilution experiments (723-731) we used an approximate flCp
= -1.85 ± 0.10 J. g-I . K- I for the correction to 298.15 K. In Expts. 738-756, we measured integral and differential
enthalpies of solution to pl'Ovide additional points on the concentration curve.
In table 2, Q reaction is the energy absorbed by the chemical reaction , and Q reaction = EEE(flTc) - Qe , where EEE is the mean electrical energy eq uivalent, flTc is the corrected temperature rise, and Qe is the electrical energy added during the endothermic reaction to prevent a drop in the calorimeter temperature . MI m(T) is the measured isothermal enthalpy at the concentration, m , and the tempera: ture of reaction (which is the mean temperature of reaction , T reaction , and is equal to -Q reaction per gram of NaN02 in the sample. The stirring energy correction is calculated from the slopes of the initial and final rating periods. This correction includes primarily the effects of stirring energy and
20
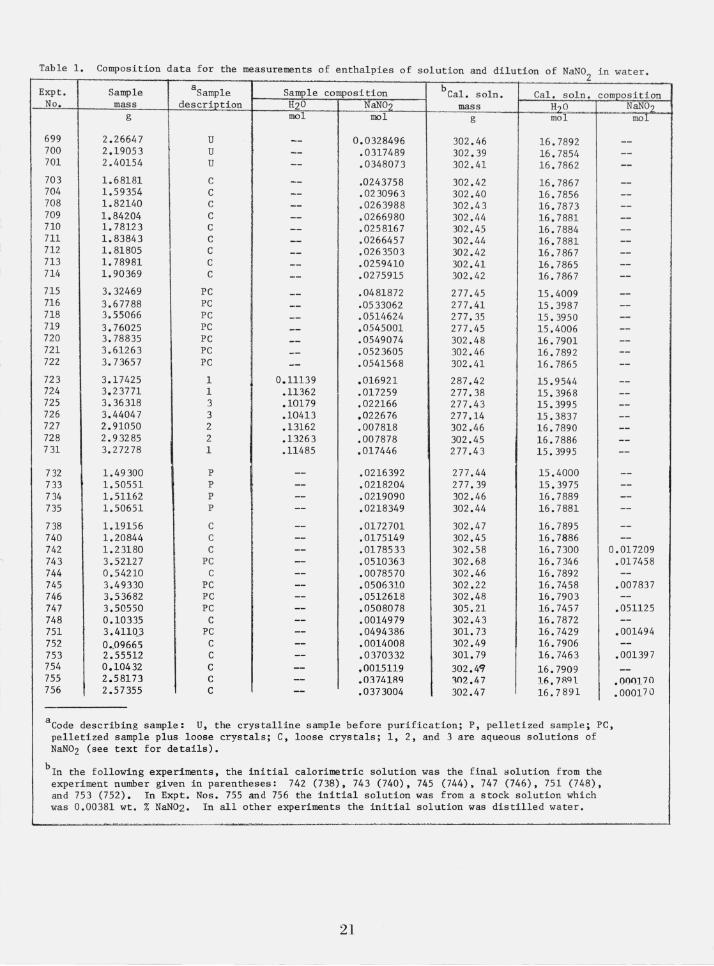
Table 1. Composi tion data fo r the measurements of entha1pies of solution and dilution of NaNO in water. 2
Expt. Sample aSamp1e description
Sample composition bCal. soln. mass
Cal. soln . composition No . H20 NaN°2 l!20 NaN°2 mass
mol mol g g mol. mol.
699 700 701
703 704 708 709 710 711 712 713 714
715 716 718 719 720 721 722
723 724 725 726 727 728 731
732 733 734 735
2. 26647 2.19053 2.40154
1.68181 1.59354 1.82140 1.84204 1. 78123 1.83843 1.81805 1. 78981 1.90369
3.32469 3.67788 3.55066 3.76025 3. 78835 3.61263 3.7365 7
3.17425 3.23771 3.36318 3.44047 2.91050 2.9 3285 3. 27278
1.49300 1.50551 1.51162 1.50651
u u u C C C C C C C C C
PC PC PC PC PC PC PC
1 1 3 3 2 2 1
P P P P
0.11139 .11362 .10179 .10413 .13162 .1326 3 .11485
0.0328496 .0317489 .0348073
.0243758
.0230963
.0263988
. 0266980
.0258167
.0266457
.0263503
.0259410
. 0275915
. 0481872
.0533062
.0514624
.0545001
.05490 74
.0523605
.0541568
.016921
.017259
. 022166
.022676
.007818
.007878
.017446
.0216392
.0218204
.0219090
.0218349
302 .46 302 . 39 302.41
302.42 302.40 302.43 302.44 302 . 45 302 .44 302 .42 302.41 302.42
277.45 277 .41 277.35 277 .45 302 .48 302 .46 302 .41
287 .42 277 . 38 277.43 277 .14 302 .46 302 .45 277.43
277 .44 277 . 39 302 .46 302.44
16.7892 16.7854 16 . 7862
16.7867 16 . 7856 16.7873 16.7881 16.7884 16.7881 16.7867 16.7865 16.7867
15.4009 15 . 3987 15.3950 15.4006 16.7901 16 . 7892 16.7865
15.9544 15.3968 15.3995 15 . 3837 16.7890 16 . 7886 15. 3995
15 . 4000 15 . 3975 16.7889 16 .7 881
738 740 742 743 744 745 746 747 748 751 752 753 754 755 756
1.19156 1.20844 1.23180 3.52127 0.54210 3.49330 3.53682 3.50550 0.10335 3.4110.) 0 •. 09665 2.55512 0.10432 2.58173 2.57355
C C C
PC
.0172701
.0175149
.0178533
.051036 3
.0078570
.0506 310
.0512618
.0508078
.0014979
.0494386
.0014008
.0370332 .0015119 .03741RQ .0373004
302 . 47 302 .45 302 .5 8 302.68 302 .46 302.22 302 .48 305.21 302 .4 3 301. 73 302.49 301. 79 302.49 102.47 302.47
16.7895 16. 7886 16.7300 16. 7346 16.7892 16.7458 16.7903 16.7457 16.7872 16.7429 16.7906 16.7463 16.7909 16.78Q l 16.7 891
0.017209 .017458
C PC PC PC
C PC
C C C C C
a Code describing sample: U, the crystalline sample before purification; P, pelletized sample; PC, pelletized sample plus loose crystals; C, loose crystals; 1, 2, and 3 are aqueous solutions of NaN02 (see text for details).
bIn the following experiments, the initial calorimetric solution was the final Holution from the experiment number given in parentheses: 742 (738), 743 (740), 745 (744),747 (746), 751 (748), and 753 (752). In Expt. Nos. 755 and 756 the initial solution was from a stock solution which was 0 . 00381 wt. % NaN02 . In all other experiments the initial solution was distilled water.
21
.007837
.051125
.001494
.001397
.000170
.000170
I'.:l I'.:l
Table 2. Calorimetric data for the measurements of entha1pies of solution of NaN02 in water.
Expt. No.
699 700 701
703 704 708 709 710 711 712 713 714
715 716 718 719 720 721 722
723 724 725 726 727 728 731
732 733 734 735
738 740 742 743 744 745 746 747 748 751 752 753 754 755 756
Electrical energy eQuivalents
Initial I Final
J.K-1 I J.K-l
1736.708 1732.549 1737.558 1733.851 1735.632 1732.669
1734.699 1732.663 1733.731 1731.610 1735.074 1732.732 1737.260 1735.069 1735.097 1732.888 1737.004 1734.292 1736.737 1734.350 1734.896 1733.147 1735.212 1733.101
1632.247 1627.872 1632.442 1628.024 1631.665 1625.475 1631.986 1627.497 1737.288 1731.810 1738.439 1732.286 1737.505 1732.071
1680.748 1678.593 1643.651 1641.743 1640.255 1628.938 1640.601 1635.928 1744.332 1739.797 1743.896 1746.856 1739.133 1637.487
1630.606 1628.153 1629.900 1628.316 1736.115 1731.992 1734.750 1733.082
1734.724 1732.766 1734.873 1732.059 1729.240 1727.683 1732.600 1728.469 1734.808 1730.632 1734.075 1728.825 1737.842 1732.789 1733.184 1728.339 1733.834 1733.292 1733.672 1728.546 1735.371 1732.162 1732.901 1729.217 1733.809 1732.736 1736.601 1732.497 1736.132 1732.027
aStirring energy
correction
K
0.014881 .012864 .014874
.014844
.015520
.016102
.014912
.015452
.013098
.012439
.014391
.014860
.018920
.021918
.017749
.018551
.017210
.018661
.016594
.017295
.015791
.016975
.014061
.016780
.016229
.014424
0·014424 .015054 .016204 .008288
.006108
.005429
.005996
.016685
.005597
.007290
.015661
.017611
. 006441
.017796
.005098
.015069
.005605
.013105
.014180
Reaction Period
min
18 17 18
18 18 18 18 18 18 18 18 18
28 32 18 20 18 22 25
17 12 17 18 17 18 18
18 18 18 18
18 14 23 28 13 26 20 23 15 33 17 15 13 16 18
liTe
K
0.304035 .533987 .631986
.717747
.729057
.700192
.714352
.705976
.715541
.716719
.703541
.692035
.554092
.763477
.681564
.655632
.738584
.759738
.744509
.179614
.004956 -.022384
.058027
.078976
.083874
.190876
0.788107 .419007 .392407 .647929
.486945
.489061
.481188
.761484
.023138
.791632
.659200
.668475
.077420
.141827
.076192
.609778
.068942
.611747
.661020
Qe
J
993.756 1348.669 1593.831
1593.696 1595.077 1594.294 1595.175 1593.563 1596.396 1593.878 1592 .088 1595.261,
1594.848 2012.228 1851. 769 1853.375 2068.456 2070.775 2069.979
366.614 53.702 53.696
157.543 154.837 163.530 379.601
1594.242 995.012 994.463
1436.127
1090.190 1098.156 1088.852 2053.149 152.021
2098.396 1878.524 1879.272
155.249 951.131 152.001
1588.776 141.107
1597.388 1594.92 3
b _Q reaction
J
466.438 421. 825 497.871
349.352 331. 861 380.228 354.942 369.406 354 .468 349.980 372.132 395.167
692.187 767.633 741. 792 784.880 787.347 752.354 778.414
64.921 45.566 90.624 62.479 17.255 17.138 66.886
310 .116 312.405 314.095 312.672
245.952 250.386 257.137 735.448 111. 928 727 .724 734.603 722.302 21.036
710.81 19.901
533.214 21. 612
536.284 535.366
T reaction
K
298.5597 308.5110 297.9980
298.4071 297.7545 297 .7758 309.1662 298.6768 309.1660 309.1710 298.1853 298.3586
297.9692 297.6505 297.7919 297,.8108 298.3596 29 7.8 344 297.9716
298.0995 308.1082 298.1167 308.2330 298.2151 298.2144 298.2099
298.2476 298.2127 298.1400 298.2531
298.8587 298.2353 298.2122 297.7176 298 .1199 298.0514 298.1803 298.1900 298.1814 297.9105 298.1645 297.6658 298.2122 298.0920 298.2146
IIHm (T)
-1 J.g
205.799 192.568 207.313
207.743 208.254 208.756 192.690 207.388 192 .810 192 .503 207.917 207.580
208.196 208.716 208.916 208.731 207.834 208.256 208.323
55.609 38 . 261 59.256 39.935 31. 991 31. 532 55.567
207.713 207.508 207.788 207.548
206.413 207.197 208.750 208.859 206.473 208.320 207.701 206.048 203.557 208.38 205.919 208.685 207.176 207.723 208.026
aThe stirring rate was 250 rpm in Expt. Nos . 735, 738, 740, 742, 744, 745, 748, 752, and 754; 450 rpm in all other experiments.
CCorr • to 298.15 K
-1 J'g
0.571 14.44 -0.212
0.358 -0.551 -0.522 15.36 0.734
15.36 15.36
0.049 0.291
-0.252 -0.696 -0.499 -0.473
0.292 -0.438 -0.249
-0.093 18.4 -0.062 18.6 0.120 0.119 0.111
0.136 0.087
-0.014 0.144
0.988 0.119 0.087
-0.602 -0.042 -0.137
0.042 0.056 0.044
-0.334 0.020
-0.675 0.087
-0.081 0.090
IIH (298.15 K) m
-1 J'g
206.370 207.01 207.101
208.081 207.703 208.234 208.05 208.122 208.17 207.86 207.966 207 .871
207.944 208.020 208.417 208.258 208.126 207.818 208.074
55.516 56.7 59.194 58.6 32.111 31.651 55.678
207.849 207.595 207.774 207.692
207.401 207.316 208.837 208.257 206.431 208.183 207.743 206.104 203.601 208.Q5 205.939 208.010 207.263 207.642 208.116
bThe following corrections (in J) were made in experiments where the temperature of the vessel was less than that of the shield during a part of the reaction period: No. 699, 0.070; No. 715, 0.542; No. 716, 0.051; No. 719, 0.015; No . 725, 0.340; No. 734, 0.087; No. 743, 0.074; and No. 751, 5,20.
c -1 -1 -1 -1 lICp = -1.85 ! 0.10 J.g ·K for Expt. Nos. 723 through 731; for all other experiments, lICp = -1.394 ! 0.014 J.g .K •
t-:l W
Table 3.
n
'" 500 ,000 100,000 50,000 20 ,000 10,000
7,000 5,000 4,000 3,000 2,000 1,500 1,110 1,000
900 800 700 600 555.1 500 400 300 277 .5 200 150 III 100
75 55.51 50
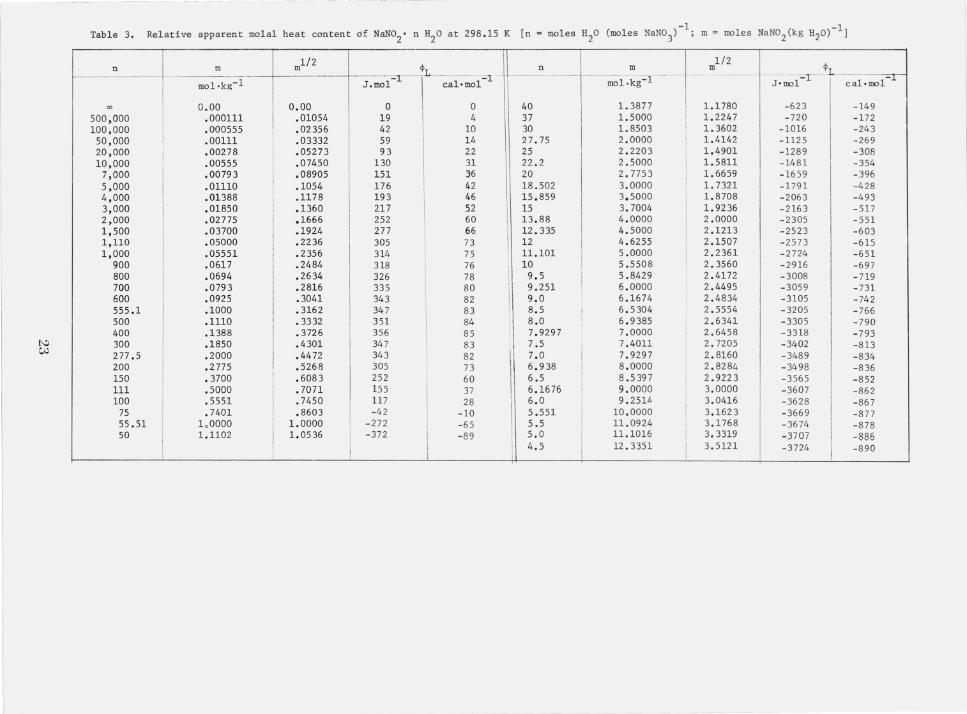
Relative apparent molal heat content of NaN02' n H20 at 298.15 K [n moles H20 (moles NaN03)-1; m = moles NaN02(kg H20) - 1]
m1/2 <l>r 1\
112 <I> m n m m
~ . ..':.L._ mol.kg-1 J.mo1-'1 ca1'mo1"'"1 i mol .kg 1 J'mo1- cal.mo1-1
0.00 0.00 0 0 40 1. 3877 1.1780 -623 -149 .000111 .01054 19 4 37 1.5000 1. 2247 -720 -172 .000555 , .02356 42 10 30 1. 8503 1.3602 -1016 -243 .00111 .03332 59 14 27.75 2.0000 I 1.4142 -1125 - 269
! .00278 .0527 3 93 22 25 2.2203 1.4901 -1289 -308 .00555 .07450 130 31 22.2 2.5000 , 1.5811 -1481 -354 .00793 .08905
I 151 36 20 2.7753 1. 6659 -1659 - 396 ,
.01110 .1054 176 42 18.502 3.0000 1. 7321 -1791 -428
.01388 .1178 193 46 15. 859 3.5000 1. 8708 -2063 -493
.01850 .1360 217 52 15 3.7004
I 1. 9236 -2163 -517
I .02775 .1666 252 60 13.88 4.0000 2.0000 - 2305 -551 .03700 .1924 277 66 12.335 4.5000 2.1213 -2523 -603 .05000 .2236 305 73 12 4.6255 I 2 .1507 -2573 -615 .05551 .2356 314 75 ; 11.101 5.0000 2.2361 -2724 - 65 1 .0617 I .2484 318 76 i
10 , 5.5508 2.3560 -2·916 -697 .0694 .2634 326 78 9.5 I 5. 8429 2 .4172 -3008 - 719 .0793 I .2816 335 I 80 9.251 i 6.0000 2 .4495 - 3059
I -731 .0925 ! .3041 343 82 9.0 6.1674 2.4834 -3105 -742 .1000 I . 3162 347 83 8.5 . 6.5304 2 .5554 -3205 - 766 .1110 .3332 351 84 8.0 . 6.9385 2.6341 -3305 -790 .1388 I . 3726 356 85 7.9297 7.0000 , 2 . 6458 -3318 - 793 .1850 I .4301 347 83 Ii 7.5 I 7.4011 2.7205 -3402 -8l3 .2000 I .4472 343 82 7. 0 i 7.929 7 2 . 8160 -3489 -834 .2775 .5268 305 73 6.938 I 8 .0000 2.8284 -3498 -836 .3700
, .608 3 252 60 6.5 8. 5397 2.9223 -3565 I -85 2
. 5000 ,
.7071 155 6.1676 i 9.0000 3. 0000 I 37 -3607 -862 .5551 .7450 117 28 6.0 9.251[' I 3. 0416 -3628 - 867 .7401 ! .8603 -42 -10 5.551 10.0000 I 3.1623 -3669 -877
1 , 0000 I 1.0000 -272 I -65 5.5 11.0924 3.1768 -3674 -878 1.1102
I 1.0536 I
- 372 I - 89 5.0 : 11.1016 i 3.3319 -3707 -886
I I 4.5 i 12.3351 I 3. 5121 -3724 -890 I I I
vaporization energy (the calorimeter has an opening to the atmosphere). The uncertainty is estimated to be 1 to 5 percent of the correction and contributes significantly to the experimental imprecision.
The length of the reaction periods (table 2) indicates that the reactions were sometimes prolonged when pelleted samples were used. This probably occurred if the pellet remained on the cylinder of the sample holder when opened instead of falling to the bottom of the vessel where the solution was relatively well-stirred.
In several experiments as listed in footnote b of table 2, the rate of electrical heating during the chemical reaction was not sufficient to compensate for the initial rapid absorption of energy. The temperature of the calorimeter vessel dropped below that of the shield and for a brief period adiabatic conditions were not maintained. The method of calculating these corrections has been described previously [4].
5. Relative Apparent Molal Heat Content
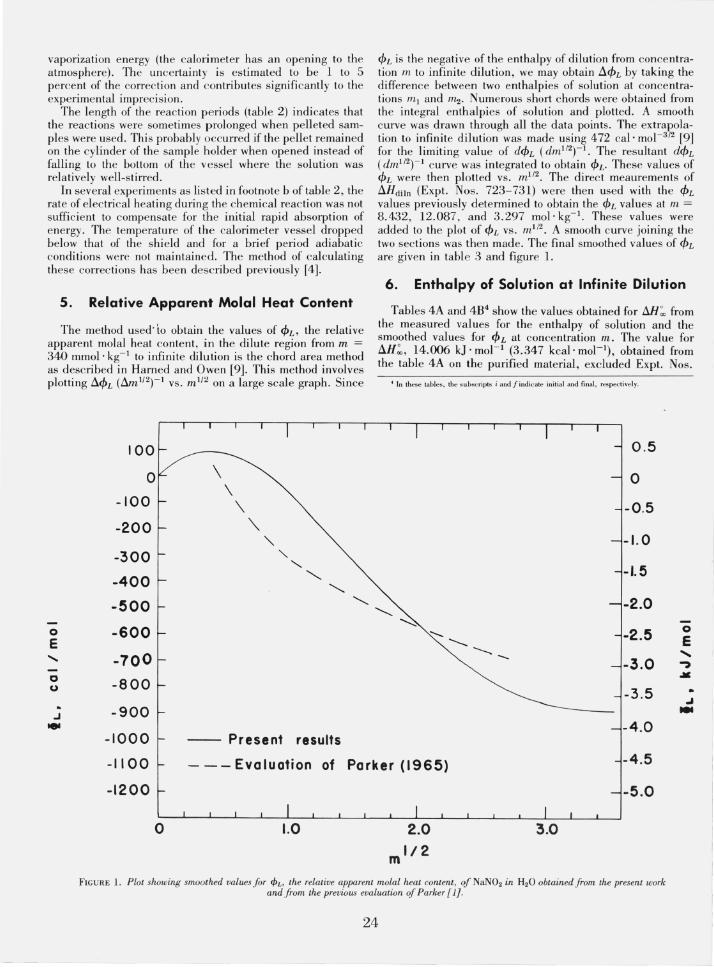
The method used' to obtain the values of 4>L, the relative apparent molal heat content, in the dilute region from m = 340 mmol' kg- I to infinite dilution is the chord area method as described in Harned and Owen [9]. This method involves plotting !l.4>L (!l.m 1/2)- 1 vs. m 1/2 on a large scale graph. Since
100
0
-100
-200
-300
-400
-500
0 -600 E
....... -700 0 -800 u
.J -900 lei
-1000 -- Present results
4>L is the negative of the enthalpy of dilution from concentration m to infinite dilution, we may obtain !l.4>L by taking the difference between two enthalpies of solution at concentrations ml and m'2' Numerous short chords were obtained from the integral enthalpies of solution and plotted. A smooth curve was drawn through all the data points. The extrapolation to infinite dilution was made using 472 cal, mol- 3/2 [9] for the limiting value of d4>L (dmI/2)-I. The resultant d4>L (dm1l2tl curve was integrated to obtain 4>L. These values of 4>L were then plotted vs. m1/2 . The direct meaurements of !l.Hdiln (Expt. Nos. 723-731) were then used with the 4>L values previously determined to obtain the (/>L values at m = 8.432, 12.087, and 3.297 mol·kg- I. These values were added to the plot of 4>L vs. m1/2. A smooth curve joining the two sections was then made. The final smoothed values of 4>L are given in table 3 and figure 1.
6. Enthalpy of Solution at Infinite Dilution
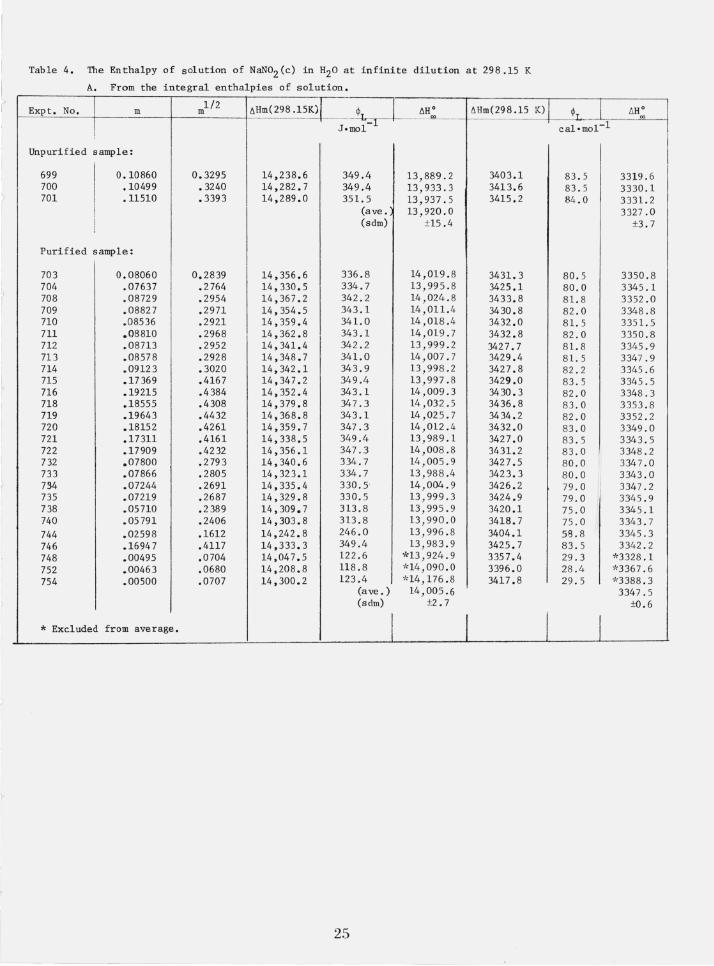
Tables 4A and 4B4 show the values obtained for !l.H "oo from the measured values for the enthalpy of solution and the smoothed values for 4> L at concentration m. The value for !l.H~, 14.006 kJ . mol-1 (3.347 kcal' mol-I), obtained from the table 4A on the purified material, excluded Expt. Nos.
4 In these tables . the subsc ripts i and f indicate initial and final , respectively.
0.5
0
-0.5
-I. 0
-1.5
-2.0
-2.5 0
e ........
-3.0 ~ .. -3.5 ... ... -4.0
-1100 - -- Evaluation of Parker (1965) -4.5
-1200 -5.0
0 1.0 2.0 3.0
m l/2
FIGURE 1. Plot showing smoothed values for <PL, the relative apparent molal heat content, of NaN02 in H20 obtained from the present work and from the previous evaluation of Parker [1 J.
24
>
------ - -----
Table 4. The Enthalpy of solution of NaN02 (c) in H20 at infinite dilution at 298.15 K
A. From the integral entha1pies of solution.
Expt. No. 1/2 6Hm(298.15K) ~T_~ 6Ho ~~8~iiil m m .. J.mo1
Unpurified sample:
699 I 0.10860 0.3295 14,238.6 349.4 13,889.2 3403.1 700 .10499 .3240 14,282.7 349.4 13,933.3 3413.6 701 I .11510 .3393 14,289.0 351.5 13,937.5 3415.2
(ave. 13,920.0 i (sdm) ±15.4 l
Purified sample:
703 0.08060 0.2839 14,356.6 336 . 8 14,019.8 3431. 3 704 .07637 . 2764 14, 330 .5 334.7 13,995.8 3425.1 708 .08729 .2954 14 , 367 . 2 342.2 14,024. 8 3433.8 709 .08827 . 2971 14, 354 . 5 343.1 14 ,011.4 3430 . 8 710 .08536 .2921 14,359.4 341.0 14 , 018.4 3432.0 711 .08810 .2968 14,362.8 343.1 14,019.7 3432. 8 712 .08713 .2952 14, 341.4 342.2 13,999 . 2 3427 . 7 713 .08578 . 2928 14,348.7 341.0 14,007. 7 3429 .4 714 .09123 . 3020 14,342.1 343.9 13,998.2 3427 . 8 715 .17 369 .4167 14,347.2 349 .4 13,997.8 3429.0 716 .19215 .4 384 14, 352 .4 343.1 14,009 . 3 3430.3 718 .18555 .4308 14,379.8 347 . 3 14,032.5 3436.8 719 .19643 .4432 14,368. 8 343 .1 14,02 5 . 7 3434.2 720 .18152 .4261 14,359.7 347.3 14,012.4 3432.0 721 .17311 .4161 14,338.5 349.4 13,989.1 3427 .0 722 .17909 .4232 14,356.1 347.3 14,008 . 8 3431. 2 732 .07800 .279 3 14,340.6 334.7 14,005 . 9 3427.5 733 .07866 . 2805 14,323.1 334.7 13,988.4 3423 . 3 734 .07244 .2691 14,335.4 330.5' 14,004.9 3426 . 2 735 .07219 . 2687 14,329.8 330.5 13,999.3 3424.9 738 .05710 . 2389 14,309.7 313.8 13,995.9 3420.1 74 0 .05791 .2406 14,303.8 313.8 13,990.0 3418.7 744 .02598 .1612 14,242.8 246 .0 13,996.8 3404.1 746 .16947 .4117 14,333.3 349 .4 13,983.9 3425.7 748 .00495 .0704 14,047.5 122.6 *13,924.9 3357 .4 752 .00463 .0680 14,208.8 118.8 *14,090.0 3396 .0 754 .00500 .0707 14,300.2 123.4 ~'14, 176.8 3417. 8
(ave. ) 14,005.6 (sdm) ±2.7
* Excluded from average. I I I
25
~ I I ca1.mo1-1
83 . 5 83 . 5 84.0
80 . 5 80 .0 81.8 82 .0 81. 5 82.0 81.8 81. 5 82 . 2 83 . 5 82 .0 83 .0 82 .0 83 .0 83 .5 83.0 80. 0 80.0 79. 0 I
79.0 75 .0 75.0 58.8 83.5 29.3 28.4 29.5 I
I
6Hq
I 3319 . 6 3330.1 3331.2 3327 .0
±3.7
3350.8 3345 .1 3352.0 3348.8 3351. 5 3350.8 3345.9 3347.9 3345.6 3345 . 5 3348 . 3 3353 .8 3352 . 2 3349.0 3343 . 5 3348 . 2 3347. 0 3343.0 3347.2 3345 .9 3345.1 3343.7 3345.3 3342 . 2
'~3328 . 1 '~3367 .6
1'3388.3 3347.5
±0.6

~ 0\
Table 4. (cont.)
B. From the differential enthalpies of solution; purified sample.
Expt. No. 1/2 1/2 lIHdiff lIH lIHdiff lIHint , m" ~L, m"
mi mf mi mf int, mE
J. 001-1 cal 1001-1 ca1.mo1-1
742 (738) 0.05710 0.11633 0.2390 0.3411 14,408.8 14,360.1
I 3443.8 3432.1 84.0
743 (740) .05791 .22718 .2406 .4766 14,368.8 14,352.2 3434.2 3430.2 79.0
745 (744) .02598 .19380 .1612 .4402 14,363.6 14,347.4
I 3433.0 3429.1 82.0
747 (746) .16947 .33788 .4117 .5813 14,220.2 14,277.0
I 3398.7 3412.3 64.0
751 (748) .00495 .16886 .0704 .4109 14,354.5 14,345.2 I 3430.8 3428.6 84.0
753 (752) .00463 .12738 .0680 .3569 14,351. 7 14,346.1 3430.1
I 3428.8 84.5
755 .000562 .12428 .(}237 .3525 14,326.3 14,325.2 3424. 1 *3423.8 84.0
756 .000562 .12439 .0237 .3520 14,359.0 14,357.6 3431. 9 I *3431. 6 84.0
I I avg. : -1 -1
I I *Ca1cu1ated using t.H11I (298.l5 K)(mt : 0.562 mmo1'kg ): 3357 ca1'mol ~-
Table 5. Enthalpies of dilution at 298.15 K
Expt. m ml/2 ¢r t.Hdiln No. initial final initial final initial final calc me as
cal'mol -1 cal.mol -1
727 3.297 0.02565 1. 8158 0.1601 -468 58.6 526.6 529.5
728 3.297 .02584 1. 8158 .1608 -468 58.6 526.6 521.9
723 8.432 .05846 2.9038 .2418 -849 75.0 924.0 915.5
724 8.432 .06177 2.9038 .2485 -849 75.5 924.5 934.7
731 8.432 .06242 2.9038 .2498 -849 76.0 925.0 918.1
725 12.087 .07937 3.4766 .2817 -890 80.0 970.0 976.1
726 12.087 .08127 3.4766 .2851 -890 81.0 971.0 966.1 ~ ~~-< -~-~~-.~~--, ~ - -,
~
I lIH~1 ::r-,
ca1.mo1
3348.1
3351. 2
3347.1
3348.3
3344.6
3344.3
3339.8
3343.6
3347.3
"
748, 752, and 754 because of relatively large experimental uncertainties; Expt. Nos. 755 and 756 of table 4B were also excluded s ince the enthalpy of solution for the initial solutions where m = 0.562 mmol' kg- I had not been experimentally dete rmined. The total or integral enthalpies of solution shown in table 4B were obtained from the combination of the experimental tlH", (298.15 K) of NaN02 (c) at the initial concentration and the measured differential enthalpy of solution.
As is evident from the values for the purified sample in table 4A, f1H : is not dependent upon the form (pelleted or loose) of the sample used. However, the unpurified sample results in f1H ~ = 13.920 kJ· mol- I (3.327 kcal' mol- I) which is 0.6 percent less than that for the purified sample.
Table 5 shows the agreement obtained between the calculated e n thai pies of dilution, ¢Lf - CPLi, and the measured values.
7. Discussion
Parker [1] tabulated the CPL values based on Perreu's [2] measurements of tlHdiin (287 K, m = 11.87 to 0.19 mol, kg- I) which she corrected to 298.15 K us ing the tabulated CPc values for NaN02 (aq). Our own measurements of f1Cp = -1.85 ± 0.1 J'g- I'K- 1 (-30. 5 cal'mol- 1'deg- 1) for the dilution are in reasonable agreement with those she used; therefore we have plotted the values of CPL as tabulated by Parker in figure 1 as well as those calculated here. Parker assumed ¢L = 40 cal· mol- 1 at the mole ratio, "H,P = 300; our value is 83 cal, mol- I. As is evident , the values are not in agreement, nor will a shift of 43 cal, mol - I bring the two curves into better agreement.
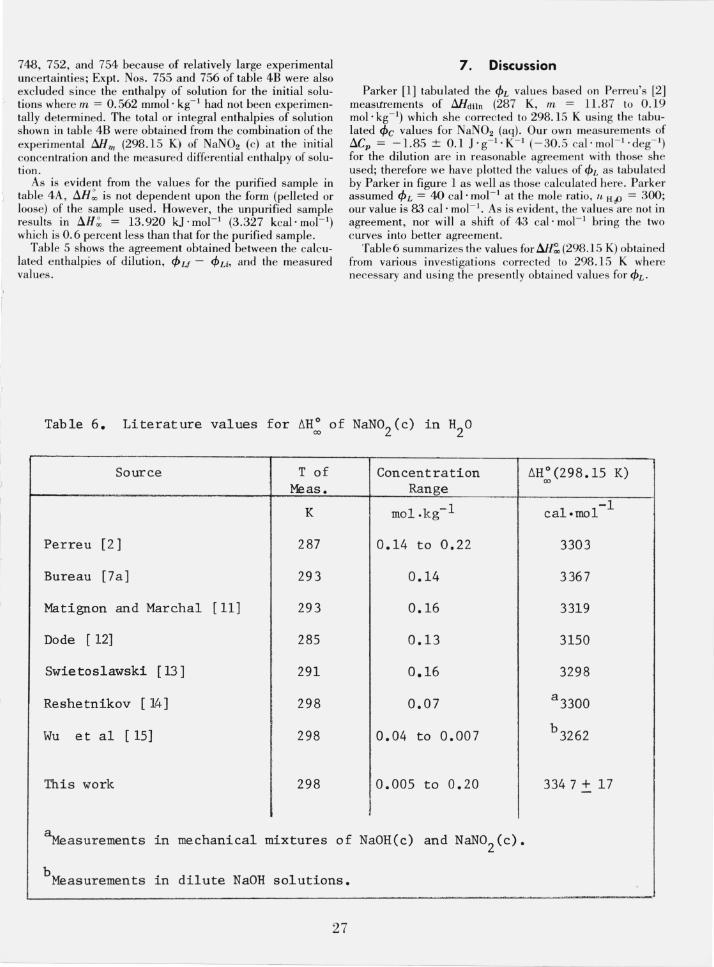
Table 6 summarizes the values for!1H~ (298.15 K) obtained from various investigations correc ted to 298.15 K where necessary and using the presently obtained values for CPL '
Table 6. Literature values for t.H~ of NaN02 (c) in H20
Source
Perreu [2]
Bureau [7a]
Matignon and Marchal [11]
Dode [12]
Swietoslawski [13]
Reshetnikov [14]
Wu et al [15]
This work
T of Meas.
K
287
293
293
285
291
298
298
298
Concentration Range
0.14 to 0.22
0.14
0.16
0.13
0.16
0.07
0.04 to 0.007
0.005 to 0.20
~asurements in mechanical mixtures of NaOH(c) and NaN02 (c).
b Measurements in dilute NaOH solutions.
27
-1 cal.mol
3303
3367
3319
3150
3298
3347+ 17
Our own measurements for tJ.Cp = -1.394 ± 0.014 J. g-l. K- 1 (-23.0 cal, mol- I. K- 1) at m = 100 mmol' kg- 1
indicate that the absolute value for CPc tabulated by Parker is too negative by 4 cal 'mol - l 'deg-~ We have made the adjustment for this in correcting those measurements not at 298.15 to 298.15 K. The "best" value for tili':-, (298.15 K) NaN02 (c) would now appear to be 14.0056 ± 0.0076 kJ'mol- 1 (3.347 ± 0.002 kcal' mol- I) with the uncertainty at the 99 percent confidence level. However, we have increased the over-all uncertainty to ±0.015 kJ· mol - I (±0.004 kcal' mol - I) to include an uncertainty in the extrapolation to infinite dilution.
8. References
[l] Parker, V. B. , Thermal Properties of Aqueous Uni-univalent Electrolytes, Nat. Stand. Ref. Data Ser., Nat. Bur. Stand. (U.S.), 2 ; 66 pages (April 1965).
[2] Perreu, J. , Compt. rend. 212,442 (1941). [3] Cases, J. C., Revue de Chimie minerale 10,577 (1973). [4] Prosen, E. J., and Kilday, M. V., J. Res. Nat. Bur. Stand. (U.S.)
77 A, (phys. and Chern), No.2 , 179-203 (Mar.-Apr. 1973). [5] Prosen, E. J. , and Kilday , M. V., J. Res. Nat. Bur. Stand. (U.S.)
77A, (phys. and Chern.) No.5, 581-597 (Sept.-Oct. 1973). [6] Commission on Atomic Weights , Pure and Applied Chern. 21, 91
(1970). [7] (a) Bureau, M. J. , Ann. Chim. 8, 1-142 (1937); (b) Swanson, H. E.,
Fuyat, R. K., and Ugrinic, G. M. , Nat. Bur. Stand. (U.S.), Circ. 539, IV, page 63 (1955).
[8] Internati onal Critical Tables, Vol. III , 82 (1928) (McGraw-Hill Book Co. , [nc., New York, N. Y.).
[9] Harned, H. S., and Owen, B. B. , The physical chemistry of electrolyte solutions, American Chemical Society Monograph Series, 3rd ed ition, 803 pp (R heinhold Publishing Corp. New York, 1958).
[10] Ferrer, P., Thesis, Madrid (1950). [11] Matignon, c., and Marchal , G., Comp\. rend. 170,232 (1940). [12] Dod';, M., Bull. Soc. Chim. France [5]4, 2093 (1937). [13] Swietoslawski, W., Z. physik. Chern. 72,49-83 (1910). [14] Reshetnikov , N. A., Zhur, Neorg. Khim. 6,682 (1961). [15] Wu, Ch., and Hepler, L. G., J. Chern. Eng. Data 7, 536 (1962).
28