entanglement of minke whales in scottish waters; an ...€¦ · creel losses amounted to 7-8% of...
TRANSCRIPT
Contract Report
Entanglement of minke whales in Scottish waters; aninvestigation into occurrence, causes and mitigation
Simon Northridge, Alexander Cargill, Alexander Coram (SMRU)Laura Mandleberg, Susannah Calderan (HWDT)
Bob Reid (SAC)
With an appendix by
Mirjam Held Wirz
Sea Mammal Research Unit
June 2010
Final Report to Scottish GovernmentCR/2007/49

2
Contents
Executive summary......................................................................................................................... 3Introduction..................................................................................................................................... 6Chapter 1: Stranded Animals: ......................................................................................................... 8
Analysis of Strandings Data........................................................................................................ 8Geographical Distribution......................................................................................................... 12Necropsies................................................................................................................................. 14Discussion ................................................................................................................................. 21
Chapter 2: Creel Fisheries............................................................................................................. 22Introduction............................................................................................................................... 22Methods..................................................................................................................................... 22Results....................................................................................................................................... 23
Official Statistics................................................................................................................... 23Interviews.............................................................................................................................. 27At Sea Surveys of Creel Fisheries ........................................................................................ 36
Discussion ................................................................................................................................. 37Chapter 3: Live sightings .............................................................................................................. 39
Introduction............................................................................................................................... 39Methods..................................................................................................................................... 39Results....................................................................................................................................... 41Discussion ................................................................................................................................. 42
Chapter 4: Comparing fishing distribution with whale distribution. ........................................... 44Minke whale distribution in the Hebrides................................................................................. 44Risk of Entanglement: co-distribution of whales and creels .................................................... 45Risk of entanglement for the rest of Scotland........................................................................... 46Potential mitigation strategies................................................................................................... 47Discussion ................................................................................................................................. 49
Chapter 5: Conclusions and recommendations............................................................................. 50Areas of further work................................................................................................................ 52
References:.................................................................................................................................... 53Appendix 1: Project leaflet. .......................................................................................................... 55Appendix 2: Necropsy protocol for entangled animals ................................................................ 57Appendix 3: MSc Thesis by Mirjam Held Wirz ……………………………………….…A1-A20
3
Executive summary
Entanglement of whales in static fishing gear is a widespread and global phenomenon that isgaining increasing attention, not least from the International Whaling Commission that requiressuch mortalities to be included in calculations for sustainable takes of whales.
In Scotland minke whales are relatively numerous but they and other baleen whales are known tobecome entangled in creel lines and other ropes. Little is known about the scale of the problem,but European member states are required to establish means of monitoring such mortalities.
In Scotland 30 baleen whales have been subjected to post mortem examination since 1990 andfor 16 of these entanglement was considered the probable (2) or actual (14) cause of death.Some other animals that had not been subject to a full post mortem are also known to have dieddue to entanglement.
In more than half of entangled baleen whales examined, there was evidence of rope lesionsaround the head or mouth, but other body parts were also often affected, so it is hard to makeinferences from dead animals about which parts of the body are entangled initially.
Geographically, minke whales appear to strand with roughly equal probability depending oncoastline length for all administrative regions, expect for Orkney and Shetland where they arereported more frequently and less frequently than predicted by coastline length respectively.
Only three whales were subject to post mortem examination during the study, though 23 werereported stranded. Most were in too advanced a state of decomposition to warrant examination,and some were logistically inaccessible. Two of the three animals examined showed evidence ofentanglement.
About 11 or 12 baleen whales strand every year in Scotland and about half of them appear tohave died due to entanglement. Not all animals that become entangled will die or becomewashed ashore.
The nature and extent of creel fishing activity was determined from official landings records,from interviews and from sightings of creel marker buoys collected during the summer of 2008from a research vessel platform in the Hebrides.
Although there are over 1100 vessels that fish with creels, most seem to do so only on a part timebasis. There may be as few as 300 vessels fishing with creels full time. The main target speciesare brown and velvet swimming crabs, lobsters and Nephrops. The main landing sites areScrabster, Stromness, Ullapool and Kirkwall.
While the number of days at sea appears to be greatest around the Firth of Forth, this is likelydue to many small boats or boats that only report occasional use of creels. Most of the catch istaken from the northern and western coasts.

4
We interviewed 50 vessel operators (skippers or crew) from 19 ports and visited another 30 portsto obtain background information. We covered the entire coastline including the northern andwestern isles.
Larger boats (>15m) tend to target crabs, especially in the northern regions, while Nephropscreels are mainly used on the west coast and by smaller vessels. Lobster is the main target formany of the smaller boats in all regions.
Most creels are steel framed, are fished in strings of typically 20 or 100, with a single main lineto which the creels are attached by short ropes, and with two end ropes attached to buoys ordahns at the surface. End lines are 1.33 times the depth of the water. A buoyant synthetic rope(“polysteel” ™) is most widely used. Rope diameters are from 8 to14mm with 10mm being themost commonly reported. Total number of creels used varied from 80 to 3000 per boat. Stringlengths varied from 300m to 4km with a mean of 1.1km in our sample. Average amounts of ropeused per boat were around 24km, with a clear relationship with vessel length.
Creel losses amounted to 7-8% of those fished per boat per year. On average this is about 90creels per year per boat.
Assuming a fleet of just 300 boats there would be around 7,500 km of creel lines in the waterthroughout most of the year around Scotland. The true total is likely much higher than this whenpart time boats are included.
Derived estimates of rope length being used on a regional basis, based on vessel size and ourinterview results, suggest that the Firth of Forth and Orkney regions have the highest km.days ofrope use. Parts of the Inner Hebrides are also areas of high rope use.
Sightings records of creels per km travelled in the Hebrides in the summer of 2008 suggest thatthe highest creel densities are to be found in the Sound of Sleat and the Inner Sound off the coastof the Applecross pensinsula.
Photos of minke whales have been collected since 1990 and a photo-library of at least 133individual whales is held by the HWDT. Two analysts both investigated photographs of minkewhales to determine the proportion of animals that bore evidence of previous entanglement –mainly through the identification of rope-like scars around parts of the body.
From these analyses an entanglement code (high, ambiguous, low or unknown likelihood ofprevious entanglement) was ascribed to each animal encountered. At least 5% of animals weregiven high likelihood entanglement codes, while up to 22% of animals had high or ambiguouscodes.
Among four body sectors, the head region had the highest incidence of entanglement-like scars,suggesting possible entanglement during feeding.
There were insufficient re-sightings of scarred animals to determine the accumulation rate ofentanglement scars.
5
The observed scarring rates are low compared with those reported in humpback whales in theGulf of Maine (Eastern USA) and south-eastern Alaska. Using such observations to estimate thenumber of lethal entanglements will require some estimate of the proportion of entanglementevents that result in the death of the entangled whale, which we have yet to address.
Encounter rates of minke whales in Hebridean waters have been plotted by 250km2 grid cells,based on sightings data collected over a 20 year period. Highest encounter rates are found in theMinches. Inshore encounter rates were lower.
These encounter rates are compared with sightings rates for creel markers collected by the R.V.Silurian, using a ‘risk of entanglement measure’ (REM) that essentially provides a high valuewhen both whales and creels are abundant and lower values where the overlap in distribution isleast pronounced.
Highest REM values in the Hebridean region are found around Skye and off North and SouthUist.
The same measure is applied to sightings rates of minke whales and estimates of creel density ata coarser spatial scale for all of Scotland. Highest rates are still found in the Hebrides, aroundSkye, but elevated REMs are also predicted for the coasts of Angus/Fife and Orkney.
Potential mitigation measures are described with reference to the measures being adopted in theUS to minimise endangered whale species entanglement in the Gulf of Maine regions. Measuresadopted there include Dynamic Area Management, where all gear must be removed from thewater for 15 day periods when and where aggregations of whales are observed, as well as a seriesof gear modifications. These include the mandatory use of weighted end lines, the use of weaklinks connecting end lines to marker buoys, the use of sinking rope on the creel main lines, and amaximum of two buoy lines per string.
Such measures are required in the US because right whales are critically endangered. No suchimmediate conservation threat has been identified in Scotland. The experience in the US shouldhelp determine any potential measures that might be useful in Scotland if, in consultation withindustry, it should be deemed useful to try to minimise whale entanglement, perhaps in certainhigh risk areas.
Further work should be directed at fine scale studies of whale movements and feeding behaviourin areas where creels are used to try to understand the risk of entanglement more clearly.

6
Introduction
Minke whales (Balaenoptera acutorostrata, Lacépède, 1804) are the smallest and mostnumerous of several species of baleen whale that frequent the waters around Scotland. Theyhave occurred regularly in the records of the UK cetacean strandings investigation programmesince its inception in 1990, and it has been noted that many of the carcasses that have beenexamined show signs of having died through entanglement in ropes of one form or another.
Entanglement of baleen whales in ropes, notably from static fishing gears such as lobster creelsand gillnets, is a well known phenomenon in many parts of the world. Member states of theInternational Whaling Commission (IWC) regularly report in excess of 200 such entanglementsworldwide annually (see e.g. IWC 2009, Annex J), and these are mainly just those that end up onthe market.
Northern right whales (Eubalaena glacialis) are subject to critical levels of entanglementmortality in lobster pot and gillnet fisheries in the north-eastern US and Atlantic Canadian waters(Kraus 1990, Caswell et al. 1999). Humpback whales are also known to become entangled notinfrequently in both Canadian and US Atlantic waters (Lien 1994, Robbins and Mattila 2001),with between 48 and 65% of whales photographed every year bearing some evidence of previousentanglement. Neilson et al. (2007) found that between 52 and 78% of humpback whales in thenorthern end of Southeast Alaskan (Panhandle) waters bore evidence of entanglement.
Other species known to be affected include grey whales (Baird et al. 2002, Bradford et al. 2009)and minke whales (Glass et al. 2008, Kim 1999), though it is probably true that any species ofbaleen whale that inhabits coastal waters runs some risk of entanglement in ropes and lines thatpeople use for fishing and for other purposes.
The purpose of the present report is to review what is known about this issue, and what more canbe deduced or discovered, for Scottish waters. Scotland has a large number of creel fishermenwho use pots (creels) to catch lobsters, crabs and prawns (Nephrops). Minke (as well as a fewhumpback and fin) whales are found right around the coasts, and entanglement is known to beone of the more commonly recorded causes of death among stranded whales. Although there isno a priori reason to suspect that entanglement of whales might represent a conservation issue inScotland, all incidental catches or killings of cetaceans need to be examined in order to addressobligations under the Habitats Directive. Furthermore, minke whales in particular are subject toannual hunts by Norwegian and Icelandic whalers in adjacent waters, and from the samebiological stocks. The IWC’s management procedure for baleen whale populations explicitlyrequires that mortality from bycatch in fisheries be taken into account when setting allowablecatch levels for whaling. Any mortality due to entanglement in Scottish waters would thereforeneed to be taken account of by the IWC in setting catch limits for Norwegian and Icelandicwhaling operations. In addition to this, entanglement of whales in fishing gear, even when notfatal to the whale, can cause considerable economic loss to the individual whose gear isremoved.

7
The objectives of the project were set out as follows:
1. Collate and review available data on past and present minke whale strandings whereentanglement is a contributing factor.
2. Conduct full scale necropsies on stranded minke whales where incidence of bycatch isevident, with the purpose of informing the origin of rope marks.
3. Investigate the extent of the implicated fisheries in Scotland (including the identificationof areas of high activity) and gear configurations.
4. Using existing sightings networks, investigate whether there is evidence of previousentanglement in live whales.
5. On the basis of the above information, determine the likelihood of co-occurrence betweenminke whales and fisheries, including any evidence of seasonality in such occurrences.
6. Identify areas around Scotland where the “risk” of entanglement is high, withrecommendations for possible mitigation proposed in these areas.
The report is divided into four chapters. Chapter 1 deals with data collected under the UKstrandings scheme, and addresses objectives 1 and 2. Chapter 2 addresses objective 3 and dealswith creel fisheries in Scotland. Chapter 3 addresses objective 4 by examining photographic dataheld by the Hebridean Whale and Dolphin Trust (HWDT). Chapter 4 addresses the final twoobjectives (5&6) and identifies areas of highest likely risk to minke whales and creel fishermen.Some initial thoughts on routes to the development of possible mitigation measures areelaborated. Each chapter has its own brief discussion.
During the project, at the request of Scottish Government, a leaflet was also prepared describingthe aims and objectives of the project. This is included as Appendix 1. Appendix 2 shows aprotocol we have developed for further work, while Appendix 3 is an MSc thesis from theUniversity of St Andrews that deals with an analysis of the photographic database that isdescribed in Chapter 3 in more detail.

8
Chapter 1: Stranded Animals:
Objective 1: Collate and review available data on past and present baleenwhale strandings
Analysis of Strandings Data
Data from the UK strandings scheme that have been collected since 1989 indicate that nearlythree hundred baleen whales have been record as stranded over these twenty years throughout theUK. Most of these (255 or 86%) have been minke whales Balaenoptera acutorostrata, theremainder has included fin Balaenoptera physalus , humpback Megaptera novaeangliae and seiwhales Balaenoptera borealis. The majority of UK baleen whale strandings have occurred inScotland (69%), and three quarters of all minke whale strandings have occurred in Scotland.
Table 1: Records of baleen whale strandings in the UK 1989 to 2009, by species.
Baleen WhaleSpecies Totals Scotland England Wales
NorthernIreland Isle of Man
Minke 255 192 50 5 7 1
Sei 3 1 2
Fin 27 6 18 3
Humpback 12 5 5 1 1
All 4 species 297 204 75 9 8 1
Within the UK as a whole, only 44 of the 297 stranded baleen whales have had a cause of deathofficially attributed to them, of which 17 (38%) were known or inferred cases of entanglement.Other causes of death included starvation, live stranding, still birth and physical trauma such asboat strikes. However, the cause of death is usually only affirmed when an animal has beennecropsied and a veterinary pathologist has inspected it. Sometimes necropsied animals may besuspected of having died due to entanglement, though the cause of death is recorded as unknown.Other cases may involve animals that have not been necropsied and for which no cause of deathhas been officially recorded, but for which circumstantial evidence, such as the presence of ropeswrapped around the animal, can strongly suggest entanglement as a factor.
Strandings records for Scotland from 1992 to September 2009 were reviewed in more detail. Atotal of 202 records of baleen whale strandings (6 fin whales, 5 humpbacks and 191 minkewhales) were recorded stranded in Scottish waters during that time period. Of these, some 30(17% of baleen whale strandings) had been subject to post mortem examination. In 16 cases ofthose examined (53% of post mortem examinations of baleen whales) the cause of death wasthought probably (2) or actually (14) to have been due to entanglement. Of the remainder, 4were live strandings, 2 were stillborn foetuses, 2 were thought to have died of post weaningstarvation, and in 6 cases the cause of death had not been determined. Entanglement is thelargest single identified cause of death among baleen whales subject to post mortemexamination, and is reported much more frequently among Scottish animals than those fromelsewhere in the UK.
9
We also found that there was some evidence for entanglement for another four animals (ropesreported around the carcase) for which no post mortem examination had been conducted.
Overall, there was evidence of entanglement for 20 of the 202 stranded baleen whales inScotland, though for many strandings that were not examined in detail evidence for entanglementcould have been missed, while the advanced state of decay in many cases would have limited thepossibility of detecting any rope marks.
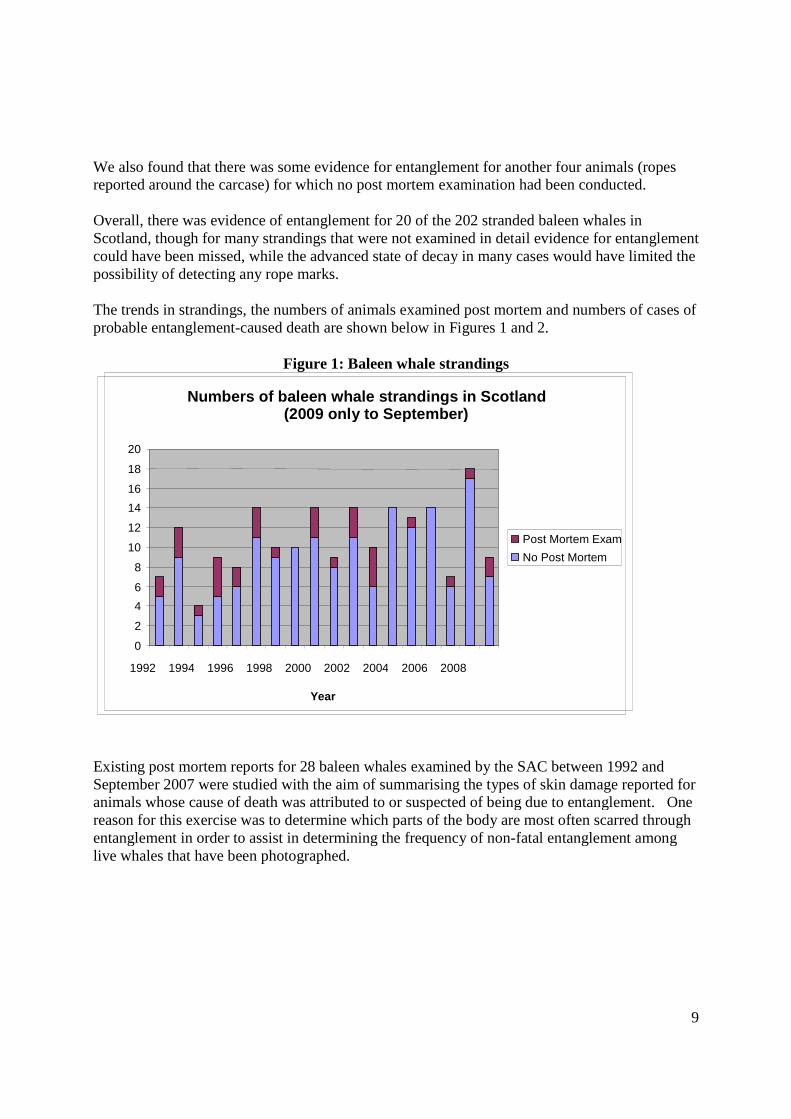
The trends in strandings, the numbers of animals examined post mortem and numbers of cases ofprobable entanglement-caused death are shown below in Figures 1 and 2.
Figure 1: Baleen whale strandings
Existing post mortem reports for 28 baleen whales examined by the SAC between 1992 andSeptember 2007 were studied with the aim of summarising the types of skin damage reported foranimals whose cause of death was attributed to or suspected of being due to entanglement. Onereason for this exercise was to determine which parts of the body are most often scarred throughentanglement in order to assist in determining the frequency of non-fatal entanglement amonglive whales that have been photographed.
Numbers of baleen whale strandings in Scotland(2009 only to September)
0
2
4
6
8
10
12
14
16
18
20
1992 1994 1996 1998 2000 2002 2004 2006 2008
Year
Post Mortem Exam
No Post Mortem
10
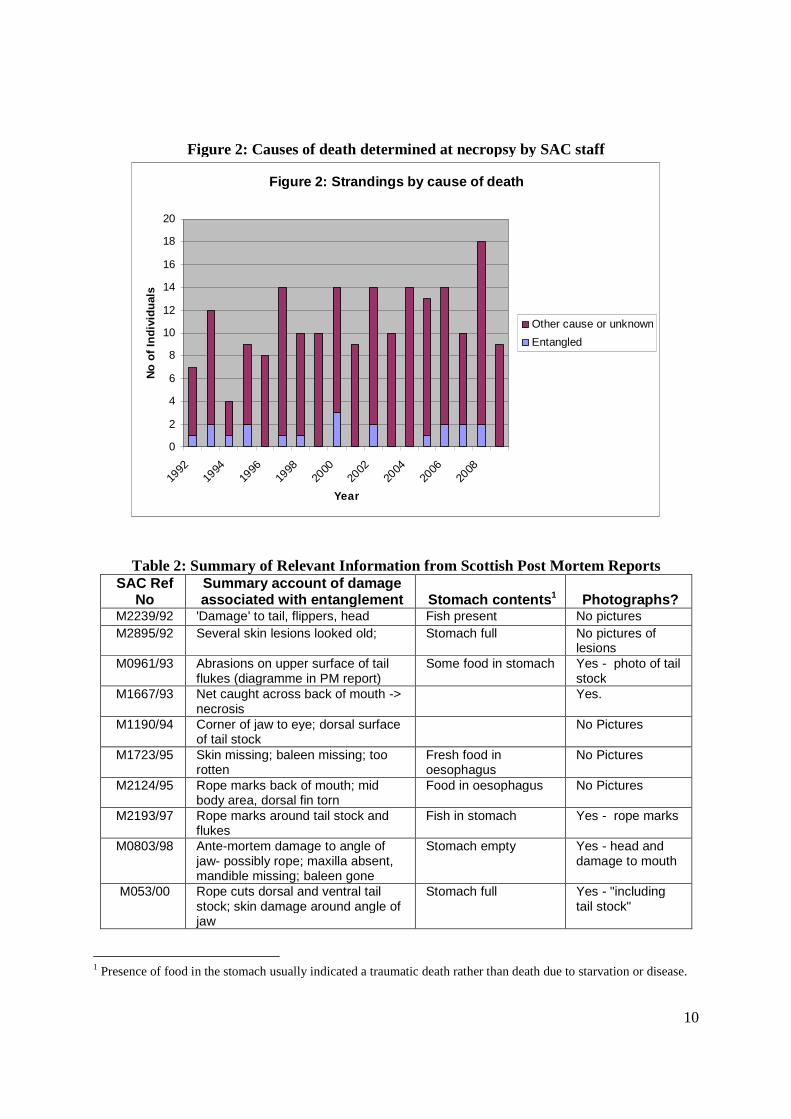
Figure 2: Causes of death determined at necropsy by SAC staff
Figure 2: Strandings by cause of death
0
2
4
6
8
10
12
14
16
18
20
1992
1994
1996
1998
2000
2002
2004
2006
2008
Year
No
of
Ind
ivid
uals
Other cause or unknown
Entangled
Table 2: Summary of Relevant Information from Scottish Post Mortem ReportsSAC Ref
NoSummary account of damageassociated with entanglement Stomach contents1 Photographs?
M2239/92 'Damage' to tail, flippers, head Fish present No pictures
M2895/92 Several skin lesions looked old; Stomach full No pictures oflesions
M0961/93 Abrasions on upper surface of tailflukes (diagramme in PM report)
Some food in stomach Yes - photo of tailstock
M1667/93 Net caught across back of mouth ->necrosis
Yes.
M1190/94 Corner of jaw to eye; dorsal surfaceof tail stock
No Pictures
M1723/95 Skin missing; baleen missing; toorotten
Fresh food inoesophagus
No Pictures
M2124/95 Rope marks back of mouth; midbody area, dorsal fin torn
Food in oesophagus No Pictures
M2193/97 Rope marks around tail stock andflukes
Fish in stomach Yes - rope marks
M0803/98 Ante-mortem damage to angle ofjaw- possibly rope; maxilla absent,mandible missing; baleen gone
Stomach empty Yes - head anddamage to mouth
M053/00 Rope cuts dorsal and ventral tailstock; skin damage around angle ofjaw
Stomach full Yes - "includingtail stock"
1 Presence of food in the stomach usually indicated a traumatic death rather than death due to starvation or disease.
11
M070/00 Skin missing too rotten Stomach with fish No pictures oflesions
M192/00 Small cuts in jaw; creel rope inmouth
No food Yes - rope marksin mouth
M005/02 Rope marks on flukes, cut in tailstock
Large amount recent No Pictures
M086/02 Rope marks mouth to mid body Food present No Pictures
M209/07 Rope or cable marks on epidermislateral right flank
Not examined Yes- cable marks -flank
M211/08 Rope marks on epidermis – flank,tail
Not examined Yes- probablyrope marks
Table 3: Summary of location of rope marks by body regionTotal number of descriptions 16No recent damage recorded / discernible (usually no skin left) 3Damage to mouth / head region 9Damage to tail stock or flukes 7Damage to mid region of body 6
A summary of the findings is shown in Tables 2 and 3. A fin whale examined on November 1st
2007 and a minke whale examined on 16th January 2008 under the present project have also beenincluded in this table. In 9 out of the 16 minke whales (56%) evidence of entanglement wasassociated with the mouth. This suggests entanglement in these minke whales has occurredwhile feeding. In seven cases skin lesions were reported around the tail stock, although in threeof these there was also evidence of entanglement in the mouth region. In only one case was thereany record of damage to the dorsal fin associated with entanglement.
These observations, though limited in number, suggest that entanglement may often occur whenthe mouth is open, or while feeding, although it is also entirely possible that some fraction ofentanglements also occur by the tail region alone (suggested in three or 19% of 16 cases). Theseobservations also suggest that only a small proportion of fatal entanglements result in damage tothe dorsal fin, the most obvious and easily photographed part of whales seen at sea, although insix out of 16 cases (37%) damage was evident in the mid region, which might be visible in a livewhale from the surface. Marks on the head and tail are usually less easy to detect on live animalsfrom the surface.
An important assumption here is that the marks left on a whale after a fatal encounter withfishing gear will have similar characteristics (in terms of distribution over the body surface) tothose observed in live whales that have survived an entanglement. It is conceivable that ropelesions to some parts of the body are more frequent in fatal entanglements that in entanglementsthat result in the animal escaping.
Aside from helping to identify the types of lesions associated with entanglement, the aboveanalysis also helps to inform on how entanglements might occur. While a majority ofentanglements involve some lesions to the head region and especially the mouth, it is clear that

12
whales can become entangled in a variety of ways. This suggests that there is no simple singlebehavioural characteristic involved.
Geographical DistributionAs a final part of our review of the strandings data we have also examined the geographicaldistribution of stranded baleen whales around Scotland. To this end we have examined thenumber of reported strandings 2002-2008 for all Scottish regions and compared these with thelength of coastline for each region. Coastline lengths for unitary authorities were taken from theonline Scottish Environment Statistics for 1998 published by the Scottish Office(http://www.scotland.gov.uk/library/stat-ses/sest2-1.htm). We have compared the number ofreported strandings with the expected number assuming that strandings should be in proportionto coastline length. Pearson’s Chi squared test was used to determine whether strandingsconformed to the null hypothesis that baleen whales strandings records are distributed by regionin proportion to coastline length.
Our initial assessment is that strandings are not recorded in proportion to coastline length (Table4: χ2= 64, 13 df, p<0.001), but by far the greatest discrepancies are found in Orkney andShetland, where 31 and 8 baleen whales strandings have been recorded respectively, whereas 15and 26 should have been expected based on the lengths of their respective coastlines.
Table 4: Whale strandings by region & coastline length: Scotland including Northern Isles
All regions including NorthernIsles
All reportedstrandings
% ofScottish
Coastline
Expected no ofstrandings(rounded) Chi Squared
Region
Aberdeenshire 9 2.02% 4 2.64
Angus 2 0.58% 1 0.34
Argyll and Bute 39 21.14% 43 0.43
City of Edinburgh 1 0.36% 1 0.07
Dumfries and Galloway 3 3.65% 7 6.59
East Lothian 4 0.64% 1 1.81
Fife 7 1.65% 3 1.89
Highland 57 27.86% 57 0.00
Moray 3 0.82% 2 0.59
North Ayrshire 3 1.59% 3 0.02
Orkney 31 7.24% 15 8.50
Shetland 8 12.76% 26 40.68
South Ayrshire 1 0.76% 2 0.30
Western Isles 36 18.92% 39 0.19
When these two regions are excluded, baleen whale strandings are indeed reported aroundScotland in proportion to the lengths of coastline by region (Table 5: χ2=15.17; 11df, p=0.17).This suggests that whales (or their carcases at least) are present in broadly similar densitiesaround the mainland part of the country and that there are no discernible biases in reporting by

13
region at least. Baleen whales by virtue of their size are not easily overlooked and also take along time to disintegrate. A humpback whale first reported at Auchmithie beach by Arbroath inFebruary 2007 was still largely intact in July 2009. This helps to maximise the probability that astranded whale is reported. Human population density is therefore less likely to affect reportingefficiency for whales than for smaller cetaceans.
Table 5: Whale strandings by region & coastline length: Scotland excluding Northern Isles.
Region: excluding NorthernIsles
All reportedstrandings
% ofScottish
'Mainland'Coastline
ExpectedNo of
StrandingsChi
Squared
Aberdeenshire 9 2.53% 4 2.59
Angus 2 0.72% 1 0.33
Argyll and Bute 39 26.42% 44 0.54
City of Edinburgh 1 0.45% 1 0.07
Dumfries and Galloway 3 4.56% 8 6.84
East Lothian 4 0.80% 1 1.79
Fife 7 2.06% 3 1.85
Highland 57 34.83% 57 0.00
Moray 3 1.03% 2 0.57
North Ayrshire 3 1.99% 3 0.03
South Ayrshire 1 0.95% 2 0.32
Western Isles 36 23.66% 39 0.26
Although there is little difference in the numbers of observed and expected whale strandingsamong the mainland regions, it is noticeable that all the eastern regions (unshaded cells in theregion column) have marginally more strandings than expected while all the western regions(shaded cells) have marginally fewer than (or the same as) expected. When west coast regionsare compared to east coast regions there are in fact significantly more than expected strandingsdown the east coast and significantly fewer on the west coast. (χ2=8.95; 1df, p=0.0028). Thissuggests either that there are more whales dying and stranding on the east coast or that reportingof carcases is better on the east coast which is more densely populated. If whales stranded onthe west coast as frequently per km of coastline as those on the east coast, one would expectabout ten more whales per year to be reported from west coast locations. It is not possible to saywhether this difference might be explained by under-reporting. The possibility of higherabundances and/or more whales dying in east coast waters is revisited in Chapter 4.
Overall, while there is reasonably good agreement between the number of whales reportedstranded by region and the coastline lengths, this is not true for the Northern Isles. About onewhale more than expected is reported from Orkney coasts every year, and about one whale peryear less than expected is reported from Shetland. Again, this may be due to reporting efficiencyor to differences in whale densities (more whales around Orkney than Shetland) – or moreimportantly, differences in the numbers of whales dying in Orcadian waters compared to thosearound Shetland.
14
Necropsies
Objective 2. Conduct necropsies of stranded whales where incidence ofbycatch is evident, with the purpose of informing origin of rope marks.
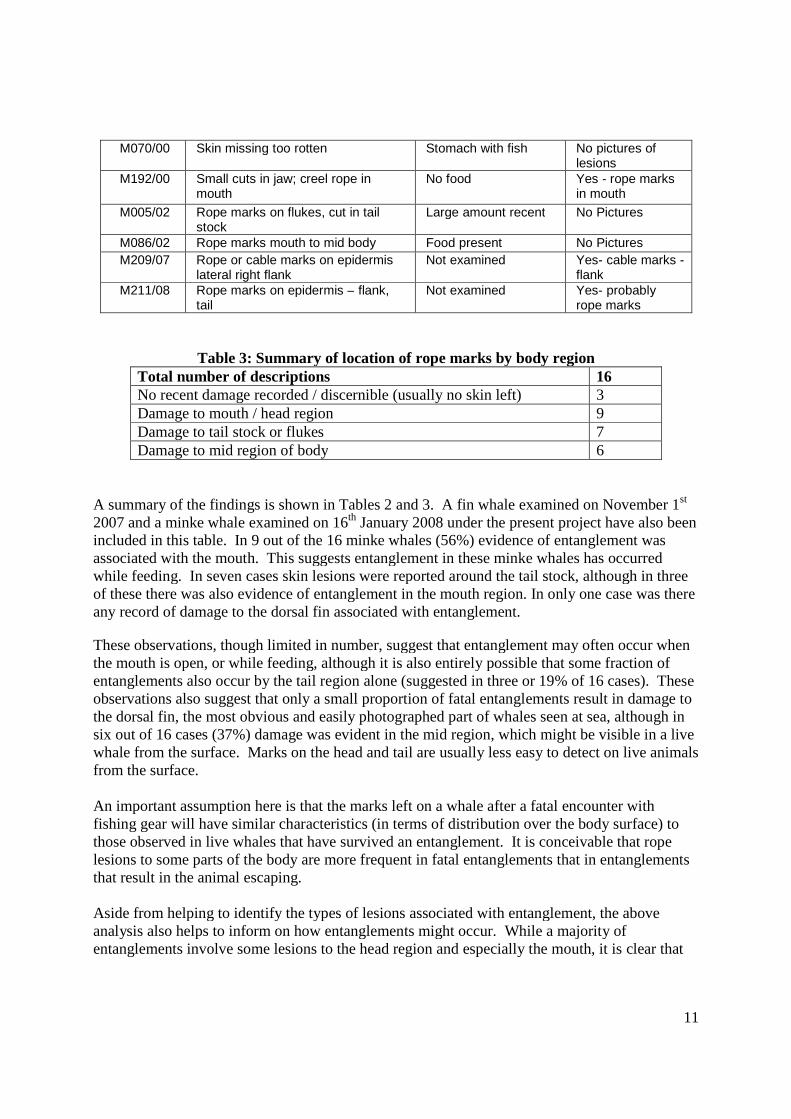
Over the course of the project (October 2007-July2009)23 baleen whales were reported strandedin Scotland. Two of these were fin whales and the rest were minke whales. Many of theseanimals were in remote places and most were clearly in an advanced state of decay where thereis little hope of determining cause of death. Often, photographs sent by local authorities ormembers of the public can confirm that there is little point in attempting a necropsy (see Figure 3for example).
Figure 3: Minke whale in advanced state of decomposition: Port William, Dumfriesand Galloway, March 2008.
Of the 23 stranded baleen whales in Scotland between October 2007 and July 2009, 14 were inadvanced to skeletal stages of decomposition. Of the remaining 9, 2 had live stranded, so thatonly 7 were in fresh / fair to moderate states of decomposition. Not all of these could beexamined owing to various logistical constraints. One was disposed of promptly by a localcouncil, while remoteness and staff availability constrained other cases. Figure 4 shows anotherminke whale at Kincraig Point, close to St Andrews, that could not be accessed for safetyreasons.
Overall, three baleen whales were subject to post mortem examination during the project. Fortwo of these – a fin whale at Stoer in Highland and a minke whale at Westray in Orkney, thecause of death was determined as probably entanglement (a third animal – a minke at Islay hadbeen hit by a ship). Another animal was reported floating at sea entangled in creel lines, though itwas well decomposed.

15
Figure 4: Minke whale wedged in a gully at Kincraig Point, Fife November 2008
There were therefore only two animal carcasses that were examined by SAC staff and that hadevidence of entanglement. The first was a slightly decomposed fin whale that stranded at Stoernear Lochinver in the Highlands in October 2007. This animal was in a moderate state ofdecomposition and had several linear braided abrasions running around at least part of theabdomen of the animal. These abrasions or impressions appeared to have been made by ropes orcables of around 5cm in diameter, and appeared rusty in colour, suggesting they may have beenmetal wires. The impressions had been made ante-mortem, as subcutaneous haemorrhagingassociated with the impressions was detected. The cause of death was given as probableentanglement. (See Figures 5-8). An examination of the stomach contents was made at the site,but no evidence of recent feeding was found..
The second animal that was examined was a moderately decomposed minke whale that strandedat Westray in Orkney in January 2008 (see Figures 9-12). This animal also had several linearrope marks round parts of the trunk, and again the cause of death was diagnosed as probablyentanglement. A sketch of the scarring patterns was made at the time, but this prompted us todevelop a more systematic template onto which we could in future record any rope marks, scarsor abrasions on any stranded whales in future. This is shown in Appendix 2.
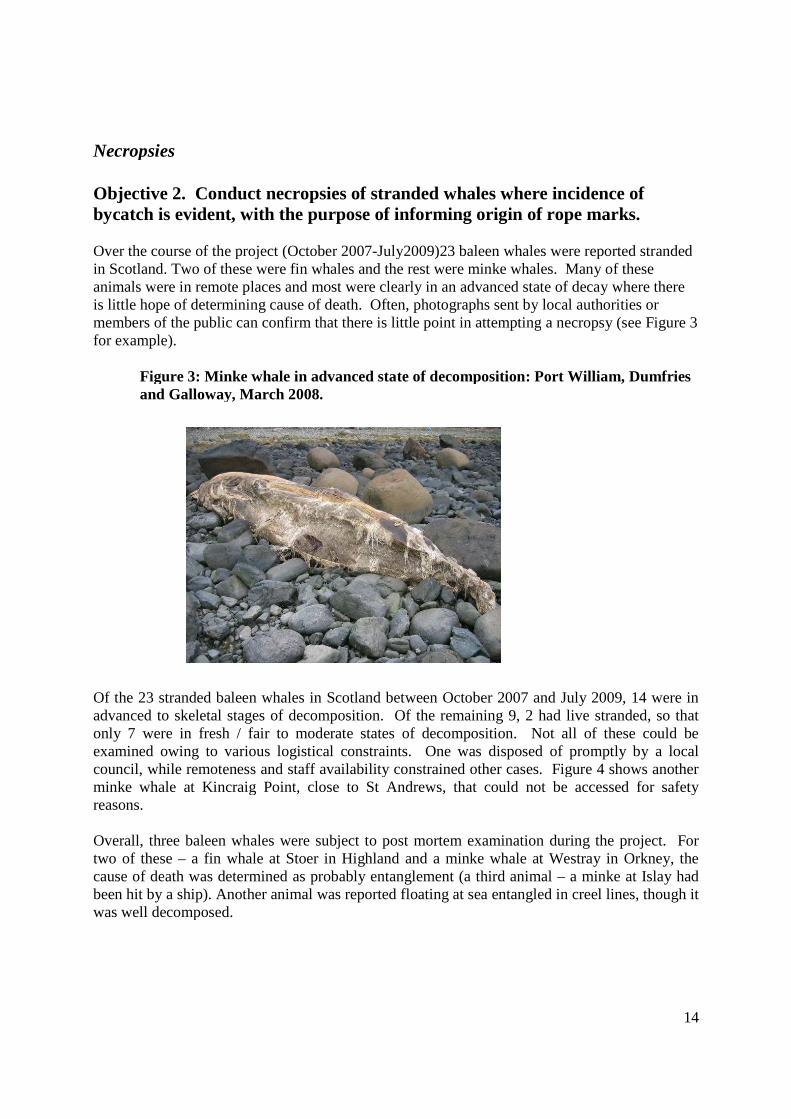
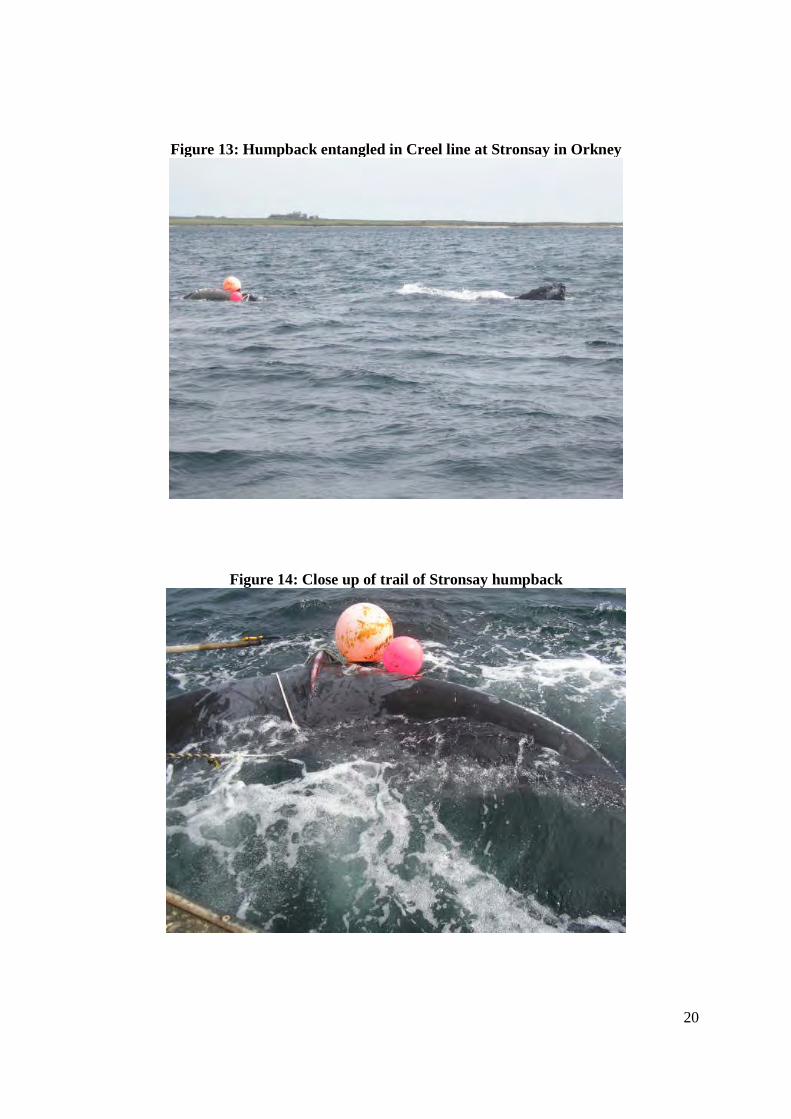
In addition to these two animals that were examined on the beach, another minke whale wasreported floating at sea, entangled in creel lines, at Gills Bay on the North Coast of Caithnesseast of Thurso. A humpback whale was also found alive and entangled in creel lines at Stronsay

16
in Orkney in May 2008. This was released alive, but some of the pictures taken at the sceneillustrate the ways in which creel lines can become caught around a whale’s tail (Figures 13 and14 below).
Figure 5: Stranded fin whale at Stoer, Highland, October 2007
Figure 6: Rope marks (possibly metal) on the flank of the animal

17
Figure 7: Rope marks showing braiding with scale
Figure 8: Subcutaneous haemorrhaging associated with rope marks

18
Figure 9: Minke whale stranded at Westray, Orkney, January 2008
Figure 10: Tail showing marks typical of rope entanglement (see also Fig 14)

19
Figure 11: Probable rope marks – too decomposed to determine braiding
Figure 12: Further possible rope marks on Westray Minke
20
Figure 13: Humpback entangled in Creel line at Stronsay in Orkney
Figure 14: Close up of trail of Stronsay humpback

21
The fin whale at Stoer appears to have become entangled in some heavy cables or wires, such asthose used by trawlers for example, and the 50mm wide abrasions do not suggest any interactionwith creel boats. We are unable to do more than speculate on the cause or circumstances of theentanglement.
The minke whale at Westray was too decomposed to make any detailed assessment of the typesof rope involved in its entanglement, but these appear to have been more in line with the size ofropes used in creel fisheries or other static gear (typically 6 – 14mm polypropylene ropes).
The two whales encountered at sea were both entangled in creel lines.
Although every effort was made to attend as many strandings as practicable, logistical issues,access and the decomposed state of many animals limited our ability to assess rope marks onmany animals. As a result of the present project SAC and SMRU have agreed to continue tocollaborate on this issue in the future and will continue to examine suitable whale carcasses forevidence of entanglement to try to elucidate how whales become entangled and by which sorts ofropes and fishing gear. SAC will use the agreed template (Appendix 2) to record the locations ofany rope marks on further stranded whales.
DiscussionOur examination of the strandings reports suggests that at least half of all baleen whales thatstrand in Scotland may have died due to entanglement. Creel lines are specifically mentioned inseveral instances. There are about 11 or 12 baleen whale strandings reported every year inScotland so it is not unreasonable to suppose that 5 or 6 of these are likely to have run foul ofcreel lines or other fishing gears. Not all entangled whales will wash ashore. The proportion ofwhales that become entangled but escape is unknown. The proportion of whales that strand oncethey have died is also unknown.
Our examination of previous records did not suggest any obvious single way in which whalesbecome entangled. At least half appear to have ropes associated with the head region, but forsome it is just the tail. Further work will be needed, possibly involving more detailedexamination of live animals to elucidate this issue.
We found that slightly more whales than expected are reported from Orkney and fewer thanexpected from Shetland. There were also slightly fewer than expected on the west coastcompared to the east coast. It is not possible to say whether these differences are due to actualdifferences in the numbers of dead whales present in these regions or to differences in humanreporting efficiency, though the longevity of whale carcases (which may make them more likelyto get reported) might suggest there is a difference in the number of carcases present. Whetherthis has any relationship with entanglement issues is a moot point.
The examination of dead whales in order to determine whether and how entanglement may haveoccurred is difficult both because of the remoteness of many strandings sites and because manyof the stranded whales are very well decomposed by the time they become stranded. Carefulexamination of freshly dead whales in the future may reveal more, but this will take time.

22
Chapter 2: Creel Fisheries.
Objective 3: Investigate the extent of the implicated fisheries in Scotland(including the identification of areas of high fishing activity) and gearconfigurations.
Introduction.Whale entanglements in various sorts of rope are clearly not uncommon. We assume here thatmost such ropes are associated with creel fisheries. The reasons for this are that other potentialsources of rope for entanglements are much less abundant in the marine environment than theropes associated with creel fishing and because creel or pot lines are frequently cited as the causeof entanglement in strandings reports. Other potential causes of entanglement might includelines associated with trawling, with moorings or with other forms of static gear such as gillnets.Trawl entanglement seems inherently less likely than static gear entanglement, because thewarps and lines associated with trawls when they are in the water are usually taught, providinglittle opportunity for a whale to wrap a line around itself. Furthermore, there is relatively littleline associated with each trawl – perhaps a few hundred metres. Any close encounter between awhale and a trawl would seem more likely to end with the animal becoming caught in the trawland possibly entangled in the webbing. Abandoned trawl netting is widespread and at least oneminke whale appears to have been killed through ‘entanglement’ with a piece of trawl netting.
Mooring ropes could theoretically entangle a whale, but these are usually only found in a veryrestricted proportion of the sea-space, mostly in harbours and anchorages where one mightexpect whale abundance to be very low. By far the most common form of rope in the wateraround the UK belongs to static fishing gears, as anyone who has seen the number of markerbuoys in coastal waters around the UK can attest. The two major fishery types are static nets andcreels or pots. In Scotland creel fishing dominates this sector. In 2008 there were just 738fishing days at sea by Scottish boats using all forms of gillnets and nearly 56,000 days byScottish boats using pots or creels.
In this section we have assessed the nature and extent of creel fisheries, aiming to determine theamount of rope typically deployed in coastal waters, and the distribution of creel fishing effortaround the country.
Methods
In order to better understand the nature and scale of Scottish creel fisheries we relied upon threesources of information. Firstly we used the existing landings records collated by Marine Scotlandto determine the overall scale of fisheries in terms of the numbers of boats and distributions oflandings of shellfish taken in creels. Secondly, by touring the ports of the country, weinterviewed creel fishermen in as wide a range of locations and as wide a range of vessel types aspossible. Thirdly, for the west coast alone, we have collated sightings data of creel marker buoys
23
in inshore waters, as recorded during research cruises by the HWDT vessel Silurian. With thesesightings we have compared the observed and the reported fishing effort distribution, and canalso observe some of the fine scale patterns of creel deployment.
Fleet statistics are collected by fishery officers around the country. All boats over 10m in lengthare required under EU law to complete logbooks that detail the methods of fishing employed, thenumber of days at sea and the landings. Data on under-10m boats are mostly collated fromlandings slips and sales notes. These data are primarily intended to monitor landings, and theassociated effort data are therefore not always as reliable as could be hoped, but neverthelessprovide an overview of trends through time and of effort distribution by region. Data are held inEdinburgh, but also provided to the Marine and Fisheries Agency in London who hold a UKdatabase of fishing fleet activity. Data were provided by the MFA to include the landings byICES rectangle and by gear type on a trip by trip basis, which includes the duration of each trip.“Days at sea” is therefore the unit of fishing effort. Some data are held on more detailed fishingeffort, but previous analyses of these same data has shown that the recorded effort data (e.g.number of pots or gillnet lengths used) are not a reliable reflection of actual fishing effort. Thereis no mandatory requirement to report detailed fishing effort so we have only used days at sea asa primary record of the amount of fishing effort.
Because effort data were made available by trip we could also determine how many vessels inwhich areas are recorded as having made fishing trips using creels.
Interviews were conducted by one of us (A. Cargill) during many trips along and around thecoast. Interviews were semi-structured. The interviewer did not use a form, but rather engagedcorrespondents in conversation bearing in mind a short number of key questions and a longnumber of less essential ones. Assessments were made at some ports where no fishermen couldbe found, based on visual inspection of the boats tied up and from conversations with otherfishermen or port officials.
The Silurian is a 16m ketch that is used by the HWDT to survey the coastal waters of westernScotland for whales, porpoises and dolphins every summer. During the summer of 2008,observers on board the Silurian also collected sightings records of creel buoys that mark the endsof lines of creels, in order to map the distribution of creel fishing effort in coastal waters.Sightings of creels have been standardized by tracklines length to provide an index of creeldensity at the 10 minute scale.
Results
Official Statistics
In 2008 there were 1163 Scottish registered vessels recorded as having fished with pots(=creels). By examining how many days each of these vessels had been reported to have fishedwith pots, it becomes clear that a majority are probably part time vessels (see Figure 15).

24
Figure 15: Distribution of fishing effort by vessels in the Scottish fleet
Days at Sea by 1163 Scottish Creel Fishing Vessels
0
50
100
150
200
250
300
0-10
20-3
0
40-5
0
60-7
0
80-9
0
100-
110
120-
130
140-
150
160-
170
180-
190
200-
210
220-
230
240-
250
260-
270
280-
290
300-
310
320-
330
Number of days at sea
No
of
vessels
rep
ort
ed
fish
ing
Some vessels known to us as trawlers appeared among the list of boats as having fished withcreels. Small amounts of creel fishing effort by vessels that are primarily trawlers may berecorded in order to maintain a track record in a fishery as a hedge against any future fishingrestrictions. Of the 1163 boats recorded as fishing with creels in 2008, 866 were reported tohave fished for fewer than 50 days, and 457 of those for fewer than 20 days. Discounting vesselsthat were recorded as having fished for less than 50 days leaves a ‘more-than-minimal-time’ fleetof 297 vessels. Even among these vessels however, there are appear to be a large number ofpart-time or seasonal boats. A full-time boat might be expected to fish for at least 150-200 daysper year - allowing for poor weather, maintenance etc. Only 92 vessels were reported to havefished with pots for more than 150 days in 2008.
By examining the landings of shellfish taken by creels on a port by port basis, we can alsodetermine something of the spatial distribution of creel fishing around the country. There were222 landing creeks at which creel landings were recorded in Scotland in 2008. For only 124 ofthese did landings exceed 10 tonnes. The top thirty ports, in terms of live weight of tonneslanded, are shown in Table 6. Total landings exceed 13,800 tonnes live weight. The mainspecies are lobster (1 Kt), crabs (brown crab (7.5Kt) and velvet swimming crab (2.7Kt)) andNephrops (1.7Kt). Green crabs (205t), whelks (271t), crawfish (6t) and a few other species makeup the rest.

25
Table 6. The 30 main creel landings ports as defined by tonnages of reported landings, broken down by species.
Landing portTotal tonnage landed
by creels Velvet crabs Brown crabs CrawfishGreenCrab Lobsters Nephrops Whelks Others
Scrabster 935.51 10.14 905.89 0.02 19.31 0.14
Stromness 903.42 44.54 818.35 21.34 15.58 1.67 3.61
Ullapool 832.64 0.15 782.81 0.05 6.01 43.20 0.42
Kirkwall 565.64 363.91 113.70 0.04 49.77 21.56 0.06 9.21 16.61
Westray 473.33 93.77 348.92 0.01 6.61 19.23 4.80
Loch Scridain (Isle of Mull) 396.06 36.67 311.77 0.18 1.44 24.02 21.90 0.07
Tingwall 370.49 176.91 159.44 0.01 15.79 18.32 0.02
Fraserburgh 345.38 32.69 300.00 8.32 0.98 3.38
Portaskaig 311.17 131.57 152.13 0.09 5.03 18.75 1.22 2.37
South Uist and Eriskay 291.89 72.35 102.28 1.80 3.72 36.79 74.23 0.72
Fionnphort 261.61 25.57 229.62 1.51 3.13 1.69 0.09
Wick 257.48 9.39 174.46 6.49 67.14 67.13
Lerwick 200.67 128.49 17.44 5.25 4.56 44.94 0.00
Pittenweem 200.17 28.23 88.91 0.04 23.71 1.66 57.63
Arbroath 184.93 84.48 47.50 51.46 1.48
Erribol 179.34 2.15 68.25 0.00 104.54 4.37 0.03
Tarbert 173.22 60.93 24.21 0.09 4.05 4.88 75.15 1.01 3.93
Torridon 168.27 2.74 89.53 0.13 0.23 0.28 75.34 0.02
South Harris 162.44 8.75 32.75 0.03 8.87 112.04 0.00
Oban 161.87 25.42 67.24 1.71 4.96 62.00 0.55 0.54
Tiree 153.40 85.67 41.35 0.72 0.52 24.84 0.29
South Ronaldsay 151.99 30.88 95.22 3.01 22.56 0.32
Kyle 151.34 3.31 14.32 0.00 0.33 133.31 0.07
Stornoway 148.20 29.95 89.15 0.21 4.14 24.77 0.00
Tobermory (Isle of Mull) 145.53 33.87 101.92 0.00 6.29 3.45 0.00
Portree 138.52 9.11 52.29 0.00 1.21 75.90 0.01
Castlebay 138.28 33.22 73.02 0.19 3.23 23.95 4.54 0.13
Port Ellen 132.94 59.20 61.10 0.01 2.23 9.90 0.42 0.03 0.07
Northmavine 129.25 2.39 125.41 0.64 0.80
26
Fishing effort can be plotted by ICES rectangle, which is the smallest unit by which it is recordedin the official statistics. Each fishing trip is recorded together with the total number of days atsea during the trip, and the landings by species and by weight from each ICES rectangle fishedduring the trip. Most trips only record landings from a single ICES rectangle, but some vesselsfish in more than one ICES rectangle during a trip. In most cases it is therefore straightforwardto allocate all the days at sea for that trip to a single ICES rectangle. Where landings arerecorded from more than one ICES rectangle there is no easy way to determine how much effortshould be allocated to each rectangle. We have pro-rated the effort among ICES rectanglesbased on the proportions of the catch taken from each rectangle. Thus a 3 day trip making equallandings from two ICES rectangle would results in each of the rectangles being attributed 1.5days at sea.
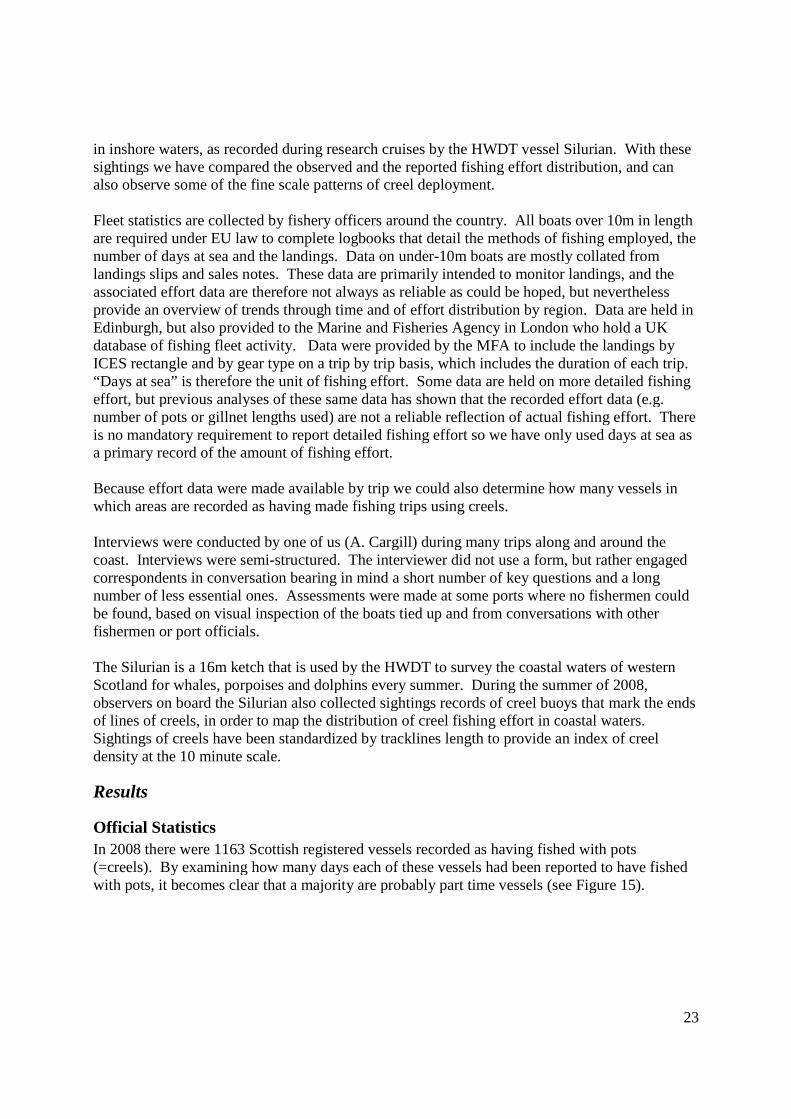
We have summed the effort (days at sea) for the entire Scottish fleet by ICES rectangle (1 degreeof longitude by ½ degree of latitude). The resulting map of fishing effort is shown in Figure 16.
Figure 16: Distribution of reported days at sea by Scottish creel boats (2008)
Mapping out the number of days at sea in this way reveals that the greatest fishing effort appearsto be focused in ICES rectangle “41E7”, which covers the east coast from just south of Arbroathto Dunbar. This area is home to a large number of small boats, but is not normally considered tobe the centre of creel fishing. Most of the larger boats, that fish the greatest number of creels, arebased further north and indeed on the west coast. If landings as expressed by tonnes live weightby rectangle of capture are presented, a rather different picture emerges, with most ‘fishing’ nowfocused around Orkney and along the west coast (See Figure 17).

27
Figure 17: Distribution of catches by creel boats by ICES rectangle (2008)
The problem with interpreting these data in the context of minke whale entanglement is thatneither of these figures adequately represents the number of creels nor the amount of rope in thewater. Smaller boats would be expected to set fewer creels, so that days at sea do not give areliable indication of the distribution of creels nor the ropes associated with them. Likewise,catch rates per creel are unlikely to be the same throughout the fishing zone, especially as severalspecies of shellfish are being targeted, so that landed weight does not necessarily give a goodindication of the number of creels either. To obtain a better picture we have relied uponinterviews to determine the nature and extent of creel fishing operations.
Interviews
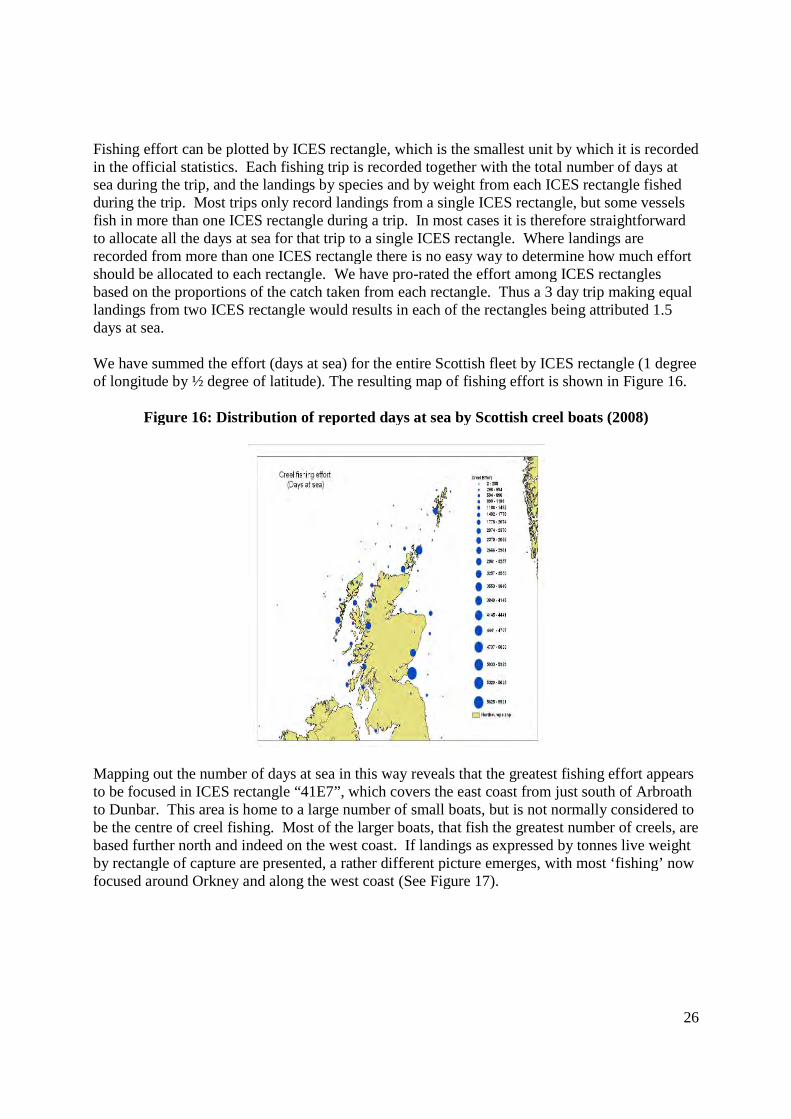
In total 49 ports were visited (of 222 at which creel landings occurred in 2008), but it is notalways possible to locate relevant vessel operators during such visits. Interviews were conductedwith 50 individuals (skipper or crew members) from 50 vessels in 19 different ports. Thegeographical spread of ports visited and of interviews made is shown in Figure 18. Visits toports where no-one could be located were used mainly to validate the information suppliedduring interviews and to ensure that there were no major discrepancies with our overalldescription of the fisheries concerned. Limited information on the types of creels being fishedand the creel boats in harbour were collected.
The locations of ports visited and the locations of vessel home ports from interviews shown inFigure 18 suggest that geographical coverage of the country is good, which we hope will helppick up any broad scale geographical differences in creel fishing.
28
Figure 18: Distribution of 50 interviews and other port visits during the project
OverviewOf the 50 boats interviewed 6 described their main target species as crabs, 32 as lobsters and 11as Nephrops. Generally speaking the larger boats focused mostly on crabs, and the lobstervessels (higher value, lower volume landings) tended to be smaller boats (all <15m). Regionally,all the boats (n=14) interviewed on the east coast (Moray to Berwick) considered lobsters to betheir main target, and all were under 10m. In the Northern Isles and North coast ports (n=18),crabs and lobsters were both mentioned and there were several boats over 10m, and one of 18m.On the west coast, lobsters, crabs and Nephrops were all mentioned as primary target species (18vessels), and again there were a number of larger vessels involved (maximum 37m).In summary Nephrops fishing was reported confined to the west coast, all six vessels over 15mreported crab was their main target, as did a few of the smaller boats. There did not seem to beany difference in size between lobster and Nephrops boats.
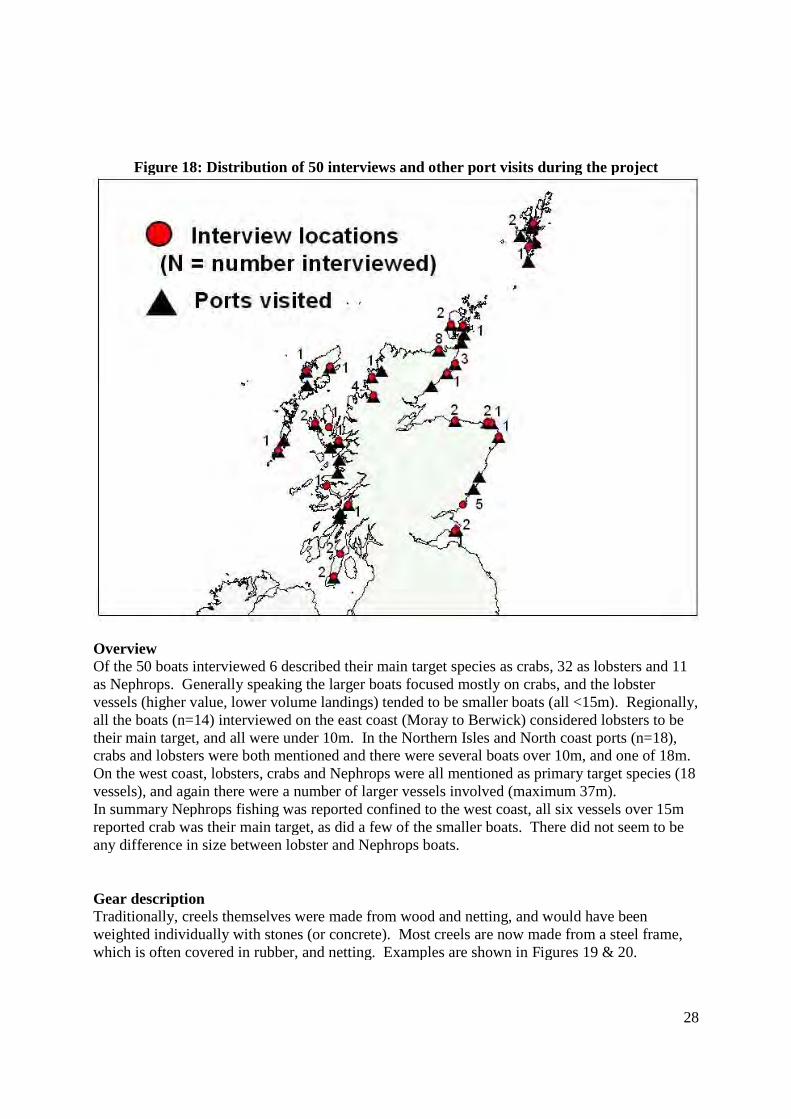
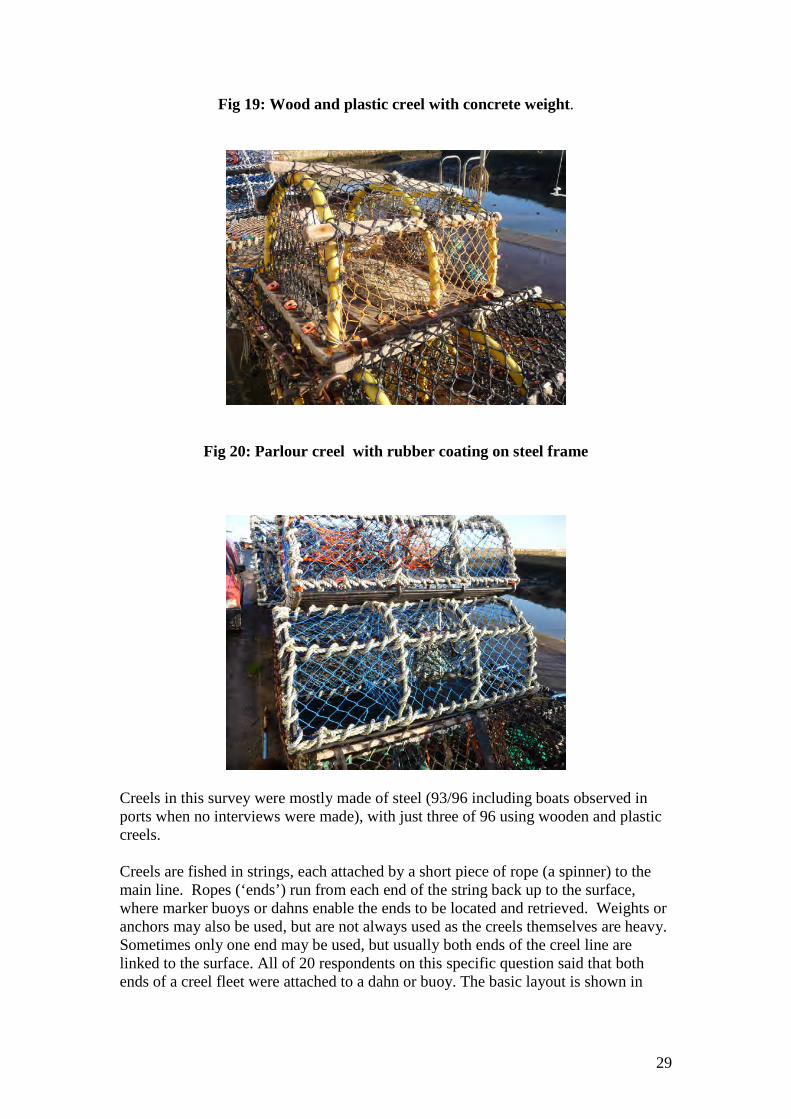
Gear descriptionTraditionally, creels themselves were made from wood and netting, and would have beenweighted individually with stones (or concrete). Most creels are now made from a steel frame,which is often covered in rubber, and netting. Examples are shown in Figures 19 & 20.
29
Fig 19: Wood and plastic creel with concrete weight.
Fig 20: Parlour creel with rubber coating on steel frame
Creels in this survey were mostly made of steel (93/96 including boats observed inports when no interviews were made), with just three of 96 using wooden and plasticcreels.
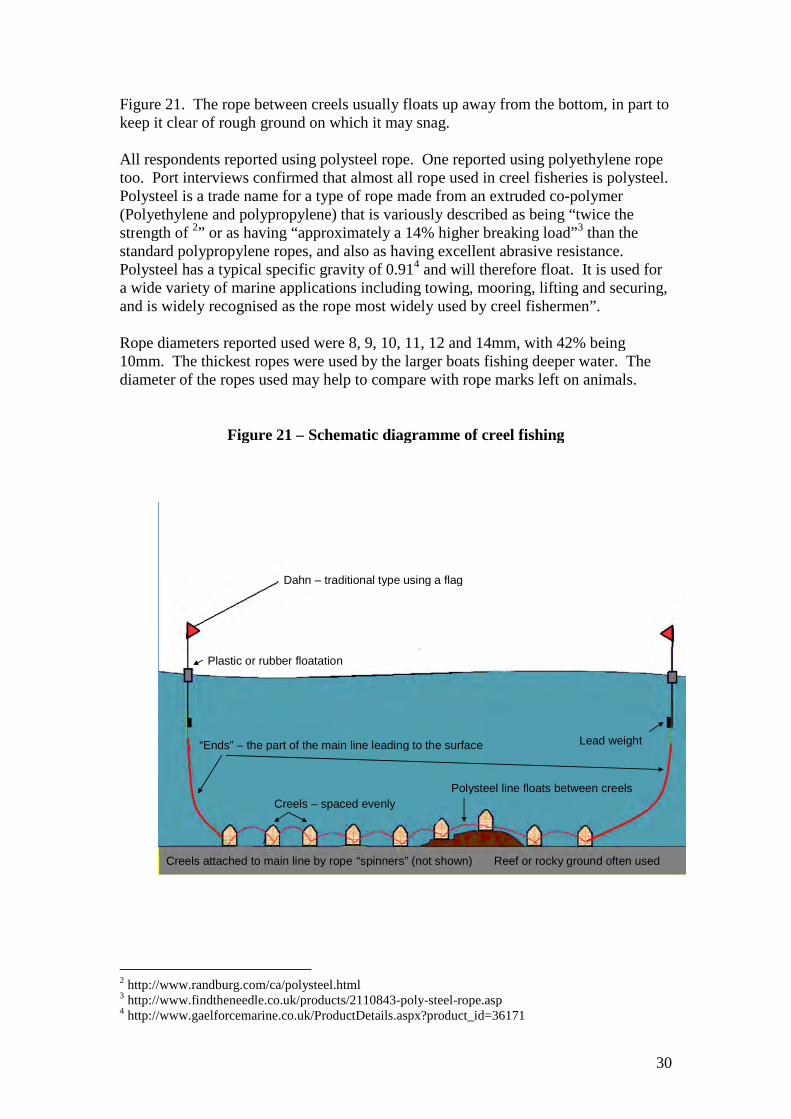
Creels are fished in strings, each attached by a short piece of rope (a spinner) to themain line. Ropes (‘ends’) run from each end of the string back up to the surface,where marker buoys or dahns enable the ends to be located and retrieved. Weights oranchors may also be used, but are not always used as the creels themselves are heavy.Sometimes only one end may be used, but usually both ends of the creel line arelinked to the surface. All of 20 respondents on this specific question said that bothends of a creel fleet were attached to a dahn or buoy. The basic layout is shown in
30
Figure 21. The rope between creels usually floats up away from the bottom, in part tokeep it clear of rough ground on which it may snag.
All respondents reported using polysteel rope. One reported using polyethylene ropetoo. Port interviews confirmed that almost all rope used in creel fisheries is polysteel.Polysteel is a trade name for a type of rope made from an extruded co-polymer(Polyethylene and polypropylene) that is variously described as being “twice thestrength of 2” or as having “approximately a 14% higher breaking load”3 than thestandard polypropylene ropes, and also as having excellent abrasive resistance.Polysteel has a typical specific gravity of 0.914 and will therefore float. It is used fora wide variety of marine applications including towing, mooring, lifting and securing,and is widely recognised as the rope most widely used by creel fishermen”.
Rope diameters reported used were 8, 9, 10, 11, 12 and 14mm, with 42% being10mm. The thickest ropes were used by the larger boats fishing deeper water. Thediameter of the ropes used may help to compare with rope marks left on animals.
Figure 21 – Schematic diagramme of creel fishing
Dahn – traditional type using a flag
Lead weight“Ends” – the part of the main line leading to the surface
Creels – spaced evenly
Plastic or rubber floatation
Reef or rocky ground often used
Polysteel line floats between creels
Creels attached to main line by rope “spinners” (not shown)
2 http://www.randburg.com/ca/polysteel.html3 http://www.findtheneedle.co.uk/products/2110843-poly-steel-rope.asp4 http://www.gaelforcemarine.co.uk/ProductDetails.aspx?product_id=36171

31
Fishing patterns
Of 40 vessels for which an answer was given, 37 fished all year, and only 3 did notfish in the winter. 12 out of 45 reported removing or reducing the number of creels inthe winter time, while the remainder reported keeping creels in the water permanently,only to be removed and replaced when they were damaged. All but two reported thesummer or autumn as the best seasons.
Respondents were fairly evenly split between those who landed once a week, twice aweek and every day. The routine depends largely on the port. Where buyers are localor where a processing plant exists (eg at Northbay), landings can be made every day.Otherwise landings routines may be driven by the collection routines of the buyers.Both crabs and Nephrops are fished on soft or muddy bottomed grounds, while creelsfor lobsters are set on broken ground, rock or rock shingle edges. This may beimportant when considering interactions with other species.
Vessels under 10m all reported fishing within 20 miles of their home ports, oftenwithin 10 miles. Boats larger than 10m worked grounds up to 80 miles from theirhome ports. Maximum depths fished ranged from 5 to 80 fathoms (9-146m) withmost in the 20-30 fathom (36-55m) zone.
Quantities of gear used.
In order to determine how much rope is being used one needs to know how manycreels are used per string, and what the spacing is between them, and how manystrings are used. One also needs to know how long the ends are and it may help toknow the length of the spinners too.
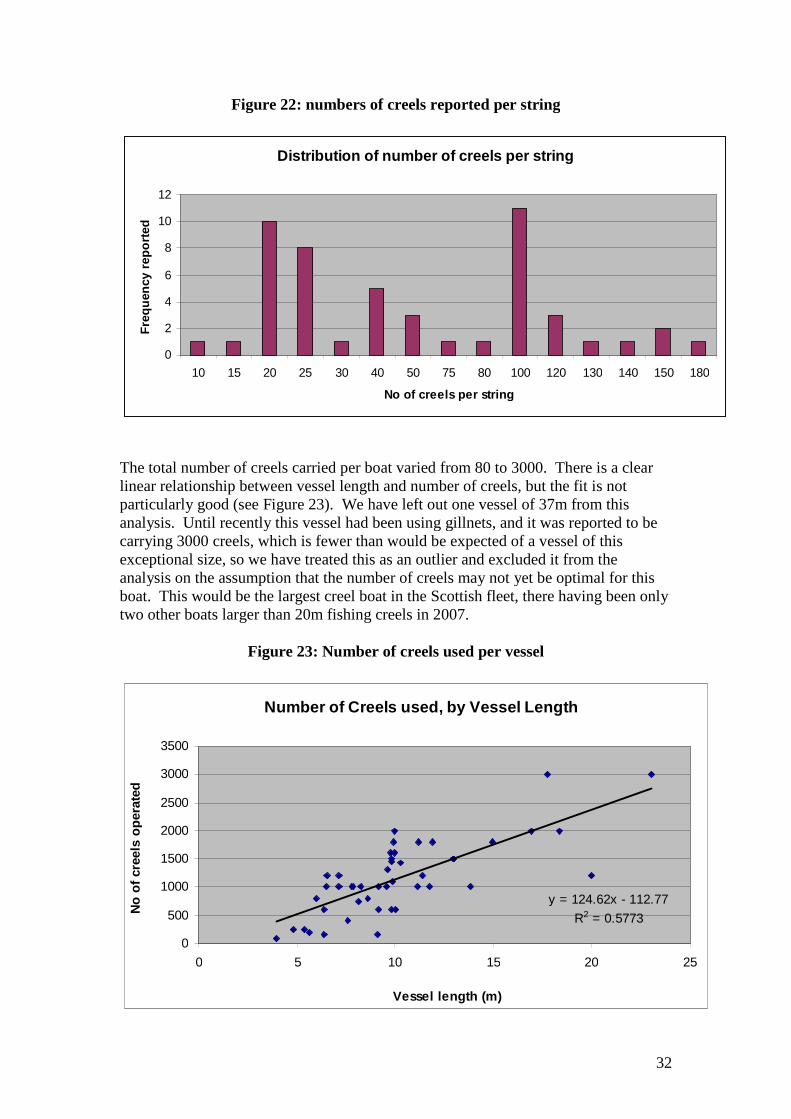
The number of creels used per string varied from 10 to 180 in the interviews, with amean of 63. In fact the numbers of creels used is almost always a round number, withtwo distinct modes at 20 and 100 as shown in Figure 22.
The number of creel strings or fleets used per boat varied from 6 to 50 with a mean of24. The number of strings used does not depend on the length of the boat. Lobsterfishermen used between 6 and 50 strings, while crab boats (generally larger) usedbetween 15 and 30, and Nephrops from 10 to 30.
The spacing of creels was closest for Nephrops at an average of 14m, then for lobstersat an average of 18m and greatest for crabs with an average spacing between creels of24m.
Every one of the interviewees and all the information gleaned from ports suggestedthat there is a universal rule that the end ropes of creel strings are “one and a third”the depth of the water being fished. Sometimes a part of the end line may be leadedto keep the line vertical, but apparently not often, as this was recorded only once,though no specific question on this issue was asked.
32
Figure 22: numbers of creels reported per string
Distribution of number of creels per string
0
2
4
6
8
10
12
10 15 20 25 30 40 50 75 80 100 120 130 140 150 180
No of creels per string
Fre
qu
en
cy
rep
ort
ed
The total number of creels carried per boat varied from 80 to 3000. There is a clearlinear relationship between vessel length and number of creels, but the fit is notparticularly good (see Figure 23). We have left out one vessel of 37m from thisanalysis. Until recently this vessel had been using gillnets, and it was reported to becarrying 3000 creels, which is fewer than would be expected of a vessel of thisexceptional size, so we have treated this as an outlier and excluded it from theanalysis on the assumption that the number of creels may not yet be optimal for thisboat. This would be the largest creel boat in the Scottish fleet, there having been onlytwo other boats larger than 20m fishing creels in 2007.
Figure 23: Number of creels used per vessel
Number of Creels used, by Vessel Length
y = 124.62x - 112.77
R2 = 0.5773
0
500
1000
1500
2000
2500
3000
3500
0 5 10 15 20 25
Vessel length (m)
No
of
cre
els
op
era
ted

33
It is clear that factors other than length, including target species, number of crew anddeck space (boat layout), and possibly local competition, are likely to influence thenumber of creels a boat can handle. There appear to be step-changes in the numbersof creels used that are associated with boat length – notably around 10m, but we areunaware of any obvious reason why this might be the case.
From an entanglement perspective, however, the number of creels carried is lessimportant than the actual lengths of rope being used. We have assessed this on a boatby boat basis among 49 of the vessels sampled, based on the answers given from oursurvey. We used the number of creels per string (less one), and the inter-creeldistance, plus an estimate of 1.3 times the maximum water depth to estimate the meanlength of an average string of creels for each boat. String lengths ranged from justover 300m to just under 4km with a mean of 1.1km.
Strings lengths for each boat were then multiplied by the number of strings reportedby that boat to obtain an estimate of the total amount of rope in use for all 49 boats.Separately we also used the number of coils of rope used per string (assuming a coilin 125 fathoms or 229m) and the number of strings used as reported on a boat by boatbasis. These two metrics gave estimates of the average amount of rope used per boatof 23.55 and 25.55 km respectively among our sample.
We may have over-estimated the amount of rope used in the ‘ends’ of each fleet, aswe have used the maximum depth fished for each boat rather than the mean depth(which we did not have), but it is encouraging that the quantities estimated from thedata on number of coils of rope used per boat gave similar results overall to theestimate based on number of creels per string, inter-creel distance and number ofstrings. On average about 12% of the rope in the water may be attributed to the ‘ends’,though as stated this may be an overestimate.
Figure 24: Rope lengths used
Estimated lengths of ropes used by 49 sampled vessels
y = 3.3156x - 11.432
R2 = 0.6428
0
10
20
30
40
50
60
70
80
90
0 5 10 15 20 25
Vessel length
Ro
pe
len
gth
(km
)

34
There was no obvious effect of target species on rope length, and the amount of ropeis again related to vessel length, but the relationship is linear. This provides us with ameans to estimate the total amount of rope in use by the Scottish fleet, but moreusefully, based on recorded fishing effort (days absent) should enable us to determinethe relative amounts of rope by ICES rectangle around the country.
Creel Losses
The number of creels lost per year depends on the number being fished, but onaverage around 98 creels or 7 to 8 % of creels that are fished may be lost per year(See Figure 25 below). Most reported that the worst season for losses was the winter,and only 3 of 37 said there was no seasonal pattern.
Figure 25: Reported creel losses
Creels Numbers Lost
y = 0.106x - 29.918
R2 = 0.5905
-50
0
50
100
150
200
250
300
350
400
0 500 1000 1500 2000 2500 3000 3500
Number fished
An
nu
al
losses
Amount of rope in use
In 2007 there were 1163 vessels that reported some level of fishing with creels.Assuming an average of 24km of rope in use by each boat this would amount to some28,000 km of rope potentially in use in the waters around Scotland. Not all of these1163 vessels are fishing full-time, and indeed effort by many of them appears to bevery low indeed. The number of vessels fishing close to full time appears to be closerto 300, which would suggest around 7,200 km or rope in use much of the time, andperhaps about 10% of this would be running vertically from the sea bed to dahns ormarker buoys and 90% in loops along the sea-bed.
It is not possible from the available statistics to say how much rope is deployed perday or even per month, because days at sea are reported when boats are at sea settingor emptying creels and not for the days that the creels are in the water and when theboats are in port. We know that most boats that fish full time do leave creels in thewater most or all of the time. Calculating the exact amount of rope is not however,particularly important. It is more important to be able to assess the relative amountsof rope between areas and seasons.

35
To provide an overview of the relative amounts of creel rope in the water we simplyassume that each recorded day at sea by any boat equates to one day of creel lines inthe water, with the amount of rope determined by that vessel’s length according to theregression formula in Figure 25. We recognize that this grossly under-estimates thatactual amount of gear in the water, as much of it remains in place even when boats arein port, but we are interested in the relative amounts of gear by area, and thereforeassume there are no geographical biases in the proportions of boats fishing part timeand full time from different ports around the coast.
Figure 26: Derived distribution of relative amounts of creel line rope in the water
On this basis, Figure 26 shows the relative amounts of creel fishing gear – asminimum km.days of rope -by ICES rectangle. This picture differs somewhat fromthose describing either landings or days at sea by creel boats (Figures 16 and 17above). The greatest amounts of ‘rope effort’ are around Orkney. Fife and Angus alsoshow a large amount of rope effort, despite relatively low landings recorded from thisregion. Elevated levels are also evident on the west coast between the Oban andLochinver, with greatest concentrations of creel rope in rectangles that include SouthUist and the Sound of Sleat and the Inner Sound on the mainland sides of Skye.
Aside from providing an overview of aspects of the Scottish creel fishing fleet, thework described above also enables a potentially more accurate assessment of the riskof entanglement to minke and other baleen whales in the waters around Scotlandwhich is continued in Chapter 4.
36
At Sea Surveys of Creel Fisheries
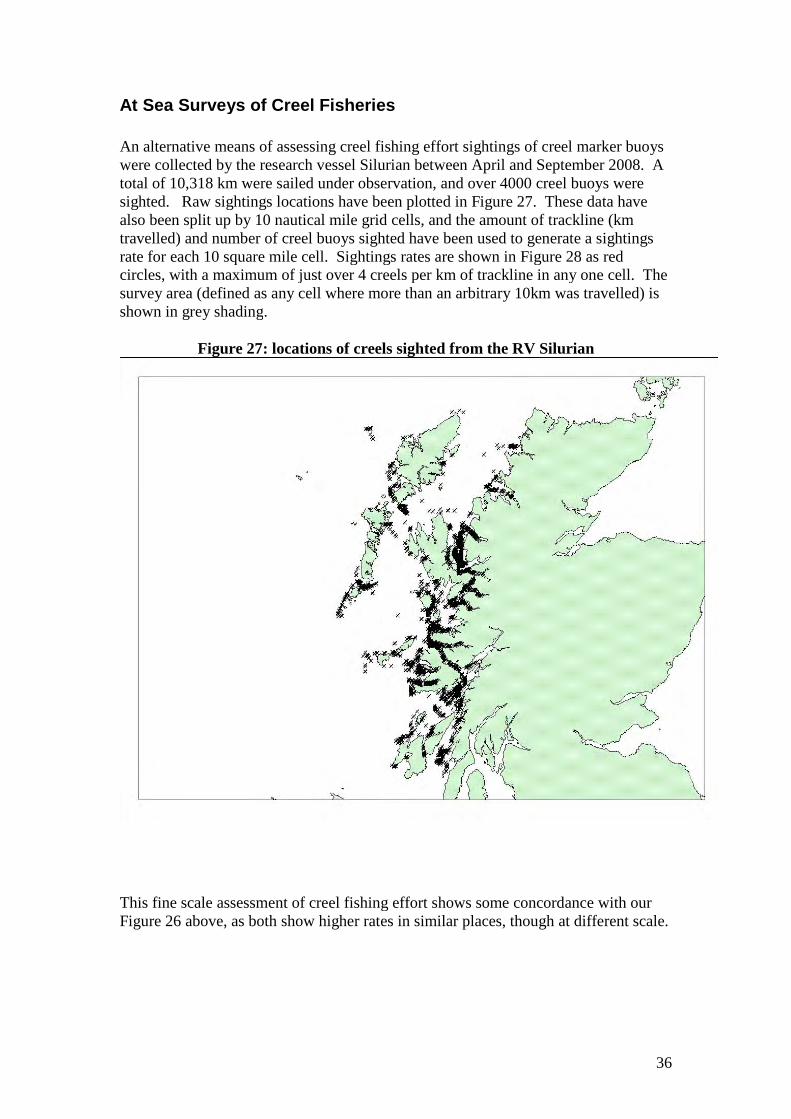
An alternative means of assessing creel fishing effort sightings of creel marker buoyswere collected by the research vessel Silurian between April and September 2008. Atotal of 10,318 km were sailed under observation, and over 4000 creel buoys weresighted. Raw sightings locations have been plotted in Figure 27. These data havealso been split up by 10 nautical mile grid cells, and the amount of trackline (kmtravelled) and number of creel buoys sighted have been used to generate a sightingsrate for each 10 square mile cell. Sightings rates are shown in Figure 28 as redcircles, with a maximum of just over 4 creels per km of trackline in any one cell. Thesurvey area (defined as any cell where more than an arbitrary 10km was travelled) isshown in grey shading.
Figure 27: locations of creels sighted from the RV Silurian
This fine scale assessment of creel fishing effort shows some concordance with ourFigure 26 above, as both show higher rates in similar places, though at different scale.

37
Figure 28: Sightings rates of creels from the Silurian
DiscussionThe main problem with assessing creel fishing effort in Scotland is that the effortmeasure that is available – the days at sea by vessel, does not provide a very usefulmeasure of the amount of gear being fished. Although it is possible to estimate howmuch gear each vessel would be using, from its length, it is much harder to estimatehow much of the time each vessel leaves its gear in the water. As lobsters and crabscan remain alive in pots for a very long time it would be entirely feasible for a vesselthat was at sea for only 20 or 30 days a year to have gear fishing every day of the year(though perhaps unlikely due to the possibility of creel loss when unattended).Interview samples are not very helpful, as there is a clear bias in our sampling towardsfull time vessels. Part time vessels are by their nature much more difficult to trackdown. From the official landing statistics it would appear that there are only about100 boats at sea more than 150 days per year, about 300 at sea more than 50 days ayear and about 700 at sea more than 20 days a year. This describes a very irregularfleet, which is difficult to characterise simply.
Our results suggest that the areas with highest densities of rope in the water are firstlyaround Orkney (where we also found higher than expected strandings rates of baleenwhales) and the around Angus and Fife. High densities are also predicted in inshorewaters close to Skye and also those around the Uists. The use of the Silurian todemonstrate creel fishing density appears to be a useful way of obtaining proxy

38
fishing effort data with which to corroborate or refine existing effort data from officialsources. Furthermore, sightings data like these could be used for finer scalemodelling of the overall distribution of the creel fleet, based on bottom type ortopography.
Reported creel losses amount to about 7 or 8% of all creels fished per year per vesselin our survey. Assuming, for the sake of example only, that an average boat uses1220 creels and 115 coils of rope in fishing (from our survey), then about 90 creelsper year and about 8 coils of rope (125 fathoms each) may be lost per vessel. Fittedcreels retail for about £50, and coils of rope fetch £30-£40 depending on gauge. Verycrudely, the average vessel therefore loses just under £5000 per year in lost gear. Lostgear must therefore cost the Scottish creel fleet in excess of £1 million per year. Thecauses of lost gear are usually unknown, and it is certainly true that the impacts of badweather and towed gear (trawls and dredges) may well account for most of theselosses. Nevertheless, whale entanglement should be seen as another factor in theoverall loss to the industry.
The specific details of the rope types in use should also help us in future to matchrope marks found on animals on beaches to particular types of rope that may be usedin different creel sectors.
39
Chapter 3: Live sightings
Objective 4: Using existing sightings networks, investigate whetherthere is evidence of previous entanglement of live whales.
Introduction
We have analysed photographic records of minke whales collected by Sea LifeSurveys – a commercial whale and other wildlife watching company based inTobermory – and the Hebridean Whale and Dolphin Trust. Most of the photographswere taken in an area stretching between Rhum and Eigg in the north and east to theTreshnish islands in the south and west, and all were within the Inner Hebrides.
Photos were taken with the intention of developing a photo-id catalogue, starting in1990. Between 1990 and 2003 only photos of identifiable individuals were stored andcatalogued. Descriptions of methods are given by Gill (1994) and Gill and Fairbairns(1995). After 2003, photos from all encounters were stored and catalogued, though atfirst photographers focused on parts of the body that would be most easily enableindividuals to be recognised, especially the dorsal fin. From 2007 photographerswere asked to try to photograph as much of the body of every animal as possible, toincrease the chances of detecting evidence of previous entanglements.
Our analysis of these data fell into two phases. Initially the HWDT photo cataloguehad only been catalogued up to 2004, so using the photographs from 1990 to 2004,Mirjam Held Wirz made an initial analysis (as an MSc project at the University of StAndrews) of the scarring of minke whales in the catalogue over this time period. Sheused just the animals that had been identified and given an identification code. Herthesis is annexed to the present report (Appendix 3).
Subsequently we have updated the HWDT/SLS photo database with photographstaken up to 2008. A separate analysis was then conducted on the entire photo-library,but using much the same methodology as that described by Held Wirz. Some of thephoto library has been made available on line at:
http://www.whaledolphintrust.co.uk/research-photo-identification-gallery.asp
Methods
Photographs are stored or filed firstly at the encounter level, with a minimum of onephotograph per encounter, and sometimes many tens of photographs during the sameencounter.
Within each encounter all photos are examined and grouped if more than oneindividual was present during the encounter, into individuals within encounters.Photos for each individual and for each encounter were then examined with two aims– firstly to find identifiable individuals, either repeat sightings of known individualsor to characterise new individuals, and secondly to categorise photos of each animal
40
within each encounter depending on the body part photographed, the photo qualityand any evidence of scarring.
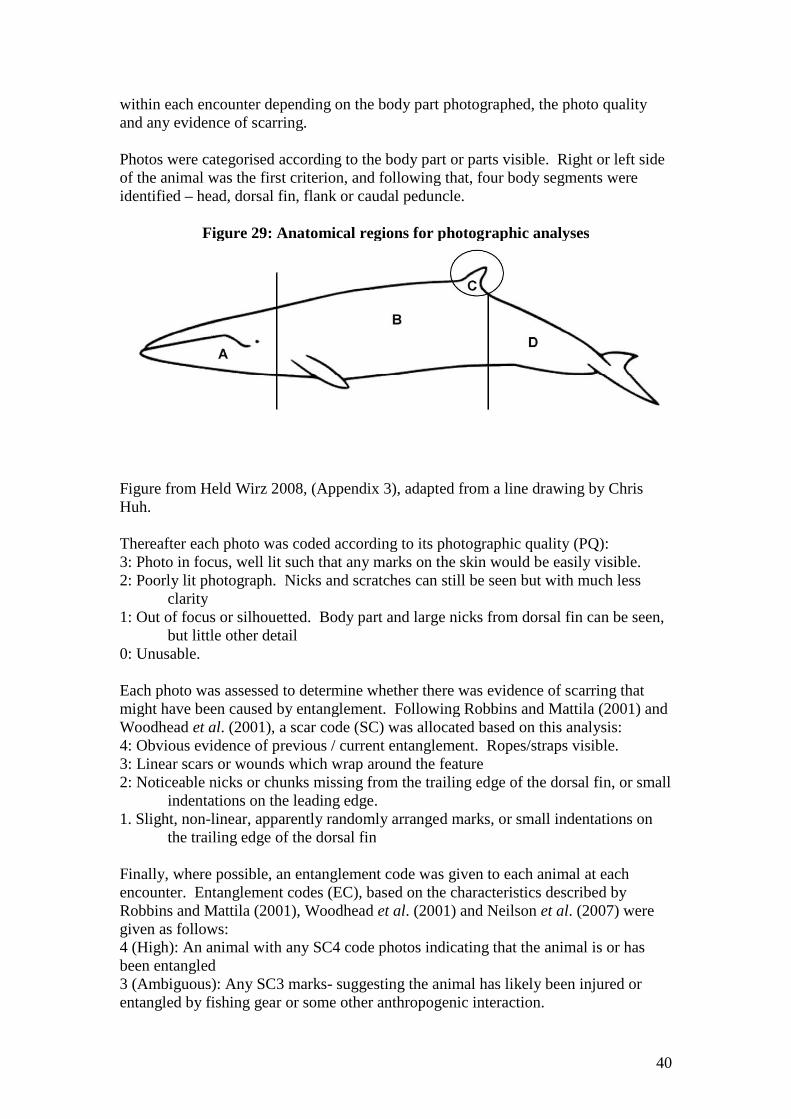
Photos were categorised according to the body part or parts visible. Right or left sideof the animal was the first criterion, and following that, four body segments wereidentified – head, dorsal fin, flank or caudal peduncle.
Figure 29: Anatomical regions for photographic analyses
Figure from Held Wirz 2008, (Appendix 3), adapted from a line drawing by ChrisHuh.
Thereafter each photo was coded according to its photographic quality (PQ):3: Photo in focus, well lit such that any marks on the skin would be easily visible.2: Poorly lit photograph. Nicks and scratches can still be seen but with much less
clarity1: Out of focus or silhouetted. Body part and large nicks from dorsal fin can be seen,
but little other detail0: Unusable.
Each photo was assessed to determine whether there was evidence of scarring thatmight have been caused by entanglement. Following Robbins and Mattila (2001) andWoodhead et al. (2001), a scar code (SC) was allocated based on this analysis:4: Obvious evidence of previous / current entanglement. Ropes/straps visible.3: Linear scars or wounds which wrap around the feature2: Noticeable nicks or chunks missing from the trailing edge of the dorsal fin, or small
indentations on the leading edge.1. Slight, non-linear, apparently randomly arranged marks, or small indentations on
the trailing edge of the dorsal fin
Finally, where possible, an entanglement code was given to each animal at eachencounter. Entanglement codes (EC), based on the characteristics described byRobbins and Mattila (2001), Woodhead et al. (2001) and Neilson et al. (2007) weregiven as follows:4 (High): An animal with any SC4 code photos indicating that the animal is or hasbeen entangled3 (Ambiguous): Any SC3 marks- suggesting the animal has likely been injured orentangled by fishing gear or some other anthropogenic interaction.
41
2: marked dorsal fin (treated separately- all animals coded 2 also given a 0, 1, 3 or 4SC code, because marks to dorsal fins are common and difficult to interpret).1 (Low): No marks of SC3 or above and at least one complete side of the animal witha PQ value of 2 or more in all sections. The animal apparently exhibits no marks orscars that might be indicative of entanglement. Previous serious entanglementdeemed unlikely.0 (Unknown): PQ is not 2 or more for all body sections of at least one side of theanimal. Photographic evidence is insufficient to make assumptions aboutentanglement marks.
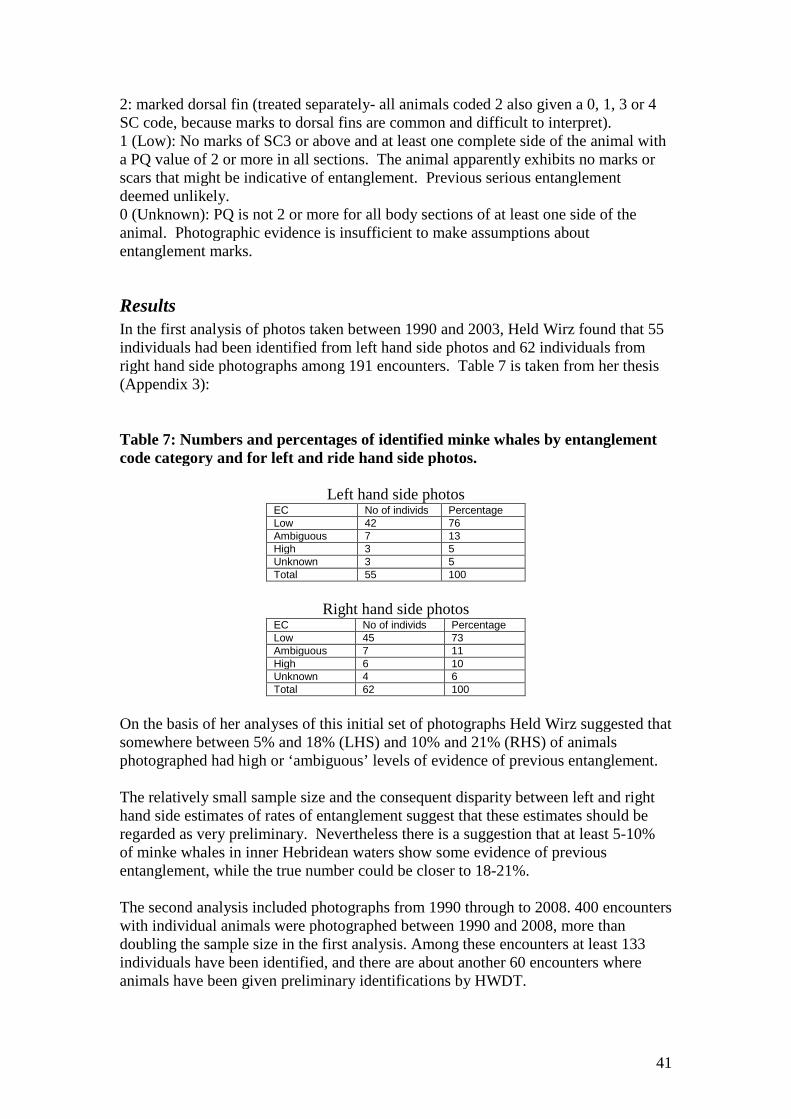
ResultsIn the first analysis of photos taken between 1990 and 2003, Held Wirz found that 55individuals had been identified from left hand side photos and 62 individuals fromright hand side photographs among 191 encounters. Table 7 is taken from her thesis(Appendix 3):
Table 7: Numbers and percentages of identified minke whales by entanglementcode category and for left and ride hand side photos.
Left hand side photosEC No of individs PercentageLow 42 76Ambiguous 7 13High 3 5Unknown 3 5Total 55 100
Right hand side photosEC No of individs PercentageLow 45 73Ambiguous 7 11High 6 10Unknown 4 6Total 62 100
On the basis of her analyses of this initial set of photographs Held Wirz suggested thatsomewhere between 5% and 18% (LHS) and 10% and 21% (RHS) of animalsphotographed had high or ‘ambiguous’ levels of evidence of previous entanglement.
The relatively small sample size and the consequent disparity between left and righthand side estimates of rates of entanglement suggest that these estimates should beregarded as very preliminary. Nevertheless there is a suggestion that at least 5-10%of minke whales in inner Hebridean waters show some evidence of previousentanglement, while the true number could be closer to 18-21%.
The second analysis included photographs from 1990 through to 2008. 400 encounterswith individual animals were photographed between 1990 and 2008, more thandoubling the sample size in the first analysis. Among these encounters at least 133individuals have been identified, and there are about another 60 encounters whereanimals have been given preliminary identifications by HWDT.

42
Among the 133 identified animals, 3 were now classed as EC4 and 27 as at least EC3or possibly EC4. The second analysis (conducted without reference to the results ofthe first, and by a different analyst (A. Coram)) again suggested similar levels ofentanglement with perhaps 30/133 = 22.5% of individuals that had high or‘ambiguous’ levels of evidence of previous entanglement.
Of the 133 individuals it was only possible to say that 26 (19%) definitely had noevidence of any entanglement scars while for the remainder (133-56= 77), some 58%,photo quality or coverage was too poor to be able to say one way or the other.
Examination of the body parts most often affected by entanglement scars suggests thatthere are some differences in scar accumulation by body part. Whereas amongstranded animals that had been diagnosed as having died due to entanglement therewas no clear difference among the different regions of the body regarding rope marks,on live animals there was a clear difference. Considering only photos that were PQgrades 2 and 3, there were clear and significant differences in the numbers of animalswith evidence of entanglement (SC 3 and 4) in different parts of the body. Highestrates of entanglement or ambiguous entanglement were recorded around the head andabdominal regions of the photographed animals, lower rates were noted around thedorsal fin and caudal peduncle. This may be because evidence of entanglement ismore visible in these areas, or because entanglement in the head region for exampleoccurs more often but is less likely to lead to the animal’s death.
Table 8: Distribution of SC3 and SC4 category damage by body region
Body segment Left hand side Right hand side
Head 28.57% 11.54%
Abdomen 4.11% 6.88%
Dorsal fin 1.86% 1.57%
Peduncle 0.55% 5.26%
We also examined the data to see if we could determine the rate of accumulation ofscars, but re-sighting rates were not high enough to allow this and no animals thatwere sighted more than once showed evidence of scar accumulation.
Discussion
The data from live sighted and photographed animals are subject to a lot of potentialinterpretation errors, and it is important therefore to interpret such data with caution.We must rely for example on the skill and interpretation on the part of the photo-librarian in making matches between individuals sighted and photographed indifferent years. We must also rely on the judgement of the photo analyst in decidingwhat marks are likely to be rope marks and what are not. Among the identifiedanimals in the HWDT catalogue, most have been checked by at least one individualwith experience of such photographic databases elsewhere. Regarding theentanglement codes ascribed to individual photos, it is encouraging that tworesearchers in our study came to very similar conclusions regarding the proportions of
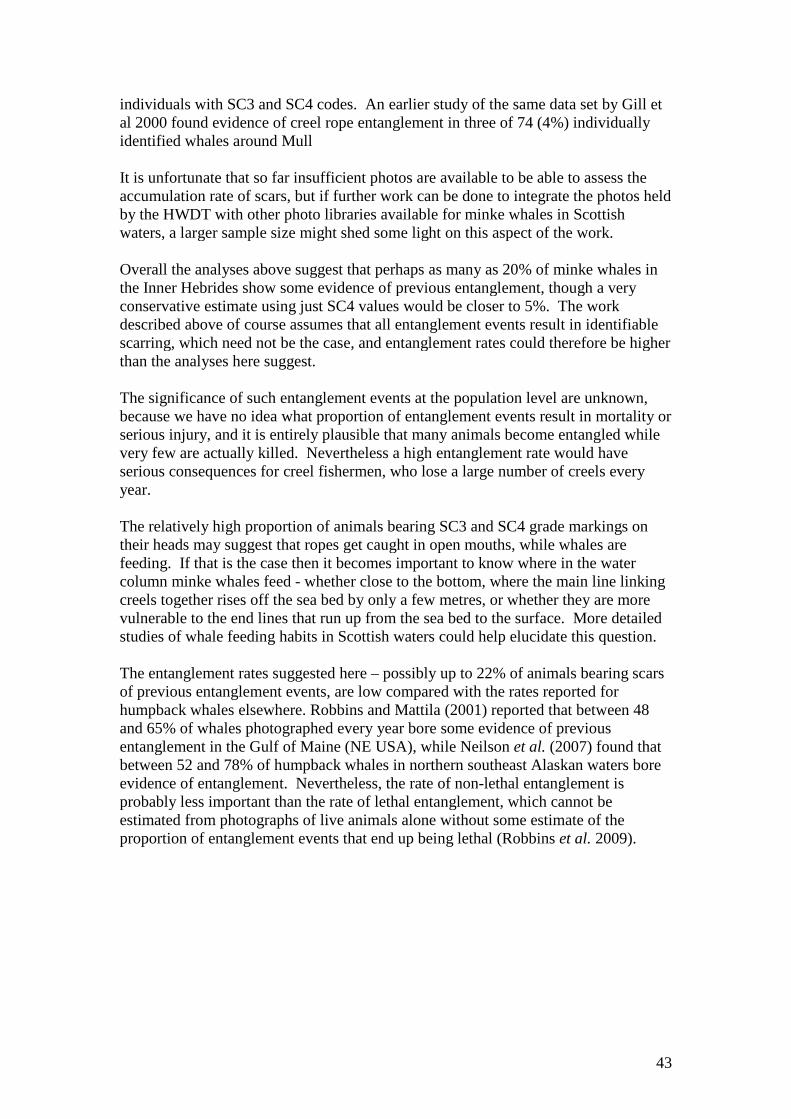
43
individuals with SC3 and SC4 codes. An earlier study of the same data set by Gill etal 2000 found evidence of creel rope entanglement in three of 74 (4%) individuallyidentified whales around Mull
It is unfortunate that so far insufficient photos are available to be able to assess theaccumulation rate of scars, but if further work can be done to integrate the photos heldby the HWDT with other photo libraries available for minke whales in Scottishwaters, a larger sample size might shed some light on this aspect of the work.
Overall the analyses above suggest that perhaps as many as 20% of minke whales inthe Inner Hebrides show some evidence of previous entanglement, though a veryconservative estimate using just SC4 values would be closer to 5%. The workdescribed above of course assumes that all entanglement events result in identifiablescarring, which need not be the case, and entanglement rates could therefore be higherthan the analyses here suggest.
The significance of such entanglement events at the population level are unknown,because we have no idea what proportion of entanglement events result in mortality orserious injury, and it is entirely plausible that many animals become entangled whilevery few are actually killed. Nevertheless a high entanglement rate would haveserious consequences for creel fishermen, who lose a large number of creels everyyear.
The relatively high proportion of animals bearing SC3 and SC4 grade markings ontheir heads may suggest that ropes get caught in open mouths, while whales arefeeding. If that is the case then it becomes important to know where in the watercolumn minke whales feed - whether close to the bottom, where the main line linkingcreels together rises off the sea bed by only a few metres, or whether they are morevulnerable to the end lines that run up from the sea bed to the surface. More detailedstudies of whale feeding habits in Scottish waters could help elucidate this question.
The entanglement rates suggested here – possibly up to 22% of animals bearing scarsof previous entanglement events, are low compared with the rates reported forhumpback whales elsewhere. Robbins and Mattila (2001) reported that between 48and 65% of whales photographed every year bore some evidence of previousentanglement in the Gulf of Maine (NE USA), while Neilson et al. (2007) found thatbetween 52 and 78% of humpback whales in northern southeast Alaskan waters boreevidence of entanglement. Nevertheless, the rate of non-lethal entanglement isprobably less important than the rate of lethal entanglement, which cannot beestimated from photographs of live animals alone without some estimate of theproportion of entanglement events that end up being lethal (Robbins et al. 2009).

44
Chapter 4: Comparing fishing distribution with whaledistribution.
Objectives 5 and 6: Determine the likelihood of co-occurrencebetween minke whales and fisheries and identify areas aroundScotland where the “risk” of entanglement is high, withrecommendations for possible mitigation proposed in these areas.
Minke whale distribution in the Hebrides
We have used data on minke whale sightings from data collected by SMRU, JointNature Conservation Committee’s seabirds and cetaceans team and the Sea WatchFoundation that form the basis of the Atlas of cetacean distribution in north-westEuropean waters (Reid et al. 2003). Data on minke whale sightings were used toproduce distribution maps in the atlas at a scale of ¼ ICES rectangles – or about 15 by17 nautical miles. Whale sightings are expressed as number of animals seen per hourof searching, and are corrected or standardized for sea state; a species-specific scalingfactor is used to adjust the time spent searching in different sea states. Sightings werecollected from 1979 to 1998. More recent data have been collected but are in variousformats and there is an ongoing project to standardize data structures so that anupdated data set can be used to revise the sightings rates for all species. At presenthowever these more recent data are unavailable. The methodology for plotting thedistribution of sightings rates is described in more detail in Reid et al.(2003).
The distribution of minke whales by ¼ ICES rectangle has been plotted using thesame data as in Reid et al. (2003) but initially just for the area covered by the Silurianand described in Chapter 2, and shown in Figure 28. This is in order to compareexpected minke whale densities with observed densities of creels recorded by Silurianin the summer of 2008 for the Hebridean region. Minke whale sightings rates areshown in Figure 29. Highest sightings rates are found in the Minches, and relativelylow sightings rates were found in the areas around the Sounds of Raasay and Sleat.Higher sightings rates are also seen in the Sea of the Hebrides around Rhum andMuck. These sightings rates can be compared directly with Figure 28, but it isdifficult to interpret the degree of overlap between the two.
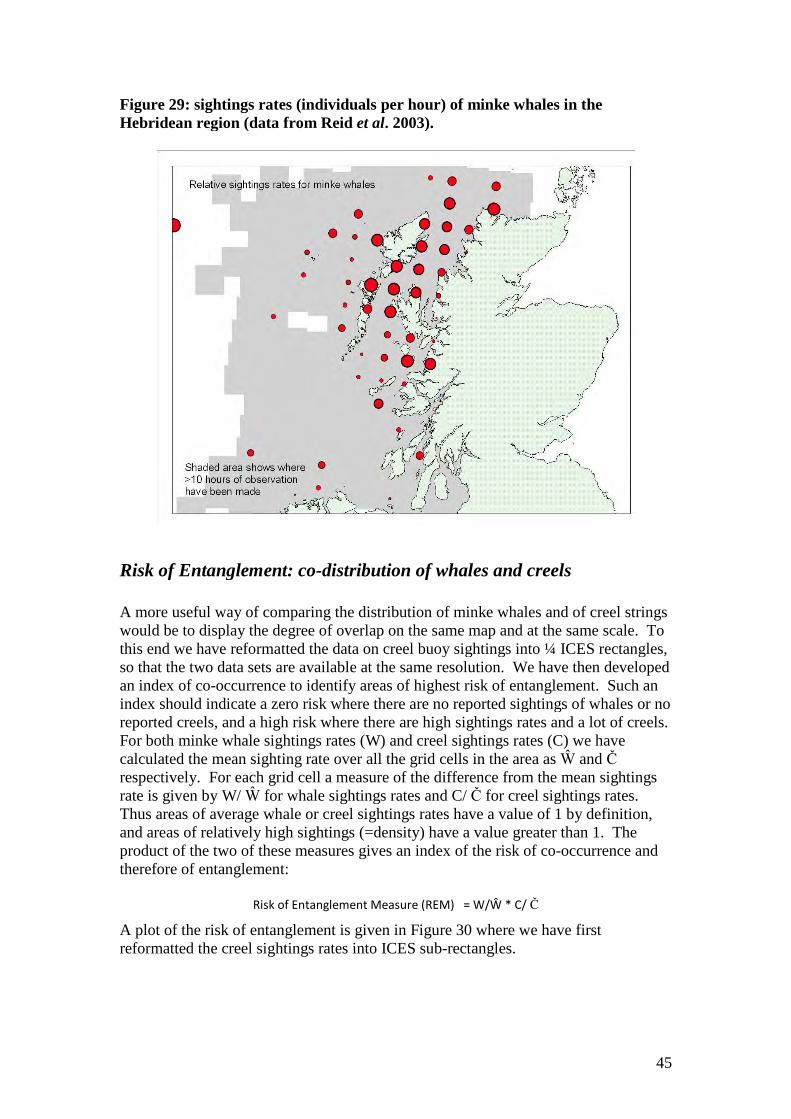
45
Figure 29: sightings rates (individuals per hour) of minke whales in theHebridean region (data from Reid et al. 2003).
Risk of Entanglement: co-distribution of whales and creels
A more useful way of comparing the distribution of minke whales and of creel stringswould be to display the degree of overlap on the same map and at the same scale. Tothis end we have reformatted the data on creel buoy sightings into ¼ ICES rectangles,so that the two data sets are available at the same resolution. We have then developedan index of co-occurrence to identify areas of highest risk of entanglement. Such anindex should indicate a zero risk where there are no reported sightings of whales or noreported creels, and a high risk where there are high sightings rates and a lot of creels.For both minke whale sightings rates (W) and creel sightings rates (C) we havecalculated the mean sighting rate over all the grid cells in the area as Ŵ and Črespectively. For each grid cell a measure of the difference from the mean sightingsrate is given by W/ Ŵ for whale sightings rates and C/ Č for creel sightings rates.Thus areas of average whale or creel sightings rates have a value of 1 by definition,and areas of relatively high sightings (=density) have a value greater than 1. Theproduct of the two of these measures gives an index of the risk of co-occurrence andtherefore of entanglement:
Risk of Entanglement Measure (REM) = W/Ŵ * C/ Č
A plot of the risk of entanglement is given in Figure 30 where we have firstreformatted the creel sightings rates into ICES sub-rectangles.

46
Figure 30: REM for minke whales in the Hebridean region; data at ¼ ICESrectangle scale
This figure provides a view of the relative ‘risk’ of entanglement, suggesting that theoverlap of minke whales and creels is greatest in coastal waters from Loch Broom tothe Ardnamurchan peninsula, coastal waters of Skye, North Uist and the Atlantic sideof South Uist. Even though sightings rates may not be particularly high in some ofthese waters, creel densities raise the risk of co-occurrence and entanglement.
Risk of entanglement for the rest of Scotland
We do not have such detailed information on creel distribution for the rest of Scotlandas we do for the west coast. We have therefore repeated the above exercise using thecreel fishing effort data by ICES rectangle (1 degree of longitude by half a degree oflatitude, or roughly 34 nautical miles by 30), having aggregated minke whale sightingto the same ICES rectangle scale. The expected distribution of creels based onofficial fishing effort statistics and our interview data was elaborated in Figure 26 inChapter 2. The REM for the whole of Scotland is shown below in Figure 31
The wider picture, though at a coarser scale, shows again that the areas with greatestrisk of overlap between creel fisheries and minke whales are likely to be the Sea ofthe Hebrides region and the Little Minch. After these two areas, the rectangle withthe highest risk or entanglement measure is on the east coast of Scotland off Angus.Thereafter, there are 5 more on the west coast in the same general area – Uists and theHebrides, and the rectangle with the ninth highest risk of entanglement measure is offOrkney.

47
Figure 31: REM for all of Scotland, data at ICES rectangle scale
Whether these metrics described above are reliable indicators of risk of entanglementis unclear, but they provide a rationale for focusing in on specific areas in the future.One of the weaknesses of the present implementation, however, is that the sightingsdata for minke whales were collected from 10 to 30 years ago, and distributions mayhave changed. It would therefore be useful to collate more recent sightings data inorder to obtain a more up to date picture.
Despite this potential weakness, the results presented above give some clearindications as to where interactions between whales and creels are most likely,namely the west coast from about Mull to about Loch Broom, around Skye and theUists. Other areas that may have higher than ‘normal’ levels of co-occurrence or riskof entanglement could include the areas of Angus and off Orkney.
Potential mitigation strategies
It would be premature at this stage to propose any significant changes to creelfisheries in the hope of reducing minke whale entanglement, as we do not yet fullyunderstand either the scale of the problem (though we have a clearer idea than wedid), nor the ways in which minke whales become caught.
Development of bycatch mitigation measures usually requires some understanding ofthe mechanics of the way in which animals become caught or entangled. In this casewe found that dead animals have rope marks on their heads (and mouths), abdomens
48
and tails, while live animals tend to have more evidence of scarring on the headregion. This may suggest that non-fatal encounters are most often associated withfeeding. A study of minke whale entanglement in Korea also showed that 64% ofwhales entangled in pot lines had become attached at the mouth (Song et al 2010). Abetter understanding of how these whales are feeding in the water column might helpdevelop an understanding of the mechanism of entanglement, and specifically todetermine whether it is the end ropes or the main line that loops along the seabed thatis most often involved in entanglements. In the Korean study most entanglements(97%) were attributed to the main or ground line and branch lines rather than the endsor buoy line. A Canadian study in contrast found that ground lines were typicallyraided by only 1-3m above the seabed and suggested that this was too low to present ahigh risk of entanglement to right whales at least (Brillant and Trippel 2010)
These same uncertainties have also been explored in the north-eastern US where 3species of whale that are listed under the US endangered species act (fin, humpbackand northern right whales), are all impacted by entanglement in very similar fisheriesto those operating in Scotland. The Atlantic Large Whale Take Reduction Team hasbeen tasked with developing mitigation strategies to protect these three endangeredspecies and also, it is acknowledged, to benefit the non-endangered minke whale.
In order to specifically protect endangered right whales, short term area closures aremandated when aggregations of right whales are detected. Dynamic AreaManagement enables the National Marine Fisheries Agency to require the removal ofall static fishing gear from a specified region for 15 days (Federal Register: January30, 2009, Volume 74, Number 19). More generally, there are several regulations thatapply to pot or creel fisheries in the region:
Groundlines must be made of sinking line. Floating groundlines areprohibited;
All buoy lines must be made of sinking line, except the bottom portion of theline, which may be a section of floating line not to exceed one-third the overalllength of the buoy line;
Fishermen are allowed to use two buoy lines per string; and A weak link with a maximum breaking strength of 600 lb (272.4 kg) must be
placed at all buoys.
Further information is available online at: http://www.nero.noaa.gov/whaletrp/. Theseappear to be the only officially mandated mitigation measures directed towardsminimising baleen whale entanglement anywhere.
There is still controversy over how effective these measures might be, but the issue inthe US is more critical because the population of right whales numbers in the lowhundreds. By way of contrast, estimates of minke whale abundance in theNortheastern Atlantic are around 65,000 (Schweder et al. 1997) and there is noobvious conservation threat posed by entanglement.
Nevertheless, emerging practices and experience in the US may in future help identifymeasures that could be adopted in Scottish fisheries should whale entanglementbecome a more pressing concern, perhaps in specific small areas such as thosehighlighted in Figures 30 and 31 above.
49
The specific measures that might be useful in a Scottish context could includeensuring that the main line is not allowed to float too high. This could be achieved byusing denser rope with a specific gravity of more than 1 as is required in the Gulf ofMaine, or by ensuring some weight is attached to the line between creels.
Limiting creel lines to two buoy lines (ends) would not make much difference inScottish fisheries as this is the normal procedure. Sinking buoy lines might be auseful approach, if it could be proved that this is the line that most often entangleswhales. Contradictory evidence on this point has been put forward by Korean andCanadian researchers (Song et al 2010 and Brillant and Trippel 2010). Weak linksbetween creels could be adopted, but this would make maintenance and constructionmore difficult and may lead to further creel losses due to snagging on the sea bed.
The costs and benefits of any such proposed mitigation measures would need to bediscussed with practitioners and assessed in detail before any thought ofimplementation, but there are at least some potential measures to consider.
Overall, there is still too little information on the mode of interaction between minkewhales and creel lines to be sure which of the proposed measures would be mostuseful in Scottish waters. Further research to investigate the feeding and diving habitsof minke whales could help elucidate these issues, as would more detailedexamination of the elevations of creel lines in lobster, crab and nephrops creelfisheries worked in Scottish waters.
Discussion
The highest risk of entanglement for minke whales appears to be in the centralHebrides, notably around Skye and also around the Uists. The areas around Fife andAngus and Orkney may also have a relatively elevated risk of minke whaleentanglement. This might be investigated by focusing any further work in these areas.
As yet we have no clear idea of the overall scale of the problem, except that it seemsperhaps 5 or 6 stranded whales per year may have been victims of entanglement,though this must be a minimum estimate. There is no a priori reason to suppose thatsuch entanglements pose any threat to the conservation of baleen whales in the region,though the impacts should be considered by the IWC in setting catch limits for whalesof the same stock in adjacent waters. If our predictions are correct then there may bean elevated risk of entanglement in some restricted areas. If this turns out to be thecase then local fishermen may like to consider potential mitigation strategies, such asthose being pursued in the US. Such strategies might help reduce whale mortalities orinjuries, but could also help limit some of the considerable loss of creels that creelfishermen experience.
Further work should be directed at fine scale studies of whale movements and feedingbehaviour in areas where creels are used, and into rope configurations and elevationson creels that are being fished, to try to understand the risk of entanglement moreclearly.

50
Chapter 5: Conclusions and recommendations
Minke whales are a strictly protected species within the EU, being listed on Annex IVof the Habitats Directive. They are nevertheless subject to hunting in neighbouringcountries (Iceland and Norway). The International Whaling Commission considersthere is a single management stock in the Northeastern Atlantic, though somepopulation sub-structure is evident within the stock region. The number of minkewhales in the Central and Northeastern Atlantic stocks combined has been estimatedat around 174,000. In North-western European Union waters (North Sea and shelfwaters west of the British Isles), the recent SCANS II project estimated that therewere around 18,800 minke whales present during the summer of 2005, though thisestimate excludes the survey blocks tthat were subject to aerial survey such as theScottish west coast. Around 600 minke whales are taken annually by Norway andIceland. Annual minke whale quotas are established nationally by Iceland andNorway and whales are taken under an Objection to the IWC’s 1985 moratorium onwhale catching, as permitted under the Whaling Convention.
Minke whale deaths due to entanglement in fishing gear, principally in creel lines,represent the single most frequently documented cause of anthropogenic mortality inScottish and UK waters. Roughly half of all examined dead baleen whales fromScotland are thought to have died due to entanglement. Although this amounts toonly about 5 or 6 animals per year on average, not all such deaths will result incarcases that are reported.
Among animals photographed off Mull, at least 5% and possibly as many as 22% ofminke whales bear some evidence of previous entanglement. These figures compare,for example, with equivalent figures of 52-78% for humpback whales photographedin the Gulf of Maine.
We have not been able to assess how frequently Scottish minke whales are entangledbecause we have not been able to assess the accumulation rate of scars. In the US,about 12% of the humpback whales in the Gulf of Maine appear to become non-lethally entangled annually. It is also thought that among all humpbackentanglements in the Gulf of Maine, about three quarters are not fatal while about onequarter of all entanglements are considered likely or actually to have been fatal. Fromthese figures, Robbins et al (2009) suggest that on average about 19 to 29 humpbackwhales may die as a result of entanglement annually (2-5% of the local stock). Onaverage on about 3 humpbacks per year are actually recorded as having died as aresult of entanglement.
These figures cannot be used to infer a great deal about minke whale entanglement inScotland, where there are larger numbers of minke whales than there are humpbacksin the Gulf of Maine, and fewer programmes to monitor whale entanglement.However, the US experience shows that even with intensive monitoring of whales, asoccurs in the Gulf of Maine, it is likely that reported fatal entanglementsunderestimate the actual number to a considerable extent.
51
Improving our understanding of the interactions between baleen whales and staticfishing gear will clearly be important if the obligations of Article 12 of the HabitatsDirective (which requires monitoring of incidental catches of Annex IV species) areto be met. Clearly with such low levels of entanglement compared with the highlevels of fishing, standard observations of fishing activity are not likely to be useful indetermining the true scale of minke whale mortality. A more fruitful approach wouldbe to document entanglement events through continued careful examination of allstranded animals, but also through further development and better co-ordination of thephoto-identification catalogues that are being compiled in various parts of Scotland.Examination of photographs of known animals through several years can enable scaraccumulation rates, and hence non-lethal entanglement rates, to be assessed. To betruly useful these non-lethal scarring rates must be linked to some estimate of theproportion of entanglements that are lethal compared with those that are not; this is anarea that needs further investigation.
Considering aspects of the creel fisheries, there are clear difficulties in theinterpretation of the fleet activity data, where over 1100 boats are reported to haveused creels in 2008, yet only about 300 appear to fish regularly. The data collected bythe Silurian, recording locations of creel dahns, is another approach to estimatingcreel fishing effort, and one that could easily be explored further and extended toother parts of the coast. The existing data should at least tell us something aboutrelative density of fishing effort, though an absolute measure of fishing effort wouldbe more helpful in trying to determine entanglement probabilities.
Comparisons of relative creel fishing density and whale sightings density in thisreport have suggested three or four areas (the Sea of the Hebrides and the LittleMinch, in Fife and Angus and in Orkney) that would appear to have the highest levelsof whale and creel overlap. These areas could be investigated in more detail, butupdating and improving the seasonal whale sightings data would also be helpful inthis context. In the present report we used sightings rates calculated from data whichextended back to the 1980s.
Overall, we cannot presently say that entanglement of minke (or other) whales inScottish waters represents a serious conservations threat, but it is an issue that shouldreceive continued attention, because of the strictly protected status afforded to theseanimals, and because any whale entanglement represents a potentially seriouseconomic loss to the individual fisherman involved.
There is also an international perspective to be considered, because any anthropogenicmortality of whales, such as their unintentional entanglement in fishing gear, shouldbe included in any catch limit calculations undertaken for the purposes of settingwhaling quotas. At present neither Norway nor Iceland include figures onentanglement when estimating their domestic quotas for minke whale harvests, and asneighbouring states that exploit whales that are strictly protected within the EuropeanUnion, this should be an issue of concern to the European Union. Entanglements arealso likely in other EU member states.
52
Areas of further work
Detailed examination of as many stranded baleen whales as is practicableshould be continued, with careful attention to the placement, orientation andfine structure of any rope like scars.
Monitoring of live animals in inshore waters should be encouraged with theaim of determining how they typically feed. Proximity to the sea bed whilefeeding is important if (as appears to be the case in Korea) ground ropes arethe main cause of entanglement. This might be done most effectively throughsuction cup tagging using data loggers to record depth, pitch and roll duringseveral dives (Hooker et al 2007).
Further work is needed to characterise the creel fishing fleet in Scotland,which consists mainly of part time vessels. This is most likely easiest toachieve through direct observations at sea and through interview surveysrather than by relying on landings and effort records which are subject toconsiderable uncertainty.
Characterisation of typical creel rope profiles and elevations should beundertaken to assess the potential entanglement risks of the variousconfigurations in use (including for example inter-creel distance and bottomtype)
The continuation, expansion and co-ordination of photo-id studies should beencouraged, in order to obtain a better picture of non-lethal entanglement, andspecifically of scarring frequency and of the anatomical distribution of ropescars.
Defining areas of highest risk could be improved if more recent sightings datacould be collated and used to determine seasonal changes in distribution andlink these with seasonal changes in creel density, and if more detailed data oncreel distribution could be obtained for the whole year and for the whole coast,rather than simply the summer months on the west coast. This could beachieved through sightings surveys or by seeking information on creel fishinglocations from active fishermen.
Local work, including at sea observational records of whales and creelfisheries should be encouraged in the areas defined in this report as having thegreatest risk of entanglement.
Further work would be required to assess the costs effectiveness andfeasibility of any mitigation measures, such as the use of sinking lines in creelfisheries, should any such measures be deemed warranted.

53
References:
Baird, R. W., P. R. Stacey, D. A. Duffus, and K. M. Langelier. 2002. An evaluation ofgray whale (Eschrichtius robustus) mortality incidental to fishing operations inBritish Columbia, Canada. Journal of Cetacean Research and Management4:289-296.
Bradford, A.L., Weller, D.W., Ivashchenko, Y.V., Burdin, A.M., and Brownell, R.L.,Jr., 2007 Anthropogenic scarring of western gray whales (Eschrichtius robustus).Paper presented to the Scientific Committee of the International Whaling Commission15pp SC/59/BRG37
Brillant, S.W. and Trippel, E.A., 2010. Elevations of lobster fishery groundlines inrelation to their potential to entangle endangered North Atlantic right whales in theBay of Fundy Canada. ICES Journal of Marine Science 67:335-364
Caswell H, Fujiwara M, Brault S. 1999. Declining survival probability threatens theNorth Atlantic right whale. Proc Natl Acad Sci U.S.A. 96 (6):3308–3313.
Gill, A. 1994. The photo-identification of the minke whale (Balaenopteraacutorostrata) off the Isle of Mull, Scotland. MSc Thesis, Aberdeen University. 67pp.
Gill, A. and Fairbairns, R. 1995. Photo-Identification of the Minke whaleBalaenoptera acutorostrata off the Isle of Mull, Scotland. In Whales, Seals, Fish andMan (ed. A.S. Blix, L.Walløe and Ø. Ulltang), pp. 129-132. Elsevier Science,Netherlands
Gill, A., Reid, R., & Fairbairns, B.R. 2000. Photographic and strandings datahighlighting the problem of marine debris and creel rope entanglement to minkewhales (Balaenoptera acutorostrata) and other marine life in Scottish waters. InProceedings of the Fourteenth Annual Conference of the European Cetacean Society(eds P.G.H. Evans, R. Pitt-Aiken & E. Rogan), Cork, Ireland.
Glass, A.H., Cole, T.V.N., Garron, M., Merrick, R.L. and Pace, R.M. III. 2008.Mortality and serious injury determinations for baleen whale stocks along the UnitedStates Eastern Seaboard and adjacent Canadian Maritimes, 2002-2006. US DeptCommerce, Northeast Fisheries Science Centre Ref. Doc. 08-04, 18pp. Availablefrom NMFS, 166 Water Street, Woods Hole, MA 02453-1026, USA
Hooker, S., Biuw, M., McConnell, B., Miller, P. Sparling, C., 2007. Bio-loggingscience: logging and relaying physical and biological data using animal-attached tags;Deep Sea Research Part II: Topical Studies in Oceanography; 54:177-182
International Whaling Commission 2009. Report of the Sub-Committee on Estimationof Bycatch and Other Human-Induced Mortality. Journal of Cetacean Research andManagement. Volume 11 Supplement Annex J (April 2009).

54
Kim, Z.G. 1999. Bycatches of minke whales in Korean waters. Journal of CetaceanResearch and Management 1 (Supplement): 98-100.
Kraus, S.D. 1990 Rates and Potential Causes of Mortality In North Atlantic RightWhales (Eubalaena glacialis). Marine Mammal Science, 6, 278-291.
Lien, J. 1994. Entrapments of large cetaceans in passive inshore fishing gear inNewfoundland and Labrador (1979-1990). Reports of the International WhalingCommission 15 (Special Issue):149-157.
Neilson, J. L., J. M. Straley, C. M. Gabriele, and S. Hills. 2007. Non-lethalentanglement of humpback whales (Megaptera novaeangliae) in fishing gear innorthern Southeast Alaska. Journal of Biogeography, Special Issue. 13 pp.
Reid, J. B., P.G. H. Evans, and S. P. Northridge. 2003. Atlas of cetacean distributionin north-west European waters. Joint Nature Conservation Committee, Peterborough.76 pp.
Robbins, J. and D. K. Mattila. 2001. Monitoring entanglements of humpback whales(Megaptera novaeangliae) in the Gulf of Maine on the basis of caudal pedunclescarring. Paper presented to the International Whaling Commission, ScientificCommittee. SC/53/NAH25. 14 pp.
Robbins, J., Landry, S. and Mattila, D.K., 2009. Estimating entanglement mortalityfrom scar-based studies. Paper presented to the Scientific Committee of theInternational Whaling Commission, June 2009, Madeira, SC/61/BC3.
Schweder, T., Skaug, H.J., Dimakos, X.K., Langaas, M. and Øien, N. 1997.Abundance of northeastern Atlantic minke whales, estimates for 1989 and 1995.Report of the International Whaling Commission 47:453-483.
Song, K-J, Kim, Z.G., Zhang, C.I., Kim, Y.H., 2009. Fishing gears involved inentanglements of minke whales (Balaenoptera acutorostrata) in the East Sea ofKorea. Marine Mammal Science 26(2): 282-295.
Woodhead, C., M. Weinrich, J. Robbins, and S. Brault. 2001. A technique to screenhumpback whale populations for risk of serious entanglement using flukephotographs. Paper presented to the International Whaling Commission’s ScientificCommittee. SC/55/BC3. 15 pp.

55
Appendix 1: Project leaflet.

56
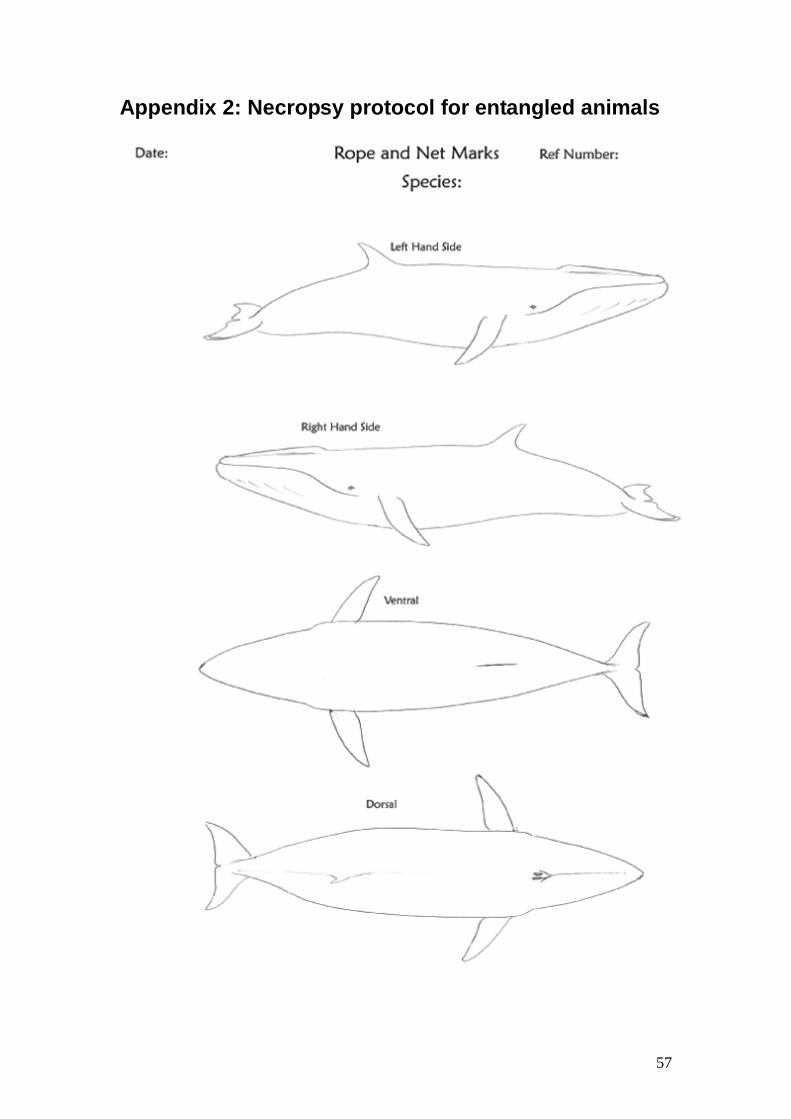
57
Appendix 2: Necropsy protocol for entangled animals