ensuring crop expansion is limited to lands … crop expansion is limited to lands with low...
TRANSCRIPT

WORKING PAPER | September 2015 | 1
working paper
Installment 10 of “Creating a Sustainable Food Future”
ENSuRING CROP ExPANSION IS lImItEd tO lANdS WItH lOW ENVIRONmENtAl OPPORtuNItY COStSCRAIG HANSON ANd TIM SEARCHINGER
CONtENtSSummary ...................................................................... 1
degraded lands and a Sustainable Food Future ............ 4
the Challenge: Increasing Food Production While Avoiding Natural Ecosystem Conversion ....................... 6
the Need: targeting lands with low EnvironmentalOpportunity Costs ....................................................... 11
Recommendations ....................................................... 16
Concluding thoughts .................................................. 24
Endnotes ..................................................................... 25
References ................................................................... 28
Disclaimer: Working Papers contain preliminary research, analysis, findings, and recommendations. They are circulated to stimulate timely discussion and critical feedback and to influence ongoing debate on emerging issues. Most working papers are eventually published in another form and their content may be revised.
SummaryIn Creating a Sustainable Food Future: Interim Findings, we proposed that in a sustainable food future the world sufficiently feeds itself without any further conversion of natural ecosystems into crops. We found, however, that it may be difficult to boost crop yields and limit food crop demand growth sufficiently to close the approximately 70 percent gap between global crop calories available in 2006 and those needed in 2050 with absolutely no expansion of cropland. For instance, in order to avoid any further increase in area harvested each year, we found that—absent reductions in food crop demand—the annual aver-age increase in crop production per hectare from 2006 to 2050 would need to be about one-third more than it was in the previous 44-year period (1962 to 2006), a period that encompassed the Green Revolution.
Likewise, numerous studies project cropland expansion over coming decades. For instance, the Food and Agricul-ture Organization of the United Nations (FAO) projects an expansion of 69 million hectares (Mha) between 2006 and 2050. Bajzelj et al. (2014) estimate a much greater expan-sion—655 million hectares between 2009 and 2050 based on the continuation of recent crop yield trends. And while demand-side measures can help close the gap, they may not do so sufficiently by themselves. For instance, in the Interim Findings we found that halving the global rate of food loss and waste by 2050 would close the crop calorie gap by about 20 percent.
Suggested Citation: Hanson, C. and T. Searchinger. 2015. “Ensuring Crop Expansion is Limited to Lands with Low Environmental Opportunity Costs.” Working Paper. Installment 10 of Creating a Sustainable Food Future. Washington, DC: World Resources Institute. Available online at http://www.worldresourcesreport.org.
2 |
New cropland historically has come from the conversion of forests, grasslands, and wetlands. However, such conver-sion generally has high environmental and social impacts. It typically releases greenhouse gas emissions otherwise stored in vegetation and soils, reduces wildlife habitat, and disrupts watershed protection benefits, to name a few. Moreover, conversion can displace people who live in those ecosystems or trigger social conflict with com-munities that depend on the natural ecosystem. Finding alternative locations for any inevitable cropland expansion is therefore urgent.
One commonly suggested option is to focus future crop-land expansion toward “marginal” or “degraded lands.” There are several challenges associated with the concept of degraded land, however, that make this solution not as straightforward as it might seem at first glance. First, there is little consensus on the definition of “degraded land.” Second, estimates of degraded land extent and location vary widely and often do not overlap. Third, alot of the land typically characterized as degraded is already cropland and therefore by definition cannot be a candidate for cropland expansion (the focus of this working paper)—but rather are candidates for restoring crop productivity on existing croplands (which we encourage). Restoring degraded cropland into greater productivity is a very important strategy for boosting food production, but it cannot be considered a “new” source of cropland. Fourth, although the phrase might connote vast tracts of unin-habited or unutilized land, degraded lands are not neces-sarily vacant areas that are unused by people or that fail to provide benefits. Fifth, there appears to be a “race for degraded lands” among a variety of interests, including those seeking to boost food production, increase wood product supplies, advance bioenergy, and restore native ecosystems. In other words, the same land is being sought for multiple purposes.
Beyond invoking “degradation,” other attempts to iden-tify areas suitable for crop expansion often identify lands whose conversion would have high environmental impacts or forgone benefits. These land categories sometimes include: (1) “potentially arable” land that is not now farmed except dense forests, (2) wet savannas, (3) grazing lands, (4) secondary forests, and (5) abandoned farmland. Considering these land types as always or inherently appropriate for cropland expansion leads to overestimates of the amount of land available for sustainable cropland expansion, creating unrealistic expectations.
To accommodate any cropland expansion in a manner consistent with a sustainable food future, we need to circumvent the ambiguity and other challenges related to the concept of “degraded land” and avoid misconstruing as inherently appropriate for cropland expansion lands whose conversion would have relatively high environ-mental impacts. One approach is to ensure any crop expansion is limited to lands with low environmental opportunity costs. This concept acknowledges that there are nearly always opportunity costs to expanding crops onto a tract of land—the opportunity to use that land for some other purpose or to merely let it regenerate into something eventually approaching its native ecosystem. Although borrowed from the world of economics, “opportunity costs” in this working paper focus on forgone environmental benefits.
Our working definition is that lands with low environ-mental opportunity costs are those that simultaneously meet at least four criteria:
1. Not already supporting crops. By definition, land that is already being used for crop production (no matter how unproductive) is not eligible as an area for cropland area expansion.
2. Minimal impact on native ecosystems and biodiversity. Any cropland expansion should avoid converting natural ecosystems or negatively impacting biodiversity.
3. Low “carbon loss to crop production” ratios. These are lands whose conversion to cropping would release relatively little carbon compared to the likely tons of crop production per hectare.
4. Low “blue water” footprint. These are lands whose conversion to cropping would lower or at least main-tain pressure on freshwater resources in the watershed.
The extent of lands with low environmental opportunity costs is uncertain. We have not yet conducted a global mapping analysis. Yet given our strict criteria, our hypo-thesis is that only modest amounts of land will qualify.
Tracts of land that do meet these four criteria should then be assessed against a set of non-biophysical considerations that determine whether the tract should or even could be converted into cropland. These considerations include:
5. Economic viability. Is converting the tract of land into cropland economically viable from the farmer’s perspective?

Ensuring Crop Expansion is Limited to Lands with Low Environmental Opportunity Costs
WORKING PAPER | September 2015 | 3
6. Legal availability. In light of land-use zoning and other policies, is it legally possible to convert the tract of land to cropland?
7. Social acceptability. Do the people living on or holding rights to the tract of land want it converted to cropland?
8. Best alternative use. Is cropping an optimal use of that tract of land relative to alternatives such as letting the native ecosystem recover?
Failure to meet criteria 5, 6, and 7 does not mean that a tract of land should necessarily be removed from consideration since steps could be taken to improve per-formance against those criteria. For example, introducing economic incentives could improve economic viability. Changing land-use zoning could make tracts legally avail-able. And improving the benefits local people gain could make conversion to crops more socially acceptable.
Ensuring crop expansion is limited to lands with low environmental opportunity costs is distinct from other strategies or “menu items” profiled in the Interim Findings. For instance, the menu item on “improving land and water management” (see pp. 68–73 in Interim Findings) is about increasing crop productivity per hect-are on land that is already being used for crop production. Utilizing lands with low environmental opportunity costs, on the other hand, is about expanding crop production onto areas that currently are not supporting crops. And whereas the menu item “increasing pastureland productivity” (see pp. 77–80 in Interim Findings) is about improving meat and milk production per hectare, this working paper focuses on crop production.
To ensure that future cropland expansion is limited to lands with low environmental opportunity costs, three sets of policies, incentives, and practices (collectively called “measures”) are needed. The first set of measures is designed to generate a clearer understanding of what and where lands with low environmental opportunity costs are located. These include:
Agreeing on a clear definition.
Applying our criteria to generate maps.
Identifying cleared or abandoned agricultural lands where biophysical or human factors are blocking natural regeneration.
The second set of measures would facilitate use of lands with low environmental opportunity costs. For farmers to use these areas for crops, the lands need to be avail-able from a legal, economic, and social perspective. These measures include:
Prioritizing lands with low environmental opportunity costs in participatory spatial planning.
Clarifying and strengthening land tenure on lands with low environmental opportunity costs.
Introducing financial incentives for farmers to use lands with low environmental opportunity costs.
Improving technical assistance and rural extension for using such lands.
Strengthening community engagement processes.
The third set of measures is designed to discourage crop-land expansion to lands with high environmental oppor-tunity costs by making the financial, reputational, market access, or legal “cost” of converting natural ecosystems into cropland greater than the cost of expanding onto lands with low environmental opportunity costs. This set can stimulate demand by farmers and agricultural companies to use lands with low environmental opportu-nity costs. These measures include:
Introducing and enforcing moratoriums on converting natural ecosystems.
Accelerating adoption of “deforestation-free” supply chain commitments.
Implementing monitoring systems.
The relative importance of all these measures will depend on the particular contextual circumstances of the tract of land being considered. And the second and third set of measures are generally important for encouraging sustain-able agricultural intensification on existing cropland and grazing lands, too. Combined, all three groups of measures could help direct any cropland expansion toward lands with low environmental opportunity costs, thereby helping to contribute to the menu for a sustainable food future.

4 |
DEGraDED LaNDS aND a SuSTaINaBLE FOOD FuTurE The World Resources Report’s Creating a Sustainable Food Future: Interim Findings describes how the world’s food system faces a “great balancing act” of simultaneously feeding more than 9 billion people, providing economic opportunity for rural people, and reducing environmental impacts by 2050 (Box 1). We explore a menu of solutions covering both food production and food consumption that could combine to meet these three needs. One of the food-production menu items calls for limiting expansion of croplands to what we originally called “low-carbon degraded lands.” In this working paper, we reframe this as ensuring any expansion of croplands is limited to “lands
with low environmental opportunity costs.” In our assess-ment, boosting food production by limiting any inevitable cropland expansion to only these lands could help satisfy the development and environment criteria described in the Interim Findings (Table 1).
Although this menu item shares some similarities with others we propose in the Interim Findings that call for increasing food production per hectare, it is nonetheless distinct. For instance, the menu item on “improving land and water management” is about increasing crop productivity per hectare on land that is already being used for crop production.1 Utilizing lands with low envi-ronmental opportunity costs, on the other hand, is about expanding crop production onto areas that currently are not supporting crops. And whereas the menu item “increasing pastureland productivity” is about improving meat and milk production per hectare, this working paper focuses on crop production.
In this working paper, we begin by highlighting how difficult it will be to sufficiently boost crop production by the year 2050 without any expansion of cropland area. Next, we posit that ensuring crop expansion is limited to what some observers call “degraded lands” might relieve that expansion’s pressure on natural ecosys-tems. We explain, however, that the concept of “degraded lands” is problematic: among other challenges, the term is ambiguously defined and inconsistently mapped. Like-wise, we highlight a number of land types often miscon-strued as inherently appropriate for cropland expansion because they are errantly considered degraded, of low environmental value, or not already in agricultural use. To avoid these problems, we propose that cropland expansion be limited to land with low environmental opportunity costs, and we suggest a set of screening criteria to identify such lands. We conclude by offering recommendations on how to direct any cropland expansion toward such lands over the coming decades. Although our examples often focus on oil palm and Indonesia, this working paper’s recommendations are intended to be applicable to other crops and countries.
How can the world adequately feed more than 9 billion people by 2050 in a manner that advances economic development and reduces pressure on the environment?
Answering this question involves a great balancing act of three needs that must be simultaneously met. First, the world needs to close a 6,500 trillion kilocalorie gap between the food available in 2006 and that needed by 2050. Second, the world needs agricul-ture to contribute to inclusive economic and social development. third, the world needs to reduce agriculture’s impact on the environment, particularly ecosystems, climate, and water.
the forthcoming World Resources Report, Creating a Sustainable Food Future, proposes a menu of solutions that can achieve the great balancing act. Some menu items address the demand for food, such as reducing food loss and waste and shifting diets. Other menu items address the supply of food, such as boosting yields via improved land and water management, better crop breeding, and improved pasture productivity. this working paper focuses on the menu item of ensuring that any expansion of crop area is limited to lands with low environmental opportunity costs.
Since the 1980s, the World Resources Report has provided government, business, and civil society decision makers with analyses and insights on major issues at the nexus of develop-ment and the environment. For more information about the World Resources Report and to access previous installments and edi-tions, visit: www.worldresourcesreport.org.
Box 1 | The World resources report: Creating a Sustainable Food Future

Ensuring Crop Expansion is Limited to Lands with Low Environmental Opportunity Costs
WORKING PAPER | September 2015 | 5
Table 1 | How “Ensuring Crop Expansion is Limited to Lands with Low Environmental Opportunity Costs” Performs against the Sustainable Food Future Criteria = positive = neutral/it depends = negative
CrITErIa DEFINITION PErFOrmaNCE COmmENT
Poverty alleviation
Reduces poverty and advances rural development, while still being cost effective
Generates food and potentially income on a tract of land that previously was not generating food.
Whether food production on these lands is economical to farmers will be a function of the revenue from crop production relative to the cost of inputs and needed land preparation/rehabilitation. If the costs of converting the land to crop production is prohibitive (and no financial assistance is avail-able) or if the returns are too meager (or both), then this menu item will not help alleviate poverty.
the poverty alleviation impact also depends on the degree to which rural populations capture the food or income benefits from the conversion of the land into productive cropland.
Gender Generates benefits for women minimizes negative impacts on communities dependent on the natural ecosystem (e.g., forest) that would have been converted to grow food had the land with low environmental opportunity costs not been converted (a benefit to both women and men).
Specific impact on women depends on what role and rights women have within the farming system on the area of cropland expansion.
Eco- systems
Avoids agricultural expansion into remaining natural terrestrial ecosystems and relieves pressure on overstrained fisheries
Provides an alternative to the conversion of natural forests, peatlands, or grasslands into cropland, thereby keeping these natural ecosystems (and the biodiversity and ecosystem services they support) intact.
Climate Helps reduce greenhouse gas emissions from agriculture to levels consistent with stabiliz-ing the climate
Avoids the greenhouse gas emissions that otherwise would have occurred from converting forests, peatlands, or grasslands into croplands. these emissions will be lower than the emissions associated with converting low-environmental-opportunity-cost land.
Water does not deplete or pollute aquifers or surface waters
Retains the ability of the spared natural ecosystem to protect watersheds in terms of water quantity and quality.
One of the criteria for lands with low environmental opportunity costs is that crops grown there would have a low blue carbon footprint.

6 |
THE CHaLLENGE: INCrEaSING FOOD PrODuCTION WHILE aVOIDING NaTuraL ECOSySTEm CONVErSION In Creating a Sustainable Food Future: Interim Findings,2 we proposed that a sustainable food future is one wherein the world sufficiently feeds itself without further conver-sion of land into agriculture. However, we found that it will be difficult to boost crop yields and limit food crop demand growth sufficiently to close the approximately 70 percent global gap between crop calories available in 2006 and those needed in 2050 with absolutely no expansion of cropland. For instance, to avoid any further increase in area harvested each year, we found that the annual aver-age increase in crop production per hectare (measured in kilograms per hectare per year) from 2006 to 2050 would need to be about one-third more than it was compared to the previous 44-year period (1962 to 2006), a period that encompassed the Green Revolution.3 That is a tall order. And while demand-side measures can help close the gap, we found in the Interim Findings that they may not do so sufficiently. For instance, halving the global rate of food loss and waste by 2050 would close the crop calorie gap by about 20 percent.4
For these reasons, most global projections indicate that cropland area will increase over the coming decades. The FAO study that we used for projecting future yields and per capita food consumption in the Interim Findings projects a net global cropland expansion of 69 Mha between 2006 and 2050.5 This projection is now on the low side, in part because it was based on a United Nations population projection that has since been revised upward to include another half a billion people by 2050.6 As explained in the Interim Findings, the FAO study is also optimistic from a land-use perspective. Not only does it project relatively modest expansion of meat consumption compared to many other studies, it also projects that crop yields will on average grow at the same rate they grew from 1962–2006, despite rising limitations on the poten-tial to boost yields by increasing chemical or irrigation inputs. And some studies have vastly higher projections for cropland expansion. Bajzelj et al. (2014), for instance, estimates a 42 percent growth in cropland area between 2009 and 2050 assuming continuation of recent historical trends, equivalent to an additional 655 Mha.7
Yet if the world could somehow avoid net expansion of cropland, it will be even more difficult to avoid gross expansion in many areas. The world’s cropland area over
the past several decades has been shifting regionally from the North to the South. While cropland area has declined in the temperate zone, it has been increasing in the tropics and subtropics—with the increase in the tropics being greater than the decrease in the temperate zone.8 Even within the same region, some farmers clear new land for crops in some places while other farmers abandon mar-ginal croplands elsewhere due to soil exhaustion, water scarcity, climate change, or other factors. The regeneration of native vegetation on these abandoned lands helps to reduce the net environmental impact of cropland expan-sion, but the carbon and biodiversity costs of new expansion typically exceed the benefits of regeneration per hectare for decades. This poor trade-off is in part because the losses of carbon during land conversion occur mostly immediately, while restoring carbon in vegetation and soils occurs gradually over longer time periods. In addition, new cropland is coming primarily from the tropics and subtropics, where the carbon costs per ton of crop production are higher,9 and where biodiversity is much higher.10
Moreover, even if the potential for yield growth—via menu items such as improved crop breeding11 and improved soil and water management12—were fully realized, there will very likely still be powerful economic,13 political, and demographic pressures to expand cropland in some regions over the coming decades.
Hotspots of expected cropland increaseProjections from a variety of sources suggest continued pressure for the production of specific crops in certain regions to convert land into crop production. Take soy-beans, for example. The growing demand for vegetable oil and high-protein animal feeds is a driver of land-use change.14 Soybeans are inputs to both of these products and are therefore likely to expand in production. Globally, soybeans occupied 84 million hectares (Mha) in 2003 and 111 Mha in 2013,15 a 33 percent increase over one decade despite advances in breeding and management of this heavily researched commodity crop. Some researchers project that even with yield gains, global soybean planted area will need to increase by another 30 Mha by 2050 to meet estimated demand.16
Palm oil is another salient example. Palm oil is a popular cooking oil and ingredient in multiple food products (such as cookies and ice cream), as well as a component in numerous consumer products (such as shampoo and soap) and a biofuel feedstock. Palm oil derives from the
Ensuring Crop Expansion is Limited to Lands with Low Environmental Opportunity Costs
WORKING PAPER | September 2015 | 7
fruit of the oil palm tree, the world’s most productive source of vegetable oil. With an average global yield of 3.7 tons of oil per hectare, oil palm generates seven times the oil yield per hectare of soybeans.17 In 2013, oil palm provided 35 percent of the world’s vegetable oil production by tonnage, beating out soybeans (at 26 percent) as the world’s dominant vegetable oil crop.18
Of the estimated more than 13 Mha of oil palm plantations around the world in 2011,19 most are concentrated in Indonesia and Malaysia, which together accounted for 85 percent of global palm oil supply in 2013.20 But the industry is making inroads into West Africa, Central Africa, and South America.21 Despite some efforts to curtail the use of palm oil,22 experts predict that palm oil will fill an even larger share of future vegetable oil demand because of its high productivity and low cost. One estimate projects a need for at least an additional 12 Mha of oil palm plantations globally from 2009 through 2050 to meet worldwide demand―and potentially more.23 And if palm oil production does not expand but vegetable oil demand continues to grow as projected, then lower-yielding vegetable crops would convert even more hectares of land to meet the projected demand.
In some parts of sub-Saharan Africa, it is traditional crops—for example, maize, rice, and root crops—that motivate land conversion, fueled by population growth, low yields on existing farmland, and land speculation. The population of sub-Saharan Africa is projected to more than double by mid-century, rising from 0.9 billion in 2012 to 2.1 billion in 2050.24 Yet the region has the world’s lowest crop yields, with cereal yields of 1.5 metric tons per hectare in 2011―roughly half the world average. Sub-Saharan Africa would need to more than triple its cereal yields on existing agricultural land by 2050 relative to today to avoid expanding cropland.25 Achieving this level of cereal yield growth in sub-Saharan Africa will be difficult in light of the region’s relatively poor soils, water scarcity, and low investment, and the projected impacts of climate change.26
“Degraded lands” to the rescue?These projections suggest continued pressure to expand cropland area. But from where will this new cropland come? Throughout history, cropland has come from the human conversion of natural ecosystems such as forests, grasslands, and wetlands.27 However, such conversion will typically have significant environmental and social impacts. It reduces habitat needed to support biodiversity.
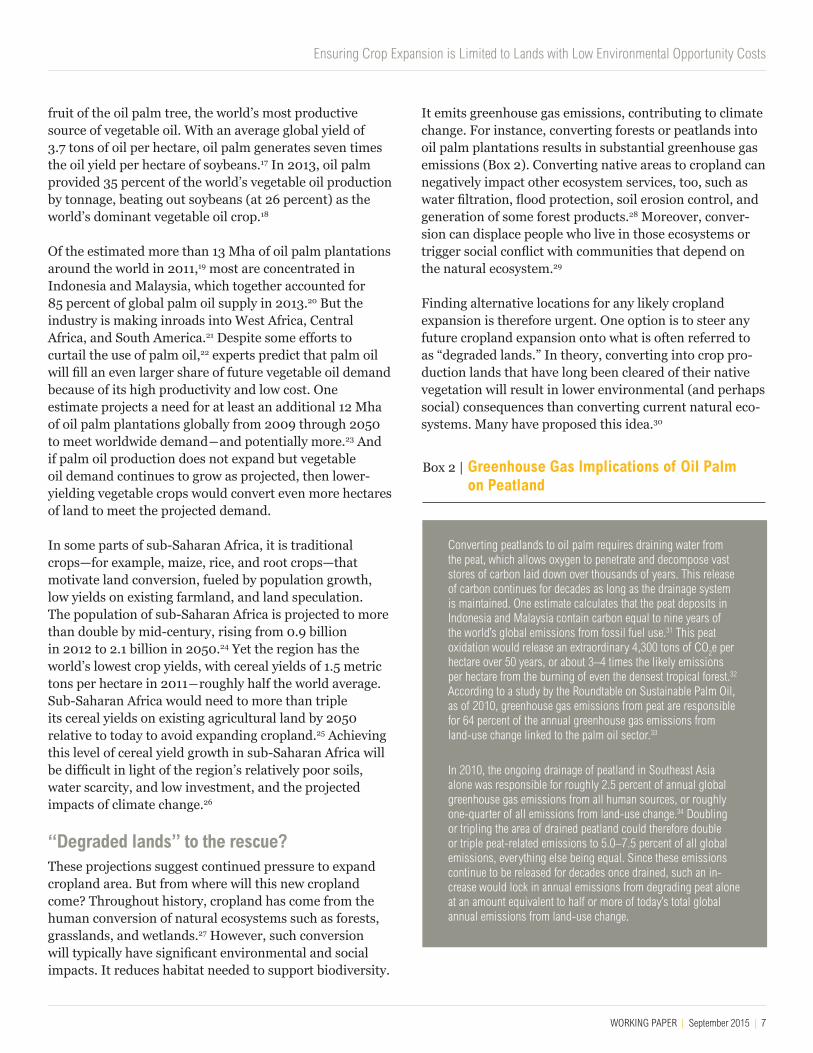
It emits greenhouse gas emissions, contributing to climate change. For instance, converting forests or peatlands into oil palm plantations results in substantial greenhouse gas emissions (Box 2). Converting native areas to cropland can negatively impact other ecosystem services, too, such as water filtration, flood protection, soil erosion control, and generation of some forest products.28 Moreover, conver-sion can displace people who live in those ecosystems or trigger social conflict with communities that depend on the natural ecosystem.29
Finding alternative locations for any likely cropland expansion is therefore urgent. One option is to steer any future cropland expansion onto what is often referred to as “degraded lands.” In theory, converting into crop pro-duction lands that have long been cleared of their native vegetation will result in lower environmental (and perhaps social) consequences than converting current natural eco-systems. Many have proposed this idea.30
Converting peatlands to oil palm requires draining water from the peat, which allows oxygen to penetrate and decompose vast stores of carbon laid down over thousands of years. this release of carbon continues for decades as long as the drainage system is maintained. One estimate calculates that the peat deposits in Indonesia and malaysia contain carbon equal to nine years of the world’s global emissions from fossil fuel use.31 this peat oxidation would release an extraordinary 4,300 tons of CO
2e per
hectare over 50 years, or about 3–4 times the likely emissions per hectare from the burning of even the densest tropical forest.32 According to a study by the Roundtable on Sustainable Palm Oil, as of 2010, greenhouse gas emissions from peat are responsible for 64 percent of the annual greenhouse gas emissions from land-use change linked to the palm oil sector.33
In 2010, the ongoing drainage of peatland in Southeast Asia alone was responsible for roughly 2.5 percent of annual global greenhouse gas emissions from all human sources, or roughly one-quarter of all emissions from land-use change.34 doubling or tripling the area of drained peatland could therefore double or triple peat-related emissions to 5.0–7.5 percent of all global emissions, everything else being equal. Since these emissions continue to be released for decades once drained, such an in-crease would lock in annual emissions from degrading peat alone at an amount equivalent to half or more of today’s total global annual emissions from land-use change.
Box 2 | Greenhouse Gas Implications of Oil Palm on Peatland

8 |
The ambiguity of “degraded land”There are a number of issues, however, with the concept of “degraded land.” First, as Gibbs and Salmon (2015) cogently show, there is little consensus on the definition of “degraded land.” Researchers have used “degradation” to refer to a range of land conditions, including soil com-paction, desertification, erosion, loss of natural vegetative cover, reduction in net primary production, and saliniza-tion. And while some researchers have focused on soil degradation, others have focused on degradation of both soils and vegetation. In addition, some researchers use “degraded” to refer to agricultural lands that are currently growing crops but are underperforming, or not realizing possible yields.35 In short, the term “degraded land” has become quite broad and inconsistently used.
Second, estimates of degraded land extent and location vary widely and often do not overlap.36 This is due to varying definitions and mapping methods. For example, some researchers focus on the end state of a tract of land, others focus on lands in the process of degradation, and still others target lands at risk of degradation. Some estimates look at only degradation within currently cropped lands, while others look at degradation within all land types. Moreover, researchers use different methods to map degraded lands, including expert opinion, satellite imagery, models, and abandoned cropland maps.
Third, much of the land classified as degraded is already cropland. Large estimates of degraded land might trace back to the Global Assessment of Soil Degradation (GLASOD), which is essentially a map based on surveys of local experts of physically degraded agricultural lands. There is little doubt that large agricultural areas are subject to erosion, loss of soil organic matter, nutrient depletion, or salinization—all of which are forms of degradation. We encourage the restoration of these areas to greater food productivity. But those lands that are already used for crops cannot by definition be candidates for cropland area expansion. Rather, they can be candi-dates for sustainably boosting yields through other menu items described in the Interim Findings, such as improved soil and water management techniques,37 judicious use of fertilizers, and improved crop varieties.38
Fourth, although the phrase “degraded land” might conjure up images of vast tracts of uninhabited, unutilized land, degraded lands are not necessarily vacant areas that are unused by people or that fail to provide any form of benefit. A reasonable hypothesis is that most tracts of land that have been cleared of their native vegetation are owned, claimed, or used—at least periodically—by some-body. People cleared and accessed these lands before; they are likely still doing so or will do so again. And sometimes these lands may be important (or the only ones accessible) to marginalized people and communities. For example, colleagues of the authors have observed local villagers periodically using tracts of deforested areas of Indonesian Borneo for occasional thatch gathering, hunting, and rights-of-way.39
Fifth, there appears to be a “race for degraded lands” among a variety of interests. Degraded land is seen as a land reserve for meeting a range of needs, including boosting food production, increasing wood product supplies, supporting bioenergy feedstocks, and restoring native ecosystems.40 For example, the New York Declaration on Forests, signed at the 2014 United Nations Climate Summit, calls for getting 350 Mha of lost or degraded forest landscapes into the process of restoration by 2030.41 This race implies that the amount of degraded land available for one desired end use may not be as large as currently thought, that decision makers will need to consider trade-offs between alternative “restoration destinations,” and that a strategy of converting degraded land into food production faces competition from other potential uses of that land.42
In light of these issues, the concept of “degraded land” as currently used does not provide sufficiently helpful guid-ance regarding where cropland expansion consistent with a sustainable food future should ideally occur.
Some lands misidentified as inherently appropriate for cropland expansion“Degraded land” is not the only terminology prior studies have used to suggest suitable land for cropland expansion. Yet these other studies have tended to identify lands that, if converted to cropland, could have high environ-mental costs or could otherwise sacrifice benefits. Five land categories in particular are sometimes misconstrued
Ensuring Crop Expansion is Limited to Lands with Low Environmental Opportunity Costs
WORKING PAPER | September 2015 | 9
as inherently appropriate for cropland expansion: (1) potentially arable land, (2) wet savannas, (3) grazing lands, (4) secondary forests, and (5) abandoned farmland. Considering these land types as always or inherently appropriate for cropland expansion can lead to over-estimates of the amount of land available for sustainable cropland expansion and thereby create unrealistic expectations or encourage policies that create more competition for land use. In addition, it can divert focus and resources away from other items on the menu for a sustainable food future.
1. Potentially arable landIn discussions about cropland expansion, the concept of “potentially arable land” or “potentially suitable crop-land” sometimes emerges. Some research points to large amounts of potentially arable land as evidence that there is no scarcity of land for supporting the expansion of agricultural crops.43 This conclusion, however, often rests on no consideration of the existing benefits many of these lands are already providing.
The most commonly cited estimates of potential, but presently unused, cropland derive from Global Agro- Ecological Zone (GAEZ) modeling. These estimates have been incorporated into a series of papers by FAO exam-ining the prospects of meeting future food needs. As the GAEZ crop models and datasets have changed over time, the estimates of potentially arable land have actually grown. In 2002, the models estimated that 3.6 billion hectares of land were potentially arable, of which 1.5 billion hectares were already used for crops, leaving around 2.1 billion hectares of unused potential cropland.44 Based on one of the model updates, Bruinsma (2009) estimated that there are 4.2 billion hectares of land “suit-able to some extent for rainfed agriculture. Of this area some 1.6 billion ha are already under cultivation.” This leaves about 2.6 billion hectares as not-yet-cultivated, potential arable land. Using yet another update, Fischer et al. (2010) estimated that there are 5.5 billion hectares “suitable for agricultural [cropland] production globally.” Excluding land already cultivated and land under protected status, unused potential cropland was estimated to be 3.4 billion hectares.45 More recently, Alexandratos and Bruinsma (2012) estimated that 4.5 billion hectares were of “prime (very suitable) or good (suitable and moderately suitable) quality for rainfed agriculture,” implying that unused potential cropland amounted to 2.9 billion hectares.46
Despite the frequent use of these estimates, there is an initial issue of how useful they are for estimating cropping potential. For instance, both Bruinsma (2009) and Fischer et al. (2010) note that some of the not-yet-cultivated but potentially arable land might face some productivity con-straints such as ecological fragility, low fertility, and lack of infrastructure. And the test for suitability is also low: crop models estimate the potential to produce any single crop at 10 percent of its maximum potential.
But the even more fundamental issue is that the “poten-tial” to produce crops does not imply that doing so would have low environmental or social implications. The authors of these studies recognized this limitation for at least some land uses and warned readers. For instance, Bruinsma (2009) stated, “However, this favorable impres-sion must be much qualified if a number of considerations and constraints are taken into account. First, it ignores land uses other than for growing the crops for which it was evaluated. Thus, forest cover, protected areas, and land used for human settlements and economic infrastructure are not taken into account.” Likewise, Fischer et al. (2010) note, “Very clearly, a large fraction of this suitable land is not available for crop production because of its nature protection status (about 0.6 billion ha), its carbon and biodiversity value (some 1.9 billion ha of forest assessed as suitable for crops), and because of its current use for feeding a large part of the world’s 3.5 billion ruminant livestock.” Fischer et al. (2010) continue by stating that conversion of forests, woodlands, and grasslands into cultivated land often entails substantial risks of negative impacts such as greenhouse gas emissions and bio- diversity loss.
Figures about the amount of potentially arable land, there-fore, say little by themselves about the environmental and social costs of land conversion.
2. Wet savannasRecent presentations of the GAEZ modeling of potential croplands have shown figures excluding forests, implicitly highlighting their environmental value, but in doing so the estimates imply that remaining lands may be appropriate for conversion.47 Yet these remaining lands include the world’s wetter tropical and sub-tropical savannas, shrub-lands, and sparse woodlands. In many global land-use analyses, they are simply treated as “other” lands.48

10 |
We call these mixtures of grasses, shrubs, and trees collectively “wet savannas,” since their defining character-istics are sufficient rainfall for food crops and lack of dense tree cover.49 A number of studies have assumed that these wet savannas, particularly in Africa, are environmentally low cost.50
But across the large areas where they exist, wet savannas typically store large quantities of carbon. Searchinger et al. (2015) found that only about 2 percent of Africa’s wet savanna area could be converted to maize at existing yields and release one-third less carbon per ton of crop than the global average carbon loss per ton of maize.51 This figure is only 11 percent for soybeans. Wet savannas in Africa also have high levels of biodiversity, including the great mammals of Africa, and provide important watershed functions.52 Furthermore, many of these lands are also used by local people for small-scale livestock grazing, wild game hunting, and traditional cultural uses. The savannas of Latin America, likewise, provide a number of ecosystem service benefits and support extraordinary biodiversity.53 Therefore, there is no inherent reason why converting these lands to alternative uses would always have low environmental and social costs.
3. Grazing landsAnother broad category of land that some researchers suggest as a candidate for cropland expansion are grazing lands wet enough to support crops.54 But if the world is to avoid conversion of even more natural ecosystems into grazing land, it is generally going to need its existing grazing lands to meet growing demand for meat and dairy from livestock over the coming several decades.
Between 2006 and 2050, FAO projects a roughly 80 percent increase in the demand for beef, mutton, and goat, and a 70 percent increase in demand for dairy.55 Factoring in higher population growth estimates updated since the FAO projections, the figures rise modestly to 90 percent (for red meat) and 80 percent (for dairy).56 At the same time, FAO projects a smaller percentage rise in the use of crops as feeds to generate those animal products.57 Even though FAO assumes continuing improvements in feeding efficiency within livestock production systems, it projects overall efficiency will decline due to a shift in production from developed to developing countries, where reliance
on crops for feed and overall feeding efficiencies are lower. Although FAO does not explicitly project changes in pasture area, the implication is that the yields of both meat and dairy from pasturelands must increase by 70–90 percent (the range of FAO and our adjusted figures) to avoid further pasture expansion.58
Therefore, diverting pastures to cropland—even pastures currently producing low amounts of meat or milk per hect-are—merely increases the need to boost meat and dairy growth per hectare on existing pasturelands elsewhere in order to avoid land conversion to pastures through midcentury. On a global basis, pastureland only becomes available for non-grazing uses at the point that the global need for pastureland intensification is exceeded. Thus, absent changes in meat and dairy demand, pastureland yields must increase by 70–90 percent by 2050 to meet projected need, which is already a significant challenge.59
We do not suggest that poorly managed grazing land should never be a preferable alternative to locate cropland expansion. For example, converting a hectare of poorly managed grazing land instead of converting a hectare of carbon- and species-rich forest into cropland risks the possibility that farmers elsewhere will convert more forest to grazing land to meet growing milk and meat demands, but it at least avoids the certainty of converting carbon- and species-rich forest to cropland. If governments endeavor to boost pasture productivity specifically to accommodate crop expansion, they might mitigate these risks. Globally, the targeting of such lands might contribute to a sustainable food future if linked to efforts to boost meat and milk yields from remaining pasture-lands and to hold down projected growth in demand for red meat and dairy.
4. Secondary forestsSome proposals treat secondary forests (or “second-growth forests”) as appropriate candidates for cropland expansion.60 While such forests tend to store less carbon and support less species diversity than primary forests, they do still perform both of these functions. Plus, the amount of carbon and biodiversity in secondary forests often increases over time if the forest is allowed to mature.61 The regrowth of secondary forests—following timber harvests, slash-and-burn cultivation, or other land uses that impact forest cover density—sequesters carbon,

Ensuring Crop Expansion is Limited to Lands with Low Environmental Opportunity Costs
WORKING PAPER | September 2015 | 11
plays a large role in mitigating climate change,62 protects watersheds, and reduces soil erosion. Converting second-ary forests into cropland thus would have high environ-mental costs. Secondary forests also can provide a suite of economic benefits, including timber, non-timber forest products, flood and landslide protection, and more.63 Conversion thus can have high economic costs, too.
5. Abandoned farmlandSome papers treat abandoned farmland64 as an essentially “free” land reserve; that is, one without any environmental impacts from conversion back to crops.65 But abandoned farmland in areas capable of supporting trees will typically revert to forest, thereby combating climate change by absorbing atmospheric carbon dioxide as well as providing watershed protection. Other abandoned farmlands will revert to grasses and woody savannas, which also have environmental benefits. Moreover, an oft-cited study estimating the amount of global abandoned land that has not yet reverted to forest includes dry, abandoned grazing lands that are typically unsuitable for crop production.66
Abandoned farmland plays an important role in global land-use shifts. As the FAO has shown, while farmers around the world clear land for agriculture, large areas of abandoned farmland revert to forest.67 This dynamic nature of land-use change means that abandoned farm-land is often not an environmentally cost-free option for cropland expansion. Specifically, whether a tract of land is considered to have low environmental costs should reflect not only the amount of vegetation it currently has, but also the amount it is likely to have in the future if left alone. The latter amount of vegetation affects both the climate and biodiversity benefits of that tract of land. Thus, aban-doned farmland should not always be a priori considered ideal candidates for cropland expansion.
THE NEED: TarGETING LaNDS WITH LOW ENVIrONmENTaL OPPOrTuNITy COSTSTo accommodate any cropland expansion in a manner consistent with our criteria for a sustainable food future, we need to avoid misidentifying as appropriate for crop-land expansion lands whose conversion would have high environmental impacts. Moreover, any appropriate
strategy for minimizing the environmental costs of crop-land expansion should start by recognizing that there are nearly always opportunity costs to expanding crops onto a tract of land—the opportunity to use that land for some other purpose or to merely let it regenerate into its native ecosystem.
In the realm of economics and business, “opportunity cost” refers to “a benefit, profit, or value of something that must be given up to acquire or achieve something else. Since every resource (land, money, time, etc.) can be put to alternative uses, every action, choice, or decision has an associated opportunity cost.”68 In this working paper, instead of economic opportunity costs, we focus on environmental opportunity costs. Thus the opportunity cost of converting a tract of cleared land into crop production consists of the forgone environmental benefits that land would have provided via its most likely alter-native use, such as the increased carbon sequestration and downstream watershed protection that would have occurred had trees been allowed to naturally regenerate. Analyses of potentially suitable croplands tend to overlook these forgone environmental benefits.
Of course, environmental opportunity costs are likely to be a matter of degree and thus on a continuum. At the same time, benefits likely to be generated by converting a tract of land to crops are also on a continuum. For instance, lands with less absolute rainfall, less consistent rainfall, or with poor soils could be less ecologically valuable from many standpoints (including carbon storage), but they will also tend to have lower crop yields if converted.
Because of the environmental opportunity costs of using land, three principles should serve as guidance for crop-land expansion strategies:
Governments, companies, and individuals should make great efforts to hold down growth in demand for food, feed, timber, bioenergy, and other products that use land over the coming decades.69
Efforts to increase food supply over the coming decades should primarily focus on boosting production on exist-ing agricultural lands, through efforts such as restoring degraded soils to fertility and increasing yields while simultaneously holding down water consumption and greenhouse gas emissions.

12 |
Expanding onto lands with low environmental opportunity costs should occur only when and where the previous two principles will not be adequate to prevent some cropland expansion.
Screening criteria for low environmental opportunity costs We propose that lands with low environmental opportunity costs suitable for cropland expansion are those that simultaneously meet at least four criteria:
1. Not already supporting crops. By definition, land that is already being used for crop production is not eligible as an area for cropland expansion. If such land is suffering from soil degradation or has relatively low crop productivity, it may be a candidate for sustainable intensification—boosting crop yields through improved soil and water management practices, crop varieties more suited for those lands, and other measures. These measures are covered in other Creating a Sustainable Food Future working papers.70
2. Minimal impact on native ecosystems and bio- diversity. One of the criteria for a sustainable food future is to “avoid expansion into remaining natural ecosystems” (Table 1). As discussed in the Interim Findings, this criterion is a proxy for the services and biodiversity that ecosystems provide and reflects the fact that the extent and quality of native ecosystems have been diminished over the past several centuries.71 This criterion entails that any cropland expansion should avoid converting natural ecosystems or negatively impacting biodiversity.
3. Low “carbon loss to crop production” ratios. Another of the criteria for a sustainable food future is to “reduce greenhouse gas emissions from agriculture to levels consistent with stabilizing the climate” (Table 1). This entails that any cropland expansion should minimize greenhouse gas emissions from land-use change. Thus, the ideal lands for any expansion would be those that have low ratios of carbon loss relative to likely gains in crop production. This criterion is inher-ently relative; we suggest that lands that meet this criterion have no more than one-half of the average carbon releases per ton of a type of crop compared to the global average for that crop.
Every time land is converted into cropland, virtually all of the carbon in the existing vegetation will be released to the atmosphere,72 and conversion generally leads to the loss of around 25 percent of soil carbon within the top meter of soil.73 These are the carbon losses or “carbon costs” of conversion. The gain is the quantity of food produced on the converted land. The carbon loss divided by the food gain is the “carbon loss to crop production” ratio and can be measured as metric tons of carbon per ton of crop production per hectare (Tcar/Tcrop/ha). To achieve a goal of minimizing carbon losses while producing more food, cropland expansion should focus on those lands with the lowest releases of Tcar/Tcrop/ha relative to other potentially new croplands to produce those crops.
Carbon loss to crop production ratios will vary among crops. This variation occurs because crop yields (measured in tons) vary greatly between crops, in part because of their different water and energy contents, and in part because different crops have evolved with different productivities. For example, a hectare of sugarcane produces dramatically more tons of crop than a hectare of even the best-raised maize. Although most of that yield is water, sugarcane also produces far more calories per hectare. A hectare of high-yielding soybeans, which offer high protein and oil content, produces a lower crop yield measured in tons or calories than a hectare of sugarcane or maize produced with equally good management practices. Carbon loss to crop production analyses therefore have to focus on each crop separately. Figure 1 shows results of such an analysis for maize and soybeans in the wet savannas of Africa.
Land use is dynamic, as the discussion above about abandoned farmland and secondary forests illustrates. The carbon cost of converting a tract of land, there-fore, should be based not only on the carbon presently stored in that tract’s vegetation and soils, but also on the likely carbon content of that land in the future. If the tract of land being evaluated is likely to regenerate forests or grasses, the carbon loss to crop production ratio should reflect this. Recognizing the dynamic, regenerative nature of land puts a premium on identifying for cropland expansion those lands where biophysical and/or human factors are likely to block regeneration of the land into a climax native ecosystem (Box 3).

Ensuring Crop Expansion is Limited to Lands with Low Environmental Opportunity Costs
WORKING PAPER | September 2015 | 13
Unsuitable for maize & soybean
Suitable for maizeSuitable for soybeanSuitable for maize & soybean
Current croplandProtected areas
Figure 1 | mapping Carbon Loss to Crop Production ratios in the african Wet Savannas
Note: the “suitable” categories show land that with good crop management and high inputs could produce either maize, soybeans, or both in the remaining wet savannas of Africa while releasing at least one-third less carbon per ton of crop produced than the carbon released through the formation of average global croplands used for that crop. this analysis indicates that most wet savannas in Africa are not likely candidate lands with low environmental opportunity costs. While analysis at this scale is appropriate and adequate for this general insight, the datasets used are too rough at this scale to conclude confidently exactly where the most suitable lands would be. this working paper discusses how to improve on this analysis.
Source: Searchinger et al. 2015.
Low-carbon potential cropland sites. Suitable means: yields ≥4tha-1 (maize) or 1.5tha-1 (soybeans), yield CV≤30%, crop season failure rates ≤10%, and carbon loss/yield ratios 33% lower than global averages for each crop.
Suitable for maize
Suitable for soybean
Suitable for maize and soybean
unsuitable for maize and soybean
Current cropland
Protected areas

14 |
A related question concerns how to value the carbon that will accrue over time. So far, within the context of biofuels, governments in Europe have evaluated car-bon changes over 20 years, while the U.S. government has mostly used 30 years.74 There are also approaches that discount emissions over time, and approaches that do not. Although a full treatment of this issue is beyond the scope of this paper, forgone carbon seques-tration should include a time component.
4. Low blue water footprint. Yet another criterion for a sustainable food future is to “not deplete or pollute aquifers or surface waters” (Table 1). This entails that cropland expansion should not result in increased pressure on scarce freshwater resources. To assess this, a blue water footprint metric could be applicable. Measured in cubic meters of water per metric ton of crop produced (m3/ton), a blue water footprint is the “volume of surface and groundwater consumed as a result of the production of a good or service. Consump-tion refers to the volume of freshwater used and then
evaporated or incorporated into a product. It also includes water abstracted from surface or groundwater in a catchment and returned to another catchment or the sea. [In short,] it is the amount of water abstracted from groundwater or surface water that does not re-turn to the catchment from which it was withdrawn.”75 Ideal lands for crop expansion would be those that offer opportunities for lowering—or at the very least maintaining—the blue water footprint of crops, particularly in stressed watersheds.
Criterion 1 determines whether or not a tract of land is by definition an eligible candidate for cropland expansion. Criteria 2, 3, and 4 screen for the biophysical or environ-mental suitability of a tract of land for conversion to crops. Because these criteria are relatively objective, they can avoid the ambiguity of the term “degraded land”—in fact, they avoid the term altogether. They determine, or are proxies for determining, whether or not a tract of land has low environmental opportunity costs. Tracts that do not meet all four criteria are “knocked out” of consideration as
Why would lands that receive enough rainfall and that have fertile enough soils to produce crops not be naturally regenerating into their native ecosystem? the most likely reason is some biophysical or social limitation, such as some form of reversible soil degradation or problem with invasive species. the Imperata grasslands of Indonesia provide such an example. these grasslands were originally covered by rich forests but were overrun by the invasive Imperata grass after forests were cut. And a combination of natural and human-induced fires prevents natural forest succession (and therefore high levels of carbon resequestration), at least for long periods. As a result, Imperata has become the climax vegetation on some tracts of land.
Some Imperata grasslands pass the four screening criteria:
First, they are not already supporting crops.
Second, converting Imperata grasslands to crops would have minimal impact on native ecosystems and biodiversity. these grasslands are not biodiversity hotspots and support much less biodiversity than the native forests they replaced.78
third, they have low carbon loss to crop production ratios. Imperata grasslands have low carbon content—less than 20 tons of carbon per hectare (tC/ha) (compared to more than 100 tC/ha in secondary forests and more than 200 tC/ha in the primary forests of Sumatra and Kalimantan, Indone-sia).79 Yet converted Imperata grasslands can productively support economically viable tree crops, including oil palm. And the return on investment from establishing oil palm on converted Imperata grasslands can be favorable even when compared with the return on investment of establishing oil palm on recently cleared forests.80
Fourth, Imperata grassland areas receive sufficient rainfall relative to the needs of oil palm plantations.
the use of Imperata grasslands could generate vegetable oil and provide economic opportunities while avoiding forest and peatland conversion and the associated greenhouse gas emissions. But are there enough of these grasslands to meet growing oil palm demand? One study estimates a need for 3 to 7 million hectares of additional oil palm plantations in Indonesia between 2010 and 2020.81 Although no one really knows how much Imperata grassland there is, estimates include 3.5 mha82 in Kalimantan to 8 mha for all of Indonesia.83 Further research is needed to more accurately estimate the extent of these grasslands.
Box 3 | Focusing on Lands Where regeneration Is Inhibited By Biophysical and/or Social Factors
Ensuring Crop Expansion is Limited to Lands with Low Environmental Opportunity Costs
WORKING PAPER | September 2015 | 15
candidates for cropland expansion consistent with creat-ing a sustainable food future. Tracts that do meet all four criteria are what we consider to be lands with low environ-mental opportunity costs that are potentially suitable for cropland expansion.
additional practical considerations Tracts of land that meet these four criteria need to be assessed against an additional set of considerations that determines whether they should or even could be con-verted into cropland. These considerations include:
5. Economic viability. The economics of converting a tract of land into crops will play a critical role in deter-mining whether or not it gets used for crops. One can presume that lands with low environmental opportu-nity costs are not already in crops for a reason. For ex-ample, they may have a high level of soil degradation, be overrun by invasive species, have limited market access, or be too small in tract size.76 Their conversion to cropping may be more expensive for land managers than converting a forest or other native ecosystem. And rehabilitating such lands into crop production might require technical know-how and sizable up-front land treatment expenses that can hinder their economic viability; restoring soil chemistry, for instance, takes time and money.77 Because of these economic fac-tors, for lands that meet criteria 1-4 above, additional site-specific analyses will likely be needed to determine the economics of their conversion to crops. In some circumstances, the financial cost of restoring land to a level capable of supporting crops may outweigh the financial returns on growing crops in the absence of deliberate policies and financial incentives.
6. Legal availability. In many countries, zoning and other policies can determine whether people have the legal right to use a tract of land for cropping. For exam-ple, a tract of land with low environmental opportunity costs might not be eligible for conversion to crops if it is not zoned for agricultural uses.
7. Social acceptability. Agricultural production on a tract of land should be a result of the voluntary choice of the people managing, owning, or having community rights to that land. If the land is privately owned, then the owner will have ultimate say—within the context and rules set by government-defined land-use plans. If the land is communal, then the village or community institutions and processes will take effect. If the land is publicly owned, then land-use planning processes that are transparent and participatory should be followed to ensure the free, prior, and informed consent (FPIC) of the people living on the land to be converted.
8. Best alternative use. There are multiple possible uses for a tract of land that has previously been cleared of its native vegetation and is not currently in crop production. For instance, the tract could be converted into cropland. Alternatively, it could be converted into grazing land (or enhanced for grazing if it is already being grazed); turned into timber production; or restored into a relatively native forest or grassland (storing carbon, supporting biodiversity, and providing other ecosystem services). In a world that needs more of all of these outputs, each tract of land should ideally be put to its best use.
Even if a tract of land that meets criteria 1–4 could be converted into crops, there may be good reasons in-stead to restore that land into its native ecosystem. To illustrate, forests might be most appropriate for low-environmental-opportunity-cost lands on steep slopes, where mechanized crop planting and harvesting is difficult or risk of erosion is high. Forests might also be most appropriate near waterways and floodplains in order to protect watersheds from erosion, reduce siltation, ensure secure water supplies, and mitigate the impact of floods. Likewise, low-opportunity-cost lands within or between protected natural areas and those near biodiversity hotspots could be strong candidates for restoration into native ecosystems to strengthen connectivity between fragmented habitats. Table 2 provides initial suggestions of “into what” such lands might be appropriately restored given character-istics of the land.

16 |
Failure to meet criteria 5, 6, and 7 does not mean that a tract of land should necessarily be removed from consid-eration since steps could be taken to improve performance against those criteria. For example, introducing economic incentives could improve economic viability. Changing land-use zoning could make tracts legally available. And improving the benefits local people gain could make conversion to crops more socially acceptable.
rECOmmENDaTIONSA number of measures are needed to ensure that any future cropland expansion is limited to lands with low environmental opportunity costs: (a) information measures, (b) measures to facilitate cropland expansion toward those lands, and (c) measures to discourage cropland expansion into natural ecosystems. Which combination of measures is appropriate will depend on the particular contextual circumstances of the tract of land being considered.
It is important to note that the measures designed to facilitate cropland expansion onto lands with low environ-mental opportunity costs and those designed to
discourage cropland expansion into natural ecosystems are very similar to ones needed to encourage sustainable intensification on existing cropland and grazing lands. Thus these measures are important for other items on the menu for a sustainable food future, too.
a. Information measuresLimiting any future crop expansion to lands with low environmental opportunity costs will first require a clearer understanding of what these lands are. Three informational steps are necessary to build this clarity:
Agreeing upon a clear definition. Government of-ficials, land-use planners, independent researchers, and community representatives need to agree on a clear, objective, and measurable definition of “lands with low environmental opportunity costs that are suitable for cropland expansion.” We propose starting with and refining the working definition described above. In many circumstances, agreeing on definitions may be the most important and most difficult component of the information measures.84
Table 2 | Characteristics of Lands with Low Environmental Opportunity Costs and Their Possible Best alternative uses (Not Exhaustive)*
BEST POSSIBLE aLTErNaTIVE uSE
rESTOrED NaTIVE ECOSySTEm CrOPLaND GrazING LaND
Land characteristics
On steep slopes Near waterways and floodplains Within or between protected areas Near biodiversity hotspots With high carbon sequestration
potential
Close to agricultural markets and infrastructure**
likely high crop yields given water availability and soil quality
large-scale conversion of native ecosystems into cropland currently occurring in the region
Already used for livestock grazing but soil quality is degraded and grass production is low
Has high potential for improving grass production
Close to agricultural markets and infra-structure**
large-scale conversion of native ecosystems into grazing land currently occurring in the region
Notes: * Suitable use ultimately should be defined by those living in and around the area.** the presence of infrastructure such as roads near a tract of land could increase the economic attractiveness of restoring that tract into viable cropland or grazing land, since the means to get agricultural products to market are nearby.

Ensuring Crop Expansion is Limited to Lands with Low Environmental Opportunity Costs
WORKING PAPER | September 2015 | 17
Applying criteria to generate maps. Governments and independent research institutions should apply the four criteria to develop spatial maps of these lands. These maps should be generated by remote-sensing imagery combined with field investigation, be of high spatial resolution, and be hosted on a publicly available database. Suggestions per criterion include:
1. Not already supporting crops. Satellite data complemented with field visits can identify land that is already in crops. It is important to factor in croplands that happen to be in the fallow period common to the region to avoid misidentifying them as “abandoned cropland.”
2. Minimal impact on native ecosystems and biodiversity. There are a range of potential methods for identifying tracts of land supporting native ecosystems and biodiversity. Satellite data complemented with field surveys can identify contiguous tracts of natural forests, grasslands, and wetlands. Biodiversity hotspot maps can identify locations with high levels of biodiversity.85 Another method is to compare areas by the number of species they support—which can be based on the absolute number of species, endemic species, or threatened species they support.86 This analysis also should incorporate experienced judgment of ecologists knowledgeable about a region’s ecosystems so that the risk of off-site impacts can be judged.87
3. Low “carbon loss to crop production” ratios. Doing this analysis well entails several requirements. First, it requires good data on existing carbon stocks in both soils and vegetation. Where carbon stocks are currently low due to human land management practices or temporary fire, a sound basis for esti-mating likely carbon sequestration rates is needed. Second, it requires good crop modeling (using realistic management assumptions) to estimate realistic crop yields for different crops that might occupy these lands. This kind of work is not a trivial task. Crop models often generate different estimates, in part because they require detailed soil param-eters and rainfall patterns that are hard to estimate precisely, as well as management assumptions such as levels of fertilizer input. Long-term rainfall data
in sub-Saharan Africa, for example, are limited to a few locations. Ideally, these models could be cali-brated locally against real yield data under different forms of management, but such experimental data can be hard to find. The goal should be to develop as detailed data as possible, and to test predictions against as many real yield outcomes as possible.
4. Low blue water footprint. The Water Footprint Network has published blue water footprint data,88 based on a well-documented methodology, for numerous crops and regions.89 The blue water footprint for a particular crop should be assessed relative to its impact on the watershed, and the watershed’s water stress or water scarcity levels. Assessing water stress helps distinguish between water-rich and water-poor watersheds and thereby indicates whether or not the blue water footprint is of concern.
For lands that meet criteria 1–4 above, additional site- specific analyses are needed to assess the economic viability, legal availability, and social acceptability of converting them to cropland and to confirm whether or not cropping is the best alternative use of those lands.
5. Economic viability. Assessing economic viability would involve traditional project-based financial calculations including the costs of preparing a tract of land to support crops, growing and harvesting the crops, and other expenditures relative to the projected financial returns from selling the crops.
6. Legal availability. Land zoning maps and regula-tions can be helpful in assessing this consideration.
7. Social acceptability. Field visits and land ownership maps can be used to assess this consider-ation. Obtaining the FPIC of local people living in or around the area being considered will be important (see below for further elaboration).
8. Best alternative use. The general principle of “best alternative use” can be easy to articulate. If a tract of land being evaluated would be very good at producing a particular crop but poor at producing a native grassland or forest, then its best use would be the crop. Conversely, if the tract of land would

18 |
be poor at producing crops but good at producing a native forest or grassland, its best use would be the native ecosystem. But the principle can be difficult to apply. This is because multiple benefits can be generated from one land use. For instance, con-verting a tract of land to crops would generate food. Alternatively, converting a tract to livestock pastures would yield meat and milk, and sequester some carbon (compared to cropland). And restoring these lands into their native ecosystem would sequester carbon, support biodiversity, and might yield water-shed benefits. To assess best use of land in a world that needs all of these outputs, there should be a common indicator(s) and metric(s) for comparing these benefits. Researchers need to produce such an indicator(s) and metric(s) for doing these calculations.
Who makes decisions regarding best alternative use is an important consideration. If the land is privately owned, then the owner will have ultimate say—within the context and rules set by govern-ment-defined land-use plans. If the land is com-munal, then the village or community institutions and processes will take effect. If the land is publicly owned, then land-use planning processes that are transparent and participatory should be followed. Ensuring that the appropriate stakeholders are engaged in the assessment is important for long-term acceptance of any land-use decisions.
Identifying cleared or abandoned agricultural lands where biophysical and/or human factors are blocking natural regeneration. Lands that are most likely to meet criteria for “low environmental opportunity costs” are likely to be cleared lands or abandoned agricultural lands whose economic use or regeneration is inhibited by a biophysical or human-caused factor. Natural regeneration could be blocked because of fires, lack of natural source populations for native plant seeds, some form of soil degradation—including salinity, loss of fertility, and heavy erosion— or occupation by an invasive species that provides few economic or environmental benefits. Indonesia’s Imperata grasslands are an example. It is unclear whether such lands exist elsewhere and, if so, how much there is. Mapping these lands will likely require some combination of remote sensing and statistically valid field sampling. Researchers, working with governments, should attempt to map such lands.
Over the past few years, WRI and local partners have mapped lands with low environmental opportunity costs potentially suitable for sustainable oil palm in Indonesia (Box 4). Although this approach does not strictly follow the method described above, it factors in several of the criteria and considerations.
While much attention already focuses on Indonesia, the amount and location of lands with low environmental opportunity costs appears to be less clear elsewhere. Mapping is therefore urgently needed to get a sense of the potential scale and location of these lands in the regions where pressure to expand cropping area will be greatest over coming decades. Given the strictness of our criteria, our hypothesis is that only modest amounts of land will qualify.
In general, to the extent low-environmental-opportunity-cost lands exist that are capable of good crop production, they are more likely to belong to the category of aban-doned farmland since most of the other alternatives would generally be some kind of native habitat (e.g., savannas, secondary forests). But, as discussed above, some abandoned farmland can still have high environ-mental opportunity costs.
B. measures to facilitate cropland expansion onto lands with low environmental opportunity costsA second set of measures can help facilitate cropland expansion onto lands with low environmental opportunity costs. If farmers are to use these areas for crops, then the lands need to be available from a legal, economic, and social perspective. These measures include:
Prioritizing these lands in participatory spatial planning. Governments regulate eligible land uses in many countries, and in some countries they even partly or fully own rights over a great deal of land. Moreover, governments fund infrastructure such as roads that determine the economic viability of various land uses. Spatial land-use planning by governments, therefore, is an important lever for ensuring crop expansion is limited to lands with low environmental opportunity costs. In Indonesia, for instance, interviews with nearly a dozen oil palm developers identified improving land- use planning as a top priority for shifting future oil palm development to lands with low environmental oppor-tunity costs.92 To be consistent with a sustainable food
Ensuring Crop Expansion is Limited to Lands with Low Environmental Opportunity Costs
WORKING PAPER | September 2015 | 19
Over the past several years, WRI has been working with Indonesian partners to identify lands with low environmental opportunity costs with the potential to support sustainable oil palm plantation expansion in Indonesia. WRI developed a method that assesses a tract of land’s envi-ronmental suitability, economic viability, legal availability, and social ac-ceptability for oil palm development. designed with input from industry, government agencies, nongovernmental organizations, and other experts, the method is consistent with international sustainability standards (such as those of the Roundtable on Sustainable Palm Oil) and with Indonesian laws and regulations.
the environmental suitability screen filters out lands that if converted to crops would forgo high economic or environmental benefits of the cur-rent use (or vegetative cover). In particular, it screens out all primary and secondary forests, swamps, peat soils of any depth, conservation areas and bodies of water, and their buffer zones. It also screens out human settlements, some agricultural lands,90 aquaculture ponds, airports, and other large infrastructure. Figure 2 shows the results of applying this screen to Indonesia.
Since not all the lands that pass the initial screening will be suitable for oil palm, the method layers on additional screens. the economic viability screen identifies those areas with appropriate elevation, slope, rainfall, soil depth, soil type, soil drainage, and soil acidity for an oil palm planta-tion to be profitable. Areas not meeting these criteria are eliminated from the map. Figure 3 shows the results of layering in the economic screen.
the method then layers on a legal availability screen to identify land-use zoning and community rights. lands located in areas not zoned for agriculture can be difficult, but not impossible,91 to convert into oil palm or other crops. Figure 4 shows the results of layering on the legal avail-ability screen for Indonesia.
the resulting map is intended to be a high-level screen that should be followed by site-level field assessments to determine the actual condition and availability of tracts of land. In WRI’s experience, the area of land considered suitable and available after the field assessment is less than what is derived from the desktop analysis.
Finally, for the areas that remain, a social acceptability screen discerns—via field-based stakeholder interviews and workshops—the interest and willingness of communities that live in and around a candidate site to have oil palm developed there. WRI’s experience is that some communi-ties support oil palm development while others do not.
As is evident from these figures, although the area of opportunity may seem large at first, the amount of land that remains practically possible for conversion to crops (in this case oil palm) is smaller after incorporat-ing important parameters such as economic, legal, and social factors. WRI’s mapping efforts in Indonesia therefore suggest that one should view large figures of “degraded land” available for conversion to crops (or other end uses for that matter) with caution.
the method WRI has applied in Indonesia does not strictly follow the method described in “the Need” section of this working paper, partly because the former was developed before the latter. For instance, the method for identifying lands suitable for sustainable oil palm expansion in Indonesia does not incorporate “carbon loss to crop production” ratios. moreover, it implicitly uses a broad definition of lands with low environmental opportunity costs: recently deforested lands likely make it through the environmental suitability screen regardless of whether those lands are likely to naturally regenerate into forests. In Indonesia, where the economic and political forces driving oil palm expansion have been strong, forgoing the potential for forest restoration on recently cleared lands may be an appropriate sacrifice. But mapping efforts in other countries should not necessarily assume that recently cut-over land always has low opportunity costs.
For more details about this method, see Gingold et al. (2012) and visit the online “suitability mapper” at commodities.globalforestwatch.org, under the “production suitability” tab.
Box 4 | mapping Lands Suitable for Sustainable Oil Palm Expansion in Indonesia

20 |
Box 4 | mapping Lands Suitable for Sustainable Oil Palm Expansion in Indonesia
Figure 3 | Lands meeting the Environmental and Economic Criteria for Supporting Sustainable Oil Palm in Indonesia
Not Suitable Suitable
Figure 4 | Lands meeting the Environmental, Economic, and Legal Criteria for Supporting Sustainable Oil Palm in Indonesia
Not Suitable Suitable
Figure 2 | Lands meeting the Environmental Criteria for Supporting Sustainable Oil Palm in Indonesia
Not Suitable Suitable
Ensuring Crop Expansion is Limited to Lands with Low Environmental Opportunity Costs
WORKING PAPER | September 2015 | 21
future, spatial land-use planning processes should be conducted in a transparent and participatory manner93 and result in making it easier to expand into lands with low environmental opportunity costs, while harder to expand into natural ecosystems.
Clarifying and strengthening land tenure on lands with low environmental opportunity costs. Some lands with low environmental opportunity costs may be hard to convert into productive agriculture because of uncertain tenure. Uncertain tenure can undermine incentives to improve the land by those who control it, hinder the ability to use the land as collateral for raising financing, and inhibit the sale or leasing of such land to those who would improve it. Where needed, govern-ments should strengthen security of land tenure and natural resource rights through transparent and fair processes. Land tenure and natural resource rights can be in the form of individual ownership, collective or community rights, and user-right certificates, among other forms. Maps showing areas with weak or non- existent land tenure can help target a tenure clarification process. If overlaid with maps of lands with low environmental opportunity costs, such land tenure risk maps can discourage use of lands until tenure has been clarified.
Introducing financial incentives. Lands with low environmental opportunity costs may likely be under-utilized for an economic reason and therefore may require financial incentives to encourage land managers to rehabilitate these lands to support crop production.94 These incentives could take the form of time-bound land or property tax breaks, tax breaks on inputs (for example, seeds and fertilizers), special land rehabilitation loans, loan guarantees, or related fiscal policies. In addition, private and public sector entities could create specially designed national or regional land regeneration funds that invest patient capital for restoring these lands into crop production. Combined with commitments to curtail deforestation, such funds could be an appropriate use of REDD+ funds.95 To help shorten investment payback periods, one agronomic option could be for land managers to plant and harvest short-rotation cash crops amid the long-rotation crops.
Improving technical assistance and rural extension. Supporting cropland expansion onto lands with low environmental opportunity costs may require increasing farmer technical know-how for activities such as removing invasive plants, enriching soils, and nurturing the first generation of crops. Likewise, it may require increasing access to seeds and financing. Governments, research agencies, and the private sector may need to provide such technical assistance and rural extension, especially for smallholders.
Strengthening community engagement processes. Converting lands with low environmental opportunity costs into cropland should respect the rights and in-terests of the people living in and around those lands. When external entities desire to convert land uses and those lands are publicly owned or community-claimed, best practice is for the land-use decisions to have the FPIC of local people living in or around the area being considered.96 But in some situations, institutions and processes for conducting FPIC can be limited. In Indo-nesia, for example, oil palm companies have identified this limitation as a constraint to greater use of lands with low environmental opportunity costs for oil palm expansion.97 They have noted that they lack the skills to conduct FPIC and, more importantly, have a conflict of interest when asked to obtain FPIC from local commu-nities or arrange any compensation for lost user rights with local communities. And if they opt to directly pay a third party to do this work, then the third party may be perceived as an agent of the company and not be trusted by the community.
What is needed is a pool of neutral, professionally qualified, local nongovernmental and/or private organizations with the training and capacity to conduct FPIC. These entities would be called upon to lead or to be involved in FPIC processes when lands with low environmental opportunity costs come under consideration for cropland expansion. They would assist companies and governments in implementing FPIC; provide training and capacity building both to communities (on FPIC facilitation, community organization, and participatory community mapping)98 and to companies and governments (on FPIC concepts and implementation approaches); and audit/review the effectiveness of FPIC implementation.

22 |
To eliminate potential conflicts of interest, their services ideally should not be financed directly by a party in the process, but rather by a neutral fund. Cash for this fund could come from fees paid to the government as part of land-use concession or permitting processes, from a small tax on agricultural commodities, from devel-opment assistance, from REDD+ financing,99 or from other sources.
C. measures to discourage cropland expansion into natural ecosystemsA third set of measures are designed to make the financial, reputational, market access, or legal “cost” of converting natural ecosystems into cropland greater than the cost of expanding onto lands with low environmental opportunity costs. These measures can stimulate demand by farmers and agricultural companies to use low-environmental-opportunity-cost lands. These measures include:
Introducing and enforcing moratoriums on con-verting natural ecosystems. Making natural forests, savannas, wetlands, and other ecosystems off-limits for conversion to agricultural land could help stimulate demand to instead use lands with low environmental opportunity costs for meeting demand for cropland expansion. Moratoriums would induce a scarcity of natural ecosystems while degraded lands would remain relatively available.
Governments can establish moratoriums that target a specific ecosystem, a specific land use, or both. For example, since the 1990s, the United States has had a “no net loss of wetlands” policy that curtails the conver-sion of wetlands into farmland or other uses.100 In 2011, Indonesia put in place a moratorium on granting new agriculture and logging concessions in primary forests and peatlands.101
Moratoriums can arise from the private sector as well. In 2006, for example, members of the Brazilian Vegetable Oils Industry Association and the National Grain Exporters Association committed to a moratorium
on the production and trade of soybeans grown on lands in the Brazilian Amazon that are deforested after July 24 of that year.102 The moratorium has been quite effective. During the two years before the moratorium, 30 percent of soy expansion in the Brazilian Amazon oc-curred on newly deforested land. Since the moratorium, the amount dropped to about 1 percent; approximately all of the 1.3 million hectares of new soy plantings from 2006–13 in the region were on previously cleared lands.103 Moreover, the moratorium did not undermine Brazil’s soybean industry. Since implementation, soy production has continued to grow.104
A variation of the moratorium is to declare certain jurisdictions—such as counties, districts, or states—that have poor governance in terms of absent monitoring, insufficient law enforcement, or corruption as “high risk,” and those with good governance as “low risk.” Such a jurisdictional approach could harness market forces to drive agricultural expansion toward low-risk jurisdictions, and stimulate efforts to improve gover-nance in the high-risk areas.105
To realize its potential, however, a moratorium needs to be enforced and backed by measures that prevent “leak-age.” Leakage in this context occurs when conversion of land to agriculture shifts from the ecosystem covered by the moratorium to another ecosystem not covered by the moratorium.
Accelerating adoption of “deforestation-free” supply chain commitments. Having buyers, traders, and financiers of agricultural commodities commit to only purchasing or financing commodities not linked to deforestation (or other form of natural ecosystem conversion) could help persuade farmers, agricultural companies, and even political jurisdictions (e.g., dis-tricts, states) to concentrate any cropland expansion onto lands with low environmental opportunity costs. Otherwise, these farmers, agricultural suppliers, and jurisdictions could risk losing business customers, market access, or finance.

Ensuring Crop Expansion is Limited to Lands with Low Environmental Opportunity Costs
WORKING PAPER | September 2015 | 23
For example, members of the Consumer Goods Forum (CGF) such as Unilever and Nestlé have committed to achieve deforestation-free commodity supply chains by 2020 and to curtail procurement from suppliers who do not comply. These commitments cover agricultural commodities such as palm oil. The impact of these pledges is already trickling upstream. For instance, major traders of palm oil have made similar pledges to buy and sell only deforestation-free palm oil. Involving major traders helps to ensure that the supply chain pressure reaches markets where the CGF may not have as much influence, such as palm oil for home cooking in some Asian countries. As of late 2014, more than half—some reports claim more than 90 percent—of globally traded palm oil is covered by “zero deforestation” commitments.106
Financiers of agricultural commodities are taking steps, too. A number of banks have agreed to a Soft Commodities Compact designed to support business customers in their efforts to reduce commodity-driven forest conversion.107 The compact commits banks to work with consumer goods companies and their supply chains to develop appropriate financing solutions that support the growth of markets producing palm oil, soy, and beef without contributing to deforestation. Nine banks had adopted the compact as of January 2015.108
The deforestation-free supply chain model is an impor-tant development because it can align cash flows of commodity purchases and of agricultural finance with avoiding forest conversion and with using lands with low environmental opportunity costs instead. It also is one of the few ways to reach small- to medium- sized farmers or grower companies that are not publicly visible and do not have robust sustainability commit-ments. It can do so because companies with defores-tation-free commitments apply their commitments upstream not only to their direct suppliers but also to their suppliers’ suppliers.
Moreover, this supply chain model has the potential for impact at a large scale. CGF consists of 400 of the world’s leading consumer goods manufacturers
and retailers from 70 countries with combined annual sales of €2.5 trillion.109 Consequently, its members can reach deep into the global supply chains of major agricultural commodities.
A number of factors must fall into place for this model to realize its potential. First, more companies and financial institutions need to make deforestation-free supply chain commitments. Although some leaders have stepped forward, more businesses and banks need to do so. Second, together these companies and banks need to account for a significant share of market demand (or financing) of the relevant agricultural commodity. Otherwise there is a risk of sizeable market “leakage” whereby suppliers merely divert deforestation- linked agricultural commodities to a large market of buyers that have not made commitments. Third, companies and banks need to follow through on their commitments. And follow-through requires monitoring and accountability mechanisms.
Implementing monitoring systems. Both moratori-ums and deforestation-free supply chain commitments need adequate spatial monitoring systems that can discern adherence and violations. This is a necessary foundation for accountability and enforceability.
Such a monitoring system will need to be able to detect clearing of natural ecosystem vegetation and combine that data with moratorium boundaries, boundaries of supplier crop-growing areas, and other data relevant to the particular moratorium or supply chain commit-ment. The free, publicly available Global Forest Watch platform can provide such capabilities with respect to forest ecosystems.110 By combining this capability with supply chain tracking all the way to the location of origin, users can ensure deforestation-free commit-ments are being met.
Going a step further, the combination of a monitoring system and maps of lands with low environmental opportunity costs can be a foundation for comprehen-sive spatial planning that enables cropland expansion consistent with a sustainable food future. WRI and partners, for instance, are tailoring the Global Forest

24 |
Watch system to combine monitoring of forest clearing in Indonesia with maps of lands with low environmental opportunity costs potentially suitable for sustainable oil palm production.111
These three types of measures should target not only farmers and companies involved in agricultural supply chains, but also governments. In many countries, national and subnational government bodies have significant influence on how land is used, and they sometimes utilize land-use allocation and zoning as a means of advancing political and economic power. Addressing that behavior will require the greater transparency provided by the information measures, the “carrots” of the measures that direct cropland expansion toward lands with low environ-mental opportunity costs, and the “sticks” of the measures that prevent cropland expansion into natural ecosystems. In our perspective, no one set of measures will be sufficient on its own.
CONCLuDING THOuGHTS Achieving a sustainable food future needs to involve efforts to hold down growth in demand for food as well as in other products that use land, such as animal feed, timber, and bioenergy. Likewise, it needs to involve efforts to increase food supply by boosting production on existing
agricultural lands. Yet pressure will likely still remain to convert more land into crops because the projected growth in demand is so large. And even if the rate of yield improvement were to keep pace with increasing crop demand, other factors such as crop prices, land speculation, or poor enforcement of land-use policies in frontier areas could encourage cropland expansion. Therefore, any inevitable cropland expansion needs to be limited to lands with low environmental opportunity costs.
The concept of low-opportunity-cost land recognizes that there are nearly always opportunity costs to expanding crops onto a tract of land—the opportunity to use that land for some other purpose or to merely let it regenerate into its native ecosystem. We introduce this concept to avoid challenges faced by the term “degraded land” and to avoid misconstruing as inherently appropriate for cropland expansion lands whose conversion could have relatively high environmental impacts. Identifying lands with low environmental opportunity costs will require rigorous analytical approaches and mapping. In addition, ensuring crop expansion is limited to these lands will require measures that support use of these lands complemented by measures that dissuade conversion of natural ecosys-tems. In such a manner, utilizing lands with low environ-mental opportunity costs could complement other items on the menu for a sustainable food future.

Ensuring Crop Expansion is Limited to Lands with Low Environmental Opportunity Costs
WORKING PAPER | September 2015 | 25
ENdNOtES1. See Winterbottom et al. (2013).2. Searchinger et al. (2013).3. Searchinger et al. (2013).4. Searchinger et al. (2013).5. Alexandratos and Bruinsma (2012).6. uNdESA (2013).7. this projection does not include bioenergy demand. to obtain a slight
decrease in cropland area, Bajzelj et al. (2014) estimate a need both for closing most yield gaps and a 50 percent reduction in food loss and waste.
8. Alexandratos and Bruinsma (2012), table 4.8.9. West et al. (2010); Searchinger et al. (2013).10. millennium Ecosystem Assessment (2005).11. See Searchinger et al. (2014).12. See Winterbottom et al. (2013).13. Including land speculation.14. Alexandratos and Bruinsma (2012); Searchinger et al. (2013), Figure
23, notes the high rate of yields that would be necessary to avoid land- use change from soybeans; Corley (2009).
15. FAO (2014). 16. Bruinsma (2009) predicts an increase in soybean production from 218
mt in 2006 to 514 mt in 2050, with a rise in yield from 2.3 t/ha to 3.7 t/ha during that period, leading to an increase in harvested area to 141 mha. masuda and Goldsmith (2009) only look out to 2030, and project a “business as usual” scenario in 2030 where 371 mt of soybeans will be produced on 141 mha of land.
17. Soyatech (n.d.).18. Oil World (2014).19. uNCtAd (2015). 20. uNCtAd (2015).21. Pacheco (2012), Greenpeace (2012), Rainforest Foundation uK (2013).22. For example, see Rainforest Foundation Norway (2012). 23. Corley (2009). Corley’s estimate is for palm oil for edible purposes
and ‘traditional’ non-edible purposes (which do not include biofuels). Rushing and lee (2013) project up to an additional 15 mha of palm oil plantation expansion globally from 2010 or 2012 level (the base year is unclear in the publication) to 2050. the implications of current (2015) low prices for palm oil remain to be seen. For instance, it could delay the timing of expansion until prices rise again. One should note that some oil palm clones are capable of yielding 11 metric tons per hectare (which is way above the current average 4–5 metric tons per hectare), so there is still an upside potential in palm oil yields (d. mclaughlin, personal communication, April 30, 2015). However, getting selected clones to become mainstream is not a forgone conclusion.
24. uNdESA (2013). 25. Searchinger et al. (2013). this estimate assumes that sub-Saharan
Africa maintains its present level of reliance on imports of staples. If imports go down, the yield growth would need to be even higher.
26. Jayne et al. (2014) conclude that cropland area will continue to expand in sub-Saharan Africa.
27. millennium Ecosystem Assessment (2005).28. millennium Ecosystem Assessment (2005).29. Rainforest Action Network (2014). 30. See Gibbs and Salmon (2015) for a good discussion.31. miettinen et al. (2012) and Page et al. (2011).32. Page et al. (2011).33. Agus et al. (2013)34. uNEP (2012).35. d. mclaughlin, personal communication, April 30, 2015.36. this paragraph is based on Gibbs and Salmon (2015). In terms of map
overlap, after a spatial review of four different types of degraded land mapping, Gibbs and Salmon (2015) conclude: “there is general agree-ment among the data sets regarding areas with little to no degradation. Of the cells that show agreement among all four data sets, 89 percent have an average extent of degradation that is less than 5 percent of the cell area. thus, it is far less common for all of the data sets to agree that an area is degraded than to concur that it is not.”
37. See Winterbottom et al. (2013).38. We explore this improvement in Searchinger et al. (2014). 39. Personal communication, Fred Stolle and Anne Rosenbarger, may
2014.40. See Gibbs and Salmon (2015). For an example of interest in restoring
some degraded lands into forest landscape ecosystems, see Potapov et al. (2011).
41. http://www.un-redd.org/portals/15/documents/Forestsdeclarationtext.pdf.
42. In some situations, these destinations or end uses are not mutually exclusive. For instance, restoring a tract of land into an agroforestry system can result in a form of tree-based ecosystem recovery (provid-ing climate and biodiversity benefits), while at the same time increasing food production.
43. For example, one study (morris and Byerlee 2009) calls explicitly for the conversion of hundreds of millions of hectares of the wet savannas and sparse woodlands of Africa to cropping. Business consultants (e.g., Roxburgh et al. 2010) have endorsed such thinking. Biofuel studies engage in the same analysis and end up focusing heavily on savannas. For discussion about this aspect in studies of bioenergy potential, see Searchinger (2010).
44. Fischer et al. (2002), table 5.15. 45. Fischer et al. (2010). data includes land area for all crop types of cere-
als, roots and tubers, sugar crops, pulses, and oil crops.46. Alexandratos and Bruinsma (2012) cited the results of Fischer et al.
(2010), but excluded land deemed “marginally suitable” in Fischer et al. (2010) from their total. thus the total is about 1 billion hectares lower than that given in Fischer et al. (2010).
47. Alexandratos and Bruinsma (2012).48. See the discussion in the supplemental materials to Searchinger et al.
(2015).49. Searchinger et al. (2015). the areas have roughly >600 mm of rainfall
per year.

26 |
50. See Searchinger et al. (2015) for a discussion of these studies.51. the figures are based on carbon loss/yield ratios, which is the carbon
lost by the conversion of native ecosystems to cropland divided by the current annual yields of those croplands. the ratios are for individual crops, not aggregations of crops.
52. See Searchinger et al. (2015). the biodiversity values of wet savannas also can be seen by comparing the areas identified as appropriate for crop conversion in morris and Byerlee (2009) and the maps presented by Grenyer et al. (2006).
53. the Brazilian Cerrado, for instance, supports around 5,000 species of plants. Ratter et al. (2006).
54. See, for example, monteiro et al. (2010) and Alkimim et al. (2015). these lands seem to be also implicitly treated as “available” in Alexan-dratos and Bruinsma (2012).
55. Alexandratos and Bruinsma (2012).56. Searchinger et al. (2013).57. the rise in oilcakes is 70 percent and the rise in cereals is 48 percent.
this is presented as a figure in Alexandratos and Bruinsma (2012), p. 84, Figure 3.8. Because the study predicts a larger rise in pork and poultry, which rely much more heavily on feeds, the implicit rise in the use of feeds for ruminants is even less able to keep up with forages.
58. See Searchinger et al. (2013) for a discussion of figures in this para-graph.
59. Searchinger et al. (2013).60. discussed in Koh and Wilcove (2008).61. For summaries of the relative biodiversity value, see Gibson et al.
(2011); Ramage et al. (2013); Koh and Wilcove (2008). 62. Pan et al. (2011) 63. See the Global Commission on the Economy and Climate (2014) for
more details.64. In this section, we make a distinction between abandoned farmland and
lands left in fallow. Croplands that happen to be in the fallow period common to the region (to allow for soil replenishment and thereafter further cropping) are not to be considered “abandoned farmland” in this context.
65. See discussion of various papers using this approach in Searchinger (2011).
66. this study is presented in two related publications: Campbell et al. (2008) and Field et al. (2008). these publications did not identify which portion of these abandoned lands had been originally only grazing land, but communications with the lead author clarified that they were the majority and are discussed in Searchinger (2011). the original study also identified some wet abandoned lands that it claimed have not shown up on present land-use maps as forests. that probably partially represents lands that are in the process of reverting to forests, and other lands that have reverted to grasslands and are still accumulating carbon.
67. FAO (2012).
68. Businessdictionary.com accessible at http://www.businessdictionary.com/definition/opportunity-cost.html. Accessed April 5, 2015.
69. the Interim Findings (Searchinger et al. 2013) summarize some demand-side measures for doing this, including (but not limited to) reducing food loss and waste, achieving replacement level fertility rates around the world, and shifting diets.
70. See Winterbottom et al. (2013) and Searchinger et al. (2014).71. millennium Ecosystem Assessment (2005).72. Some carbon may be lost only over a few years, and when forests are
burned, a little carbon may be added for likely long-term storage in the soil through formation of charcoal. But the release of all vegeta-tive carbon (whether above- or below-ground) is generally viewed as a reasonable approximation (Fearnside and laurance 2004).
73. Guo and Gifford (2002). 74. European Commission Renewable Energy directive (2009/28/EC)
applies 20 years to amortizing emissions from direct land-use change (European Parliament 2009). u.S. EPA Renewable Fuel Standard (Searchinger 2012) applies 30 years to evaluating indirect land-use change emissions.
75. Water Footprint Network. Glossary. Accessible at http://waterfootprint.org/en/water-footprint/glossary/. Accessed July 26, 2015.
76. What type of farming system is most economically amenable to a tract of land with low environmental opportunity costs in many cases will be influenced by the size of the tract. In Indonesia, for example, a contiguous 10,000 hectare tract will be attractive to industrial-scale farmers, while five-hectare tracts are more amenable to smallholders or sustenance farmers.
77. Giller et al. (2009).78. Chapin et al. (2000).79. Figures include both biomass and necromass (Fairhurst et al. 2010).
land with less than 40 tC/ha could be converted without incurring a “carbon debt” according to the World Agroforestry Center (dewi et al. 2009.)
80. Fairhurst and mclaughlin (2009).81. For links and citations of these figures, see Gingold (2010). 82. this figure reflects the area classified as “grassland” by Sarvision’s
radar-based satellite imagery of Kalimantan in 2010. unpublished analysis conducted by WRI.
83. Garrity et al. (1997).84. this observation is based on WRI experiences attempting to divert
future oil palm plantations to Imperata grasslands in Indonesia.85. Podolsky (2003). 86. myers (2000). 87. For example, there are areas of land in sub-Saharan Africa that have
relatively low species counts but that are critical for biodiversity be-cause they form the watersheds of sensitive, highly biodiverse wetlands such as the Okavango delta in Botswana, or they form part of animal migration routes.

Ensuring Crop Expansion is Limited to Lands with Low Environmental Opportunity Costs
WORKING PAPER | September 2015 | 27
88. As well as green and gray water footprint data.89. See http://waterfootprint.org/en/. 90. the method screens out existing plantations and intensively used
agricultural areas according to ministry of Forestry land cover data. to more precisely fit the definition proposed in this working paper of lands with low environmental opportunity costs suitable for cropland expan-sion, the method should screen out all active cropping areas, which must be determined via field surveys.
91. It would require having the relevant zoning agency(ies) rezone the tract of land into a class that allows for agriculture.
92. Fairhurst et al. (2010).93. Spatial planning and the allocation of associated titles, permits, or other
forms of land-use rights need to be done in a transparent and participa-tory process. Planning and allocation should be absent of rent-seeking, corruption, and the use of “informal payments” to garner access to land. these improvements can make processes more streamlined, predictable, and fair. Ensuring that the appropriate stakeholders are engaged in the assessment is important for long-term acceptance of any land-use decisions. See the FAO Voluntary Guidelines on tenure for more information.
94. Financial incentives, however, are not needed everywhere. during interviews, managers from eleven oil palm companies in Indonesia stated that financial incentives were not needed to encourage grow-ers to convert Imperata grasslands into oil palm. they indicated that economics were not a barrier to using lands with low environmental opportunity costs. See Fairhurst et al. (2010).
95. Reduced Emissions from deforestation and forest degradation in developing countries.
96. FPIC refers to “a collective expression of support for a proposed project (e.g., agricultural plantation) by potentially affected people, reached through an independent and self-determined decision-making process undertaken with sufficient time, and in accordance with their cultural traditions, customs and practices…the FPIC principle implies that, whatever the form of consent, it must be free of coercion; obtained prior to the commencement of any project activities; and informed through access to all the information necessary to make the decision, including knowledge of legal rights and the implications of the project.” From Fairhurst et al. (2010).
97. Fairhurst et al. (2010).98. Participatory mapping—also called community-based mapping—is
a general term used to define a set of approaches and techniques that combines the tools of modern cartography with participatory methods to represent the spatial knowledge of local communities. See www.mappingforrights.org.
99. Reduced Emissions from deforestation and forest degradation “plus” fostering conservation, sustainable management of forests, and en-hancement of forest carbon stocks.
100. Salzman and Ruhl (2006).101. murdiyarso et al. (2011), Austin et al. (2012).102. Fabiani et al. (2010).103. Gibbs et al. (2015). 104. Soy production in Brazil was about 20 million metric tons in 1991, 56
million metric tons in 2005, 61 million metric tons in 2007, 75 million metric tons in 2011, and 82 million metric tons in 2013. Source: 1991 through 2009 data are from the uS department of Agriculture, as reported in Boucher et al. (2011). data for 2011 and 2013 are from u.S. department of Agriculture (2013).
105. d. mclaughlin, personal communication, April 30, 2015.106. Grandia (2014) and Harball (2015). 107. university of Cambridge, Institute for Sustainability leadership (2014).108. university of Cambridge, Institute for Sustainability leadership (2014)
and university of Cambridge, Institute for Sustainability leadership (2015). the founding member banks are Barclays, deutsche Bank, lloyds Banking Group, Santander, Westpac, BNP Paribas, RBS, and uBS.
109. the Consumer Goods Forum (2014).110. See http://www.globalforestwatch.org.111. See http://commodities.globalforestwatch.org.

28 |
REFERENCESAgus, F., P. Gunarso, B.H. Sahardjo, N. Harris, m. van Noordwijk, and t. Killeen. 2013. “Historical CO2 Emissions from land use and land use Change from the Oil Palm Industry in Indonesia, malaysia and Papua New Guinea.” Reports from the technical Panels of the 2nd Greenhouse Gas Working Group of the Roundtable on Sustainable Palm Oil: 65–88.
Alexandratos, N., and J. Bruinsma. 2012. World agriculture towards 2030/2050: the 2012 revision. Rome: FAO.
Alkimim, A., G. Sparovek, and K. C. Clarke. “Converting Brazil’s pastures to cropland: An alternative way to meet sugarcane demand and to spare forestlands.” Applied Geography 62: 75–84.
Austin, K., F. Stolle, and S. Sheppard. 2012. Indonesia’s moratorium on New Forest Concessions. Washington, dC: World Resources Institute.
Bajzelj, B., K. S. Richards, J. m. Allwood, P. Smith, J. S. dennis, E. Curmi, and C. A. Gilligan. 2014. “Importance of food-demand management for climate mitigation.” Nature Climate Change 4: 924–929.
Boucher, d., P. Elias, K. lininger, C. may-tobin, S. Roquemore, and E. Saxon. 2011. the Root of the Problem: What’s driving tropical deforestation today? Washington, dC: union of Concerned Scientists.
Bruinsma, J. 2009. the Resource Outlook to 2050: By how much do land, water and crop yields need to increase by 2050? Rome: FAO.
Campbell, J. E., d. B. lobell, R. C. Genova, and C. B. Field. 2008. “the global potential of bioenergy on abandoned agricultural lands.” Environmental Science & technology 42 (15): 5791–5794.
Chapin, F. S., E. S. Zavaleta, V. t. Eviner, R. l. Naylor, P. m. Vitousek, H. l. Reynolds, d. u. Hooper, S. lavorel, O. E. Sala, S. E. Hobbie, m. C. mack, and S. díaz. 2000. “Consequences of changing biodiversity.” Nature 405: 234–242.
Corley, R. H. 2009. “How much palm oil do we need?” Environmental Science & Policy 12: 134–139.
dewi, S., N. Khasanah, S. A. E. Rahayu, and m. van Noordwijk. 2009. Carbon Footprint of Indonesian Palm Oil Plantation: a Pilot Study. Bogor, Indonesia: World Agroforestry Centre (ICRAF), SEA Regional Office.
European Parliament. 2009. “directive 2009/28/EC of the European Parliament and of the Council of 23 April 2009 on the promotion of the use of energy from renewable sources and amending and subsequently repealing directives 2001/77/EC and 2003/30/EC.”
Fabiani, l., C. lovatelli, and B. Rudorff. 2010. Soy moratorium: mapping & monitoring of Soy Plantings in the Amazon Biome in the third Year. São Paulo: ABIOVE, GlobalSat, and INPE. Accessible at: <http://www.abiove.org.br/site/_files/english/04092012-161845-relatorio_moratoria_2012_ingles.pdf>.
Fairhurst, t., and d. mclaughlin. 2009. Sustainable Oil Palm development on degraded land in Kalimantan. Washington, dC: World Wildlife Fund.
Fairhurst, t., m. mcleish, and R. Prasodjo. 2010. Conditions Required by the Private Sector for Oil Palm Expansion on degraded land in Indonesia. london and Washington, dC: tropical Crop Consultants, ltd and World Resources Institute.
FAO (Food and Agriculture Organization of the united Nations). 2012. Global forest land-use change 1990–2005. Rome: FAO.
FAO (Food and Agriculture Organization of the united Nations). 2014. “FAOStAt.” Rome: FAO.
Fearnside, P. and W. laurance. 2004. “tropical deforestation and greenhouse-gas emissions,” Ecological Applications 14: 982–986.
Field, C. B., J. E. Campbell, and d. B. lobell. 2008. “Biomass energy: the scale of the potential resource.” trends in Ecology & Evolution 23 (2): 65–72.
Fischer, G., H. van Velthuizen, m. Shah, and F. Nachtergaele. 2002. Global Agro-ecological Assessment for Agriculture in the 21st Century: methodology and Results. laxenburg, Austria: International Institute for Applied Systems Analysis.
Fischer, G. E. Hizsnyik, S. Prieler, and d. Wiberg. 2010. Scarcity and abundance of land resources: competing uses and the shrinking land resource base. Rome: FAO (Food and Agriculture Organization of the united Nations).
Garrity, d. P., m. Soekardi, m. van Noordwijk, R. de la Cruz, P. S. Pathak, H. P. m. Gunasena, N. Van So, G. Huijun, and N. m. majid. 1997. “the Imperata grasslands of tropical Asia: Area, distribution and typology.” Agroforestry Systems 36: 3–29.
Gibbs H. K., l. Rausch, J. munger, I. Schelly, d. C. morton, P. Noojipady, B. Soares-Filho, P. Barreto, l. micol, and N.F. Walker. 2015. “Brazil’s Soy moratorium.” Science 347 (6220): 377–378.
Gibbs, H. K., and J.m. Salmon. 2015. “mapping the world’s degraded land.” Applied Geography. 57: 12–21.
Gibson, l., t. m. lee, l. P. Koh, B. W. Brook, t. A. Gardner, J. Barlow, C. A. Peres, C. J. A. Bradshaw, W. F. laurance, t. E. lovejoy, and N. S. Sodhi. 2011. “Primary forests are irreplaceable for sustaining tropical biodiversity.” Nature 478: 378–383.
Giller, K.E., E. Witter, m. Corbeels, and P. tittonell. 2009. “Conservation agriculture and smallholder farming in Africa: the heretics’ view.” Field Crops Research 114: 23–34.
Gingold, B. 2010. “FAQ: Indonesia, degraded land and Sustainable Palm.” November 4, 2010. Washington, dC: World Resources Institute. Accessible at: < http://www.wri.org/blog/2010/11/faq-indonesia-degraded-land-and-sustainable-palm-oil>.
Gingold, B., A. Rosenbarger, Y. K. d. muliastra, F. Stolle, m. Sudana, m. d. m. manessa, A. murdimanto, S. B. tiangga, C. C. madusari, and P. douard. 2012. “How to Identify degraded land for Sustainable Palm Oil in Indonesia.” Washington, dC: World Resources Institute.
Grandia, K. 2014. “Forest Heroes Wins a BENNY top Campaign Award!” Forest Heroes, december 16, 2014. Accessible at: <http://www.forestheroes.org/forest_heroes_wins_a_benny>.
Greenpeace. 2012. Palm oil’s new frontier: How industrial expansion threatens Africa’s rainforests. Amsterdam: Greenpeace International.

Ensuring Crop Expansion is Limited to Lands with Low Environmental Opportunity Costs
WORKING PAPER | September 2015 | 29
Grenyer, R., C. d. l. Orme, S. F. Jackson, G. H. thomas, R. G. davies, t. J. davies, K. E. Jones, V. A. Olson, R. S. Ridgely, P. C. Rasmussen, t. ding, P. m. Bennett, t. m. Blackburn, K. J. Gaston, J. l. Gittleman, and I. P. F. Owens. 2006. “Global distribution and conservation of rare and threatened vertebrates.” Nature 444: 93–96.
Guo, l.B. and R.m. Gifford. 2002. “Soil carbon stocks and land use change: a meta analysis.” Global Change Biology 8 (4): 345–360.
Harball, E. 2015. “How a small band of activists saved tropical forests by turning around ‘Big doughnut.’” ClimateWire, February 4, 2015. Accessible at: <http://www.eenews.net/climatewire/stories/1060012804>
Jayne, t. S., A. Chapoto, N. Sitko, C. Nkonde, m. muyanga, and J. Chamberlin. 2014. “Is the Scramble for land in Africa Foreclosing a Smallholder Agricultural Expansion Strategy?” Journal of International Affairs 67 (2): 35–53.
Koh, l. P., and d. S. Wilcove. 2008. “Is oil palm agriculture really destroying tropical biodiversity?” Conservation letters 1: 60–64.
masuda, t., and P. d. Goldsmith. 2009. “World Soybean Production: Area Harvested, Yield, and long-term Projections.” International Food and Agribusiness management Review 12 (4): 143–162.
mekonnen, m. m., and A. Y Hoekstra. 2010. the green, blue, and grey water footprint of crops and derived crop products. delft: uNESCO-IHE (united Nations Educational, Scientific, and Cultural Organization—Institute for Water Education).
miettinen, J., A. Hooijer, C. Shi, d. tollenaar, R. Vernimmen, S. C. liew, C. malins, and S. E. Page. 2012. “Extent of industrial plantations on Southeast Asian peatlands in 2010 with analysis of historical expansion and future projections.” Global Change Biology Bioenergy 4: 908–918.
millennium Ecosystem Assessment. 2005. Ecosystems and Human Well-being: Synthesis. Washington, dC: Island Press.
monteiro, J. m., l. B. E. Veiga, and H. l. C. Coutinho. 2010. “Sugarcane crop for biofuel production, demand on soil resource and food security in Brazil.” Paper presented at the 19th World Congress of Soil Science, Soil Solutions for a Changing World, August 1–6, 2010, Brisbane, Australia.
morris, m., and d. Byerlee. 2009. Awakening Africa’s Sleeping Giant. Washington, dC: World Bank.
murdiyarso, d., S. dewi, d. lawrence, and F. Seymour. 2011. “Indonesia’s forest moratorium: A stepping stone to better forest governance?” Working Paper 76. Bogor, Indonesia: Center for International Forestry Research.
myers, N., R.A. mittermeier, C.G. mittermeier, G.A.B. da Fonseca, and J. Kent. 2000. “Biodiversity hotspots for conservation priorities.” Nature 403: 853–858. doi: 10.1038/35002501.
Nepstad, d. C., C. m. Stickler, B. Soares-Filho, and F. merry. 2008. “Interactions among Amazon land use, forests and climate: prospects for a near-term forest tipping point.” Philosophical transactions of the Royal Society B 363: 1737–1746.
Oil World. 2014. “Oil World data Base march 2014.” Hamburg, Germany: Oil World IStA mielke GmbH. Accessible at: <http://www.slideshare.net/GreenPalmOil/2013-global-vegtable-oil-production>.
Pacheco, P. 2012. “Soybean and palm oil expansion in South America: A review of main trends and implications.” Working Paper 90. Bogor, Indonesia: Center for International Forestry Research.
Page, S. E., R. morrison, C. malins, A. Hooijer, J. O. Rieley, and J. Jauhiainen. 2011. “Review of peat surface greenhouse gas emissions from oil palm plantations in Southeast Asia.” ICCt White Paper 15. Washington, dC: International Council on Clean transportation.
Pan, Y., R. A. Birdsey, J. Fang, R. Houghton, P. E. Kauppi, W. A. Kurz, O. l. Phillips, A. Shvidenko, S. l. lewis, J. G. Canadell, P. Ciais, R. B. Jackson, S. W. Pacala, A. d. mcGuire, S. Piao, A. Rautiainen, S. Sitch, and d. Hayes. 2011. “A large and persistent carbon sink in the world’s forests.” Science 333: 988–993.
Podolsky, R. 2003. “Biodiversity Hotspot Analysis using diversidad Software: A Background document In Preparation of the laguna merin Workshop.” New York: Columbia university, Center for International Earth Science Information Network Earth Science Institute.
Potapov, P., l. laestadius, and S. minnemeyer. 2011. Global map of forest landscape restoration opportunities. Washington, dC: World Resources Institute. Accessible at: <www.wri.org/forest-restoration-atlas>.
Rainforest Action Network. 2014. Conflict Palm Oil in Practice: Exposing KlK’s Role in Rainforest destruction, land Grabbing and Child labor. San Francisco, CA: Rainforest Action Network.
Rainforest Foundation Norway. 2012. “Norway: Palm oil consumption reduced by two thirds.” Oslo: Rainforest Foundation Norway. Accessible at: <http://www.regnskog.no/en/rainforest-news/rainforest-foundation-norway/norway-palm-oil-consumption-reduced-by-two-thirds>.
Rainforest Foundation uK. 2013. Seeds of destruction: Expansion of Industrial Oil Palm in the Congo Basin: Potential Impacts on Forests and People. london: Rainforest Foundation uK.
Ramage, B. S., d. Shell, H. m. Salim, C. Fletcher, N. Z. mustafa, J. C. luruthusamay, R. d. Harrison, E. Butod, A. d. dzulkiply, A. R. Kassim, and m. d. Potts. 2013. “Pseudoreplication in tropical forests and the resulting effects on biodiversity conservation.” Conservation Biology 27: 364–372.
Ratter, J.A., S. Bridgewater, and J.F. Ribeiro. 2006. Biodiversity patterns of the woody vegetation of the Brazilian Cerrado. In R.t. Pennington, G.P. lewis, and J.A. Ratter (eds.). Neotropical savannas and seasonally dry forests: plant diversity, biogeography and conservation. Boca Raton, Florida: CRC Press.
30 |
Rosenbarger, A., B. Gingold, R. Prasodjo, A. Alisjahbana, A. Putraditama, and d. tresya. 2013. “How to Change legal land use Classifications to Support more Sustainable Palm Oil Production in Indonesia.” Washington, dC: World Resources Institute.
Roxburgh, C., N. dorr, A. leke, A. tazi-Riffi, A. van Wamelen, S. lund, m. Chironga, t. Alatovik, C. Atkins, N. terfous, and t. Zeino-mahmalat. 2010. lions on the move: the progress and potential of African economies. mcKinsey Global Institute.
Rushing, J. and C. lee. 2013. New Oils for the New World. Chicago, Ill: A.t. Kearney.
Salzman, J., and J. B. Ruhl. 2006. “’No Net loss’ – Instrument Choice in Wetlands Protection.” In J. Freeman and C. d. Kolstad (eds.). moving to markets in Environmental Regulation: lessons from thirty Years of Experience. Oxford, uK: Oxford university Press.
Searchinger, t. 2010. “Biofuels and the need for additional carbon.” Environmental Research letters 5: 024007.
Searchinger, t. 2011. “Potential clarifications to the uK Climate Committee’s Bioenergy Review.” Princeton, NJ: Princeton university StEP Program.
Searchinger, t., C. Hanson, J. Ranganathan, B. lipinski, R. Waite, R. Winterbottom, A. dinshaw, and R. Heimlich. 2013. Creating a Sustainable Food Future: A menu of solutions to sustainably feed more than 9 billion people by 2050. World Resources Report 2013–14: Interim Findings. Washington, dC: World Resources Institute.
Searchinger, t., C. Hanson, and J.-m. lacape. 2014. “Crop Breeding: Renewing the Global Commitment.” Working Paper, Installment 7 of Creating a Sustainable Food Future. Washington, dC: World Resources Institute.
Searchinger, t., l. Estes, P. K. thornton, t. Beringer, A. Notenbaert, d. Rubenstein, R. Heimlich, R. licker, and m. Herrero. 2015. “High carbon and biodiversity costs from converting Africa’s wet savannahs to cropland.” Nature Climate Change 5, 481–486.
Soyatech. n.d. “Palm Oil Facts.” Accessible at: <http://www.soyatech.com/Palm_Oil_Facts.htm.> (Accessed on October 29, 2012.)
the Consumer Goods Forum. 2014. “the Consumer Goods Forum Calls for Binding Global Climate Change deal.” June 18, 2014. Accessible at: <http://www.theconsumergoodsforum.com/the-consumer-goods-forum-calls-for-binding-global-climate-change-deal>.
the Global Commission on the Economy and Climate. 2014. “land use.” Chapter 3 in Better Growth, Better Climate: the New Climate Economy Report. Washington, dC: the Global Commission on the Economy and Climate.
uNCtAd (united Nations Conference on trade and development). n.d. “Infocomm Commodity Profile Palm Oil.” Accessible at: <http://www.unctad.info/en/Infocomm/AACP-Products/Palm-oil>. (Accessed on July 14, 2015.)
uNdESA (united Nations department of Economic and Social Affairs). Population division. 2013. “World Population Prospects: the 2012 Revision, Highlights and Advance tables.” Working Paper ESA/P/WP. New York: united Nations.
uNEP (united Nations Environment Programme). 2012. “the Emissions Gap Report 2012.” Nairobi: uNEP.
u.S. department of Agriculture. 2013. World Agricultural Supply and demand Estimates. Available online at: <http://www.usda.gov/oce/commodity/wasde/latest.pdf>.
university of Cambridge, Institute for Sustainability leadership. 2014. “Banking Environment Initiative.” Cambridge, uK: university of Cambridge. Accessible at: <http://www.cisl.cam.ac.uk/Business-Platforms/Banking-Environment-Initiative>.
university of Cambridge, Institute for Sustainability leadership. 2015. “Rabobank joins Compact group.” Cambridge, uK: university of Cambridge. Accessible at: < http://www.cisl.cam.ac.uk/business-action/sustainable-finance/banking-environment-initiative/rabobank-join-compact-group>.
West, P. C., H. K. Gibbs, C. monfreda, J. Wagner, C. C. Barford, S. R. Carpenter, and J. A. Foley. 2010. “trading carbon for food: Global comparison of carbon stocks vs. crop yields on agricultural land.” Proceedings of the National Academy of Sciences of the united States of America 107: 19645–19648.
Winterbottom, R., C. Reij, d. Garrity, J. Glover, d. Hellums, m. mcGahuey, and S. Scherr. 2013. “Improving land and Water management.” Working Paper, Installment 4 of Creating a Sustainable Food Future. Washington, dC: World Resources Institute.

Ensuring Crop Expansion is Limited to Lands with Low Environmental Opportunity Costs
WORKING PAPER | September 2015 | 31
ABOut WRI WRI is a global research organization that works closely with leaders to turn big ideas into action to sustain a healthy environment—the foundation of economic opportunity and human well-being. Our ChallengeNatural resources are at the foundation of economic opportunity and human well-being. But today, we are depleting Earth’s resources at rates that are not sustainable, endangering economies and people’s lives. People depend on clean water, fertile land, healthy forests, and a stable climate. livable cities and clean energy are essential for a sustainable planet. We must address these urgent, global challenges this decade. Our VisionWe envision an equitable and prosperous planet driven by the wise manage-ment of natural resources. We aspire to create a world where the actions of government, business, and communities combine to eliminate poverty and sustain the natural environment for all people. Our approachCOuNt ItWe start with data. We conduct independent research and draw on the latest technology to develop new insights and recommendations. Our rigorous analysis identifies risks, unveils opportunities, and informs smart strategies. We focus our efforts on influential and emerging economies where the future of sustainability will be determined. CHANGE ItWe use our research to influence government policies, business strategies, and civil society action. We test projects with communities, companies, and government agencies to build a strong evidence base. then, we work with partners to deliver change on the ground that alleviates poverty and strength-ens society. We hold ourselves accountable to ensure our outcomes will be bold and enduring. SCAlE ItWe don’t think small. Once tested, we work with partners to adopt and expand our efforts regionally and globally. We engage with decision-makers to carry out our ideas and elevate our impact. We measure success through government and business actions that improve people’s lives and sustain a healthy environment.
ACKNOWlEdGmENtSthe authors would like to acknowledge the following individuals for their valu-able guidance and critical reviews: Ezra Berkhout (PBl Netherlands Environ-mental Assessment Agency), Ben ten Brink (PBl Netherlands Environmental Assessment Agency), Chris delgado (WRI), Eric dinerstein (Resolv), Jenny Goldstein (university of California, los Angeles), Nancy Harris (WRI), lisa Johnston (WRI), Agnieszka latawiec (International Institute for Sustainability-Brazil), denise leung (WRI), Brian lipinski (WRI), david mclaughlin (WWF), moray mcleish (Price Waterhouse Coopers-Indonesia), Aurelio Padovezi (WRI-Brasil), Anne Rosenbarger (WRI-Indonesia), Nirarta Samadhi (WRI-Indonesia), Fred Stolle (WRI), Bernardo Strassburg (International Institute for Sustainability-Brazil), Carl Wahl (Concern Worldwide), Richard Waite (WRI), Peter Veit (WRI), and Robert Winterbottom (WRI).
We thank the more than dozen participants in the WRI-hosted “land use Op-portunity mapping” workshop (may 27, 2015), which provided an opportunity to preview the emerging messages of this working paper and motivated us to provide more quantitative screening criteria for lands with low environmental opportunity costs.
We appreciate the research conducted by lisa Johnston, Andrew leach, Hidayah Hamzah, and tania Puspita Firdausy for the maps of Indonesia in Box 3; the citation checking by Caroline Vexler; and the suggestions on the water criterion by Charles Iceland and Paul Reig.
We thank Emily Schabacker for style editing and Robert livernash for copy- editing and proofreading. In addition, we thank Hyacinth Billings, Carni Klirs, and Jen lockard for publication layout and design. We also thank Aaryaman Singhal and Caroline Vexler for research assistance.
For this working paper, WRI is indebted to the generous financial support of the Norwegian ministry of Foreign Affairs, the united Nations development Programme, the united Nations Environment Programme, and the World Bank. WRI also thanks the united Kingdom’s department for International develop-ment for its support of WRI’s Project POtICO from which we derived much insight and analysis.
this working paper represents the views of the authors alone. It does not necessarily represent the views of the World Resources Report’s funders.
ABOut tHE AutHORSCraig Hanson, Global director of Food, Forests and Water at WRI; Steward of the World Resources Report Contact: [email protected]
Tim Searchinger, Senior Fellow at World Resources Institute (WRI); Research Scholar at Princeton university

32 |
Copyright 2015 World Resources Institute. this work is licensed under the Creative Commons Attribution 4.0 International license. to view a copy of the license, visit http://creativecommons.org/licenses/by/4.0/
10 G Street, NE | Washington, dC 20002 | www.WrI.org