ensuring an integrated world- class supply chain
TRANSCRIPT
ENSURING AN INTEGRATED WORLD-CLASS SUPPLY CHAIN
Philip A. HodgesExecutive Vice President Supply Chain
INTEGRATED SUPPLY CHAIN

Running a successful integrated supply chain
1. Continue building on the solid foundation led by Fund the Journey and SAIL’22
2. SAIL’22 priorities impacting supply chain
3. Providing Supply Chain solutions to changing consumer landscape
4. Driving margin improvement
5. Delivering against our Together Towards ZERO commitments
2

We have moved from pockets of excellence to global, integrated and end-to-end
3
THEN Patches of excellence NOW Global, integrated, end-to-end
World class B&P
Traditional procurement levers
Total cost of ownership
Capacity solver projects
Customer driven supply network
In-plant qualityBeer-in-hand quality
Health & safety routines
ZERO accidents culture
Reducing environmental costs
Environmental leadership
Top tier in customer service
Maintain top SSL position
Cutting SKUsHolistic portfolio management
E2E efficiencies using COM driven Lean/TPM

Unchanged objectives: deliver SAIL’22. Enable growth, optimise cost & assets and master processes
4
Quality, health & safety, sustainability
Measured against a balanced scorecard
Optimise cost and asset utilisation
• Carlsberg Excellence
• Gross/net Savings
• Capital Investment
• ROIC
Master cross-functional processes
• Digitalisation
• Transactional processes
Enable commercial growth agenda
• Support innovation and premiumisation
• Respond to growth in complexity
Live by our Compass, our purpose and winning culture

We have improved the overall health of our operations
5
7.4
4.3 4.2
3.5
2016 2017 2018 2019
LTAR/per 1,000 employees
Lost-time accidents
34
14
97
2016 2017 2018 2019Market
Recall/Withdraw
Quality
6.35.9
5.65.2
2016 2017 2018 2019
CO2 kg/hl
Together towards ZERO
56%58%
62%
2016 2017 2018OEE WE
priority lines
Production efficiency
2016 2017 2018
Net savings
Funding the Journey
-13% -
14%-16%
2016 2017 2018
TWC/net revenue
Production efficiency
Achieved significant reduction in LTAR…
Boosted our public reputation…
Maintained a disciplined cash focus…
Meeting our sustainability targets…
Strong focus on Carlsberg excellence…
Deliveredsignificant savings…

Our supply chain must manage volume growth in Asia and an increased level of complexity across the Group
Core beer Craft &speciality
Alcohol-freebrews
Growing categories…
2016 (index 100) 2019E
6
Core beer Craft &speciality
Alcohol-freebrews
… and increased level of innovations
2018 (index 100) 2019
>90%
>300%

We are managing portfolio complexity and strengthening capabilities in the organisation
7
Focus primarily
on # SKUs; ISC driven
Profitability of the tail and
# SKUs. Embed commercial ownership.
Focus on robust portfolio profitability and inflow threshold
compliance.
20172018 2019
8% net SKU
reduction16% increase in
tail profitability100% visibility on stage
gate compliance
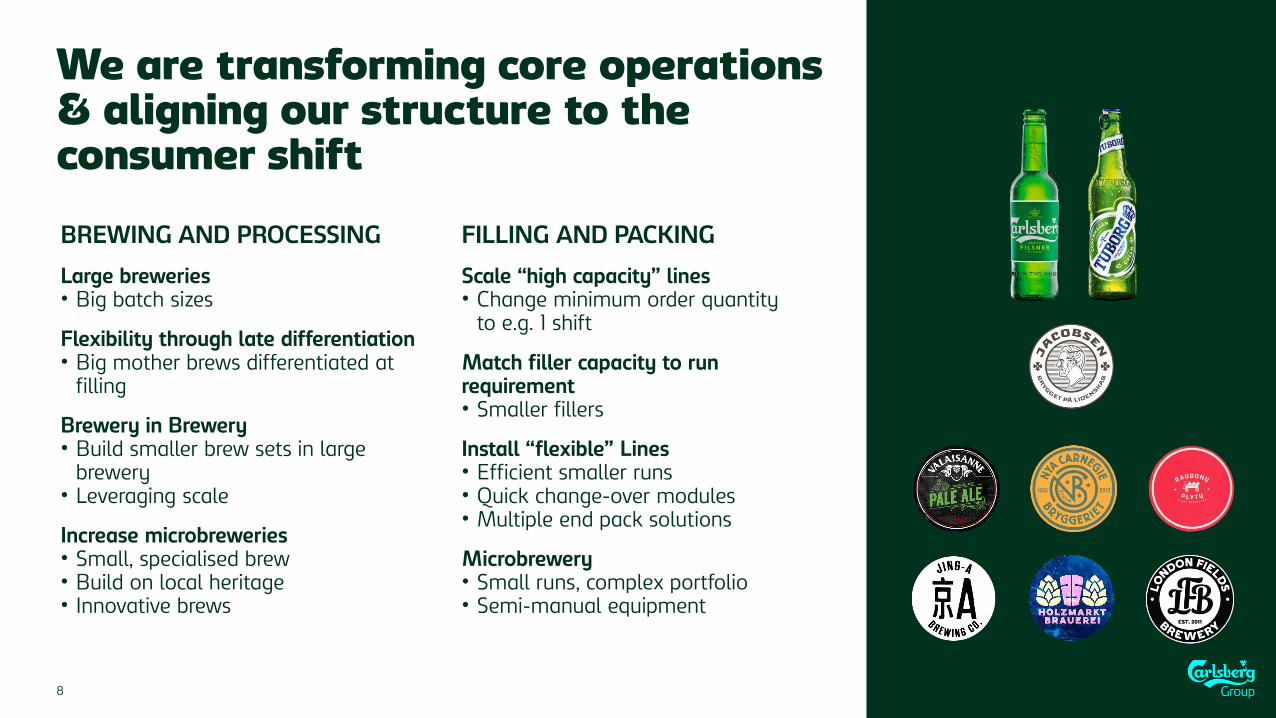
We are transforming core operations & aligning our structure to the consumer shift
8
BREWING AND PROCESSING
Large breweries• Big batch sizes
Flexibility through late differentiation• Big mother brews differentiated at
filling
Brewery in Brewery• Build smaller brew sets in large
brewery• Leveraging scale
Increase microbreweries• Small, specialised brew• Build on local heritage• Innovative brews
FILLING AND PACKING
Scale “high capacity” lines• Change minimum order quantity
to e.g. 1 shift
Match filler capacity to run requirement• Smaller fillers
Install “flexible” Lines• Efficient smaller runs• Quick change-over modules• Multiple end pack solutions
Microbrewery• Small runs, complex portfolio• Semi-manual equipment

Our network of micro-breweries increases, serving as “hot beds” of new brews
9
-> 2017 2018 2019 2020
6 13 15 18
Ny Carnegie SE
EC Dahls NO
Aldaris LV
Valaisanne CH
Zatec CZ
Jacobsen DK (Ph 1)
Valaisanne Brew Pub CH
Svyturus LT
Berlin Container DE
Astra Brewpub DE
Ringnes Brewpub NO
Tigre Brewpub FR
Nizhniy Novgorod RU
London Fields UK
Tian Dao C&S China
Jacobsen in Fredericia DK
Valby Brew Pub DK
Grimbergen BE
Cardinal CH
(Jacobsen becomes brewpub)

Supporting the continuous DraughtMaster growth across regions
10
DraughtMaster volume
growth
2017 H1 2019
+40%
2016 2018
ASIAStarted to test
growth
opportunities
WESTERN EUROPEContinued
growth
NORDICSStarted full
conversion
Norway (2x), Finland
Sweden, Denmark
>15 line locations
Portugal, Italy
Greece, Serbia,
Romania
China, India
Malaysia

Handling the portfolio by optimising asset location while respecting heritage and Together Towards ZERO
Specialisation in HUB locations drives asset investment decisions
• Scale for efficiency
• Standardise processes
• Firepower in the right locations
• Invest in brewing & processes and packing to create hubs for:
• Segments
• Pack types
11

Network “hub” concept in Western Europe
12
CRAFT & SPECIALITYWestern Europe
Portugal
Northampton
Kerava 2
Fredericia
Brzesko
Koprivnica Celarevo
Blagoevgrad
Rheinfelden
Utena
Switzerland
Germany
Poland
Sweden
Denmark
United Kingdom
Finland
Croatia
Estonia
Lithuania
BulgariaSerbia
Porto 1
Lubz
Saku
Szczecin
ELUDX-border EE/ASIA
BARLEY BROSSt. Pete Obernai
STEEL KEGWestern Europe
0.0 BREWSWestern Europe

Growth in China is facilitated via national and regional hubs
13
National HUB drives efficiency on small batches of craft & speciality variants…
… and regional HUBs optimises network via demand-zone split

SnapPack can capability in UK, DK
Becoming more efficient and shifting capex to our SAIL’22 priority areas, supporting growth and premium-led complexity
Our capex programme is driven by
Enable growth
Replace assets and infrastructure
Cost reduction/automation
Environmental commitments
14
EXAMPLES OF CAPEX IN COMING YEARS
Can capacity in China, Nordics
AFB capabilities in Europe, Asia
TTZ commitments, water management
DM roll-out Nordics, Asia

Increased line efficiency and “free” hectolitre generated through Carlsberg Excellence
CARLSBERG EXCELLENCE
One culture – One system – One language
• >10pp improvement in overall equipment efficiency
• Capacity released = 3-5 large breweries
15
2018 2019 2020 2021 2022
Breweries started
26% 63% 75% 80% 88%

0.0
0.5
1.0
1.5
2.0
2.5
3.0
68.0
70.0
72.0
74.0
76.0
78.0
80.0
82.0
2017 2018 2019
Enabling China volume growth by improving OEE
Bottle vol. gain vs. PY Can vol. gain vs. PY Bottle OEE Can OEE
Improving existing asset efficiency is a critical enabler for delivering on growth
+10% OEE
+11% OEE
MAJOR DRIVERS OF OEE IMPROVEMENT
• Upskilling line colleagues
• Upskilling maintenance teams
• Breakdown/defect rate reduction
• Minor stops reduction
OEE IMPROVEMENTS HAVE UNLOCKED
• 4 million hl bottle capacity (equivalent to 5 lines)
• 0.6 million hl can capacity (equivalent to 1 line)
• Economies of scale
16

Building a smart supply chain with digital, improving line reliability and demand forecasting accuracy
17
Removal of inefficiencies at supplier
Reduced shifts or over-time reduction
More productive work-force
Reduced maintenance
costs
Less capital
Lower warehouse
costs
Fewer planning resources
Increased quality
Increased safety
Higherservice level
Less penalties
Less obsoletes
Lower cost internal
transport
Reduced warehouse costs
Increased transparency
Better planning of labour resources
Fewer losses on the line
Reduced spare-parts inventory
Positive effect
upstream
Better flexibility to
support growth
CONSUMER DEMAND SIGNAL
Optimisingability for growth & efficiency
BREWERY RELIABILITY
>75% >75%Improved call off of
raw and pack materials
Where possible line
consolidation
Reduced cost of raw
materials

Promising digital solution under development to alleviate expected planning bottlenecks
Improvement of demand forecastingTraditional → Machine Learning
FRANCE OFF-TRADE DIGITAL VS CURRENT PLANNING SYSTEM
3 MONTHSOUT
4 WEEKS OUT
1 WEEK OUT
SKU ship from warehouse location +9 ppt +9 ppt +15 ppt
18

We will face inflationary headwinds, which we will manage through our gross savings programmes
COMMODITIES / FOREX
• Hedges & spot purchases (barley, alu, sugar, etc.)
GROSS SAVINGS
• Value excellence (light-weighting glass)
• Procurement contracts (long-term commitments)
• Brewery/W&D efficiencies (CarlEx)
• Fixed cost reduction (overhead benchmarking)
NEGATIVES
• Inflation (glass, labour)
• Depreciation (capital investments)
• External events (rail road closure, CO2 shortage)
NET SAVINGS
• Result to the P&L
2019 2020 2021 2022
Gross versus net savings
Gross savings (index 100) Net savings
19

Significant share of Western Europe net savings delivered via structural improvements in production
Structural cost base transformation will deliver net savings of ~3% in production costs year-over-year via
• Carlsberg Excellence, driving production to world class levels
• Line manning
• Network optimisation
• Central overhead reduction
New (patented) technologies
• Hop dosing
• Fermentation
2018 2019 2020 2021 2022
Net savings from production
20
3%

We continue to follow our strategichealth & safety roadmap
HEALTH & SAFETY TOP OF MIND
• Leadership training, shop floor engagement
• Life Saving Rules
ZERO FATALITIES AND SERIOUS INCIDENTS
• High risk activities
• Machinery safety
• Contractor management
RISK EXPOSURE REDUCTION
• Comprehensive risk assessments
• Occupational health management
21

Quality focus is on food safety and hygiene programmes
22
Consumers demand the right quality, every time
Alcohol-free brews -higher sugar content liquids
Craft – new liquids, new risks
QUALITY PERFORMANCE MANAGEMENT• Zero quality incidents, defects, losses
DEPLOYMENT OF QUALITY STANDARDS
• Increased minimum hygiene requirements
• Investment in infrastructure (floors, basement, walls)
SEAMLESS INTERFACE WITH DESIGN QUALITY
• Clear product and processes standards
• Supplier capability

Our target of 30% beer-in-hand CO2 reduction will require an end-to-end strategy, with particular focus on brewing and packaging
23
2022 (15pp)
2030 (30pp)
Breweries
carbon-neutral -7pp -14pp
Leveraging
packaging suppliers
programs
-6pp -11pp
Malting energy,
logistics (e.g. e-
trucks)
-1pp -2pp
Refrigeration -1pp -3pp
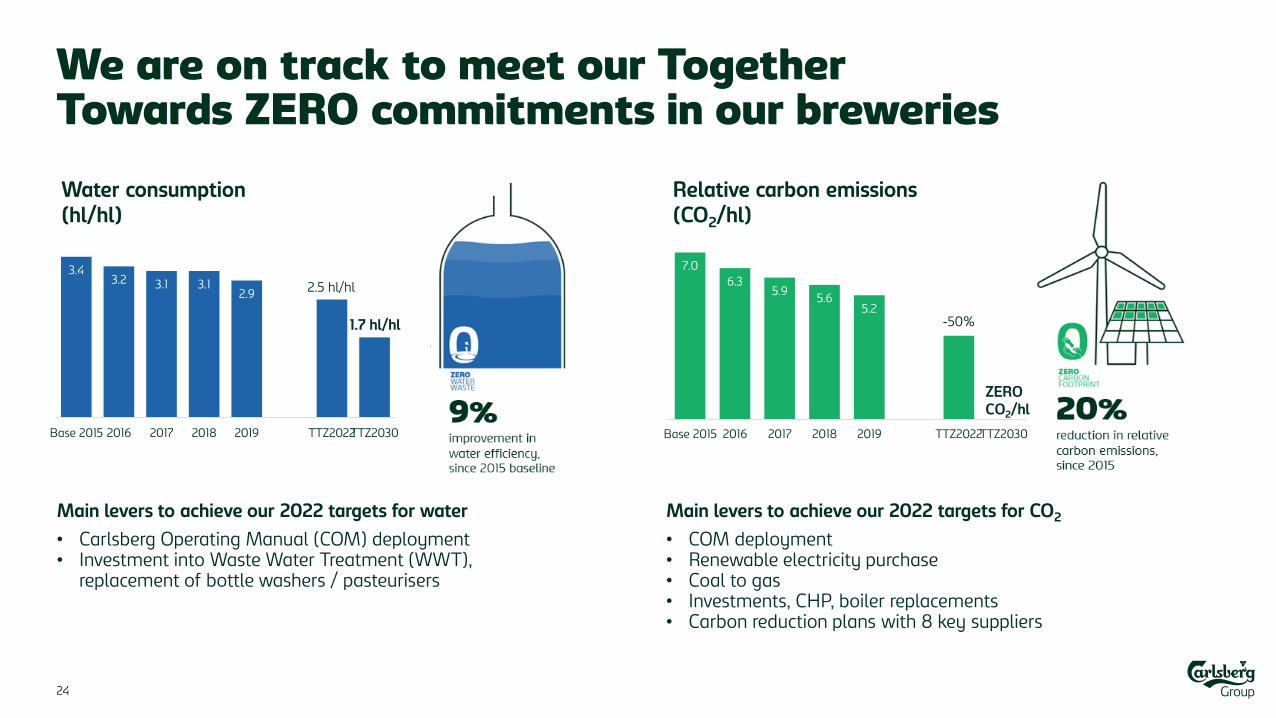
We are on track to meet our Together Towards ZERO commitments in our breweries
24
Main levers to achieve our 2022 targets for water
• Carlsberg Operating Manual (COM) deployment• Investment into Waste Water Treatment (WWT),
replacement of bottle washers / pasteurisers
Main levers to achieve our 2022 targets for CO2
• COM deployment • Renewable electricity purchase • Coal to gas • Investments, CHP, boiler replacements• Carbon reduction plans with 8 key suppliers
3.43.2 3.1 3.1
2.9
Base 2015 2016 2017 2018 2019 TTZ2022TTZ2030
Water consumption(hl/hl)
2.5 hl/hl
1.7 hl/hl
7.0
6.35.9
5.65.2
0.0
Base 2015 2016 2017 2018 2019 TTZ2022TTZ2030
Relative carbon emissions(CO2/hl)
-50%
ZEROCO2/hl
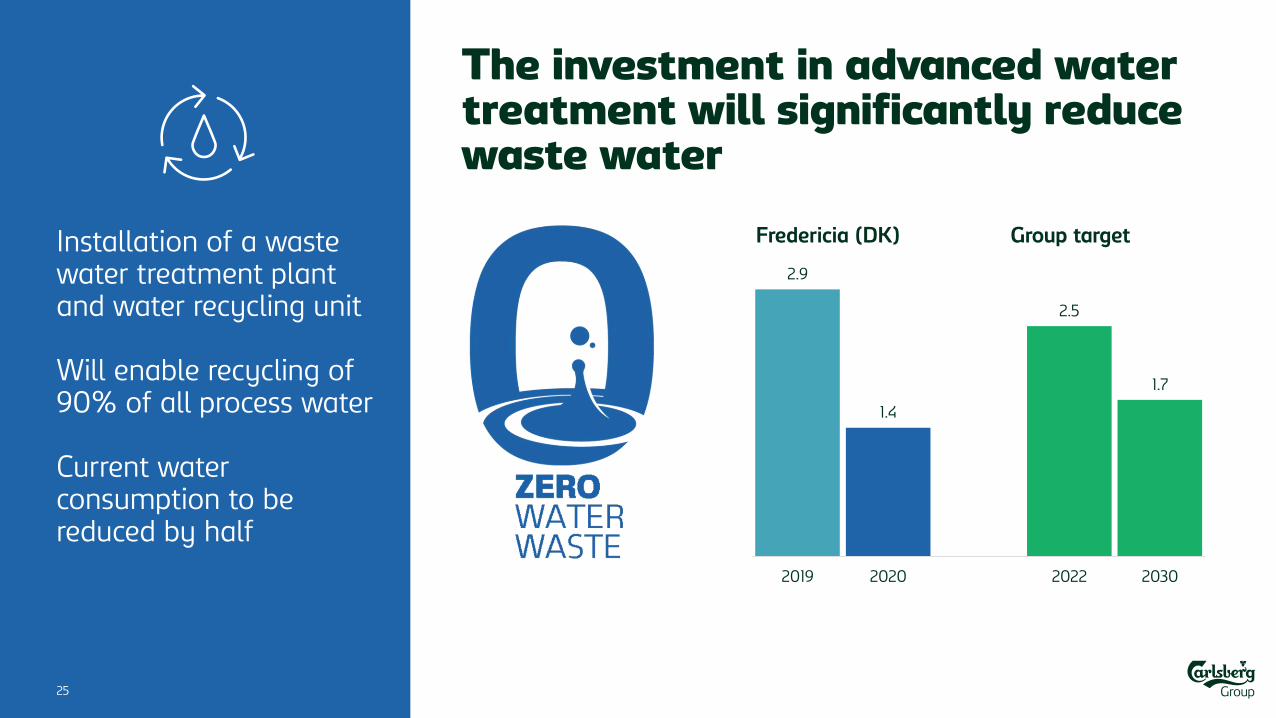
The investment in advanced water treatment will significantly reduce waste water
Installation of a waste water treatment plant and water recycling unit
Will enable recycling of 90% of all process water
Current water consumption to be reduced by half
2.9
1.4
2.5
1.7
2019 2020 2022 2030
25
Fredericia (DK) Group target

Our integrated supply chain, in summary
26
01Continue building on a solid foundation led by Fund the Journey and SAIL’22
04Drive margin improvement, despite higher input costs
02Commercial growth signalling three key challenges
• Lack of capacity on growth engines• Portfolio fragmentation increasing• Recipes becoming more intricate and
sensitive
05Deliver against our Together Towards ZERO commitments
03Our supply chain solutions to challenges
• Adapt production: flexible, late differentiation, micro-breweries, hub concept
• Enable DraughtMaster growth • Improve hygiene for new recipes• Digitalise consumer demand, complement
Carlsberg Excellence with digital

1
PREMIUMISING IN
João Abecasis, Managing Director Kronenbourg
FRANCE

2
Kronenbourg: Carlsberg’s French business
01 The French beer market
02 Transforming Kronenbourg
03 Delivering strong results
Today’s agenda

3
Per capita consumption, l.
29.0 29.9 29.8 28.9 29.5 30.4 30.9 31.4 32.2
42% 41% 41% 41% 40% 39% 38% 37% 35%
2% 2% 2% 2% 2% 2% 2% 2% 2%
7% 6% 7% 7% 7% 6% 6% 6% 6%
8% 8% 8% 7% 7% 7% 7% 7% 7%
7% 6% 6% 5% 5% 5% 5% 5%5%
37% 37% 38% 38% 39% 40% 42% 43% 46%
2010 2011 2012 2013 2014 2015 2016 2017 2018
Alcoholic drinks – Volume market share HMSM
Wine Cider Apéritif Spirits Sparkling wine Beer
Source: IRI panel – HMSM – volume market share; Global data – Total France - 2018
In recent years, the French beer market has consistently taken share from wine and CSDs

4
33.7%
29.3%
32.… 30.4%
12.2%
15.3%
7.2%7.9%
14.5%17.1%
2010 2011 2012 2013 2014 2015 2016 2017 2018
Volume market shares on- and off-trade(HMSM)
Kronenbourg (Carlsberg) HeinekenABI DoBs / discountOthers
10%
2010
21%
2015
29%
2018
Share of craft and specialty and alcohol-free brews tripled in our portfolio
x3x2
Source: GIRA ON Trade & IRI panel HMSM
We have managed to stabilise our market share in France, thanks to portfolio evolution

5
BEERCATEGORY
WIN FOR CUSTOMER
Fit to customer’s strategy and
ambitions
WIN FOR COMPANY
Fit to BK’s strategy & ambitions
Brand portfolioEfficient supply chain
WIN FOR CONSUMER / SHOPPER
6 GROWTH
DRIVERS OF THE BEER CATEGORY
Consumer motivations and moments (DS) &
current shopper behaviour
Key trends impactingconsumer, shopper &
channel behaviour
How to unleash the full potential of beer category?

6
KRONENBOURG BRAND MARKET SHARE
45% in 2018
43% in 2014
1. Revise brand fundamentals:
Positioning, architecture, look
and feel
2. Step up on-trade experience
3. Innovation pipeline in sync
with market trends
VOLUME
-4% market segment
-0.2% Kronenbourg
2014 - 2018
Source: IRI, Total OFF
SHARE OF OWN LAGER VOLUME
1664
Kronenbourg
2014 2018
34% 44%
59% 52%
WIN IN BEER by rejuvenating our local power brands to win in core beer with 1664
WIN IN BEER
Secure our fair share in the beer category

1664 : ENCOURAGE PEOPLE TO ENRICH THEIR SHARED TREAT MOMENTS
BY CULTIVATING THEIR FRENCH SPIRIT

8
Craft & speciality expansion positively impact brewers’ image that is now ahead of winery
Craft & speciality beers have strong opportunities to trade in from wine in key consumption occasions
CRAFT & SPECIALITY SEGMENT
+38%
2014 - 2018
GRIMBERGEN
+108%
2014 - 2018
KRONENBOURG CRAFT & SPECIALITY PORTFOLIO
+83%
2014 - 2018
Source: IRI, Total OFF
Share in key Demand Spaces
Craft &
speciality
beer Wine
Shared Treat &
Celebration6% 31%
Knowing the Best 5% 17%
Reward & Indulge 6% 15%
WIN WITH BEER by driving craft & specialitysegment growth and our share within the segment
WIN WITH BEER
Increase share of beer in adjacent categories

9
SOURCE OF GROWTH
TRADE ACROSS ABBEYS DEFEND VS CRAFT BEERS TRADE IN FROM WINE
BRAND XP
ACTIVATION OFF & ON & RENEWED LOOK & FEEL
COMMUNICATION
Reduce mass market perception and premiumise
Clarify, premiumise and push the range
TASTINGFOOD PAIRING
PALE ALE LAUNCH
DISCOVERY & CIRCULATION
Reignite the flame with a more expert approach
GLORIFY NEW GLASSWARE ON & OFF
BREW & SERVE
BRAND ADVOCACYMAKE GRIMBERGEN
A CONTEMPORARY ABBEY BEER1 2 3
Bringing Grimbergen to life in Reward and Indulge Demand Space
10
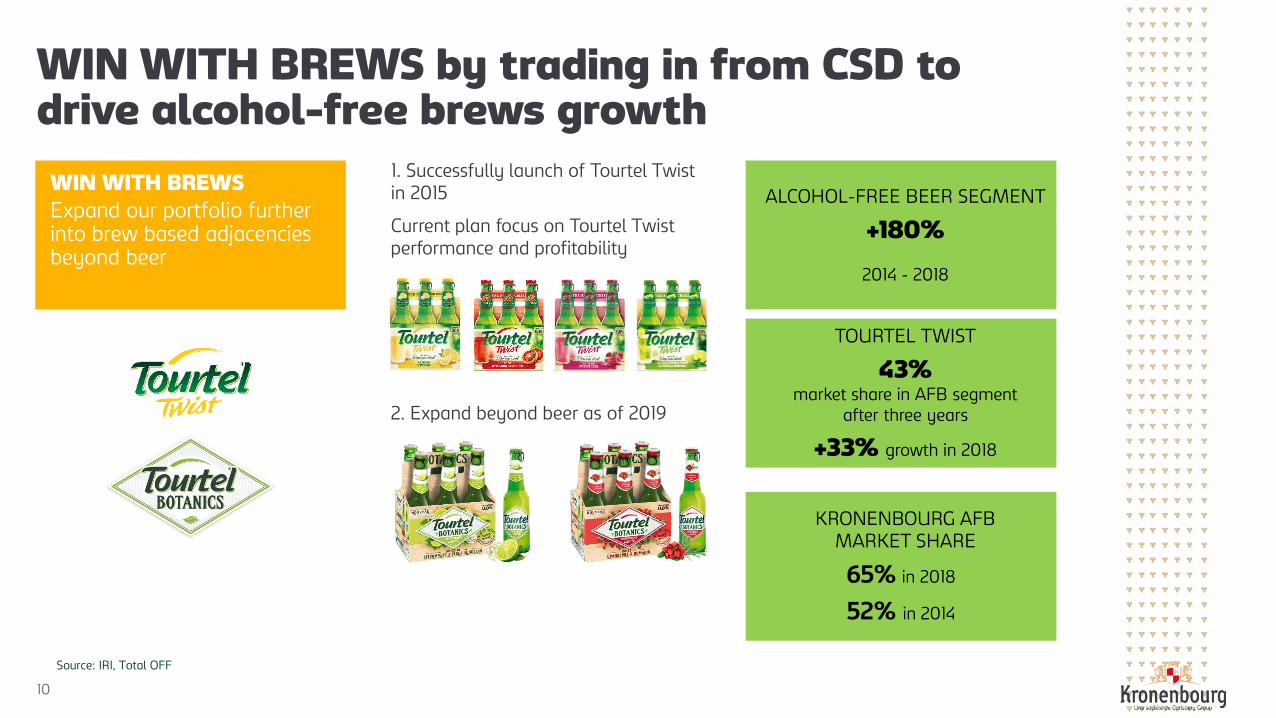
1. Successfully launch of Tourtel Twist in 2015
Current plan focus on Tourtel Twist performance and profitability
2. Expand beyond beer as of 2019
Source: IRI, Total OFF
ALCOHOL-FREE BEER SEGMENT
+180%
2014 - 2018
TOURTEL TWIST
43%market share in AFB segment
after three years
+33% growth in 2018
KRONENBOURG AFB MARKET SHARE
65% in 2018
52% in 2014
WIN WITH BREWS
Expand our portfolio further into brew based adjacencies beyond beer
WIN WITH BREWS by trading in from CSD to drive alcohol-free brews growth
11
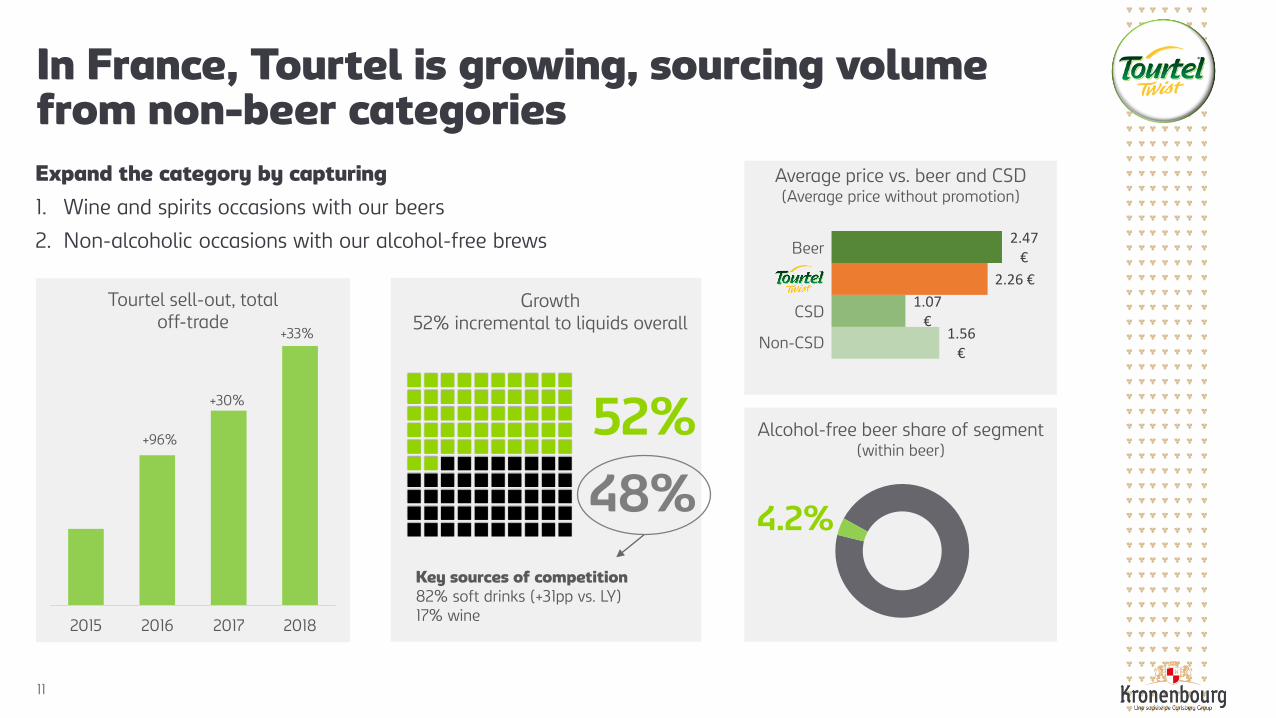
2015 2016 2017 2018
Tourtel sell-out, total off-trade
+33%
+30%
+96%
Growth52% incremental to liquids overall
52%
48%
Key sources of competition82% soft drinks (+31pp vs. LY)17% wine
1.56 €
1.07 €
2.26 €
2.47 €
Beer
CSD
Non-CSD
Average price vs. beer and CSD(Average price without promotion)
Alcohol-free beer share of segment(within beer)
4.2%
Expand the category by capturing
1. Wine and spirits occasions with our beers
2. Non-alcoholic occasions with our alcohol-free brews
In France, Tourtel is growing, sourcing volume from non-beer categories

12
BARLEY BREWED… … WITH PLANTS & FRUITS…
… 0.0% ALCOHOL… … AND CLEAN LABEL
20k hlEst. Year 1
Profitabilityindex
196 vs. BKAug. 2019
WIN WITH BREWS by launching Tourtel Botanics

13
We have achieved good Golden Triangle results in 2016-2018
2016 = Index 100 2018
Volume growth
+6%
2016 = Index 100 2018
Operating profit growth
+18%

14
In summary, Kronenbourg has successfully grown value by premiumising portfolio
WIN IN BEER
Leveraging core beer
WIN WITH BREWS
Innovating in alcohol-free brews
WIN WITH BEER
Accelerating craft & speciality
01Significant transformation of our
portfolio over the last decade
02Achieved by being a key contributor to
market innovation
03Transformation and innovation
supported by Demand Space and
growth story approach

DELIVERINGSHAREHOLDER
VALUE
Heine DalsgaardChief Financial Officer Carlsberg Group

Driving consistent value creation
1. Reviewing SAIL’22 performance
2. Continuing the Funding the Journey culture
3. Maintaining financial discipline
4. Ensuring optimal capital allocation
5. Delivering shareholder value
2

3
SAIL’22 – delivering shareholder value
STRENGTHEN THE CORE
POSITION FOR GROWTH
CREATE A WINNING CULTURE
DELIVER VALUE FOR SHAREHOLDERS
Leverage our strongholds
Excel in execution
Funding the Journey culture
Win in craft & speciality
Win in alcohol-free brews
Grow in Asia
Organic growth in operating profit
ROIC improvement
Optimal capital allocationTeam-based performance
Together Towards ZERO
Compass

The starting point required action…
6.0
8.0
9.0 9.0
1.5x
2.0x
2.5x
3.0x
0
4
8
12
2012 2013 2014 2015
Capital allocation
Dividend per share Net debt/EBITDA (rhs)
4
-5%
5%
1%
-7%
-10%
-6%
-2%
2%
6%
10%
14%
-8%
-6%
-4%
-2%
0%
2%
4%
6%
2012 2013 2014 2015
Operating profitorganic growth and margin (rhs)
5.9% 6.0% 5.8% 5.6%
10.4% 10.6% 10.7% 11.0%
2012 2013 2014 2015
Return on invested capital
ROIC ROIC excl. goodwill

… since 2016, we have consistently improved our performance…
10.0
16.0
18.0
0
5
10
15
20
2016 2017 2018
0.5x
1.0x
1.5x
2.0x
2.5x
Capital allocation
Dividend per share Net debt/EBITDA (rhs)
5
5.0%
8.4%
11.0%
17.7%
5%
8%
11%
14%
17%
0%
2%
4%
6%
8%
10%
12%
14%
16%
18%
20%
2016 2017 2018 H1 2019
Operating profitorganic growth and margin (rhs)
5.9%6.9%
8.1%8.7%
12.7%
15.7%
20.9%22.1%
2016 2017 2018 H1 2019
Return on invested capital
ROIC ROIC excl. goodwill

…enabled by a step-change in performance management and processes
6
STRATEGY AND
DIRECTIONSAIL’22 and Golden Triangle
MONTHLY
PERFORMANCE
PROCESSES
ALIGNED
INCENTIVES
Performance review of Group,
region and marketsMD letters
Tracking of FtJ elements
(head count, SKUs, costs etc)OCM follow-up by cost groups
On-going risk identification
and gap-closingMarketing tracking
STIs (Net revenue, operating profit, FCF)
LTIs (TSR, ROIC, EPS, net revenue)

Funding the Journey was launched with two purposes …
7
Funding the Journey
DKK ~3bnTotal benefits from Funding the Journey delivered by 2018
REINVEST IN THE BUSINESS in support of SAIL’22 growth priorities
IMPROVE OPERATING PROFIT
01
02

Funding the Journey
should not be seen
as a DIET.
It is a change of
LIFESTYLE
… and we will continue with Funding the Journey…
8
Funding the Journey culture
2017 2018 2019E
Marketing/revenue
2017 2018 2019E
SG&A/revenue”

… embedded across four themes
9
VALUE MANAGEMENT
SUPPLY CHAIN EFFICIENCY
COMMERCIAL SPEND EFFICIENCY
OPERATING COST EFFICIENCY
CONTINUE current focus and actions on pricing and mixStrengthen reporting and tracking
CONTINUE current focus and actionsStrengthen reporting and tracking
OPTIMISE brands’ marketing and point-of-sale spendFurther develop and improve reporting and tracking
RE-ENERGISE OCM processesStep-change benchmarking and analysisSprint approach to cost group reviews
Funding the Journey culture

Enhanced Operating Cost Management (OCM) will capture further benefits from enhanced processes…
OCM introduced in 2015
• Establishment of granular, reliable and transparent data sets
• Routinely monitoring
• Benchmarking
• Sharing best practices
Introducing enhancements
• 5 weeks sprints per cost group
• Deep dives on commercial spend cost groups
• Stronger cost group leadership
• Review per functional cost group
10
INCREASED EFFICIENCY Best
practices
KPIs / Bench-marking
Reduce cost base
Maximise marketing investments
Costtransparency

… and still further potential for process standardisation and digitalisation ...
11
END-TO-END PROCESS EXCELLENCEStandardise and improve
processes and IT tools
INTELLIGENT AUTOMATIONUsing technology to allow people to focus on value-adding activities
SHARED SERVICES 2.0Professional, scalable, agile,
performance driven Shared Services
DATA, REPORTING, ANALYTICSImproved insights and data transparency supporting improved business decisions

…by standardising E2E processes and optimising the use of shared service center…
12
SOURCE-TO-PAY
RECORD-TO-REPORT
ORDER-TO-CASH
HIRE-TO-RETIRE
CUSTOMERSSUPPLIERS
DIFFERENTIATED DIFFERENTIATEDUNSTANDARDISED
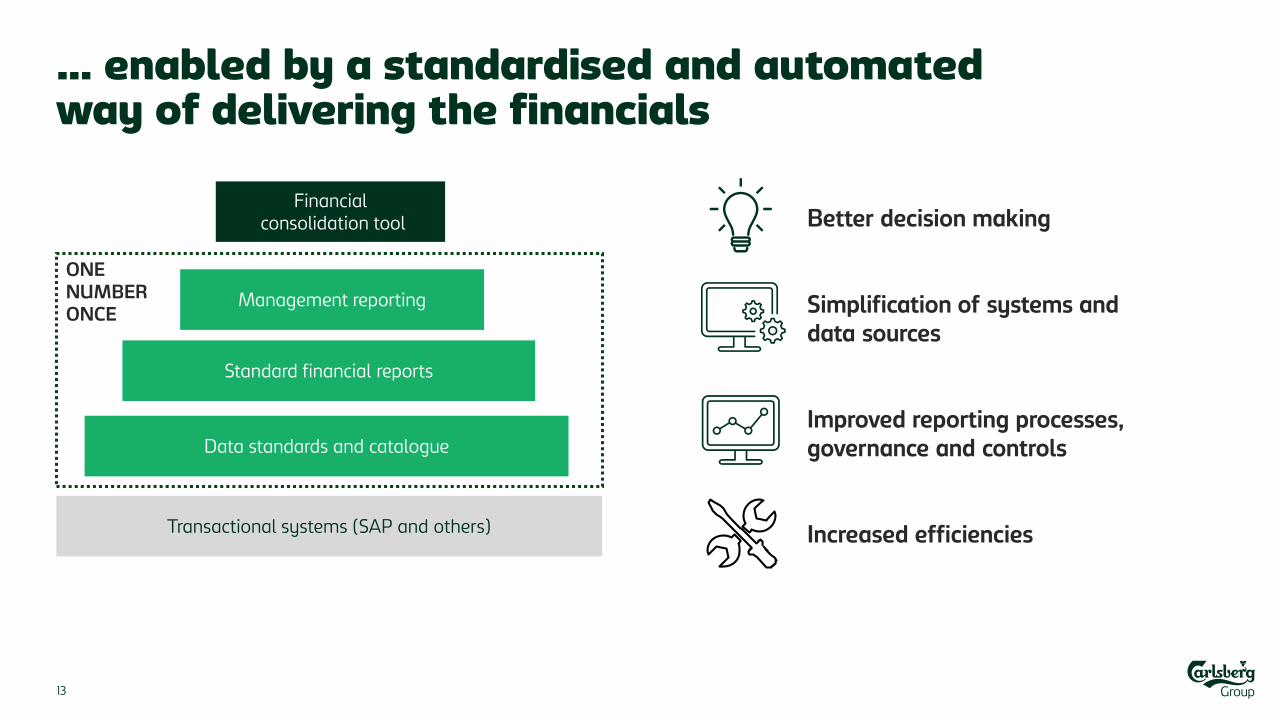
… enabled by a standardised and automated way of delivering the financials
13
ONENUMBERONCE
Financialconsolidation tool
Management reporting
Standard financial reports
Data standards and catalogue
Transactional systems (SAP and others)
Better decision making
Simplification of systems and data sources
Improved reporting processes, governance and controls
Increased efficiencies

2015 2016 2017 2018 2022E
Operating margin
Funding the Journey will continue to support growthinvestments and margin improvement
14
+200bp
INVESTING IN
Craft & speciality
Alcohol-free brews
Grow in Asia

33%
29%28%
Below 28%
2016 2017 2018 2019E 2020E 2021E 2022E
Effective tax rate
Further opportunities to optimiseour tax position
15
Strengthening tax compliance
Optimising effective tax rate

Continued strong trade working capital …
Trade working capital/net revenue improvement of +1070bp since 2013 driven by:
• Focus/KPIs
• Stronger processes
• Strict follow-up
• Detailed targets
16
ACCUMULATED CASH FLOW
DKK
5.6bnTWC improvement
2013-2018
-18%
-15%
-12%
-9%
-6%
-3%
2013 2014 2015 2016 2017 2018
Trade working capital/net revenue

… and strict capex discipline…
Capex approval process strengthened
• Business case with ambitious financial KPIs
Key areas of capex spending
• Flexibility
• DraughtMaster
• Sales equipment (coolers)
• Asian capacity expansion
• Efficiency improvements
• Environment
• Digital0%
2%
4%
6%
8%
10%
2013 2014 2015 2016 2017 2018 2019E
Capex/net revenue
17

… will support consistent ROIC improvement
ROIC improvement driven by …
• Operating profit growth
• Optimising tax position
• Strict TWC and cash flow discipline
• Disposal of redundant assets
…and a cultural change
• Increased focus through target setting
• Continued follow-up
• Focus on ROIC in incentive scheme
5.6% 5.9%6.9%
8.1%8.7%
12.9% 12.7%
15.7%
20.9%22.1%
2015 2016 2017 2018 H1 2019
Return on invested capital
ROIC ROIC excl. goodwill
18

Leverage target of below 2x…
Net debt reduction driven by
• Strong free operating cash flow due to• Earnings growth• TWC improvement• Strict capex spend• Lower finance costs
• Right-sizing
• Disposal of non-core assets
Future net debt
• Will be managed in accordance with capital allocation principles
19
1.0x
1.5x
2.0x
2.5x
3.0x
0
10
20
30
40
2014 2015 2016 2017 2018 H12019
NIBD (DKKbn) and NIBD/EBITDA
NIBD NIBD/EBITDA (rhs)
Leverage target below 2.0x

0%
10%
20%
30%
40%
50%
60%
2012 2013 2014 2015 2016 2017 2018
Pay-out ratio
6.0
8.09.0 9.0
10.0
16.0
18.0
2012 2013 2014 2015 2016 2017 2018
Dividend per share (DKK)
20
… and a target pay-out ratio of around 50%

DKK
~3bn Net acquisitions
2018-2019
We will maintain a strong balance sheet to have the opportunities for value-enhancing acquisitions…
21
Disposals in 2016/17
• Danish Malting Group
• Vung Tau, Vietnam
• Carlsberg Malawi
• Sejet
• Carlsberg Uzbekistan
• United Romanian Breweries
• MSSP, Russia
• Nordic Getränke, Germany
Acquisitions in 2018/19
• Olympic Brewery, Greece
• Cambrew, Cambodia
• Brewery Alivaria, Belarus
• Super Bock, Portugal
• Jing-A Brewing Co, China
• Carlsberg Ukraine

… and continue to distribute excess cash to shareholders
EXCESS CASH
distributed to shareholders via
EXTRAORDINARYDIVIDENDS
and/or
SHARE BUY-BACK
22
0.9 1.2 1.4 1.4 1.52.4 2.7
4.5
2012 2013 2014 2015 2016 2017 2018
TOTAL CASH RETURNS TO SHAREHOLDERS Dividends and share buy-back (DKKbn)
Dividends Share buy-back (announced)

23
01 Invest in our business to drive long-term value creation
Continued focus on ensuring optimal capital allocation
03 Dividend pay-out ratio of around 50%
04 Excess cash to be redistributed through buy-backs and/or extraordinary dividends
05 Deviating from the above only if value-enhancing acquisition opportunities arise
02 NIBD/EBITDA < 2.0x

Delivering consistent shareholder value
NET REVENUEGrow net revenue organically every year by • Expand in high-growth categories and markets • Leverage our strongholds
OPERATING PROFIT & MARGINDeliver organic operating profit growth ahead of top-line growth by • Embed Funding the Journey culture and value management • Grow in high-margin categories and markets
STRICT FINANCIAL DISCIPLINEEnsure strict discipline on • Costs, tax, working capital, capex and ROIC
OPTIMAL CAPITAL ALLOCATIONMaintain a financial leverage enabling growth in shareholder returns and/or value-enhancing acquisitions
24
2019

Disclaimer
FORWARD-LOOKING STATEMENTSThe presentations may contain forward-looking statements, including statements about the Group’s sales, revenues, earnings, spending, margins, cash flow, inventory, products, actions, plans, strategies, objectives and guidance with respect to the Group's future operating results. Forward-looking statements include, without limitation, any statement that may predict, forecast, indicate or imply future results, performance or achievements. Any such statements are subject to risks and uncertainties that could cause the Group's actual results to differ materially from the results discussed in such forward-looking statements. Prospective information is based on management’s then current expectations or forecasts. Such information is subject to the risk that such expectations or forecasts, or the assumptions underlying such expectations or forecasts, may change. The Group assumes no obligation to update any such forward-looking statements to reflect actual results, changes in assumptions or changes in other factors affecting such forward-looking statements.
Some important risk factors that could cause the Group's actual results to differ materially from those expressed in its forward-looking statements include, but are not limited to: economic and political uncertainty (including interest rates and exchange rates), financial and regulatory developments, demand for the Group's products, increasing industry consolidation, competition from other breweries, the availability and pricing of raw materials and packaging materials, cost of energy, production and distribution related issues, information technology failures, breach or unexpected termination of contracts, price reductions resulting from market driven price reductions, market acceptance of new products, changes in consumer preferences, launches of rival products, stipulation of fair value in the opening balance sheet of acquired entities, litigation, environmental issues and other unforeseen factors. New risk factors can arise, and it may not be possible for management to predict all such risk factors, nor to assess the impact of all such risk factors on the Group's business or the extent to which any individual risk factor, or combination of factors, may cause results to differ materially from those contained in any forward-looking statement. Accordingly, forward-looking statements should not be relied on as a prediction of actual results.