ensemble methods to reconcile disparate national long ... › docs › projects › files › fikr...
TRANSCRIPT
Risø-R-1435(EN) EUR 20990 EN
ENSEMBLE Methods to Reconcile Disparate National Long Range Dispersion Forecasts
Torben Mikkelsen, Stefano Galmarini, Roberto Bianconi and Simon French (Eds.) ENSEMBLE (WG4)-RP(03)02 EU Contract FIKR-CT-2000-00038. Duration: 36 months Start October 1. 2000 End September 30. 2003
Risø National Laboratory, Roskilde November 2003

Abstract ENSEMBLE is a web-based decision support system for real-time exchange and evaluation of national long-range dispersion forecasts of nuclear releases with cross-boundary consequences. The system is developed with the purpose to reconcile among disparate national forecasts for long-range dispersion.
ENSEMBLE addresses the problem of achieving a common coherent strategy across European na-tional emergency management when national long-range dispersion forecasts differ from one another during an accidental atmospheric release of radioactive material.
A series of new decision-making “ENSEMBLE” procedures and Web-based software evaluation and exchange tools have been created for real-time reconciliation and harmonisation of real-time disper-sion forecasts from meteorological and emergency centres across Europe during an accident.
The new ENSEMBLE software tools is available to participating national emergency and meteoro-logical forecasting centres, which may choose to integrate them directly into operational emergency information systems, or possibly use them as a basis for future system development.
ISBN 87-550-3274-5 ISBN 87-550-3275-3 (Internet) ISSN 0106-2840
Print: Pitney Bowes Management Services Denmark A/S, 2003

Risø-R-1435(EN) 3
Contents
1 Background 7
2 Objectives 8
3 ENSEMBLE’s four realisation steps 10
3.1 Exercises 10 3.2 The “Live” ENSEMBLE Web site 10 3.3 Decision-Maker’s Web Tool 10 3.4 Dissemination 10
4 The “Live” ENSEMBLE Web site 11
4.1 Description of menu functions 12 4.2 Documentation 13 4.3 People 14 4.4 Change your password 15 4.5 Release information 16 4.5.1 Contact system administration 16 4.6 Upload new results 17 4.7 Status of upload 18 4.8 Analysis 18 4.9 Personal folder 19 4.10 Analysis tools 20 4.10.1 Ensemble types 20 4.10.2 Graphical representations 21 4.10.3 Graphical and statistical comparisons 21 4.10.4 Ensemble representations 21
5 The projects Ten New Real-time ENSEMBLE Exercises 25
5.1 Exercise 01: April 18, 2001 - Lerwick, British Isles 25 5.1.1 Scope of the exercise 25 5.1.2 Release information 25 5.1.3 Real time exercise 26 5.1.4 Sample results from Exercise 01 26 5.2 Exercise 02: September 28, 2001 - Carcassonne, France 28 5.2.1 Scope of the exercise 28 5.2.2 Release Information 28 5.2.3 Real time exercise 29 5.2.4 Weather Map 29 5.2.5 Sample results from Exercise 02 30 5.3 Exercise 03: November 21, 2001 – London; U.K. 30 5.3.1 Scope of the exercise 30 5.3.2 Release Information 30 5.3.3 Real time exercise 31 5.3.4 Weather Map 31 5.3.5 Sample results from Exercise 03 32 5.4 Exercise 04 February 5, 2002 – Nantes, France 33 5.4.1 Scope of the exercise 33 5.4.2 Release Information 33 5.4.3 Real time exercise 34 5.4.4 Weather Map 34

4 Risø-R-1435(EN)
5.4.5 Sample results from Exercise 04 35 5.5 Exercise 05 April 16, 2002 – Stockholm, Sweden 36 5.5.1 Scope of the exercise 36 5.5.2 Release Information 36 5.5.3 Real time exercise 37 5.5.4 Weather Map 38 5.5.5 Sample results from Exercise 05 39 5.6 Exercise 06 June 25, 2002 - Dublin, Ireland 40 5.6.1 Scope of the exercise 40 5.6.2 Release Information 40 5.6.3 Real time exercise 41 5.6.4 Weather Map 41 5.6.5 Sample results from Exercise 06 41 5.7 Exercise 07 October 4, 2002 Glasgow, UK 43 5.7.1 Scope of the exercise 43 5.7.2 Release Information 43 5.7.3 Real time exercise 43 5.7.4 Weather Map 45 5.7.5 Sample results from Exercise 07 45 5.8 Exercise 08 December 3, 2002 Mochovce, SR 46 5.8.1 Scope of the exercise 46 5.8.2 Release Information 46 5.8.3 Real time exercise 46 5.8.4 Weather Map 47 5.8.5 Sample results from Exercise 08 47 5.9 Exercise 09 February 12, 2003 Bratislava, SR 47 5.9.1 Scope of the exercise 47 5.9.2 Release Information 47 5.9.3 Real time exercise 48 5.9.4 Weather Map 48 5.9.5 Sample results from Exercise 09 49 5.10 Exercise 10 and 11 June 11, 2003 - London, UK; Dirty bomb Cs137 and Pu241 50 5.10.1 Scope of the exercise 50 5.10.2 Release Information 50 5.10.3 Real time exercise 51 5.10.4 Weather Map 51 5.10.5 Sample results from Exercises 10 and 11 52 5.11 Special exercises 56 5.11.1 India Pakistan nuclear escalation 56 5.11.2 Second Gulf war 59 5.11.3 ETEX revisited 60
6 The Decision-Maker’s Web Tool 61
6.1 Introduction 61 6.2 An analysis of the ENSEMBLE exercises from the perspective of decision making 61 6.3 The role of meteorological offices in the emergency management process 64 6.4 Review of the literature on the cognitive understanding of spatial and temporal plots of dispersion 66 6.5 Design of the Decision Maker’s Web-Tools 67
7 References 71
8 New Publications resulting from the ENSEMBLE project 73

Risø-R-1435(EN) 5

6 Risø-R-1435(EN)
Participants
Ensemble's Contractors and Associated Contractors: Partner Partner Country Partner Full Name Co-ordinator (CO) w/ Associated Contractors (AC), and Contractors (CR) 1 CO RISØ DK Risø National Laboratory
2 AC DWD D German Weather Service 3 AC KNMI NL Royal Netherlands Meteorological Institute 4 AC RIVM NL National Inst. of Public Health and Environmental 5 AC RMIB B Royal Meteorological Institute Belgium 6 AC Meteo-F F Meteo-France 7 AC Met.Office U.K. The British Met. Office 8 AC FMI FIN Finnish Meteorological Institute 9 AC SMHI SE Swedish Meteorological and Hydrological Institute
10 AC DMI DK Danish Meteorological Institute 11 AC CIMG A Austrian Meteorological and Geophysical Office 12 AC EN-WA IT ENVIROWARE-SRL
13 AC*) IAE PL Polish Atomic Energy Institute 14 AC*) DNMI NO Norwegian Meteorological Office 15 AC*) NCSR GR Demokritos
16 CS JRC-EI IT JRC-Ispra, Environment Institute, European Commission 17 CR UoM UK University of Manchester
Risø-R-1435(EN) 7
1 Background
During the days of the Chernobyl nuclear accident, the European National Long-range dispersion forecasts would differ because of differences in national models, differences in weather prediction methods.Differences in national forecasts caused problems at the European level, as many National emergency management strategies did not cohere with those in neighboring countries.
ENSEMBLE was set out to addresses this harmonisation and coherence issues for emergency man-agement and decision-making in relation to long range atmospheric dispersion modelling.
The idea behind ENSEMBLE originated from the 1994 ETEX project where about 50 long-range dispersion forecast models were run at several Institutes around the world to simulate two real long-range tracer releases involving a large part of the European territory, Girardi et al. (1998); Mosca et al. (1998b)..
Statistical tool were already then developed for model evaluation against data from the ETEX tracer releases, Mosca et al. (1998a).
At the time of ETEX, the World Wide Web was not readily available to all the exercise participants, and the modellers plume predictions were submitted by fax and regular mail for subsequent processing at JRC-Ispra. However, the rapid development of the World Wide Web in the second half of the nine-ties, together with the experience gained during the ETEX exercises encouraged the development of a new generation Web-based model-intercomparison system.
In 1998 – 1999 the RTMOD (Real-Time MODel Evaluation) project realised the first Web-based long-range atmospheric dispersion data transfer system, Bellasio et al. (1999); Bellasio et al. (2000); Graziani et al. (2000). The statistical evaluation for the projects 4 model inter-comparison studies was still, however, done via post-processing.
ENSEMBLE is in many respects an extension and implementation of the model intercomparison and evaluation procedures earlier conceived during ETEX, ATMES and the RTMOD project. Today, ENSEMBLE features a true real-time Web-based and user-friendly decision support system for long-range atmospheric dispersion data exchange and model evaluation. It has build-in interactive evalua-tion packages for immediate displaying, intercomparison and decision-making support based on the ensemble of multiple submitted, national predictions of cross-boundary spreading from a nuclear re-lease in Europe.
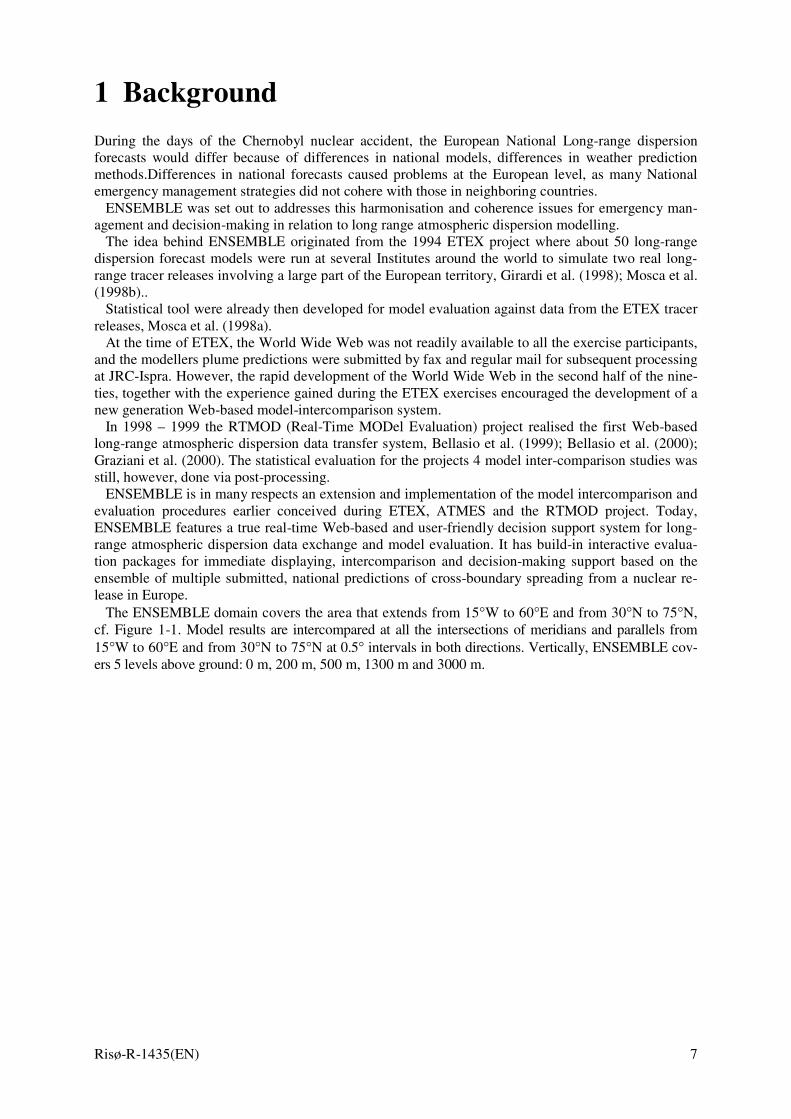
The ENSEMBLE domain covers the area that extends from 15°W to 60°E and from 30°N to 75°N, cf. Figure 1-1. Model results are intercompared at all the intersections of meridians and parallels from 15°W to 60°E and from 30°N to 75°N at 0.5° intervals in both directions. Vertically, ENSEMBLE cov-ers 5 levels above ground: 0 m, 200 m, 500 m, 1300 m and 3000 m.
8 Risø-R-1435(EN)
Figure 1-1. The ENSEMBLE Domain
ENSEMBLE inter-compares and analyses the predicted concentration and deposition at the grid nodes. During exercises, a hypothetical release is notified to the participating forecasters via the Web.
Participants then accessed the ENSEMBLE web page for detailed information on the actual release, and immediately run their national dispersion forecast out to + 60 or to +72 hours ahead, before up-loading their predictions to the ENSEMBLE server.
Forecasters can now inter-compare their national prediction against a “European ensemble” of pre-dictions formed by the many participants, and each of them can now make their own intercomparison analysis and national emergency strategy based on an “ensemble” of long-range model results.
As new numerical weather prediction data becomes available to the long-range forecasters (which typically happens every + 6 hour), new updated long-range dispersion forecasts can again be submit-ted, and the statistical analysis and intercomparison can be re-calculated to include the influence of the newest forecasts.
The ENSEMBLE provides a web-based tool for practical decision-making and communication be-tween dispersion modelers that address harmonization and coherence issues for emergency manage-ment and decision-making.
The participants count 17 European Meteorological Institutes and national responsible emergency organisations in addition to Canadian, Japanese and US American agencies.
The participating models are typically national nuclear emergency preparedness modules, but in-clude also the joint European atmospheric dispersion module developed within the European Real-time On-line Decision support System RODOS Mikkelsen et al. (1997); Mikkelsen et al. (1998).
2 Objectives
ENSEMBLE’s objective is to provide effective communication procedures and software tools for rec-onciliation and harmonization of disparate national long-range dispersion forecasts across Europe dur-ing a nuclear accident.

Risø-R-1435(EN) 9
ENSEMBLE aims to facilitate coherent and harmonised European “best estimate” forecasts, includ-ing qualification of forecast uncertainty. Common agreements, communication protocols and alert procedures are being established for on-line forecast exchange and uncertainty interpretation.
ENSEMBLE’s Web tools are intended to European Emergency centres for operational use. The simple web-based system can be integrated directly into operational emergency information systems, or can be used as a common basis for future harmonised system development. During its many exer-cises ENSEMBLE builds a database of experience to help long range forecasters, national meteoro-logical offices, decision makers and their advisors to gain an intuitive understanding of ‘normal’ agreement / disagreement between forecasts. It also provides its many potential users and decision-makers a hands-on feel for part of the uncertainty in the advice that they are receiving during a real accident.
ENSEMBLE also sensitises the decision-making community in Europe via the exercises and their analysis to the existence and scale of the forecast uncertainty. ENSEMBLE is able to assist Europe’s many different long-range forecasting and emergency centres during a real accident in the reconcilia-tion and harmonisation of the individual national emergency responses on a common European basis. ENSEMBLE is designed to offers reconciled long-range forecasts for decision-making in countries without own national forecasting facilities. And finally does ENSEMBLE provide forecasters with an overview of where their particular forecast fits against a backdrop of other forecasts.
ENSEMBLE is maintained via a consortium formed by the participating emergency centres and me-teorological forecasting centres, and is disseminated through its consortium to European forecast cen-tres and decision makers.
Table 2-1. ENSEMBLE's Design Features
1. The ENSEMBLE project tests its decision-making tools through real-time conduct of ~10 Euro-pean scale exercises.
2. The developed projects tools are platform independent, Internet / Web-based. 3. Methodologies are being developed for relating and evaluating individual Long-range forecasts
against a backdrop of many other Long-range forecasts. 4. The project builds a database of experience to help long-range forecasters, national meteorologi-
cal offices, decision makers and their advisors to gain an intuitive understanding of ‘normal’ agreement / disagreement between forecasts.
5. ENSEMBLE provides its potential users’ and decision-makers with a feeling for part of the un-certainty in the advice that they are receiving during a real accident.
6. ENSEMBLE sensitises the decision-making community in Europe via a series of issues to do with forecast uncertainty.

10 Risø-R-1435(EN)
3 ENSEMBLE’s four realisation steps
ENSEMBLE is realised through four distinct, but simultaneously conducted activities:
3.1 Exercises First of all, the ENSEMBLE concept is developed, evaluated and refined through the conduct of some ten real-time European scale nuclear accident forecast exercises, with simultaneous participation of up to 20 European and overseas emergency-response organisations. These exercises are conducted using the ENSEMBLE concepts new communication protocols and Internet based model intercomparison techniques for long-range dispersion forecasting.
3.2 The “Live” ENSEMBLE Web site Secondly, realisation of a "Live ENSEMBLE Web site” enables directly interaction and real-time data exchange with the many Users’. The server and its Web pages is created to hold, exchange and show the “live” Pan-European real-time “ENSEMBLE” forecasting system. Ensemble’s users have exer-cised the access and interaction with the “live” Web pages in real-time during the exercises.
3.3 Decision-Maker’s Web Tool A "Decision-Maker’s Web Tool" is designed to provide a decision-makers evaluation package. Web-tools are developed to provide on-line methods to interpretation of uncertainties and provide graphical methods to present them. Tools are generated to analyse forecast uncertainty and to facilitate interac-tion with and training of national decision-makers.
3.4 Dissemination The new Ensemble Web-tools are disseminated to forecasters and decision-makers within Europe’s existing radio-ecological exchange networks and decision support systems (DSSNET, IAEA, WMO/GTS, RODOS, ARGOS etc.).
For the sake of clarity, the website is presented first, and exercises are presented by means of the tools provided by the website itself.

Risø-R-1435(EN) 11
4 The “Live” ENSEMBLE Web site
A web site has been developed, with tools for real-time reconciliation and harmonisation of dispersion forecasts from meteorological and emergency centres across Europe during an accident.
A typical real-time session consists in a notification of the occurrence of a nuclear accident at a spe-cific location within an area ranging from 30 to 75 degrees North of Latitude and from –15 to 60 de-grees East of Longitude. The information on the release, including also its starting time, duration and rate, is sent to the participating institutes that in the shortest time provide their model prediction of the dispersion and deposition of the radionuclides over Europe, for a time horizon of about 60 hours from the release beginning. Variables estimated include: concentration at 5 different levels (0, 200, 500, 1300 and 300 m agl), integrated concentration, dry and wet deposition and precipitation.
Data are transmitted to the ENSEMBLE website through the http protocol, after a preliminary proc-essing made in order to assure data integrity and to compress the data for shorter transmission times or responses.
There is generally a time-window after the release notification (72 hours typically) when predicted values can be arbitrarily updated by users (typically when new meteorological input is available to simulate the release episode).
Data available at the website can then be used to produce analyses and ensembles that are intended to help decision makers in managing emergency situations.
Each user can submit results produced with different modelling tools and for each of them several sets, depending on meteorological updating.
At the web-page top one can find an “Exercise number” selector where the user can specify the ex-ercise number of interest. This is an important part of the site since using this selector the user can work on different exercises.
At any time, users have the opportunity to upload some model output to test the system files (using number 00 as exercise number, exercise 00 is constantly open). Datasets must be provided in coded format, obtained using the Enform software (written in Fortran) that is available in the “Download” section. Datasets relating to exercises different form 00 can only be uploaded during the exercise time window.
In order to upload the files, users access the “Upload new results” menu entry. Once the file is sub-mitted and the upload successfully started (a message on the page is displayed when this happens), users can check the result of the decoding from the “Status of upload” menu entry.
A green ball beside the file name means that the processing was successful, a yellow ball means that the file is being processed and a red ball indicates an error (in such case users will also find a link to the error diagnosis).
Users can submit as many files as they want, as well as delete or replace old submissions (logged submission time will change).
In case users should experience problems, or for any comment, the form “Contact system admini-stration” can be used to directly send a message to the system administrators.
The access to ENSEMBLE is restricted to authenticated users, due to the confidential information collected and made available through the website. The URL address of ENSEMBLE is http://ensemble.ei.jrc.it. By clicking the ‘Login’ link, the user is prompted for username and password.
Among ENSEMBLE users, some have “administrator” privileges, so that they have readily available an interface to create new users and assigning them a dummy password that the user can change after accessing the system for the first time.
Figure 4-1 shows the home page of ENSEMBLE, after requesting the access through the “Login” link.

12 Risø-R-1435(EN)
Figure 4-1.– Accessing ENSEMBLE.
Once the user is successfully authenticated, the restricted-access part of the website offers some func-tions, described in the following chapter.
4.1 Description of menu functions ENSEMBLE was designed to make, wherever possible, its use simple, straightforward, and intuitive. On the top of the web pages (generated dynamically, see the specific Appendix for technical details), it was decided to have always the same information and functions available. This includes (Figure 4-2):
• an “Exercise selector” to switch from one exercise to another, • the status of the exercise (“closed” or “open”), system date, username and its IP address origi-
nating the connection. • three Menubars with active links at the top of the page.
Figure 4-2 – Top of ENSEMBLE pages, with “Exercise selector” and menubars.

Risø-R-1435(EN) 13
“Exercise number” is a two-digit number, starting from “00”. An exercise is in general “closed”, apart during the time-window of the exercise performance. Only when an exercise is decleared “open” the upload of results is allowed. An exception being exercise “00” that is always “open” for upload. Links available in the Menubars are: Home, containing updated information on ongoing activities within the project Exit, linking back to the public home page of ENSEMBLE Calendar, listing ENSEMBLE events and meetings People, showing a list of participants to the ENSEMBLE project Models, giving a short description of participating models Change your password, providing a form to modify the login password Contact system administration, providing a form to send a message to ENSEMBLE “administra-tors” Documentation, providing links to downloadable documentation and software Publications, providing links to downloadable publications related to ENSEMBLE Development notes, providing a description of new implementations and error fixing during system development Release information, showing information on release characteristics Meteorological conditions, showing information on meteorological conditions through weather charts Upload new results, providing an interface to upload model results during exercises Status of upload, showing information on datasets submitted and upload status (successful, error, un-der processing) for the data file Dataset changes, listing the models for which a dataset originally submitted was later removed and/or substituted with a new one Analysis, linking to all the available analyses that can be performed on the available datasets Personal folder, storing the processing of interest to the user, for later consultation and data retrieval In the following some detail is given for specific menu items.
4.2 Documentation This page (Figure 4-3) includes the links to available documentation resources. Among other material, here are the Enform software for preprocessing the datasets before, the available Newsletters, the technical notes, the presentations at the meetings, the minutes of the meetings.

14 Risø-R-1435(EN)
Figure 4-3 – “Documentation” page.
4.3 People The project participants (Figure 4-4) are listed with their username, their model(s) code - if they are among data providers to ENSEMBLE - and their contact address.
Figure 4-4 – “People” page.

Risø-R-1435(EN) 15
4.4 Change your password From this page (Figure 4-5) users can change their password. This is mandatory at first access. Some tools to create/delete/edit users (Figure 4-6) are available to users that are authorised to act as admin-istrators.
Figure 4-5 – “Change your password” page for users.
Figure 4-6 – “Change your password” page for superusers.

16 Risø-R-1435(EN)
4.5 Release information From this page (Figure 4-7) users can access the release description for the selected exercises. These are:
• Geographical coordinates (latitude positive North and Longitude positive East, in dd:mm) of the
source point • Date and time UTC of release start • Release rate, in Bq/h • Duration of the release, in hours • Emission height, in meters • Nature of release • Isotope released • Date and time horizon UTC of the forecast In particular, the date and time horizon indicates the last requested prediction in the datasets. See Ap-pendix A for more details.
Figure 4-7 – “Release information” page.
4.5.1 Contact system administration
This page (Figure 4-8) provides an interface to the mail system and can be used to submit comments to the administration of the website.

Risø-R-1435(EN) 17
Figure 4-8 – “Contact system administration” page.
4.6 Upload new results This page (Figure 4-9) provides an interface to upload the compressed files, either in gzip or zip for-mat, that contain the coded model data. The user can browse the local folders of its computer and se-lect the file to upload. Once the upload process has started, the user can access the “Status of upload” page to visualise the status of the decoding process and database update.
Figure 4-9 – “Upload new results” page.

18 Risø-R-1435(EN)
4.7 Status of upload This page (Figure 4-10) lists the available datasets for the exercise currently selected. A green ball be-side the file name means that the processing was successful, a yellow ball means that the file is still under processing and a red ball indicates an error (in such case users also find a link to the error diag-nosed).
Each record in the table also shows:
• the file name • the date and time UTC of the meteorological input, intended as the date of the last analysed mete-
orological fields that were used to produce the meteorological input covering the simulation period • the date and time UTC of the upload • the number of datasets available vs the total of requested datasets covering the simulation period
Figure 4-10 – “Status of upload” page.
4.8 Analysis This page (Figure 4-11) is the access to the analyses available in ENSEMBLE. These tools apply to: space analysis: the values at a fixed time are considered all over the domain. This analysis is useful to evince space shifting among datasets. time analysis: the values at a fixed location are considered for the whole duration of the 'episode'. This analysis can give insight on discrepancies among of time series that may arise due to time shifting. global analysis: all the values at any time and location are considered. This analysis outlines the over-all distribution of the values regardless of space and time, as well as the overall tendency to underes-timate or overestimate one dataset compared to another, with a quantification of the absolute devia-tion.

Risø-R-1435(EN) 19
The notation adopted to identify datasets and upload times is based on positive and negative hours with respect to release time. Therefore +60h0m corresponds to a meteorological input that includes the analysis made 60 h after release time, -6h0m corresponds to a meteorological input that includes the analysis made 6 hours before the release time. Each model is identified by the country and a number since more than one model may be from the same country. The age of the meteorology and upload re shown in brackets (e.g. DK1[12h0m/+1h0m]).
A detailed description on these tools is given in a separate chapter.
Figure 4-11 – “Analysis” page.
4.9 Personal folder A personal page is provided to each user (Figure 4-12) where results of the analysis can be stored, both as images and as original data that were extracted from the ENSEMBLE database to produce the plot. These data are conveniently compressed and can easily be transferred to the user’s computer by clicking on a link.

20 Risø-R-1435(EN)
Figure 4-12 – “Personal folder” page.
4.10 Analysis tools ENSEMBLE includes tools for the graphical representation of the results. This feature allows the graphical and statistical comparison of 2 datasets (each obtained as single-model predictions or en-semble of predictions by two or more models), and the graphical statistical comparison of ensembles of model results(it is defined that two model results grouped in whatever fashion, average, maximum, etc is an ensemble).
The following classes of analyses can be defined: • space analysis, [S], where the values at a fixed time are considered all over the domain. This
analysis is useful to evince space shifting among datasets. • time analysis, [T], where the values at a fixed location are considered for the whole duration of
the 'episode' • global analysis, [G], where all the values at any time and location are considered. For this analy-
sis the distribution of the values is important, as well as the overall tendency to underestimate or overestimate of one dataset compared to another, with a quantification of the absolute deviation.
In the following, by stating “model” it is intended a single model or the ensemble obtained from sev-eral models, according one of the “ensemble types” described in the following paragraph.
4.10.1 Ensemble types
The following ensemble types are currently available in ENSMBLE.
Maximum value: for each point in space and time, the maximum value among selected models is taken Average value: for each point in space and time, the value among valid values of selected models is taken

Risø-R-1435(EN) 21
4.10.2 Graphical representations
These are representations where the behaviour of a single model is shown:
• grid plot [S] and representations where a single model or two models are shown: • time series [T] • vertical profiles [S] • time series of vertical profiles [T]
4.10.3 Graphical and statistical comparisons
The following classes of statistical comparison analyses are currently available in ENSEMBLE: These are representations where 2 models (single model or ensemble) are compared, both graphi-
cally and statistically. They are: • space overlap [S] • scatter diagram [S,G] The following statistical indexes, where applicable, are also shown together with the appropriate graphical representation: • Factor of 2 [S,G] • Factor of 5 [S,G] • Factor of excess [S,G] • Figure of merit in space [S]
4.10.4 Ensemble representations
These are representations where the behaviour of an ensemble of models is shown. They are:
• confidence in threshold level [S] • confidence in percentile threshold [S]
Examples of these plots are given in the chapter presenting the results of the exercises carried out. A complete description can be found in Bianconi (2003). Ensemble concepts are also presented and dis-cussed in Bianconi et al. (2003).
Here, in order to show the sequence of generation of one of the representations, the grid plot analysis in presented in detail.
The grid plot is available for single models and for ensemble of models. The ensemble is obtained according one of the methods already described. The generation of the plot for the variable of interest takes 3 steps:
1. Selection (Figure 4-13) of the time interval for the representation of the grid plot and selection of
the vertical level for the field to be represented (option available for 3-hour concentration field). 2. Selection of models to be plot (Figure 4-14). All model results available are listed with a check
box beside. The model results are ordered according to the age of the meteorology used (first col-umn). Below the models list are the check boxes for the type of ensemble to apply (Figure 4-15). If only one model is selected then the "none" check box must be selected here. The submission produces the plot of the single model at that time. If more than one model is selected, another check-box must be selected specifying the ensemble type.
3. In the following page generated after pressing the “submit” button, the grid plot is displayed (Figure 4-16). The user can change at will the colour table and the levels (number of levels and

22 Risø-R-1435(EN)
corresponding values) and zoom into the picture. The plot can be commented and saved in a per-sonal folder accessible through the main menu bar. Defaults can be updated or restored (Figure 4-17).
Figure 4-13. Grid plot: selection of time interval and vertical level (only for concentration).
Figure 4-14. Grid plot: selection of model(s) to plot. Top of page.

Risø-R-1435(EN) 23
Figure 4-15. Grid plot: selection of model(s) to plot. Bottom of page.
Figure 4-16. Grid plot: graphical representation on European map.

24 Risø-R-1435(EN)
Figure 4-17. Grid plot: selectors of options available on bottom of the page, to redraw the graph in different fashion.

Risø-R-1435(EN) 25
5 The projects Ten New Real-time ENSEMBLE Exercises
ENSEMBLE is intended to be a decision support system for real emergency. Towards this scope, dur-ing the execution of the project, 11 fictitious releases of radio nuclides are simulated with alert proce-dures and real-time response by the projects many participants.
A typical real-time session starts by a notification of the occurrence of a nuclear accident at a spe-cific location within an area ranging from 30 to 75 degrees North of Latitude and from –15 to 60 de-grees East of Longitude.
The information on the release, including also its starting time, duration and rate, is sent to institutes that in the shortest possible time upload their model prediction of the dispersion and deposition of the radio nuclides over Europe, for a time horizon of about +60 hours from the beginning of the release.
Variables estimates include (at the 5 heights: 0, 200, 500, 1300 and 300 m above ground level): 1. Instantaneous air concentration 2. Integrated air concentration, 3. Dry and wet deposition 4. Precipitation. Data are transmitted to the ENSEMBLE website through the http protocol, after a preliminary process-ing made in order to assure data integrity and to compress the data for shortest possible transmission time.
In a 72-hour time-window after the release notification dispersion predictions are updated by users (which typically happens when new meteorological weather forecasts become available to simulate the release episode).
Data available at the website can then be used to produce analyses and ensembles that are intended to help decision makers in managing emergency situations.
In the following some examples are given of ENSEMBLE’s graphical - statistical analysis and inter-comparison features as it is available to the users and decision maker directly in real-time from the Ensemble “Live” web pages at http://ensemble.ei.jrc.it/.
Each of the experiments performed so far are introduced, presenting the relevant parameters describ-ing the release characteristics.
5.1 Exercise 01: April 18, 2001 - Lerwick, British Isles
5.1.1 Scope of the exercise
The exercise was intended as a test of the model results uploading procedures to the web site. An ex-ercise 00 was initially set up for the testing uploading procedures. Each participant was requested to upload a file regardless of the case simulated. Exercise 01 is the first in which all participants submit-ted a file with a common simulation case.
5.1.2 Release information
On 18/04/01 the first official ENSEMBLE exercise took place. On the 17/04/01 the pre-alert message that foresaw the occurrence of a release in the next 30 hours was broadcasted to the participants by email and fax. At 10:00 UTC of the following day an alert message was broadcasted to the ENSEMBLE participants by email and fax and web site with the following information:

26 Risø-R-1435(EN)
EXPERIMENT Number: 01 Geographical Coordinates of the Release Point LERWICK, Shetland-Isles: Latitude: 60 deg N, 09 min; Longitude: 1 deg W, 10 min. Time and date of Release: 12:00 UTC, Date : 18. April, 2001. Release rate: 10**15 Bq/h Duration of Release: 06 hours. Height of the Emission: 00 meters above ground. Nature of Release: Leakage. Isotope released: Cs 137. Time Horizon of Forecast: 21. April 2001, 00:00 UTC.
5.1.3 Real time exercise
Within 1 hour from the notification 9 participants out of 16 acknowledged receipt, another 4 acknowl-edged within the second hour and 2 more in the next hour. 2 participants in the first hour delivered the requested map, other 2 in the second hour and 5 in the third hour after notification. 35 files from vari-ous sources are available on the site. Few institutes asked for extra model codes to upload the results of different models or of the same model used with different set up’s (e.g. resolution). The email noti-fication worked out efficiently and resulted the best communication mean during the exercise.
The notification by fax also worked out efficiently for all participants although slowly than email (45’ to deliver all faxes).
5.1.4 Sample results from Exercise 01
Figure 5-1 shows the Agreement in Percentile Level (APL) for time integrated concentration 60 h after release. The plot gives the time-integrated concentration produced by 90% of the models listed on the right side of the ENSEMBLE plot.

Risø-R-1435(EN) 27
Figure 5-1. APL for exercise 01
Figure 5-2 gives the Agreement in Threshold Level (ATL) for wet deposition, 60h after the release and the models listed on the right hand side of the plot. ATL allows to show the areas of agreement of models in predicting that the threshold will be exceeded. A value of 1 Bq/m2 has been selected for this plot. The agreement is shown in percentage: 100% total agreement, all models predict threshold ex-ceedence in that specific region.

28 Risø-R-1435(EN)
Figure 5-2. ATL for wet deposition 60h after release 01
5.2 Exercise 02: September 28, 2001 - Carcassonne, France
5.2.1 Scope of the exercise
Elevated release.
5.2.2 Release Information
On 28/09/01 the second official ENSEMBLE exercise took place. In order to allow the upload of the simulation based on completely analysed meteorological data the exercise was closed on 02/10/01.
Given the development and operationality of the graphical tools in the web site, Exercise 02 can be considered the first complete exercise of the ENSEMBLE series. In this occasion users where able to upload and display all model results following both single and ensemble representations. On the 27/09/01 the pre-alert message was broadcasted to the participants by email and fax that foresaw the occurrence of a release in the next 30 hours. At 08:20 UTC of the following day an alert message was broadcasted to the ENSEMBLE participants by email and fax and web site with the following infor-mation:

Risø-R-1435(EN) 29
EXPERIMENT Number: 02 Geographical Coordinates of the Release Point: Carcassonne, Southern France. Latitude: 43 deg 13 min N, Longitude: 2 deg 20 min E. Time and date of Release: 12.00 UTC, Date: 28, September, 2001 Release rate: 10**15 Bq/h Duration of Release: 06 hours Height of the Emission: 300 meters above ground Nature of Release: Leakage Isotope released: Cs 137 Time Horizon of Forecast: 01.October 2001, 00:00UTC
5.2.3 Real time exercise
The reaction to the alert was quite fast also this time with 5 models uploading the results within 30 minutes from notification. The email and fax notifications worked out efficiently and resulted the best communication mean during the exercise. The data uploading procedure worked out smoothly for all participants and the exercise was therefore successful. At present 30 sets of models results are avail-able to the participants for consultations and analysis.
5.2.4 Weather Map
The weather map in Figure 5-3 shows the weather condition at release start (courtesy of DWD).
Figure 5-3. Weather situation at release time

30 Risø-R-1435(EN)
5.2.5 Sample results from Exercise 02
Figure 5-4, gives an example of scatter diagram produced with the ENSEMBLE system. The diagram is used here to highlight the variations of a model results (UK1) as a function of the weather data used to calculate the dispersion. The scatter diagram compares the TIC produced globally and obtained with totally forecasted weather data (-12h) with that obtained with analysed meteorology (+60h).
Figure 5-4. Global scatter diagram
5.3 Exercise 03: November 21, 2001 – London; U.K.
5.3.1 Scope of the exercise
Standard exercise featuring surface release.
5.3.2 Release Information
On 21/11/01 the third official ENSEMBLE exercise took place. On the 20/11/01 the pre-alert message was broadcasted to the participants by email and fax that foresaw the occurrence of a release in the next 30 hours. At 08:23 UTC of the following day an alert message was broadcasted to the ESEMBLE participants by email and fax and web site with the following information:

Risø-R-1435(EN) 31
Exercise Number: 03 Geographical Coordinates of the Release Point: LONDON, UK Latitude: 51 deg N, 33 min; Longitude: 0 deg W, 0 min. Time and date of Release : 12:00 UTC, Date : 21. November 2001 Release rate: 10**15 Bq/h Duration of Release: 06 hours Height of the Emission: 00 meters above ground. Nature of Release: Leakage. Isotope released: Cs 137. Time Horizon of Forecast: 24. November 2001, 00:00 UTC.
5.3.3 Real time exercise
The reaction to the alert was faster than ever since the first forecasted concentration maps from two separate groups were received 3 minutes after the notification. Within 1 hour from notification 6 model results were upload and available for consultation. Fax notification has produced no problems though fast response make it at present an obsolete medium of communication since an automated fax procedure and ordinary telephone line allows the delivery of the notification to all participants in 1 hour. In any case it remains a reliable technique under operational conditions.
5.3.4 Weather Map
The weather map in Figure 5-5 shows the weather condition at release start.
Figure 5-5. Weather situation at release time
32 Risø-R-1435(EN)
5.3.5 Sample results from Exercise 03
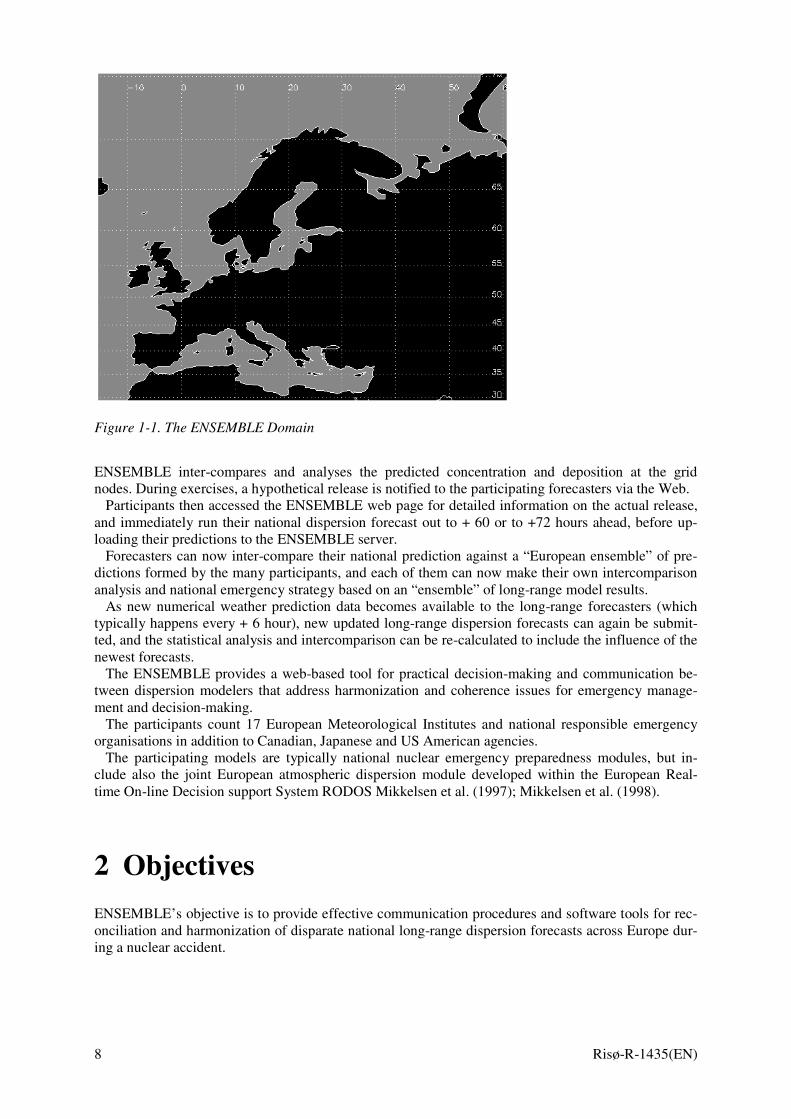
Figure 5-6 shows one of the new parameters introduced in the ENSEMBLE analysis which is the Agreement in percentile threshold. For a pre-defined percentile value (90th in the figure) the plot gives the corresponding variable field (in the figure time integrated concentration). The plot thus presents the field produced by 90% of the selected models and implies that only 10% of them have produced values larger than the ones given in the colour table.
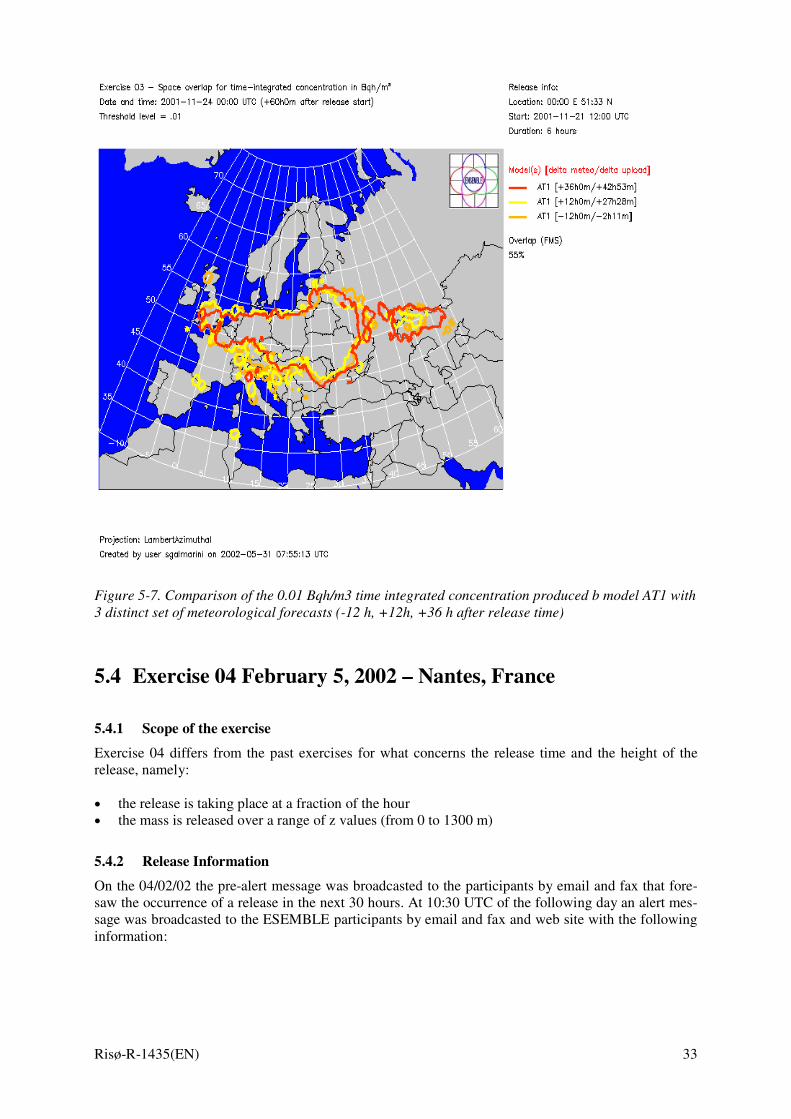
Figure 5-6. APL for time integrated concentration 57 h after release 03 Figure 5-7 gives an example of another application of the ENSEMBLE system. During the exercise model AT1 has submitted three results corresponding to three simulation using totally forecasted (or-ange line) and partially forecasted (red and yellow lines) meteorology. The figure gives, for a fixed threshold the variability of the model results with respect to the meteorology update.
Risø-R-1435(EN) 33
Figure 5-7. Comparison of the 0.01 Bqh/m3 time integrated concentration produced b model AT1 with 3 distinct set of meteorological forecasts (-12 h, +12h, +36 h after release time)
5.4 Exercise 04 February 5, 2002 – Nantes, France
5.4.1 Scope of the exercise
Exercise 04 differs from the past exercises for what concerns the release time and the height of the release, namely:
• the release is taking place at a fraction of the hour • the mass is released over a range of z values (from 0 to 1300 m)
5.4.2 Release Information
On the 04/02/02 the pre-alert message was broadcasted to the participants by email and fax that fore-saw the occurrence of a release in the next 30 hours. At 10:30 UTC of the following day an alert mes-sage was broadcasted to the ESEMBLE participants by email and fax and web site with the following information:

34 Risø-R-1435(EN)
Exercise Number: 04 Geographical Coordinates of the Release Point: NANTES, F Latitude: 47 deg 13 min N; Longitude: 01 deg 33 min W. Time and date of Release : 11:45 UTC, Date : 05. February 2002 Release rate: 0.9E15 homogeneously distributed over z [0-1000] m 0.1E15 homogeneously distributed over z (1000-1300] m Duration of Release: 06 hours Height of the Emission: [0,1300]. Nature of Release: Fire. Isotope released: Cs 137. Time Horizon of Forecast: 7 February 2002, 21:00 UTC.
5.4.3 Real time exercise
These new feature represented a problem for almost all participants. The proposed scenario was in fact interpreted by most of the participants has presented on the web site under “Dataset Changes”. Not all models are able to start the release at a fraction of the hour, some anticipated the release to 11:00 UTC in order to have the first output at 12:00, others delayed it by 15 min thus presenting no release at the first requested output time (12:00). The impact of these interpretations can be investigated by analyz-ing the model results. The distribution of the mass over the z range was also interpreted by most of the participants who adapted it to their model structure. The impact of such interpretations is expected to be larger than the other one.
Despite the difficulty posed by the case study the response time was good with 12 files uploaded in the first 7 h of the exercise.
Figure 5-1 shows the time distribution of the file uploads up to 12/02/2002 (excluding the week-end days). The first upload took place 0.5 h after notification. Uploading procedure proceeded smoothly through out the exercise. In one case files were removed by the user and substituted.
5.4.4 Weather Map
The weather map in Figure 5-8 shows the weather condition at release start.
Figure 5-8. Weather map at release time

Risø-R-1435(EN) 35
5.4.5 Sample results from Exercise 04
Figure 5-9 shows a special application of the ATL. The figure gives the agreement in predicting the dry deposition field of 137Cs by 9 models (in percentage). The shaded area represents the contribution of DE1 to the overall distribution of models. A similar analysis is given in Figure 5-10 for wet deposi-tion.
Figure 5-9. ATL plus contribution of a single model

36 Risø-R-1435(EN)
Figure 5-10. Same as Figure 5-9 for wet deposition
5.5 Exercise 05 April 16, 2002 – Stockholm, Sweden
5.5.1 Scope of the exercise
Exercise 05 differs from the past exercises for what concerns the release duration. It lasted 10 hours and a time evolution of the release rate was prescribed.
5.5.2 Release Information
On the 15/04/02 the pre-alert message was broadcasted to the participants by email and fax that fore-saw the occurrence of a release in the next 30 hours. At 10:22 UTC of the following day an alert mes-sage was broadcasted to the ESEMBLE participants by email and fax and web site with the following information:
Risø-R-1435(EN) 37
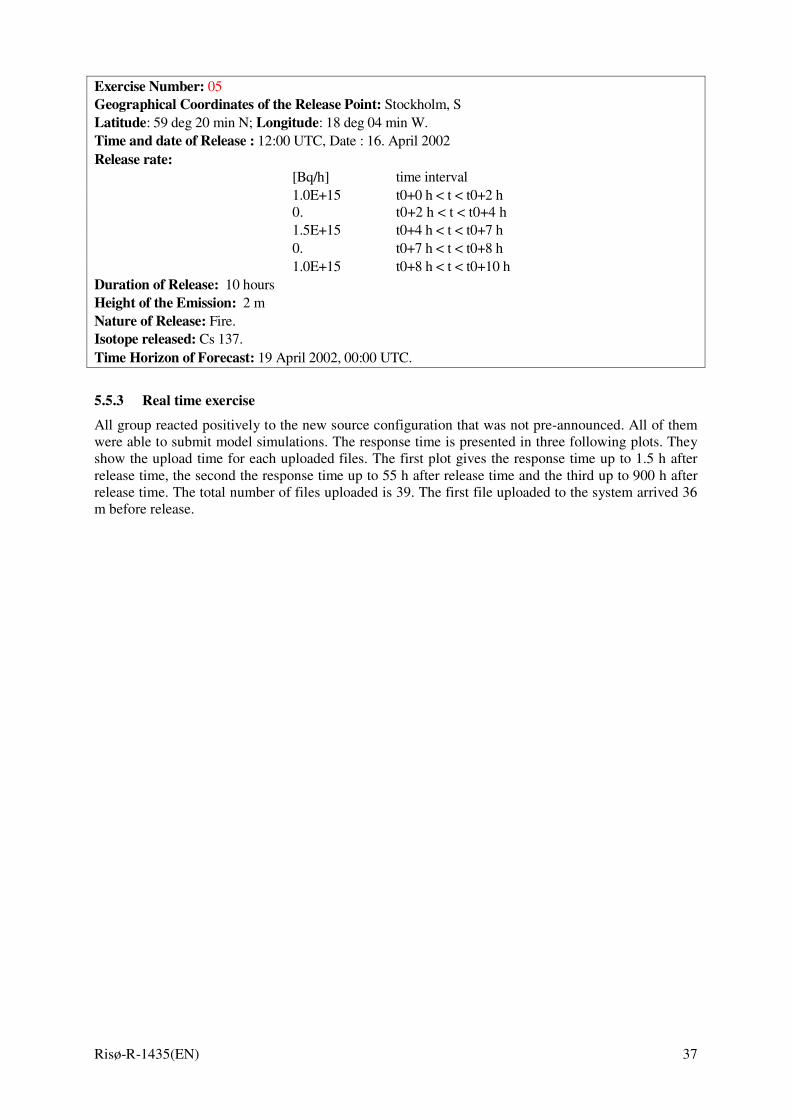
Exercise Number: 05 Geographical Coordinates of the Release Point: Stockholm, S Latitude: 59 deg 20 min N; Longitude: 18 deg 04 min W. Time and date of Release : 12:00 UTC, Date : 16. April 2002 Release rate: [Bq/h] time interval 1.0E+15 t0+0 h < t < t0+2 h 0. t0+2 h < t < t0+4 h 1.5E+15 t0+4 h < t < t0+7 h 0. t0+7 h < t < t0+8 h 1.0E+15 t0+8 h < t < t0+10 h Duration of Release: 10 hours Height of the Emission: 2 m Nature of Release: Fire. Isotope released: Cs 137. Time Horizon of Forecast: 19 April 2002, 00:00 UTC.
5.5.3 Real time exercise
All group reacted positively to the new source configuration that was not pre-announced. All of them were able to submit model simulations. The response time is presented in three following plots. They show the upload time for each uploaded files. The first plot gives the response time up to 1.5 h after release time, the second the response time up to 55 h after release time and the third up to 900 h after release time. The total number of files uploaded is 39. The first file uploaded to the system arrived 36 m before release.

38 Risø-R-1435(EN)
5.5.4 Weather Map
The weather map in Figure 5-11 shows the weather condition at release start (courtesy of DMI).
Uploa d t ime
0
100
200
300
400
500
600
700
800
900
1000
1 2 3 4 5 6 7 8 9 10 11 12 13 14 15 16
f i l e
Upl oa d t i me
0
10
20
30
40
50
60
1 2 3 4 5 6 7 8 9 10 11 12 13 14 15f i l e
Upl oa d t i me
-1
-0.5
0
0.5
1
1.5
2
1 2 3 4 5 6 7 8
f i l e

Risø-R-1435(EN) 39
Figure 5-11. Weather situation at release start
5.5.5 Sample results from Exercise 05
Figure 5-12 gives the agreement in predicting the precipitation field 51 h after the release start by 7 models (in percentage). This information can be correlated with the wet deposition field. Figure 5-13 gives the ATL for wet deposition for 9 models 51 h after the release and contribution of DE1 to the overall distribution.
Figure 5-12. ATL for precipitation 51 h after release for exercise 05

40 Risø-R-1435(EN)
Figure 5-13. ATL for wet deposition 54 h after release for exercise 05
5.6 Exercise 06 June 25, 2002 - Dublin, Ireland
5.6.1 Scope of the exercise
Standard ENSEMBLE exercise.
5.6.2 Release Information
On the 24/06/02 the pre-alert message was broadcasted to the participants by email and fax that fore-saw the occurrence of a release in the next 30 hours. At 10:29 EST of the following day an alert mes-sage was broadcasted to the ESEMBLE participants by email and fax and web site with the following information:
Exercise Number: 06 Geographical Coordinates of the Release Point: Dublin, Ir Latitude: 53:52 N; Longitude: 06:16 W. Time and date of Release: 12:00 UTC 2002-06-25 Release rate: 10.0E15 [Bq/h] Duration of Release: 15 hours Height of the Emission: surface Nature of Release: Leakage. Isotope released: Cs 137. Time Horizon of Forecast: 2002-06-28 00:00

Risø-R-1435(EN) 41
5.6.3 Real time exercise
During the exercise a communication mismatch occurred for what concerns the release rate and the time horizon of the forecast between the web site information and the email. It was due to a procedure error and not intentional. The information contained in the email was however the one agreed upon before hand. The notification of the difference in information, however, allowed an immediate correc-tion of the parameters published on the web page and caused no consequences to the following stage of the exercise.
The uploading procedure proceeded with the usual pace. By the end of the exercise, 43 files were uploaded to the system.
5.6.4 Weather Map
Figure 5-14. Weather situation at release start
5.6.5 Sample results from Exercise 06
The figures give the Agreement in Threshold level calculated by all models that submitted results for the –12 h meteo set and the +60 h one. The plot relates to the air concentration at the time horizon and to a threshold of 0.1 Bq/m3. As from the figures the area of high agreement of the plume remains lo-cated in the same region although the distribution obtained with forecasted meteorology is more spread in space.

42 Risø-R-1435(EN)
Figure 5-15. ATL of all model results obtained with –12h meteorological data
Figure 5-16. ATL of all model results obtained with +60h meteorological data

Risø-R-1435(EN) 43
5.7 Exercise 07 October 4, 2002 Glasgow, UK
5.7.1 Scope of the exercise
Vertical distribution of released map. Joint ENSEMBLE-ECURIE exercise
5.7.2 Release Information
On 04/10/02 the seventh official ENSEMBLE exercise took place. The exercise was conducted jointly with one of the periodic ECURIE exercises (level 3). Differently from the previous exercises in this case the date was defined a-priori by the ECURIE organization as well as the source term characteris-tics and accident type (Airplane crash on NPP). The only free parameter, which was selected by the ENSEMBLE organization, was the source location. On the 03/10/02 the pre-alert message was broad-casted to the participants by email and fax that foresaw the occurrence of a release in the next 30 hours. At 10:00 EST of the following day an alert message was broadcasted to the ESEMBLE partici-pants by email and fax and web site with the following information:
Exercise Number: 07 Geographical Coordinates of the Release Point: Glasgow, Scotland Latitude: 55 deg 53 min N ; Longitude: 4 deg 14 min W. Time and date of Release: 07:00 UTC, Date : 04. October 2002 Release rate: 1.E+15 [Bq/h] Duration of Release: 4 hours Height of the Emission: homogenously from surface to 500m above ground Nature of Release: FIRE. Isotope released: Cs 137. Time Horizon of Forecast: 6. October 2002, 19:00 UTC
5.7.3 Real time exercise
The uploading procedure proceeded with the usual pace. The first model output reached the ENSEMBLE server at 10:15 EST. By the end of the exercise, 47 files were uploaded on the system. In order to allow the ECURIE community to access the ENSEMBLE results without accessing the ENSEMBLE system, a special web location was constructed whose URL (http://ensemble.ei.jrc.it/ecurie-level3) was communicated to the ECURIE community through an ECURIE message. The reason for such a choice was motivated by the fact that little overlapping exists between the ECURIE and the ENSEMBLE communities and the former has no experience or training in consulting the ENSEMBLE system or in interpreting the ENSEMBLE plots and representations. The web site contained a summary of the results produced in real-time by the ENSEMBLE commu-nity, mainly agreement plots. Figure 5-1 give the home page of the special ECURIE-ENSEMBLE web site.
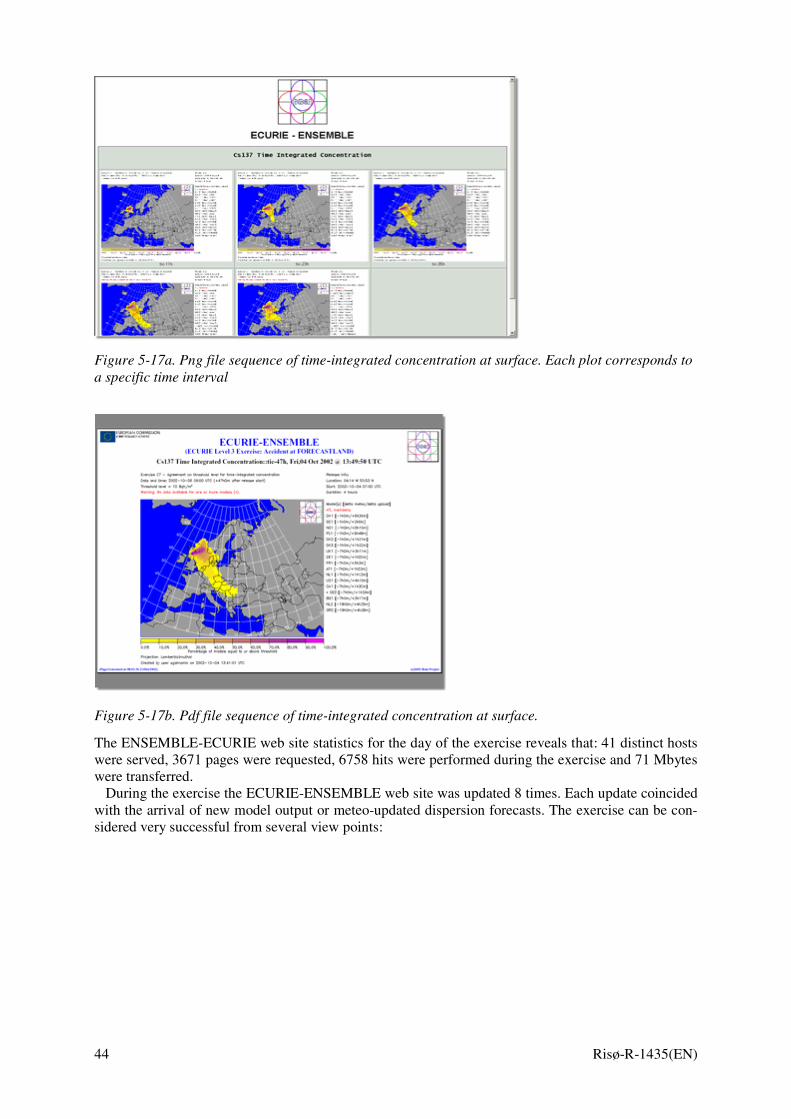
The variables for which the dispersion evolution was provided were: surface concentration, wet and dry- deposition and time-integrated concentration at surface. Figure 5-17 (a and b) give an example of the format in which the forecasts of the four variables were presented. For each variable the spatial distribution of the agreement parameter at 5 time intervals was presented in the form of png (Figure 5-17a) files as well as pdf (Figure 5-17b) file sequence. This to allow direct consultation and printing for fax delivery reasons.
The reason for selecting only the Agreement plots as the representation to present to the ECURIE community was connected to, the fact that such plot summarizes nicely the models behaviour and level of agreement in few plots.
44 Risø-R-1435(EN)
Figure 5-17a. Png file sequence of time-integrated concentration at surface. Each plot corresponds to a specific time interval
Figure 5-17b. Pdf file sequence of time-integrated concentration at surface.
The ENSEMBLE-ECURIE web site statistics for the day of the exercise reveals that: 41 distinct hosts were served, 3671 pages were requested, 6758 hits were performed during the exercise and 71 Mbytes were transferred.
During the exercise the ECURIE-ENSEMBLE web site was updated 8 times. Each update coincided with the arrival of new model output or meteo-updated dispersion forecasts. The exercise can be con-sidered very successful from several view points:

Risø-R-1435(EN) 45
• The modelling groups response has been prompt (7 model results uploaded within 1 hour from notification);
• The forecast update has been continuous though out the exercise; • This has allowed a continuous update of the plots on the ECURIE-ENSEMBLE web site; • A lot of interest was raised within the ECURIE community by the presence of all forecasts has it
can be evinced from the web site statistics. As far as the ENSEMBLE exercise is strictly concerned there are still problems in sending out the faxes to the various institutes. In this occasion only few of them could reach the destination the others where not sent due to a series of reasons (e.g. unreachable number, line engaged). This issue should be solved in the future though it does not seem, at this stage, to be crucial for the performance of the ex-ercises.
5.7.4 Weather Map
Figure 5-18. Weather situation at release start
5.7.5 Sample results from Exercise 07
All ENSEMBLE results on Exercise 07 are accessible at http://ensemble.ei.jrc.it/ecurie-level3

46 Risø-R-1435(EN)
5.8 Exercise 08 December 3, 2002 Mochovce, SR
5.8.1 Scope of the exercise
Joint ENSEMBLE-DSSNET exercise
5.8.2 Release Information
On December 3, 2002 the height ENSEMBLE exercise took place. The exercise featured a release of Cs137 from the nuclear power plant of Mochovce in Slovak Republic. The release type chose is a time profile of emission rate lasting 12 hours as described in the box below.
Exercise Number: 08 Geographical Coordinates of the Release Point: Mochovce (Slovak Republic) Latitude: 48 deg 16 min N ; Longitude: 18 deg 28 min W. Time and date of Release : 12:00 UTC, Date : 03. December 2002 Release rate: 2.54E+14 for t [t0+0 h, t0+1 h], 8.61E+13 for t [t0+1 h, t0+2 h], 5.05E+13 for t [t0+2h, t0+3 h], 8.56E+12 for t [t0+3h, t0+4 h], 4.32E+12 for t [t0+4h, t0+5 h], 4.32E+12 for t [t0+5h, t0+6 h], 4.32E+12 for t [t0+6h, t0+7 h], 1.28E+12 for t [t0+7h, t0+8 h], 2.22E+11 for t [t0+8h, t0+9 h], 2.22E+11 for t [t0+9h, t0+10 h], 2.22E+11 for t [t0+10h, t0+11 h], 5.18E+11 for t [t0+11h, t0+12 h] [Bq/h] Duration of Release: 12 hours Height of the Emission: 25 m Nature of Release: LEAKAGE. Isotope released: Cs 137. Time Horizon of Forecast: 6. December 2002, 00:00 UTC
The selection of an existing NPP was motivated by a request from the DSSNET project of FP5 which is planning to perform a decision support system exercise next spring involving the selected NPP and several countries in Europe. The exercise performed within ENSEMBLE and the dispersion fields produced will be used during the DSSNET exercise. The weather condition was selected so that the dispersion took place from East to West and involved a large number of countries in Central Europe. Such an aspect was one of the requests from the DSSNET project. The NPP authorities in close col-laboration with the DSSNET project defined the release characteristics.
5.8.3 Real time exercise
The exercise proceeded smoothly as usual. At the end of the exercise 51 datasets have been upload.
Risø-R-1435(EN) 47
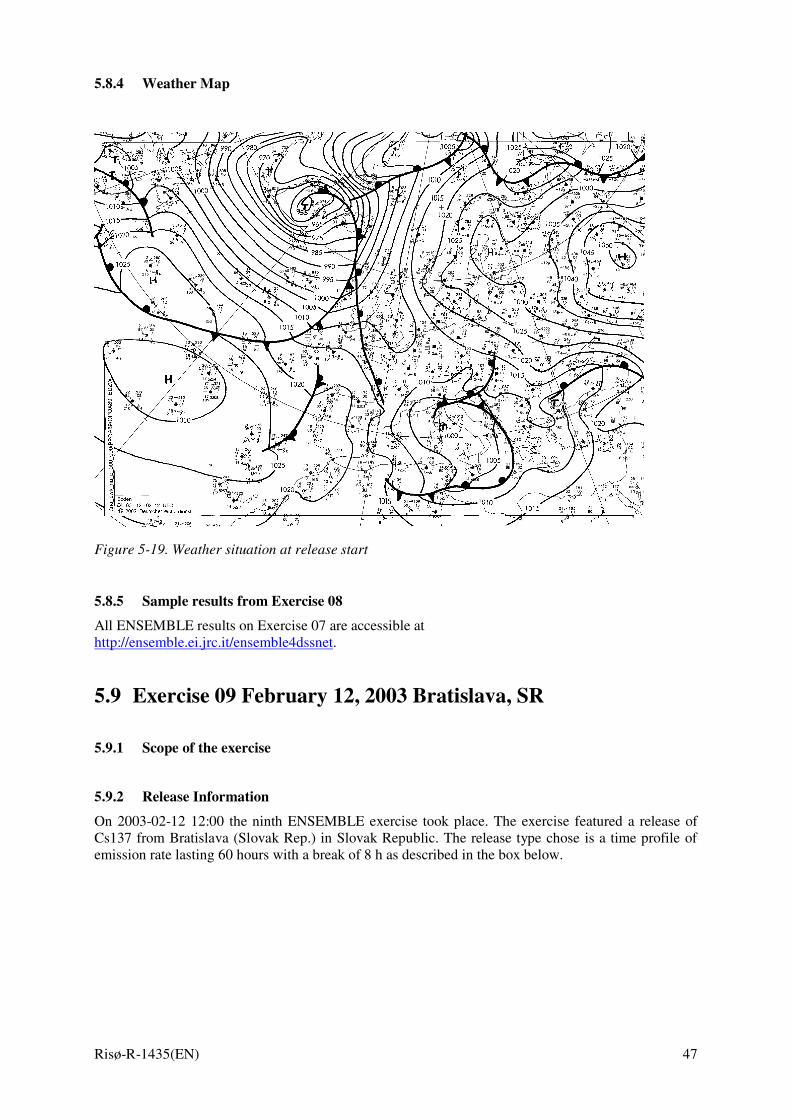
5.8.4 Weather Map
Figure 5-19. Weather situation at release start
5.8.5 Sample results from Exercise 08
All ENSEMBLE results on Exercise 07 are accessible at http://ensemble.ei.jrc.it/ensemble4dssnet.
5.9 Exercise 09 February 12, 2003 Bratislava, SR
5.9.1 Scope of the exercise
5.9.2 Release Information
On 2003-02-12 12:00 the ninth ENSEMBLE exercise took place. The exercise featured a release of Cs137 from Bratislava (Slovak Rep.) in Slovak Republic. The release type chose is a time profile of emission rate lasting 60 hours with a break of 8 h as described in the box below.

48 Risø-R-1435(EN)
Exercise Number: 09
Geographical Coordinates of the Release Point: Bratislava (Slovak Republic)
Latitude: 48:09 N ; Longitude: 17:08 E .
Time and date of Release : 2003-02-12 12:00
Release rate: 1.0E+16 from t0 to t0+ 11 h 59 m,
0 from t0+12 h 00 m to t0+ 19 h 59 m,
1.0E+16 from t0+ 20 h 00 m to t0+31 h 59 m
Duration of Release: 60 hours
Height of the Emission: 25 m Nature of Release: LEAKAGE. Isotope released: Cs 137.
Time Horizon of Forecast: 2003-02-15 00:00
5.9.3 Real time exercise
The exercise proceeded smoothly as usual. At the end of the exercise 48 datasets have been upload.
5.9.4 Weather Map
Figure 5-20. Weather situation at release start

Risø-R-1435(EN) 49
5.9.5 Sample results from Exercise 09
Figure 5-21 and Figure 5-22 give the ATL and APL for time integrated concentration 60 h after the release. ATL in particular shows an excellent agreement among the model results considering in par-ticular that the plume splits into two branches. Although the majority of the models predict that the plume will mainly be along the n-w direction from the source point, a large portion of them also agree in predicting the plume presence along the s-w direction. The APL plot is corresponds to the 100% of models and time integrated concentration thus providing the distribution of the maximum time inte-grated concentration level. The combined analysis of the two plots gives a clear indication of wide-spread agreement in forecasting time-integrated concentration of the order 102-104 Bqh/m3.
Figure 5-21. ATL for time-integrated concentration 60h after release

50 Risø-R-1435(EN)
Figure 5-22. ATL for time-integrated concentration 60h after release
5.10 Exercise 10 and 11 June 11, 2003 - London, UK; Dirty bomb Cs137 and Pu241
5.10.1 Scope of the exercise
Long range dispersion from RDD explosion in major urban area. Dispersion of 2 radio nuclides.
5.10.2 Release Information
The source term for the case study was determined by JRC/ITU. Based on the source term estimates, two exercises were performed within ENSEMBLE relating to the dispersion of 137Cs and 241Pu. The release characteristics of the two radionuclide emissions are given in the table.
137Cs 241Pu
Release location London (UK) London (UK)
Date and time of the release (UTC) 11/06/2003 12:00 11/06/2003 12:00
Release duration [s] 900 900
Emission height [m] 350 350
Nature of the release Spreading Spreading
Mass released [Bq] 1.E13 9.94E12
Risø-R-1435(EN) 51
The choice of the release location date and time was determined by the weather conditions at the time of the exercise as described in the next section. Since the initial dispersion is the result of an explosion, a 900 s release duration was assumed. It is assumed that during this time the material released is lo-cally dispersed in the atmosphere. Therefore 900 s is the time assumed for the whole mass release to start to be influenced by atmospheric circulation. The emission height of 350 m has been assumed as if the explosion took place on the top of a high building (including also the vertical projection of the ma-terial caused by the explosion), as would be the case of a terrorist act that wants to achieve the con-tamination of a large surface.
5.10.3 Real time exercise
During the exercise the ENSEMBLE system has received in total 49 model predictions from 24 mod-elling systems. The large number of model results is motivated by the fact the exercise lasted for 3 days during which updates of the dispersion fields were submitted which were based on updated me-teorological forecast. The results presented in this report relate to the last set of model results calcu-lated, i.e. based on analysed (actual) meteorology. The exercise was performed in real time thus simu-lating the occurrence of an unexpected event. All participants were informed of the release characteris-tics at the moment of notification and were asked to produce model predictions in real time. The first model result was available on the ENSEMBLE system 36 min after notification and within an hour approximately 10 model predictions were uploaded.
5.10.4 Weather Map
A Westerly flow was chosen with a source located in the Western part of Europe. Since the source location had to be a major urban site, as it would be in the case of a terrorist attack, London (UK) was selected as suitable location. An appropriate circulation took place on June 11 2003. As from the weather map of Figure 5-17a, on that date a high-pressure system was moving over the British isles and Northern France following the passage of a cold front to the West and an occluded front to the North. An anticyclonic circulation was therefore present with surface winds blowing to the North-East direction.

52 Risø-R-1435(EN)
Figure 5-23. Weather situation at release start
A warm front moves to the North West as a result of the high pressure system present on the Mediter-ranean sea thus feeding and keeping the High over England in the same position. Figure 5-17b gives the weather situation 24 hours later (12/06/2003). The high pressure over the British Isles has extended in the West-East direction while the cold front has advanced well into the northern European territory.
5.10.5 Sample results from Exercises 10 and 11
The total deposition (dry and wet deposition) map produced by 90% of the models for 137Cs is given in Figure 5-24. The deposition map reflects the dispersion pattern shown in Figure 5-24. However the contamination levels are higher with values of 10 to 100 Bqm-2 in the Eastern part of Britain. As for the other European countries the levels range from 10-5 to 1 Bqm-2. An hot spot can be seen in south-ern Sweden with level between 10 and 100 Bqm-2.
The deposition pattern predicted by 90% of the codes is given in Figure 5-25. The levels of depos-ited 241Pu by dry and wet deposition are still confined to the Eastern part of England while the rest of the European territory presents deposition levels, which do not exceed 1 Bqm-2. The nuclide distribu-tion is patchier than in the case of 137Cs with two distinct areas with values between 1and 10 Bqm-2. According to a larger population of model results the deposition extends all the way to the southern border of Germany though with very low contamination levels. Good agreement is found with the pat-tern shown in Figure 5-24 by the three selected model predictions.

Risø-R-1435(EN) 53
Figure 5-24. Agreement in Percentile Threshold for total deposition of 137Cs 60 h after release. The field relates to the deposition produced by 90% of the models listed on the right hand side of the figure and indicated by country code.
Figure 5-25. Agreement in Percentile Threshold for total deposition of 241Pu 60 h after re-lease. The field relates to deposition produced by 90% of the models listed on the right hand side of the figure and indicated by country code.
54 Risø-R-1435(EN)
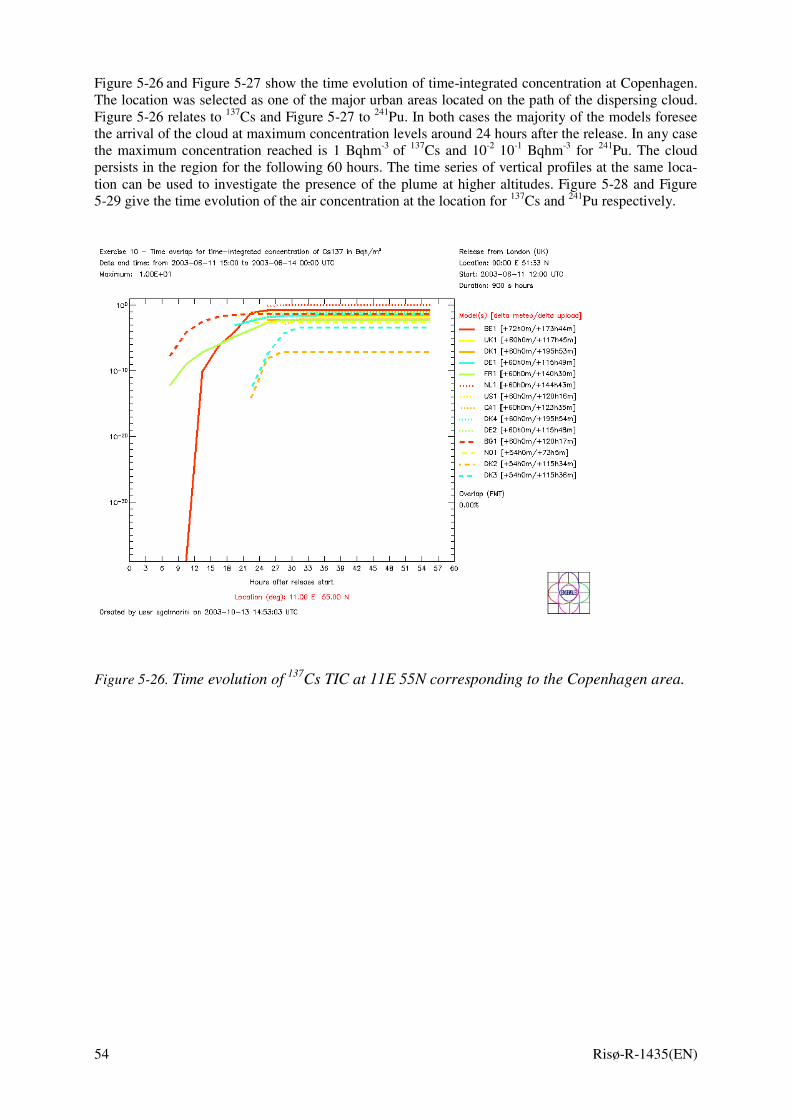
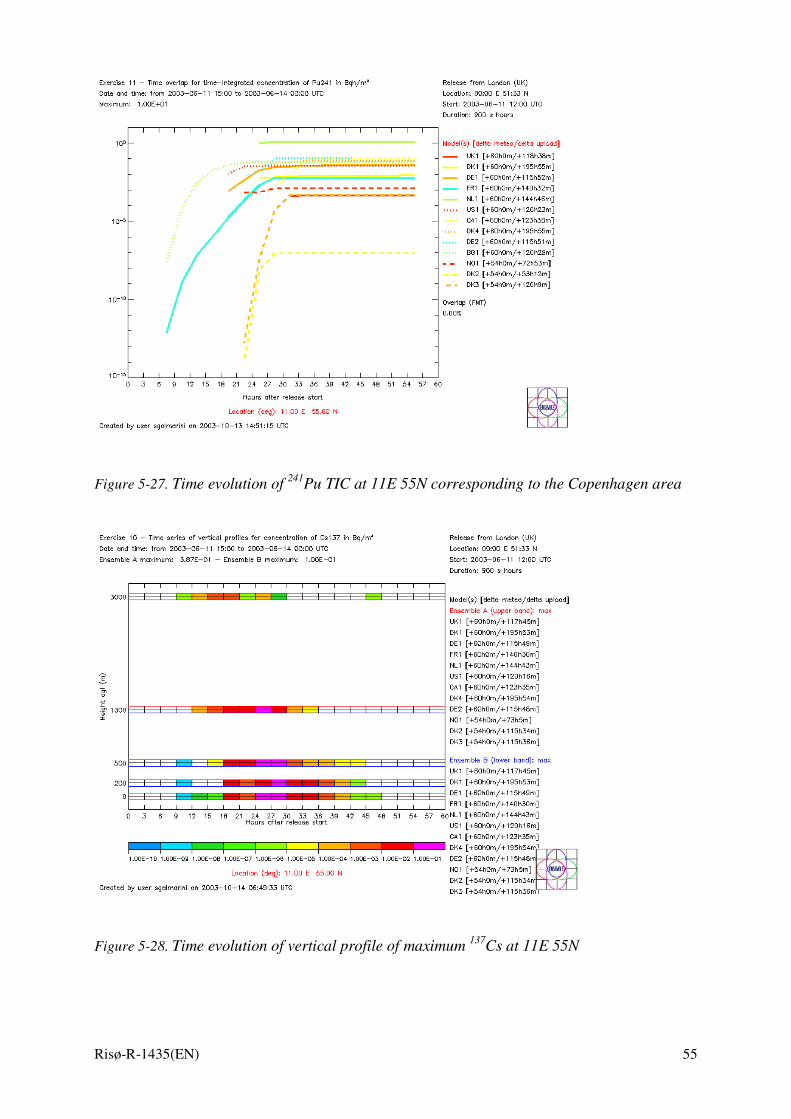
Figure 5-26 and Figure 5-27 show the time evolution of time-integrated concentration at Copenhagen. The location was selected as one of the major urban areas located on the path of the dispersing cloud. Figure 5-26 relates to 137Cs and Figure 5-27 to 241Pu. In both cases the majority of the models foresee the arrival of the cloud at maximum concentration levels around 24 hours after the release. In any case the maximum concentration reached is 1 Bqhm-3 of 137Cs and 10-2 10-1 Bqhm-3 for 241Pu. The cloud persists in the region for the following 60 hours. The time series of vertical profiles at the same loca-tion can be used to investigate the presence of the plume at higher altitudes. Figure 5-28 and Figure 5-29 give the time evolution of the air concentration at the location for 137Cs and 241Pu respectively.
Figure 5-26. Time evolution of 137Cs TIC at 11E 55N corresponding to the Copenhagen area.
Risø-R-1435(EN) 55
Figure 5-27. Time evolution of 241Pu TIC at 11E 55N corresponding to the Copenhagen area
Figure 5-28. Time evolution of vertical profile of maximum 137Cs at 11E 55N

56 Risø-R-1435(EN)
Figure 5-29. Time evolution of vertical profile of maximum 241Pu at 11E 55N
5.11 Special exercises During the course of the ENSEMBLE project special additional exercises were also performed beyond the 10 requested. Namely: 5 India Pakistan nuclear escalation 6 Second Gulf war 7 ETEX revisited The first two exercises were motivated by specific requests from other Commission services given a potential threat for the European territory from the use of nuclear weapons. The third exercise was or-ganised to make a quantitative estimate of the multi-model ensemble technique against the ETEX measurements.
5.11.1 India Pakistan nuclear escalation
In recent times, political tensions between India and Pakistan have risen to the point where escalation into a nuclear conflict is a distinct possibility. There exist real concerns that such escalation may result in nuclear fallout impinging on the European Union territory. A consequence of all nuclear explosions is the dispersal of radioactive material in the atmosphere, and their subsequent transport over long dis-tances. Details of this dispersal will depend on the magnitude of the weapons details of their deploy-ment and the existing weather conditions. Dispersed fallout will ultimately be deposited to the ground. We have configured the ENSEMBLE system for the task, and applied it to that geographical region (Figure 5-30), in what we call the “Karachi Event”. In order to illustrate system capability, we have selected a set of weather conditions that actually occurred, and imposed source term parameters that are as representative as possible to those describing an explosion event, given the present state of de-velopment of the system. The weather conditions represented in this study are almost randomly cho-

Risø-R-1435(EN) 57
sen. Obviously in a real event the explosion details would be provided by intelligence services and actual weather conditions (and their evolution) would be used. If one wanted to anticipate the conse-quences of an event well in advance, it would be necessary to conduct a wide series of studies cover-ing a climatologically representative set of weather conditions. The hypothetical Karachi Event is con-structed simply for purposes of illustrating ENSEMBLE capability, and must not be interpreted as rep-resentative of actual events, past or future. The real time capability of ENSEMBLE, and its continuous connection to the weather services would allow us to providing a forecast of conditions following a real event, or to provide guidance should the probability of an event increase. In order to show the sys-tem capacity, a set of meteorological conditions was selected and four institutes performed simulations based on the case.
The case analysed is the dispersion of fallout from an explosion at the geographical coordinates:
Latitude: 24 ° 54 ‘ N Longitude: 67 ° 21 ‘ E Which corresponds roughly with the location of Karachi (Pakistan). We hypothesize an explosion which releases into the atmosphere 9 10 15 Bq of 137Cs.
The release is assumed to be effectively instantaneous (lasting 900 s) and uniformly distributed in the vertical (from 0 to 500 m above ground level). Past studies have shown that a large fraction of ra-dioactive material emitted from a nuclear explosion is transported to the upper tropo-sphere/stratosphere (80% from 9.5 to 13.7 km) and only a small fraction (20 %) is distributed in the troposphere. In such cases, most of the material is transported by large-scale atmospheric motion and is deposited or transported back to the surface over time scales of months to years. The portion of ra-dioactive material that represents an immediate threat (over a timescale of days to weeks) is than the one that is left in the troposphere, and whose quantity depends on the magnitude and release condi-tions of the nuclear weapon. This study addresses specifically cases of nuclear explosions in which the tropospherically released fallout is large enough to have significant surface effects in the short term. In any case, the hypothetical release upon which this illustration is based has been chosen so as to dem-onstrate system capability, and is motivated by the present status and scope of application of the ENSEMBLE system. Further elaboration on the hypothesis could include several layers in the tropo-sphere and thus account for release throughout the first atmospheric layer. It should be bared in mind that the application case given here is more a demonstration of the system potential in collecting, rep-resenting and delivering model forecasts. More appropriate modifications to the system can be put in place for such specific application. All participating groups submitted results from 60 h simulations of the evolution of the cloud of 137Cs produced by the explosion which was assumed to take place at 00:00 UTC on 24-06-2002.
All models participating in ENSEMBLE are operational, long-range transport and dispersion models used by meteorological offices and environmental protection agencies for the forecast of atmospheric dispersion at the continental scale. They are in many cases applicable not only to the release of radio-active material but also to passive and chemically reactive compounds. All models rely on in-house meteorological forecasts produced by national meteorological offices or international organisations such as the European Center for Medium Range Weather Forecast in Reading (UK). Therefore each model not only differs from the others in terms of the way dispersion and mixing is simulated, but also in terms of the weather data used to run the dispersion. This variety may be a source of uncertainty and complicate the decision making process if model results are considered separately. Within ENSEMBLE it becomes and advantage. An essential function of ENSEMBLE is the simultaneous col-lation of results from a wide range of models in real time. The larger the number of model results available, the more information on the possible scenarios are made available to the decision making process. Five out of the full set of 22 models that normally constitute ENSEMBLE activities for Europe were employed in this study. This subset was made necessary by the availability of resources for running this special case and availability of weather data for this region of the world, both factors that affect the routine applicability of models outside their usual domain of application (the European region). The five models are: two models from the DWD (D), a model from METEOFRANCE (F), a model from the Savannah River Technology Centre, USA and a model from Environment Canada. The latter two models are currently external contributors to the DG-RTD SCA.

58 Risø-R-1435(EN)
Figure 5-30. Representation of the spatial domain covered by the ENSEMBLE system for the so-called Karachi event study.
Figure 5-31 (a and b) shows the cloud position 27 and 39 h after release respectively at ground level. The figures show considerable overlap in resultant fallout patterns from the five models. This overlap indicates substantial agreement between the participating models.
Figure 5-31a. Areas with 137Cs grater than 1 Bq m-3, 24 h after explosion concentration of 1 Bq/m3 at surface

Risø-R-1435(EN) 59
Figure 5-32b: Areas with 137Cs grater than 1 Bq m-3, 36 h after explosion cocentration of 1 Bq/m3 at surface
5.11.2 Second Gulf war
During the Second Gulf war concerned was raised on the possible use of nuclear weapons as well as the use of chemical and biological dispersion weapons. In order to be prepared to provide support to decision-making the ENSEMBLE system was tuned to work on the domain of Figure 5-33. The do-main was selected so that the European territory as well as the war theatre was included. Eventually no model simulation was run on this case.
Figure 5-33. ENSEMBLE domain set for potential application during the Second Gulf War period.

60 Risø-R-1435(EN)
5.11.3 ETEX revisited
In order to evaluate the multi-model ensemble technique developed within the ENSEMBLE project, the modelling groups were asked to re-simulate the European Tracer Experiment within the ENSEMBLE context. The availability of monitoring data collected during the ETEX exercise allowed a study for the quantitative evaluation of the ENSEMBLE parameters developed and used within ENSEMBLE.
Figure 5-34 gives an example of the ETEX application of ENSEMBLE.
Figure 5-34. ENSEMBLE application to the ETEX case
The figure shows the Agreement in Threshold Level for 1.e-10 gr/m3 of the ETEX tracer (PMCH) obtained with the results of 15 models. The figure relates to the dispersion 47 h after the release. The hatched area represents the contour for the same concentration level of the measured data. As one can see the high agreement area coincides with the measured area.

Risø-R-1435(EN) 61
6 The Decision-Maker’s Web Tool
6.1 Introduction The third work-package (WG3) of the ENSEMBLE project was focused on the development of analytical tools to support the needs of the decision making process during emergency management. The ana-lytical tools developed during earlier programmes such as the ETEX dispersion experiments and the RTMOD programme were focused in many ways on the needs of meteorologists and statisticians in comparing and evaluating different atmospheric transport forecasts (Girardi et al, 1998; Graziani et al, 2000; Nodop, 1997). The power of such tools suggested that they will have an important role during an emergency in conveying to decision makers the likely long range dispersion of the contamination. However, the tools had not been tailored to the needs of decision making per se. It was the role of WG3 to investigate appropriate tailoring and to specify enhancements of the ENSEMBLE web-site spe-cifically for the purpose of supporting decision making.
The work-package had four broad strands:
• comparison and analysis of the exercises conducted by WG1 in order to learn parallels and differ-ences in behaviour of the atmospheric transport forecasts made by the partner meteorological of-fices;
• an investigation of the role of the meteorological offices in the emergency management process with the particular aim of identifying the advice that will be sought from them;
• an literature review of the cognitive issues faced in conveying spatio-temporal information, in-cluding uncertainty, to non-expert users;
• specification of geographical and other plots to inform decision making on emergency manage-ment relating the long-range transport of contamination.
Progress on these strands has been varied. The schedule of the exercises was delayed somewhat over that originally planned in the ENSEMBLE proposal in order to develop the web-site and download pro-cedures. Thus only one full exercise was run in the first year and the statistical analyses of the first five exercises was not completed until month 20. However, by the completion of the project, eleven exer-cises had been run plus a ‘simulation’ of the ETEX 1 experiment has also been conducted. Analyses of the results were prepared for the plenary meetings of the project held in September 2002 and 2003 and a summary report prepared. The investigation into the roles of the meteorological offices proceeded as planned, although the results were not as clear as had been hoped at the planning stage of the ENSEMBLE project. Work in this respect is continuing under the guides of the EVATECH project, due for completion in November 2004. Investigations into ways of presenting information on the uncer-tainty in spatio-temporal forecasts to decision makers (DMs) proceeded over the course of the project. Sadly, surveys found remarkably little related work in the literatures of cognitive psychology and geo-graphical information systems, although many authors in both fields indicated that there were many issues to consider. Moreover, the range of possible plots and other means of presenting the uncer-tainty were limited by a lack of means of assessing the uncertainty that were either feasible or accept-able to the ENSEMBLE community. A suggestion was made based upon ideas derived from the meth-odology of the sensitivity analysis and this was trailed in a number of ways. Also a survey was made of how the participating meteorological offices would use ENSEMBLE tools to prepare reports for their DMs.
6.2 An analysis of the ENSEMBLE exercises from the perspective of decision making
The ENSEMBLE project has run eleven exercises relating to dispersions of airborne contaminants at a European scale, and also a simulation of the first ETEX experiment. There were two more limited exer-cises relating to dispersions in the Middle East and in Northern India/Pakistan. French and Bayley

62 Risø-R-1435(EN)
(2003) provide an analysis and comparison of the eleven European exercises and the repeat of the ETEX experiment from the perspective of a DM, i.e. a person who is not necessarily statistically trained, who is focused on specific issues concerning emergency management and who will tend to look at visual plots in a ‘naïve’ fashion. DMs will also be working under time pressures and the inherent stress that those bring; and they will need to communicate with the public and other specific stakeholder groups who will be concerned with the management of the accident.
The exercises indicated several general observations:
• some models perform similarly (see Figure 6-1); • some models perform differently (see Figure 6-2); • some models can perform very differently (see Figure 6-3); • similar models evolve similarly; • the differences between using forecast and analysed meteorology are not substantial (see Figure
6-4).
Figure 6-1. Plots of time integrated concentrations at about 60 hours after release for the four Danish models in Exercise 4 (DK1 top left; DK2 top right; DK3 bottom left; DK4 bottom right) based upon ana-lysed meteorology.

Risø-R-1435(EN) 63
Figure 6-2. Plots of time integrated concentrations at about 60 hours after release for four models in Exercise 4 based upon analysed meteorology: United Kingdom (UK1 – left); German (DE1 – right).
Figure 6-3. Plots of time integrated concentrations at about 60 hours after release for the Norwegian (NO1 – left) and United States (US1 – right) models in Exercise 9 based upon analysed meteorology.
Figure 6-4. Plots of time integrated concentrations at about 60 hours after release for the United States model (US1) in Exercise 5: left hand plot for forecast meteorology; right hand plot for analysed meteorology.

64 Risø-R-1435(EN)
We performed several cluster analyses to investigate the similarities and differences between models and found that in general terms that models with similar underlying atmospheric dispersion models and meteorologies perform similarly. A result that might well be expected, but one that is now given some empirical verification. However, this result should not be taken too far. We found no unambigu-ous clusters here; nor was there sufficient data to investigate spatial correlations in any more sophisti-cated manner.
The main ENSEMBLE exercises gathered data on how the contributing models would forecast the dis-persion of contamination. There were no actual releases and no monitoring observations so it was not possible to compare the actual dispersions with the forecast dispersions. As a partial step to compare forecasts with actual contamination data, the ETEX 1 experiment was simulated using archived ana-lysed meteorological data. This enabled some estimation of the performance of the models and en-sembles against empirical data. However, it should be noted that this empirical comparison is likely to be slightly biased and to underestimate the forecast errors since almost all the models have been modi-fied since the original ETEX experiments and these modifications have been made in full knowledge of their performance in ETEX. Thus there is an element of overfitting of the data. Moreover, the compari-sons were not made with the actual ETEX 1 data at the actual monitoring stations, but with interpolated data at the grid points used in ENSEMBLE.
• Several observations were apparent: • The overlaps based upon a contamination contour of 2.5×10⁻¹⁰ on individual models are of order
50% – 60%. • Errors can be 1 to 2 orders of magnitude. • The scatterplots indicate a consistent positive bias for all the models. At the plenary ENSEMBLE
meeting held in Risø in September, 2003, it was suggested that this positive bias might arise from some bias in the manner of interpolation used to generate contamination maps from the ETEX 1 monitoring data.
• Experiments in comparing ensembles of models with the ETEX 1 data gave overlaps of 30% – 40% based upon a contamination contour of 2.5×10⁻¹⁰, which is poorer than the individual models, but the ensembles usually contained the empirical contamination completely whereas in the case of individual models there were often regions of actual contamination missed by the forecast.
What conclusions may be drawn from these analyses? In many ways, any conclusion depends upon the purpose to which it will be put. The old adage that “An optimist sees a glass as half full; a pessi-mist sees it as half empty” is particularly true here. There is no doubt that from the perspective of at-mospheric dispersion science, these results represent a considerable degree of agreement between the outputs of complex – very complex! – computer codes in the face of very uncertain inputs. But from the perspective of DMs, perhaps the lack of agreement is more apparent. Overlaps with the ETEX 1 data of little more than 50% suggest that the models provide at best indications of the general direction and spread of the contamination rather than forecasts that may be used with more certainty.
6.3 The role of meteorological offices in the emergency manage-ment process
In order to design a tool to support decision making, it is necessary to understand the needs of the DMs and their role in the wider emergency management processes. Moreover, there is a danger of referring to DMs and decision making as if there were single coherent groups engaged in a single task. A variety of DMs with differing levels of responsibilities and accountabilities will need advice from long range dispersion modelling in the event an accident with significant potential for off-site impacts at pan-European ranges. For any incident there will be a range of distinct decisions needed in respect of dif-ferent issues: e.g.

Risø-R-1435(EN) 65
• There will almost certainly be a need to plan monitoring strategies and potential countermeasures and this will require a prediction of the path of the plume and a reasonable idea of the time of pas-sage along with bounds on the associated uncertainties. Related to this will be a need to inform the public of the facts and the likely development of the situation. To support this in individual coun-tries the forecasts of the responsible organisation needs to be presented in the context of the wider picture of forecasts made across Europe and by international bodies.
• The demands, both in content and urgency, upon a national meteorological office are also likely to depend on the location of the release; i.e. whether it is
• within the country, • outside but near the country’s borders, • distant from the country. • There may be a need to predict the scale of agricultural and other countermeasures so that appro-
priate resources may be prepared and be deployed. Such planning requires forecasts, which pay somewhat less attention to the spatial and temporal movement of the plume and more to the scale of deposition and contaminated area. Again, the forecasts of the national responsible organisations need to be presented in the context of forecasts made elsewhere.
To clarify DM needs, a simple questionnaire was sent to the national meteorological offices participat-ing in the ENSEMBLE project. The design of the questionnaire was described in French (2001) and its conduct and analysis in Carter and French (2002b).
The survey was only partially successful: many of the replies were too vague to answer the issues definitively, even though a second more focused questionnaire was sent to some respondents. The vagueness in the responses may be due to potential ambiguity in the questions. However, it also seems that respondents know the details of the chain of command as it effects them, but do not necessarily know the whole process nor the entire set of objectives that the process had been designed to serve. There is the possibility that some of the meteorological offices may not have given thought to the na-ture of and reasons behind the questions which would be asked in the different types of emergency scenarios: viz. when the release is in, near or distant from their country. Encouragingly, there is some ephemeral evidence that the questionnaire is prompting the meteorological offices to think about these issues.
Half the countries surveyed handle one scenario differently in each of the questions. Here there is an issue with who decides when the situation is treated differently, and also whether this difference causes confusion in those involved in the process if the differences in the scenarios are not widely un-derstood. There is also a great variation in the nature and number of organisations involved in the management of a cross border emergency, the most common of which are nuclear agencies, emer-gency agencies, meteorological offices and various government ministries and departments. In many cases, local government are involved when the release is in the country, with some responses indicat-ing them as the decision maker or chair of the decision making group. Thus the responsibility for de-cision making and managing the emergency can range from local government to nuclear agencies, with their understanding of nuclear emergencies expected to differ. The number of organisations in-volved in the process in a country is also an issue with 41% of countries having at least five different organisations involved. With some exceptions it was seen that the countries with an emergency man-agement agency or one assigned organisation, usually a government department or a nuclear agency appeared to have a clearer idea of the process and the responsibilities of the parties to it. The responsi-bilities of the meteorological offices involve both the provision of meteorological support and their involvement in the emergency management. All the meteorological offices provide meteorological support and a quarter are involved in the management process. The support provided and the advice requested of the meteorological offices is compatible with the aims of the ENSEMBLE.
Detailed results from the questionnaire survey are provided in Carter and French (2002b). We also note that more detailed modelling of the emergency management process is being undertaken in the EVATECH project and that the results reported here will feed into that.

66 Risø-R-1435(EN)
6.4 Review of the literature on the cognitive understanding of spatial and temporal plots of dispersion
Over the past 30 years much attention has been paid to the graphical display of data1: see, e.g., Cleve-land (1994) for a general review. Several converging strands of work can be distinguished. Within the statistical community, there has been a recognition of the power of graphical methods for exploring data and for assessing the validity of models: see, e.g. Chambers et al (1983). The advent of high-powered computer graphics and multimedia has stimulated much activity, both in the development of novel representations and in the design of the human-computer interface: see, e.g., Brodlie et al (1992). Within the behavioural sciences there has been much concern with cognitive biases and mis-conceptions, which can lead decision makers to misinterpret graphical displays of data. Human infor-mation processing is particularly susceptible to biases and misconceptions in the presence of uncer-tainty: see, e.g. Bazerman (2001), Cleveland (1994) and Henrion and Granger Morgan (1990). On this latter point, we note that in a number of exercises using current and previous versions of RODOS, there has been some evidence that users have a disposition to view the boundaries of plumes as ‘hard’ be-cause of the mode of displaying contours. Also relevant is the observation that decision makers in ex-ploratory exercises avoided issues relating to uncertainty by considering worst – or best! – case sce-narios (French et al, 2000). When plots are used to communicate uncertainty as well as explore its im-plications, further confounding issues are encountered which have been explored in a growing litera-ture on risk communication: see, Bennett and Calman (1999).
The import of all these studies is that if the ENSEMBLE web-site is to be used to inform decision makers and other stakeholders then cognitive issues must be addressed. It is not safe to assume that plots which are transparent to meteorologists and statisticians will be transparent to others in the emergency management process. Actually it is not entirely safe to assume that a plot which is trans-parent to one meteorologist will be as clear to another! Should the plots be used as part of a broader risk communication strategy to inform the public, then there is a further need to ensure that they are easily understood by a broad spectrum of viewers.
As part of WG3’s activities a review of a range of behavioural and cognitive research literatures was undertaken: see French (2001, Section 3; French and Battson, 2003). Unfortunately, while there is plenty of evidence of the importance of addressing cognitive issues in developing informative, easily comprehended plots, in the case of spatio-temporal plots, particularly those involving uncertainty, there is little firm guidance. Indeed, Couclelis (2003) recommends the development of an ‘Encyclope-dia of GIS Ignorance’ to recognise those areas that require much further research and the representa-tion of uncertainty is one of these.
Despite the paucity of advice currently available, there is a need within ENSEMBLE to design time-space plots of the plume and statistical comparisons of different forecasts, which facilitate unbiased comprehension of the evolving situation and the inherent risks. The plots need to give an impression of the uncertainties and the outer boundary of possibilities. We recognise that some of the plots may not only be used to support decision making, but may also be used as a basis for communication with a wider public so they must be intuitive and not need detailed guidance to interpret. We also note that one study (Evans, 1997) suggested that expert and novice users are differentiated more by the time it takes them to understand a plot than the mode of presentation: thus we would be wise in making all plots intuitive.
A fuller discussion of issues relating to the cognitive aspects of the representation of uncertainty in spatio-temporal data may be found in French and Battson (2003). Here we simply note that the plots produced by ENSEMBLE have not been tested with real DMs in any substantial way. There is an as-sumption that they are intuitive and convey the information intended to all users. This should be tested in any further development of the ENSEMBLE web-site.
1 Here the term ‘data’ is taken to include both empirical data gathered from, for example, monitoring and model output
data.

Risø-R-1435(EN) 67
6.5 Design of the Decision Maker’s Web-Tools Progress in designing the DMs web-tools progressed less well than had been intended in the initial pro-ject design for a number of reasons. Firstly, we have noted above that the emergency management processes, which they will support, vary considerably between countries and in some respects are ill-understood in some countries. Secondly, again as noted above, there is a paucity of advice available on how to present uncertain spatio-temporal information to DMs, although there are well recognised is-sues relating to cognitive bias and misunderstanding which can arise in assimilating presentations of such information. To these must be added a third, much more significant issue: namely, the assessment of the uncertainty.
In an ideal world the DMs and their advisors want a mechanism, which provides them with an en-semble forecast, and a valid assessment of the potential error between the forecast and the actual dis-persion as it later occurs. Essentially there are only two ways in which a valid assessment of the po-tential error can be obtained:
• an assessment of the potential error in each component forecast may be provided and then these
assessments may be combined to give an assessment of the potential error in the ensemble fore-cast;
• monitoring data may be provided showing the error in the ensemble forecast at some points, pre-sumably early on dispersion forecast, and this measured error propagated to other later points in the dispersion forecast.
The latter method may be dismissed in so far as the ENSEMBLE project is concerned, because it would lead to methods of data assimilation and also would involve difficult logistical procedures of data col-lection and their use at the ENSEMBLE website. The former method is, perhaps, more possible techni-cally, but is subject to considerable difficulties. We can only determine (some of) statistical properties of the potential error in the ensemble forecast if we have knowledge of (some of) the statistical proper-ties the potential errors in the individual institute forecasts. How might this knowledge be acquired? Again, there are essentially two possibilities. • From data. We might explore data from past dispersion experiments and accidents to determine
how well each institute’s model has performed in the past. However, the available data are sparse. We have a number of experiments such as ETEX, but there are far too few points to determine the errors with any great confidence.
• From expert judgement. Over the past three decades many methodologies have been developed for eliciting expert judgements of uncertainly: see, e.g. Cooke and Goossens (2000), Goossens and Kelly (2000). Thus one might work with one or more meteorologists to assess the error distribu-tions in each component model. In technical terms, this would be a difficult, but nonetheless pos-sible task: there are well-established methodologies. However, discussions within the consortium have indicated that the ENSEMBLE members are very reluctant to consider assessing the errors in their forecasts quantitatively themselves, feeling that there was not enough information to do so. While the evidence from the risk analysis and expert judgement literature indicates that, despite their views, they could provide very useful assessments of the uncertainty (see, e.g., Goossens and Kelly, 2000), there is a greater political problem. The use of expert judgement would require insti-tutes, at least implicitly, to assess the relative performance of their own models with respect to those of other institutes. It is unlikely to improve relations between institutes, if one institute says that its forecasts are more accurate than another’s; and it is almost inconceivable that they would announce that their own was less accurate than another’s.
Thus the ENSEMBLE methodology faced a difficult task in acquiring the quantitative assessments needed to implement technically correct methods for estimating and then displaying the uncertainty in ensemble forecasts. One way forward was to design one of the ENSEMBLE exercises as a repeat of an ETEX experiment using archived meteorological data. This allowed comparison of the various fore-casts based on current models with actual dispersion, although, of course, this will assess the uncer-tainty under only one set of conditions and, moreover, developments of models since the ETEX ex-

68 Risø-R-1435(EN)
periments have reflected their performance in those and thus introduce an element of over-fitting (French and Bayley, 2003).
There was another approach to exploring the uncertainty in a forecast, already embodied into the ENSEMBLE web-site at the outset of the project: namely, tools for exploring the agreement between several institute’s forecasts. If there is general agreement in some sense between several forecasts de-veloped ‘independently’, then DMs should have more confidence in basing their planning on these forecasts. There is no doubting the good sense of this approach in heuristic terms. But formally there are difficulties. The models are not ‘independent’, as the similarity and clustering analysis in French and Bayley (2003) shows2. Moreover, it can be shown statistically that any formal development to im-plement this method would again need some assessment of the potential error between the individual forecasts and the subsequent actual dispersion. In statistical terms, all agreement does is allow one to ‘gain strength’ between the forecasts. There is still a need for some statistical connection between the forecasts and reality.
Notwithstanding the comments above, the forecasts collected on the ENSEMBLE website together with comparisons of their agreement provide an outstanding resource to develop guidance for regional, national and international decision makers which are far more informative and may well help them take a more sanguine view of the uncertainties in their planning of countermeasures and their issuing of advice to the public.
Studies of emergency and risk management have shown that DMs, not unreasonably, want certainty to enable them to see a clear course of action. Thus they and, to some extent, their advisors have a subconscious tendency to avoid explorations of the uncertainty in issues and to seek single perspec-tives on problems even when there are disparate, possibly strongly conflicting views in the scientific community. In the case of major accidental releases of radioactivity, we know from, for example, the ETEX, RTMOD and, indeed, the ENSEMBLE exercises that long range forecasts provided by the institutes will differ in many respects and that none have a monopoly on the accuracy of their predictions. There is great potential value in using the ENSEMBLE tools to present an easily understood picture of the dif-ferences and agreements between the forecasts of their national institute(s) and others across Europe and beyond. Thus one objective in developing reports for DMs based upon the use of ENSEMBLE tools should be to set any individual forecast, be it a national or an ensemble forecast, in the context of the other forecasts that are available in order to see how other institutes are interpreting the situation. Given the remarks above, the comparison should be sensitive to the use of common models, common data and common meteorological forecasts in order to allow for expected correlations. Thus agreement between the former is less informative than agreement between the latter. However, there is no way at present to make this statement any more precise than a ‘qualitative health warning’.
There are many potential issues which would concern DMs in their handling of the emergency and issue of advice and these lead to a variety of questions, almost all having a temporal or spatial dimen-sion: see French (2001). These lead us to believe that, while their technical advisors will need to ex-plore the agreement between forecasts in many ways using all the tools already implemented on the ENSEMBLE website (scatter-plots, figures of merit, etc.), the DMs will be mainly interested in geo-graphic and temporal issues with a specific focus on their region. Thus the DM tools will typically re-quire plots which either predict the geographical spread of contamination at a particular time or show the temporal evolution of the contamination at a particular location. Since the review of the literature on the cognitive understanding of spatial and temporal plots of dispersion failed to find well accepted guidelines on presenting uncertainty in geographic information systems, we can only proceed using guidelines found in more general studies of cognition of uncertainty and of human computer inter-faces: namely keep it simple and use as little unfamiliar jargon and symbols as possible. The latter is important because people in a position of authority are often loath to ask for explanations of conven-tions and ‘simple’ things lest they lose face.
2 Put another way: consider an extreme case. Suppose that 100 institutes across Europe all use the RODOS system with the
same version of the RIMPUFF-MATCH long range dispersion forecasting code based upon the same set of release parame-ters and the same HIRLAM data. Then there would literally be 100% agreement between the forecasts: they would be identical. But, of course, there is only one model and one forecast which has be replicated 100 times. So to draw any confidence from the agreement would be illusory.
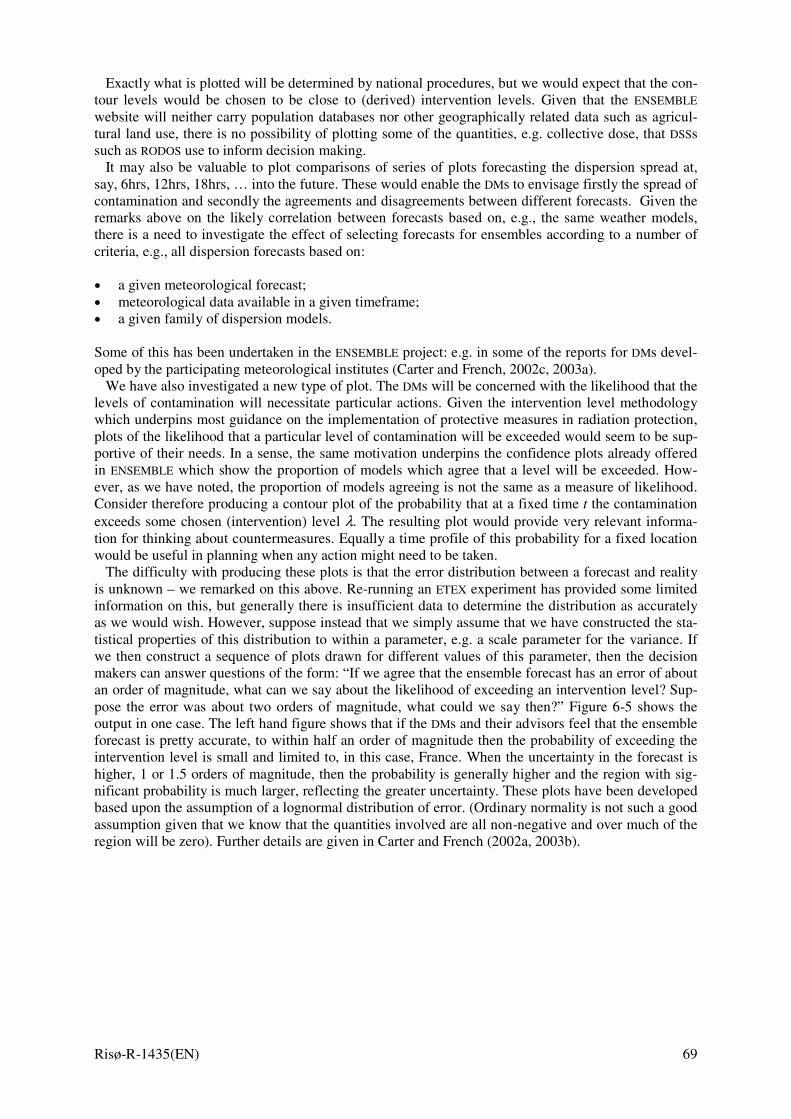
Risø-R-1435(EN) 69
Exactly what is plotted will be determined by national procedures, but we would expect that the con-tour levels would be chosen to be close to (derived) intervention levels. Given that the ENSEMBLE website will neither carry population databases nor other geographically related data such as agricul-tural land use, there is no possibility of plotting some of the quantities, e.g. collective dose, that DSSs such as RODOS use to inform decision making.
It may also be valuable to plot comparisons of series of plots forecasting the dispersion spread at, say, 6hrs, 12hrs, 18hrs, … into the future. These would enable the DMs to envisage firstly the spread of contamination and secondly the agreements and disagreements between different forecasts. Given the remarks above on the likely correlation between forecasts based on, e.g., the same weather models, there is a need to investigate the effect of selecting forecasts for ensembles according to a number of criteria, e.g., all dispersion forecasts based on: • a given meteorological forecast; • meteorological data available in a given timeframe; • a given family of dispersion models. Some of this has been undertaken in the ENSEMBLE project: e.g. in some of the reports for DMs devel-oped by the participating meteorological institutes (Carter and French, 2002c, 2003a).
We have also investigated a new type of plot. The DMs will be concerned with the likelihood that the levels of contamination will necessitate particular actions. Given the intervention level methodology which underpins most guidance on the implementation of protective measures in radiation protection, plots of the likelihood that a particular level of contamination will be exceeded would seem to be sup-portive of their needs. In a sense, the same motivation underpins the confidence plots already offered in ENSEMBLE which show the proportion of models which agree that a level will be exceeded. How-ever, as we have noted, the proportion of models agreeing is not the same as a measure of likelihood. Consider therefore producing a contour plot of the probability that at a fixed time t the contamination exceeds some chosen (intervention) level λ. The resulting plot would provide very relevant informa-tion for thinking about countermeasures. Equally a time profile of this probability for a fixed location would be useful in planning when any action might need to be taken.
The difficulty with producing these plots is that the error distribution between a forecast and reality is unknown – we remarked on this above. Re-running an ETEX experiment has provided some limited information on this, but generally there is insufficient data to determine the distribution as accurately as we would wish. However, suppose instead that we simply assume that we have constructed the sta-tistical properties of this distribution to within a parameter, e.g. a scale parameter for the variance. If we then construct a sequence of plots drawn for different values of this parameter, then the decision makers can answer questions of the form: “If we agree that the ensemble forecast has an error of about an order of magnitude, what can we say about the likelihood of exceeding an intervention level? Sup-pose the error was about two orders of magnitude, what could we say then?” Figure 6-5 shows the output in one case. The left hand figure shows that if the DMs and their advisors feel that the ensemble forecast is pretty accurate, to within half an order of magnitude then the probability of exceeding the intervention level is small and limited to, in this case, France. When the uncertainty in the forecast is higher, 1 or 1.5 orders of magnitude, then the probability is generally higher and the region with sig-nificant probability is much larger, reflecting the greater uncertainty. These plots have been developed based upon the assumption of a lognormal distribution of error. (Ordinary normality is not such a good assumption given that we know that the quantities involved are all non-negative and over much of the region will be zero). Further details are given in Carter and French (2002a, 2003b).

70 Risø-R-1435(EN)
Error ~ 0.5 order of magnitude Error ~ 1 orders of magnitude Error ~ 1.5 orders of magnitude
Figure 6-5. Plot of probability of exceeding some intervention level if the error in the forecast is 0.5, 1 or 1.5 orders of magnitude
In conclusion, the project has addressed the problem of developing plots to inform DMs in their deci-sions on response during emergency management. However, progress has not been as great as had been hoped initially, primarily because of the difficulty of assessing the uncertainty in the forecasts. A secondary problem was that the participating meteorological institutes did not feel that their reports to DMs should be couched in decision making terms with explicit treatment of the inherent uncertainties: see Carter and French (2002c, 2003a, 2003b). None the less, the sensitivity analysis methodology which has been developed does offer a way forward and it is hope that this will be taken up in further developments of the ENSEMBLE web-site and its tools.

Risø-R-1435(EN) 71
7 References
Bazerman M.H. (2001) Managerial decision making. 5th Edition. John Wiley and Sons, New York. Bellasio R., R. Bianconi, G. Graziani and S. Mosca (1999) RTMOD: An Internet based system to ana-
lyse the predictions of long-range atmospheric dispersion models, Computers and Geosciences, 25, 7, 819-833.
Bellasio R., R. Bianconi, S. Galmarini, G. Graziani and S. Mosca (1998) RTMOD: a Web-based real-time statistical evaluation package for long-range dispersion models. Preprints of the 23rd NATO/CCMS International Technical Meeting on Air Pollution and its Application, Varna, Bul-garia, September 29 - October 3 1998, Vol. I, 209-216.
Bianconi R. (2003) Ensemble system and user manual. ENSEMBLE(WG2)-TN(2002)04 Bianconi R., S. Galmarini and R. Bellasio (2003) A WWW-based decision support system for the
management of accidental releases of radio nuclides in the atmosphere. Environmental Modelling and Software, accepted for publication.
Bennett P. and K. Calman, Eds (1999) Risk Communication and Public Health. Oxford University Press.
Brodlie K.W., L. Carpenter, R.A. Earnshaw, J.R. Gallop, R.J. Hubbold, A.M. Mumford, C.D. Osland and P. Quarendon, Eds (1992) Scientific Visualisation: Techniques and Applications. Springer Verlag, Berlin.
Carter E. and S. French (2002a). ENSEMBLE: Design of Decision Makers’ Web Tools. Manchester Business School, University of Manchester, Booth Street West, Manchester, M15 6PB. ENSEMBLE(WG3)TN(02)01
Carter E. and S. French (2002b). A survey on the roles of the meteorological offices in nuclear emer-gency management. Manchester Business School, University of Manchester, Booth Street West, Manchester, M15 6PB. ENSEMBLE(WG3)TN(02)02
Carter E. and S. French (2002c) ‘A survey on the information given to DMs using the ENSEMBLE system in nuclear emergency management’ Manchester Business School, University of Manches-ter, Booth Street West, Manchester, M15 6PB. ENSEMBLE(WG3)TN(02)04.
Carter E. and S. French (2003a) ‘A review of the participant presentations identifying and exploring key uncertainties’ Manchester Business School, University of Manchester, Booth Street West, Manchester, M15 6PB. ENSEMBLE(WG3)TN(03)03.
Carter E. and S. French (2003b). ‘On Presenting ENSEMBLE Predictions and Associated Uncertainty to Decision Makers’. Manchester Business School, University of Manchester, Booth Street West, Manchester, M15 6PB. ENSEMBLE(WG3)TN(02)03. Version 2.2.
Chambers J.M., W.S. Cleveland, W.S. Cleveland, R.B. Kleiner and P.A. Tukey (1983) Graphical Methods for Data Analysis. Wadsworth, Belmont.
Cleveland W.S. (1994) The Elements of Graphing Data. Murray Hill, New Jersey. Cooke R.M. and L.H.J. Goossens (2000) Procedures Guide for Structured Expert Judgement.
EUR 18820 EN, Director General for Research, Commission of the European Communities, Brussels.
Couclelis H. (2003) ‘Certainty of Uncertainty: GIS and the Limits of Geographic Knowledge’, Trans-actions in GIS 7(2)
Evans B.J. (1997) ‘Dynamic display of spatial data reliability: does it benefit the map user?’ Com-puters and Geosciences, 23, 409-422.
French S. (2001) ENSEMBLE: (i) preliminary mathematical specification of statistical development (ii) the cognitive understanding of spatial and temporal plots of dispersion (iii) design of survey of organisational responsibilities and processes. Manchester Business School, University of Manchester, Booth Street West, Manchester, M15 6PB. ENSEMBLE(WG3)-TN(01)01
French S., J. Bartzis, J. Ehrhardt, J. Lochard, M. Morrey, N. Papamichail, K. Sinkko and A. Sohier (2000) rodos: Decision support for nuclear emergencies. In S.H. Zanakis, G. Doukidis and C. Zopounidis (Eds). Recent Developments and Applications in Decision Making, 379-394, Klu-wer Academic Publishers.
72 Risø-R-1435(EN)
French S. and A. Battson (2003) ‘Review and implications of research on the cognitive understanding of uncertainties relating to spatial and temporal plots’ Manchester Business School, University of Manchester, Booth Street West, Manchester, M15 6PB. ENSEMBLE(WG3)-TN(03)01
French S. and C. Bayley (2003) ‘An analysis of the ENSEMBLE exercises from the perspective of deci-sion making’ Manchester Business School, University of Manchester, Booth Street West, Man-chester, M15 6PB. ENSEMBLE(WG3)-TN(03)02.
Girardi F., G. Graziani, D. van Velzen, S. Galmarini, S. Mosca, R. Bianconi, R. Bellasio, W. Klug and G. Fraser ETEX - The European tracer experiment. EUR 18143 EN, pp. 1-108, 1998. Office for Official Publications of the European Communities, Luxembourg.
Goossens L.H.J. and G.N. Kelly (Eds) (2000) Expert Judgement and Accident Consequence Uncer-tainty Analysis. Special issue of Radiation Protection Dosimetry. 90, No 3.
Granger Morgan M. and M. Henrion (1990) Uncertainty: A Guide to Dealing with Uncertainty in Quantitative Risk and Policy Analysis. Cambridge University Press.
Graziani, G. et al. RTMOD: Real-Time MODel evaluation. pp. 1-47, 2000. Denmark, Risø National Laboratory. Risø-R-1174(EN).
Mikkelsen, T. et al. An operational real-time model chain for now- and forecasting of radioactive at-mospheric releases on the local scale. 22. NATO/CCMS international technical meeting , Cler-mont-Ferrand (FR) 2-6 Jun 1997 , 501-508 . In: Air pollution modeling and its application 12. NATO Challenges of Modern Society, 221998.
Mikkelsen, T. et al. MET-RODOS: A comprehensive atmospheric dispersion module. Ra-diat.Prot.Dosim.73 45-561997.
Mosca, S. G. Graziani, W. Klug, R. Bellasio and R. Bianconi (1998a) A statistical methodology for the evaluation of long-range dispersion models: An application to the ETEX exercise. Atmos-pheric Environment, 32, [24], pp. 4307-4324.
Mosca, S. R. Bianconi, R. Bellasio, G. Graziani and W. Klug (1998b) ATMES II - Evaluation of long-range dispersion models using data of the 1st ETEX release. EUR 17756 EN, pp. 1-458. Office for Official Publications of the European Communities, Luxembourg.
Nodop K. (Ed) (1997) ETEX symposium on long range atmospheric transport, model verification and emergency response. Office for Official Publication of the European Commission, Luxembourg. EUR17346EN

Risø-R-1435(EN) 73
8 New Publications resulting from the ENSEMBLE project
Galmarini S. et al. (2003) Can the confidence in long range atmospheric Transport models be in-
creased? The pan European Experience of ENSEMBLE Radiation protection dosimetry (under review)
Bianconi R., Galmarini S., Bellasio R.(2003) Web-based system for decision support in case of emer-gency: In press Journal of Environmental Modelling and Software
R. Addis and R. Buckley (2003) Ensemble atmospheric dispersion modelling for Emergency response consequence assessments Off-site Nuclear Emergency Management: Capabilities and Challenges, Salzburg, Austria, 29/9- 3/10 October 2003, (submitted)
Galmarini S. et al. (2003) Can the confidence in long range atmospheric Transport models be in-creased? The pan European experience of ensemble Off-site Nuclear Emergency Management: Capabilities and Challenges, Salzburg, Austria, 29/9- 3/10 October 2003
Champion H. et al. (2003) Ensemble forecasts of atmospheric dispersion 26th NATO/CCMS interna-tional technical meeting on air pollution modelling and its application, May 26 - 30, 2003 Istan-bul, Turkey.
Mikkelsen, T.; Astrup, P.; Thykier-Nielsen, S.; Jørgensen, H.E., On-going atmospheric dispersion ac-tivities in the field of environmental radiation protection in Europe: Data assimilation, ensemble forecasting, and experimental evaluation studies. In: Program and abstracts. 1. Asian and oceanic congress for radiation protection (AOCRP-1), Seoul (KR), 20-24 Oct 2002. (AOCRP-1 Secre-tariat, Seoul, 2002) p. 87
Mikkelsen, T.; Astrup, P.; Thykier-Nielsen, S.; Jørgensen, H.E., On-going atmospheric dispersion ac-tivities in the field of environmental radiation protection in Europe: Data assimilation, ensemble forecasting, and experimental evaluation studies. In: Radiation protection toward the new horizon (on CD-ROM). 1. Asian and oceanic congress for radiation protection (AOCRP-1), Seoul (KR), 20-24 Oct 2002. (AOCRP-1 Secretariat, Seoul, 2002) 10 p.
Mikkelsen, T.; Galmarini, S., ENSEMBLE system: Ensemble dispersion forecasting and support to decision making. Meeting of the Thematic Network DSSNET, Copenhagen (DK), 4-5 Jul 2002. Unpublished.
Mikkelsen, T., Methods to reconcile disperate national forecasts of medium and long-range atmos-pheric dispersion (ENSEMBLE). In: Decision support for emergency management and environ-mental restoration. Schulte, E.-H.; Kelly, G.N.; Jackson, C.A. (eds.), (Office for Official Publica-tions of the European Communities, Luxembourg, 2002) p. 42-43
Syrakov D. et al. (2002) Description and performance of Bulgarian emergency response system Eight International Conference on Harmonisation within Atmospheric Dispersion Modelling for Regu-latory Purposes. October 14 -17 2002, Rodina Hotel, Sofia, Bulgaria.
Saltbones J. et al. (2002) Inter-comparison of real-time dispersion model results, supporting decision-making in case of nuclear accidents and focusing on quantification of uncertainty. Eight Interna-tional Conference on Harmonisation within Atmospheric Dispersion Modelling for Regulatory Purposes. October 14 -17 2002, Rodina Hotel, Sofia, Bulgaria.
Galmarini S. et al. (2002) ENSEMBLE: real time multi-model ensemble dispersion forecast for nu-clear emergencies. Eight Topical Meeting - Emergency Preparedness and Response.
Washington DC, 17-21 November 2002. Bartnicki J. and J. Saltbones (2002) Scientific and policy oriented applications of the internet tools
developed in the frame of the ENSEMBLE project IIASA workshop, 2002. Galmarini S. et al. (2002) ENSEMBLE: a system for ensemble dispersion forecast in case of nuclear
emergency. European IRPA Congress 2002,Florence 8-11 October, 2002. Galmarini S. et al. (2001) Forecasting the consequences of accidental releases of radionuclides in the
atmosphere from ensemble dispersion modelling. Journal of Environmental Radioactivity, 57, 3, 203-219.

74 Risø-R-1435(EN)

Risø-R-1435(EN) 75
Appendix I: Key to Model Number and Participants
Slide no.
Model number
Model code
Model name Institution Info
01 UK1 NAME British Met Office (United Kingdom)
02 DK1 RODOS Risoe National Laboratory (Denmark) LSMC/MATCH
03 SE1 model name Swedish Meteorological and Hydrological Institute (Sweden)
04 DE1 GME-LPDM Deutscher Wetterdienst (Germany) NWP global model GME
05 FR1 model name Meteo-France (France)
06 AT1 model name Zentralanstalt fuer Meteorologie undGeodynamik (Austria)
07 GR1 model name National Centre for Scientific Research "Demokritos" (Greece)
08 NL1 model name National Institute of Public Health and Environment (The Netherlands)
09 NO1 model name Det Norske Meteorologiske Institutt(Norway)
10 PL1 model name National Institute of Atomic Energy Agency (Poland)
11 DK2 DERMA DMI-HIRLAM-E
Danish Meteorological Institute (Denmark)
DERMA with DMI-HIRLAM-E data (15 km resolution)
12 BE1 model name Institut Royal Meteorologique deBelgique (Belgium)
13 NL2 model name Royal Netherlands Meteorological Institute (The Netherlands)
14 FI1 model name Finnish Meteorological Institute (Finland)
15 US1 LPDM Savannah River Westinghouse (USA)
16 CA1 model name Environment Canada (Canada)
21 DK3 DERMA DMI-HIRLAM-G
Danish Meteorological Institute (Denmark)
DERMA with DMI-HIRLAM-G data (45 km resolution)
22 DK4 RODOS Risoe National Laboratory (Denmark) Stand-alone MATCH
24 DE2 LM-LPDM Deutscher Wetterdienst (Germany) Local Model Limited Area
25 FR2 model name Meteo-France (France)
26 AT2 model name Zentralanstalt fuer Meteorologie undGeodynamik (Austria)
31 DK5 DERMA ECMWF
Danish Meteorological Institute (Denmark)
DERMA with ECMWF dataThis version has not precipitation data, so wet deposition is not correct
Bibliographic Data Sheet Risø-R-1435(EN) EUR 20990 EN
Title and authors
ENSEMBLE Methods to Reconcile Disparate National Long Range Dispersion Forecasts Torben Mikkelsen, Stefano Galmarini, Roberto Bianconi and Simon French ISBN ISSN 87-550-3274-5 87-550-3275-3 (Internet) 0106-2840 Department or group Date
Wind Energy Department November 2003 Groups own reg. number(s) Project/contract No(s)
Sponsorship
Pages Tables Illustrations References 75 1 41 30 Abstract (max. 2000 characters)
ENSEMBLE is a web-based decision support system for real-time exchange and evaluation of national long-range dispersion forecasts of nuclear releases with cross-boundary consequences. The system is developed with the purpose to reconcile among disparate national forecasts for long-range dispersion.
ENSEMBLE addresses the problem of achieving a common coherent strategy across European national emergency management when national long-range dispersion forecasts differ from one another during an accidental atmospheric release of radioactive material.
A series of new decision-making “ENSEMBLE” procedures and Web-based software evaluation and exchange tools have been created for real-time recon-ciliation and harmonisation of real-time dispersion forecasts from meteorologi-cal and emergency centres across Europe during an accident. The new ENSEMBLE software tools is available to participating national emer-gency and meteorological forecasting centres, which may choose to integrate them directly into operational emergency information systems, or possibly use them as a basis for future system development. Descriptors INIS/EDB