ensemble classifier based on optimized feature matrix for …€¦ · · 2018-01-17department of...
TRANSCRIPT

Ensemble Classifier based on Optimized Feature Matrix for Healthcare Dataset
Pratibha Mishra* and Megha Kamble
Department of Computer Science Engineering, LNCT, Bhopal, India
*Corresponding author: [email protected]
ABSTRACT
The mining of health care data is important aspect for the forecast of critical disease like cancer. In health care data mining various tools and techniques are available and applicable from machine learning. Machine Learning offers popular effective technique of classification for the purpose of mining voluminous dataset of health care. This paper implements the different traditional classifiers decision tree, k-nearest neighbor, support vector machine and modified ensemble classifier random forest for classification of health/diseased entities from the UCI data set for Cancer. The paper proposes the feature matrix extracted from majority voting ensemble classifier random forest mapped to SVM. Then it is implemented on three variations of cancer data set. Random forest shows the great results in terms of reduction in features, overfitting by averaging several tree, and also algorithm show less variance by using multiple tree, reduce the chance of stumbling across a classifier that doesn’t perform well because of the relationship between train and test data. In Random Forest, randomness is introduced by identifying the best split feature from a random subset of available features. These available important features further classified by powerful supervised machine learning algorithm named support vector machine. The main purpose of feature selection approach is to select a minimal and relevant feature subset for the given dataset and maintaining its original representation. This approach enhances the performance of SVM classifier and give rise to modified the majority vote ensemble classifier. The proposed hybrid mechanism of random forest feature matrix and SVM classification has shown 1.3% increment in accuracy for reduced cancer data set and this is verified from three reduced cancer data sets. This paper also demonstrates better accuracy of proposed ensemble classifier by comparative analysis with existing classifiers mechanism.
Keywords: Data mining (DM), support vector machine (SVM), decision tree (DT), K-nearest neighbour (KNN), random forest (RF), support vector machine-random forest (SVM-RF).
In the early 1970’s, it was very expensive to store data or information. But due to the advancement within the field of data gathering tools and World Wide Web within the last twenty-five years, we have seen immense quantity of information or of knowledge or data are obtainable in electronic format.
International Journal of Information Science and Computing: 4(2): December 2017: p. 105-120
DOI: 10.5958/2454-9533.2017.00011.4
©2017 New Delhi Publishers. All rights reserved

106
Mishra and Kamble
Print ISSN : 2348-7437 Online ISSN : 2454-9533
To store such a large quantity of information or information the sizes of databases are magnified very quickly. Such type of databases consist very helpful information. It becomes possible with facilitation of knowledge mining or data Discovery in Databases (KDD). Data mining is that the method of extracting the helpful info from an oversize assortment of knowledge that was antecedent unknown[1-2]. A range of relationships are hidden among such oversized assortment knowledge or of information for instance a relationship between patient data and their number of days of keep[3-4]. Classification is a data mining function that assigns items in a collection to target categories or classes. The goal of classification is to accurately predict the target class for each case in the data. For example, a classification model could be used to identify loan applicants as low, medium, or high credit risks. A classifier is a Supervised function (machine learning tool) where the learned (target) attribute is categorical (“nominal”). It is used after the learning process to classify new records (data) by giving them the best target attribute (prediction). The target attribute can be one of k class membership. There are two forms of data analysis that can be used for extracting models describing important classes or to predict future data trends. These two forms are as follows − Classification and Prediction. The Data Classification process includes two steps −Building the Classifier or Model Using Classifier for Classification. In later one, the test data is used to estimate the accuracy of classification rules. The classification rules can be applied to the new data tuples if the accuracy is considered acceptable. The paper implements classifiers KNN, decision tree and SVM on healthcare cancer dataset which is obtained from e-resources. Ensemble methods are learning algorithms that construct a set of classifiers and then classify new data points by taking a (weighted) vote of their predictions. The original ensemble method is Bayesian averaging, but more recent algorithms include error-correcting output coding, Bagging, and boosting. Random forests is an ensemble learning method for classification, regression and other tasks, that operate by constructing a multiple of decision trees at training time and outputting the class that is repetitively occurring with majority. Random forest works on best feature selection which is key technique of classifier. Accuracy of SVM is high as compared to all these techniques. So if feature matrix obtained from RF is mapped to SVM, its performance can be boosted. The paper has suggested and implemented the hybrid mechanism of feature matrix of RF mapped to SVM.Rest of the paper is organised as follows. Related work is detailed in section 2 followed by the problem statement in section 3. Section 4 and 5 describe the system model and proposed methodology and implementation respectively. Section 6 demonstrated the results and their discussion followed by the conclusion as last section of this paper.
RELATED WORK
Literarure described number of classification algorithms for healthcare dataset of cancer. Brief summary is provided as follows:Shamsul Huda et al.[5] presented that Electronic Health Record (EHRs) is providing increased access to attention information that will be created out there for advanced information analysis. This can be employed by the attention professionals to form a lot of informed call providing improved quality of care. However, due to the inherent heterogeneous and imbalanced characteristics of medical information from EHRs, data analysis task faces a huge challenge. The paper addressed the challenges of unbalanced medical information concerning a tumor diagnosing downside. Morpho-metric analysis of histo-pathological images is speedily rising as a valuable diagnostic tool for neuropathology. Oligodendro-glioma is one

107
Ensemble Classifier based on Optimized Feature Matrix for Healthcare Dataset
Print ISSN : 2348-7437 Online ISSN : 2454-9533
type of tumor or brain tumor or neoplasm that incorporates a smart response to treatment provided the tumor subtype is recognized accurately. The genetic variant, 1p-/19q- has recently been found to have high chemo sensitivity, and has morphological attributes that may lend it to machine-controlled image analysis and histologic process and diagnosing. This study aims to achieve a quick, affordable and objective diagnosing of this genetic variant of oligodendroglioma with a novel data processing approach combining a feature choice and ensemble primarily based classification. In this study, 63 instances of brain neoplasm with oligodendroglioma area unit obtained owing to prevalence and incidence of the neoplasm variant. In order to attenuate the effect of an unbalanced attention dataset, a global optimisation primarily based hybrid wrapper-filter feature choice with ensemble classification is applied. The experiment results shows that proposed approach outperforms the customary techniques utilized in tumor classification downside to beat the unbalanced characteristics of medical information.Po-Yen Wu et al.[6] proposed rapid advances of high-throughput technologies and wide adoption of electronic health records (EHRs) have led to quick accumulation. This voluminous complex information contain well-endowed data for exactness drugs, and big information analytics will extract such data to boost the standard of health care. Methods presented associated challenges, and information analytics together with data pre-processing, mining, and modeling. Results demonstrated how massive information analytics allows exactness drugs, in two case studies, including characteristic un-wellness biomarkers from multi-omic information and incorporating omic data into EHR.Ravishankar Rao et al.[7] presented associate analytics toolkit based mostly on open-source modules that facilitate the exploration of aid connected datasets. Framework is illustrated by providing a careful analysis of medical practitioner and hospital ratings information. Our technique should prove valuable to code developers, big-data architects, hospital administrators, policy makers and patients. As an illustration of the capabilities of the toolkit, an arguable issue in the medical field relating to the connection between seniority of medical professionals and clinical outcomes.Satwik Sabharwal et al.[8] proposed big knowledge analytics is primarily the method of analyzing and mining of massive knowledge which might manufacture business and operational information at an unexampled specificity and scale. The paper focuses on the applications and challenges of big knowledge analytics within the attention trade. The requirement of analyzing and leverage clinical knowledge collected by completely different sources is one among the crucial drivers for large knowledge analysis tools within the attention trade. The Big knowledge analytics plays an important role in raising the health conditions of the folks and prevents them from major medical problems once used with wisdom.Zoubida Alaoui Mdaghri et al.[9] proposed data Mining for massive information within the framework of health care. Furthermore, the Data Mining for accumulated information is investigated. Especially, their complexities of the many fields of health and medical analysis. Finally, machine learning algorithms have been utilized in order to check processing health care information.Ankit Agrawal et al.[10] presented associate article. In this article presented, Understanding the prognosis of older adults is a big challenge in health care analysis, especially since very little is understood concerning how completely different co-morbidities move and influence the prognosis. Recently, an electronic healthcare records dataset of twenty four patient attributes from Northwestern Memorial Hospital was used to develop prognosticative models for five year survival outcome. In this study, we analyze constant information for locating hotspots with relation to five year survival victimization association rule mining techniques. The goal here is to identify characteristics of patient segments where the five year survival

108
Mishra and Kamble
Print ISSN : 2348-7437 Online ISSN : 2454-9533
fraction is considerably lower/higher than the survival fraction across the complete dataset. A two-stage post-processing procedure was used to identify non-redundant rules. The resulting rules adapt to existing medicine data and offer attention-grabbing insights into prognosis of older adults. Incorporating such information into clinical call creating might advance person-centered health care by encouraging optimum use of health care services to those patients presumably to profit.Mario Bochicchio et al.[11] proposed multidimensional mining approach, targeted to complex health care environments. A preliminary analysis on the effectiveness of the framework is also projected.Haoyi Cui et al.[12] presented the numerical validation with a health care dataset demonstrates that health care fraud by misdiagnosis in healthcare treatments will be with success detected by using the developed fraud detection approach.Literature demonstrated various classification methods but there is scope of improvement of accuracy by combining good features of mechanisms.
PROBLEM STATEMENT
Healthcare dataset consists of various disease datasets and freely available on internet for research purpose. The datasets are developed by different mechanisms consists of diseased and health classes of patients. Cancer dataset is most widely studied and consists of malignant and benign classes. Classification technique is measured in terms of accuracy percentage and prediction of number of diseased cases from a cumulative dataset.Decision tree classifier is having limitation of variance and outfitting. Although random forest ensemble classifier is more accurate and along horizontal dimension, it can provide widespread accuracy. Generation of multiple trees is time consuming and space consuming. But best part of RF is best feature selection set. Accuracy of SVM classifier is better as compared to other classifiers.So there is requirement of best possible ensemble classifier by combining good feature of existing classification techniques to implement it on Cancel healthcare dataset so as to produce more accurate outcome.With this objective, RF feature extraction is mapped to SVM to increase accuracy of classification of cancer dataset.
SYSTEM MODEL
We used the following classifiers available in MATLAB 14.0b for a series of complete tests with outcomes presented in this paper.1. K-Nearest Neighbor’s: In pattern recognition, the k-nearest neighbor’s algorithm (k-NN) is a non-parametric method used for classification and regression. In both cases, the input consists of the k closest training examples in the feature vector. The output depends on whether k-NN is used for classification or regression:
� In k-NN classification, the output is a class membership. An object is classified by a majority vote of its neighbors, with the object being assigned to the class most common among its k nearest neighbors (k is a positive integer, typically small). If k = 1, then the object is simply assigned to the class of that single nearest neighbor.

109
Ensemble Classifier based on Optimized Feature Matrix for Healthcare Dataset
Print ISSN : 2348-7437 Online ISSN : 2454-9533
� In k-NN regression, the output is the property value for the object. This value is the average of the values of its k nearest neighbors.
K-NN is a type of instance based learning, or lazy learning, where the function is only approximated locally and all computation is deferred until classification. The k-NN algorithm is among the simplest of all machine learning algorithms.Both for classification and regression, a useful technique can be to assign weight to the contributions of the neighbors, so that the nearer neighbors contribute more to the average than the more distant ones. For example, a common weighting scheme consists in giving each neighbor a weight of 1/d, where d is the distance to the neighbor.The neighbors are taken from a set of objects for which the class (for k-NN classification) or the object property value (for k-NN regression) is known. This can be thought of as the training set for the algorithm, though no explicit training step is required.A peculiarity of the k-NN algorithm is that it is sensitive to the local structure of the data. The algorithm is not to be confused with K-means, another popular machine learning technique.The training examples are vectors in a multidimensional feature space, each with a class label. The training phase of the algorithm consists only of storing the feature vector and class labels of the training samples.In the classification phase, k is a user-defined constant, and an unlabeled vector (a query or test point) is classified by assigning the label which is most frequent among the k training samples nearest to that query point.A commonly used distance metric for continuous variables is Euclidean distance. For discrete variables, such as for text classification, another metric can be used, such as the overlap metric (or Hamming distance). In the context of gene expression microarray data, for example, k-NN has also been employed with correlation coefficients such as Pearson and Spearman. Often, the classification accuracy of k-NN can be improved significantly if the distance metric is learned with specialized algorithms such as large margin nearest neighbor or neighborhood components analysis. The major drawback of K-NN has need to determine value of parameter K (number of nearest neighbor) distance based learning not clear like which kind of distance to use and which attribute to use to produce the best results. Also computational cost is quite high because we need to compute distance of each query instance to all training sample.2. Decision Tree: Decision tree is one of the classification methods, which classify the labeled trained data into a tree or rules. Once the tree or rules are derived in learning phase to test the accuracy of a classifier test data is taken randomly from training data. After Verification of accuracy, unlabeled data is classified using the tree or rules obtained in learning phase. The structure of a decision tree is similar to the tree with a root node, a left sub tree and right sub tree. The leaf nodes in a tree represent a class label. The arcs from one node to another node denote the conditions on the attributes. The Tree can be built as[7]:
� The selection of attribute as a root node is done based on attribute splits. � The decisions about the node to represent as terminal node or to continue for splitting the node. � The assignment of terminal node to a class.
The attribute splits depends on the impurity measures such as Information gain, gain ratio etc. Once the tree is built then it is pruned to check for over fitting and noise. Finally the tree is an optimized tree

110
Mishra and Kamble
Print ISSN : 2348-7437 Online ISSN : 2454-9533
.The advantage of tree structured approach is easy to understand and interpret, handles categorical and numeric attributes, robust to outliers and missing values. Decision tree classifiers are used extensively for diagnosis of diseases such as breast cancer, ovarian cancer and heart sound diagnosis and so on. The main disadvantage of using classifier like decision tree mainly for data including categorical variable with different number of levels, information gain in decision tree is biased in favor of those attribute with more levels. Also calculation can gets very complex, particularly if many value are uncertain. Precisely decision tree has data set overfitting and variance problem.3. Random Forest: Random forest is an ensemble classifier that consists of many decision trees. The output of the classes is represented by individual trees. The random forest inducing algorithm is developed by Leo Breiman and Adele Cutler and it is their trademark. It is derived from random decision a forest that was proposed by Tin Kam Ho of Bell Labs in 1995. This method combines with random selection of features to construct a decision trees with controlled variations. The tree is constructed using algorithm discussed below:
1. Let N be the number of training classes and M be the number of variables in classifier.2. The input variable m is used to determine the node of the tree. Note that m<M3. Choosing n times of training sets with the replacement of all available training cases N. by predicting
the classes, estimate the error of the tree.4. Choose m variable randomly for each node of the tree and calculate the best split.5. At last the tree is fully grown and it is not pruned.
The tree is pushed down for predicting a new sample. When the terminal node is ends up the label is assigned the training sample. This procedure is iterated over all trees ad it is reported as random forest prediction.4. SVM (Support Vector Machine): Support vector Machine is binary classifier, the performance of classification of support vector machine is high in compression of another binary classifier such as decision tree, KNN and bay’s classifier. Support Vector Machine (SVM) is a novel machine learning[8] method based on statistical learning theory developed by V.N. Vapnik, and it has been successfully applied to numerous classification and pattern recognition problems such as text categorization, image recognition and bioinformatics. The concept of SVM is to transform the input vectors to a higher dimensional space Z by a nonlinear transform, and then an optical hyperplane which separates the data can be found. This hyperplane should have the best generalization capability. As shown in Fig. 1, the black dots and the white dots are the training dataset which belong to two classes.The Plane H series are the hyperplanes to separate the two classes. The optical plane H is found by maximizing the margin value
H2
H1
H2 H0
Margin=2/||w||
H2
Fig. 1: The SVM binary classifications

111
Ensemble Classifier based on Optimized Feature Matrix for Healthcare Dataset
Print ISSN : 2348-7437 Online ISSN : 2454-9533
2/|w|. Hyperplanes H1 and H2 are the planes on the border of each class and also parallel to the optical hyperplane H. The data located on H1 and H2 are called support vectors.The development of a SVM classification model depends on the selection of kernel function K. There are several kernels that can be used in Support Vector Machines models. These include linear, polynomial, radial basis function (RBF) and sigmoid function:
deg
2
( )( , )
exp( | |
tanh( )
Ti j
T reei j
i ji j
Ti j
x x Linear
x x coefficient PolynomialK x x
x x RBF
x x coefficient Sigmoid
γγ
γ
+= − − +
The RBF is by far the most popular choice of kernel types used in Support Vector Machines. This is mainly because of their localized and finite responses across the entire range of the real x-axis.Improper kernel function might generate poor performance. Currently there is no effective “learning” method to choose a proper kernel function for a specific problem. The selection is decided by the experiment result at this time. In our proposed system, two kernel functions are tested: Radial Basis Function-RBF and Polynomial Function.
ppoly xxxxK )1*(),( 2121 +=
)||||exp(),( 22121 xxpxxK RBF −−=
5 . E n s e m b l e Vo t e Classifier: The Ensemble Vote Classifier is a meta-classifier for combining similar or conceptually d i f f e r e n t m a c h i n e learning classifiers for classification via majority or plurality voting. (For simplicity, we will refer to both majority and plurality voting as majority voting.)The Ensemble Vo te Classifier implements “hard” and “soft” voting. In hard voting, we predict the final class label as the class label that has been predicted most frequently by the classification models. In soft voting, we predict the class labels by averaging the class-probabilities (only recommended if the classifiers are well-calibrated).Voting in which the class predicted by majority of the models is selected. In Voting no learning takes place at the Meta level, as the final classification is decided by the majority of votes casted by the base level classifiers.

112
Mishra and Kamble
Print ISSN : 2348-7437 Online ISSN : 2454-9533
Training Set
Classification Models C1 C2 Cm…………………
Prediction P1 P2 ……………… Pm
VOTING
PfFinal Prediction
NewData
Fig. 2: The Majority Vote Ensemble Strategy
PROPOSED METHODOLOGY
The main purpose of an ensemble methodology is to combine a set of models, each of which solves the same original problem, in order to obtain a better composite global model with more accurate and reliable estimates or decisions than obtained from using a single model.
The learning procedure for majority vote ensemble algorithms can be divided into the following two parts:
1. Constructing base classifiers/base models: the main tasks of this division are:a. Data processing: prepare the input training data for building base classifiers and attributes
selection to reduce the dimensionality of the attributes[12].a. Base classifier constructions: build base classifiers on the data set with a learning algorithm[13].
2. Voting: the second stage of ensemble methods is to combine the base classifiers models built in the previous step into the final ensemble model.
In this paper presented the majority vote ensemble classifier using random forest and support vector machine. Basically Random forest is an ensemble method in which a classifier is constructed by combining several different Independent base classifiers. The independence is theoretically enforced by training each base classifier on a training set sampled with replacement from the original training set. In Random Forest, further randomness is introduced by identifying the best split feature from a random

113
Ensemble Classifier based on Optimized Feature Matrix for Healthcare Dataset
Print ISSN : 2348-7437 Online ISSN : 2454-9533
subset of available features. These random subset of available feature further classified by the support vector machine as shown in Fig. 3.
HealthCare
Data-sets
TrainingPhase
TestingPhase
RANDOM FOREST
SVM(RBF)
Ensemble SVM-RF
1NN1
2NN2
3NN3
.
.
.
.
.
MNN-M
Class 1 N1
Class 2 N2..
Class M NM
Class M+1 NN1
Class M+2 NN2
.
.
Class 2M NN-M
Class 1
2
3
4........
2M
RecurrentPatient Record
RecurrentPatient Record
Fig. 3: Architecture of the proposed Classification aided by the ensemble
Algorithm: The steps of the proposed Random Forest based data feature selection for SVM (RF-SVM) are as follows:
1. Set number of classes = N, Number of features = M2. Let m determine the number of features at a node of decision tree (m<M)3. For each decision tree do.4. Select randomly: a subset (with replacement) of training data that represent the N classes and use
the rest of data to measure the error of the tree.5. For each node of this tree do.6. Select randomly: m feature to determine the decision at this node and calculate the best split
accordingly.7. Iterate and check feature matrix for processing of SVM mapping.
The relevance of a feature set S for the class c is defined by the average value of all mutual.
( ) ( ), 1/ | | ,fi S
F S c S I fi c∈
= ∑
8. Finally, feature matrix is passed to SVM algorithm for obtaining final class results. The points xi in Feature space S for class c, are mapped to hyperplane
( ), Constantik xi xΣ ∝ =
9. SVM mathematical formula, two kernel functions are tested, Radial Basis Function-RBF and Polynomial Function.

114
Mishra and Kamble
Print ISSN : 2348-7437 Online ISSN : 2454-9533
1 2 1 2( , ) ( * 1) ppolyK x x x x= +
21 2 1 2( , ) exp( || || )RBFK x x p x x= − −
10. END.
A. Performance Evaluation
The present study adopted method to measure the performance of the adopted model, which consist of various parameters’ confusion matrix, Precision and Recall, Accuracy and Error-Rate.
1. Confusion Matrix
onfusion matrix is the matrix consist of S*S matrix, in which various variables of ‘S’ column represent attributes of dataset index and ‘S’ rows. This tool allows analyzing efficiency of the classifier from different classes. Table 1 represents a general structure of the confusion matrix of the predicted and actual class for a given dataset.
Table 1: Confusion MatrixActual Predicted
Positive Negative
Positive True Positive False Negative
Negative False Positive True Negative
2. Precision and Recall
The fundamental element, i.e. Precision and Recall, allows to measure text performances. The algorithm which classifies the data accordingly referred as precision and if the precision value is 1.000, it indicates 100 percent accuracy[13].
Sensitivity (%) = 100TP
TP FN×
+
Specificity (%) = 100TN
FP TN×
+
Precision = TP
TP FP+
However, recall value is considered as the percentage of class relevant information which is classified correctly.
Recall = TP
TP FN+

115
Ensemble Classifier based on Optimized Feature Matrix for Healthcare Dataset
Print ISSN : 2348-7437 Online ISSN : 2454-9533
3. Accuracy
Accuracy is defined in the terms of correctly classified instances divided by the total number of instances present in the dataset[13].
Accuracy (%) = 100TP TN
TP FP TN FN
+ × + + +
Where TP- True Positive, FP- False Positive, TN- True Negative, FN- False Negative.
TP Rate
It is the ability which is used to find the high true positive rate. The true positive rate is also called as sensitivity[13].
TPR = TP
TP FN +
Error-Rate
The misclassification rate of the test set is known as the error rate[13].
Re = 1 – Acc (M)
Where R is the Error rate, Acc (M) is the Accuracy of the selected variables
RESULTS AND DISCUSSION
Datasets: This research work proposes the disease diagnosis model for Cancer disease. Datasets are taken from UCI Machine Learning Repository. The details of datasets are shown in Table 2. It is clear from Table 2 that all the three datasets contain a different number of instances in each class and imbalance in nature. Imbalance ratio is calculated by taking the ratio of number of data points of majority class with minority class. For Cancer-I, one class contains 241 and the other contains 458 instances. The numbers of features in Cancer is 9. For Cancer-II, one class contains 241 and the other contains 458 instances. The numbers of features in Cancer is 11. For Cancer-III, one class contains 268 and the other contains 500 instances. The numbers of features in Cancer is 20.
Table 2: Data sets Details
Data set No. of Features No. of Positive Instance No. of Negative Instance
Imbalance Ratio
Cancer-I 09 241 458 1.9Cancer-II 11 241 458 1.9Cancer-III 20 268 500 1.8

116
Mishra and Kamble
Print ISSN : 2348-7437 Online ISSN : 2454-9533
Simulation Results
Fig. 4: Shows that the initially empty window for implementation to classify the data using various classifier
The research used the MATLAB software to classify the dataset by using five classifiers and to determine the performance metrics, i.e. specificity, sensitivity and accuracy.
Table 3: Comparison of Different Classifier Results of the Selective Attributes (CANCER-1)Parameter
MethodsACC. MAE MRE TIME
DT 87.08 21.20 30.67 13.99
KNN 86.18 22.00 31.59 13.96
SVM 97.18 20.50 20.47 14.89
RF 98.18 20.00 27.02 14.42
SVM-RF 99.96 19.89 23.77 15.36
Table 4 and 5 presented the comparison results of the selective attributes (CANCER-I) and (CANCER-II) of dataset in terms of accuracy, mean absolute error and mean relative error and elapsed time using different classifier and combining classifier. In this table depicted or describe the results of different classifier like decision tree, k-Nearest Neighbor (KNN), Support Vector Machine (SVM), and Random Forest, and combination of classifier SVM-RBF and Random Forest.As per the above depicted table we conclude that the accuracy determine by the classification technique (SVM-RF) Ensemble method was highest among technique or data mining approach. In this table we describe the accuracy, mean absolute error, mean relative error and elapse time using different data mining approaches.
117
Ensemble Classifier based on Optimized Feature Matrix for Healthcare Dataset
Print ISSN : 2348-7437 Online ISSN : 2454-9533
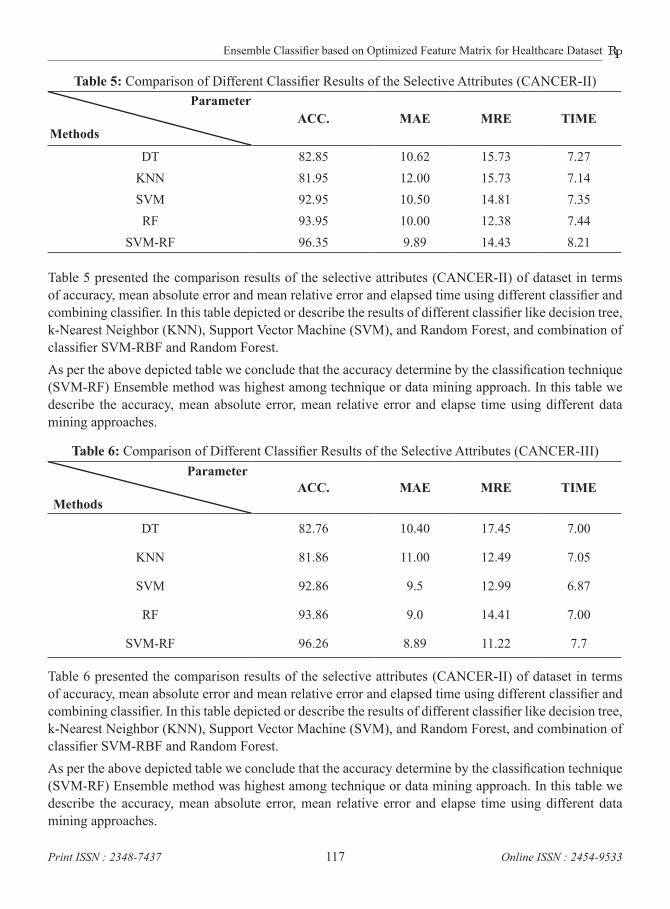
Table 5: Comparison of Different Classifier Results of the Selective Attributes (CANCER-II)Parameter
MethodsACC. MAE MRE TIME
DT 82.85 10.62 15.73 7.27KNN 81.95 12.00 15.73 7.14SVM 92.95 10.50 14.81 7.35RF 93.95 10.00 12.38 7.44
SVM-RF 96.35 9.89 14.43 8.21
Table 5 presented the comparison results of the selective attributes (CANCER-II) of dataset in terms of accuracy, mean absolute error and mean relative error and elapsed time using different classifier and combining classifier. In this table depicted or describe the results of different classifier like decision tree, k-Nearest Neighbor (KNN), Support Vector Machine (SVM), and Random Forest, and combination of classifier SVM-RBF and Random Forest.As per the above depicted table we conclude that the accuracy determine by the classification technique (SVM-RF) Ensemble method was highest among technique or data mining approach. In this table we describe the accuracy, mean absolute error, mean relative error and elapse time using different data mining approaches.
Table 6: Comparison of Different Classifier Results of the Selective Attributes (CANCER-III)Parameter
MethodsACC. MAE MRE TIME
DT 82.76 10.40 17.45 7.00
KNN 81.86 11.00 12.49 7.05
SVM 92.86 9.5 12.99 6.87
RF 93.86 9.0 14.41 7.00
SVM-RF 96.26 8.89 11.22 7.7
Table 6 presented the comparison results of the selective attributes (CANCER-II) of dataset in terms of accuracy, mean absolute error and mean relative error and elapsed time using different classifier and combining classifier. In this table depicted or describe the results of different classifier like decision tree, k-Nearest Neighbor (KNN), Support Vector Machine (SVM), and Random Forest, and combination of classifier SVM-RBF and Random Forest.As per the above depicted table we conclude that the accuracy determine by the classification technique (SVM-RF) Ensemble method was highest among technique or data mining approach. In this table we describe the accuracy, mean absolute error, mean relative error and elapse time using different data mining approaches.

118
Mishra and Kamble
Print ISSN : 2348-7437 Online ISSN : 2454-9533
0
20
40
60
80
100
120
87.08
21.230.6
0
0
0
0
0
0
0
DT
Co
86.18
26713.99
omparison Ch
2231.59
13.96
KNN
hart in terms oCANC
Accuracy
97.18
20.520.47
14.8
SVM
of Accuracy, MCER-I (Datase
MAE MRE
98.18
202789
RF
MAE, MRE anet)
TIME
99.96
7.0214.42
nd Time for
6
19.8923.77
15.36
SVM-RF
Fig. 5: The comparison chart of different method for CANCER-I dataset
0
20
40
60
80
100
120
82.85
10.6215.737
DT
Co
81.95
137.24
omparison Ch
9
215.737.14
KNN
hart in terms oCANC
Accuracy
92.95
10.514.81
7.35
SVM
of Accuracy, MCER-II (Datase
MAE MRE
93.95
10125
RF
MAE, MRE anet)
TIME
96.
2.387.44
F
nd Time for
35
9.8914.43
15.3
SVM-RF
6
Fig. 6: The comparison chart of different method for CANCER-II dataset
0
20
40
60
80
100
120
82.76
10.417.45
DT
Co
81.86
157
omparison Ch
9
112.497.05
KNN
hart in terms oCANCE
Accuracy
92.86
9.512.99
6.87
SVM
of Accuracy, MER-III (Datas
MAE MRE
93.86
9 147
RF
MAE, MRE anset)
TIME
96.
4.41 7
F
nd Time for
26
8.8911.22
7.7
SVM-RF
Fig. 7: The comparison chart of different method for CANCER-III dataset

119
Ensemble Classifier based on Optimized Feature Matrix for Healthcare Dataset
Print ISSN : 2348-7437 Online ISSN : 2454-9533
Figs. 5, 6 and 7 shows the comparison chart of different ensemble method for cancer-I, cancer-II and cancer-II data set. From these figures concluded that the proposed majority vote ensemble algorithm SVM-RF achieved better accuracy than other ensemble approach. The proposed approach gives 99.96 percent accuracy for reduced dataset and 96.35 percent for original dataset.
CONCLUSION
This paper apply classification proceed based on classifier selection to medical disease data and propose a majority vote Ensemble-based classifier selection method. In the method, many classification are selected for an ensemble process. The process of combining different classification output emerged as an alternative approach for improving the quality of the Results of majority vote ensemble algorithms. It is based on the success of the combination of supervised classifiers. Classification of medical data is an important task in the prediction of any disease. It even helps doctors in their diagnosis decisions. In this paper we applied different data mining classification approach like decision tree, KNN, random forest and SVM. In this paper we combine the SVM-RBF with random forest classifier and proposed the majority vote ensemble classification technique for healthcare or cancer dataset and compare their results with other classification mechanism like decision tree, SVM-RBF, random forest, and KNN and get results in terms of accuracy, mean absolute error, mean relative error and elapse time for different datasets of cancer. Our proposed (SVM-RF) system achieved 99.96 percent for cancer-I (Reduced data set) and 96.35 percent for cancer-II and 96.26 percent for cancer-III (Original or large data set) in terms of accuracy. The our proposed majority vote ensemble classifier shows the better accuracy than the twin SVM approach and it has shown 1.3% improvement for reduced data set using optimized SVM mechanism.
REFERENCES
1. Hand, D., Mannila, H. and Smyth, P. 2001. “Principles of data mining”, MIT.
2. Koh, H.C. and Tan, G. 2005. “Data Mining Application in Healthcare”, Journal of Healthcare Information Management, 19(2).
3. Fayyad, U., Piatetsky-Shapiro, G. and Smyth, P. 1996. “The KDD process of extracting useful knowledge form volumes of data.commun.”, ACM, 39(11): 27-34.
4. Han, J. and Kamber, M. 2006. “Data mining: concepts and techniques”, 2nd ed. The Morgan Kaufmann Series.
5. Shamsul Huda, John Yearwood, Herbert F. Jelinek, Mohammad Mehedi Hassan, Giancarlo Fortino, Michael Buckland, 2016. “A hybrid feature selection with ensemble classification for imbalanced healthcare data: A case study for brain tumor diagnosis”, IEEE Early Access.
6. Po-Yen Wu, Chih-Wen Cheng, Chanchala D. Kaddi, Janani Venugopalan, Ryan Hoffman, and May D. Wang, 2016. “Omic and Electronic Health Records Big Data Analytics for Precision Medicine”, IEEE TRANSACTION ON BIOMEDICAL.
7. Ravishankar Rao, A. and Daniel Clarke, 2016. “A fully integrated open-source toolkit for mining healthcare big-data: architecture and applications”, IEEE.

120
Mishra and Kamble
Print ISSN : 2348-7437 Online ISSN : 2454-9533
8. Satwik Sabharwal, Samridhi Gupta, and Thirunavukkarasu, K. 2016. “Insight of Big Data Analytics in Healthcare Industry”, IEEE.
9. Zoubida Alaoui Mdaghri, Mourad El Yadari, Abdelillah Benyoussef and Abdellah El Kenz, 2016. “Study and analysis of Data Mining for Healthcare”, IEEE.
10. Ankit Agrawal, Jason Scott Mathias, David Baker, and Alok Choudhary, 2016. “Identifying Hot-Spots in Five Year Survival Electronic Health Records of Older Adults”, IEEE.
11. Mario Bochicchio, Alfredo Cuzzocrea, and Lucia Vaira, 2016. “A Big Data Analytics Framework for Supporting Multidimensional Mining over Big Healthcare Data”, IEEE.
12. Haoyi Cui, Qingzhong Li, Hui Li, Zhongmin Yan, 2016. “Healthcare Fraud Detection Based on Trustworthiness of Doctors”, IEEE.
13. Divya Tomar and Sonali Agarwal, 2016. “Hybrid Feature Selection Based Weighted Least Squares Twin Support Vector Machine Approach for Diagnosing Breast Cancer, Hepatitis, and Diabetes”, Hindawi Publishing Corporation Advances in Artificial Neural Systems.