enrollment management plan 2015-2020 - university of … · 2016-12-02 · strategic enrollment...
TRANSCRIPT

UNIVERSITY OF MICHIGAN-FLINT
STRATEGICENROLLMENTMANAGEMENT PLAN
2015-2020PREPARED BY THE UM-FLINT SEM DATA TEAM, MARCH 2016

TABLE OF CONTENTS3 Letters from Chancellor, Provost, and Vice Chancellors
4 Executive Summary/Introduction
5 Environmental Scan
5 Campus Overview
5 Mission
5 Maguire Research: 2012 Marketing Research Findings
7 State,National,andInternationalProfile
7 Enrollment in Michigan Colleges and Universities
8 Reduction in High School Graduates: United States and Michigan
10 Reduction in High School Graduates: Local
11 Demand for Undergraduate Education
11 Demand for Graduate Programs
12 Downward Trend in Community College Enrollments
13 General Population Changes and Shifts
14 Trends in Graduate Enrollment by Discipline
16 InternationalStudentProfile
17 Cost, Affordability, and Regulatory Impact
17 Regulatory Impact
17 Affordability and State of Michigan Funding
20 Howundergraduatestudentsfinancetheireducation
22 Howgraduatestudentsfinancetheireducation
22 National Trends in Online Education
23 Challenges to Online Enrollment Growth Strategies
23 The Rapidly Shifting Technology Landscape for Students
24 Recruiting Environment
24 Traditional FTIAC
26 Recruiting Graduate and Adult Students
27 Recruiting International Students
28 EnrollmentProfile
28 Overall
28 Undergraduate
29 Graduate
29 International
30 Goals and Strategies
30 Recruitment
31 Retention
32 Enrollment targets
33 Appendix A: Freshman Merit Scholarship Program
34 Appendix B: SEM Committee Membership
UNIVERSITY OF MICHIGAN-FLINT
STRATEGICENROLLMENTMANAGEMENT PLAN
2

LETTER FROM CHANCELLORDear Faculty and Staff,
As a regional comprehensive University, our commitment to students and their active engagement in the process and content of discovery and learning within our academic, local, and global communities is our central mission. We embrace this focus on engaged learning and student success. Our opportunity as the University of Michigan-Flint community centers on having high expectations for our students and ourselves. Our success as educators within this learning community depends on collective strategic vision supported by targeted and sustained actions. Our best choices are grounded in national research and ongoing assessment linked to student learning and organizational outcomes. Our effectiveness will be measured by increased academic excellence, demonstrated learning outcomes, greater student satisfaction, and higher graduation rates.
To answer some of these questions, the University of Michigan-Flint, through the stewardship of faculty and staff leaders with input from students, has invested the past eighteen months in a period of discovery and discussions resulting in this Strategic EnrollmentManagementPlan.Theidentifiedstrategicprioritiesandinitiativeshavebeenformulatedthroughextensivedataand process analyses focused on our approaches and performance to-date. With the challenges of changing demographics, declining number of high school students, and increasing competition, we must all focus on recruitment of students who are well-matched to our academic programs, outstanding services that help them to thrive here, and on their success in meeting their educational, personal, and career goals. The Strategic Enrollment Management Plan provides the map for our individual and collective actions grounded in best practices to advance student success.
Thank you to those who have invested your time and talent to this planning process. I look forward to working with each of you inourUM-FlintCommunityaswecontinuetobuilduponoursuccesses,learnfromreflections,andembracethefuturewithasense of urgency guided by clarity of vision and action.
Susan E. Borrego, Ph.D.Chancellor
STRATEGIC ENROLLMENT MANAGEMENT PLAN, 2015-2020
JOINT LETTER FROM PROVOST AND VICE CHANCELLOR FOR ACADEMIC AFFAIRSAND VICE CHANCELLOR FOR CAMPUS INCLUSION AND STUDENT LIFEThe University of Michigan-Flint embarked upon a Strategic Enrollment Management (SEM) process in the fall of 2014 under the leadership of Chancellor Susan E. Borrego. SEM, in alignment with an institution’s Strategic Plan, is an organizational mindset focused on internal student success and experiences and the external environment with the ultimate objective of increasing retention and graduation rates. Faculty and staff from Academic Affairs, Business & Finance, and Student Affairs ensured broad and enthusiastic participation in SEM planning from data collection to the development of goals and strate-gies. Dr. Tom Green, Associate Executive Director of AACRAO for Consulting and SEM, provided expert guidance throughout the planning phases to the Data, Recruitment, and Retention Committees. Months of intense information gathering, bench-marking, and data analysis culminated with a set of goals that provide the best possible opportunity of enrolling an optimal mix of students while maximizing student success.
For sixty years, the University of Michigan-Flint has met the challenges of the future in advancing our mission of academic excellence, student centeredness, and engaged citizenship. While steadfast in our commitment, UM-Flint is not immune to the myriad challenges facing higher education today. This document, our Strategic Enrollment Plan, meets the future head-on with the same courage, fearlessness, and optimism that has marked the history of our campus. Shaped by dynamic and collaborative campus leaders and assisted by hundreds of our colleagues from every part of the University, the Strategic Enrollment Plan provides a roadmap for meeting our enrollment objectives, enhancing student success, and assuring a vi-brant,engaged,andfiscally-soundUniversityforfuturestudents,faculty,andstaff.Weknowthiscommunitywillmeetthechallengesaheadwiththesamespirit,values,anddedicationthathavedefinedourhistoryandwillcontinuetochartoursuccessful future.
Doug Knerr, Ph.D.Provost and Vice Chancellor for Academic Affairs
Barbara Avery, Ed.D.Vice Chancellor for Campus Inclusion and Student Life
3

EXECUTIVE SUMMARY/INTRODUCTIONThe University of Michigan-Flint’s Strategic Enrollment Management Plan achieves a number of crucial functions in moving ourcampusforwardtofulfillingourcommitmenttoexcellenceinteaching,learning,andscholarship;studentcenteredness;and engaged citizenship. First, the Environmental Scan provides the campus with a solid empirical foundation upon which the plan’s goals and tactics are grounded. In short, the institution faces demographic headwinds and increased competition forstudentswithinacontextofconstrainedbudgetsandfinanciallystretchedstudentsandfamilies.TheEnvironmentalScanalso underscores the opportunities to mitigate these downward pressures on enrollment through the strategic development ofnewprograms,expansionofourrecruitmentfootprint,theleveragingoffinancialaidtoprospectivestudents,andthede-velopment of clear pathways for our transfer students. Data shared with the campus community also included an assessment onourretentionoffirst-andsecond-yearstudents,andcametothesoberingconclusionthatsome40to50percentofallfreshmen leave our University after two years. Therefore, the SEM plan naturally frames its goals, strategies and tactics within the two themes of recruitment and retention.
ThesecondroletheUniversity’sSEMplanfulfills isthatitplacesinmotionconcreteactionstoachievethehighestprioritiesofthe2011-2016StrategicPlan.Accordingly,theSEMplaninnofashionreplacesthesepriorities;andinfacttheSEMplanenhances, supports, and places greater institutional commitment to achieving the goals of the Strategic Plan. By developing newprogramsattheundergraduateandgraduatelevels,includingonlineprograms,thecampuswilladvanceitsfirstprior-ity of enhancing the quality and breadth of its academic programs. Supporting disciplinary and interdisciplinary teaching, scholarship and creative activity, and the expansion of faculty professional development (priority number two) will promote greater student engagement and advance both the recruitment and retention goals of the SEM plan. The University is deeply committedtothesuccessofallitsstudents.Bypursuingthestrategiestoincreasefirst-year,second-yearandtransferstudentretention,theSEMplanwilldeliverontheStrategicPlan’sfifthpriorityoffulfillingourstudent-centeredmissionasweserveagrowing and increasingly diverse student body. Finally, the SEM plan is the University’s blueprint to achieve the seventh priority of our strategic plan: increase enrollment, student retention, and degree completion to achieve planned growth. In addition to squarely aligning with the institution’s Strategic Planning Prioritization, the goals and strategies of the SEM plan underscore the interdependence and complementarity of the University’s top-four Strategic Plan priorities.
AlthoughtheofficialreleaseoftheUniversity’sStrategicEnrollmentManagementplanisthemostcompletearticulationoftheinstitution’sgoals,strategies,andtacticsdesignedtoenhancerecruitmentandretention,itisbynomeansthefirsttimetheenvironmental scan and accompanying goals and strategies for recruitment and retention have been shared with the Uni-versity of Michigan-Flint community. This introduction provides an opportunity to emphasize the extensive planning and wide University engagement that accompanied the development of our SEM plan. The development of a Strategic Enrollment Management plan began in the fall of 2014, and included a presentation of the SEM Core Concepts on December 9, 2014. TheWintersemesterrepresentsafive-monthperiodinwhichtheRecruitmentandRetentionCouncilsformulatedtheirgoalsandstrategiesandsharedthemwidelyattheTownHallPresentationsonMay21and27,2015asoverone-hundredmem-bers of the University of Michigan-Flint community were present at each forum (see Appendix B for a listing of committees’ membership).The2015-16academicyearbeganwithareiterationoftheSEMplan’sgoalsandstrategiesattheUniversity’sAugust27Forum,whichalsodrewoverone-hundredinterestedindividuals.Duringthefallsemesterof2015,thesubcommit-tees worked diligently to articulate the tactics included in this report. The Goals, Strategies, and Tactics in this publication were approved by the SEM Steering Committee on February 9, 2016. With the formulation and approval of the University’s SEM plan, the emphasis of the work now pivots to implementation.
Thedistributionof theUniversity ofMichigan-Flint’s approved Strategic EnrollmentManagementplan fulfills the final andperhaps most important function of providing the campus with a clear vision of how we will collectively address the recruit-ment and retention challenges articulated in the environmental scan. Between now and 2020, groups of faculty, staff, and members of the University leadership will collaborate on the numerous tactics listed within the various strategies designed to achieve our recruitment and retention goals. The SEM Steering Committee will continue to provide regular campus updates, and there will be ample opportunity to collectively take stock of what the campus has accomplished, reiterate the next steps to achieve our goals, and engage the necessary campus constituencies.
As you read through the goals, strategies, and tactics toward the end of this document, the members of the Recruitment, Retention, and Data Councils, as well as the Steering Committee, invite you to consider how you can participate in this most important University work over the next four years. The importance of publishing the SEM plan extends beyond the stating our institutional commitment to these goals, strategies, and tactics. The articulation of the SEM plan is also a vitally important “call to action.”
It is important to view the SEM plan as a living document. While the University is committed to the goals of expanding our recruitment and increasing our retention of our students so that they complete their degree programs in a timely fashion, the tacticsdescribedwithinmustbeseenasfluidandamenabletoformativefeedbackasweworktogethertodeliverontheUniversity of Michigan-Flint’s unwavering commitment to excellence in teaching, learning and scholarship, student centered-ness and engaged citizenship.
STRATEGIC ENROLLMENT MANAGEMENT PLAN, 2015-2020
4

ENVIRONMENTAL SCANCAMPUS OVERVIEWThe University of Michigan-Flint is one of three campuses of the world-renowned University of Michigan. For nearly 60 years, UM-Flint has been committed to the highest standards of teaching, scholarship, and creativity. Research, engaged learning, and academic excellence are hallmarks of the UM-Flint educational experience.
UM-Flint students choose from 120 undergraduate and 35 graduate programs in the liberal arts and a number of pre-professional andprofessional fields taught by over 575 faculty.With an emphasis on engaged learning, or applyingclassroom concepts to real-world problems, UM-Flint has earned the reputation for producing graduates who excel in their careers and communities.
UM-Flint’s own legacy continues to grow and gain the attention of students and scholars worldwide. U.S News & World Report ranked us #20 for public universities in the Midwest, and the School of Management was named among the “Best Business Schools 2014” by the Princeton Review. The University of Michigan-Flint is accredited by the Higher Learning Commission (HLC) of the North Central Association of Colleges and Schools, one of six regional accrediting agencies in the United States.
Adiversestudentpopulationof8,500studentsattendtheUniversity,whichtothisdayisprimarilyacommutercampuswithlimited student housing. With the median age of 26, UM-Flint students come to campus with varied life experiences. Many students have jobs, families, and other demands on their time. Nearly 8% of the student body is international students hailing frommore than45differentcountries.Understanding that student successmustbemetatall levels, theUniversityofferssupport services for students in such as areas as academic advising, tutoring, counseling, veterans’ resources, and more. MISSIONThe University of Michigan-Flint is a comprehensive urban University of diverse learners and scholars committed to advancing our local and global communities. In the University of Michigan tradition, we value excellence in teaching, learning, and scholarship;studentcenteredness;andengagedcitizenship.Throughpersonalattentionanddedicatedfacultyandstaff,ourstudentsbecomeleadersandbestintheirfields,professions,andcommunities.
MAGUIRE RESEARCH: 2012 MARKETING RESEARCH FINDINGS In 2012-2013, UM-Flint sought the services of Maguire and Associates to conduct marketing and brand research in conjunc-tion with a similar project for the University of Michigan in Ann Arbor. Prospective and current students as well as faculty, staff, and community members were surveyed as part of the research project.
Research included 2,632 online surveys collected from several UM-Flint audiences:
•231Prospectiveundergraduatestudents •1,460Currentstudents - 1,161 undergraduates - 299 graduate students •365Facultyandstaff •576Alumni •30executiveinterviewswith: - 17 Community and business leaders - 7 Parents of prospective parents - 3 Parents of current students - 3 Guidance counselors
STRATEGIC ENROLLMENT MANAGEMENT PLAN, 2015-2020
1Maguire Marketing Research Report: www.umflint.edu/sites/default/files/groups/Brand/um-flint_brand_research_presentation.pdf
5
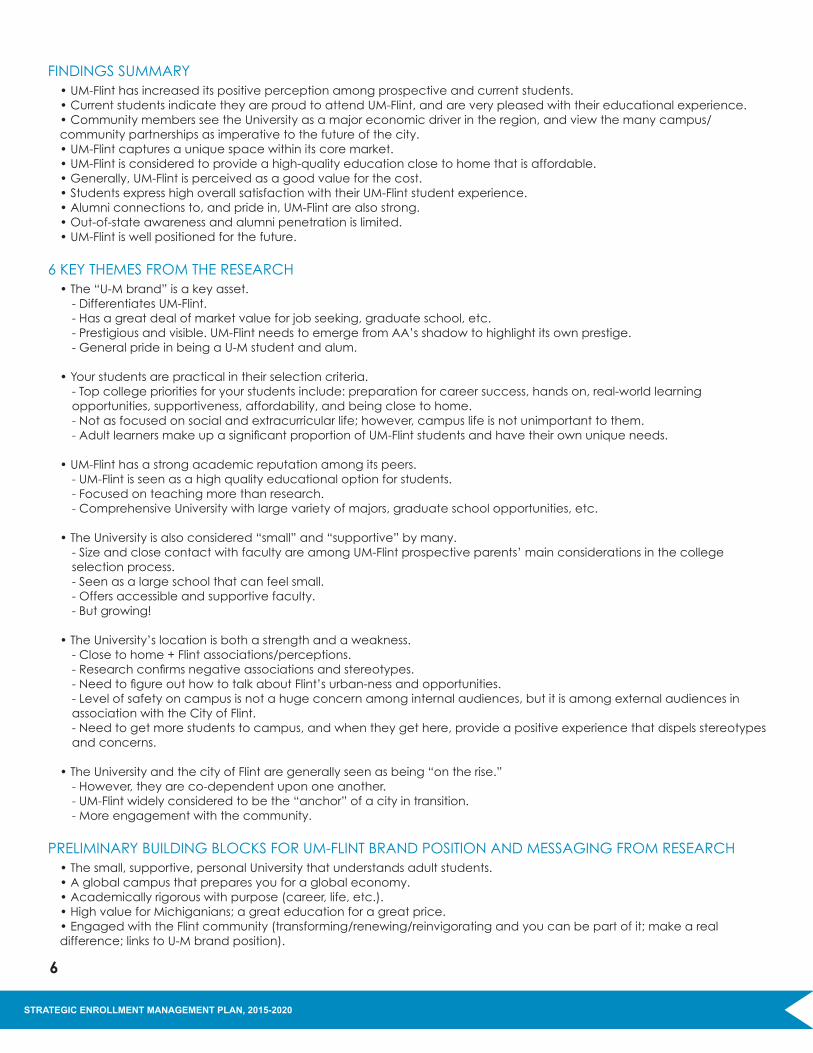
FINDINGS SUMMARY •UM-Flinthasincreaseditspositiveperceptionamongprospectiveandcurrentstudents. •CurrentstudentsindicatetheyareproudtoattendUM-Flint,andareverypleasedwiththeireducationalexperience. •CommunitymembersseetheUniversityasamajoreconomicdriverintheregion,andviewthemanycampus/ community partnerships as imperative to the future of the city. •UM-Flintcapturesauniquespacewithinitscoremarket. •UM-Flintisconsideredtoprovideahigh-qualityeducationclosetohomethatisaffordable. •Generally,UM-Flintisperceivedasagoodvalueforthecost. •StudentsexpresshighoverallsatisfactionwiththeirUM-Flintstudentexperience. •Alumniconnectionsto,andpridein,UM-Flintarealsostrong. •Out-of-stateawarenessandalumnipenetrationislimited. •UM-Flintiswellpositionedforthefuture.
6 KEY THEMES FROM THE RESEARCH •The“U-Mbrand”isakeyasset. - Differentiates UM-Flint. - Has a great deal of market value for job seeking, graduate school, etc. - Prestigious and visible. UM-Flint needs to emerge from AA’s shadow to highlight its own prestige. - General pride in being a U-M student and alum.
•Yourstudentsarepracticalintheirselectioncriteria. - Top college priorities for your students include: preparation for career success, hands on, real-world learning opportunities, supportiveness, affordability, and being close to home. -Notasfocusedonsocialandextracurricularlife;however,campuslifeisnotunimportanttothem. -AdultlearnersmakeupasignificantproportionofUM-Flintstudentsandhavetheirownuniqueneeds.
•UM-Flinthasastrongacademicreputationamongitspeers. - UM-Flint is seen as a high quality educational option for students. - Focused on teaching more than research. - Comprehensive University with large variety of majors, graduate school opportunities, etc.
•TheUniversityisalsoconsidered“small”and“supportive”bymany. - Size and close contact with faculty are among UM-Flint prospective parents’ main considerations in the college selection process. - Seen as a large school that can feel small. - Offers accessible and supportive faculty. - But growing!
•TheUniversity’slocationisbothastrengthandaweakness. - Close to home + Flint associations/perceptions. -Researchconfirmsnegativeassociationsandstereotypes. -NeedtofigureouthowtotalkaboutFlint’surban-nessandopportunities. - Level of safety on campus is not a huge concern among internal audiences, but it is among external audiences in association with the City of Flint. - Need to get more students to campus, and when they get here, provide a positive experience that dispels stereotypes and concerns.
•TheUniversityandthecityofFlintaregenerallyseenasbeing“ontherise.” - However, they are co-dependent upon one another. - UM-Flint widely considered to be the “anchor” of a city in transition. - More engagement with the community.
PRELIMINARY BUILDING BLOCKS FOR UM-FLINT BRAND POSITION AND MESSAGING FROM RESEARCH •Thesmall,supportive,personalUniversitythatunderstandsadultstudents. •Aglobalcampusthatpreparesyouforaglobaleconomy. •Academicallyrigorouswithpurpose(career,life,etc.). •HighvalueforMichiganians;agreateducationforagreatprice. •EngagedwiththeFlintcommunity(transforming/renewing/reinvigoratingandyoucanbepartofit;makeareal difference;linkstoU-Mbrandposition).
STRATEGIC ENROLLMENT MANAGEMENT PLAN, 2015-2020
6

STATE, NATIONAL, AND INTERNATIONAL PROFILEENROLLMENT IN MICHIGAN COLLEGES AND UNIVERSITIESMichigan’s Public Universities experienced a slow annual rate of growth in enrollment between Fall 2009 and Fall 2011, but since Fall 2012 total Michigan public University enrollment has declined slightly. The University of Michigan-Flint‘s enrollment has consistently grown each year. While enrollment growth in 2009-13 was dominated by degree-seeking undergraduate andgraduatestudents, subsequentgrowth in2014-15waspowered in large-partbysignificant increases indual-enrolleeenrollments. Graduate enrollment has increased substantially, largely due to investments in new graduate programs, growth in international students, and expansions in capacity in some existing programs.
Michigan Public UniversitiesTotal Fall Enrollment Annual Percentage Change
UndergraduateenrollmentatMichigan’spublicuniversitiesreflectstheoverallenrollmenttrends.
Michigan Public University Total Undergraduate Fall EnrollmentAnnual Percentage Change (IPEDS)
STRATEGIC ENROLLMENT MANAGEMENT PLAN, 2015-2020
-2%
0%
2%
4%
6%
8%
Fall 2013Fall 2012Fall 2011Fall 2010Fall 2009
% Annual Total Enrollment Change % Annual UM-Flint Enrollment Change
Fall 2009 Fall 2010 Fall 2011 Fall 2012 Fall 2013% Annual Total Enrollment Change 1.94% 1.17% 0.60% -0.47% -0.46%
% Annual UM-Flint Enrollment Change 7.07% 4.70% 1.52% 0.33% 3.21%
Total Enrollment 298,240 301,734 303,554 302,129 300,730
UM-Flint Enrollment 7,773 8,138 8,262 8,289 8,555
% Annual Total Enrollment Change % Annual UM-Flint Enrollment Change
Fall 2009 Fall 2010 Fall 2011 Fall 2012 Fall 2013% Annual Total Enrollment Change 1.80% 1.92% 1.02% -0.23% -0.28%
% Annual UM-Flint Enrollment Change 6.92% 4.45% 1.24% 0.36% 2.28%
Total Enrollment 229,230 233,640 236,026 235,479 234,814
UM-Flint Enrollment: Undergraduate 6,581 6,874 6,959 6,984 7,143
-2%
0%
2%
4%
6%
8%
Fall 2013Fall 2012Fall 2011Fall 2010Fall 2009
7
1996
-97
2026
-27
1997
-98
1998
-99
1999
-00
2000
-01
2001
-02
2027
-28
2002
-03
2003
-04
2004
-05
2005
-06
2006
-07
2007
-08
2008
-09
2009
-10
2010
-11
2011
-12
2012
-13
2013
-14
2014
-15
2015
-16
2016
-17
2017
-18
2018
-19
2019
-20
2020
-21
2021
-22
2022
-23
2023
-24
2024
-25
2025
-26
120,000
105,000
90,000
75,000
0
= Public = Public & nonpublic
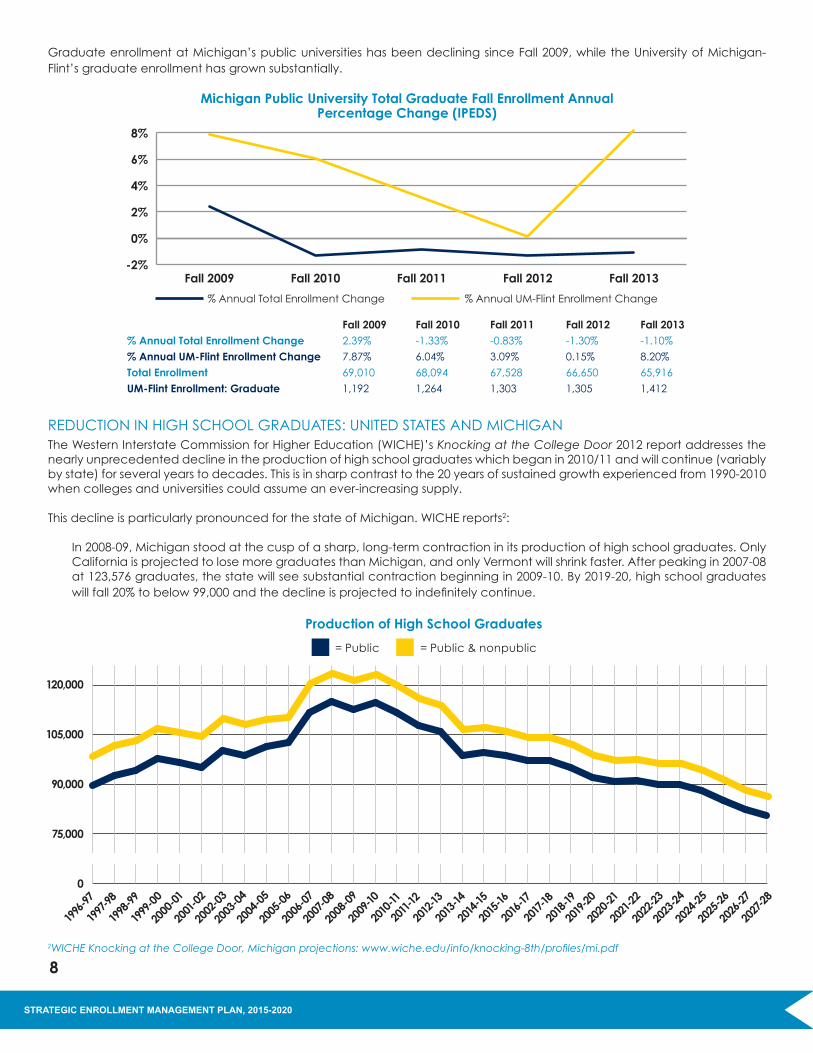
Graduate enrollment at Michigan’s public universities has been declining since Fall 2009, while the University of Michigan-Flint’s graduate enrollment has grown substantially.
Michigan Public University Total Graduate Fall Enrollment AnnualPercentage Change (IPEDS)
STRATEGIC ENROLLMENT MANAGEMENT PLAN, 2015-2020
% Annual Total Enrollment Change % Annual UM-Flint Enrollment Change
Fall 2009 Fall 2010 Fall 2011 Fall 2012 Fall 2013% Annual Total Enrollment Change 2.39% -1.33% -0.83% -1.30% -1.10%
% Annual UM-Flint Enrollment Change 7.87% 6.04% 3.09% 0.15% 8.20%
Total Enrollment 69,010 68,094 67,528 66,650 65,916
UM-Flint Enrollment: Graduate 1,192 1,264 1,303 1,305 1,412
-2%
0%
2%
4%
6%
8%
Fall 2013Fall 2012Fall 2011Fall 2010Fall 2009
REDUCTION IN HIGH SCHOOL GRADUATES: UNITED STATES AND MICHIGANThe Western Interstate Commission for Higher Education (WICHE)’s Knocking at the College Door 2012 report addresses the nearly unprecedented decline in the production of high school graduates which began in 2010/11 and will continue (variably by state) for several years to decades. This is in sharp contrast to the 20 years of sustained growth experienced from 1990-2010 when colleges and universities could assume an ever-increasing supply.
This decline is particularly pronounced for the state of Michigan. WICHE reports2:
In 2008-09, Michigan stood at the cusp of a sharp, long-term contraction in its production of high school graduates. Only California is projected to lose more graduates than Michigan, and only Vermont will shrink faster. After peaking in 2007-08 at123,576graduates,thestatewillseesubstantialcontractionbeginningin2009-10.By2019-20,highschoolgraduateswillfall20%tobelow99,000andthedeclineisprojectedtoindefinitelycontinue.
Production of High School Graduates
2WICHE Knocking at the College Door, Michigan projections: www.wiche.edu/info/knocking-8th/profiles/mi.pdf
8

STRATEGIC ENROLLMENT MANAGEMENT PLAN, 2015-2020
As the below map demonstrates, Michigan (and surrounding states, in general) will be among the most severely affected:
Percent Change in Public and Nonpublic High School Graduates,by State, 2008-09 to 2019-20
Greaterthan15% 0%to5% -15%to-5.01%
5.01%to15% -5%to-0.01% Lessthan-15%
There is perhaps no greater threat to college and University enrollments in Michigan than this contraction. Not only does this reducethemarketforfirst-timestudents,ithasandwillproducesharpdeclinesincommunitycollegeenrollments,themarketfor prospective transfer students, and eventually impact the graduate student market as well.
9
STRATEGIC ENROLLMENT MANAGEMENT PLAN, 2015-2020
Changes in High School Graduates by Race/EthnicityTheracial/ethnicmixofhighschoolgraduatesinMichiganwillundergoasignificantchangefrom2010-2020.Blacknon-Hispanicswillexperiencethegreatestpercentagedecline(-24%),followedbyWhitenon-Hispanics(-21%).GrowthinHispanicsandAsians/PacificIslanderswillbesignificant(37%and19%,respectively),butnotenoughtooffsetthedeclinesinothersegments.3
3WICHE Knocking at the College Door, Michigan projections: www.wiche.edu/info/knocking-8th/profiles/mi.pdf4Derived from CEPI Historical Student Counts: www.mischooldata.org/Other/DataFiles/StudentCounts/HistoricalStudentCount.aspx
1000
2000
3000
4000
5000
6000
202020192018201720162015201420132012201120102009200820072006200520042003
Genesee County 12th Grade Class Sizes
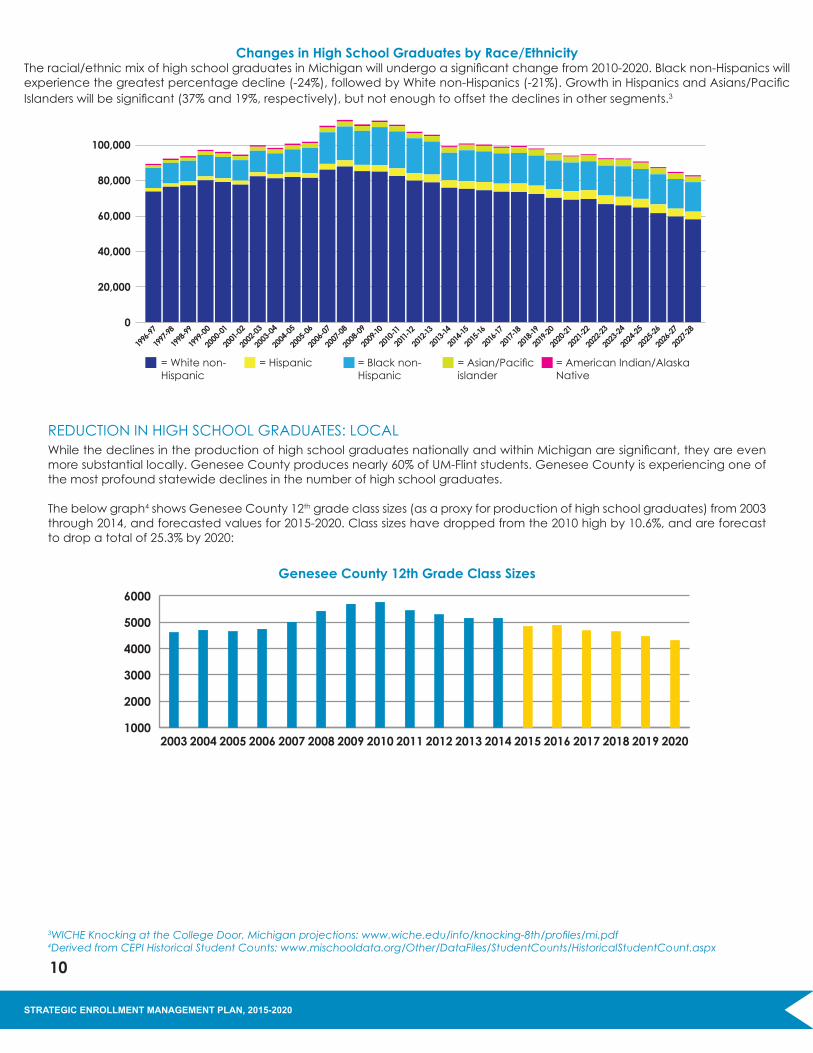
REDUCTION IN HIGH SCHOOL GRADUATES: LOCALWhilethedeclinesintheproductionofhighschoolgraduatesnationallyandwithinMichiganaresignificant,theyareevenmore substantial locally. Genesee County produces nearly 60% of UM-Flint students. Genesee County is experiencing one of the most profound statewide declines in the number of high school graduates.
The below graph4 shows Genesee County 12th grade class sizes (as a proxy for production of high school graduates) from 2003 through2014,andforecastedvaluesfor2015-2020.Classsizeshavedroppedfromthe2010highby10.6%,andareforecasttodropatotalof25.3%by2020:
1996
-97
2026
-27
1997
-98
1998
-99
1999
-00
2000
-01
2001
-02
2027
-28
2002
-03
2003
-04
2004
-05
2005
-06
2006
-07
2007
-08
2008
-09
2009
-10
2010
-11
2011
-12
2012
-13
2013
-14
2014
-15
2015
-16
2016
-17
2017
-18
2018
-19
2019
-20
2020
-21
2021
-22
2022
-23
2023
-24
2024
-25
2025
-26
= White non-Hispanic
100,000
80,000
60,000
40,000
20,000
0
= Hispanic = Black non-Hispanic
=Asian/Pacificislander
= American Indian/Alaska Native
10
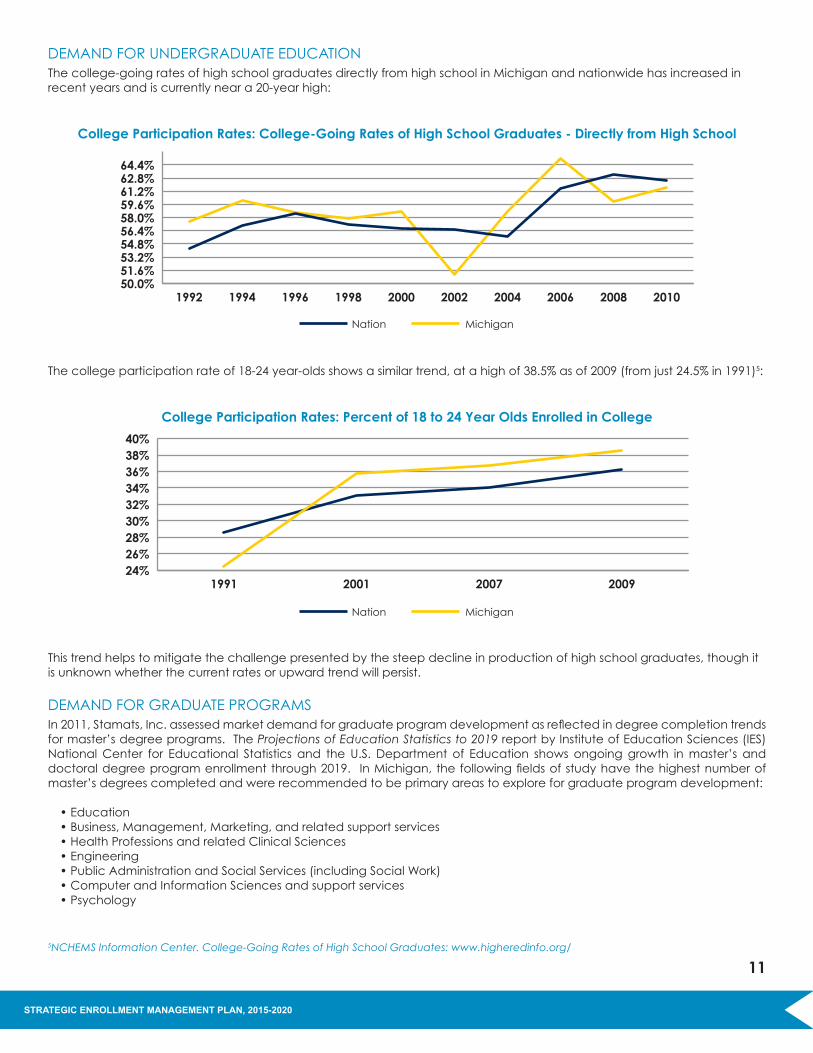
DEMAND FOR UNDERGRADUATE EDUCATIONThe college-going rates of high school graduates directly from high school in Michigan and nationwide has increased in recent years and is currently near a 20-year high:
College Participation Rates: College-Going Rates of High School Graduates - Directly from High School
STRATEGIC ENROLLMENT MANAGEMENT PLAN, 2015-2020
50.0%51.6%53.2%54.8%56.4%58.0%59.6%61.2%62.8%64.4%
2010200820062004200220001998199619941992
Nation Michigan
Thecollegeparticipationrateof18-24year-oldsshowsasimilartrend,atahighof38.5%asof2009(fromjust24.5%in1991)5:
College Participation Rates: Percent of 18 to 24 Year Olds Enrolled in College
24%26%28%30%32%34%36%38%40%
2009200720011991
Nation Michigan
This trend helps to mitigate the challenge presented by the steep decline in production of high school graduates, though it is unknown whether the current rates or upward trend will persist.
DEMAND FOR GRADUATE PROGRAMSIn2011,Stamats,Inc.assessedmarketdemandforgraduateprogramdevelopmentasreflectedindegreecompletiontrendsfor master’s degree programs. The Projections of Education Statistics to 2019 report by Institute of Education Sciences (IES) National Center for Educational Statistics and the U.S. Department of Education shows ongoing growth in master’s and doctoraldegreeprogramenrollmentthrough2019. InMichigan,thefollowingfieldsofstudyhavethehighestnumberofmaster’s degrees completed and were recommended to be primary areas to explore for graduate program development:
•Education •Business,Management,Marketing,andrelatedsupportservices •HealthProfessionsandrelatedClinicalSciences •Engineering •PublicAdministrationandSocialServices(includingSocialWork) •ComputerandInformationSciencesandsupportservices •Psychology
5NCHEMS Information Center. College-Going Rates of High School Graduates: www.higheredinfo.org/
11
SpecificallyfortheUniversityofMichigan-Flint,Stamatsrecommendeddevelopmentofthefollowingprograms:
•MasterofSocialWork •PhysicianAssistant •MasterofScienceinAccounting(alreadydeveloped) •MasterofScienceinFinance •MasterofArtsinCounseling
In addition to recommending program development in these areas, Stamats also recommended that we address program delivery formats and location, as well as enhance information and messages on our website to assure maximum enrollment growth opportunities.
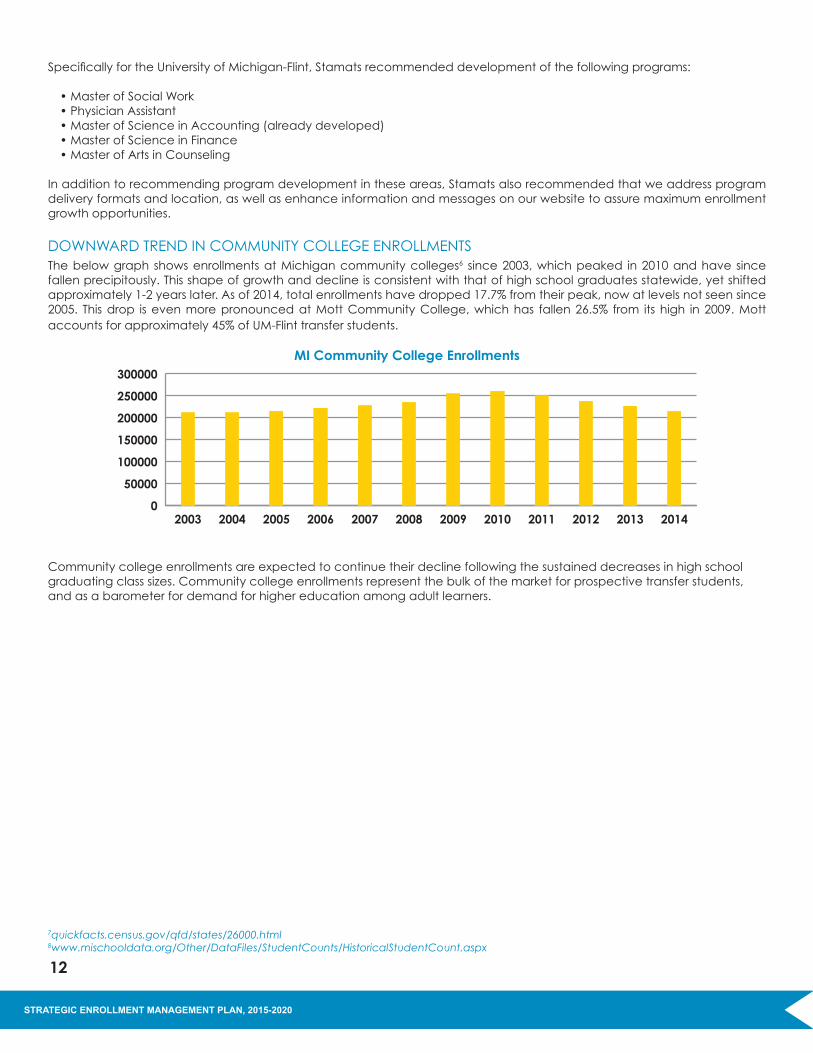
DOWNWARD TREND IN COMMUNITY COLLEGE ENROLLMENTSThe below graph shows enrollments at Michigan community colleges6 since 2003, which peaked in 2010 and have since fallen precipitously. This shape of growth and decline is consistent with that of high school graduates statewide, yet shifted approximately 1-2 years later. As of 2014, total enrollments have dropped 17.7% from their peak, now at levels not seen since 2005. Thisdrop isevenmorepronouncedatMottCommunityCollege,whichhas fallen26.5% from itshigh in2009.Mottaccountsforapproximately45%ofUM-Flinttransferstudents.
MI Community College Enrollments
STRATEGIC ENROLLMENT MANAGEMENT PLAN, 2015-2020
7quickfacts.census.gov/qfd/states/26000.html8www.mischooldata.org/Other/DataFiles/StudentCounts/HistoricalStudentCount.aspx
0
50000
100000
150000
200000
250000
300000
201420132012201120102009200820072006200520042003
Community college enrollments are expected to continue their decline following the sustained decreases in high school graduating class sizes. Community college enrollments represent the bulk of the market for prospective transfer students, and as a barometer for demand for higher education among adult learners.
12

GENERAL POPULATION CHANGES AND SHIFTSThe below table shows populations of the ten-top counties for undergraduate enrollment at the University of Michigan-Flint and the change since 20107.Thereisnosignificantpopulationgrowth,thoughtherearemodestdeclinesinGeneseeand Shiawassee counties. The percent of individuals 18 and younger is slightly below the national average of 23.3% in most counties. Though overall population changes are relatively moderate, nearly all counties represented have experienced declines (manyquite significant) in thenumberof12thgraders from2010-2014. Institutionalestimates forecastadditionaldeclines(1.9%-16.5%)from2014-20208, consistent with the expectations of the WICHE Knocking at the College Door report.
STRATEGIC ENROLLMENT MANAGEMENT PLAN, 2015-2020
7quickfacts.census.gov/qfd/states/26000.html8www.mischooldata.org/Other/DataFiles/StudentCounts/HistoricalStudentCount.aspx9quickfacts.census.gov/qfd/states/26000.html
2013 12th Grade 12th Grade Total UG 2010 Population Change % 18 Years Change Change 2010- Students % Resident Population Estimate 2010 to 2013 or Younger 2010-2014 2014 (est.) Fall 14 Undergrad
Genesee 425,790 415,376 -2.5% 23.7% -10.6% -16.5% 3,686 56.3%
Lapeer 88,319 88,389 .1% 22.5% -4.2% -13.1% 498 7.6%
Oakland 1,205,508 1,231,640 2.1% 22.5% -2.3% -9.4% 462 7.1%
Livingston 180,967 184,443 1.9% 23.7% 8.5% -13.2% 350 5.3%
Wayne 1,820,584 1,775,273 -2.5% 24.3% -9.6% -13.6% 247 3.8%
Shiawassee 70,648 68,900 -2.5% 22.6% -7.5% -8.8% 168 2.6%
Macomb 840,978 854,769 1.6% 22.1% -9.4% -1.9% 166 2.5%
St. Clair 163,040 160,469 -1.6% 22.3% -1.0% -15.6% 149 2.3%
Ingham 280,891 282,234 .5% 20.4% -4.0% -3.3% 141 2.2%
Saginaw 200,169 196,542 -1.8% 22.2% -15.6% -9.3% 108 1.7%
Michigan 9,883,640 9,898,193 .1% 22.7%
USA 308,745,538 316,497,531 2.4% 23.3%
The below table shows populations of the ten-top counties for graduate enrollment at the University of Michigan-Flint and the change since 20109. Population growth is modest in most counties with no signs of major growth or decline during the next fewyears.Thetablealsoshowsthepercentageofpeople25yearsofageandolderwhohavebachelor’sdegreesorhigherin these counties, and the total resident graduate students at UM-Flint. Wayne and Oakland are by far the most populous counties;Washtenaw,Oakland,Livingston,andKentare themosteducated. It is interesting tonote thatKentCounty isgeographically outside our target market, yet has 42 students enrolled.
2013 % 25+ Total UG 2010 Population Change w/Bach. Students % Resident Population Estimate 2010 to 2013 Degree Fall 14 GR
Genesee 425,790 415,376 -2.5% 18.9% 384 33%
Oakland 1,205,508 1,231,640 2.1% 43.1% 173 14.9%
Wayne 1,820,584 1,775,273 -2.5% 21.3% 58 5%
Washtenaw 344,791 354,250 2.7% 51.3% 55 4.7%
Saginaw 200,169 196,542 -1.8% 19.1% 49 4.2%
Livingston 180,967 184,443 -1.9% 32.9% 45 3.9%
Kent 602,622 621,700 3.1% 31.7% 42 3.6%
Macomb 840,978 854,769 1.6% 22.5% 41 3.5%
Lapeer 88,319 88,389 .1% 17% 39 3.4%
Ingham 280,891 282,234 .5% 36.5% 27 2.3%
Michigan 9,883,640 9,898,193 .1% 25.9%
USA 308,745,538 316,497,531 2.4% 28.8%
13

TRENDS IN GRADUATE ENROLLMENT BY DISCIPLINEThe Council of Graduate Schools Publication Graduate Enrollment and Degrees: 2003 to 2013 documents trends in graduate enrollment by discipline. Between Fall 2008 and Fall 2013, average annual growth in total enrollment was greatest in health sciences(10.3%),mathematicsandcomputersciences(5.4%),andengineering(3.8%).Incontrast,totalgraduateenrollmentfellannuallyonaverage in threefieldsover thesametimeperiod: education(-3.4%), ‘otherfields’ (-2.6%),andartsandhumanities (-1.1%). The change over the ten-year period between 2003 and 2013 is a bit less pronounced as indicated by the below table:
Average Annual Percentage Change in Total GraduateEnrollment by Broad Field, Fall 2003 to Fall 2013
STRATEGIC ENROLLMENT MANAGEMENT PLAN, 2015-2020
Total
Arts & HumanitiesBiological & Agric. Sci.
BusinessEducation
EngineeringHealth Sciences
.Physical & Earth Sci.
Public Admin. & Svcs.Social & Behavioral Sci.
Other Fields1.5%
-.2%2.8%
1.8%-.9%2.7%7.7%
2.7%1.5%
1.9%1.2%
-1.3%
Source: CGS/GRE Survey of Graduate Enrollment and Degrees
Math & Computer Sci.
14

When considering citizenship status, the differences in change in disciplines are different, where mathematics and computer sciences and business show higher growth and health sciences lower growth, as shown below.
Average Annual Percentage Change in Total GraduateEnrollment by Broad Field and Citizenship, Fall 2003 to Fall 2013
Total
Arts & Humanities
Biological & Agric. Sci.
Business
Education
Engineering
Health Sciences
.
Physical & Earth Sci.
Public Admin. & Svcs.
Social & Behavioral Sci.
Other Fields
10.9%1.6%1.8%4.4%1.9%1.0%3.3%3.3%1.6%1.5%
-1.7%2.8%
1.4%2.9%
-.1%.9%
2.9%2.1%1.9%3.4%-.8%1.4%2.7%2.8%
STRATEGIC ENROLLMENT MANAGEMENT PLAN, 2015-2020
Source: CGS/GRE Survey of Graduate Enrollment and Degrees
Math & Computer Sci.
= Temporary residents
= U.S. citizens and permanent residents
15

INTERNATIONAL STUDENT PROFILEThe United States has been the top destination for international students.
According to the Institute of International Education (IIE) Open Doors 2014 State Fact Sheet for Michigan, our state ranks number 9 in the country for the number of international students10. Additionally, the U.S. News and World Report ranks the University of Michigan-Flint 20th amongst 96 regional institutions in the Midwest for the highest percentage of international students (6%) for the 2013-2014 academic year11.TheFall2014UniversityofMichigan-FlintStudentProfilestatesthatinternationalstudentsmakeup approximately to 8% of the overall student enrollment12. The population of over 760 international students (in academic and ELP) and their dependents have added and will continue to add to the global diversity of our campus and the Greater FlintandGeneseeCountycommunities.Theaverageinternationalstudentandtheirfamiliesspendapproximately$15,770onliving expenses (housing, food, clothing, etc.) during one -year of study in Michigan, contributing about $12 million annually to the Flint area economy.
886,052 International Students Studied at U.S. Colleges and Universities in 2013/14.The Number of International Students studying in the U.S. Grew by 8% Over the Prior Year and is Now at a Record High.
10www.iie.org/~/media/Files/Corporate/Open-Doors/Fact-Sheets-2014/States/Michigan-State-Sheet-2014.ashx 11colleges.usnews.rankingsandreviews.com/best-colleges/rankings/regional-universities-midwest/most-international 12www.umflint.edu/sites/default/files/groups/Institutional_Analysis/documents/student_body_profile_fall_2014.pdf
STRATEGIC ENROLLMENT MANAGEMENT PLAN, 2015-2020
2013/142003/041993/941983/84
1973/741963/641953/54
886k573k450k339k
151k75k34k
16

COST, AFFORDABILITY, AND REGULATORY IMPACTREGULATORY IMPACTIt is anticipated that the 114thCongresswillremainingridlock.“WhileRepublicanswillhold54seatsintheSenate,theywon’thaveafilibuster-proofmajority,soDemocratswillbeabletoblockbillsfromadvancing,”accordingtoanarticlebyKellyFieldintheChronicleofHigherEducationonJanuary5,2015.Fundingwillremaintightwithanticipatedacrosstheboardspendingcuts, known as the sequester. Modest increases to level funding to student aid are the most to hope for. The federal Perkins Loan program faces an uncertain future. From 2014-2016 the federal Perkins Loan program has represented an average of $280,381 or 23.3% of the Federal campus based monies allocated to the University of Michigan-Flint.
Simplificationwillbethetalkinthenation’sCapitaloverthenextcoupleofyears.ReductiontothenumberofFAFSAquestions,potentially moving to “one grant, one loan, one work program” with only modest annual increases to the federal Pell Grant program, and the likelihood of the move toward utilizing prior-prior year income information on the FAFSA will leave colleges tocompeteforfurtherattentionwithseveralothercompetingnon-educationalprioritiesin2015.WhiletheU.S.Departmentof Education seeks to increase regulation of aid programs, congressional republicans will do their best to prevent it. It is anticipated that there will be very little action on the reauthorization of the Higher Education Act this year. It is also anticipated that it will be reviewed and moved forward piecemeal, and not in one large bill over the next few years13. AFFORDABILITY AND STATE OF MICHIGAN FUNDING The University of Michigan-Flint (UM-Flint) demonstrated its affordability ranking as the fourth least expensive amongst the other15 four-yearpublic institutions inMichigan forabachelor’sdegree, tenth foramaster’sdegree,and ranking leastexpensiveforaPh.Din2014-1514. UNDERGRADUATE TUITION AND FEE COMPARISON
Summary of Tuition and Required FeesResident Students - FYES Basis
2014-2015 vs. 2013-2014
Undergraduate
13Field, Kelly. “5 Things Colleges Can Expect From Congress in 2015.” The Chronicle of Higher Education. January 5, 2015. 14 President’s Council State Universities of Michigan (PCSUM) Report on Tuition and Fees:
www.pcsum.org/Portals/0/docs/USETuition%20and%20Fees%202014-15.pdf
STRATEGIC ENROLLMENT MANAGEMENT PLAN, 2015-2020
2014-2015 2013-2014 % Change
FTIAC Lower Upper FTIAC Lower Upper FTIAC Lower Upper
Central Michigan University 11,55011,550 11,22011,220 2.94%2.94%
Eastern Michigan University 9,663 9,663 9,364 9,364 3.19% 3.19%
Ferris State University 11,190 11,190 11,430 10,95010,950 2.19%2.19%
Grand Valley State University 10,752 10,752 11,304 10,454 10,454 10,978 2.85% 2.85% 2.97%
Lake Superior State University 10,498 10,248 10,210 9,960 2.82% 2.89%
Michigan State University 13,252 13,252 14,760 12,915 12,915 14,347 2.61% 2.61% 2.88%
Michigan Technological University 14,040 14,040 15,840 13,728 13,728 15,238 2.27% 2.27% 3.95%
Northern Michigan University 9,5599,324 9,2629,037 3.20%3.17%
Oakland University 10,613 10,613 12,308 10,613 10,613 11,603 0.00% 6.07%
Saginaw Valley State University 8,691 8,691 8,423 8,423 3.18% 3.18%
University of Michigan-Ann Arbor 13,486 13,486 15,186 13,142 13,142 14,812 2.62% 2.62% 2.53%
University of Michigan-Dearborn 10,952 10,952 11,222 10,614 10,614 10,884 3.18% 3.18% 3.11%
University of Michigan-Flint 10,138 10,138 10,270 9,844 9,844 9,970 2.99% 2.99% 3.01%
Wayne State University 11,448 11,448 13,251 11,094 11,094 12,841 3.19% 3.19% 3.19%
Western Michigan University 10,985 10,685 11,711 10,655 10,355 11,347 3.10% 3.19% 3.21%
BasedonFYESdefinitionsof:Undergraduate-30semestercredits Masters - 24 semester credits PhD - 16 semester credits
17
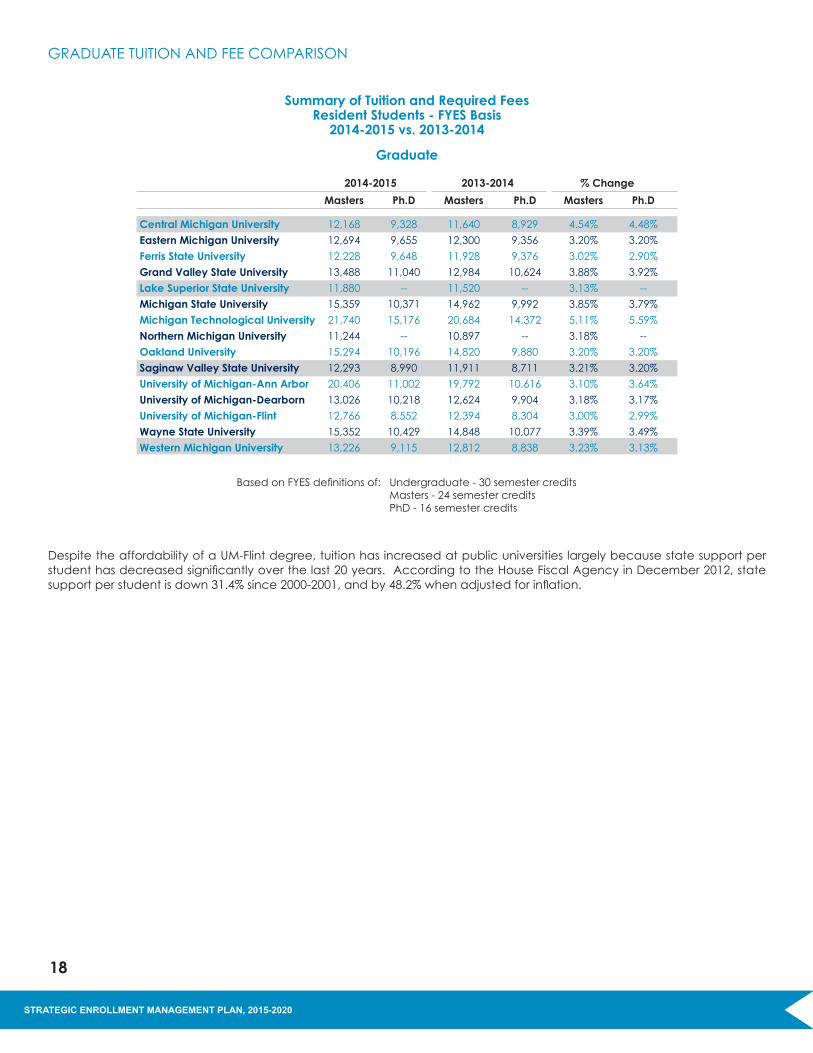
GRADUATE TUITION AND FEE COMPARISON
Summary of Tuition and Required FeesResident Students - FYES Basis
2014-2015 vs. 2013-2014
Graduate
2014-2015 2013-2014 % Change
Masters Ph.D Masters Ph.D Masters Ph.D
Central Michigan University 12,168 9,328 11,640 8,929 4.54% 4.48%
Eastern Michigan University 12,694 9,655 12,300 9,356 3.20% 3.20%
Ferris State University 12,228 9,648 11,928 9,376 3.02% 2.90%
Grand Valley State University 13,488 11,040 12,984 10,624 3.88% 3.92%
Lake Superior State University 11,880 -- 11,520 -- 3.13% --
Michigan State University 15,359 10,371 14,962 9,992 3.85% 3.79%
Michigan Technological University 21,740 15,176 20,684 14,372 5.11% 5.59%
Northern Michigan University 11,244 -- 10,897 -- 3.18% --
Oakland University 15,294 10,196 14,820 9,880 3.20% 3.20%
Saginaw Valley State University 12,293 8,990 11,911 8,711 3.21% 3.20%
University of Michigan-Ann Arbor 20,406 11,002 19,792 10,616 3.10% 3.64%
University of Michigan-Dearborn 13,026 10,218 12,624 9,904 3.18% 3.17%
University of Michigan-Flint 12,766 8,552 12,394 8,304 3.00% 2.99%
Wayne State University 15,352 10,429 14,848 10,077 3.39% 3.49%
Western Michigan University 13,226 9,115 12,812 8,838 3.23% 3.13%
BasedonFYESdefinitionsof:Undergraduate-30semestercredits Masters - 24 semester credits PhD - 16 semester credits
Despite the affordability of a UM-Flint degree, tuition has increased at public universities largely because state support per studenthasdecreasedsignificantlyoverthelast20years.AccordingtotheHouseFiscalAgencyinDecember2012,statesupportperstudentisdown31.4%since2000-2001,andby48.2%whenadjustedforinflation.
STRATEGIC ENROLLMENT MANAGEMENT PLAN, 2015-2020
18

Michigan Last in Increases in Higher Ed Appropriations, Last Five Years Combined
STRATEGIC ENROLLMENT MANAGEMENT PLAN, 2015-2020
TOP 10
-10%
0%
10%
20%
30%
40%
50%
60%
70%
80%
Hawaii
North Carolina
New Mexico
Alabama
Nevada
Arkansas
Oregon
Louisiana
Wyoming
Arizona
Colorado
Massachusetts
Pennsylvania
Georgia
IowaMichigan
Wisconsin
Illinois
Rhode Island
Missouri
BOTTOM 10
National Average: 24.1%
Source: Illinois State University’s “Grapevine Project”: www.grapevine.ilstu.edu
The latest reduction inappropriationsoccurred in 2012-13whena 15%cutacross-the-boardwasassessed to thepublicuniversities in Michigan. To date these funds have not been fully restored, as tuition and fees become the driving source of general fund revenue.15
SOURCES OF GENERAL FUND OPERATING REVENUE
15 Boulus, Michael A. Michigan’s Public Universities Moving Michigan into the Knowledge Economy, February 12, 2013.
Tuition & Fees25%
Appropriations75%
Tuition & Fees38%
Appropriations62%
Tuition & Fees41%
Appropriations59%
Tuition & Fees78%
Appropriations22%
1972-73 1982-83
2011-121992-93
Source: House Fiscal Agency
19

Statereductionshavecreatedcompetingforcesforfundingoncampusmakingitmoredifficulttosupportthefinancialneedof UM-Flint students. As state disinvestment continues, an article by the Young Invincibles (YI) demonstrates how states fair using a scoring system that takes into account the relationship between state budgets and college affordability. YI says, “Few states are doing much to ease the cost burden of college for students and families,”which “should concern us all.”16 See below how Michigan fares:17
Report CardMichigan State Budget Support for Public Higher Education
Subject
Tuition
Spending per Student
Burden on Families
State Aid to Students
Education as a State Priority
Final Grade
Grade
D
F
F
F
F
F
Comments
Tuition in Michigan is an incredible $11,600 per year, one of the highest
price tags in the nation. It has increased 22% since the recession.
Michigan has cut state appropriations for higher education by 27%
per FTE since 2008.
Students and families shoulder 70% of higher education costs. Is it still
a public school when the government only pays for a third?
Michigangives$212perFTEingrantstostudents,almost$350less
than the national average.
The state legislature spent just 4% of its budget on higher education
in 2012, down 13% in the past 4 years.
Given the high tuition rate and low student support, Michigan ranks
dead last for overall state support of higher education.
Additional Comments: Michigan should increase state support for students and families, as well as work with
colleges and universities to lower tuition and make a degree more affordable.
The average student debt load in Michigan is $28,840Source: Young Invincibles
HOW UNDERGRADUATE STUDENTS FINANCE THEIR EDUCATION Thepublishedpricefortuitionandfeesatpublicuniversitieshasrisendramaticallyinrecentyears—28%from2005/6–2011/12.Though alarming, the average net price (the amount students actually pay) has risen more modestly over the same period at 7%.18
Tuition and Fees
16These Four States Make All The Others Look Bad On College Affordability: younginvincibles.org/these-four-states-make-all-the-others-look-bad-on-college-affordability 17 State Report Card: www.studentimpactproject.org/michigan 18 The College Board, 2012, Trends in Public Higher Education: Enrollment, Prices, Student Aid, Revenues, and Expenditures: trends.college-
board.org/sites/default/files/trends-2012-public-higher-education-expenditures-brief.pdf.
STRATEGIC ENROLLMENT MANAGEMENT PLAN, 2015-2020
$0
$2,000
$4,000
$6,000
$8,000
$10,000
2011-12 (Est.)2006-072001-021996-97
Published Tuition and Fees Net Tuition and FeesSource: the College Board, Trends in College Pricing 2011
20

As of 2013-14, federal loans comprised 34% of undergraduate student aid followed by institutional grants (21%) and Federal Pell Grants (19%).
Type of Aid (Percentage of All Undergraduate Aid)Billions of Dollars
$0 $10 $20 $30 $40 $50 $60 $70
Federal Loans (34%)
InstitutionalGrants (21%)
Federal PellGrants (18%)
Federal Education TaxCredits & Deductions (8%)
Federal GrantsOther Than Pell (7%)
Private and EmployerGrants (6%)
State Grants (5%)
FederalWork-Study (<1%)
Since 2007-08, the composition of total aid for undergraduates has seen a relative increase in grants and other aid, and decrease in loans.19
Percentage of Total Funds Per Academic Year
0%
20%
40%
60%
80%
13-1407-0805-0693-94
Loans Grants Other Aid
19 The College Board, Total Undergraduate Student Aid by Source and Type, 2013-14. trends.collegeboard.org/student-aid/figures-tables/total-undergraduate-student-aid-source-type-2013-14
STRATEGIC ENROLLMENT MANAGEMENT PLAN, 2015-2020
21
HOW GRADUATE STUDENTS FINANCE THEIR EDUCATION Thewaysgraduatestudentsfinancetheireducationvariesbydegreelevel,fieldofstudy,andyearintheprogram.In2013-14, federal loans comprised 62% of all graduate student aid. Other sources of aid for graduate students in 2013-14:20
•Institutionalgrants:19% •Privateandemployergrants:9% •Educationtaxbenefits:6% •Federalgrants:3%(mostlyintheformofveteransandmilitaryfunding) •Nonfederalloans:3% •Stategrants:Lessthan1% •Federalwork-study:lessthan1%
In addition, there are very small percentages of master’s students nationally with fellowships and assistantships (22%), and cumulative loan debt is a concern.21
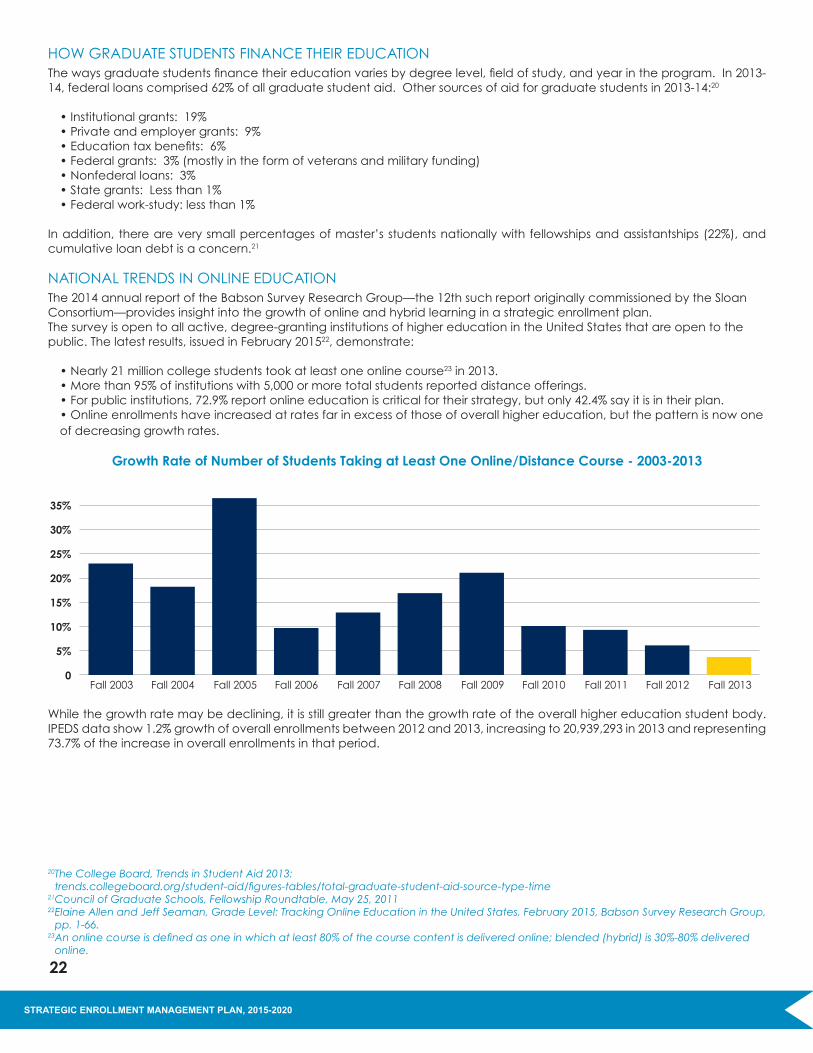
NATIONAL TRENDS IN ONLINE EDUCATION The 2014 annual report of the Babson Survey Research Group—the 12th such report originally commissioned by the Sloan Consortium—provides insight into the growth of online and hybrid learning in a strategic enrollment plan.The survey is open to all active, degree-granting institutions of higher education in the United States that are open to the public.Thelatestresults,issuedinFebruary201522, demonstrate:
•Nearly21millioncollegestudentstookatleastoneonlinecourse23 in 2013. •Morethan95%ofinstitutionswith5,000ormoretotalstudentsreporteddistanceofferings. •Forpublicinstitutions,72.9%reportonlineeducationiscriticalfortheirstrategy,butonly42.4%sayitisintheirplan. •Onlineenrollmentshaveincreasedatratesfarinexcessofthoseofoverallhighereducation,butthepatternisnowone of decreasing growth rates.
Growth Rate of Number of Students Taking at Least One Online/Distance Course - 2003-2013
20 The College Board, Trends in Student Aid 2013: trends.collegeboard.org/student-aid/figures-tables/total-graduate-student-aid-source-type-time
21 Council of Graduate Schools, Fellowship Roundtable, May 25, 201122 Elaine Allen and Jeff Seaman, Grade Level: Tracking Online Education in the United States, February 2015, Babson Survey Research Group,
pp. 1-66.23 An online course is defined as one in which at least 80% of the course content is delivered online; blended (hybrid) is 30%-80% delivered
online.
STRATEGIC ENROLLMENT MANAGEMENT PLAN, 2015-2020
While the growth rate may be declining, it is still greater than the growth rate of the overall higher education student body. IPEDS data show 1.2% growth of overall enrollments between 2012 and 2013, increasing to 20,939,293 in 2013 and representing 73.7% of the increase in overall enrollments in that period.
Fall 2003
35%
30%
25%
20%
15%
10%
5%
0Fall 2004 Fall2005 Fall 2006 Fall 2007 Fall 2008 Fall 2009 Fall 2010 Fall 2011 Fall 2012 Fall 2013
22

Distance Education Enrollment Change, 2012-13
CHALLENGES TO ONLINE ENROLLMENT GROWTH STRATEGIES Institutions seeking to grow using online enrollment as a strategy face several challenges:
Academic Concerns24
Faculty acceptance A.Only28.0%ofchiefacademicofficerssaytheirfacultymembersacceptthe“valueandlegitimacyofonlineeducation,” a rate substantially the same as in 2003. B. Increased faculty effort in distance education compared to face-to-face instruction C. 78% of academic leaders say it requires additional effort to deliver online instruction.
Student Retention 44.6%ofchiefacademicofficersagreedthatretainingstudentsisagreaterproblemforonlinecoursesthanforface-to-facecourses.
Course Quality and Learning OutcomesNearly 70 percent of college leaders believe online and blended learning outcomes are equal to or superior to those for face-to-face instruction.
Competition from Open Educational Resources and Massive Open Online Courses (MOOCS)The percentage of institutions offering MOOCs has increased from 2.6% in 2012 to 8% in 2014, although the percentage of schools planning to offer MOOCs in the future is on the decline.
State AuthorizationMost states require that out-of-state colleges submit to an approval process before enrolling students in distance education programs. The process for obtaining approval can be expensive, onerous, and extend to licensing agencies, such as boards of nursing and education.
A program of regional and national reciprocity may ameliorate the need for individual state approvals. Michigan colleges arenotyetabletoparticipateinthesereciprocityagreementspendinglegislativeaction;however,itisanticipatedthatbyJuly1,2015,Michiganwillhavepassedtheenablinglegislation.25
THE RAPIDLY SHIFTING TECHNOLOGY LANDSCAPE FOR STUDENTS26
Information and communications technology changes quickly, and colleges need to understand the types of technology and access most available and used by students. Lifestyles, personal budgets, commutes, personal devices, and campus resourcesallaffecthowastudentmayfare inadistanceeducationcourse. Collegesmustdecidehowtheymayoutfitstudents to close a digital gap, or how the colleges can adapt course delivery to student technology norms.
24 Allen and Seaman, Babson Survey, p. 2125 State and Federal Regulations on State Authorization of Distance Education, WICHE Cooperative for Educational Technologies (WCET),
www.wcet.wiche.edu/learn/issues/state-authorization, accessed February 17, 2015.26 Maura Smale and Mariana Regalado, Commuter Students Using Technology, Educause Review, September 15, 2014,
www.educause.edu/ero/article/commuter-students-using-technology, accessed February 17, 2015.
STRATEGIC ENROLLMENT MANAGEMENT PLAN, 2015-2020
Public, 4-year
125,000
100,000
75,000
50,000
25,000
0
-25,000
-50,000
Private not-for-profit,4-year
Private for-profit,4-year
Public, 2-year
Provate not-for-profit,2-year
Private for-profit,2-year
23

RECRUITING ENVIRONMENTTRADITIONAL FTIACAconfluenceof factors suchas technologyanddecliningproductionof high schoolgraduatesarechanging student’spreferencesandinfluences,andthewaysinwhichinstitutionsrecruittraditionalfirst-timeinanycollege(FTIAC)students.Morethan ever, students (and parents) are conducting the college search using technology: 61% of students prefer web-based resources for learning about colleges, 40% use a mobile device nearly all the time for web browsing, and 71% use email at least once per week.27
Students
62%
40%
9%
71%
93%
60%
75%
40%
73%
Preferences or behavior
Prefer web-based resources
for learning about colleges
Use a mobile device nearly
all the time for web browsing
Rarely use a mobile device
to go online
Have looked at a college website
on a mobile device
Use email at least once per week
Will open an email from
an unknown school
Use Facebook
Use Twitter
Use YouTube
Parents
51%
28%
20%
45%
77%
43%
56%
15%
32%
27 Noel Levitz 2014 E-Expectations Report: www.noellevitz.com/documents/gated/Papers_and_Research/2014/2014_E-Expectations_Report.pdf
STRATEGIC ENROLLMENT MANAGEMENT PLAN, 2015-2020
24
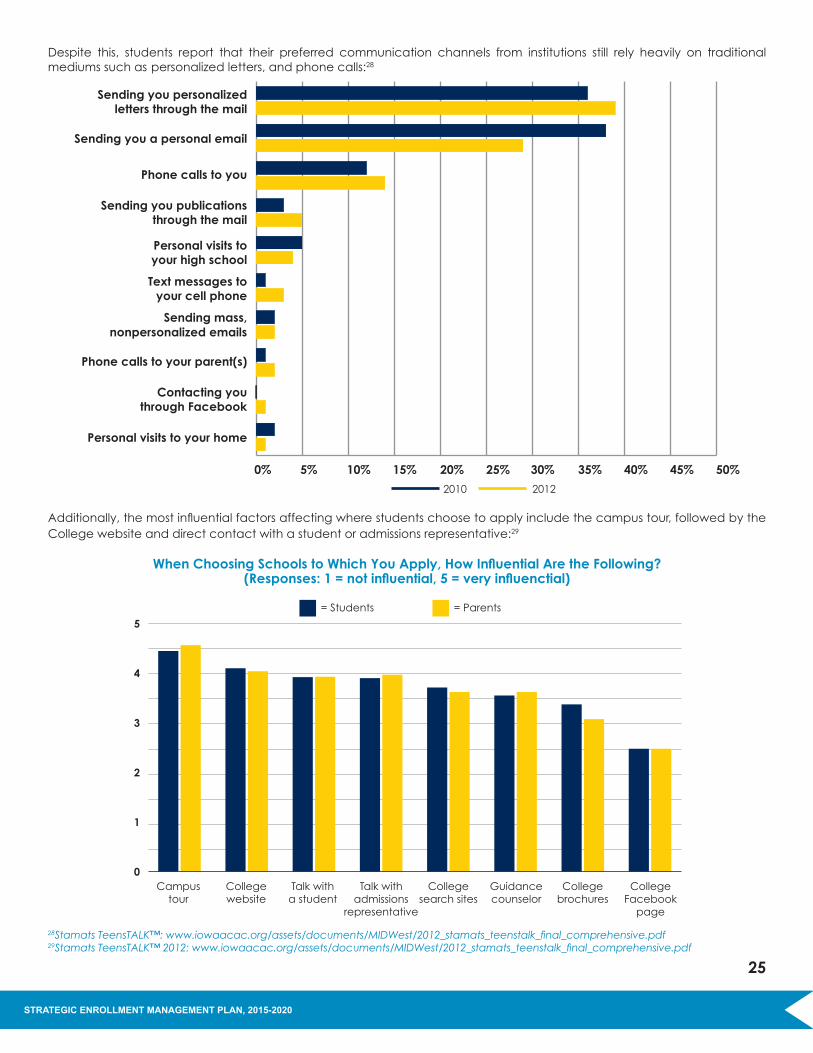
Despite this, students report that their preferred communication channels from institutions still rely heavily on traditional mediums such as personalized letters, and phone calls:28
0% 5% 10% 15% 20% 25% 30% 35% 40% 45% 50%
Personal visits to your home
Contacting youthrough Facebook
Phone calls to your parent(s)
Sending mass,
Text messages toyour cell phone
Personal visits toyour high school
Sending you publicationsthrough the mail
Phone calls to you
Sending you a personal email
Sending you personalizedletters through the mail
2010 2012
28 Stamats TeensTALK™: www.iowaacac.org/assets/documents/MIDWest/2012_stamats_teenstalk_final_comprehensive.pdf29 Stamats TeensTALK™ 2012: www.iowaacac.org/assets/documents/MIDWest/2012_stamats_teenstalk_final_comprehensive.pdf
STRATEGIC ENROLLMENT MANAGEMENT PLAN, 2015-2020
nonpersonalized emails
25
Additionally,themostinfluentialfactorsaffectingwherestudentschoosetoapplyincludethecampustour,followedbytheCollege website and direct contact with a student or admissions representative:29
When Choosing Schools to Which You Apply, How Influential Are the Following?(Responses: 1 = not influential, 5 = very influenctial)
Campus tour
5
4
3
2
1
0Collegewebsite
Talk with a student
Talk with admissions
representative
College search sites
Guidance counselor
College brochures
College Facebook
page
= Students = Parents

Lastly,factorsmostimportanttoprospectivefirst-timestudentsincludefinancialaid/scholarships,costofattendance,qualityof preferred major, and job/graduate school outcomes:30
30 Noel-Levitz 2014 Student Satisfaction and Priorities Report: www.noellevitz.com/papers-research-higher-education/2014/2014-national-student-satisfaction-and-priorities-report.
31Stamats Adult StudentsTALK™: http://cdn2.hubspot.net/hub/360416/file-590608697-pdf/Presentations_for_download/AdultTalk_2014_Consumer_Final.pdf
STRATEGIC ENROLLMENT MANAGEMENT PLAN, 2015-2020
Four-year Four-year Community CareerEnrollment Factor Private Public College School
Financial Aid 82% 78% 78% 85%
Academic Reputation 79% 74% 71% 82%
Cost 77% 83% 84% 79%
Personalized Attention Prior to Enrollment 65% 58% 59% 78%
Geographic Setting 60% 63% 63% 67%
Size of Institution 59% 56% 52% 65%
Campus Appearance 59% 58% 53% 70%
Recommendations from Family/Friends 45% 47% 47% 62%
Opportunity to Play Sports 30% 28% 25% --
Future Employment Opportunities -- -- -- 88%
RECRUITING GRADUATE AND ADULT STUDENTS According to the Adult StudentsTALK™ survey conducted by Stamats31, the factor that is most important to adult learners is the cost of their program of interest. This is because many adult students plan to pay for their education through their own personalfundsorsavings,orthroughpersonalloans.Itisalsothenveryimportanttodisplaycostandfinancialaidinformationvery prominently on websites that reach potential adult learners. Students also took into account the quality of their preferred program and whether or not it was accredited.
Secondly, when weighing options for mode of course delivery, most adult students prefer a mix of in-classroom instruction and online courses, as opposed to one or the other. When polled, 79% of adult students said they would prefer for their face-to-face instruction to take place on a weekday or weeknight, as opposed to weekend classes, even if they are only once-per-month.
When being marketed to, adult students indicated that television ads were most effective in capturing their attention regarding schools or programs they might want to attend. Search engine marketing, direct mail, and email were the next effective modes. Students indicated that it was more acceptable for institutions to send them mail and email to them if the pieces were personalized.
26

STRATEGIC ENROLLMENT MANAGEMENT PLAN, 2015-2020
322012 Marketing and Student Recruitment Practices Report for Master’s-Level Graduate Programs: https://www.noellevitz.com/papers-research-higher-education/2012/2012-marketing-student-recruitment-practices-master-level33Recruiting (and Retaining) the New Graduate Student: http://www.slideshare.net/targetx/nagap-2014-recruiting-and-retaining-the-new-graduate-student34http://www.acenet.edu/the-presidency/columns-and-features/Pages/Going-International.aspx2Choudra, R. and Kono, Y. (2012, October). Beyond More of the Same: The Top Four Emerging 3http://www.iie.org/~/media/Files/Corporate/Open-Doors/Fact-Sheets-2014/States/Michigan-State-Sheet-2014.ashx
Noel-Levitz and the National Association of Graduate Admissions Professionals conducted a national poll32 to determine the most effective practices in recruiting graduate students. For master’s-level graduate programs, the following are the top 10 most effective practices for respondents of public doctorate-granting and public master’s institutions:
Strong customer service is also imperative for success in recruiting adult (and truly, all) students. Brian Niles of TargetX has said many students will choose a University based partially on how they feel they are being treated.33
RECRUITING INTERNATIONAL STUDENTS
The growth in international student enrollment in the United States since 2006 has been fueled largely by increases in the number of students from three countries: China, Saudi Arabia, and Vietnam. Due in part to government scholarship programs foroutboundstudents,countriessuchasOman,Iraq,Kuwait,Iran,andBrazilareemergingassignificantsendersofstudentsto the United States.34
Universities across the U.S actively recruit international students in order to diversify and increase overseas market share. A portfolio of countries and practices is typically utilized to reduce the risks associated with overdependence on select markets. Recruiting practices include overseas recruitment at high schools and college fairs, sponsored program relationships, agreements with overseas marketing services representatives, partnerships with foreign institutions, and marketing and social media campaigns.2 The top four countries of origin for international students in the state of Michigan are China, India, Saudi Arabia, and South Korea.3
Places of Origin of International StudentsAbout50percentofinternationalstudentscometoMichiganfromChina,India,andSouthKorea:
Note: Figures exceed 100 percent due to rounding.Source: Institute of International Education
India, 12%China, 31% Saudi Arabia,
6%
South Korea,
6%
Taiwan, 3%Canada, 3%
Japan, 2%Brazil, 2%
Mexico, 2%Vietnam, 2% Other, 32%
Practices for master’s level graduate programs at public, doctorate-granting institutions
% rating practice very effective
Assistantships awarded with a work obligation attached 69%Financial aid award notices sent at time of admission 68% Campus visits for admitted students 68%Scholarships/fellowships awarded without a work obligation 59%Graduate program web pages to attract inquires 56%Outreach to our own institution’s undergraduate population 47%Follow up by email with students whose applications are incomplete 45%Open house and campus visit days to generate inquiries 41%Phone calls to admitted students from current students/graduate assistants 41%Follow up by phone with students whose applications are incomplete 40%
Practices for master’s level graduate programs at public, master’s institutions
% rating practice very effective
Follow up by phone with students whose applications are incomplete 58%Assistantships awarded with a work obligation attached 58%Search engine optimization tactics to ensure we appear as a result of a search 50%Graduate program Web pages to attract inquires 47% Campus visits for admitted students 46%Phone calls to admitted students from faculty members in students’ programs of interest 45%Follow up by email with students whose applications are incomplete 44%Institutional aid awarded based on student financial need 39%Web pages designed to enhance international student interest 38%Open house and campus visit days to generate inquiries 38%
27

STRATEGIC ENROLLMENT MANAGEMENT PLAN, 2015-2020
ENROLLMENT PROFILE
OverallInFall2014,enrollmentattheUniversityofMichigan-Flintwas8,574students.83%wereundergraduateand17%wereatthegraduatelevel.Studentscompletedover1,700degreesandpost-graduatecertificatesinFY2013-14.InFall2014:
UndergraduateOf more than 7,000 undergraduate students, 60% are full-time and 93% are degree-seeking. Ofthe1,458Fall2014newdegree-seekingstudents:•45%wereFirstTimeInAnyCollege(FTIAC)and55%newtransfers.•51%ofundergraduatesarestudyingintheCollegeofArtsandSciences,29%inSchoolofHealthProfessionsandStudies,15%intheSchoolofManagement,and5%intheSchoolofEducationandHumanServices.There were over 1,200 bachelor’s degrees issued in FY 2013-14. Of those graduating, 67.3% borrowed through federal loan programs. Average debt was $32,107.
Fall 2014 New Undergraduates by Type Count PercentFreshmen 662 32%Transfers 796 39%Readmits 169 8%NCFDs 52 3%Guests 12 1%Dual Enrollees 322 16%Early College 26 1%
As of Fall 2014, 80% of new undergraduates are degree-seeking, and 20% are nondegree.Fall2014FTIACProfile •662students •AverageHSGPA:3.22 •AverageACT:21.34 •Male:43.4%,Female:56.6% •Full-time:89.9%,Part-time:10.1% •33.2%minority •3.6%international
60% of all students were female, 40% male
Nearly 90% were Michigan residents
Nearly 60% were residents of Genesee
County
International students comprised 8% of the
student body
15.6% of all students (1,344) were enrolled only in online courses
Fall Enrollment by Full and Part-Time Status Part-Time Full-Time TotalUndergraduate 2,838 4,240 7,078Graduate 969 527 1,496Total 3,807 4,767 8,574
6,42
2
6,52
7
6,88
3
7,26
0
7,77
3
8,13
8
8,26
2
8,28
9
8,55
5
8,57
4
5,67
0
5,60
0
5,82
4
6,15
5
6,58
1
6,87
4
6,95
9
6,98
4
7,14
3
7,07
8
752
927
1,0
59
1,1
05
1,1
92
1,2
64
1,3
03
1,3
05
1,4
12
1,4
96
2005 2006 2007 2008 2009 2010 2011 2012 2013 2014
Overall Undergraduate Graduate
White, 5,727
Black or African
American, 1,026
Nonresident alien, 663
Unknown, 392
Hispanic or Latino, 297
2 or more races, 230
American Indian or Native, 63
Asian,170
Native Hawaiian or other Pacific Islander, 6
28
STRATEGIC ENROLLMENT MANAGEMENT PLAN, 2015-2020
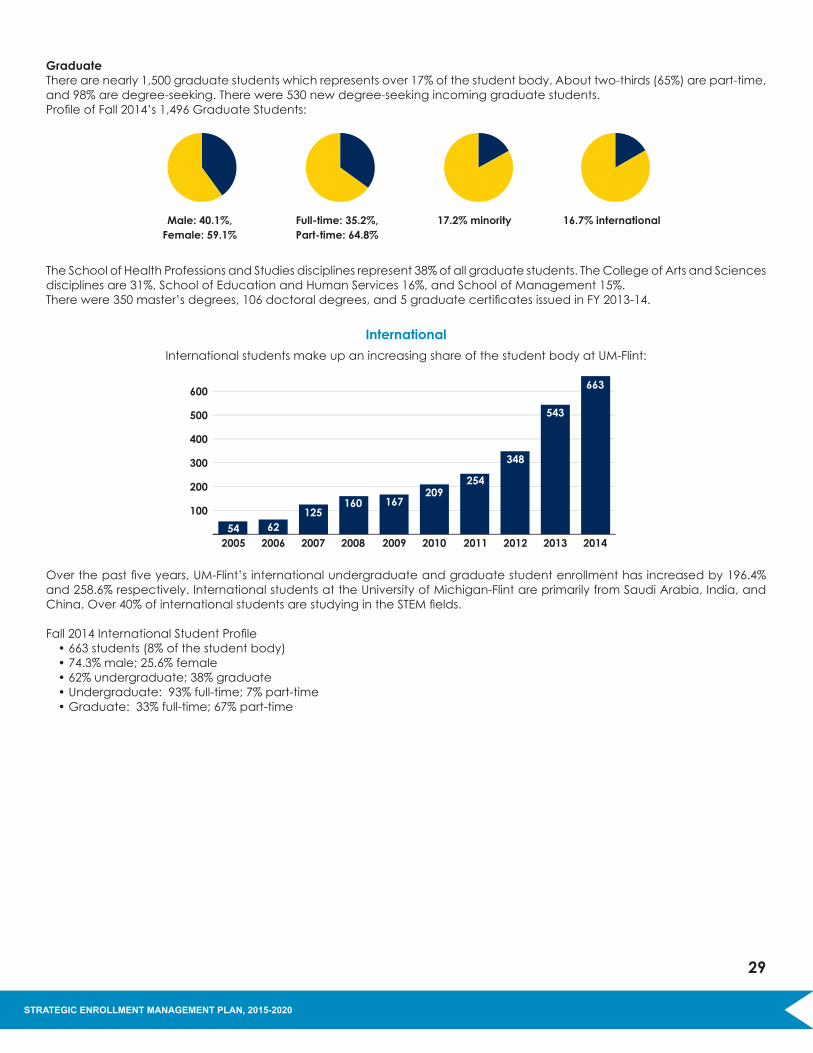
GraduateTherearenearly1,500graduatestudentswhichrepresentsover17%ofthestudentbody.Abouttwo-thirds(65%)arepart-time,and98%aredegree-seeking.Therewere530newdegree-seekingincominggraduatestudents.ProfileofFall2014’s1,496GraduateStudents:
The School of Health Professions and Studies disciplines represent 38% of all graduate students. The College of Arts and Sciences disciplinesare31%,SchoolofEducationandHumanServices16%,andSchoolofManagement15%.Therewere350master’sdegrees,106doctoraldegrees,and5graduatecertificatesissuedinFY2013-14.
International
International students make up an increasing share of the student body at UM-Flint:
Overthepastfiveyears,UM-Flint’sinternationalundergraduateandgraduatestudentenrollmenthasincreasedby196.4%and258.6%respectively.InternationalstudentsattheUniversityofMichigan-FlintareprimarilyfromSaudiArabia,India,andChina.Over40%ofinternationalstudentsarestudyingintheSTEMfields.
Fall2014InternationalStudentProfile •663students(8%ofthestudentbody) •74.3%male;25.6%female •62%undergraduate;38%graduate •Undergraduate:93%full-time;7%part-time •Graduate:33%full-time;67%part-time
100
200
300
400
500
600
2005 2006 2007 2008 2009 2010 2011 2012 2013 201454 62
125160 167
209254
348
543
663
Male: 40.1%,Female: 59.1%
Full-time: 35.2%, Part-time: 64.8%
17.2% minority 16.7% international
29

STRATEGIC ENROLLMENT MANAGEMENT PLAN, 2015-2020
GOALS AND STRATEGIESRECRUITMENTThe Environmental Scan demonstrates the number of high school graduates in our local area, the State of Michigan, and our region of the country are in decline. Further, the number of community college enrollments is also decreasing. As these two populations have comprised most of the undergraduate population on our campus, we have formulated goals and strategies to mitigate the effects of declining populations. This includes maintaining a steady freshman (FTIAC) class by increasing the number of students coming from areas of Michigan and neighboring states beyond our local region, increasing thenumberofinternationalstudents,leveragingourfinancialaidinwaysthatenableustocompeteandservethegreatestnumber of students, strengthening our transfer pathways from community colleges, and growing our graduate and online student populations.
GOAL 1: Maintain average number of incoming FTIAC students of 65035 in each Fall semester, 2015-2020.Strategies:
A. Increase the market share of domestic, in-state FTIACs from noncommutable counties in Michigan.36
B.Launchsignificantrecruitmenteffortsinadomestic,non-MichiganU.S.marketormarkets(e.g.,Chicago,Ohio,Indiana, Ontario) as a means to maintain the FTIAC class size.
C. Increase market share of international FTIACs, with focus on increasing this segment at least 60% by Fall 2020. D.LeverageinstitutionalfinancialaidtomaximizethenumberofFTIACstudents. GOAL 2: Mitigate potential loss of new transfer students to no greater than 10% by Fall 2020. Strategies:
A.Strengthentransferpathwaysfromselectedinstitutionstomitigatelossatthoseinstitutionstonogreaterthan5%by2020.
B. Increase market share of international transfers, with focus on increasing this segment at least 60% by Fall 2020.
C. Increase availability of online programs by creating 3 new degree completion programs by Fall 2020.
D.Leveragefinancialaidtomaximizethenumberoftransferstudents.
GOAL 3: Grow new graduate enrollment 7% by Fall 2020.Strategies:
A. Add at least 4 new graduate degree programs by Fall 2020.
B. Increase number of programs that are completely online or have low residency requirements by at least 2 by Fall 2020.
C.Stabilizenewinternationalgraduateenrollmentto20-25%oftotalnewgraduatestudentsbyFall2020.
35650 FTIAC students include ~50 Promise Scholars entering in each Fall semester.36Measured by the number of in-state FTIACs from non-commutable counties in Michigan increasing by 50% to 200 by Fall 2020
30

STRATEGIC ENROLLMENT MANAGEMENT PLAN, 2015-2020
RETENTIONOurinternalstudyshowsthatwehavesignificantworktodoinordertoincreasetheretentionratesforthreeofourpopulations:first-year studentsmoving into their second year, second-year studentsmoving into their third year, and transfer studentsmoving into their second year. Student success is our number one priority and we have, therefore, put forward a set of strategies that will help us achieve the three retention goals listed below:
Retention Goal 1: Increase the first-year retention rate for full-time and part-time domestic FTIAC students (moving into their second year) from 71.2% to 79% by Fall 2020. Strategies:
A. Create a highly structured advising and support program with appropriate follow-ups and regular student interaction.
B. Strengthen the supplemental instruction (SI) program to target high fail rate courses.
C.EnsurestudentsparticipateinHighImpactPracticesduringtheirfirsttwoyears.
Retention Goal 2: Increase the Second-Year retention rate for full-time and part-time domestic FTIAC students (moving into their third year) from 56.2% to 65% by Fall 2020. Strategies:
A. Create a highly structured advising and support program with appropriate follow-ups and regular student interaction. B. Strengthen the supplemental instruction (SI) program to target high fail rate courses.
Retention Goal 3: Increase the First-Year retention rate for full-time and part-time domestic Transfer students from 67.2% to 80% by Fall 2020. Strategies:
A. Create a highly structured advising and support program with appropriate follow-ups and regular student interaction.
B. Strengthen the supplemental instruction (SI) program to target high fail rate courses.
31

STRATEGIC ENROLLMENT MANAGEMENT PLAN, 2015-2020
32
ENROLLMENT TARGETS
New Student Recruitment Incremental Goals
Fall 2015 Fall 2016 Fall 2017 Fall 2018 Fall 2019 Fall 2020
Domestic Freshmen 610 606 602 597 591 586
Domestic Transfers 690 676 662 648 634 620
Domestic Other 525 525 525 525 525 525
Domestic Graduate 357 361 366 371 376 381
International Freshmen 40 44 48 53 59 64
International Transfers 16 18 19 21 23 26
International Other 20 20 20 20 20 20
International Graduate 95 96 97 98 100 101
Retention goals
Cohort: Fall 15-16 Fall 16-17 Fall 17-18 Fall 18-19 Fall 19-20
Dom FTIAC 1st Yr Ret 71.2% 73.1% 75.1% 77% 79%
Dom Transfer 1st Yr Ret 67.2% 70.4% 73.6% 76.8% 80%
Cohort: Fall 15-17 Fall 16-18 Fall 17-19 Fall 18-20
Dom FTIAC 2nd Yr Ret 56.2% 59.1% 62.1% 65%

STRATEGIC ENROLLMENT MANAGEMENT PLAN, 2015-2020
33
APPENDIX A
Freshman Merit Scholarship Program
Annual Award Total Award* Criteria Renewal
$3,000 $12,000 3.25+GPA 15credits/term 24-26ACT 2.75GPA,SAP** 1090-1200 SAT
$5,000 $20,000 3.25+GPA 15credits/term 27-30ACT 3.00GPA,SAP** 1210-1350SAT
$7,000 $28,000 3.25+GPA 15credits/term 31-36ACT 3.00GPA,SAP** 1360-1600 SAT
FullRide*** FullRide*** 3.25+GPA 15credits/term Selection 3.00GPA,SAP**
* Over 4 years** Satisfactory Academic Progress*** Full-ride Merit Scholarships are available on a limited basis, and awarded through a competitive selection process. Students must have a complete application (including test scores and official transcripts) by December 1, 2015 to be considered for full-ride awards.

STRATEGIC ENROLLMENT MANAGEMENT PLAN, 2015-2020
34
APPENDIX B
SEM Committee Membership
Steering CommitteeDouglas Knerr, Co-Chair (Provost and Vice Chancellor for Academic Affairs)Barbara Avery, Co-Chair (Vice Chancellor for Campus Inclusion and Student Life)Bob Barnett (Dean, SEHS)VahidLotfi(SeniorViceProvostandDeanofGraduatePrograms)Brad Maki (Director, Graduate Admissions)Greg Laurence (Assistant Professor, Management)Susan Gano-Phillips (Dean, CAS)Aimi Moss (Director, Student Success Center)Roy Barnes (Associate Dean, CAS)Jay Gandhi (Director, AIMS)
Recruitment Sub-CommitteeBrad Maki, Co-Chair (Director, Graduate Admissions)Greg Laurence, Co-Chair (Assistant Professor, Management)Lori Vedder (Director, Financial Aid)Jon Davidson (Director, Undergraduate Admissions)Dan Adams (Director, International Center)Melissa Brown (Assistant Director, University Relations)Chris Heidenreich (Assistant Professor, Music)Melva Craft-Blacksheare (Assistant Professor, Nursing)DeborahWhite(Director,OfficeofExtendedLearning)
Retention Sub-CommitteeSusan Gano-Phillips, Co-Chair (Associate Dean, CAS)Aimi Moss, Co-Chair (Director, Student Success Center)Jerry Glasco (Director, Financial Services and Budget)Jan Furman (Professor of English and Program Director, MA in Liberal Studies)Krista Hansen (Associate Professor, Mathematics)Stephen Turner (Associate Professor, Computer Science)Sarah Rosaen (Associate Professor, Communication)Amelia Biehl (Associate Professor, Economics)Kazuko Hiramatsu (Associate Professor, Linguistics)Chris Waters (Professor of Art, Associate Provost and Dean of Undergraduate Studies)Fawn Skarsten (Director, Institutional Analysis)Rob Montry (University Ombuds)Maureen Tippen (Clinical Assistant Professor, Nursing)
Data Sub-CommitteeRoy Barnes, Co-Chair (Associate Dean, CAS)Jay Gandhi, Co-Chair (Director, AIMS)Jon Davidson (Director, Undergraduate Admissions)Brad Maki (Director, Graduate Admissions)Aimi Moss (Director, Student Success Center)Karen Arnould (Registrar)Lori Vedder (Director, Financial Aid)Daniel Adams (Director, International Center)DeborahWhite(Director,OfficeofExtendedLearning)Fawn Skarsten (Director, Institutional Analysis)