enrollment and employees in postsecondary institutions
TRANSCRIPT

Enrollment and Employees in Postsecondary Institutions, Fall 2014; and Financial Statistics and Academic Libraries, Fiscal Year 2014 First Look (Provisional Data)
NCES 2016-005 U.S . DEPARTMENT OF EDUCATION

Enrollment and Employees in Postsecondary Institutions, Fall 2014; and Financial Statistics and Academic Libraries, Fiscal Year 2014 First Look (Provisional Data)
NOVEMBER 2015
Scott A. Ginder Janice E. Kelly-ReidFarrah B. MannRTI International
NCES 2016-005U.S. DEPARTMENT OF EDUCATION

U.S. Department of EducationArne DuncanSecretary
Institute of Education SciencesRuth NeildDeputy Director for Policy and ResearchDelegated Duties of the Director
National Center for Education StatisticsPeggy G. CarrActing Commissioner
Administrative Data DivisionRoss SantyAssociate Commissioner
The National Center for Education Statistics (NCES) is the primary federal entity for collecting, analyzing, and reporting data related to education in the United States and other nations. It fulfills a congressional mandate to collect, collate, analyze, and report full and complete statistics on the condition of education in the United States; conduct and publish reports and specialized analyses of the meaning and significance of such statistics; assist state and local education agencies in improving their statistical systems; and review and report on education activities in foreign countries.
NCES activities are designed to address high-priority education data needs; provide consistent, reliable, complete, and accurate indicators of education status and trends; and report timely, useful, and high-quality data to the U.S. Department of Education, the Congress, the states, other education policymakers, practitioners, data users, and the general public. Unless specifically noted, all information contained herein is in the public domain.
We strive to make our products available in a variety of formats and in language that is appropriate to a variety of audiences. You, as our customer, are the best judge of our success in communicating information effectively. If you have any comments or suggestions about this or any other NCES product or report, we would like to hear from you. Please direct your comments to
NCES, IES, U.S. Department of Education 1990 K Street NW Washington, DC 20006-5651
November 2015
The NCES Home Page address is http://nces.ed.gov.The NCES Publications and Products address is http://nces.ed.gov/pubsearch.
This publication is only available online. To download, view, and print the report as a PDF file, go to the NCES Publications and Products address shown above.
This report was prepared for the National Center for Education Statistics under Contract No. ED-IES-13-C-0056 with RTI International. Mention of trade names, commercial products, or organizations does not imply endorsement by the U.S. Government.
Suggested CitationGinder, S.A., Kelly-Reid, J.E., and Mann, F.B. (2015). Enrollment and Employees in Postsecondary Institutions, Fall 2014; and Financial Statistics and Academic Libraries, Fiscal Year 2014: First Look (Provisional Data) (NCES 2016-005). U.S. Department of Education. Washington, DC: National Center for Education Statistics. Retrieved [date] from http://nces.ed.gov/pubsearch.
Content ContactAurora D’Amico(202) [email protected]

iii
Acknowledgments
The authors would like to recognize the contributions of the postsecondary institutions and their representatives who provided the data upon which this report is based. This report would not have been possible without their invaluable contributions.

iv
Contents
Page
Acknowledgments ........................................................................................................................ iii
List of Tables ..................................................................................................................................v
Introduction ....................................................................................................................................1 IPEDS 2014-15 .............................................................................................................................1 Fall Enrollment .............................................................................................................................1 Finance ..........................................................................................................................................2 Human Resources .........................................................................................................................2 Academic Libraries .......................................................................................................................2
Selected Findings ............................................................................................................................4 Characteristics of Enrolled Students .............................................................................................4 Revenues and Expenses of Title IV Entities .................................................................................4 Employees in Postsecondary Institutions .....................................................................................4 Academic Library Collections ......................................................................................................4
Tables ..............................................................................................................................................5
Appendix A: Data Collection Procedures ....................................................................................1
Appendix B: Glossary of IPEDS Terms ......................................................................................1

v
List of Tables
Table Page
1. Number and percentage of students enrolled at Title IV institutions, by control of institution, student level, and other selected characteristics: United States, fall 2014 ........5
2. Amount and percentage distribution of revenues and expenses of all Title IV institutions and administrative offices, by level and control of institution, accounting standards utilized, and source of funds: United States, fiscal year 2014 ..........7
3. Number of staff at Title IV institutions and administrative offices, by control and level of institution, medical school staff status, and other selected characteristics: United States, fall 2014 ......................................................................................................10
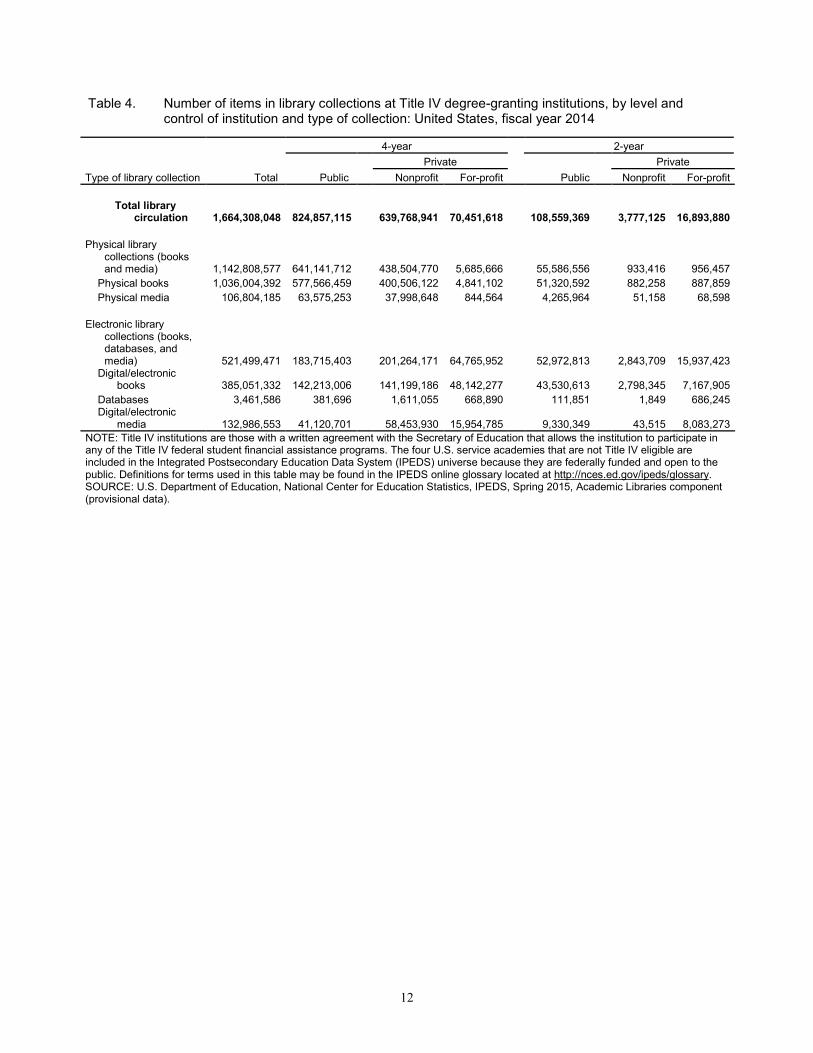
4. Number of items in library collections at Title IV degree-granting institutions, by level and control of institution and type of collection: United States, fiscal year 2014....................................................................................................................................12

1
Introduction
The Integrated Postsecondary Education Data System (IPEDS) collects institution-level data from postsecondary institutions in the United States (50 states and the District of Columbia) and other U.S. jurisdictions (see appendix A for a list of other U.S. jurisdictions). This First Look presents findings from the provisional data of the IPEDS spring 2015 data collection, which included four survey components: Enrollment at postsecondary institutions during fall 2014; Finance, for the 2014 fiscal year; Human Resources at postsecondary institutions during fall 2014, and Academic Libraries for the 2014 fiscal year. Data for all components were collected through the IPEDS web-based data collection system. Detailed information about the study methodology can be found at http://nces.ed.gov/pubsearch/pubsinfo.asp?pubid=2015098.
This First Look provides users with access to fully reviewed, edited, and imputed IPEDS data. These provisional data are an update to the previously released preliminary data, which had not been extensively reviewed or edited. Final data, including revisions to the provisional data submitted by institutions after the close of data collection, will be available during the next collection year (2015-16).
The purpose of this report is to introduce new data through tables containing descriptive information. The findings presented here demonstrate the range of information available through IPEDS; they include only a sample of the information collected and are not meant to emphasize any particular issue. While only a few of the data included in the spring 2015 collection are displayed in this First Look, all data from the spring 2015 collection are publicly available through the IPEDS Data Center, found at http://nces.ed.gov/ipeds/datacenter.
IPEDS 2014-15
Participation in IPEDS was required for institutions and administrative offices that participated in Title IV federal student financial aid programs such as Federal Pell Grants or Federal Stafford Loans during the 2014-15 academic year.1 A total of 7,310 institutions and 79 administrative offices (central or system offices) in the United States and other U.S. jurisdictions were expected to participate in the spring collection. Tables in this report focus on the 7,151 institutions and 76 administrative offices in the United States; however, data from institutions and administrative offices in both the United States and the other U.S. jurisdictions are available for download.
Detailed definitions of terms used in this report are available in the glossary (appendix B).
Fall Enrollment
The 2015 Fall Enrollment component collected student enrollment data for fall 2014. Data were collected on the race/ethnicity and gender of students, attendance status, and student level (undergraduate or graduate). Institutions were also required to report data by state of residency, while student age reporting was optional. In addition, data were collected on the number of
1 Institutions participating in Title IV programs are accredited by an agency or organization recognized by the Secretary of the U.S. Department of Education, have a program of more than 300 clock hours or 8 credit hours, have been in business for at least 2 years, and have a signed Program Participation Agreement with the Office of Postsecondary Education, U.S. Department of Education.

2
students enrolled exclusively in distance education courses, in any distance education courses, or in no distance education courses. These data were reported by student level, undergraduate degree-seeking status, and student residence location (i.e., in the same state or jurisdiction as the institution; in a different state or jurisdiction as the institution; outside the U.S.; or unknown).The Fall Enrollment component also collected retention rates and student-faculty ratios.
Finance
The 2015 Finance component collected financial statistics, such as institutional revenues and expenses, for the most recent fiscal year ending prior to October 2014 (fiscal year 2014). The Finance component is designed to follow the format of institutional financial statements suggested by the Financial Accounting Standards Board (FASB) and the Governmental Accounting Standards Board (GASB). Most public institutions and administrative offices follow GASB, so the figures in this report for public entities2 represent those following GASB standards.3 Aggregate totals for public entities using FASB standards are included in the footnotes of tables displaying Finance data. All private entities use FASB standards. Private for-profit institutions were required to report more detailed data beginning with the 2015 Finance component. This change was implemented to increase data comparability across institutional sectors.
Human Resources
The Human Resources (HR) component of IPEDS collected data on the number of staff on the institution’s payroll as of November 1, 2014. Institutions were required to report staff counts by employment status (full or part time), faculty status, and occupational category; reporting of staff counts by race/ethnicity and gender was optional. In addition to counts of staff, the HR component collected salary information for full-time staff.
During collections that start in an even-numbered year, such as this year (2014-15), the reporting of data by race/ethnicity and gender is optional, while during collections that start in an odd-numbered year (e.g., 2015-16), the reporting of these data is required.
Academic Libraries
The Academic Libraries (AL) component collected information from degree-granting institutions on library collections, expenditures, and services for fiscal year 2014. Institutions answer a screening question within the Institutional Characteristics component that determines the requirement to complete the AL component and the correct section to complete. The AL component consists of two sections: Section I collects data on the library collections and circulation numbers including physical books, media, digital or electronic books (including government documents), digital or electronic databases, and digital or electronic media and is to be completed by institutions reporting any library expenditures. Section II collects data on the number of branch and independent libraries as well as expenditures—including library staff wages and fringe benefits, materials and service costs, operations and maintenance expenditures, and interlibrary services—and is to be completed by institutions with total library expenditures
2 Throughout this publication, the term “entity” refers to both institutions and administrative offices. 3 Ninety-nine percent of public institutions used GASB, and 1 percent used FASB.

3
greater than $100,000. Institutions with no library expenditures were not required to respond to the AL component.

4
Selected Findings
Characteristics of Enrolled Students • In fall 2014, Title IV institutions enrolled approximately 17.7 million undergraduate and
about 2.9 million graduate students (table 1). Of the approximately 17.7 million undergraduates, about 60 percent were enrolled in 4-year institutions, nearly 39 percent in 2-year institutions, and almost 2 percent in less-than-2-year institutions.
Revenues and Expenses of Title IV Entities • In fiscal year 2014, public 4-year institutions and administrative offices received about
20 percent of their revenues from tuition and fees, compared with just over 29 percent at private nonprofit entities and nearly 91 percent at private for-profit entities (table 2).
• During the same period, about 29 percent of expenses at public 4-year entities were for instruction, compared with approximately 43 percent at public 2-year entities and nearly 51 percent at public less-than-2-year entities (table 2).
Employees in Postsecondary Institutions • Title IV institutions and administrative offices reported employing approximately 4.1 million
individuals in fall 2014 (table 3). Of the 4.1 million individuals, about 2.5 million were employed full-time and about 1.6 million were employed part-time.
Academic Library Collections • Eligible Title IV degree-granting institutions reported approximately 1.1 billion items in
physical library collections (books and media) and about 521 million items in electronic library collections (digital/electronic books, databases, and digital electronic media) (table 4).

5
Tables Table 1. Number and percentage of students enrolled at Title IV institutions, by control of institution,
student level, and other selected characteristics: United States, fall 2014
Student level, level of institution, attendance status, gender, and race/ethnicity
Total Public Private
Nonprofit For-profit Number Percent Number Percent Number Percent Number Percent
Total students 20,663,464 100.0 14,765,873 100.0 4,015,094 100.0 1,882,497 100.0
4-year 13,493,388 65.3 8,257,250 55.9 3,966,228 98.8 1,269,910 67.5 2-year 6,845,040 33.1 6,457,732 43.7 39,287 1.0 348,021 18.5 Less-than-2-year 325,036 1.6 50,891 0.3 9,579 0.2 264,566 14.1 Full-time 12,805,895 62.0 8,459,290 57.3 3,020,309 75.2 1,326,296 70.5 Part-time 7,857,569 38.0 6,306,583 42.7 994,785 24.8 556,201 29.5 Men 8,950,025 43.3 6,596,380 44.7 1,710,083 42.6 643,562 34.2 Women 11,713,439 56.7 8,169,493 55.3 2,305,011 57.4 1,238,935 65.8 American Indian or Alaska Native 151,473 0.7 117,343 0.8 19,325 0.5 14,805 0.8 Asian 1,166,770 5.6 886,785 6.0 225,735 5.6 54,250 2.9 Black or African American 2,726,098 13.2 1,790,686 12.1 449,176 11.2 486,236 25.8 Hispanic or Latino 3,138,355 15.2 2,508,830 17.0 344,029 8.6 285,496 15.2 Native Hawaiian or Other Pacific
Islander 57,327 0.3 37,208 0.3 9,133 0.2 10,986 0.6 White 10,800,216 52.3 7,850,263 53.2 2,245,970 55.9 703,983 37.4 Two or more races 605,912 2.9 440,631 3.0 103,203 2.6 62,078 3.3 Race/ethnicity unknown 1,098,032 5.3 546,524 3.7 311,045 7.7 240,463 12.8 Nonresident alien 919,281 4.4 587,603 4.0 307,478 7.7 24,200 1.3
Undergraduate 17,748,487 100.0 13,355,695 100.0 2,789,951 100.0 1,602,841 100.0
4-year 10,578,411 59.6 6,847,072 51.3 2,741,085 98.2 990,254 61.8 Full-time 8,123,183 45.8 5,222,955 39.1 2,246,928 80.5 653,300 40.8 Part-time 2,455,228 13.8 1,624,117 12.2 494,157 17.7 336,954 21.0 Men 4,692,149 26.4 3,138,928 23.5 1,178,533 42.2 374,688 23.4 Women 5,886,262 33.2 3,708,144 27.8 1,562,552 56.0 615,566 38.4 American Indian or Alaska
Native 69,208 0.4 47,161 0.4 14,135 0.5 7,912 0.5 Asian 606,357 3.4 443,232 3.3 139,520 5.0 23,605 1.5 Black or African American 1,323,744 7.5 762,844 5.7 314,043 11.3 246,857 15.4 Hispanic or Latino 1,364,820 7.7 987,826 7.4 252,974 9.1 124,020 7.7 Native Hawaiian or Other Pacific
Islander 28,812 0.2 16,238 0.1 6,702 0.2 5,872 0.4 White 5,840,987 32.9 3,871,724 29.0 1,593,856 57.1 375,407 23.4 Two or more races 344,508 1.9 225,343 1.7 79,783 2.9 39,382 2.5 Race/ethnicity unknown 567,325 3.2 219,399 1.6 193,410 6.9 154,516 9.6 Nonresident alien 432,650 2.4 273,305 2.0 146,662 5.3 12,683 0.8
2-year 6,845,040 38.6 6,457,732 48.4 39,287 1.4 348,021 21.7
Full-time 2,760,633 15.6 2,421,022 18.1 30,508 1.1 309,103 19.3 Part-time 4,084,407 23.0 4,036,710 30.2 8,779 0.3 38,918 2.4
Men 2,955,965 16.7 2,824,594 21.1 13,661 0.5 117,710 7.3 Women 3,889,075 21.9 3,633,138 27.2 25,626 0.9 230,311 14.4 American Indian or Alaska
Native 65,354 0.4 61,097 0.5 830 # 3,427 0.2 Asian 374,663 2.1 361,785 2.7 1,199 # 11,679 0.7 Black or African American 991,448 5.6 900,881 6.7 8,629 0.3 81,938 5.1 Hispanic or Latino 1,487,126 8.4 1,406,618 10.5 4,874 0.2 75,634 4.7 Native Hawaiian or Other Pacific
Islander 21,259 0.1 18,626 0.1 129 # 2,504 0.2 White 3,318,506 18.7 3,169,001 23.7 20,570 0.7 128,935 8.0 Two or more races 196,843 1.1 186,151 1.4 749 # 9,943 0.6 Race/ethnicity unknown 293,444 1.7 259,991 1.9 1,387 # 32,066 2.0 Nonresident alien 96,397 0.5 93,582 0.7 920 # 1,895 0.1
See notes at end of table.

6
Table 1. Number and percentage of students enrolled at Title IV institutions, by control of institution, student level, and other selected characteristics: United States, fall 2014—Continued
Student level, level of institution, attendance status, gender, and race/ethnicity
Total Public Private
Nonprofit For-profit Number Percent Number Percent Number Percent Number Percent
Less-than-2-year 325,036 1.8 50,891 0.4 9,579 0.3 264,566 16.5
Full-time 251,512 1.4 25,562 0.2 8,865 0.3 217,085 13.5 Part-time 73,524 0.4 25,329 0.2 714 # 47,481 3.0
Men 90,670 0.5 23,811 0.2 3,853 0.1 63,006 3.9 Women 234,366 1.3 27,080 0.2 5,726 0.2 201,560 12.6 American Indian or Alaska
Native 3,732 # 2,097 # 51 # 1,584 0.1 Asian 10,894 0.1 1,175 # 984 # 8,735 0.5 Black or African American 81,372 0.5 5,656 # 2,066 0.1 73,650 4.6 Hispanic or Latino 76,307 0.4 7,483 0.1 3,227 0.1 65,597 4.1 Native Hawaiian or Other Pacific
Islander 1,388 # 278 # 26 # 1,084 0.1 White 129,523 0.7 31,160 0.2 2,792 0.1 95,571 6.0 Two or more races 7,519 # 1,383 # 127 # 6,009 0.4 Race/ethnicity unknown 12,505 0.1 1,649 # 279 # 10,577 0.7 Nonresident alien 1,796 # 10 # 27 # 1,759 0.1
Graduate 2,914,977 100.0 1,410,178 100.0 1,225,143 100.0 279,656 100.0 Full-time 1,670,567 57.3 789,751 56.0 734,008 59.9 146,808 52.5 Part-time 1,244,410 42.7 620,427 44.0 491,135 40.1 132,848 47.5 Men 1,211,241 41.6 609,047 43.2 514,036 42.0 88,158 31.5 Women 1,703,736 58.4 801,131 56.8 711,107 58.0 191,498 68.5 American Indian or Alaska Native 13,179 0.5 6,988 0.5 4,309 0.4 1,882 0.7 Asian 174,856 6.0 80,593 5.7 84,032 6.9 10,231 3.7 Black or African American 329,534 11.3 121,305 8.6 124,438 10.2 83,791 30.0 Hispanic or Latino 210,102 7.2 106,903 7.6 82,954 6.8 20,245 7.2 Native Hawaiian or Other Pacific
Islander 5,868 0.2 2,066 0.1 2,276 0.2 1,526 0.5 White 1,511,200 51.8 778,378 55.2 628,752 51.3 104,070 37.2 Two or more races 57,042 2.0 27,754 2.0 22,544 1.8 6,744 2.4 Race/ethnicity unknown 224,758 7.7 65,485 4.6 115,969 9.5 43,304 15.5 Nonresident alien 388,438 13.3 220,706 15.7 159,869 13.0 7,863 2.8
# Rounds to zero. NOTE: Title IV institutions are those with a written agreement with the Secretary of Education that allows the institution to participate in any of the Title IV federal student financial assistance programs. The four U.S. service academies that are not Title IV eligible are included in the Integrated Postsecondary Education Data System (IPEDS) universe because they are federally funded and open to the public. Students who self-identify with more than one race are included in the Two or more races category. Individuals who are in the United States on a visa or temporary basis, and who are not authorized to remain indefinitely, are included in the Nonresident alien category regardless of race or ethnicity. Students of Hispanic or Latino ethnicity are included in the Hispanic or Latino category regardless of race. Percentages in the columns of this table use the corresponding count in the Total students row as the denominator. Detail may not sum to totals because of rounding. Definitions for terms used in this table may be found in the IPEDS online glossary located at http://nces.ed.gov/ipeds/glossary. SOURCE: U.S. Department of Education, National Center for Education Statistics, IPEDS, Spring 2015, Fall Enrollment component (provisional data).

7
Table 2. Amount and percentage distribution of revenues and expenses of all Title IV institutions and administrative offices, by level and control of institution, accounting standards utilized, and source of funds: United States, fiscal year 2014
Source of funds
4-year 2-year Less-than-2-year Revenues or
expenses (in thousands) Percent
Revenues or expenses
(in thousands) Percent
Revenues or expenses
(in thousands) Percent
Public institutions (GASB standards1)
Total revenues and other sources $284,825,215 100.0 $56,563,937 100.0 $769,329 100.0
Operating revenues 173,694,284 61.0 16,133,397 28.5 345,595 44.9
Tuition and fees (net of allowances and discounts) 57,882,090 20.3
9,448,808 16.7 157,426 20.5
Grants and contracts 40,286,623 14.1 3,946,056 7.0 120,749 15.7 Federal (excludes FDSL loans) 24,427,493 8.6 1,795,547 3.2 25,888 3.4 State 5,208,575 1.8 1,606,029 2.8 66,326 8.6 Local 2,352,499 0.8 309,840 0.5 27,647 3.6 Private 8,298,056 2.9 234,640 0.4 887 0.1
Sales and services of auxiliary enterprises after deducting discounts and allowances 22,866,860 8.0
1,831,244 3.2 † †
Sales and services of hospitals 34,628,117 12.2 † † † † Sales and services of educational activities 8,213,202 2.9 156,939 0.3 6,241 0.8 Independent operations 1,399,047 0.5 † † † † Other operating revenues 8,418,346 3.0 750,350 1.3 61,180 8.0
Nonoperating revenues 95,961,542 33.7 38,111,087 67.4 411,012 53.4
Appropriations 50,752,941 17.8 24,513,829 43.3 301,058 39.1 Federal 1,705,882 0.6 113,230 0.2 12,015 1.6 State 48,485,918 17.0 13,720,703 24.3 140,150 18.2 Local 561,140 0.2 10,679,896 18.9 148,894 19.4
Nonoperating grants 14,025,465 4.9 12,349,183 21.8 96,255 12.5 Federal 11,187,296 3.9 10,837,272 19.2 88,943 11.6 State 2,659,043 0.9 1,389,730 2.5 6,551 0.9 Local 179,126 0.1 122,181 0.2 761 0.1
Gifts 7,076,065 2.5 243,340 0.4 4,740 0.6 Investment income 18,233,228 6.4 315,038 0.6 1,470 0.2 Other nonoperating revenues 5,873,842 2.1 689,697 1.2 7,488 1.0
Total other revenues and additions2 15,169,389 5.3 2,319,454 4.1 12,722 1.7
Capital appropriations 3,867,745 1.4 1,445,711 2.6 — — Capital grants and gifts 3,563,297 1.3 272,641 0.5 — — Additions to permanent endowments 1,106,470 0.4 17,236 # — — Other revenues and additions 6,631,877 2.3 583,866 1.0 — —
Total expenses $259,469,759 100.0 $54,639,999 100.0 $675,080 100.0
Instruction 75,558,634 29.1 23,415,420 42.9 342,811 50.8 Research 32,485,116 12.5 29,249 0.1 0 0.0 Public service 12,809,163 4.9 865,667 1.6 2,235 0.3 Academic support 21,480,777 8.3 4,789,804 8.8 59,169 8.8 Student services 12,595,381 4.9 5,731,547 10.5 61,888 9.2 Institutional support 22,819,392 8.8 8,987,974 16.4 130,237 19.3 Scholarships and fellowships (excluding discounts
and allowances) 9,881,832 3.8
6,116,073 11.2 25,843 3.8 Auxiliary enterprises 26,719,166 10.3 2,557,446 4.7 † † Hospital services 34,033,875 13.1 † † † † Independent operations 1,487,800 0.6 † † † † Other expenses and deductions 9,598,623 3.7 2,146,819 3.9 52,896 7.8 See notes at end of table.

8
Table 2. Amount and percentage distribution of revenues and expenses of all Title IV institutions and administrative offices, by level and control of institution, accounting standards utilized, and source of funds: United States, fiscal year 2014—Continued
Source of funds
4-year 2-year Less-than-2-year Revenues or
expenses (in thousands) Percent
Revenues or expenses
(in thousands) Percent
Revenues or expenses
(in thousands) Percent Private nonprofit institutions (FASB standards)
Total revenues and investment return $228,245,902 100.0 $703,208 100.0 $138,168 100.0
Tuition and fees 67,330,536 29.5 442,266 62.9 80,660 58.4 Government appropriations 834,702 0.4 20,335 2.9 25 #
Federal 469,510 0.2 12,632 1.8 25 # State 362,825 0.2 7,295 1.0 0 0.0 Local 2,367 # 408 0.1 0 0.0
Government grants and contracts 17,961,680 7.9 74,905 10.7 34,267 24.8 Federal 16,363,048 7.2 65,572 9.3 28,903 20.9 State 1,161,811 0.5 8,687 1.2 4,337 3.1 Local 436,821 0.2 646 0.1 1,027 0.7
Private gifts 18,932,512 8.3 34,984 5.0 2,462 1.8 Private grants and contracts 5,133,308 2.2 3,935 0.6 4,097 3.0 Contributions from affiliated entities 1,708,707 0.7 21,874 3.1 5,684 4.1 Investment return 57,109,230 25.0 42,873 6.1 3,391 2.5 Sales and services of educational activities 6,278,758 2.8 8,440 1.2 4,135 3.0 Sales and services of auxiliary enterprises 16,374,118 7.2 30,991 4.4 † † Hospital revenue 20,667,484 9.1 † † † † Independent operations revenue 6,761,831 3.0 † † † † Other revenue3 9,153,035 4.0 22,604 3.2 3,448 2.5
Total expenses $172,000,999 100.0 $710,964 100.0 $137,779 100.0
Instruction 56,514,305 32.9 292,356 41.1 67,172 48.8 Research 17,734,396 10.3 441 0.1 2 # Public service 2,458,106 1.4 1,846 0.3 564 0.4 Academic support 15,401,452 9.0 59,270 8.3 12,515 9.1 Student services 14,460,555 8.4 101,853 14.3 12,137 8.8 Institutional support 22,501,214 13.1 149,356 21.0 32,435 23.5 Net grant aid to students 863,327 0.5 4,641 0.7 59 # Auxiliary enterprises 15,944,610 9.3 30,438 4.3 † † Hospital services 17,377,766 10.1 † † † † Independent operations 5,693,990 3.3 † † † † Other expenses 3,051,280 1.8 70,761 10.0 12,894 9.4 Private for-profit institutions(FASB standards)
Total revenues and investment return $17,845,848 100.0 $5,766,509 100.0 $3,710,052 100.0
Tuition and fees 16,187,061 90.7 5,110,351 88.6 3,149,990 84.9 Government appropriations 50,956 0.3 63,165 1.1 39,006 1.1
Federal 48,643 0.3 61,355 1.1 38,540 1.0 State 1,722 # 1,262 # 231 # Local 591 # 548 # 235 #
Government grants and contracts 710,290 4.0 225,394 3.9 114,646 3.1 Federal (excludes FDSL loans) 660,773 3.7 200,568 3.5 111,007 3.0 State 48,975 0.3 14,176 0.2 2,114 0.1 Local 542 # 10,650 0.2 1,525 #
Private gifts, grants and contracts 10,232 0.1 2,087 # 2,850 0.1 Investment income and investment gains (losses) 36,012 0.2 8,543 0.1 7,368 0.2 Sales and services of educational activities 222,739 1.2 100,123 1.7 242,206 6.5 Sales and services of auxiliary enterprises 395,510 2.2 87,050 1.5 † † Hospital services 144 # 0 0.0 † † Other revenue3 232,905 1.3 169,796 2.9 153,986 4.2 See notes at end of table.

9
Table 2. Amount and percentage distribution of revenues and expenses of all Title IV institutions and administrative offices, by level and control of institution, accounting standards utilized, and source of funds: United States, fiscal year 2014—Continued
Source of funds
4-year 2-year Less-than-2-year Revenues or
expenses (in thousands) Percent
Revenues or expenses
(in thousands) Percent
Revenues or expenses
(in thousands) Percent
Private for-profit (FASB standards)—Continued
Total expenses $16,031,478 100.0 $5,529,570 100.0 $3,312,968 100.0
Instruction 4,077,757 25.4 1,779,603 32.2 1,348,584 40.7 Research 5,136 # 364 # 3,438 0.1 Public service 10,057 0.1 1,962 # 2,282 0.1 Academic support 1,462,951 9.1 458,698 8.3 308,885 9.3 Student services 3,433,300 21.4 859,347 15.5 357,502 10.8 Institutional support 5,643,922 35.2 1,706,274 30.9 875,515 26.4 Net grant aid to students 32,306 0.2 5,899 0.1 13,581 0.4 Auxiliary enterprises 371,014 2.3 101,186 1.8 † † Hospital services 27 # 0 0.0 † † Other expenses 995,008 6.2 616,237 11.1 403,181 12.2 — Not available. Non-degree-granting institutions and administrative offices report the total other revenues and additions, but not the details. † Not applicable. Percentages are not calculated for negative revenues (losses). # Rounds to zero. 1In addition to the public institutions using Governmental Accounting Standards Board (GASB) standards, 18 public institutions (0.9 percent of public institutions) not displayed in this table reported $12.4 billion in revenue and investment return and $10.4 billion in expenses using Financial Accounting Standards Board (FASB) standards. 2Non-degree-granting institutions report the total other revenues and additions, but not the details. As a result, the details will not sum to the total. 3Other revenue is a calculated value and may be negative if the total revenue and investment return reported is less than the sum of the reported data in the detail revenues and investment return categories. NOTE: Title IV institutions are those with a written agreement with the Secretary of Education that allows the institution to participate in any of the Title IV federal student financial assistance programs. The four U.S. service academies that are not Title IV eligible are included in the Integrated Postsecondary Education Data System (IPEDS) universe because they are federally funded and open to the public. Due to differences between GASB standards and FASB standards, figures from public institutions are not comparable to figures from private institutions, even in categories with identical labels. Percentages in the columns of this table use the corresponding dollar amount in the appropriate total row of each section as the denominator. Detail may not sum to totals because of rounding. Definitions for terms used in this table may be found in the IPEDS online glossary located at http://nces.ed.gov/ipeds/glossary. SOURCE: U.S. Department of Education, National Center for Education Statistics, IPEDS, Spring 2015, Finance component (provisional data).

10
Table 3. Number of staff at Title IV institutions and administrative offices, by control and level of institution, medical school staff status, and other selected characteristics: United States, fall 2014
Occupational category and employment status
All institutions
Public Private Nonprofit For-profit
4-year 4-year 4-year Staff not
in medical schools1
Medical school1
staff 2-year Less-than-
2-year
Staff not in medical
schools1
Medical school1
staff 2-year Less-than-
2-year
Staff not in medical
schools1
Medical school1
staff 2-year Less-than-
2-year
Total staff 4,127,354 1,680,315 226,511 644,443 11,442 1,145,035 168,794 8,007 1,775 156,930 56 48,242 35,804 Full-time 2,535,342 1,105,166 182,067 304,309 6,485 664,054 142,089 5,080 1,244 69,430 28 30,745 24,645 Part-time 1,592,012 575,149 44,444 340,134 4,957 480,981 26,705 2,927 531 87,500 28 17,497 11,159 Instruction 1,569,207 483,205 61,479 361,434 6,296 463,257 44,538 4,427 893 98,715 56 26,038 18,869
Full-time 731,828 303,001 50,608 112,685 2,583 185,637 36,738 2,407 492 15,778 28 11,313 10,558 Part-time 837,379 180,204 10,871 248,749 3,713 277,620 7,800 2,020 401 82,937 28 14,725 8,311
Research 85,117 37,872 15,552 96 † 19,852 11,593 14 † 58 † 80 †
Full-time 70,443 29,825 13,623 85 † 16,803 10,041 6 † 31 † 29 † Part-time 14,674 8,047 1,929 11 † 3,049 1,552 8 † 27 † 51 †
Public service 27,271 10,265 4,760 3,600 † 1,881 6,693 4 † 65 † 3 †
Full-time 18,615 7,798 3,927 321 † 1,110 5,449 4 † 3 † 3 † Part-time 8,656 2,467 833 3,279 † 771 1,244 0 † 62 † 0 †
Librarians, curators, and archivists 43,788 18,589 300 5,726 33 17,240 354 136 24 939 † 377 70
Full-time 37,057 17,005 276 3,867 15 14,508 329 84 19 678 † 234 42 Part-time 6,731 1,584 24 1,859 18 2,732 25 52 5 261 † 143 28
Student and academic affairs and other
education services occupations 204,431 58,008 2,420 51,047 1,355 72,302 1,919 499 176 10,318 † 3,426 2,961 Full-time 114,450 41,182 1,929 21,780 997 31,830 1,345 341 146 9,346 † 3,051 2,503 Part-time 89,981 16,826 491 29,267 358 40,472 574 158 30 972 † 375 458
Management occupations 259,381 99,744 10,493 32,857 708 85,573 9,696 704 219 10,583 † 4,787 4,017
Full-time 251,493 96,626 9,965 31,632 654 83,283 9,396 665 203 10,475 † 4,710 3,884 Part-time 7,888 3,118 528 1,225 54 2,290 300 39 16 108 † 77 133
Business and financial operations
occupations 216,690 99,785 14,140 17,099 233 68,207 8,034 273 74 4,587 † 2,764 1,494 Full-time 186,405 92,735 12,863 15,238 198 48,998 7,668 226 67 4,446 † 2,629 1,337 Part-time 30,285 7,050 1,277 1,861 35 19,209 366 47 7 141 † 135 157
Computer, engineering, and science
occupations 242,040 117,772 25,446 17,003 136 60,633 18,252 110 20 2,108 † 391 169 Full-time 210,627 107,425 22,551 14,223 116 46,563 17,132 103 16 2,015 † 353 130 Part-time 31,413 10,347 2,895 2,780 20 14,070 1,120 7 4 93 † 38 39
Community, social service, legal, arts, design, entertainment, sports, and media occupations 172,664 76,783 4,484 23,457 136 57,927 2,389 252 36 6,391 † 533 276
Full-time 139,600 67,003 3,698 15,918 104 44,069 2,088 157 34 5,881 † 426 222 Part-time 33,064 9,780 786 7,539 32 13,858 301 95 2 510 † 107 54
See notes at end of table.

11
Table 3. Number of staff at Title IV institutions and administrative offices, by control and level of institution, medical school staff status, and other selected characteristics: United States, fall 2014—Continued
Occupational category and employment status
All institutions
Public Private Nonprofit For-profit
4-year 4-year 4-year Staff not in
medical schools1
Medical school1
staff 2-year Less-than-
2-year
Staff not in medical schools1
Medical school1
staff 2-year Less-than-
2-year
Staff not in medical schools1
Medical school1
staff 2-year Less-than-
2-year Healthcare practitioners and technical
occupations 116,230 34,116 37,671 1,917 207 13,008 28,900 67 1 169 † 101 73 Full-time 94,143 26,946 32,657 867 107 9,366 24,029 45 1 90 † 12 23 Part-time 22,087 7,170 5,014 1,050 100 3,642 4,871 22 0 79 † 89 50
Service occupations 245,383 118,658 7,489 36,350 707 71,743 6,752 382 45 1,673 † 770 814 Full-time 202,683 102,518 6,377 25,080 477 59,872 6,112 205 35 1,165 † 461 381 Part-time 42,700 16,140 1,112 11,270 230 11,871 640 177 10 508 † 309 433
Sales and related occupations 17,828 2,656 76 2,000 11 3,572 41 105 53 5,227 † 2,506 1,581
Full-time 14,984 2,089 73 1,066 7 2,861 37 91 53 5,158 † 2,239 1,310 Part-time 2,844 567 3 934 4 711 4 14 0 69 † 267 271
Office and administrative support
occupations 464,532 188,814 25,131 83,348 1,327 116,188 22,179 917 206 15,286 † 6,054 5,082 Full-time 376,617 155,138 22,660 54,499 1,013 98,944 20,504 656 163 14,050 † 5,015 3,975 Part-time 87,915 33,676 2,471 28,849 314 17,244 1,675 261 43 1,236 † 1,039 1,107
Natural resources, construction, and
maintenance occupations 74,890 47,254 636 7,197 202 17,476 985 102 25 251 † 390 372 Full-time 70,276 44,939 624 6,203 166 16,598 935 83 12 190 † 262 264 Part-time 4,614 2,315 12 994 36 878 50 19 13 61 † 128 108
Production, transportation, and
material moving occupations 19,524 12,555 273 1,298 91 4,758 294 15 3 190 † 21 26 Full-time 16,121 10,936 236 845 48 3,612 286 7 3 124 † 8 16 Part-time 3,403 1,619 37 453 43 1,146 8 8 0 66 † 13 10
Graduate assistants2 – teaching plus
various categories 368,378 274,239 16,161 14 † 71,418 6,175 † † 370 † 1 † Full-time † † † † † † † † † † † † † Part-time 368,378 274,239 16,161 14 † 71,418 6,175 † † 370 † 1 †
† Not applicable. 1Medical schools are defined as those that grant degrees in Doctor of Medicine (M.D.) and/or Doctor of Osteopathic Medicine (D.O.) programs. Also includes health or allied health schools or departments that are affiliated with (housed in or under the authority of) the medical school. 2By definition, all graduate assistants are part-time. NOTE: Title IV institutions are those with a written agreement with the Secretary of Education that allows the institution to participate in any of the Title IV federal student financial assistance programs. The four U.S. service academies that are not Title IV eligible are included in the Integrated Postsecondary Education Data System (IPEDS) universe because they are federally funded and open to the public. Military-specific occupations (Standard Occupational Classification [SOC] code 55-0000) are part of the SOC system but are not applicable to the IPEDS Human Resources (HR) component because IPEDS HR collects data on civilian staff. Definitions for terms used in this table may be found in the IPEDS online glossary located at http://nces.ed.gov/ipeds/glossary. SOURCE: U.S. Department of Education, National Center for Education Statistics, IPEDS, Spring 2015, Human Resources component (provisional data).
12
Table 4. Number of items in library collections at Title IV degree-granting institutions, by level and control of institution and type of collection: United States, fiscal year 2014
Type of library collection Total
4-year 2-year
Public
Private
Public
Private Nonprofit For-profit Nonprofit For-profit
Total library
circulation 1,664,308,048 824,857,115
639,768,941 70,451,618
108,559,369
3,777,125 16,893,880 Physical library
collections (books and media) 1,142,808,577 641,141,712
438,504,770 5,685,666
55,586,556
933,416 956,457 Physical books 1,036,004,392 577,566,459 400,506,122 4,841,102 51,320,592 882,258 887,859 Physical media 106,804,185 63,575,253 37,998,648 844,564 4,265,964 51,158 68,598
Electronic library collections (books, databases, and media) 521,499,471 183,715,403
201,264,171 64,765,952
52,972,813
2,843,709 15,937,423 Digital/electronic
books 385,051,332 142,213,006
141,199,186 48,142,277
43,530,613
2,798,345 7,167,905 Databases 3,461,586 381,696 1,611,055 668,890 111,851 1,849 686,245 Digital/electronic
media 132,986,553 41,120,701
58,453,930 15,954,785
9,330,349
43,515 8,083,273 NOTE: Title IV institutions are those with a written agreement with the Secretary of Education that allows the institution to participate in any of the Title IV federal student financial assistance programs. The four U.S. service academies that are not Title IV eligible are included in the Integrated Postsecondary Education Data System (IPEDS) universe because they are federally funded and open to the public. Definitions for terms used in this table may be found in the IPEDS online glossary located at http://nces.ed.gov/ipeds/glossary. SOURCE: U.S. Department of Education, National Center for Education Statistics, IPEDS, Spring 2015, Academic Libraries component (provisional data).

A-1
Appendix A: Data Collection Procedures
The spring 2015 collection was entirely web-based; data were collected between December 10, 2014, and April 8, 2015. Data were provided by “keyholders,” institutional representatives appointed by campus chief executives, who were responsible for ensuring that survey data submitted by the institution were correct and complete. No problems were noted during the spring 2015 data collection. During the collection period, the Integrated Postsecondary Education Data System (IPEDS) Help Desk was available to assist respondents with reporting the necessary data.
The IPEDS universe is established during the fall collection period. There were 7,389 Title IV institutions and administrative offices1 located in the United States and the other jurisdictions of the United States, such as Puerto Rico,2 in the 2014-15 academic year. The four U.S. service academies that are not Title IV eligible are included in the IPEDS universe because they are federally funded and open to the public.3
Because the Title IV institutions that are the focus of IPEDS are required to participate in IPEDS, the response rates in the spring 2015 IPEDS collection were high: rounding to 100 percent. Responses were missing for 8 institutions in the Fall Enrollment component,4 12 institutions in the Finance component,5 5 in the Human Resources component,6 and 3 in the Academic Libraries component.7
The National Center for Education Statistics (NCES) statistical standards require that the potential for nonresponse bias for all institutions (including those in other jurisdictions) be analyzed for sectors for which the response rate is less than 85 percent. Because response rates
1 Title IV institutions and administrative offices include 7,310 institutions and 79 administrative (central or system) offices. The central and system offices are required to complete the Institutional Characteristics component in the fall, the Human Resources component in the spring, and the Finance component in the spring (if they have their own separate budget). 2 The other U.S. jurisdictions surveyed in IPEDS are American Samoa, the Commonwealth of the Northern Mariana Islands, the Federated States of Micronesia, Guam, the Marshall Islands, Palau, Puerto Rico, and the U.S. Virgin Islands. 3 The four U.S. service academies that are not Title IV eligible are the U.S. Air Force Academy, the U.S. Coast Guard Academy, the U.S. Military Academy, and the U.S. Naval Academy. The U.S. Merchant Marine Academy is Title IV eligible. Data for all five institutions are included in the tables and counts of institutions unless otherwise indicated. 4 Eighteen Title IV institutions that were included in the IPEDS universe were not required to respond to the Fall Enrollment component because the institutions either closed or did not enroll students; hence, a total of 7,292 institutions were expected to respond. Of these, 7,284 provided data. 5 Nine Title IV institutions that were included in the IPEDS universe were not required to respond to the Finance component because the institutions either closed or did not enroll students; hence, a total of 7,380 institutions were expected to respond. Of these, 7,368 provided data. 6 Eighteen Title IV institutions that were included in the IPEDS universe were not required to respond to the Human Resources component because the institutions either closed or did not enroll students; hence, a total of 7,371 institutions and administrative offices were expected to respond. Of these, 7,366 provided data. 7 The Academic Libraries component was required of the subset of institutions that were degree-granting during the fiscal year and reported a library expenditure in the Institutional Characteristics component. As a result, 4,323 institutions were expected to respond to the Academic Libraries component. Of these, 4,320 provided data.

A-2
were at least 99.8 percent for each survey component, no such analysis was necessary. However, some institutions had all data imputed for the components where they were unit nonrespondents. For the Human Resources component there were 5 such institutions, for the Fall Enrollment component there were 8 such institutions, for the Finance component there were 12 such institutions, and for the Academic Libraries component there were 3 such institutions.
Some data are only required to be reported to IPEDS biennially. For the spring 2015 collection, these data include race/ethnicity and gender of employees reported in the Human Resources component, and enrollment data by student age in the Fall Enrollment component. IPEDS permits institutions to report these data in years when they are not required, should institutions choose to do so. These data are not included in this First Look report. Some 45 percent of Title IV institutions and administrative offices provided data by race/ethnicity and gender in the Human Resources component, and 42 percent of Title IV institutions submitted data by student age in the Fall Enrollment component.
Detailed information about the study methodology including imputation procedures can be found at http://nces.ed.gov/pubsearch/pubsinfo.asp?pubid=2015098.

B-1
Appendix B: Glossary of IPEDS Terms
administrative office: The system or central office in a multicampus environment.
auxiliary enterprises revenues: Revenues generated by or collected from the auxiliary enterprise operations of the institution that exist to furnish a service to students, faculty, or staff and that charge a fee that is directly related to, although not necessarily equal to, the cost of the service. Auxiliary enterprises are managed as essentially self-supporting activities. Examples are residence halls, food services, student health services, intercollegiate athletics, college unions, college stores, and movie theaters.
branch and independent libraries: Auxiliary library service outlets with quarters separate from the central library that houses the basic collection. The central library administers the branches. Libraries on branch campuses that have separate NCES identification numbers are reported as separate libraries.
business and financial operations occupations: An occupational category based on the major group Business and Financial Operations Occupations in the 2010 Standard Occupational Classification (SOC) Manual (http://www.bls.gov/soc/2010/soc130000.htm).
child institution: An institution that has its data reported by another institution, known as the parent institution.
community, social service, legal, arts, design, entertainment, sports, and media occupations: An occupational category based on the following three major groups in the 2010 Standard Occupational Classification (SOC) Manual: (1) Community and Social Service Occupations (http://www.bls.gov/soc/2010/soc210000.htm); (2) Legal Occupations (http://www.bls.gov/soc/2010/soc230000.htm); and (3) Arts, Design, Entertainment, Sports, and Media Occupations (http://www.bls.gov/soc/2010/soc270000.htm).
computer, engineering, and science occupations: An occupational category based on the following three major groups in the 2010 Standard Occupational Classification (SOC) Manual: (1) Computer and Mathematical Occupations (http://www.bls.gov/soc/2010/soc150000.htm); (2) Architecture and Engineering Occupations (http://www.bls.gov/soc/2010/soc170000.htm); and (3) Life, Physical, and Social Science Occupations (http://www.bls.gov/soc/2010/soc190000.htm).
control (of institution): A classification of whether an institution is operated by publicly elected or appointed officials (public control) or by privately elected or appointed officials and derives its major source of funds from private sources (private control).
degree/certificate-seeking students: Students enrolled in courses for credit who are recognized by the institution as seeking a degree or other formal award. At the undergraduate level, this is intended to include students enrolled in vocational or occupational programs.
Financial Accounting Standards Board (FASB): FASB is recognized by the American Institute of Certified Public Accountants (AICPA) as the body authorized to establish accounting standards. In practice it defers to the Government Accounting Standards Board (GASB) for the setting of accounting standards for local and state government entities.

B-2
first-time student (undergraduate): A student with no prior postsecondary experience attending any institution for the first time at the undergraduate level. Includes students enrolled in academic or occupational programs. Also includes students enrolled in the fall term who attended college for the first time in the prior summer term, as well as students who entered with advanced standing (college credits earned before graduation from high school).
full-time student: Undergraduate—A student enrolled for 12 or more semester credits, or 12 or more quarter credits, or 24 or more contact hours a week each term. Graduate—A student enrolled for 9 or more semester credits, or 9 or more quarter credits, or a student involved in thesis or dissertation preparation that is considered full time by the institution.
Governmental Accounting Standards Board (GASB): The GASB establishes accounting standards for local and state entities including governmental colleges and universities.
government appropriations (revenues): Revenues received by an institution through acts of a legislative body, except grants and contracts. These funds are for meeting current operating expenses and not for specific projects or programs. The most common example is a state’s general appropriation. Appropriations primarily to fund capital assets are classified as capital appropriations.
government grants: Transfers of money or property from a government agency to the education institution without a requirement to receive anything in return. These grants may take the form of grants to the institutions to undertake research or they may be in the form of student financial aid. (Used for reporting on the Finance component.)
graduate assistants (teaching): An occupational category based on the detailed occupation Graduate Teaching Assistants (SOC code 25-1191) in the 2010 Standard Occupational Classification (SOC) Manual (http:// www.bls.gov/soc/2010/soc251191.htm).
graduate student: A student who holds a bachelor’s degree, or equivalent, and is taking courses at the postbaccalaureate level. These students may or may not be enrolled in graduate programs.
healthcare practitioners and technical occupations: An occupational category based on the major group Healthcare Practitioners and Technical Occupations in the 2010 Standard Occupational Classification (SOC) Manual (http://www.bls.gov/soc/2010/soc290000.htm).
instructional staff: An occupational category that consists of the following two functions: (1) instruction only and (2) instruction combined with research and/or public service.
level of institution: A classification of whether an institution’s programs are 4 years or more (4-year), at least 2 but less than 4 years (2-year), or less than 2 years (less-than-2-year).
librarians: An occupational category based on the broad occupation Librarians in the 2010 Standard Occupational Classification (SOC) Manual (http://www.bls.gov/soc/2010/soc254020.htm).
librarians, curators, and archivists: An occupational category based on the following three broad occupations in the 2010 Standard Occupational Classification (SOC) Manual: (1) Librarians (http://www.bls.gov/soc/2010/soc254020.htm); (2) Archivists, Curators, and Museum Technicians (http://www.bls.gov/soc/2010/soc254010.htm); and (3) Library Technicians (http://www.bls.gov/soc/2010/soc254030.htm).

B-3
library: An organized collection of printed, microform, and audiovisual materials which (1) is administered as one or more units, (2) is located in one or more designated places, and (3) makes printed, microform, and audiovisual materials as well as necessary equipment and services of a staff accessible to students and to faculty. Includes units meeting the above definition which are part of a learning resource center.
library collections: Comprising documents held locally and remote resources for which permanent or temporary access rights have been acquired. Access rights may be acquired by the library itself, by a consortium, and/or through external funding. Acquisition is to be understood as securing rights and including it on the OPAC (online public access catalog) or other databases of the library.
library expenditures: Funds expended by the library (regardless of when received) from its regular budget and from all other sources, e.g., research grants, special projects, gifts and endowments, and fees for services.
library technicians: An occupational category based on the broad occupation Library Technicians in the 2010 Standard Occupational Classification (SOC) Manual (http://www.bls.gov/soc/2010/soc254030.htm).
management occupations: An occupational category based on the major group Management Occupations in the 2010 Standard Occupational Classification (SOC) Manual (http://www.bls.gov/soc/2010/soc110000.htm).
medical school staff: Staff employed by or staff working in the medical school (Doctor of Medicine [M.D.] and/or Doctor of Osteopathic Medicine [D.O.]) component of a postsecondary institution or in a free standing medical school. Does not include staff employed by or employees working strictly in a hospital associated with a medical school or those who work in health or allied health schools or departments such as dentistry, veterinary medicine, nursing, or dental hygiene unless the health or allied health schools or departments are affiliated with (housed in or under the authority of) the medical school.
natural resources, construction, and maintenance occupations: An occupational category based on the following three major groups in the 2010 Standard Occupational Classification (SOC) Manual: (1) Farming, Fishing, and Forestry Occupations (http://www.bls.gov/soc/2010/soc450000.htm); (2) Construction and Extraction Occupations (http://www.bls.gov/soc/2010/soc470000.htm); and (3) Installation, Maintenance, and Repair Occupations (http://www.bls.gov/soc/2010/soc490000.htm).
nonresident alien: A person who is not a citizen or national of the United States and who is in this country on a visa or temporary basis and does not have the right to remain indefinitely.
office and administrative support occupations: An occupational category based on the major group Office and Administrative Support Occupations in the 2010 Standard Occupational Classification (SOC) Manual (http://www.bls.gov/soc/2010/soc430000.htm).
Office of Postsecondary Education (OPE): Office within the U.S. Department of Education that formulates federal postsecondary education policy and administers programs that address critical national needs in support of its mission to increase access to quality postsecondary education.
parent institution: An institution that reports data for another institution, known as the child institution.

B-4
part-time student: Undergraduate—A student enrolled for either 11 semester credits or less, or 11 quarter credits or less, or less than 24 contact hours a week each term. Graduate—A student enrolled for either 8 semester credits or less, or 8 quarter credits or less, excluding those involved in thesis or dissertation preparation that is considered full time by the institution.
postsecondary education: The provision of a formal instructional program whose curriculum is designed primarily for students beyond the compulsory age for high school. This includes programs whose purpose is academic, vocational, and continuing professional education, and excludes avocational and adult basic education programs.
postsecondary education institution: An institution that has as its sole purpose, or one of its primary missions, the provision of postsecondary education. For IPEDS, this institution must be open to the public.
private for-profit institution: A private institution in which the individual(s) or agency in control receives compensation other than wages, rent, or other expenses for the assumption of risk.
private nonprofit institution: A private institution in which the individual(s) or agency in control receives no compensation, other than wages, rent, or other expenses for the assumption of risk. These include both independent nonprofit schools and those affiliated with a religious organization.
production, transportation, and material moving occupations: An occupational category based on the following two major groups in the 2010 Standard Occupational Classification (SOC) Manual: (1) Production Occupations (http://www.bls.gov/soc/2010/soc510000.htm) and (2) Transportation and Material Moving Occupations (http://www.bls.gov/soc/2010/soc530000.htm).
Program Participation Agreement (PPA): A written agreement between a postsecondary institution and the Secretary of Education. This agreement allows institutions to participate in any of the Title IV student assistance programs other than the State Student Incentive Grant (SSIG) and the National Early Intervention Scholarship and Partnership (NEISP) programs. The PPA conditions the initial and continued participation of an eligible institution in any Title IV program upon compliance with the General Provisions regulations, the individual program regulations, and any additional conditions specified in the program participation agreement that the Department of Education requires the institution to meet. Institutions with such an agreement are referred to as Title IV institutions.
programs of less than 2 years: Programs requiring less than 2 years of full-time-equivalent college-level work (4 semesters or 6 quarters) or less than 1,800 contact hours to obtain a degree, diploma, or certificate.
public institution: An educational institution whose programs and activities are operated by publicly elected or appointed school officials and which is supported largely by public funds.
public service staff: An occupational category used to classify persons whose specific assignments customarily are made for the purpose of carrying out public service activities such as agricultural extension services, clinical services, or continuing education. Regardless of title, academic rank, or tenure status, these employees formally spend the majority of their time carrying out public service activities. (This category includes employees with a public service assignment regardless of the location of the assignment [e.g., in the field rather than on campus]).
race/ethnicity: Categories developed in 1997 by the Office of Management and Budget that are used to describe groups to which individuals belong or identify with. The categories do not denote

B-5
scientific definitions of anthropological origins. The designations are used to categorize U.S. citizens, resident aliens, and other eligible noncitizens.
Individuals are asked to first designate ethnicity as: • Hispanic or Latino or • Not Hispanic or Latino
Second, individuals are asked to indicate all races that apply among the following: • American Indian or Alaska Native • Asian • Black or African American • Native Hawaiian or Other Pacific Islander • White
For reporting purposes, students who identify with more than one race are included in the Two or more races category.
research staff: An occupational category used to classify persons whose specific assignments customarily are made for the purpose of conducting research. Regardless of title, academic rank, or tenure status, these employees formally spend the majority of their time conducting research.
resident alien (and other eligible noncitizens): A person who is not a citizen or national of the United States but who has been admitted as a legal immigrant for the purpose of obtaining permanent resident alien status and who holds one of the following: an alien registration card (Form I-551 or I-151), a Temporary Resident Card (Form I-688), or an Arrival-Departure Record (Form I-94) with a notation that conveys legal immigrant status such as Section 207 Refugee, Section 208 Asylee, Conditional Entrant Parolee, or Cuban-Haitian.
sales and related occupations: An occupational category based on the major group Sales and Related Occupations in the 2010 Standard Occupational Classification (SOC) Manual (http://www.bls.gov/soc/2010/soc410000.htm).
sector: One of nine institutional categories resulting from dividing the universe according to control and level. Control categories are public, private nonprofit, and private for-profit. Level categories are 4 years and higher (4-year), at least 2 but less than 4 years (2-year), and less than 2 years (less-than-2-year). For example: public 4-year institutions.
service occupations: An occupational category based on the following five major groups in the 2010 Standard Occupational Classification (SOC) Manual: (1) Healthcare Support Occupations (http://www.bls.gov/soc/2010/soc310000.htm); (2) Protective Service Occupations (http://www.bls.gov/soc/2010/soc330000.htm); (3) Food Preparation and Serving Related Occupations (http://www.bls.gov/soc/2010/soc350000.htm); (4) Building and Grounds Cleaning and Maintenance Occupations (http://www.bls.gov/soc/2010/soc370000.htm); and (5) Personal Care and Service Occupations (http://www.bls.gov/soc/2010/soc390000.htm).
state and local government grants: State and local monies awarded to the institution under state and local student aid programs, including the state portion of State Student Incentives Grants (SSIG) (used for reporting Student Financial Aid data).

B-6
student and academic affairs and other education services occupations: An occupational category based on the following three minor groups in the 2010 Standard Occupational Classification (SOC) Manual: (1) Preschool, Primary, Secondary, and Special Education School Teachers (http://www.bls.gov/soc/2010/soc250000.htm#25-2000); (2) Other Teachers and Instructors (http://www.bls.gov/soc/2010/soc250000.htm#25-3000); and (3) Other Education, Training, and Library Occupations (http://www.bls.gov/soc/2010/soc250000.htm#25-9000).
Student Right-to-Know Act: Also known as the “Student Right-to-Know and Campus Security Act” (P.L. 101-542), which was passed by Congress November 9, 1990. Title I, Section 103, requires institutions eligible for Title IV funding to disclose completion or graduation rates of certificate- or degree-seeking, full-time students entering an institution to all students and prospective students. Further, Section 104 requires each institution that participates in any Title IV program and is attended by students receiving athletically related student aid to annually submit a report to the Secretary of Education. This report is to contain, among other things, graduation/completion rates of all students as well as students receiving athletically related student aid by race/ethnicity and gender and by sport, and the average completion or graduation rate for the four most recent years. These data are also required to be disclosed to parents, coaches, and potential student athletes when the institution offers athletically related student aid. The Graduation Rates component of IPEDS was developed specifically to help institutions respond to these requirements.
Title IV institution: An institution that has a written agreement with the Secretary of Education that allows the institution to participate in any of the Title IV federal student financial assistance programs (other than the State Student Incentive Grant [SSIG] and the National Early Intervention Scholarship and Partnership [NEISP] programs).
undergraduate student: A student enrolled in a 4- or 5-year bachelor’s degree program, an associate’s degree program, or a vocational or technical program below the baccalaureate level.
2-year institution: Any postsecondary institution that offers programs of at least 2 but less than 4 years’ duration, as well as occupational and vocational schools with programs of at least 1,800 hours and academic institutions with programs of less than 4 years. Does not include bachelor’s-degree-granting institutions where the baccalaureate program can be completed in 3 years.
4-year institution: Any postsecondary institution that offers programs of at least 4 years’ duration or one that offers programs at or above the baccalaureate level, as well as schools that offer postbaccalaureate certificates only or those that offer graduate programs only.