enprise group limited and subsidiaries … group limited and subsidiaries unaudited preliminary...
TRANSCRIPT

ENPRISE GROUP LIMITED AND SUBSIDIARIES UNAUDITED PRELIMINARY FINANCIAL STATEMENTS MARCH 2017

ENPRISE GROUP LIMITED AND SUBSIDARIES FINANCIAL STATEMENTS 31 MARCH 2017
PAGE
2
Contents
Directors’ Report 3 – 5 Auditor’s Report 6 –7 Statement of Financial Position 8 – 9 Statement of Comprehensive Income 10 – 11 Statement of Cash Flows 12 Statement of Changes in Equity 13 Notes to the Financial Statements 14 – 45 Corporate Information 46

ENPRISE GROUP LIMITED AND SUBSIDARIES FINANCIAL STATEMENTS 31 MARCH 2017
PAGE
3
Directors’ Report
The Directors are pleased to submit to shareholders their report and financial statements for the year ended 31 March 2017.
Principal Activities Enprise Group Limited (Enprise) currently has one operating division, Enprise Solutions, which is a solution provider for MYOB Enterprise software in Australia and New Zealand. Enprise has a joint venture, Datagate Innovation Limited (Datagate), an early stage business that provides online reporting and billing portals under a Software-as-a-Service (SaaS) model for resellers of Telco/Utility services and hosted service providers.
Significant Changes in the State of Affairs Enprise invested a further $250,000 in Datagate on 1 December 2016. The capital raising took place at $1.20 per share. If Enprise’s shares in Datagate were valued at the last external issue price, the value of the investment would be $2,050,000. The Datagate capital raising was more than twice oversubscribed raising a total of $1,042,794. As Enprise only took up its entitlement, Enprise’s share of Datagate was reduced to 44.19%.
Directors Mr Lindsay Phillips (appointed 1 December 2013) Mr George Cooper (appointed 10 April 2012) Mr Nicholas Paul (appointed 1 December 2015) Mr Mark Loveys (resigned 1 December 2015) Mr Jens Neiser (resigned 1 December 2015)
Remuneration of Directors The remuneration of the Directors for the year ended 31 March 2017 is set out below:
Group 2017 2016 $000 $000
Salaries, bonuses and commissions 211 261 Other benefits 50 12 Directors fees 65 63
Total compensation 326 336
Mark Loveys George Cooper Jens Neiser Lindsay Phillips Nicholas Paul
-
211 -
40 75
112 150
15 40 19
326 336

ENPRISE GROUP LIMITED AND SUBSIDARIES FINANCIAL STATEMENTS 31 MARCH 2017
PAGE
4
Rounding of Amounts Amounts in the directors’ report and financial statements have been rounded off to the nearest thousand dollars.
Review of Operations and Outlook Enprise is leveraging its position as the only MYOB EXO and MYOB Advanced reseller with offices in both New Zealand and Australia, to target trans-Tasman businesses. Enprise is well positioned to take advantage of the trend towards cloud while still having a stable, well supported, secure and continually developed on-premises offering. The Australian sales increased by 64.5% to $1.8 million, whilst New Zealand sales increased by 7.1% to $6.6 million. Profitability from operations before income tax increased by 38.9% to $839,000. Net tangible assets per share increased 107% to 11.8 cents per share. The company paid dividends during the year of 5 cents per share. The total dividend for the year was $335,193 of which $168,437 was reinvested through the dividend reinvestment plan. The company brought back 200,000 shares from Bridge 2 Limited that were issued as part of the purchase of Global Bizpro. The shares were purchased for 40 cents per share on 17 June 2016. Enprise invested $250,000 in Datagate during the year. Datagate had twenty one paying customers at 31 March 2017 representing annualised recurring revenue of $222,000, a 106% increase from 31 March 2016. The Datagate rights issue in December 2016 was more than twice subscribed. The total cash raised by Datagate was $1,042,429 with external investors subscribing $792,429 and Enprise $250,000. Consequently, Enprise stake in Datagate reduced to 44.19%. If the Enprise shares in Datagate of 1,708,333 were valued at the rights issue price of $1.20 per share, the value of Enprise’s Datagate investment would be $2,050,000. The actual carrying value of Datagate is $1,351,608 after a charge for the year (net of tax) of $295,720. The difference between the carrying value and the value at the last investment round is $698,392. Enprise is actively exploring other opportunities in the SME software market.
Donations Enprise made donations during the year of $870 (2016: $870). Directors Interests Number of
Shares
Lindsay Phillips* 1,447,411 George Cooper 404,523 Nicholas Paul 36,000
ENPRISE GROUP LIMITED AND SUBSIDARIES FINANCIAL STATEMENTS 31 MARCH 2017
PAGE
5
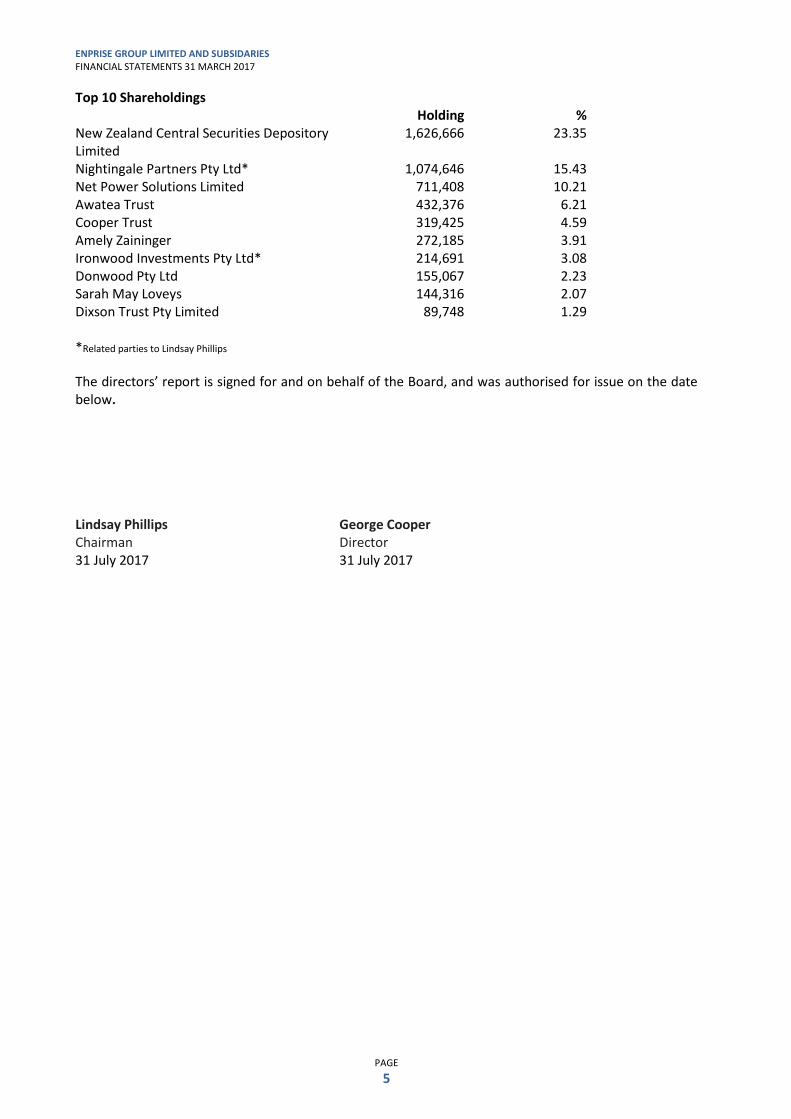
Top 10 Shareholdings Holding % New Zealand Central Securities Depository Limited
1,626,666 23.35
Nightingale Partners Pty Ltd* 1,074,646 15.43 Net Power Solutions Limited 711,408 10.21 Awatea Trust 432,376 6.21 Cooper Trust 319,425 4.59 Amely Zaininger 272,185 3.91 Ironwood Investments Pty Ltd* 214,691 3.08 Donwood Pty Ltd 155,067 2.23 Sarah May Loveys 144,316 2.07 Dixson Trust Pty Limited 89,748 1.29 *Related parties to Lindsay Phillips
The directors’ report is signed for and on behalf of the Board, and was authorised for issue on the date below. Lindsay Phillips George Cooper Chairman Director 31 July 2017 31 July 2017

ENPRISE GROUP LIMITED AND SUBSIDARIES FINANCIAL STATEMENTS 31 MARCH 2017
PAGE
6
Auditor’s Report
INDEPENDENT AUDITOR’S REPORT To the Shareholders of Enprise Group Limited Report on the Financial Statements

ENPRISE GROUP LIMITED AND SUBSIDARIES FINANCIAL STATEMENTS 31 MARCH 2017
PAGE
7
INDEPENDENT AUDITOR’S REPORT – Page 2

ENPRISE GROUP LIMITED AND SUBSIDARIES FINANCIAL STATEMENTS 31 MARCH 2017
PAGE
8
Statement of Financial Position
As at 31 March 2017
Note
2017 2016
$000 $000
ASSETS
Current Assets
Cash and cash equivalents 598 109
Trade and other receivables 11 1,342 1,079
Related party receivables 11 7 -
Lock Finance 57 58
Term Deposit 154 154
Deferred Tax asset 28 57 61
Staff receivables 8 5
Total Current Assets 2,223 1,466 Non-Current Assets Investments in equity accounted joint venture 12 1,352
1,397
Property, plant and equipment 13 104 108
Staff receivables 9 3
Intangible assets 14 1,825 1,890
Total Non-Current Assets 3,290 3,398
TOTAL ASSETS 5,513 4,864
LIABILITIES Current Liabilities
Trade and other payables 15 1,232 935
Related party payables 15 - 2
Provisions 16 193 142
Other liabilities 15 15
Total Current Liabilities 1,440 1,094 Non-Current Liabilities Other liabilities 34 49 Deferred tax liability 28 38 44
Total Non-Current Liabilities 72 93 TOTAL LIABILITIES 1,512 1,187
The above statement of financial position should be read in conjunction with the accompanying notes.

ENPRISE GROUP LIMITED AND SUBSIDARIES FINANCIAL STATEMENTS 31 MARCH 2017
PAGE
9
Statement of Financial Position (cont)
As at 31 March 2017
Note
2017 2016
$000 $000
EQUITY
Equity attributable to equity holders of the parent Contributed equity 17 2,936 2,823
Retained earnings 1,065 854
TOTAL EQUITY 4,001 3,677
TOTAL EQUITY AND LIABILITIES 5,513 4,864
For and on behalf of the Board, who authorise the issue of these financial statements on 31 July 2017:
Lindsay Phillips George Cooper
Chairman Director
31 July 2017 31 July 2017
The above statement of financial position should be read in conjunction with the accompanying notes.
ENPRISE GROUP LIMITED AND SUBSIDARIES FINANCIAL STATEMENTS 31 MARCH 2017
PAGE
10
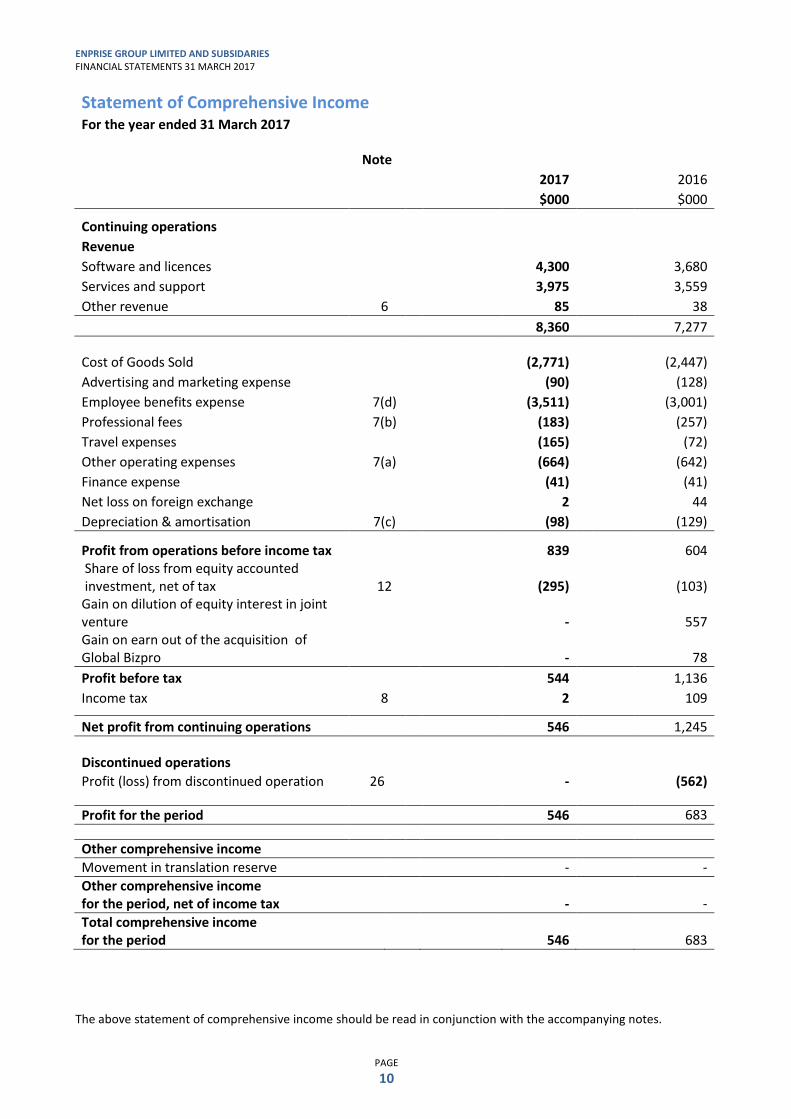
Statement of Comprehensive Income
For the year ended 31 March 2017 Note
2017 2016
$000 $000
Continuing operations
Revenue
Software and licences 4,300 3,680
Services and support 3,975 3,559
Other revenue 6 85 38
8,360 7,277
Cost of Goods Sold (2,771) (2,447)
Advertising and marketing expense (90) (128)
Employee benefits expense 7(d) (3,511) (3,001)
Professional fees 7(b) (183) (257)
Travel expenses (165) (72)
Other operating expenses 7(a) (664) (642)
Finance expense (41) (41)
Net loss on foreign exchange 2 44
Depreciation & amortisation 7(c) (98) (129)
Profit from operations before income tax 839 604 Share of loss from equity accounted investment, net of tax 12 (295) (103) Gain on dilution of equity interest in joint venture - 557 Gain on earn out of the acquisition of Global Bizpro - 78
Profit before tax 544 1,136
Income tax 8 2 109
Net profit from continuing operations 546 1,245
Discontinued operations
Profit (loss) from discontinued operation 26 - (562) Profit for the period 546 683
Other comprehensive income
Movement in translation reserve - -
Other comprehensive income for the period, net of income tax - -
Total comprehensive income for the period 546 683
The above statement of comprehensive income should be read in conjunction with the accompanying notes.

ENPRISE GROUP LIMITED AND SUBSIDARIES FINANCIAL STATEMENTS 31 MARCH 2017
PAGE
11
Statement of Comprehensive Income (cont)
Note
2017 2016
$000 $000
Profit (Loss) attributable to: Owners of the Parent 546 702
Non-controlling interest - (19)
Profit for the period 546 683
Total comprehensive income (loss) attributable to:
Owners of the Parent 546 702
Non-controlling interests - (19)
Total comprehensive income for the year 546 683
Earnings per share attributable to the ordinary equity holders of the company: 10
Basic earnings per share 0.078 0.103
Diluted earnings per share 0.078 0.103
Basic earnings per share from continuing operations * 0.078 0.181
Diluted earnings per share from continuing operations * 0.078 0.181
* 2016 includes the fair value adjustment of the investment in Datagate of $557,049.
The above statement of comprehensive income should be read in conjunction with the accompanying notes.
ENPRISE GROUP LIMITED AND SUBSIDARIES FINANCIAL STATEMENTS 31 MARCH 2017
PAGE
12
Statement of Cash Flows
For the year ended 31 March 2017
Note 2017 2016 $000 $000
Cash flows from operating activities Receipts from customers (inclusive of GST) 9,249 8,681 Payments to suppliers and employees (inclusive of GST) (8,293)
(8,158)
Interest paid (2) (41)
Interest received 21 12
Net cash flows used in operating activities 18 975
494
Cash flows from investing activities Purchase of property, plant and equipment (15)
(19)
Purchase of intangibles - (520)
Loans given to staff (25) -
Loans repaid by staff 15 29
Purchase of Global Bizpro - (296)
Proceeds for sale of Enprise Software 51 400
Investments in joint venture (250) - Net cash outflow on disposal of subsidiary following loss of control -
(488)
Net cash flows from / (used in) investing activities (224)
(894)
Cash flows from financing activities
Encap Loan - (100)
Nightingale Partners Loan - (336)
Dividends paid (335)
Proceeds from issue of shares 193 -
Share buyback (80)
Capital Raising – Datagate - 650
Lock Finance 1 (77)
Insurance loan (35) 1
Net receipts from related parties - 15
Net cash flows from financing activities (256) 153
Net increase/(decrease) in cash and cash equivalents 495
(247)
Net foreign exchange differences (6) (23) Cash and cash equivalents at beginning
of period 109
379
Cash and cash equivalents at end of period 598
109
The above statement of cash flows should be read in conjunction with the accompanying notes.

ENPRISE GROUP LIMITED AND SUBSIDARIES FINANCIAL STATEMENTS 31 MARCH 2017
PAGE
13
Statement of Changes in Equity
Share
capital
Retained earnings
Non-controlling
interest
2016
Total equity
Group Note $000 $000 $000 $000
Balance at 1 April 2015 2,823 171 - 2,994 Net profit / (loss) for the period - 702 (19) 683 Other comprehensive income - - - - Transferred on dilution of equity interest in joint venture - (19)
19 -
Total comprehensive income for the period - 683 - 683
Balance at 31 March 2016 2,823 854 - 3,677
Share capital
Retained earnings
Non-controlling
interest
2017
Total equity
Group $000 $000 $000 $000
Balance at 1 April 2016 2,823 854 - 3,677 Net profit / (loss) for the period: - 546 - 546 Other comprehensive income - - - - Total comprehensive income for the period - 546 - 546
Transactions with owners, recorded directly in equity 113 (335) - (222)
Balance at 31 March 2017 2,936 1,065 - 4,001
The above statement of changes in equity should be read in conjunction with the accompany notes.

ENPRISE GROUP LIMITED AND SUBSIDARIES FINANCIAL STATEMENTS 31 MARCH 2017
PAGE
14
Notes to the Financial Statements
For the year ended 31 March 2017
1 Corporate information
The financial statements represented are those for the Enprise Group Limited.
Enprise Group Limited is a company limited by shares incorporated and domiciled in New Zealand whose shares are publicly traded on the New Zealand Alternative Market (NZAX).
The nature of the operations and principal activities of the Group are described in the Directors’ Report section of this annual report.
2 Summary of significant accounting policies
Table of Contents
(a) Basis of preparation ......................................................................................................... 15
(b) Changes in accounting policies ........................................................................................ 15
(c) Statement of compliance ................................................................................................. 15
(d) New accounting standards and interpretations .............................................................. 15
(e) Basis of consolidation ....................................................................................................... 16
(f) Investment in subsidiaries ............................................................................................... 16
(g) Investment in equity accounted associates – refer note 12 ........................................... 17
(h) Segment reporting – refer note 5 .................................................................................... 17
(i) Foreign currency translation ............................................................................................ 17
(j) Cash and cash equivalents ............................................................................................... 18
(K) Trade and other receivables – refer note 11 ................................................................... 18
(l) Property, plant and equipment – refer note 13 .............................................................. 18
(m) Leases – refer note 21 ...................................................................................................... 18
(n) Intangibles – refer note 14 ............................................................................................... 19
(o) Trade and other payables – refer note 15 ....................................................................... 19
(p) Provisions and employee benefits – refer note 16 .......................................................... 19
(q) Revenue recognition – refer note 6 ................................................................................. 19
(r) Income tax and other taxes – refer note 8 ...................................................................... 20
(s) Earnings per share – refer note 10 ................................................................................... 21
(t) Impairment of non-financial assets ................................................................................. 21
(u) Contributed equity – refer note 17 .................................................................................. 21
(v) Discontinued operation – refer note 5 and 26…..……………………………….……...22
(w) Classificaction of investment...…………………………………………………..……....22

ENPRISE GROUP LIMITED AND SUBSIDARIES FINANCIAL STATEMENTS 31 MARCH 2017
PAGE
15
(a) Basis of preparation
The financial statements have been prepared under the historical cost convention, as modified by revaluations to fair value for certain classes of assets as described in the accounting policies. The financial statements are presented in New Zealand dollars and all values are rounded to the nearest thousand dollars ($000) unless otherwise stated.
(b) Changes in accounting policies
All policies have been applied on a basis consistent with the previous year.
(c) Statement of compliance
Enprise Group Limited is a FMC Reporting Entity under the Financial Markets Conduct Act 2013 and the Financial Reporting Act 2013 and its financial statements comply with these acts. The company is listed on the New Zealand Stock Exchange Alternate Market.
The financial statements have been prepared in accordance with New Zealand Generally Accepted Accounting Practice (“NZ GAAP”). The financial statements comply with New Zealand equivalents to International Financial Reporting Standards (“NZ IFRS”), as appropriate for profit-oriented entities. They also comply with International Financial Reporting Standards (“IFRS”).
(d) New accounting standards and interpretations
Standards and interpretations that have recently been issued or amended but are not yet effective have not been adopted by the Group for the annual reporting period ending 31 March 2017. These are outlined in the table below.
Reference Title Summary of requirements Effective date – periods
beginning on or after
Impact on Group financial report
Application date for Group*
NZ IFRS 9 Financial Instruments: Classification and Measurement
Requires all financial assets to be: (a) Classified on the basis of the entity’s
business model for managing the financial assets and the contractual cash flow characteristics of the financial asset.
(b) Initially measured at fair value plus, in the case of a financial asset not at fair value through profit or loss, particular transaction costs
(c) Subsequently measured at amortised cost or fair value.
1 January 2018
Application of a consistent approach to classifying financial assets, and the use of one impairment method.
1 April 2018
NZ IFRS 15 Revenue from Contracts with Customers
The core principle of the Standard is to recognise revenue for the amount of consideration due to an entity in exchange for goods and services provided to the customer. This is done following a 5 step process: (1) Identify the contract with the
customer (2) Identify the performance obligations
in the contract (3) Determine the transaction price (4) Allocate the transaction price to the
performance obligations in the contract and
(5) Recognise revenue when (or as) the entity satisfies a performance obligation by transferring control of an asset to a customer. This may be at a point in time or over time.
1 January 2018
Management is still conducting further analysis of the impact of this new standard.
1 April 2018

ENPRISE GROUP LIMITED AND SUBSIDARIES FINANCIAL STATEMENTS 31 MARCH 2017
PAGE
16
NZ IFRS 16 Leases NZ IFRS 16 removes the classification of leases as either operating or finance leases – for the lessee – effectively treating all leases as finance leases. Lessor accounting remains similar to current practice – i.e. lessors continue to classify leases as finance and operating leases. NZ IFRS 16 is effective for accounting periods beginning 1 January 2019. Early application of NZ IFRS 16 Leases is permitted only if the entity also applies NZ IFRS 15 Revenue from Contracts with Customers
1 January 2019
Management is still conducting further analysis of the impact of this new standard.
1 January 2019
(e) Basis of consolidation
The consolidated financial statements of Enprise Group Limited (“the Group”) comprise the financial statements of the parent and its subsidiaries (as outlined in note 5) as at 31 March each year.
Subsidiaries are all entities over which the parent has control. Control is obtained when the parent has power over the investee, is exposed to or has rights to variable returns from its investment and has the ability to use its power to affect returns.
Subsidiaries are fully consolidated from the date on which control is obtained by the Group.
The acquisition of subsidiaries is accounted for using the acquisition method of accounting. The acquisition method of accounting involves recognising at acquisition date, separately from goodwill, the identifiable assets acquired, the liabilities assumed and any non-controlling interest in the acquirer. The identifiable assets acquired and the liabilities assumed are measured at their acquisition date fair values. The difference between the above items and the fair value of the consideration is goodwill.
(f) Investment in subsidiaries
Subsidiary Percentage Held Balance Date Datasquirt (Australia) Pty Limited 100% 31 March Enprise Australia Pty Limited 100% 31 March Enprise Solutions Limited 100% 31 March Enprise Limited 100% 31 March GlobalBizpro Limited 100% 31 March
If the ownership interest in a subsidiary changes during the year that does not result in the loss of control, an entity shall disclose a schedule showing the effects of that change in ownership on the equity attributable to the owners of the parent.
If control of a subsidiary is lost, the group shall disclose the gain or loss recognised, if any, and the portion of that gain or loss attributable to recognising any investment retained in the former subsidiary at its fair value at the date when control is lost and the line item(s) in the Statement of Comprehensive Income in which the gain or loss is recognised, if not presented separately in the Statement of Comprehensive Income. Enprise reduced its equity stake in Datagate on 5 November 2015 to 69.75%. Datagate became a joint venture on 11 December 2015 when a further 569,000 shares were issued in conjunction with a Datagate shareholders agreement resulting in the Company losing control but maintaining joint control. This triggered a fair value adjustment to the carrying value of Enprise’s investment in Datagate. The capital raising took place at $1.00 per share, valuing the Company’s equity interest at $1,500,000. On 4
th February 2016 a further 242,000 shares were issued in Datagate
reducing the Enprise share to 50.65%. The company reduced its equity stake in Datagate on 1 December 2016 when a capital raising took place at $1.20 per share, valuing Enprise’s Datagate shares at $2,050,000. On 23
December 2016 the capital raising was completed,
the total cash raised in December 2016 was $1,042,794, reducing Enprise’s share to 44.19%

ENPRISE GROUP LIMITED AND SUBSIDARIES FINANCIAL STATEMENTS 31 MARCH 2017
PAGE
17
(g) Investment in equity accounted investments – refer note 12
Joint Venture Percentage Held Balance Date
Datagate Innovation Limited 44.19% 31 March
Associates are those entities in which the Group has significant influence, but not control or joint control, over the financial and operating policies. Significant influence is presumed to exist when the Group holds between 20 percent and 50 percent of the voting power of another entity.
Investment in Associates is accounted for under the equity method and is recognised initially at cost. The cost of the investment includes transaction costs.
The consolidated financial statements include the Group’s share of the profit or loss and other comprehensive income of equity accounted associate, after adjustments to align the accounting policies with those of the Group, from the date that significant influence commences until the date that significant influence ceases.
When the Group’s share of losses exceeds its interest in an equity accounted associate, the carrying amount of the investment, including any long-term investments that form part thereof, is reduced to zero, and the recognition of further losses is discontinued except to the extent that the Parent has an obligation or has made payments on behalf of the associate.
(h) Segment reporting – refer note 5
A business segment is a distinguishable component of the entity that is engaged in providing products or services that are subject to risks and returns that are different to those of other operating business segments. Operating segments are reported in a manner consistent with the internal reporting provided to the chief operating decision-maker. The chief operating decision-maker, who is responsible for allocating resources and assessing performance of the operating segments, has been identified as the Board of Directors that makes strategic decisions.
(i) Foreign currency translation
(i) Functional and presentation currency
Both the functional and presentation currency of Enprise Group Limited is New Zealand dollars ($). The subsidiaries’ and associate’s functional currency is the local currency which is translated to presentation currency (see below).
(ii) Transactions & balances
Subsidiary Functional Currency Presentation Currency
Datasquirt (Australia) Pty Limited Australian dollars ($) New Zealand dollars ($)
Enprise Australia Pty Limited Australian dollars ($) New Zealand dollars ($)
Enprise Solutions Limited New Zealand dollars ($) New Zealand dollars ($)
Enprise Limited New Zealand dollars ($) New Zealand dollars ($)
GlobalBizpro Limited New Zealand dollars ($) New Zealand dollars ($)
Transactions in foreign currencies are initially recorded in the functional currency by applying the exchange rates ruling at the date of the transaction. Monetary assets and liabilities denominated in foreign currencies are retranslated at the rate of exchange ruling at the reporting date.
Non-monetary items that are measured in terms of historical cost in a foreign currency are translated using the exchange rate as at the date of the initial transaction.

ENPRISE GROUP LIMITED AND SUBSIDARIES FINANCIAL STATEMENTS 31 MARCH 2017
PAGE
18
(iii) Translation of Group Companies functional currency to presentation currency
The results of the subsidiaries are translated into New Zealand dollars as at the date of each transaction. Assets and liabilities are translated at exchange rates prevailing at reporting date. Exchange variations resulting from the translation are recognised in the foreign currency translation reserve in equity.
(j) Cash and cash equivalents
Cash and cash equivalents in the statement of financial position comprise of cash at bank and in hand and short-term deposits with an original maturity of three months or less that are readily convertible to known amounts of cash and which are subject to an insignificant risk of changes in value.
For the purposes of the Statement of Cash Flows, cash and cash equivalents consist of cash and cash equivalents as defined above.
(k) Trade and other receivables – refer note 11
Trade receivables, which generally have 30-90 day terms, are recognised initially at fair value and subsequently measured at amortised cost using the effective interest method, less an allowance for impairment.
Collectability of trade receivables is reviewed on an ongoing basis at an operating unit level. Individual debts that are known to be uncollectible are written off when identified. An impairment provision is recognised when there is objective evidence that the Company will not be able to collect the receivable. Financial difficulties of the debtor, default payments or debts more than 90 days overdue are considered objective evidence of impairment.
(l) Property, plant and equipment – refer note 13
Property, plant and equipment are stated at historical cost less accumulated depreciation and any accumulated impairment losses. Such costs include the cost of replacing parts that are eligible for capitalisation when the cost of replacing the parts is incurred. The cost is recognised in the carrying amount of the plant and equipment as a replacement only if it is eligible for capitalisation. All other repairs and maintenance are recognised in the statement of comprehensive income as incurred.
Depreciation is calculated on a diminishing value basis over the estimated useful life of the specific assets:
Computer equipment – 20% to 50% Office furniture and equipment – 10% to 50%
The assets’ residual values, useful lives and amortisation methods are reviewed, and adjusted if appropriate, at each financial year end.
Derecognition
An item of property, plant and equipment is derecognised upon disposal or when no further future economic benefits are expected from its use. (m) Leases – refer note 21
Operating lease payments are recognised as an expense in the income statement on a straight-line basis over the lease term.

ENPRISE GROUP LIMITED AND SUBSIDARIES FINANCIAL STATEMENTS 31 MARCH 2017
PAGE
19
(n) Intangibles – refer note 14
Goodwill Goodwill that arises on the acquisition of subsidiaries are initially measured at cost of the business combination, being the excess of the consideration transferred over the fair value of the Subsidiaries’ net identifiable assets acquired and liabilities assumed. After initial recognition, goodwill is measured at the amount recognised at acquisition date less any accumulated impairment losses.
Other intangible assets Other intangible assets that are acquired by the Group and have finite useful lives are measured at cost less accumulated amortisation and accumulated impairment losses. See note 14.
Subsequent expenditure is capitalised only when it increases the future economic benefits embodied in the specific asset to which it relates. All other expenditure, including expenditure on internally generated intangible assets, is recognised in the statement of comprehensive income as incurred.
Except for goodwill, intangible assets are amortised on a straight-line basis in the statement of comprehensive income over their estimated useful lives, from the date that they are available for use.
The estimated useful lives for the current and comparative periods are as follows:
Software licenses 3-5 years
Customer relationships 5 years
Amortisation methods, useful lives and residual values are reviewed at each financial year-end and adjusted if appropriate. Research and development costs Research costs are expensed as incurred.
Development activities involve a plan or design for the production of new or substantially improved products and processes. Development expenditure is capitalised only if development costs can be measured reliably, the product or process is technically and commercially feasible, future economic benefits are probable and the Group intends to and has sufficient resources to complete development and to use or sell the asset. The expenditure capitalised includes the cost of materials, direct labour, overhead costs that are directly attributable to preparing the asset for its intended use. Capitalised development expenditure is measured at cost less accumulated depreciation and accumulated impairment losses.
(o) Trade and other payables – refer note 15
Trade and other payables are carried at amortised cost and due to their short term nature they are not discounted. They represent liabilities for services provided to the Group prior to the end of the financial year that are unpaid and arise when the Group becomes obliged to make future payments in respect of the purchase of these services. The amounts are unsecured and are usually paid within 30 days of recognition.
(p) Provisions and employee benefits – refer note 16
Provisions are recognised when the Group has a present obligation (legal or constructive) as a result of a past event, it is probable that an outflow of resources embodying economic benefits will be required to settle the obligation and a reliable estimate can be made of the amount of the obligation.
Provisions are measured at the present value of management’s best estimate of the expenditure required to settle the present obligation at the reporting date.
Employee leave benefits
Wages, salaries, annual leave
Liabilities for wages and salaries, including non-monetary benefits, and annual leave are recognised in respect of employees’ services up to the reporting date. They are measured at the amounts expected to be paid when the liabilities are settled.
(q) Revenue recognition
Revenue is recognised and measured at the fair value of the consideration received or receivable to the extent it is probable that the economic benefits will flow to the Group and the revenue can be reliably measured. The following specific recognition criteria must also be met before revenue is recognised:

ENPRISE GROUP LIMITED AND SUBSIDARIES FINANCIAL STATEMENTS 31 MARCH 2017
PAGE
20
(i) Rendering of services
Revenue includes software implementation and support services.
When the outcome of a transaction involving the rendering of services can be estimated reliably, revenue associated with the transaction is recognised by reference to the stage of completion of the transaction at the balance date. The outcome of a transaction can be estimated reliably when all the following conditions are satisfied:
The amount of revenue can be measured reliably;
It is probable that the economic benefits associated with the transaction will flow to the Group;
The stage of completion of the transaction at the balance date can be measured reliably; and
The cost incurred for the transaction and the costs to complete the transaction can be measured reliably
Contract revenue is also recognised under the percentage of completion method. A percentage of the revenue is recognised in the accounting period in which the services are rendered. The stage of completion is assessed by reference to surveys of work performed and delivered. When the outcome of an implementation and provisioning contract cannot be estimated reliably, contract revenue is recognised only to the extent of contract costs incurred that are likely to be recoverable. An expected loss on a contract is recognised immediately in profit or loss. When the contract outcome cannot be estimated reliably, revenue is recognised only to the extent of the expenses recognised that are recoverable. Contract income, which includes license fees, hosting fees and transaction fees, is recognised in the statement of comprehensive income in the accounting period in which the service is rendered, by reference to completion of the specific transaction assessed on the basis of the actual service provided.
(ii) Sale of goods
Revenue includes sales of software licenses.
The revenue from the sale of third party software is recognised at the time of sale. Revenue from in-house developed software is recognised on acceptance by the client.
The revenue from the maintenance on software developed by the Group is recognised over the period that the maintenance applies.
(iii) Interest revenue
Interest income is accrued on a time basis, by reference to the principal outstanding and at the interest rate applicable.
(iv) Rental income
Rental income is recognised in the income statement on a straight-line basis over the term of the lease. Lease incentives granted are recognised as an integral part of the rental income, over the term of the lease.
(r) Income tax and other taxes – refer note 8
Current tax assets and liabilities for the current and prior periods are measured at the amount expected to be recovered from or paid to the taxation authorities based on the current period’s taxable income. The tax rates and tax laws used to compute the amount are those that are enacted or substantively enacted by the reporting date.
On the basis that deferred income tax assets are recognised to the extent that it is probable that taxable profit will be available against which the carry-forward of unused tax credits and unused tax losses can be utilised.
Temporary differences that can reasonably be foreseen in the next accounting period have been recognised as a deferred tax asset. Enprise has not recognised the deferred Tax Losses due uncertainty of shareholder continuity in future periods.
Other taxes Revenues, expenses and assets are recognised net of the amount of GST except:
i. when the GST incurred on a purchase of goods and services is not recoverable from the taxation authority, in which case the GST is recognised as part of the cost of acquisition of the asset or as part of the expense item as applicable; and
ii. receivables and payables, which are stated with the amount of GST included.

ENPRISE GROUP LIMITED AND SUBSIDARIES FINANCIAL STATEMENTS 31 MARCH 2017
PAGE
21
The net amount of GST recoverable from, or payable to, the taxation authority is included as part of receivables or payables in the statement of financial position.
Cash flows are included in the Statement of Cash Flows on a gross basis and including the GST component of cash flows arising from investing and financing activities, which is recoverable from, or payable to, the taxation authority is classified as part of operating cash flows.
(s) Earnings per share – refer note 10
Basic earnings per share is calculated as net profit attributable to members of the parent, divided by the weighted average number of ordinary shares.
Diluted earnings per share is calculated as net profit attributable to members of the parent, divided by the weighted number of ordinary shares and dilutive potential ordinary shares.
(t) Impairment of non-financial assets
The carrying amounts of the Group’s non-financial assets are reviewed at each reporting date to determine whether there is any indication of impairment. If any such indication exists, then the asset’s recoverable amount is estimated.
Goodwill is tested annually for impairment. An impairment loss is recognised if the carrying amount of an asset or its related cash-generating unit (“CGU”) exceeds its estimated recoverable amount. The recoverable amount of an asset or CGU is the greater of its value in use and its fair value less costs to sell. For the purposes of impairment testing, goodwill is allocated to each of the Group’s cash-generating units that are expected to benefit from the synergies of the combination, irrespective of whether other assets or liabilities are assigned to those units. Impairment is determined by assessing the recoverable amount of the cash-generating unit to which the goodwill relates. The Group performs its impairment testing as at 31 March each year using the value in use method based on expected future revenue. When the recoverable amount of the cash-generating unit is less than the carrying amount, an impairment loss is recognised. Key assumptions used in determining the future cash flows from each segment over the next 5 years with a terminal value. The terminal value is based on a 2% perpetual growth rate after 5 years. These assumptions are based on continued growth in new products and services being delivered by Enprise to both new and existing customers. The Australian growth rate is higher than New Zealand as Enprise has assumed increased customer acquisition off a smaller base, therefore a higher rate as a percentage. The discount rate was estimated based on the weighted average cost of capital of similar public listed companies.
31 March 2017 Growth Rate Discount Rate Enprise Services – New Zealand 5% 20% Enprise Services – Australia 10% 20%
31 March 2016 Growth Rate Discount Rate Enprise Services – New Zealand 5% 20% Enprise Services – Australia 10% 20%
(u) Contributed equity – refer note 17
Ordinary shares are classified as equity. Incremental costs directly attributable to the issue of new shares or options are shown in equity as a deduction, net of tax, from the proceeds.

ENPRISE GROUP LIMITED AND SUBSIDARIES FINANCIAL STATEMENTS 31 MARCH 2017
PAGE
22
(v) Discontinued operation – refer to note 5 and 26
A discontinued operation is a component of the Group’s business, the operation and cash flows of which can be clearly distinguished from the rest of the Group and which: · represents a separate major line of business or geographical area of operations; · is part of a single co-ordinated plan to dispose of a separate major line of business or geographical area of operations; or · is a subsidiary acquired exclusively with a view to re-sale. Classification as a discontinued operation occurs at the earlier of disposal or when the operation meets the criteria to be classified as held for sale. (w) Classification of investments
Financial assets The Group classifies its investments in the following categories: financial assets at fair value through profit or loss, loans and receivables. The classification depends on the purpose for which the investments were acquired. Management determines the classification of its investments at the initial recognition and re-evaluates this designation at every reporting date. Income is recognised on an effective interest basis for debt instruments other than those financial assets designated as at fair value through the profit and loss. Financial assets at fair value through profit and loss Assets that comprise this category that is term deposits and fit-out loans are classified as current assets if they are expected to be realised within 12 months of the reporting date. Loans and Receivables Loans and receivables are non-derivative financial assets with fixed or determinable payments that are not quoted in an active market. They arise when the Group provides money, goods or services directly to a debtor with no intention of selling the receivable. They are included in current assets, except for those with maturities greater than 12 months after the reporting date which are classified as non-current assets. The Group’s loans and receivables comprise receivables and cash and cash equivalents. Interest income is recognised by applying the effective interest rate. Financial assets measurement Loans and receivables and held to maturity investments are carried at amortised cost using the effective interest method. Realised and unrealised gains and losses arising from changes in the fair value of the ‘financial assets at fair value through profit or loss’ category are included in the profit or loss in the period in which they arise. The Group assesses at each reporting date whether there is objective evidence that a financial asset or a group of financial assets is impaired.

ENPRISE GROUP LIMITED AND SUBSIDARIES FINANCIAL STATEMENTS 31 MARCH 2017
PAGE
23
3 Financial risk management objectives and policies
The Group’s principal financial instruments comprise receivables, payables and cash and short-term deposits.
The Group manages its exposure to key financial risks, including interest rate, liquidity risk and currency risk in accordance with the Group’s financial risk management policy. The objective of the policy is to support the delivery of the Group’s financial targets whilst protecting future financial security.
The Board reviews and agrees policies for managing each of the risks identified below, foreign currency and interest rate risk, credit allowances, and future cash flow forecast projections.
Risk exposures and responses Interest rate risk The Group’s exposure to market interest rates relates primarily to the Group’s cash deposited in interest-bearing call accounts. Interest rates are monitored although there is generally no significant variation in interest rates offered by the different major banks.
The local operational bank accounts do not earn interest.
At 31 March 2017, if interest rates had moved, as illustrated in the table below, with all other variables held constant, post-tax profit and equity would have been affected as follows:
Judgements of reasonably possible movements:
Post Tax Profit Higher/(Lower)
Equity Higher/(Lower)
2017 2016 2017 2016 $000 $000 $000 $000
Group +1% (100 basis points) 8 3 8 3 - 1% (100 basis points) (8) (3) (8) (3)
Credit risk Credit risk arises from the financial assets of the Group, being trade and other receivables. The Group’s exposure to credit risk arises from potential default of the counter party, with a maximum exposure equal to the carrying amount of these instruments. Exposure at balance date is addressed in each applicable note. The carrying amount of financial assets represents the maximum credit exposure. The maximum exposure to credit risk at the reporting date was as follows:
2017
2016
$000 $000 Loans and receivables 1,414 1,145 Cash and cash equivalents 598 109 Term deposits 154 154
Total 2,166 1,408
The Group does not hold any credit derivatives to offset its credit exposure.
The Group trades only with recognised, creditworthy third parties and as such collateral is not requested nor is it the Group’s policy to securitize its trade and other receivables.
It is the Group’s policy that all customers who wish to trade on credit terms are subject to credit verification procedures including an assessment of their independent credit rating, financial position, past experience and industry reputation. Risk limits are set for each individual customer in accordance with parameters set by the board. These risk limits are regularly monitored.
In addition, receivable balances are monitored on an ongoing basis with the result that the Group’s exposure to bad debts is not significant.

ENPRISE GROUP LIMITED AND SUBSIDARIES FINANCIAL STATEMENTS 31 MARCH 2017
PAGE
24
3 Financial risk management objectives and policies (cont)
The only significant concentration of credit risk within the Group exists in relation to cash and cash equivalents, the majority being held with two major trading banks.
Foreign currency risk
Each entity in the Group conducts the majority of its transactions in its functional currency.
The currency exposure of the Group arises from the effect of any substantial movements in currency rates on the transfer of funds (the large proportion being in Australian dollars) to the local currency of the subsidiary to fund operations.
The net exposure is not significant due to the size of the foreign operations and is mitigated by the regular transfer of small advances to spread the currency risk over time. Although each subsidiary or geographic segment is subject to variations in foreign currency rates, each segment is not material. Refer to note 5 on segment reporting.
The Group’s exposure to foreign currency risk was as follows based on notional amounts:
2017 2016 In thousands on Australian Dollars $000 $000 Cash and cash equivalents 63 57 Trade and other receivables 249 132 Trade and other payables (403) (151)
Net statement of financial position exposure (91) 38
The following significant exchange rates applied during the year: Average rate Reporting date spot rate 2017 2016 2017 2016 Australian Dollars 0.9383 0.9191 0.9174 0.9023
At 31 March 2016, if exchange rates had moved with all other variables held constant, the impact to the post tax profit and equity would not be material.
Liquidity risk
Liquidity risk represents the Group’s ability to meet its financial obligations on time. The Group’s cash flow enables it to make timely payments. The Management evaluates the Group’s liquidity requirements on an ongoing basis. The following tables set out the contractual cash flows for all financial liabilities:
Group – 2017 In thousands on New Zealand Dollars
Carrying amount
Contractual cash flow
6 months or less
6 – 12 months
1 – 2 years
2 – 5 years
Trade and other payables 1,234 1,234 1,234 - - - Related party payables - - - - - - Other liabilities 49 49 8 7 15 19
Total 1,283 1,283 1,242 7 15 19
Group – 2016
In thousands on New Zealand Dollars
Carrying amount
Contractual cash flow
6 months or less
6 – 12 months
1 – 2 years
2 – 5 years
Trade and other payables 935 935 935 - - - Related party payables 2 2 2 - - - Other liabilities 64 64 8 7 15 34
Total 1,001 1,001 945 7 15 34

ENPRISE GROUP LIMITED AND SUBSIDARIES FINANCIAL STATEMENTS 31 MARCH 2017
PAGE
25
4 Significant accounting judgements, estimates and assumptions
The preparation of the financial statements requires management to make judgements, estimates and assumptions that affect the reported amounts in the financial statements. Management continually evaluates its judgements and estimates in relation to assets, liabilities, contingent liabilities, revenue and expenses. Management bases its judgements and estimates on historical experience and on other various factors it believes to be reasonable under the circumstances, the results of which form the basis of the carrying values of assets and liabilities that are not readily apparent from other sources. Actual results may differ from these estimates under different assumptions and conditions. Impairment of goodwill
The Group tests annually whether goodwill has suffered any impairment, in accordance with the accounting policy stated in note 14. The recoverable amounts of cash-generating units have been determined based on value-in-use calculations. These calculations require the use of estimates (note 2(t))
Impairment of non-financial assets other than goodwill
The Group assesses impairment of all assets at each reporting date by evaluating conditions specific to the Group and to the particular asset that may lead to impairment. The Group follows the guidance of NZ IAS 36 to determine if a non-financial asset is impaired. This determination requires significant judgement. In making this judgement, the Group evaluates, among other factors, external sources of information, such as significant changes with adverse effect and market rates, as well as internal sources of information, such as evidence of obsolescence or physical damage.
Recognition of the deferred tax asset
The company continues to meet the shareholder continuity requirement to carry forward tax losses. However, the directors do not believe the company meets the level of certainty of recoverability of tax losses required to recognise a deferred taxation asset and hence have not accounted for the asset. Refer to note 8.
Classification of Datagate as a joint venture
Datagate is a limited liability company whose legal form confers separation between the parties to the joint arrangement and the company itself. Furthermore, the parties are bound by a shareholder agreement that governs each party’s rights and obligations. There are no other facts and circumstances that indicate that the parties to the joint arrangement have rights to the assets and obligations for the liabilities of the joint arrangement. Accordingly, Datagate is classified as a joint venture of the Group. Refer to note 27 for details

ENPRISE GROUP LIMITED AND SUBSIDARIES FINANCIAL STATEMENTS 31 MARCH 2017
PAGE
26
5 Segment information
In presenting information on the basis of geographical segments, segment revenue is based on the geographical location of customers. Segment assets are based on the geographical location of the assets.
The Board of Directors is the Group’s chief operating decision-maker. Management has determined the operating segments based on the information reviewed by the Board of Directors and the Chief Executive Officer for the purposes of allocating resources and assessing performance.
The geographic segments are described in the table below:
Legal Entity Location Geographic region
Enprise Group Limited (Parent) New Zealand New Zealand
Enprise Solutions Limited New Zealand New Zealand and Worldwide
Enprise Australia Pty Limited Australia Australia
Datasquirt (Australia) Pty Limited (Non-Trading)
Australia Australia
Enprise Limited (Non-Trading) New Zealand New Zealand
Global Bizpro Limited (Non-Trading) New Zealand New Zealand
Datagate Innovation Limited * New Zealand New Zealand
* Datagate has been recognised as a subsidiary until 11 December 2015 when the company lost control. From 11 December 2015, Datagate has been recognised as a joint venture as the Company has joint control.

ENPRISE GROUP LIMITED AND SUBSIDARIES FINANCIAL STATEMENTS 31 MARCH 2017
PAGE
27
5 Segment information (cont)
Geographic segments
The following table presents revenue, profit, and certain asset information regarding the subsidiaries’ performance for the year.
Year ended 31 March 2017
New Zealand
$000
Australia
$000 Asia
$000
North America
$000
EMEA $000
TOTAL
$000
Continued operations Revenue 6,381 1,813 81 - - 8,275 Other income 64 - - - - 64 Interest Received 21 - - - - 21
Total segment revenue 6,466 1,813 81 - - 8,360 Inter-segment elimination - - - - - -
Total group revenue 6,466 1,813 81 - - 8,360 Share of loss from equity accounted associate
(296) - - - - (296)
Inter-segment elimination - - - - - -
Net profit / (loss) 423 123 - - - 546 Depreciation & amortisation 98 - - - - 98 Capital expenditure 31 - - - - 31
Segment assets – current 2,438 311 - - - 2,749 Investments in equity accounted associate
1,352 - - - - 1,352
Segment assets – other non-current 1,780 158 - - - 1,938 Inter-segment elimination (526) - - - - (526)
Total group assets 5,044 469 - - - 5,513
Liabilities 1,108 930 - - - 2,038 Inter-segment elimination - (526) - - - (526)
Total group liabilities 1,108 404 - - - 1,512
Year ended 31 March 2016
New Zealand
$000
Australia
$000 Asia
$000
North America
$000
EMEA $000
TOTAL
$000
Revenue 6,122 1,087 30 - - 7,239 Other income 26 - - - - 26 Interest received 12 - - - - 12
Total segment revenue 6,160 1,087 30 - - 7,277 Inter-segment elimination - - - - - -
Total group revenue 6,160 1,087 30 - - 7,277
Discontinued operations Revenue 37 62 2 218 71 390 Interest received - - - - - -
Total group revenue 37 62 2 218 71 390
Total foreign sourced revenue - - - - - - Inter-segment elimination - - - - - -

ENPRISE GROUP LIMITED AND SUBSIDARIES FINANCIAL STATEMENTS 31 MARCH 2017
PAGE
28
5 Segment information (cont)
Year ended 31 March 2016
New Zealand
$000
Australia
$000 Asia
$000
North America
$000
EMEA $000
TOTAL
$000 Share of loss from equity accounted associate (103) - - - - (103) Inter-segment elimination - - - - - -
Net profit 692 (9) - - - 683
Depreciation & amortisation 129 - - - - 129
Capital expenditure 468 - - - - 468
Segment assets – current 1,997 190 - - - 2,187 Investments in equity accounted associate
1,397 - - - - 1,397
Segment assets – other non-current 1,846 155 - - - 2,001 Inter-segment elimination (721) - - - - (721)
Total group assets 4,519 345 - - - 4,864
Liabilities 1,023 885 - - - 1,908 Inter-segment elimination - (721) - - - (721)
Total group liabilities 1,023 164 - - - 1,187
*EMEA (Europe, Middle East and Africa)
Enprise Services
Enprise Software
Datagate Corporate Total
31 March 2017 Revenue 8,275 - - - 8,275 Other income 64 - - - 64
Total segment revenue 8,339 - - - 8,339 Interest received 15 - - 6 21
Total group revenue 8,354 - - 6 8,360
Interest expense - - - (2) (2) Depreciation and amortisation (98) - - - (98)
Total group expense (98) - - (2) (100)
Share of loss from equity accounted associated - - - (296) (296)
Net profit / (loss) 1,074 - - (528) 546
31 March 2016 Revenue 7,182 390 57 - 7,629 Other income 25 - - - 25
Total segment revenue 7,207 390 57 - 7,654 Interest received - - 1 12 13
Total group revenue 7,207 390 58 12 7,667
Interest expense (41) - - - (41) Depreciation (113) (39) (16) - (168)
Total group expense (154) (39) (16) - (209)
Share of loss from equity accounted associated - - - (103) (103)
Net profit / (Loss) 1,269 (562) (153) 129 683
Assets and liabilities are not reported by segment to the chief executive officer. They are reported on a consolidated group basis. Enprise Software is a discontinued operation. Enprise Software was sold to ProjectLine on 1 November 2015.

ENPRISE GROUP LIMITED AND SUBSIDARIES FINANCIAL STATEMENTS 31 MARCH 2017
PAGE
29
6 Other revenue
2017 2016 $000 $000
Interest income 21 13 Rent income 64 25
85 38
7 Expenses
2017 2016
$000 $000
(a) Other operating expenses
Communications 60 73 Premises (operating lease) 194 189 Other 410 380
664 642
(b) Professional fees
Directors fees 65 63 Accountancy 23 24 Auditor’s remuneration (See note 24) 88 66 Legal 7 104
183 257
(c) Depreciation and amortisation
Depreciation 33 20 Amortisation – Customer Relationship 65 65 Amortisation – Software - 44
98 129
(d) Employee benefits expense
Wages and salaries 3,439 2,922 Superannuation 72 79
3,511 3,001
ENPRISE GROUP LIMITED AND SUBSIDARIES FINANCIAL STATEMENTS 31 MARCH 2017
PAGE
30
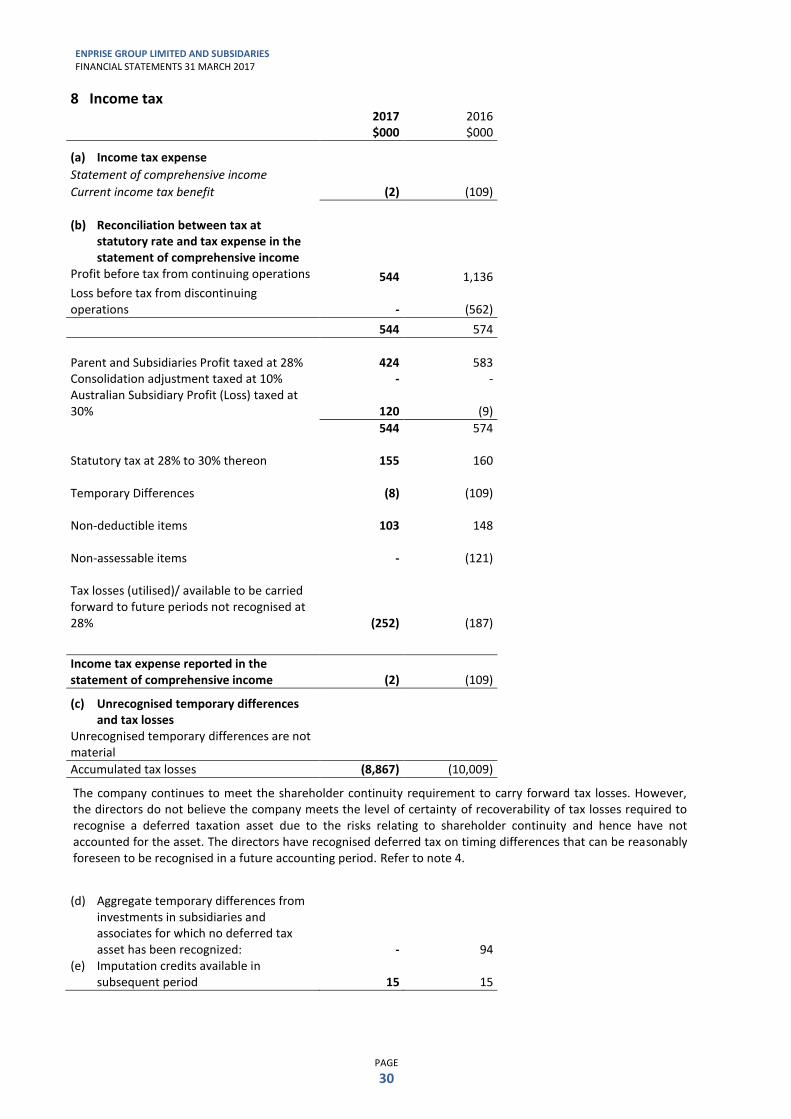
8 Income tax
2017 2016 $000 $000
(a) Income tax expense
Statement of comprehensive income
Current income tax benefit (2) (109)
(b) Reconciliation between tax at
statutory rate and tax expense in the statement of comprehensive income
Profit before tax from continuing operations 544 1,136 Loss before tax from discontinuing operations - (562)
544 574
Parent and Subsidiaries Profit taxed at 28% 424 583 Consolidation adjustment taxed at 10% - - Australian Subsidiary Profit (Loss) taxed at 30% 120 (9)
544 574 Statutory tax at 28% to 30% thereon 155 160 Temporary Differences (8) (109) Non-deductible items 103 148 Non-assessable items - (121) Tax losses (utilised)/ available to be carried forward to future periods not recognised at 28% (252) (187) Income tax expense reported in the statement of comprehensive income (2) (109)
(c) Unrecognised temporary differences
and tax losses Unrecognised temporary differences are not material
Accumulated tax losses (8,867) (10,009)
The company continues to meet the shareholder continuity requirement to carry forward tax losses. However, the directors do not believe the company meets the level of certainty of recoverability of tax losses required to recognise a deferred taxation asset due to the risks relating to shareholder continuity and hence have not accounted for the asset. The directors have recognised deferred tax on timing differences that can be reasonably foreseen to be recognised in a future accounting period. Refer to note 4.
(d) Aggregate temporary differences from investments in subsidiaries and associates for which no deferred tax asset has been recognized: - 94
(e) Imputation credits available in subsequent period 15 15

ENPRISE GROUP LIMITED AND SUBSIDARIES FINANCIAL STATEMENTS 31 MARCH 2017
PAGE
31
9 Dividends paid
A final dividend of 3.5 cents (2016: 3 cents) per share was declared on 2 June 2017, the record date is 3 July 2017. The dividend amount is $243,383 payable on 17 July 2017. The dividend reinvestment plan will not apply.
An interim dividend of 2.0 cents per share was paid on 18 November 2016. The dividend amount was $137,445. The dividend reinvestment plan applied resulting in 94,397 new shares being issued.
10 Earnings per share
The following reflects the income used in the basic and diluted earnings per share computations:
2017 2016 $000 $000
(a) Earnings used in calculating earnings per share
For basic earnings per share: Net profit attributable to ordinary equity holders of the parent 546 702
For diluted earnings per share: Net profit attributable to ordinary equity holders of the parent (from basic EPS) 546 702
Net profit attributable to ordinary equity holders of the parent 546 702
(b) Weighted average number of shares 2017 2016 Thousands Thousands
Balance as at 1 April 6,791 6,791 Issue of ordinary shares – Staff 50 - Cancellation of ordinary shares – Global Bizpro (200) - Issue of ordinary shares – Dividend Reinvestment Plan 325 -
Balance at end of year 6,966 6,791 Effect of dilution: Share options - -
Weighted average number of ordinary shares 6,837 6,791
2017 2016 Cents per share
Cents per share
Basic earnings per share for the continued operation 8.0 10.3
Basic earnings per share for the discontinued operation - (8.3)
Diluted earnings per share for the continued operation 8.0 10.3
Diluted earnings per share for the discontinued operation - (8.3)
The earnings and weighted average number of ordinary issued shares used in the calculation of basic earnings per share are as follows:
$000 Net Profit attributable to ordinary equity holders 546 No. Weighted average number of shares for the purpose of basic earnings per share
6,837,122
ENPRISE GROUP LIMITED AND SUBSIDARIES FINANCIAL STATEMENTS 31 MARCH 2017
PAGE
32
10 Earnings per share (cont)
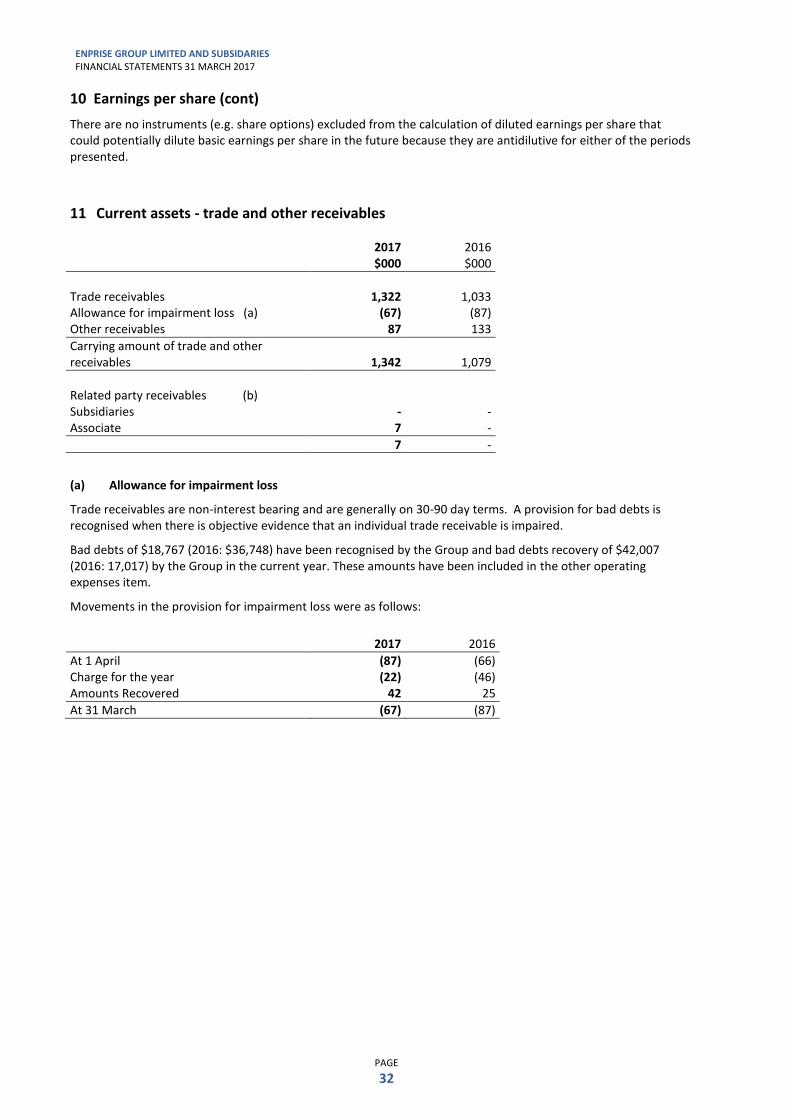
There are no instruments (e.g. share options) excluded from the calculation of diluted earnings per share that could potentially dilute basic earnings per share in the future because they are antidilutive for either of the periods presented.
11 Current assets - trade and other receivables 2017 2016 $000 $000
Trade receivables 1,322 1,033 Allowance for impairment loss (a) (67) (87) Other receivables 87 133
Carrying amount of trade and other receivables 1,342 1,079
Related party receivables (b) Subsidiaries - - Associate 7 -
7 -
(a) Allowance for impairment loss
Trade receivables are non-interest bearing and are generally on 30-90 day terms. A provision for bad debts is recognised when there is objective evidence that an individual trade receivable is impaired.
Bad debts of $18,767 (2016: $36,748) have been recognised by the Group and bad debts recovery of $42,007 (2016: 17,017) by the Group in the current year. These amounts have been included in the other operating expenses item.
Movements in the provision for impairment loss were as follows:
2017 2016
At 1 April (87) (66) Charge for the year (22) (46) Amounts Recovered 42 25
At 31 March (67) (87)

ENPRISE GROUP LIMITED AND SUBSIDARIES FINANCIAL STATEMENTS 31 MARCH 2017
PAGE
33
11 Current assets - trade and other receivables (cont) At 31 March 2017, the aging analysis of trade receivables is as follows:
Total 0 – 30 days 31 – 60
days 61- 90 days
PDNI* +91 days
PDNI* +91 days
CI*
2017 Group 1,322 833 250 48 124 67 2016 Group 1,033 684 176 42 44 87
Past due not impaired (PDNI) Considered impaired (CI) (b) Related Party Receivables
For terms and conditions of related party receivables refer to note 19.
(c) Fair value and credit risk Due to the short term nature of these receivables, their carrying value is assumed to approximate their fair value.
The maximum exposure to credit risk is the fair value of receivables. Collateral is not held as security, nor is it the Group's policy to transfer (on-sell) receivables to special purpose entities.
(d) Foreign exchange and interest risk For further information on the management of foreign exchange and interest risk refer to note 3.
12 Non-current assets – investments in equity accounted associate 2017 2016 $000 $000
Investments in associate – at cost 1,750 1,500 Share of loss (398) (103)
1,352 1,397
Please refer to note 27
The accounted associate is not a publicly listed entity and consequently does not have published price quotation.
The company reduced its equity stake in Datagate on 23 December 2016 to 44.19%. Enprise invested a further $250,000 in a capital raising. The capital raising took place at $1.20 per share, valuing the Company’s equity interest at $2,050,000. Datagate is an early stage software company that is incurring losses however it is actively marketing its product. The recoverability of the investment in the joint venture is dependent on the joint venture meeting its profit forecast. If the joint venture were unable to meet its profit forecast, adjustments may need to be made to the carrying value of the investment in joint venture. Further details on the joint venture is provided in note 27. Reconciliation of the net assets of the joint venture
Net assets of the joint venture 2,213 Proportion of the Group’s ownership interest in the joint venture 44.19% 978 Goodwill 374
Carrying amount of the Group’s interest in the joint venture 1,352

ENPRISE GROUP LIMITED AND SUBSIDARIES FINANCIAL STATEMENTS 31 MARCH 2017
PAGE
34
13 Non-current assets – property, plant and equipment
Computer
equipment Furniture
and fittings Office
equipment Total $000 $000 $000 $000
Year ended 31 March 2017 Cost 165 171 84 420 Accumulated depreciation and impairment (149) (94) (69) (312)
Carrying value at beginning of the year 16 77 15 108 Additions 31 - - 31 Disposals (1) - - (1) Depreciation charge for the year (13) (17) (4) (34)
Carrying value at the end of the year 33 60 11 104
At 31 March 2017
Cost 150 171 84 405
Accumulated depreciation and impairment (117) (111) (73) (301)
Net carrying amount 33 60 11 104
Computer
equipment Furniture
and fittings Office
equipment Total $000 $000 $000 $000
Year ended 31 March 2016 Cost 154 171 84 409 Accumulated depreciation and impairment (129) (76) (64) (269)
Carrying value at beginning of the year 25 95 20 140 Additions 19 - - 19 Disposals (8) - - (8) Depreciation charge for the year (20) (18) (5) (43)
Carrying value at end of year 16 77 15 108
At 31 March 2016 Cost 165 171 84 420 Accumulated depreciation and impairment (149) (94) (69) (312)
Net carrying amount 16 77 15 108

ENPRISE GROUP LIMITED AND SUBSIDARIES FINANCIAL STATEMENTS 31 MARCH 2017
PAGE
35
14 Non-current assets – intangible assets
Customer
relationship
Goodwill Software
licences Total $000 $000 $000 $000
Year ended 31 March 2017 Cost 329 1,626 - 1,955 Accumulated amortisation and impairment (65) - - (65)
Carrying value at the beginning of the year 264 1,626 - 1,890 Amortisation charge for the year (65) - - (65)
Carrying value at end of year 199 1,626 - 1,825
At 31 March 2017 Cost 329 1,626 - 1,955 Accumulated amortisation and impairment (130) - - (130)
Net carrying amount 199 1,626 - 1,825
Customer
Relationship Goodwill Software
licences (Restated)
Total $000 $000 $000 $000
Year ended 31 March 2016 Cost 329 2,145 1,838 4,312 Accumulated amortisation and impairment - - (700) (700)
Carrying value at the beginning of the year 329 2,145 1,138 3,612 Additions - - 449 449 Disposal of business - (532) (1,314) (1,846) Impairment - - (213) (213) Amortisation charge for the year (65) - (60) (125) Effect of foreign exchange differences - 13 - 13
Carrying value at end of year
264
1,626 - 1,890
At 31 March 2016 Cost 329 1,626 - 1,955 Accumulated amortisation and impairment (65) - - (65)
Net carrying amount 264 1,626 - 1,890
The carrying amount of goodwill allocated to Australia’s CGU is $417,244 and the carrying amount of goodwill for New Zealand’s is $1,209,080. Due to the divestment of Enprise Software and Datagate, goodwill decreased during the prior reporting period.

ENPRISE GROUP LIMITED AND SUBSIDARIES FINANCIAL STATEMENTS 31 MARCH 2017
PAGE
36
14 Non-current assets – intangible assets (cont) Description of the Group's intangible assets
Software Licenses
Software license costs are carried at cost less accumulated amortisation and accumulated impairment losses. This intangible asset has been assessed as having a finite life and is amortised using the straight line value method over a period of 5 years. The amortisation has been recognised in the statement of comprehensive income in the line item depreciation and impairment. If an impairment indication arises, the recoverable amount is estimated and an impairment loss is recognised to the extent that the recoverable amount is lower than the carrying amount.
Customer Relationships
Customer relationship costs are carried at cost less accumulated amortisation and accumulated impairment losses. This intangible asset has been assessed as having a finite life and is amortised using the straight line value method over a period of 5 years. The amortisation has been recognised in the statement of comprehensive income in the line item depreciation and impairment. If an impairment indication arises, the recoverable amount is estimated and an impairment loss is recognised to the extent that the recoverable amount is lower than the carrying amount.
15 Current liabilities - trade and other payables 2017 2016 $000 $000
Trade payables 560 387 Payroll liabilities 72 69 Insurance loan - 35 Other payables 600 444
Carrying amount of trade and other payables 1,232 935
Related party payables (a) Subsidiaries - - Other related parties (note 19) - 2
- 2
(a) Related party payables
For terms and conditions relating to related party payables refer to note 19.
(b) Fair value
Due to the short term nature of these payables, their carrying value is assumed to approximate their fair value.
(c) Foreign exchange and liquidity risk
For further information on the management of foreign exchange and liquidity risk refer to note 3.
16 Current liabilities – provisions 2017 2016 $000 $000
Employee entitlements 193 142
At 31 March 193 142
The staff leave entitlements which consist of holiday pay are due and payable, it is expected that they will be paid within the following 12 month period.

ENPRISE GROUP LIMITED AND SUBSIDARIES FINANCIAL STATEMENTS 31 MARCH 2017
PAGE
37
17 Contributed equity 2017 2016 $000 $000
Ordinary shares
(a) Ordinary shares
Issued and fully paid 2,936 2,823
Ordinary shares have no par value. Each share entitles the holder to one vote and the right to dividends.
Thousands $000
Movement in ordinary shares on issue
At 1 April 2016 6,791 2,823 Cancellation of ordinary shares (200) (80) Issue of ordinary shares 230 113 Issue of ordinary shares 50 25 Issue of ordinary shares 95 55
At 31 March 2017 6,966 2,936
On 1 February 2015, 200,000 shares were issued to Global Bizpro. The shares were issued at a price of $0.50 per share. These shares were brought back on 17 June 2016 at a price of 40 cents and subsequently cancelled.
On 22 July 2016, 230,231 shares were issued pursuant to a dividend reinvestment plan offered to eligible shareholders. The shares were issued at a price of $0.494 per share.
On 9 September 2016, 50,420 shares were issued in a private placement to staff. The shares were issued at a price of $0.50 per share.
On 18 November 2016, 94,397 shares were issued pursuant to a dividend reinvestment plan offered to eligible shareholders. The shares were issued at a price of $0.5795 per share.
The Group's objectives when managing capital, that is share capital, foreign translation reserve and retained earnings, are to safeguard the Group's ability to continue as a going concern in order to provide returns for shareholders and benefits for other stakeholders and to maintain an optimal capital structure to reduce the cost of capital. In order to maintain or adjust the capital structure, the group may adjust the amount of dividends paid to shareholders, return capital to shareholders, issue new shares or sell assets to reduce debt. Consistent with others in the industry, the group monitors capital on the basis of the gearing ratio. This ratio is calculated as net debt divided by total capital. Net debt is calculated as total borrowings (including current and non-current borrowings as shown in the consolidated balance sheet) less cash and cash equivalents. Total capital is calculated as equity as shown in the consolidated balance sheet plus net debt.
The Group is not subject to any externally imposed capital requirements.

ENPRISE GROUP LIMITED AND SUBSIDARIES FINANCIAL STATEMENTS 31 MARCH 2017
PAGE
38
18 Statement of cash flows reconciliation 2017 2016 $000 $000
Reconciliation of net profit to net cash flows from operations Net profit / (loss) 546 683 Adjustments for non-cash items: Depreciation and amortisation 98 168 Net loss (gain) on foreign exchange (2) (44) Gain on Datagate Joint Venture - (557) Income tax benefit 2 109 Gain on earn out of Global Bizpro - (78) Loss on sale of Enprise Software - 440 Share of loss from equity accounted Joint Venture 296 103
Changes in assets and liabilities (Increase)/decrease in trade and other receivables (270) 255 (Decrease)/increase in trade and other payables 320 (629) Decrease in other liabilities (15) (15) Net liabilities disposed of on dilution of Datagate - 59
Net cash from operating activities 975 494

ENPRISE GROUP LIMITED AND SUBSIDARIES FINANCIAL STATEMENTS 31 MARCH 2017
PAGE
39
19 Related party disclosure (a) Subsidiaries and joint venture
The consolidated financial statements include the financial statements of Enprise Group Limited, the subsidiaries and the associate, as listed in the following table: Subsidiary name Country of
incorporation Principal Activity
% of equity interest Investment ($000)
2017 2016 2017 2016
Datasquirt (Australia) Pty Limited * Australia Software sales - 100 - -
Enprise Solutions Limited New Zealand Software sales 100 100 2,075 2,075
Enprise Australia Pty Limited Australia Software sales 100 100 - -
Enprise Limited New Zealand Software sales 100 100 - -
Global Bizpro Limited New Zealand Software sales 100 100 - -
* Datasquirt (Australia) Pty Limited was deregistered in January 2017.
Joint Venture name Country of
incorporation Principal Activity
% of equity interest Investment ($000)
2017 2016 2017 2016
Datagate Innovation Limited New Zealand Software Sales 44.19 50.65 1,352 1,397 (b) Ultimate parent Enprise Group Limited is the ultimate New Zealand parent entity and the ultimate parent of the Group.
(c) Key management personnel Details relating to key management personnel, including remuneration paid, are included in note 20.
(d) Transactions with related parties
The following table provides the total amount of transactions that were entered into with related parties for the relevant financial year (for information regarding outstanding balances on related party trade receivables and payables at year-end, refer to notes 11 and 15 respectively):
Related Party Sales to related parties
Purchases from related parties
Amounts owed by related parties
Amounts owed to related parties
$000 $000 $000 $000
Group Datagate Innovation Limited 2017 58 - 7 - 2016 38 - - - Nicholas Paul (Director) 2017 - 50 - - 2016 - - - 2
The outstanding balance from The Sales Factory within creditors is related by Nicholas Paul

ENPRISE GROUP LIMITED AND SUBSIDARIES FINANCIAL STATEMENTS 31 MARCH 2017
PAGE
40
19 Related party disclosure (cont)
Terms and conditions of transactions with related parties:
(i) Shareholders and other related parties
During the year, the group provided and received services on standard commercial terms with related parties.
(ii) Subsidiaries
The transactions between the parent, Enprise Group Limited, and its subsidiaries, are comprised of cash advances from the parent to the subsidiaries, purchases made on behalf of one entity by another.
20 Key management personnel Compensation for key management personnel 2017 2016 $000 $000
Salaries, bonuses and commissions 211 261 Other benefits - 12 Directors fees 65 63
Total compensation 276 336
During the year, the number of employees or former employees, not being non-executive directors of Enprise Group Limited received remuneration and the value of other benefits that exceeded $100,000 as follows: 2017 2016 Number of employees
100,001 – 110,000 3 3 110,001 – 120,000 1 5 120,001 – 130,000 4 - 130,001 – 140,000 - 1 140,001 – 150,000 - 1 150,001 – 160,000 - 1 160,001 – 170,000 1 - 170,001 – 180,000 1 - 210,001 – 220,000 1 -

ENPRISE GROUP LIMITED AND SUBSIDARIES FINANCIAL STATEMENTS 31 MARCH 2017
PAGE
41
21 Commitments (i) Leasing commitments Lease commitments The Group has commercial lease commitments.
Enprise Solutions Limited – Auckland Office
The lease of Enprise Solutions Limited, Auckland Office, is for an initial term of 8 years, commencing 21 June 2012 with a renewal of a further six years. The renewal date is 21 June 2020. The final expiry date of the lease is 20 June 2026.
Enprise Solutions Limited – Wellington Office
The lease of Enprise Solutions Limited, Wellington office, is for a term of 12 months, commencing on the 1st February 2017. The lease expires on 31
st January 2018 with a renewal of a further one year.
Enprise Solutions Limited – Hamilton Office
The lease of Enprise Solution Limited, Hamilton office, commenced on the 5th November 2007. The lease agreement continues to operate until terminated by either party by way of 3 months’ notice in writing.
Enprise Australia Pty Limited – Melbourne Office
The lease of Enprise Australia Pty Limited, Melbourne office, commenced on the 1st December 2016 and is for a minimum term of 6 months expiring 31st May 2017. The lease agreement continues to operate until terminated by either party by way of 3 months’ notice in writing.
The total expense recognised for the year ended 31 March 2017 in relation to operating commitments is $194,339 (2016: $189,861).
Future minimum rentals payable under non-cancellable operating leases as at 31 March are as follows:
2017 2016 $000 $000
Within one year 132 124 After one year but not more than five years 288 390 After more than five years - -
Total minimum lease payments 420 514
(ii) Property, plant and equipment commitments The Group had no contractual obligations to purchase plant and equipment at balance date. (2016: $nil).
22 Contingencies
There were no known material contingent liabilities at 31 March 2017 (2016: $nil).
23 Events after the reporting date
There are no significant events after balance date

ENPRISE GROUP LIMITED AND SUBSIDARIES FINANCIAL STATEMENTS 31 MARCH 2017
PAGE
42
24 Auditor’s remuneration
2018 2017
$000 $000
Amounts received or due and receivable by
Staples Rodway Auckland for 2016 and
UHY Haines Norton Auckland for 2015:
Audit fees – UHY Haines Norton Auckland - 18 Audit fees – Staple Rodway Auckland 88 48
88 66
The auditor of Enprise Group Limited is Staples Rodway Auckland. UHY Haines Norton Auckland resigned as the auditor on 29 March 2016.
25 Financial instruments classification
Group
Non-derivative
financial liabilities
Loans and receivable
Available for sale
Fair value through profit
or loss 2017 Total
31 March 2017 $000 $000 $000 $000 $000
Financial Assets: Cash and cash equivalents - 598 - - 598 Trade and other receivables - 1,342 - - 1,342 Related party receivables - 7 - - 7 Lock Finance - 57 - - 57 Staff receivables - 18 - - 18 Term deposit - - - 154 154
Total - 2,022 - 154 2,176
Financial Liabilities: Trade and other payables 1,234 - - - 1,234 Related party payables - - - - - Other liabilities 51 - - - 51
Total 1,285 - - - 1,285
Group
Non-derivative
financial liabilities
Loans and receivable
Available for sale
Fair value through profit
or loss 2016 Total
31 March 2016 $000 $000 $000 $000 $000
Financial Assets: Cash and cash equivalents - 109 - - 109 Trade and other receivables - 1,079 - - 1,079 Lock finance - 58 - - 58 Staff receivables - 8 - - 8 Term deposit - - - 154 154
Total - 1,254 - 154 1,408
Financial Liabilities: Trade and other payables 935 - - - 935 Related party payables 2 - - - 2 Other liabilities 64 - - - 64
Total 1,001 - - - 1,001

ENPRISE GROUP LIMITED AND SUBSIDARIES FINANCIAL STATEMENTS 31 MARCH 2017
PAGE
43
25 Financial instruments classification (cont) The Lock Finance facility is secured over Trade Receivables of Enprise Solutions Limited and Enprise Australia Pty Limited.
26 Discontinued Operations On 1
st November 2016 Enprise sold its SAP Software add-on division, Enprise Software for a sale price of $451,045.
The consideration was received in cash. Identifiable assets acquired and liabilities sold
In thousands of New Zealand Dollars
2017 $000
2016 $000
Software Licenses 311 Fixed Assets – Computer Equipment - 3 Subscriptions in advance - (9)
Total identifiable net assets - 305
Results of discontinued operation Revenue - 390 Expenses - (512)
Results from operating activities - (122) Attributable income tax expense - -
- (122) Loss on disposal of Enprise Software - (227) Software impairment - (213)
Loss for the year from discontinued operations - (562)
Depreciation and amortisation for the year - (39)
Goodwill 1 April 2015 411 Sale proceeds (184)
Loss on Sale of Enprise Software (227)
Cash Flow included in these financial statements 2017 2016 $000 $000 Receipts from customers - 246 Payments to suppliers and employees - (556)
Net cash flows used in operating activities - (310) Purchase of property, plant and equipment - (3) Purchase of intangibles - (121) Proceeds from asset sale - 400
Net cash flows used in investing activities - 276
Net increase/(decrease) in cash and cash equivalents - (34)

ENPRISE GROUP LIMITED AND SUBSIDARIES FINANCIAL STATEMENTS 31 MARCH 2017
PAGE
44
27 Joint Venture Datagate is a New Zealand based company and was classified as a subsidiary until 11 December 2015, when the Company change the classification to a Joint Venture. The company reduced its equity stake in Datagate on 5 November 2015 to 69.75%. Datagate became a joint venture on 11 December 2015 when a further 569,000 shares were issued in conjunction with a Datagate shareholders agreement resulting in the Company losing control but maintaining joint control. This triggered a fair value adjustment to the carrying value of the Company’s investment in Datagate. The capital raising took place at $1.00 per share, valuing the Company’s equity interest at $1,500,000. On 4
th February 2016 a further 242,000 shares were issued in Datagate reducing the Enprise share to 50.65%.The
investment in the joint venture is measured using the fair value method. The company invested $250,000 in Datagate at $1.20 per share on 1 December 2016. The capital raising total of $1,042,794 reduced the company’s share of Datagate to 44.19% and valued the company’s investment at $2,050,000. The following is summarised financial information for Datagate Innovation, based on its financial statements prepared in accordance with IFRS. In thousands of New Zealand Dollars
Note
2016 $000
Revenue 103
Profit / (Loss) from continuing operation’s (368) Other comprehensive income -
Total comprehensive income / (loss) for the period (368)
Current assets 953 Non-current assets 1,150 Current liabilities (83) Non-current liabilities -
Net assets 2,020
Identifiable assets acquired and liabilities on derecognition Trade and other Debtors 24 Cash 488 Trade Creditors (81) Fixed Assets 4 Software Licenses 1,003
Net Assets 1,438
Financial Information as at 31 March 2017 2017 2016 000’s 000’s Trade and other Debtors 48 26 Cash 999 927 Trade Creditors (168) (83) Fixed Assets 14 4 Software Licenses 1,250 1,145
Net Assets 2,143 2,019
Charges to the Statement of Comprehensive Income of Datagate
2017 2016 000’s 000’s Depreciation and Amortisation (297) (89) Interest Income 14 6 Interest expense - (5) Income Tax - -

ENPRISE GROUP LIMITED AND SUBSIDARIES FINANCIAL STATEMENTS 31 MARCH 2017
PAGE
45
28 Deferred Tax Balances 2016 Recognised
in profit
2017
Deferred tax assets (liabilities) in relation to Customer relationships (74) 18 (56) Doubtful debts 18 - 18 Employee benefits and entitlements 37 8 45 Depreciation of Impaired Assets 36 (24) 12
Total deferred tax recognised 17 2 19
Current deferred tax Customer relationships (18) Doubtful debts 18 Employee benefits and entitlements 45 Depreciation of Impaired Assets 12
57
Non-current deferred tax Customer relationships (38)
(38)

ENPRISE GROUP LIMITED AND SUBSIDARIES FINANCIAL STATEMENTS 31 MARCH 2017
PAGE
46
Corporate Information New Zealand company number 1562383
ARBN (Australian Registered Body Number) 125 825 792 ABN (Australian Business Number) 41 125 825 792 Contact details New Zealand Principal place of business Level 2, 16 Hugo Johnston Drive Level 2, 16 Hugo Johnston Drive Penrose, Auckland 1061 Penrose, Auckland 1061 PO Box 62262 Phone: +64 9 829 5500 Sylvia Park Auckland 1644 Registered office
Phone: +64 9 829 5500 Level 2, 16 Hugo Johnston Drive Fax: +64 9 829 5501 Penrose, Auckland 1061 Australia Principal place of business – Australia P O Box R348 Suite 27, Waterman Business Centre Royal Exchange 1330 Ferntree Gully Road, Scoresby, VIC Sydney NSW 1225 Registered office – Enprise Australia Phone: +61 2 8355 7055 Level 3, 22 Market Street Fax: +61 2 8355 7045 Sydney, NSW 2000 Internet address www.enprisegroup.com Email [email protected] Directors George Cooper Chief Executive Officer Lindsay Phillips Chairman Nicholas Paul Non-executive Director Share Register Link Market Services Limited Level 7, Zurich House 21 Queen Street Auckland, New Zealand Phone: +64 9 375 5990 Enprise Group Limited shares are listed on the New Zealand Stock Exchange Alternative Market Auditor Staples Rodway Auckland, New Zealand Lawyer Hudson Gavin Martin, Auckland, New Zealand
Sean Joyce, Auckland, New Zealand Principal Bankers ASB Bank Limited, Auckland, New Zealand