enhancing the marketing mix factors in the upvc and
TRANSCRIPT
Enhancing the Marketing Mix Factors in the UPVC and Aluminium
Windows and Doors Industry in Egypt Eng. Hatem Shiba, Dr. Adel Elmahdy and Dr. Ahmed Ismail.
1. Abstract:
This research aims to evaluate the marketing mix factor and assess its effect on the competitive
advantage of the UPVC and Aluminium windows and doors industry in Egypt to explore the
most affected factors on the customers buying decisions; using the Fuzzy Hierocracy Process
(FAHP); in addition, to analyse the weight of each marketing mix factors affecting UPVC and
Aluminium industry. To prove the ability of the proposed framework based on actual study was
conducted in the UPVC and Aluminium windows and doors industry in Egypt for the year 2020.
Since there is no papers or thesis in the field of windows and doors in Egypt had been made
before so the researcher makes this paper to be a primary reference for the next research in the
field.
Keywords: UPVC, Aluminium, Windows, and Doors Industry.
2. Introduction:
The window is an opening in the wall to transfer light and air in. The bad effect of the window
is that it does not just transfer light in, it makes the heat goes out. gives the climate access and
may give undesirable guests access. Early "windows" in the brown metal that's copper and tin
and Iron Ages fought these disadvantages by utilizing shutters which had been made from wood
and even bringing animals skins and made scrapping and stretching to it and putting it in oils to
make them transparent and water resistant. The creation of glass made things a stride further by
giving a cover to windows which allows the transfer of light in and at the same time keeping any
other things out. The utilization of glass for building purposes started at the end of the 1st century
BC after the Romans found that by adding manganese oxide to other combination, they got a little
clear glass. This glass was just utilized in the buildings that have a great degree of importance.
The improvement of window glass creation techniques to deliver bigger, compliment pieces with
better clearness has affected the designer’s ideas of windows through days. It is the constraint of
the size of a window that gives us leaded lights and. It is interested that some advanced, costly,
glass impacts are amusements of what might have been blames, or even consuming in old glass.
old glass creation methods of projecting, blowing, and turning were with the end goal that solitary
little sheets of predictable thickness and clearness could be delivered. These then must be gotten
together with lead strips to create a sensible territory. As glass creation innovation created, larger
sheet could be delivered which offered ascend to the windows designing through the time utilizing
the largest size of sheets to give the clearest view.
2.1 The difference between UPVC and aluminium windows and doors:
2.1.1 UPVC windows:
UPVC means UN plasticized poly vinyl chloride; Germany was the first country that introduced
the UPVC windows to the world in the period of the 70s to mid-80s and turned out to be amazingly
well known in most of the world during the 80s.
2.1.2 Aluminium windows:
Aluminium is a metal characterized and differs from iron by its lighter weight but it is very strong
also its more flexible and not magnetized, it’s a great good conductor for electricity and it could
be used in combination with many other metals to form different alloys.
GSJ: Volume 9, Issue 4, April 2021 ISSN 2320-9186 1291
GSJ© 2021 www.globalscientificjournal.com
GSJ: Volume 9, Issue 4, April 2021, Online: ISSN 2320-9186 www.globalscientificjournal.com
2
3. Literature review:
Since there is no papers or thesis in the field of windows and doors in Egypt had made before so
we decide to make the literature review to be a study for this market in Egypt. In this paper we
are going to introduce the imports of the raw materials of windows and doors in Egypt from the
international trade centre ITC (www.trademap.org) and make analysis for this data to compare
between the three main materials of windows and doors (Wood-Aluminium-UPVC) in the last
10 years and to observe the market share of each kind of windows in the Egyptian market.
3.1 UPVC
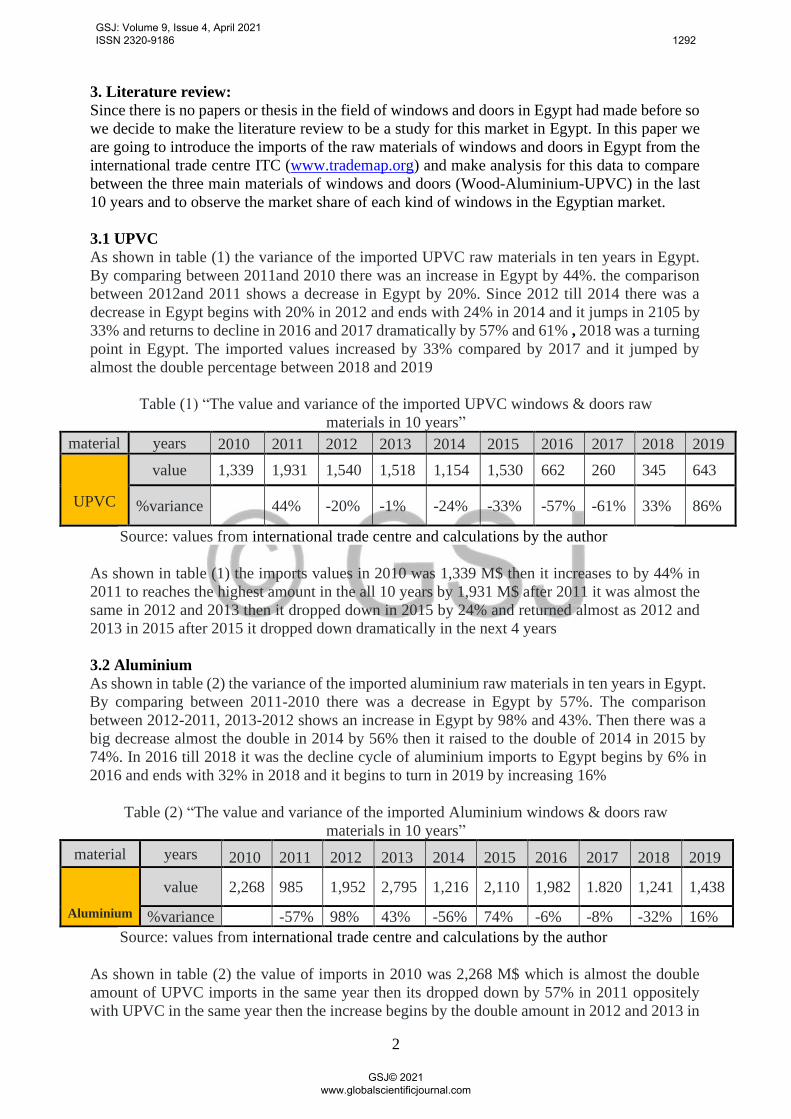
As shown in table (1) the variance of the imported UPVC raw materials in ten years in Egypt.
By comparing between 2011and 2010 there was an increase in Egypt by 44%. the comparison
between 2012and 2011 shows a decrease in Egypt by 20%. Since 2012 till 2014 there was a
decrease in Egypt begins with 20% in 2012 and ends with 24% in 2014 and it jumps in 2105 by
33% and returns to decline in 2016 and 2017 dramatically by 57% and 61% , 2018 was a turning
point in Egypt. The imported values increased by 33% compared by 2017 and it jumped by
almost the double percentage between 2018 and 2019
Table (1) “The value and variance of the imported UPVC windows & doors raw
materials in 10 years”
material years 2010 2011 2012 2013 2014 2015 2016 2017 2018 2019
UPVC
value 1,339 1,931 1,540 1,518 1,154 1,530 662 260 345 643
%variance 44% -20% -1% -24% -33% -57% -61% 33% 86%
Source: values from international trade centre and calculations by the author
As shown in table (1) the imports values in 2010 was 1,339 M$ then it increases to by 44% in
2011 to reaches the highest amount in the all 10 years by 1,931 M$ after 2011 it was almost the
same in 2012 and 2013 then it dropped down in 2015 by 24% and returned almost as 2012 and
2013 in 2015 after 2015 it dropped down dramatically in the next 4 years
3.2 Aluminium
As shown in table (2) the variance of the imported aluminium raw materials in ten years in Egypt.
By comparing between 2011-2010 there was a decrease in Egypt by 57%. The comparison
between 2012-2011, 2013-2012 shows an increase in Egypt by 98% and 43%. Then there was a
big decrease almost the double in 2014 by 56% then it raised to the double of 2014 in 2015 by
74%. In 2016 till 2018 it was the decline cycle of aluminium imports to Egypt begins by 6% in
2016 and ends with 32% in 2018 and it begins to turn in 2019 by increasing 16%
Table (2) “The value and variance of the imported Aluminium windows & doors raw
materials in 10 years”
material years 2010 2011 2012 2013 2014 2015 2016 2017 2018 2019
Aluminium
value 2,268 985 1,952 2,795 1,216 2,110 1,982 1.820 1,241 1,438
%variance -57% 98% 43% -56% 74% -6% -8% -32% 16%
Source: values from international trade centre and calculations by the author
As shown in table (2) the value of imports in 2010 was 2,268 M$ which is almost the double
amount of UPVC imports in the same year then its dropped down by 57% in 2011 oppositely
with UPVC in the same year then the increase begins by the double amount in 2012 and 2013 in
GSJ: Volume 9, Issue 4, April 2021 ISSN 2320-9186 1292
GSJ© 2021 www.globalscientificjournal.com
3
2014 the amount decreases to the half by 1.216 M$ in 2015 the amount increases to 2,110 M$
then the decrease begins from 2016 till 2018 and it increases slightly in 2019 by 1,438 M$.
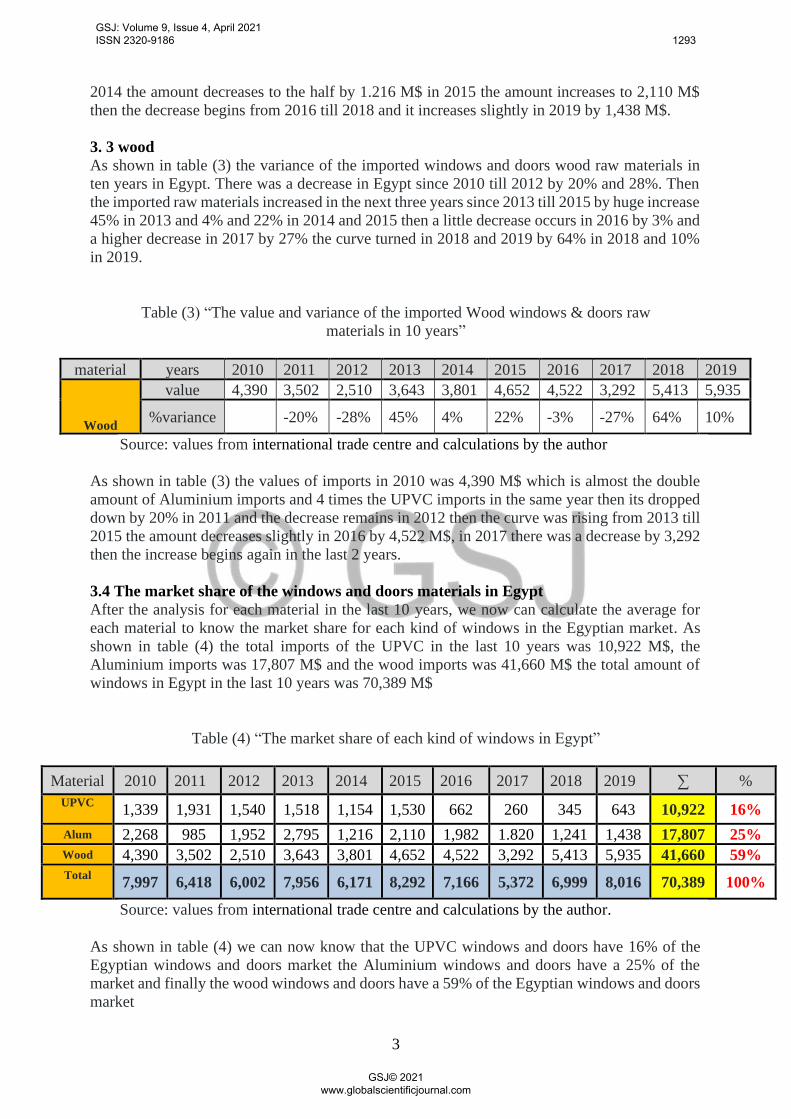
3. 3 wood
As shown in table (3) the variance of the imported windows and doors wood raw materials in
ten years in Egypt. There was a decrease in Egypt since 2010 till 2012 by 20% and 28%. Then
the imported raw materials increased in the next three years since 2013 till 2015 by huge increase
45% in 2013 and 4% and 22% in 2014 and 2015 then a little decrease occurs in 2016 by 3% and
a higher decrease in 2017 by 27% the curve turned in 2018 and 2019 by 64% in 2018 and 10%
in 2019.
Table (3) “The value and variance of the imported Wood windows & doors raw
materials in 10 years”
material years 2010 2011 2012 2013 2014 2015 2016 2017 2018 2019
Wood
value 4,390 3,502 2,510 3,643 3,801 4,652 4,522 3,292 5,413 5,935
%variance -20% -28% 45% 4% 22% -3% -27% 64% 10%
Source: values from international trade centre and calculations by the author
As shown in table (3) the values of imports in 2010 was 4,390 M$ which is almost the double
amount of Aluminium imports and 4 times the UPVC imports in the same year then its dropped
down by 20% in 2011 and the decrease remains in 2012 then the curve was rising from 2013 till
2015 the amount decreases slightly in 2016 by 4,522 M$, in 2017 there was a decrease by 3,292
then the increase begins again in the last 2 years.
3.4 The market share of the windows and doors materials in Egypt
After the analysis for each material in the last 10 years, we now can calculate the average for
each material to know the market share for each kind of windows in the Egyptian market. As
shown in table (4) the total imports of the UPVC in the last 10 years was 10,922 M$, the
Aluminium imports was 17,807 M$ and the wood imports was 41,660 M$ the total amount of
windows in Egypt in the last 10 years was 70,389 M$
Table (4) “The market share of each kind of windows in Egypt”
Material 2010 2011 2012 2013 2014 2015 2016 2017 2018 2019 ∑ %
UPVC
1,339 1,931 1,540 1,518 1,154 1,530 662 260 345 643 10,922 16%
Alum 2,268 985 1,952 2,795 1,216 2,110 1,982 1.820 1,241 1,438 17,807 25%
Wood 4,390 3,502 2,510 3,643 3,801 4,652 4,522 3,292 5,413 5,935 41,660 59%
Total
7,997 6,418 6,002 7,956 6,171 8,292 7,166 5,372 6,999 8,016 70,389 100%
Source: values from international trade centre and calculations by the author.
As shown in table (4) we can now know that the UPVC windows and doors have 16% of the
Egyptian windows and doors market the Aluminium windows and doors have a 25% of the
market and finally the wood windows and doors have a 59% of the Egyptian windows and doors
market
GSJ: Volume 9, Issue 4, April 2021 ISSN 2320-9186 1293
GSJ© 2021 www.globalscientificjournal.com

4
4. Research methodology:
The Analytic Hierarchy Process has been identified as a general theory of measurement (Saaty
and Vargas, 2006). Analytic Hierarchy Process offers many solutions for problems because it
compare the weight of each criteria with different alternatives in a hierarchic structure. AHP can
be understood broadly as a theory of measurement using quantitative and/or qualitative data; it
allows the use of qualitative as well as quantitative criteria in the evaluation (Bernasconi et al.,
2010). The Analytic Hierarchy Process has a big advantage which is it can compare intangibles
criteria in a structured way such as Perhaps the biggest advantage of this method is that it allows
the inclusion of intangibles such as experience and preferences. It allows a more accurate
description of the DM process (Mu, and Pereyra-Rojas, 2017).
This research will apply Fuzzy AHP by using questionnaire. According to this tool the respondent
has to respond to the same questions in the questionnaire form, for that, AHP considered as an
important tool to collect data within survey strategy (Saunders et al., 2007). This research
illustrates the concept of the Analytic Hierarchy Process (AHP), the sampling type used in AHP
model. The analysis consists of four sections. The first section shows the general proposed
framework of the FAHP. The second section illustrates the empirical study on the Egyptian UPVC
and Aluminium windows and doors industry. Section three reviews research validity and
reliability. Finally, the summary of this chapter is provided in section four.
The Proposed Framework
This thesis proposes a framework to rank the competitiveness of the UPVC and Aluminium
windows and doors industry using FAHP according to the next steps:
A: evaluating the level of competitiveness by identifying the criteria
The aim of the FAHP is to identify the weight of each criteria used in evaluating and assessing
the UPVC and Aluminium windows and doors industry.
B: Identify the relative importance of selected criteria by developing FAHP survey
Using a scale from 1 to 9 a FAHP survey was developed to assess the relative importance weight
of the selected criteria (Saaty and Kearns, 1985). Table (1) illustrates Saaty’s pairwise comparison
scale.
Table (1) Pairwise comparison scale.
Judgment Value
Extreme more important 9
Very strong more important 7
Strong more important 5
Moderate more important 3
Equal important 1
Intermediate values between two adjacent judgments 2, 4, 6 and 8
These values represent the opposite of the reciprocal whole
numbers
1/3, 1/5, 1/7 and
1/9
Reference: (Saaty and Kearns, 1985).
The following questionnaire form was used to determine the weights of the selected criteria -
using a scale, where one demonstrate equal important and 9 Extreme more important, 7
GSJ: Volume 9, Issue 4, April 2021 ISSN 2320-9186 1294
GSJ© 2021 www.globalscientificjournal.com

5
demonstrably more important, 5 strongly more important and 3 indicates moderate more
important
An electronic survey was distributed in order assess the relative importance weight of selected
criteria such as Customers, Companies and Experts in the field. Table (2) shows the survey form.
Table (2) FAHP Questionnaire form.
With respect to
competitiveness (Decision Alternatives D.A.’s)
Product
9 7 5 3 1 3 5 7 9 Price
9 7 5 3 1 3 5 7 9 Place
9 7 5 3 1 3 5 7 9 Promotion
9 7 5 3 1 3 5 7 9 After sales service
Price
9 7 5 3 1 3 5 7 9 Place
9 7 5 3 1 3 5 7 9 Promotion
9 7 5 3 1 3 5 7 9 After sales service
Place 9 7 5 3 1 3 5 7 9 Promotion
9 7 5 3 1 3 5 7 9 After sales service
Promotion 9 7 5 3 1 3 5 7 9 After sales service
The second survey was formulated using Likert scale from excellent to very poor; to evaluate the
current performance of the competitiveness.
As illustrated in the next table (3), a Likert scale questionnaire form using performance rating
scale (excellent, good, very good, poor and very poor) is established to rank the competitiveness
of door and windows industry, where 1 signifies excellent performance, 0.8 signifies very good
performance, 0.6 signifies good performance, 0.4 signifies poor performance and 0.2 signifies
very poor performance.
Table (3) Likert Scale questionnaire.
Excellent V. good Good Poor V. poor
Product Aluminium
UPVC
Price Aluminium
UPVC
Place Aluminium
UPVC
Promotion Aluminium
UPVC
After sales service Aluminium
UPVC
AHP has a great advantage such as simplicity. In addition, it can compare tangible and in tangible
(Al Khalil, 2002). Table (4) show the pair comparison of selected criteria.
GSJ: Volume 9, Issue 4, April 2021 ISSN 2320-9186 1295
GSJ© 2021 www.globalscientificjournal.com

6
Table (4) Pairwise comparison matrix of criteria.
1 7
1
1
1
1/7 1
SUM ….. ….. ….. ….. …..
It is necessary to check that the judgment is consistent. For this purpose, FAHP calculates a
Consistency Ratio (CR) comparing the Consistency Index (CI) of the matrix, as illustrated in table
(5).
Table (5) Random Consistency Index of Analytic Hierarchy Process. Number of
criteria 1 2 3 4 5 6 7 8 9 10
RI 0.00 0.00 0.58 0.9 1.12 1.24 1.32 1.41 1.46 1.49
Source: (Teknomo, 2006)
To calculate CR, we need to calculate the Consistency Index (CI), as shown in equation (1), CI
measures the degree of logical consistency” according to (Brunnelli, 2015), CI can be explained
as:
1n
nλCI max
−
−=
(1)
Where, 𝜆𝑚𝑎𝑥. = Σ YkXk, and n is the number of compared elements (in this case n = 6), as shown
in equation (2) (Alexander, 2012), after calculating CR we can calculate the Consistency Ratio
(CR), according to (Triantaphyllou and Mann, 1995) CR can be explained as:
CR = CI/RI (2)
CR = CI/RI. The proportion of inconsistency CR should be less than 0.10, to continue the process
of FAHP (Elgazzar, 2013).
To reach the validity of the judgment decisions outputted from AHP model in any research, the
CR should be calculated which determines the allowed inconsistency ratio 0.10 or 10%; more
than these values mean the comparisons are less consistent. On the opposite, the smaller numbers
mean comparisons are more consistent.
Three: Evaluate each efficiency criterion by establishing a performance rating scale
Using a performance rating scale (excellent, very good, good, poor and very poor)
Four: Calculating the competitiveness index of UPVC and Aluminium windows and doors
industry
GSJ: Volume 9, Issue 4, April 2021 ISSN 2320-9186 1296
GSJ© 2021 www.globalscientificjournal.com
7
First, we determining, the relative weight, and the performance rate of each criterion, the weighted
rate (WR) of each criterion is calculated. Finally, the weighted rates of selected criteria using a
weighted average aggregation method (Ismail and Elgazzar, 2018).
5. Empirical Study:
This section attempts to measure the competitiveness of the UPVC and Aluminium Windows and
Doors Industry in Egypt to find out the present status and the drawbacks. It will suggest solutions
for eliminating drawbacks and improve the competitiveness position of the UPVC and aluminium
windows and doors industry in Egypt.
This paper focuses on the five main marketing mix factors in the UPVC & Aluminium windows
and doors industry UPVC & Aluminium windows and doors industry in Egypt for the year 2020,
Primary data was collected from customers, companies in the field. This thesis proposes a
framework using FAHP technique based on the following steps:
One: Evaluate the level of competitiveness between the UPVC & Aluminium windows and
doors by identifying the criteria
Previous studies identified the five main criteria that reflect the marketing mix factors; product:
price, place, promotion and after sales services.
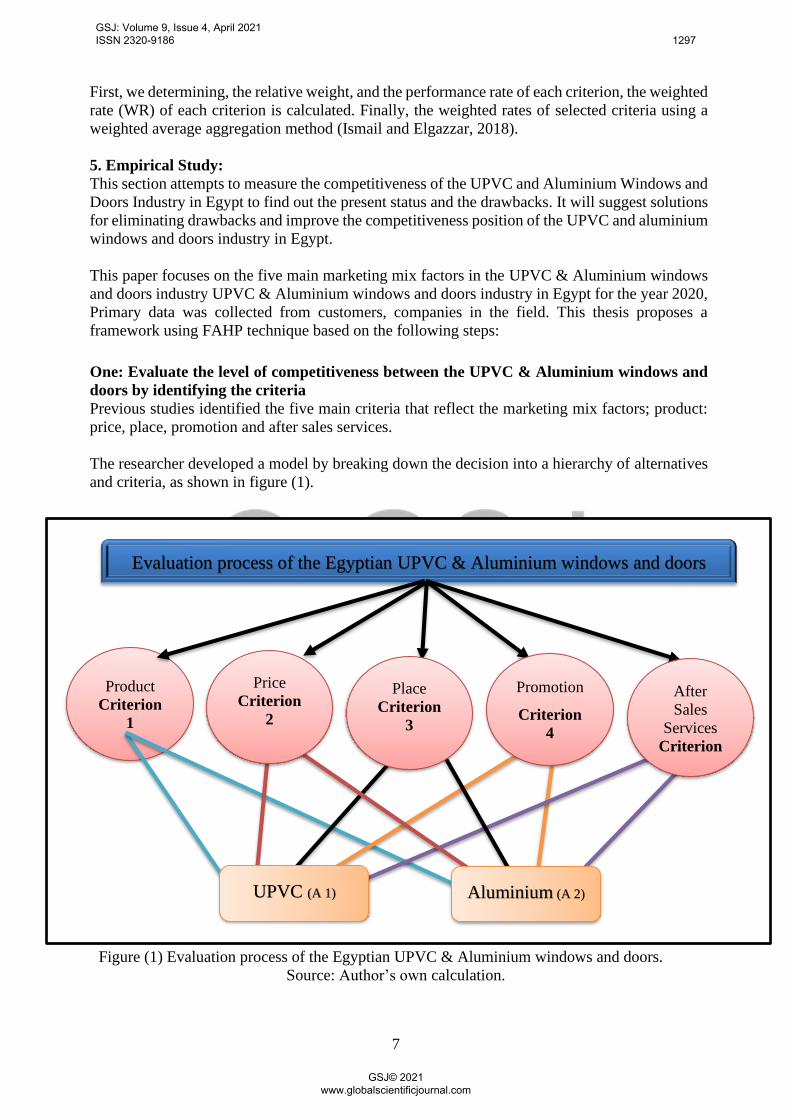
The researcher developed a model by breaking down the decision into a hierarchy of alternatives
and criteria, as shown in figure (1).
Figure (1) Evaluation process of the Egyptian UPVC & Aluminium windows and doors.
Source: Author’s own calculation.
Evaluation process of the Egyptian UPVC & Aluminium windows and doors
Product
Criterion
1
Price
Criterion
2
Place
Criterion
3
Promotion
Criterion
4
After
Sales
Services
Criterion
5
UPVC (A 1)
Aluminium (A 2)
GSJ: Volume 9, Issue 4, April 2021 ISSN 2320-9186 1297
GSJ© 2021 www.globalscientificjournal.com

8
Two: Developing a FAHP questionnaire form to identify the weight of each criteria
The main objective of this survey is to determine the relative importance weights of the Egyptian
UPVC & Aluminium windows and door’s five main marketing mix factors using AHP approach
to determine the weight of each criteria (Product, Price, Place, Promotion and After sales services)
with respect to the priorities of profitability. The questionnaire form was conducted with the group
of experts to determine the priorities of the main measures.
B 2 C empirical analysis:
A questionnaire was conducted with the group of experts to determine the priorities of the main
measures. In order to do statistical analysis for the UPVC & Aluminium windows and doors
industry by applying AHP model, the researcher input the valid questionnaire forms that collected
from questionnaire’s participants, as shown in the previous section, into an excel sheet to run and
analyse these data by using Fuzzy AHP model.
To determine the relative importance weight of each variable, a fuzzy pairwise questionnaire,
based on expert’s opinion we calculate the pairwise questionnaires based on questionnaire’s
participants; as shown in table (7)
Calculating the Consistency
To ensure the consistent of the judgment are, we have to calculate the consistency level.
The CR of a decision should not exceed 0.1. In the case where CR exceeds 0.1, the comparison
matrix is considered inconsistent and should be improved (Elgazzar, 2013; Dyck and Ismael,
2015). For any metrics at any level, if the value of the Consistency Ratio is smaller or equal to
10%, the inconsistency is acceptable (Mu and Rojas, 2017). If the Consistency Ratio is greater
than 10%, the pair-wise comparison processes should be repeated until the consistency ratio is
less than 0.1.
Three main steps to calculate the Consistency Ratio:
1) Calculation of Eigenvalue (λmax)
λmax = 5.04971. In addition, total the five criteria should equal one as illustrated in
appendix (4-1) “0.4197 + 0.2131 + 0.1381 + 0.0843 + 0.1245 = 1”.
2) Calculation of Consistency Index (CI).
Where CI = λmax - N / N - 1 (Kousalya et al., 2012).
CI= 5.04791 – 5 / 5 – 1 = 0.012
3) Calculation of Consistency Ratio (CR).
Where CR = CI/RI (Triantaphyllou and Mann, 1995). defining the suitable value of (RI) from the
table of the above table, RI = 1.12, CR= 0.0120 / 1.12 = 0.010694196.
In this context, the researcher calculated the CR in order to verify the consistency of responses;
and found 0.012 as shown in the next table (6) is lower than 0.1. Therefore, our judgments matrix
is reasonably consistent (Elgazzar, 2013). Also, the CI result reflects increase in the validity
degree of this research, because the result is reliable only when CR value is 0.1 or less.
GSJ: Volume 9, Issue 4, April 2021 ISSN 2320-9186 1298
GSJ© 2021 www.globalscientificjournal.com
9
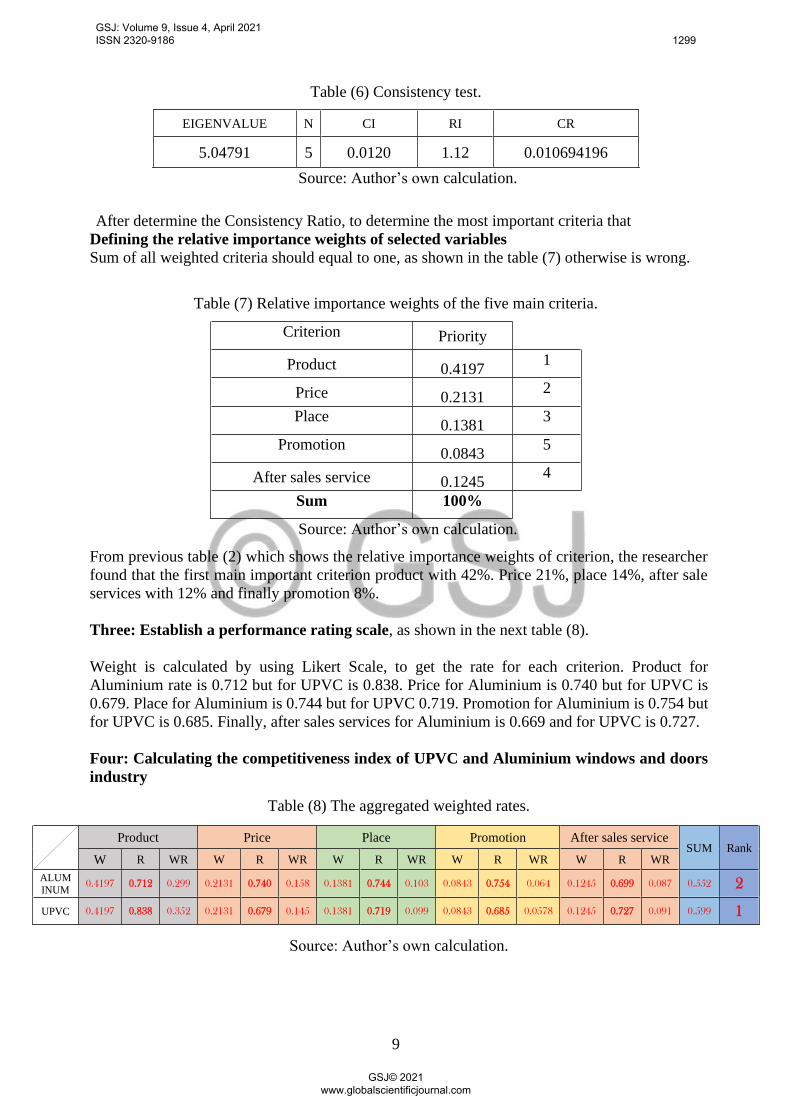
Table (6) Consistency test.
EIGENVALUE N CI RI CR
5.04791 5 0.0120 1.12 0.010694196
Source: Author’s own calculation.
After determine the Consistency Ratio, to determine the most important criteria that
Defining the relative importance weights of selected variables
Sum of all weighted criteria should equal to one, as shown in the table (7) otherwise is wrong.
Table (7) Relative importance weights of the five main criteria.
Criterion Priority
Product 0.4197 1
Price 0.2131 2
Place 0.1381
3
Promotion 0.0843
5
After sales service 0.1245 4
Sum 100%
Source: Author’s own calculation.
From previous table (2) which shows the relative importance weights of criterion, the researcher
found that the first main important criterion product with 42%. Price 21%, place 14%, after sale
services with 12% and finally promotion 8%.
Three: Establish a performance rating scale, as shown in the next table (8).
Weight is calculated by using Likert Scale, to get the rate for each criterion. Product for
Aluminium rate is 0.712 but for UPVC is 0.838. Price for Aluminium is 0.740 but for UPVC is
0.679. Place for Aluminium is 0.744 but for UPVC 0.719. Promotion for Aluminium is 0.754 but
for UPVC is 0.685. Finally, after sales services for Aluminium is 0.669 and for UPVC is 0.727.
Four: Calculating the competitiveness index of UPVC and Aluminium windows and doors
industry
Table (8) The aggregated weighted rates.
Source: Author’s own calculation.
Product Price Place Promotion After sales service SUM Rank
W R WR W R WR W R WR W R WR W R WR
ALUM
INUM 0.4197 0.712 0.299 0.2131 0.740 0.158 0.1381 0.744 0.103 0.0843 0.754 0.064 0.1245 0.699 0.087 0.552 2
UPVC 0.4197 0.838 0.352 0.2131 0.679 0.145 0.1381 0.719 0.099 0.0843 0.685 0.0578 0.1245 0.727 0.091 0.599 1
GSJ: Volume 9, Issue 4, April 2021 ISSN 2320-9186 1299
GSJ© 2021 www.globalscientificjournal.com

10
B 2 B empirical analysis:
The questionnaire form was conducted with the experts in order to determine the priorities of the
main measures. Questionnaire’s participants in this research are companies in the field in Egypt.
As shown in the table (9) which illustrates questionnaire’s participants and their number of
questionnaires sent, received, valid and invalid.
Table (9) Questionnaire’s participants and their number of questionnaires
sent, received, valid and invalid.
Questionnaire’s Participants Questionnaire’s
numbers “sent” Received Valid Invalid
Emirates NBD bank – Kafr Abdo Branch 10 6 6 0
Style Architects and Interior Design 10 5 5 0
Emelia Interior design $ Furniture 10 9 9 0
Alforat Development 15 11 10 1
MAS Engineering and Contracting S.A.E 10 4 4 0
Engineering group for Architecture and decoration 10 5 5 0
Aleatemad Company for suppliers and constructing 10 10 9 1
Egyptian group 20 15 13 2
IKON Architecture design 10 6 5 1
OMSI Group 40 30 30 0
Orascom Construction PLC 15 11 9 2
Total 160 112 106 8
Source: Author’s own calculation.
As shown in the above table (4) the valid collected questionnaire percent from questionnaire’s
participants. The researcher has found that 96% from all collected questionnaire are valid and 4%
were not valid. The next figure (2) shows the valid questionnaire percent from questionnaire’s
participants.
GSJ: Volume 9, Issue 4, April 2021 ISSN 2320-9186 1300
GSJ© 2021 www.globalscientificjournal.com

11
Figure (2) valid questionnaire percent from questionnaire’s participants.
Source: by the researcher.
Responses were tested using Microsoft Excel and PopTools (Hood, 2010). In order to do statistical
analysis for the UPVC & Aluminium windows and doors industry by applying AHP model, the
researcher input the valid questionnaire forms that collected from questionnaire’s participants, as
shown in the previous section, into an excel sheet to run and analyse these data by using Fuzzy
AHP model.
To calculate the relative importance weight of selected variable, a fuzzy pairwise questionnaire,
based on triangular fuzzy numbers (Ismail, 2019). The pairwise questionnaires were given to the
experts “questionnaire’s participants”. The data in the next table (11) are based on expert’s
opinion.
Perform the Consistency
There are three main steps for calculating the Consistency Ratio (CR):
1) Calculation of Eigenvalue (λmax)
λmax = 5.02236. In addition, total the five criteria should equal one as illustrated in
appendix (4-1) “0.27 + 0.26 + 0.07 + 0.20 + 0.19 = 1”.
2) Consistency Index (CI).
CI= 5.02236 – 5 / 5 – 1 = 0.0056
Where CI = λmax - N / N - 1 (Kousalya et al., 2012).
3) Calculation of Consistency Ratio (CR).
Where CR = CI/RI (Triantaphyllou and Mann, 1995). Random Index (RI) = 1.12, after that we
calculated (CR); CR= 0.0056 / 1.12 = 0.004991.
Emirates NBD bank –Kafr Abdo Branch
6%
Style Architects and Interior Design
5% Emelia Interior design $ Furniture
8%
Alforat Development9%
MAS Engineering and
Contracting S.A.E…
Engineering group for Architecture and
decoration5%
Aleatemad Company for suppliers and
construvting8%
Egyptian group (Tatweer)
12%
IKON Architecture design
5%
OMSI Group29%
Orascom Construction PLC9%
GSJ: Volume 9, Issue 4, April 2021 ISSN 2320-9186 1301
GSJ© 2021 www.globalscientificjournal.com

12
In this context, the researcher calculated the CR in order to verify the consistency of responses;
and found 0.012 as shown in the next table (10) is lower than the accepted CR 0.1. (Elgazzar,
2013). In addition, the CI result reflects increase in the validity degree of this research, because
the result is reliable only when CR value is 0.1 or less.
Table (10) Consistency test.
EIGENVALUE N CI RI CR
5.02236 5 0.0056 1.12 0.004991071
Source: Author’s own calculation.
After determining the Consistency Ratio, to determine the most important criteria that
Determining the weights of the each criteria
Sum of all weighted criteria should equal to one, as shown in the table (11) otherwise is wrong.
Table (11) Relative importance weights of the five main criteria.
Criterion Priority
Product 27 1
Price 26 2
Place 7 5
Promotion 20 3
After sales service 19 4
Sum 100%
Source: Author’s own calculation.
From the previous table (12) which assesses the weights of the selected main criterion, the
researcher found that, the first main important criterion product with 27%. Price 26%, place 7%,
after sale services with 19% and finally promotion 20%.
Four: Calculating the competitiveness index of UPVC and Aluminium windows and doors
industry
Table (12) The aggregated weighted rates.
Source: Author’s own
Product Price Place Promotion After sales service
SUM Rank
W R WR W R WR W R WR W R WR W R WR
ALUM INUM
0.270 0.746 0.202 0.260 0.768 0.199 0.070 0.779 0.0545 0.200 0.724 0.145 0.190 0.73 0.1394 0.54 2
UPVC 0.270 0.838 0.226 0.260 0.749 0.195 0.070 0.741 0.052 0.200 0.712 0.143 0.190 0.778 0.1477 0.57 1
GSJ: Volume 9, Issue 4, April 2021 ISSN 2320-9186 1302
GSJ© 2021 www.globalscientificjournal.com

13
Conclusion:
Although the UPVC windows and doors got many advantages compared by the Aluminium
windows and doors and almost both having equal price or may be the UPVC is a little higher in
its price still most of customers are buying Aluminium windows and doors So, in this paper we
decide to evaluate each marketing mix factor and Measure Its effect on the Competitive advantage
for each product (UPVC & Aluminium windows and doors) to explore the most affected factors
on the customers buying decision So, the results of the above calculations show that
In the B2C customers group the Product rank in UPVC is higher than aluminium by 0.05288,
Price rank in aluminium is higher than UPVC by 0.013, place rank in aluminium is higher than
UPVC by 0.00346, and promotion rank in aluminium is higher than UPVC by 0.00581, after sales
service rank in UPVC is higher than aluminium by 0.00348.
which means that the B2C customers see that the UPVC windows and doors as a material is much
better than the aluminium windows and doors and the after sales service of the UPVC windows
and doors companies is much better than the aluminium companies but the UPVC windows and
doors is more expensive in price than the aluminium windows and doors also the place and
promotion of the aluminium windows and doors companies is much better than the UPVC
windows and doors companies.
In the other hand the results of the calculations of the B2B customers group we conclude that the
Product rank in UPVC is higher than aluminium by 0.0248, Price rank in aluminium is higher
than UPVC by 0.005, place rank in aluminium is higher than UPVC by 0.0026, and promotion
rank in aluminium is higher than UPVC by 0.0023, after sales service rank in UPVC is higher
than aluminium by 0.0083.
which means that the B2B customers see that the UPVC windows and doors as a material is much
better than the aluminium windows and doors and the after sales service of the UPVC windows
and doors companies is much better than the aluminium companies but the UPVC windows and
doors is more expensive in price than the aluminium windows and doors also the place and
promotion of the aluminium windows and doors companies is much better than the UPVC
windows and doors companies.
From all the above we can see that the both groups of customers (B2C – B2B) decide that product
and after sales service in the UPVC companies is much better than the Aluminium companies but
the price, place and promotion in the Aluminium companies is better than the UPVC companies
Therefor we advise the UPVC companies to revise their pricing strategies and to make more effort
on their advertising plans to cope with their main competitor the aluminium companies
This research provided a framework assessing the competitiveness of position of the UPVC and
aluminium windows and doors industry in Egypt. The framework captures key performance
indicators to assess the UPVC and aluminium windows and doors industry in Egypt.
Reference:
Al Khalil, M. I, (2002) “Selecting the appropriate project delivery method using AHP”.
International Journal of Project Management. 20, pp. 469-474.
Bernasconi, M., Choirat, C. and Seri, R. (2010) “The Analytic Hierarchy Process and the Theory
of Measurement”, Management Science, 56 (4), pp. 699-711.
Brunnelli, M. (2015). “Introduction to the Analytic Hierarchy Process”. Springer.
GSJ: Volume 9, Issue 4, April 2021 ISSN 2320-9186 1303
GSJ© 2021 www.globalscientificjournal.com
14
Elgazzar, S. (2013) “Enhancing the Company’s Financial Performance through Managing the
Performance of Supply Chain Operations: A Case Study of an Egyptian Manufacturing
Company”, PhD Thesis. University of Huddersfield.
Hood, G. M. (2010) PopTools version 3.2.5. [Online] Available at: http://www.poptools.org
Ismail, A. (2019) Benchmarking the Efficiency of the Egyptian Container Terminals, Unpublished
PhD Thesis. Arab Academy for Science Technology and Maritime Transport.
Ismail, A. and Elgazzar, S. (2018), ‘Measuring the Egyptian container ports' efficiency: A FUZZY
AHP framework’, paper presented to 23rd Annual Conference of The Chartered Institute of
Logistics and Transport, Logistics Research Network (LRN). Plymouth, UK. 5-7 September 2018.
Kousalya, P., Reddy G. M., Supraja, S. and Prasad V. S. (2012) “Analytical Hierarchy Process
approach – An application of engineering education”, Mathematica Aeterna. 2 (10), pp. 861-878
Mu, E. and Rojas, M. P. (2017) “Understanding the Analytic Hierarchy Process”. Practical
Decision Making using Super Decisions, pp. 7-22.
Saaty, T. L. (1980). The analytic hierarchy process: planning, priority setting, resource allocation.
Mcgraw-Hill. New York.
Saaty, T.L. and Kearns, K. (1985) “Analytical Planning; The Organization of Systems”, Oxford:
Pergamon Press.
Saaty, T.L. and Vargas, L.G. (2006) “Decision Making with the Analytic Network Process:
Economic, Political, Social and Technological Applications with Benefits, Opportunities, Costs
and Risks”, New York: Springer.
Saunders, M., Lewis, P. and Thornhill, A. (2009) “Research Methods for Business Students”, 5th
ed. London: Pearson Education, Limited.
Teknomo, k. (2006). “Analytic Hierarchy Process (AHP) Tutorial”. Available from:
https://pdfs.semanticscholar.org/7e27/b5a124c2e6829e1ff0d3e1279c2dbc9ebe2a.pdf.
Triantaphyllou, E. and Mann, S. H. (1995) “Using the Analytic Hierarchy Process for Decision
Making in Engineering Applications: Some Challenges”. The International Journal of Industrial
Engineering. 2 (1), pp. 35-44.
GSJ: Volume 9, Issue 4, April 2021 ISSN 2320-9186 1304
GSJ© 2021 www.globalscientificjournal.com