enhancing the balance sheet management function at ... · enhancing the balance sheet management...
TRANSCRIPT

Enhancing the Balance Sheet Management Function at Financial Institutions Behavioral Models
Paris, April 5th 2012
Association Française des Gestionnaires Actif-Passif (AFGAP)
Cayetano Gea-Carrasco
Enterprise Risk Management Solutions

Liquidity & Balance Sheet Management Practice
2
Contents
I. About Moody’s Analytics
II. Motivation & Regulatory Backdrop
III. Behavioral Models
IV. Assessing and Pricing Contingent Liquidity
V. How to enhance your Balance Sheet Management Function
VI. Conclusions
Moody’s Analytics Enterprise Risk Management Solutions

Liquidity & Balance Sheet Management Practice
Moody’s Analytics 1

Liquidity & Balance Sheet Management Practice
4
Moody’s Analytics: Separation Policy Moody’s Analytics is a subsidiary of Moody’s Corporation and a separate legal entity from Moody’s Investors Service, Inc. (which is a global provider of credit ratings and research covering debt instruments and securities). Moody’s Investors Service does not share non-public information received from issuers as part of the ratings process with Moody’s Analytics. Further, Moody’s Corporation prohibits any ratings personnel from providing consulting services on behalf of Moody’s Analytics
Moody’s Analytics Enterprise Risk Management Solutions

Liquidity & Balance Sheet Management Practice
Motivation & Regulatory Backdrop 2

Liquidity & Balance Sheet Management Practice
6
Regulatory Emphasis on Active Liquidity Management around the World
Basel: “… the maintenance of a sufficient cushion of high quality liquid assets to meet contingent liquidity needs…”
FSA: “A Contingency Funding Plan should set out a firm’s strategy for addressing liquidity shortfalls in stressed conditions…”
Fed: “… a cushion of liquid assets, and a formal well-developed contingency funding plan (CFP) as primary tools for measuring and managing liquidity risk…”
Moody’s Analytics Enterprise Risk Management Solutions

Liquidity & Balance Sheet Management Practice
Responses to an International Survey that Covered 38 Large banks from Nine Countries show that many Liquidity & Balance Sheet Management Practices were Largely Deficient “The most striking example of poor practice was that some banks failed to attribute liquidity costs to assets and conversely liquidity credits to liabilities for some business activities due to poor Fund Transfer Pricing Models and policies”
“Banks’ liquidity cushions were too small to withstand prolonged market disruptions and were comprised of assets that were thought to be more liquid than they actually were”
“Some of the banks that were surveyed treated liquidity as a free good, completely ignoring the costs, benefits and risks of liquidity”
“Banks that participated in the survey also applied insufficient haircuts to many of the traded assets they held. These banks clearly underestimated the likelihood of a market disruption, and the extent to which market liquidity could evaporate”
“Liquidity cushions were not linked to stress-testing outcomes, and scenario analyses were not severe enough to account for prolonged market-wide disruptions”
“In one form or another, all banks that participated in the survey are enhancing the way they manage contingent liquidity risk and their balance sheet models”
7
* Source: BIS
Moody’s Analytics Enterprise Risk Management Solutions

Liquidity & Balance Sheet Management Practice
8
Increasing Basel 3 Liquidity Requirements are becoming a Constraint for Financial Institutions
* Source: Moody’s Analytics
The Liquidity Coverage Ratio (LCR) reflects a
bank’s ability to convert high-quality, unencumbered
liquid assets to cash to offset projected cash flows during a one-month period
The Net Stable Funding Ratio (NSFR) requires
banks to maintain enough funding that is expected to be stable to cover potential uses of funds over a one-
year period
“Banks will be required to calculate and report these projected outflows based on a scenario set by supervisors and regulators that will incorporate conditions similar to
those experienced during the 2007-2008 crisis”
Moody’s Analytics Enterprise Risk Management Solutions

Liquidity & Balance Sheet Management Practice
Liquidity Sources are Scarce and Expensive: You should Model and Manage Them
9
Moody’s Analytics Enterprise Risk Management Solutions
* Source: Financial Times, Moody’s Analytics, JP Morgan
“Global banks are facing a €4 trillion of cash outflows that should be reduce in the next years in order to be profitable. A lower revenue base, tighter regulation and stubbornly high staff costs would push down average return on equity to 7% by 2013”
“Banks are to shrink their balance sheets by another $1tn or up to 7% globally within the next two years due to higher funding costs and increased regulatory pressure to bolster capital”
“Banks should adjust their funding and liquidity structure by increasing retail deposits by €215bn. However, accelerating the growth in the deposit base is easier said than done: deposit growth trend is negative in Europe and US from 2006 to nowadays”
“The cost of acquiring new retail deposits is high, with current deposit margins already low if not in negative territory (i.e. some banks are losing money in deposits due to the higher funding cost – average loss of 120 bps in 2011 and increasing)”
“On customer deposits, given the amounts required by institutions, analysts expect the average cost of acquiring term deposits to be as expensive as in the wholesale markets at an estimated 221bp”
“Retail deposit spreads will remain under pressure in the next years as a result of increased competition and regulation, especially in countries where the market is more fragmented and bank funding remains stretched (i.e. Spain, Italy, US, Germany and the UK)”
Liquidity & Balance Sheet Management Practice
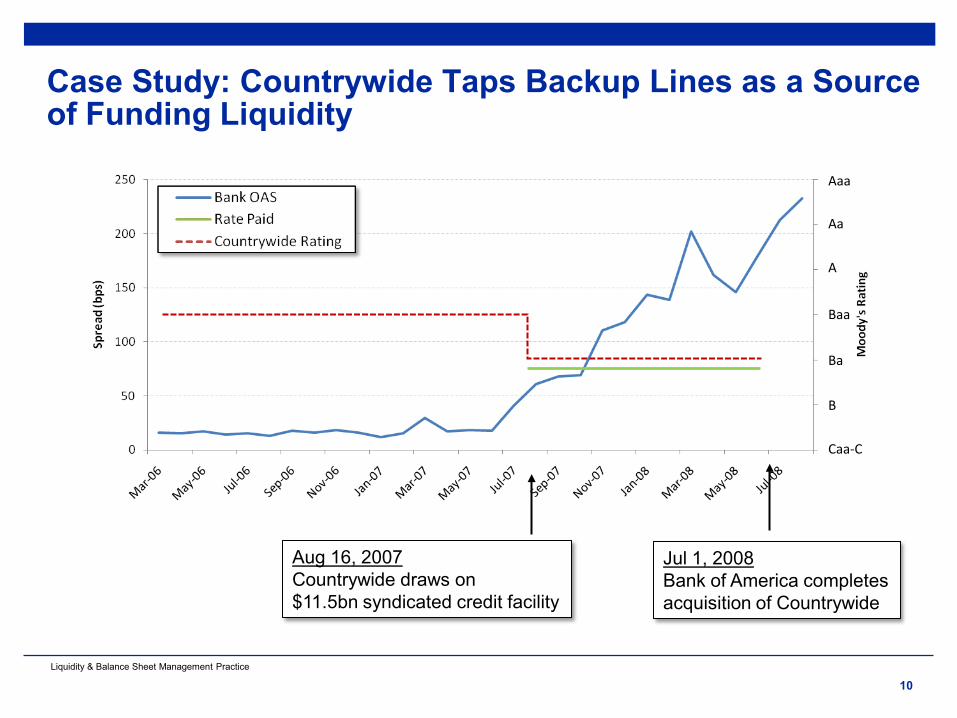
Case Study: Countrywide Taps Backup Lines as a Source of Funding Liquidity
10
Aug 16, 2007 Countrywide draws on $11.5bn syndicated credit facility
Jul 1, 2008 Bank of America completes acquisition of Countrywide
Aaa
Aa
A
Baa
Ba
B
Caa-C

Liquidity & Balance Sheet Management Practice
Behavioral Models 3

Liquidity & Balance Sheet Management Practice
12
Behavioral Models: Economic Guidance
• Banks’assets and liabilities are often maturity-mismatched, with long-term assets funded through short-term liabilities
Assets and Liabilities Funding Profile
• During periods of distressed liquidity conditions, the bank may face elevated funding costs and more stringent haircuts as it refinances its short-term funding
Funding Planning
• At the same time, the bank’s borrowers may increase their use of bank funds, forcing the bank to raise additional funds
Liquidity Stress Testing
• What amount of liquid assets should a financial institution
hold in order to absorb potential losses due to adverse funding conditions?
Liquidity Buffers
• How should a financial institution account for these dynamics when originating loans or when calculating a fund transfer price?
Business-Driven
Moody’s Analytics Enterprise Risk Management Solutions

Liquidity & Balance Sheet Management Practice
13
Liquidity Stress Testing: Characterizing the “Perfect Storm” for Determining the Balance Sheet’s Resilience
• A significant downgrade of the institution’s public credit rating Credit Migration
• A partial loss of deposits Deposits Run-Off
• A loss of unsecured wholesale funding Unsecured Funding
• A significant increase in secured funding haircuts Secured Funding
• Increases in derivative collateral calls Collateral Haircuts
RiskFoundation TM
Moody’s Analytics Enterprise Risk Management Solutions

Liquidity & Balance Sheet Management Practice
14
Behavior of Non-maturing Liabilities
• Deposits of different categories are modeled as an econometric system of deposit rates and balances, which explicitly account for the relationships between deposit balances, deposit rates, as well as macro-economic factors
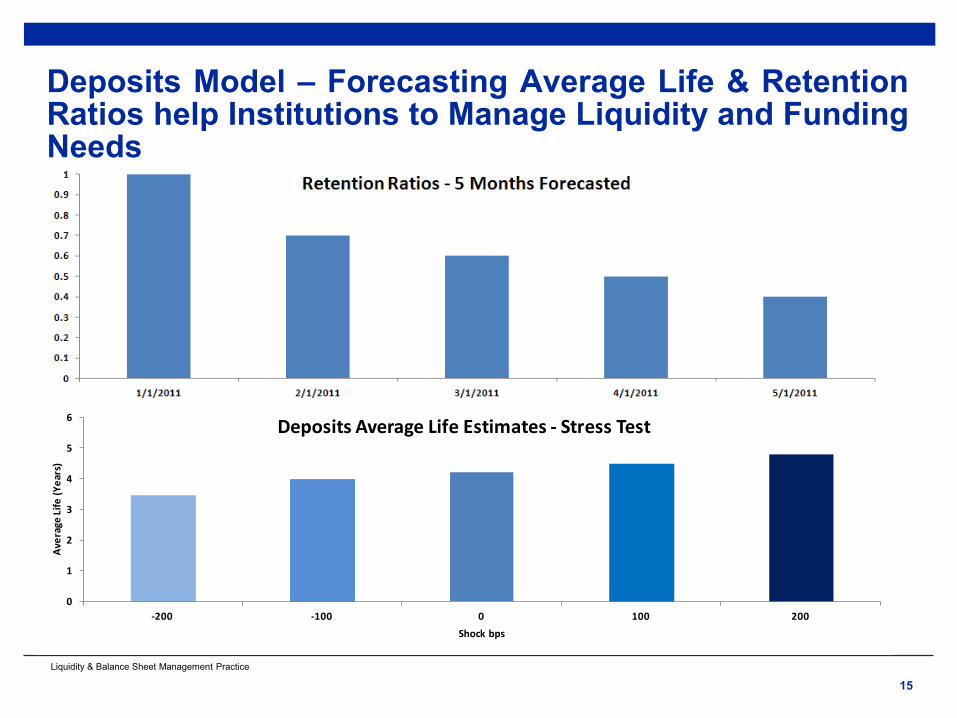
• A system of equations is statistically produced, based on balance sheet’s specific historical data, to quantify past behaviors. The equations are used to forecast future total balances, estimates lifes, deposit rates, and retained balances
• The framework also quantifies and breaks down the core and the volatile balance contribution to the balance sheet volatility. Decay profiles for the core balances will be computed during the analysis as well as volatility of deposits from historical balance variations by incorporating the volatility of factors in the analytics
0
2
4
6
8
10
12
500 400 300 200 100 0
Ave
rage
Life
s Es
tim
ates
-D
epos
its
Basis Points Shock
*Chart represents average life estimates for a sample of deposit data under different interest rates shocks, measured in basis points
Liquidity & Balance Sheet Management Practice
15
Deposits Model – Forecasting Average Life & Retention Ratios help Institutions to Manage Liquidity and Funding Needs
0
1
2
3
4
5
6
-200 -100 0 100 200
Ave
rage
Life
(Yea
rs)
Shock bps
Deposits Average Life Estimates - Stress Test

Liquidity & Balance Sheet Management Practice
16
Behavior of Revolving Credit Facilities
• Our research* studies indicate a strong relationship between the credit quality of borrowers and their credit line drawdown behavior
• Defaulted borrowers draw down their lines heavily when approaching defaults. Non-defaulted borrowers have significantly lower usage. Borrowers with high credit risk tend to draw down the lines more
• Both the draw-down amount and commitment amount decrease during the economic downturns
• We also document that usage is related to the collateral type, commitment size and bank internal ratings. The findings suggest banks monitor lines with larger commitment size, no collateral, and worse internal ratings more closely
*Moody’s Analytics has created the Credit Research Database, which is a middle-market database covering financial statement, loan accounting system data, and default data of middle-market borrowers from 23 countries around the world

Liquidity & Balance Sheet Management Practice
17
Usage Model – Middle Market lines have higher UGD than Public Firms
** UGD: The percentage of the exposure that is expected to be drawn in the event of default
Lack of granularity on the usage measurements can have a material
effect on liquidity buffers and funding: higher usage implies higher funding needs and therefore
higher liquidity risk
Usage models help institutions to overcome data limitations, granularity
problems, and facilitate the empirical validation of their
internal usage assumptions for regulatory purposes
* Results based on Moody’s Analytics Usage Model (“Measuring the EAD of Middle Market Credit Lines”, Jing Zhang, Moody’s Analytics)

Liquidity & Balance Sheet Management Practice
18
Behavior of Prepayments Dynamics
• Borrower prepayment assumptions can have a material effect on liquidity and interest rate risk measures
• Moody’s Analytics advocates two complementary approaches to prepayment modeling and estimation:
a. Analytic prepayment models, which model the prepayment decision of the borrower as a state-dependent rational exercise as a function of both interest rates and credit quality
b. Econometric prepayment models, which describe borrowers’ prepayment propensity as a function of a set of explanatory factors, capturing borrower specific information, seasonal variation, market rates, and macro economic factors
*The chart represents Moody’s Analytics multi-dimensional lattice valuation model (jointly interest rates and credit quality dynamics)

Liquidity & Balance Sheet Management Practice
19
Prepayment Model –Prepayment results in Loss of Potential Income & Asset-Liability Mismatch
Contractual Prepayment Penalty (bps)
Refinancing Cost (bps)
Option Spread (bps)
Expected Life (years)
0 0 38 0.3 50 0 20.5 0.44 70 0 13 0.72 0 40 7.7 2.29
50 40 0 2.99 70 40 0 2.99
*Results based on Moody’s Analytics Prepayment Model for a Term Loan with Prepayment Optionality, 3 years duration. Charts compare the net stock (assets minus liabilities) for a sample balance sheet using two different prepayment assumptions
-15
-10
-5
0
5
10
15
20
25Liquidity Gap: 4% Prepayment Rate
-15
-10
-5
0
5
10
15
20
25Liquidity Gap: 6% Prepayment Rate

Liquidity & Balance Sheet Management Practice
20
Liquidity Cost & FTP Allocation
• Funds transfer pricing (FTP) is an increasingly central component of asset-liability management, as it facilitates risk transfer, profitability measurement, capital allocation, and business unit incentive alignment
• The components include a credit spread, which compensates the financial institution for bearing credit risk associated with the exposure, as well as an option spread, which is a premium that compensates the bank for any embedded options in the contract (e.g. prepayment option)
• The funding liquidity spread, which is the expected cost of funds required to support the exposure to its remaining life, and the contingent liquidity spread, which relates to the cost of maintaining a sufficient cushion of high quality liquid assets to meet sudden or unexpected obligation
Funds
Transf
er
Pri
ce
Commercial Margin
Credit Spread
Option Spread
Funding Liquidity Spread
Contingent Liquidity Spread
Reference Rate
*The chart represents an schematic illustration of the components of an FTP

Liquidity & Balance Sheet Management Practice
21
Liquidity Cost Model – Incorporating Contingent Liquidity Costs in Funds Transfer Pricing for Funding Planning
21
Commercial Margin
Credit Spread 201bps
Funding Liquidity Spread 32bps
Contingent Liquidity Spread 20bps
Reference Rate
Base Case: λ = 0.5, Corr(Bank,Borrower) = 16.5%
Stressed Scenario: λ = 0.9, Corr(Bank,Borrower) = 33%
FT
P =
253bps
FTP
= 3
26bps
Credit Spread 261bps
Funding Liquidity Spread 32bps
Contingent Liquidity Spread 33bps
Contr
actu
al F
ee =
300bps
Reference Rate
Contr
actu
al F
ee =
300bps
*Results based on Moody’s Analytics Liquidity Cost Model for a line of credit (bank PD 20bps/annual, borrower PD 1.2%/annual, LGD 50%)

Liquidity & Balance Sheet Management Practice
Assessing and Pricing Contingent Liquidity 4

Liquidity & Balance Sheet Management Practice
23
Borrower Credit State Net Cash Flow to Bank
No-Default rBorrower Default – LGDBorrower
1
QBorrower Borrower
Borrower QBorrower
PD LGDrPD⋅
=−
Break-even rate:
Computing Break-Even Spread in a One-Period Model: No Funding Costs
Moody’s Analytics Enterprise Risk Management Solutions
Liquidity & Balance Sheet Management Practice
24
1 1
QBank Borrower Borrower
Borrower Q QBorrower Borrower
r PD LGDrPD PD
⋅= +
− −
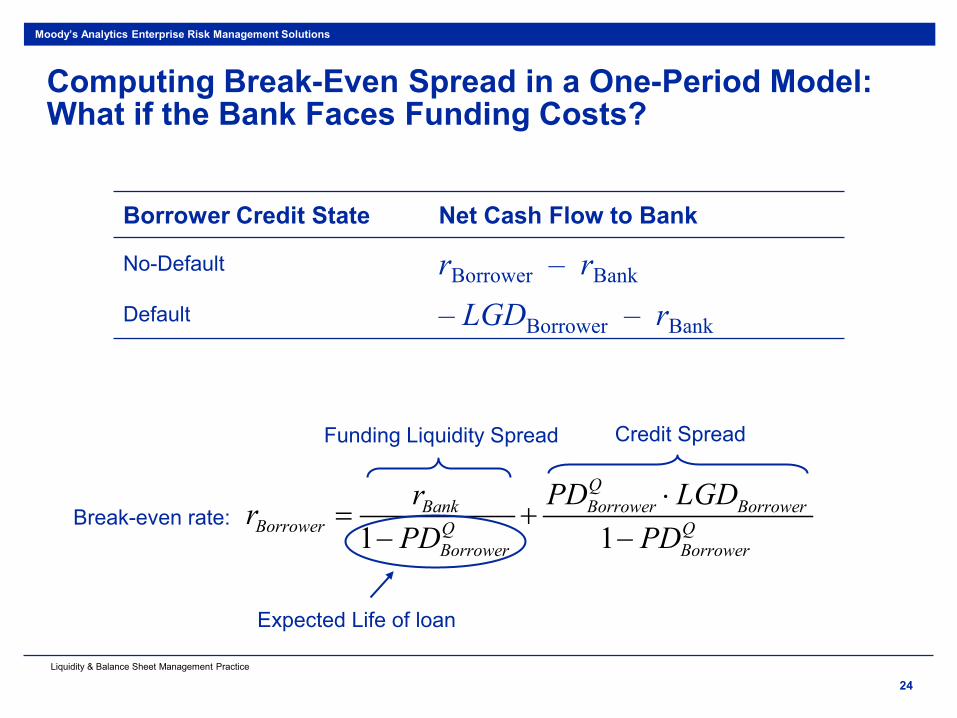
Computing Break-Even Spread in a One-Period Model: What if the Bank Faces Funding Costs?
Credit Spread Funding Liquidity Spread
Expected Life of loan
Borrower Credit State Net Cash Flow to Bank
No-Default rBorrower – rBank Default – LGDBorrower – rBank
Break-even rate:
Moody’s Analytics Enterprise Risk Management Solutions
Liquidity & Balance Sheet Management Practice
25
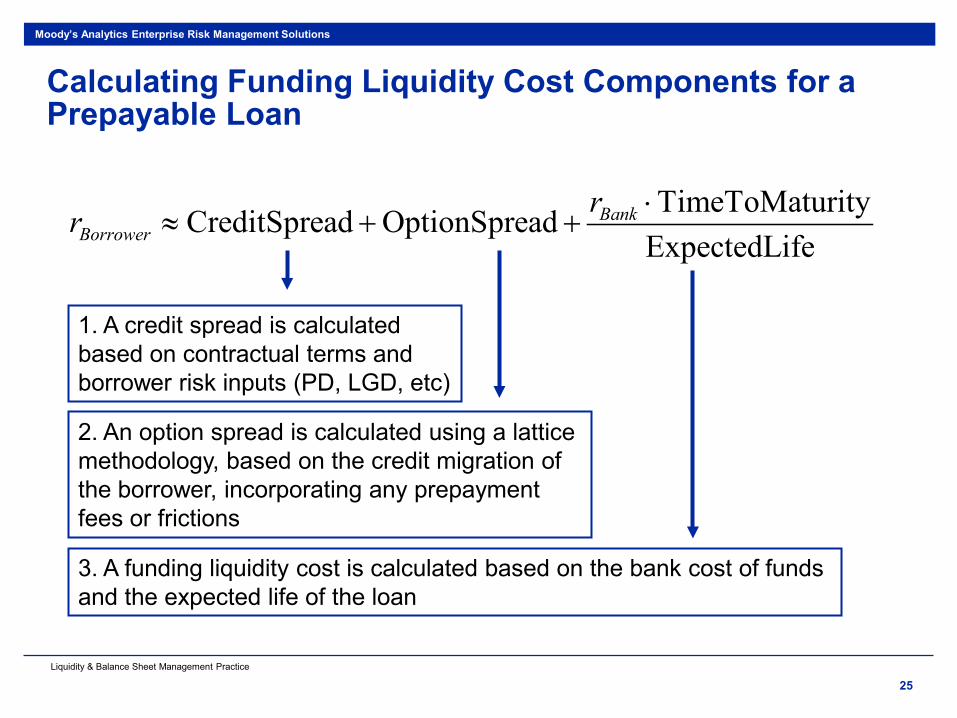
Calculating Funding Liquidity Cost Components for a Prepayable Loan
TimeToMaturityCreditSpread OptionSpreadExpectedLife
BankBorrower
rr ⋅≈ + +
1. A credit spread is calculated based on contractual terms and borrower risk inputs (PD, LGD, etc)
2. An option spread is calculated using a lattice methodology, based on the credit migration of the borrower, incorporating any prepayment fees or frictions
3. A funding liquidity cost is calculated based on the bank cost of funds and the expected life of the loan
Moody’s Analytics Enterprise Risk Management Solutions

Liquidity & Balance Sheet Management Practice
Access to capital markets may be limited A systemic event may result in severely hampering funding access
26
( )( ) 1 2 11 1
1, 2 1
2 1
1 log 1 ( )BankBank Bankt t tt tr N N PD RSQ t t LGD
t tλ− ≈ − − + ⋅ − ⋅ −
Short-Term Cost of Collateralized Funding Within a Structural Model of Default
Probability of bank default between t1 and t2 Market risk premium
Markets Functioning1 1Shutdownλ λ≤=
1 1 2, Bank
Default
Colateral Colateralt t tLGD QPD LGD≈ ⋅
Risk-adjusted collateral default probability, given the bank defaults
Moody’s Analytics Enterprise Risk Management Solutions

Liquidity & Balance Sheet Management Practice
27
A bank invests in a variety of assets
Extends backup lines of credit to a pool of borrowers: the future credit quality of them
is uncertain
Fully-funded instruments with
varying degrees of liquidity: the future
liquidity is uncertain
The bank funds the credit lines using a combination of long-term funds (a liquidity
buffer), short-term collateralized debt, and
possibly asset sales
The degree to which assets can be
collateralized is uncertain
The market price of the assets is uncertain
The bank’s funding costs, due in part to the value of
the collateral, and the borrowers’ line usage are
correlated
The future correlation behavior is uncertain
Borrowers’ future demand for liquidity (line utilization) is
uncertain
Availability of short-term funds is limited in severe
market conditions
The duration of the adverse funding
conditions is uncertain
The future funding needs are uncertain
Contingent Liquidity Risk: Motivation
• What amount of liquid assets should your bank hold in order to absorb potential losses due to adverse funding conditions?
Question
Moody’s Analytics Enterprise Risk Management Solutions

Liquidity & Balance Sheet Management Practice
Time Bank Funding Spread
Borrower Line Usage
Net Cash Flow to Bank at End of Period
To absorb losses with 99.9% confidence, has to satisfy
28
Measuring Bank Losses
{ }11Pr ( ) 99.9%BankBorrower
LUsage r r r L L− − ⋅ ≥ − ≥
11 ( )BankBorrower
LUsage r r r L− − ⋅
0t 0Bankr 0Usage 0 0( )Borrower Bank
LUsage r r r L− − ⋅
1t 1Bank
r 1Usage
Size of liquidity buffer
Cost of carry of liquidity buffer
L
Moody’s Analytics Enterprise Risk Management Solutions
Liquidity & Balance Sheet Management Practice
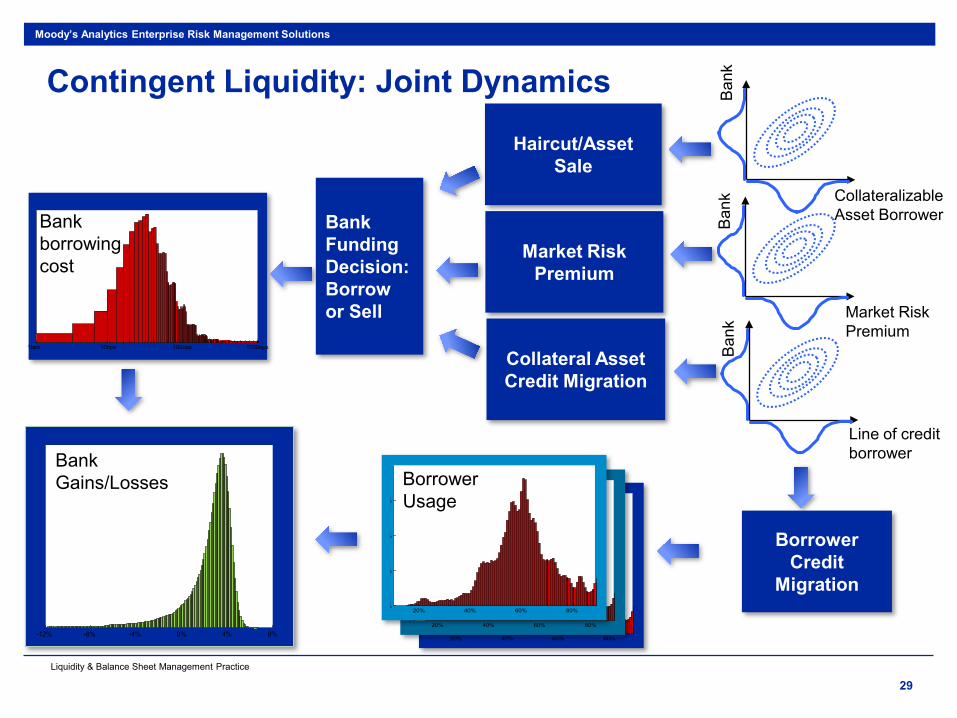
20% 40% 60% 80%%
%
%
%
20% 40% 60% 80%%
%
%
%
20% 40% 60% 80%%
%
%
%
1bps 10bps 100bps 1000bps
29
Borrower Usage
-12% -8% -4% 0% 4% 8%
Bank Gains/Losses
Borrower Credit
Migration
Collateral Asset Credit Migration
Market Risk Premium
Haircut/Asset Sale
Ban
k
Line of credit borrower
Ban
k
Market Risk Premium
Ban
k
Collateralizable Asset Borrower Bank
borrowing cost
Bank Funding Decision: Borrow or Sell
Contingent Liquidity: Joint Dynamics Moody’s Analytics Enterprise Risk Management Solutions

Liquidity & Balance Sheet Management Practice
How to Enhance your Balance Sheet Management Function 5

Liquidity & Balance Sheet Management Practice
31
Prepayments Behaviors
Non-Maturity Liabilities Behaviors
Short Term Assets
Behaviors
Revolving Credit
Facilities Behaviors
Borrower prepayment assumptions can have a
material effect on liquidity and interest rate risk measures
and are key to perform liquidity stress testing
Best practice is to model liabilities by explicitly accounting for the relationships between
deposit balances, deposit rates, currency effects, as well
as macro-economic factors
How should one determine the proper maturity for exposures
that have short contractual maturity, from a few days to a
few weeks and properly account for the liquidity and
credit risk?
How should one estimate the proper usage for revolving
credit facilities and properly account for the liquidity and
credit risk?
Quantifying Behavioral Dynamics Moody’s Analytics Enterprise Risk Management Solutions

Liquidity & Balance Sheet Management Practice
32
0.20.30.40.50.60.70.80.911.11.2
0.8
0.9
1
1.1
1.2
Mar-02 Mar-03 Mar-04 Mar-05 Mar-06 Mar-07 Mar-08 Mar-09 Mar-10 Mar-11
Banking Index Asset Value Market Price of Risk
Quantifying Banks Assets Value Dynamics
• Correlations between bank asset returns and Innovations in risk premium are elevated during crisis periods
Bank Asset Value and Credit Market Risk Premium
Moody’s Analytics Enterprise Risk Management Solutions

Liquidity & Balance Sheet Management Practice
33
-
0.200
0.400
0.600
0.800
1.000
1.200
1.400
11/23/01 11/23/02 11/23/03 11/23/04 11/23/05 11/23/06 11/23/07 11/23/08 11/23/09 11/23/10
NA - IG
NA - HY
EU - IG
EU - HY
Quantifying a Crisis Period Value
• The crisis period is characterized as the 95th percentile of the empirical density estimate
Market Risk Premium Significantly Higher in Crisis Periods
Moody’s Analytics Enterprise Risk Management Solutions

Liquidity & Balance Sheet Management Practice
34
Measuring Haircuts
Bank
Counterparty 1
Counterparty2
Asset 1
Asset 2
Collateral 1
Collateral 2
Counterparty Collateral ID
Baseline Scenario Stress Testing Scenario (Collateral -3 Notch)
Target Probability Target Probability
90% 95% 99% 90% 95% 99%
1 C1 3% 6% 8% 7% 11% 16%
2 C2 5% 9% 12% 9% 12% 25%
Firm Risk
Systematic Risk
Firm Specific
Risk
Country Risk
Industry Risk
Industry Specific
Risk
(61)
Country Specific
Risk
(49)
Regional Risk
(5)
Global Economic
Risk
(2)
Industrial Sector Risk
(7)
R2 1 - R2
• The counterparty link to the collateral tends to be ignored altogether in portfolio management; it should be modeled properly
A Reliable and Consistent Haircut Level
Moody’s Analytics Enterprise Risk Management Solutions
Liquidity & Balance Sheet Management Practice
35
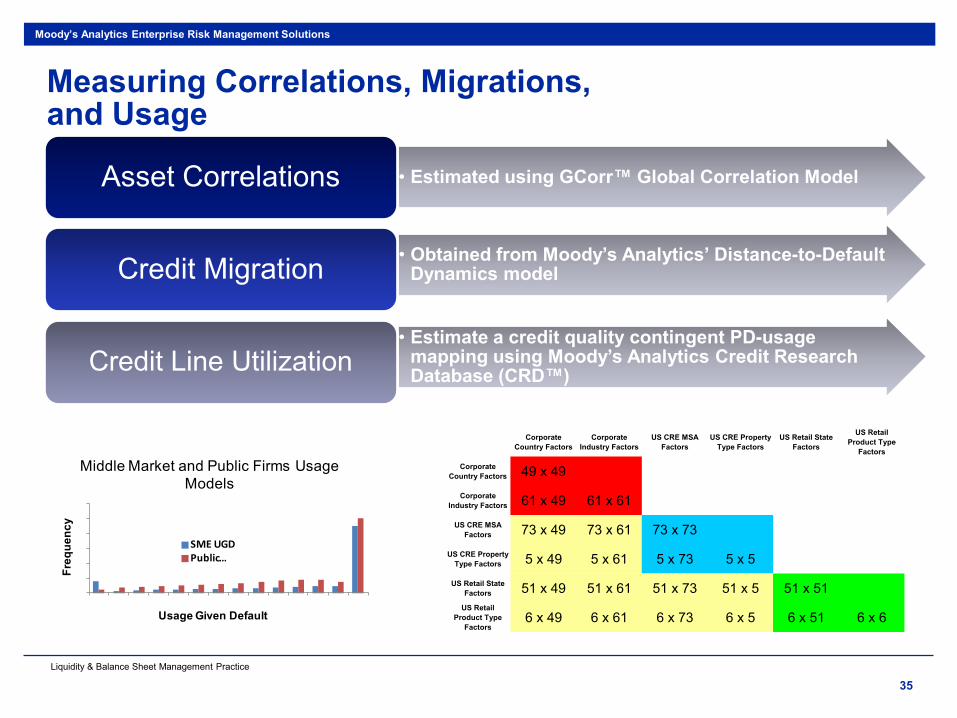
Measuring Correlations, Migrations, and Usage
• Estimated using GCorr™ Global Correlation Model Asset Correlations
• Obtained from Moody’s Analytics’ Distance-to-Default Dynamics model Credit Migration
• Estimate a credit quality contingent PD-usage mapping using Moody’s Analytics Credit Research Database (CRD™) Credit Line Utilization
Corporate Country Factors
Corporate Industry Factors
US CRE MSA Factors
US CRE Property Type Factors
US Retail State Factors
US Retail Product Type
Factors
Corporate Country Factors 49 x 49
Corporate Industry Factors 61 x 49 61 x 61
US CRE MSA Factors 73 x 49 73 x 61 73 x 73
US CRE Property Type Factors 5 x 49 5 x 61 5 x 73 5 x 5
US Retail State Factors 51 x 49 51 x 61 51 x 73 51 x 5 51 x 51
US Retail Product Type
Factors6 x 49 6 x 61 6 x 73 6 x 5 6 x 51 6 x 6
0
0.2
0.4
0.6
0.8
1
1.2
Freq
uenc
y
Usage Given Default
Middle Market and Public Firms Usage Models
SME UGDPublic …
Moody’s Analytics Enterprise Risk Management Solutions

Liquidity & Balance Sheet Management Practice
36
Quantifying Portfolio Characteristics
Bank Characteristics
• Cost of long-term debt: 1.5%
• Maturity of short-term debt: one year
• 1-year default probability: 50 bps
• RSQ: 60%
Collateral Asset Characteristics
• No. of homogeneous assets: 40
• Maturity of assets: two years
• 1-year default probability: 80 bps
• Coupon rate: 3%
• RSQ: 40%
Borrower Characteristics
• No. of homogeneous borrowers: 80
• Maturity of credit line: two years
• Contractual usage fee: 3%
• 1-year default probability: 2%
• RSQ: 25%
Moody’s Analytics Enterprise Risk Management Solutions
Liquidity & Balance Sheet Management Practice
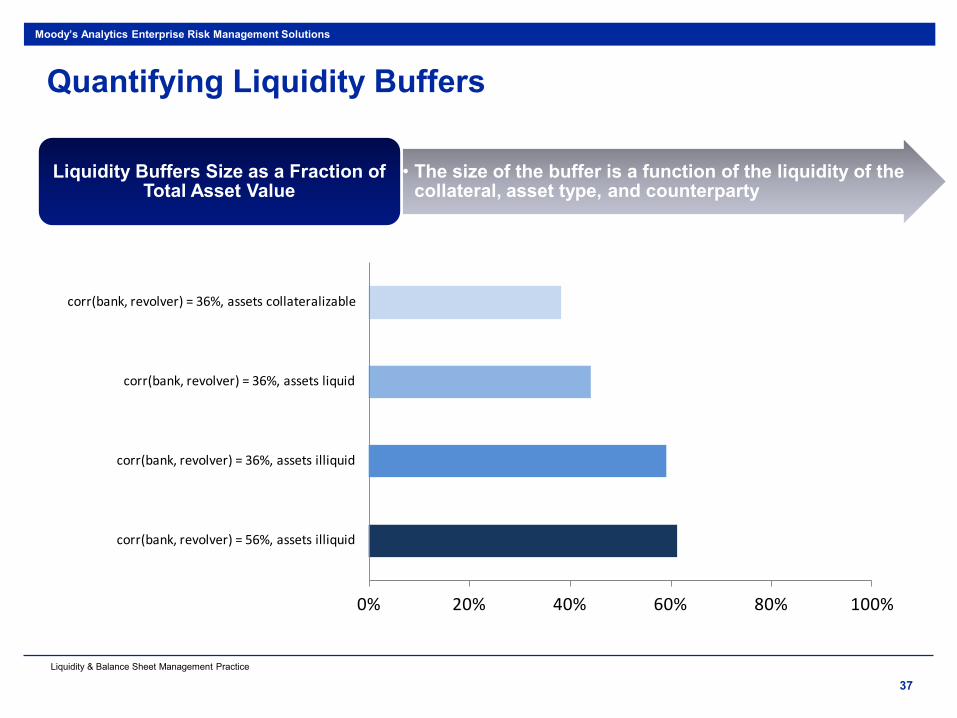
37
0% 20% 40% 60% 80% 100%
corr(bank, revolver) = 36%, assets collateralizable
corr(bank, revolver) = 36%, assets liquid
corr(bank, revolver) = 36%, assets illiquid
corr(bank, revolver) = 56%, assets illiquid
Quantifying Liquidity Buffers
• The size of the buffer is a function of the liquidity of the collateral, asset type, and counterparty
Liquidity Buffers Size as a Fraction of Total Asset Value
Moody’s Analytics Enterprise Risk Management Solutions

Liquidity & Balance Sheet Management Practice
38
Quantifying Fund Transfer Pricing
Commercial Margin
Credit Spread 201bps
Funding Liquidity Spread 32bps
Contingent Liquidity Spread 20bps
Reference Rate
FTP
= 2
53bps
FTP
= 3
26bps
Credit Spread 261bps
Funding Liquidity Spread 32bps
Contingent Liquidity Spread 33bps C
ontr
actu
al F
ee =
300bps
Reference Rate
Contr
actu
al F
ee =
300bps
• Market Sharpe Ratio = 0.5, Corr(Bank,Borrower) = 16.5%
Base Case Scenario
• Market Sharpe Ratio = 0.9, Corr(Bank,Borrower) = 33% Stress Scenario
Moody’s Analytics Enterprise Risk Management Solutions

Liquidity & Balance Sheet Management Practice
Conclusions 6

Liquidity & Balance Sheet Management Practice
40
Conclusions Liquidity has become a scarce and expensive resource, and institutions are starting to
measure, allocate liquidity efficiently by improving their Fund Transfer Pricing frameworks
The regulators identified “ineffective” liquidity management as a key characteristic of the crisis and highlighted the lack of attention that liquidity risk received relative to other risks prior to the crisis
Responses to an international survey that covered more than 35 large banks from nine countries show that many liquidity management practices were largely deficient
A central aspect of the new Basel 3 regulation involves accurate measurement of the liquidity profile of the balance sheet under different scenarios
This, in turn, relies on a comprehensive characterization of behaviors of both assets and liabilities and liquidity contingency buffers
As a consequence, a large number of institutions are enhancing the balance sheet management function by improving the sophistication of their liquidity models, workflows and policies, ALM systems, and integration between the credit and liquidity management function
Moody’s Analytics Enterprise Risk Management Solutions

Liquidity & Balance Sheet Management Practice
© 2012 Moody’s Analytics, Inc. and/or its licensors and affiliates (collectively, “MOODY’S”). All rights reserved. ALL INFORMATION CONTAINED HEREIN IS PROTECTED BY COPYRIGHT LAW AND NONE OF SUCH INFORMATION MAY BE COPIED OR OTHERWISE REPRODUCED, REPACKAGED, FURTHER TRANSMITTED, TRANSFERRED, DISSEMINATED, REDISTRIBUTED OR RESOLD, OR STORED FOR SUBSEQUENT USE FOR ANY SUCH PURPOSE, IN WHOLE OR IN PART, IN ANY FORM OR MANNER OR BY ANY MEANS WHATSOEVER, BY ANY PERSON WITHOUT MOODY’S PRIOR WRITTEN CONSENT. All information contained herein is obtained by MOODY’S from sources believed by it to be accurate and reliable. Because of the possibility of human or mechanical error as well as other factors, however, all information contained herein is provided “AS IS” without warranty of any kind. Under no circumstances shall MOODY’S have any liability to any person or entity for (a) any loss or damage in whole or in part caused by, resulting from, or relating to, any error (negligent or otherwise) or other circumstance or contingency within or outside the control of MOODY’S or any of its directors, officers, employees or agents in connection with the procurement, collection, compilation, analysis, interpretation, communication, publication or delivery of any such information, or (b) any direct, indirect, special, consequential, compensatory or incidental damages whatsoever (including without limitation, lost profits), even if MOODY’S is advised in advance of the possibility of such damages, resulting from the use of or inability to use, any such information. The ratings, financial reporting analysis, projections, and other observations, if any, constituting part of the information contained herein are, and must be construed solely as, statements of opinion and not statements of fact or recommendations to purchase, sell or hold any securities. NO WARRANTY, EXPRESS OR IMPLIED, AS TO THE ACCURACY, TIMELINESS, COMPLETENESS, MERCHANTABILITY OR FITNESS FOR ANY PARTICULAR PURPOSE OF ANY SUCH RATING OR OTHER OPINION OR INFORMATION IS GIVEN OR MADE BY MOODY’S IN ANY FORM OR MANNER WHATSOEVER. Each rating or other opinion must be weighed solely as one factor in any investment decision made by or on behalf of any user of the information contained herein, and each such user must accordingly make its own study and evaluation of each security and of each issuer and guarantor of, and each provider of credit support for, each security that it may consider purchasing, holding, or selling.
Moody’s Analytics Enterprise Risk Management Solutions