enhancing sql server performance -...
TRANSCRIPT

Enhancing SQL Server Performance
Bradley Ball, Jason Strate and Roger Wolter
End user satisfaction is often fleeting, and manufacturers are constantly releasing newer, faster hardware. While investing in the latest and greatest hardware is a tempting quick-fix to improve performance, throwing hardware at a problem without understanding the root of the issue is a very risky and potentially expensive approach.
The most practical way to gather and analyze performance data is through a third-party tool like SolarWinds Database Performance Analyzer (DPA) that performs database analysis. There are quite a few ways to improve SQL Server performance that don’t involve a sig-nificant investment in new hardware. Before proposing top of the line hardware upgrades or the latest Solid State Drive (SSDs), take the time to investigate and fully understand the true cause of performance issues with the following steps:• Impactful Adjustments to Current Hardware• Refine Storage Usage• Take Advantage of Parallelism• Optimize Memory• Fine-Tune Table and Index Scans• Speed Up Transaction Logs• Analyze Wait Times
In the ever-evolving data world, improving database performance is a constant challenge for administrators.

Monitoring database performance is essential for making sure the right problem is be-ing solved and can lead to finding and fixing performance issues before they become a problem. Gathering information, establishing baselines, and maintaining history are all critical to maintaining high performance.
Impactful Adjustments to Current HardwareEven after tripling the number of processor cores and memory powering the SQL Server Database, new processors may still show 70-89% usage when running under load. Simply adjusting power saver settings to “high performance” can dramatically decrease processor usage to under 20%.
In the midst of a performance issues, current hardware should be evaluated and optimized to ensure maximum efficiency be-fore even considering new hardware. Specifically, the Power Saver settings and HBA Queue depth should be checked:
Adjust Power Saver Settings
During off-peak usage, Microsoft Windows servers can slow down to save power and run cooler. While this feature defi-nitely has its benefits, it can also cause SQL Server perfor-mance problems. When the server isn’t being pushed hard, the processors slow down thus resulting in longer query result times. The easiest way to fix this is to change the Power Saver setting from the default of “Balanced” to “High Power.” This quick adjustment will make query response times con-sistent but will use more power.
Increase HBA Queue Depth
SQL Server storage IO tends to happen in bursts which can temporarily exceed the SAN’s processing abilities. To handle bursts in IO, Host Bus Adapters (HBA) have a queue to store IO commands until they can be sent to the SAN controller. Most HBAs default to a queue depth of 16 or 32. This is usually too small for SQL Server. The HBA queue depth should be 64 or 128 for SQL Server. Start by increasing HBA queue depth to 64, and if that improves performance, increase again to 128. If the OS Disk Queue Length goes into double digits frequently or if it has been increasing over time, the HBA queue depth is a likely candidate.
Refine Storage UsagePutting logs, data, and tempdb on separate volumes is a best practice for good reason: It’s essential for optimum performance. When some volumes that are faster than oth-ers – such as RAID 10 vs RAID 5 or SSD vs spinning media – the log and tempdb will benefit more than the other from the added speed. Tempdb IO speed is most important when one of the snapshot isolation options is being used or if an application creates a lot of temp tables.
If storage is already properly allocated, another efficient method for reducing storage IO demand is utilizing data compression. Very few databases using modern processors are processor bound, but many of them are IO bound, therefore it’s rare for compression to not significantly improve performance. That being said, if processor usage is consistent-ly over 70%, it needs to be addressed before implementing data compression. Not only does compression save storage space, it also increases the amount of data contained

in each IO operation thus reducing the number of IOs required. Commonly, compressed indexes take longer to rebuild so that should be taken into consideration when planning a compression and maintenance strategy.
The last method to reduce disk IO is to modify the application to use less IO. One of the biggest contributors to disk IO is table and index scans. Beware that what looks like a disk IO problem might be caused by too many disk scans in the application.
DPA monitors many disk statistics that can be very helpful in assessing storage issues.
Valuable metrics to watch:
• seconds/read • seconds/writeIdeally for a well-tuned SAN, seconds/ read should be under .010 (10ms) and seconds/write should be under .005 (5ms), but adequate performance from a storage subsystem with numbers considerably higher than this is possible.
As with most metrics, it’s important to look at how the current numbers compare to a time when performance was adequate, and the history maintained by DPA should provide that information. DPA also displays nice graphs of trends that should help you find wors-ening disk performance before your users notice a problem.

Take Advantage of ParallelismOne of the latest hardware trends is the increase in processor clock speeds from a few megahertz to about 3 gigahertz - a thousand fold increase in just a few years. Conversely, clock rates have remained fairly constant over the last decade. New generations of mi-croprocessor technology improve performance by increasing cache sizes, adding caches and increasing the number of cores per chip. These improvements are largely due to ap-proaching limitations within the current chip technology. One of the effects of this change is that applications have to improve at running many tasks in parallel to take advantage of the number of cores available.
SQL Server has two ways to take advantage of parallel processors:
• Running multiple queries simultaneously• Running a single query on multiple processorsRunning multiple queries in parallel is controlled by the SQL Server schedulers and hap-pens automatically. If the server doesn’t have hyper-threading enabled, turning it on can increase parallelism. When hyper-threading was first introduced, there were reports of decreased performance, but those issues are no longer a factor.
Using parallel processors to execute a single query is a bit more complex and requires some tuning to work well. There is a tradeoff between giving enough parallel resources to a query so that it runs quickly and dedicating too many resources to a single query so that it impacts the performance of the rest of the system.
The instance parameter MAXDOP controls how many parallel processors a query can use. The default value for MAXDOP is 0 which means the optimizer can chose to use all the processors in the system to execute a single query. All the processors is generally too much to dedicate to a query, unless it’s for running one or two huge queries at a time as part of a nightly processing job. The right value for MAXDOP depends on the kind of que-ries being run: higher for OLAP systems with a few very big queries and lower for OLTP systems. Start out with setting it to the number of processors in a NUMA node - usually 6
Experiencing performance issues even with large servers? Increasing the MAXDOP value from 0 to 8 and the cost threshold from 5 to 30 can more than double performance.
or 8. If the system doesn’t have NUMA nodes, then 8 is a good place to start.
If DPA shows consistently high values for the CXPACKET wait type, it means your server is doing a lot of parallel queries. When the SQL Server engine splits a que-ry into multiple execution threads, it has to wait for all the threads to complete before doing single threaded operations. The time spent waiting is recorded as a CXPACKET wait. In a data warehouse that does primarily large queries on large tables, high CXPACKET wait times may be normal. But in an OLTP system, this may be a sign of too many parallel queries. Parallelism is relatively expensive so it should be reserved for the very large queries that need it.
The SQL Server optimizer always computes a serial plan first, and then if the cost of the serial plan is large enough, it computes a parallel plan and compares the se-rial and parallel costs to determine which one to use. The cost that must be ex-ceeded before a parallel plan is computed is the “Cost Threshold for Parallelism” which is an advanced instance property. The Cost Threshold for Parallelism de-faults to 5 which is much too small for a modern server. This should be set to at least 20 or 30.
Optimize MemoryMemory is generally the most critical factor in SQL Server performance. If a query can find the data it needs in memory, it may execute hundreds of times faster than if it has to go to disk. While adding memory will almost always help SQL Server performance, there are limits to how much memory a processor can use therefore optimizing the usage of memory is critical.
Buffer Cache
Optimizing storage performance through data compression also optimizes memory usage because the data pages are stored in memory in compressed format. If compression de-creases disk space by 20%, it will also increase the amount of data that can be cached in buffer memory by 20%.
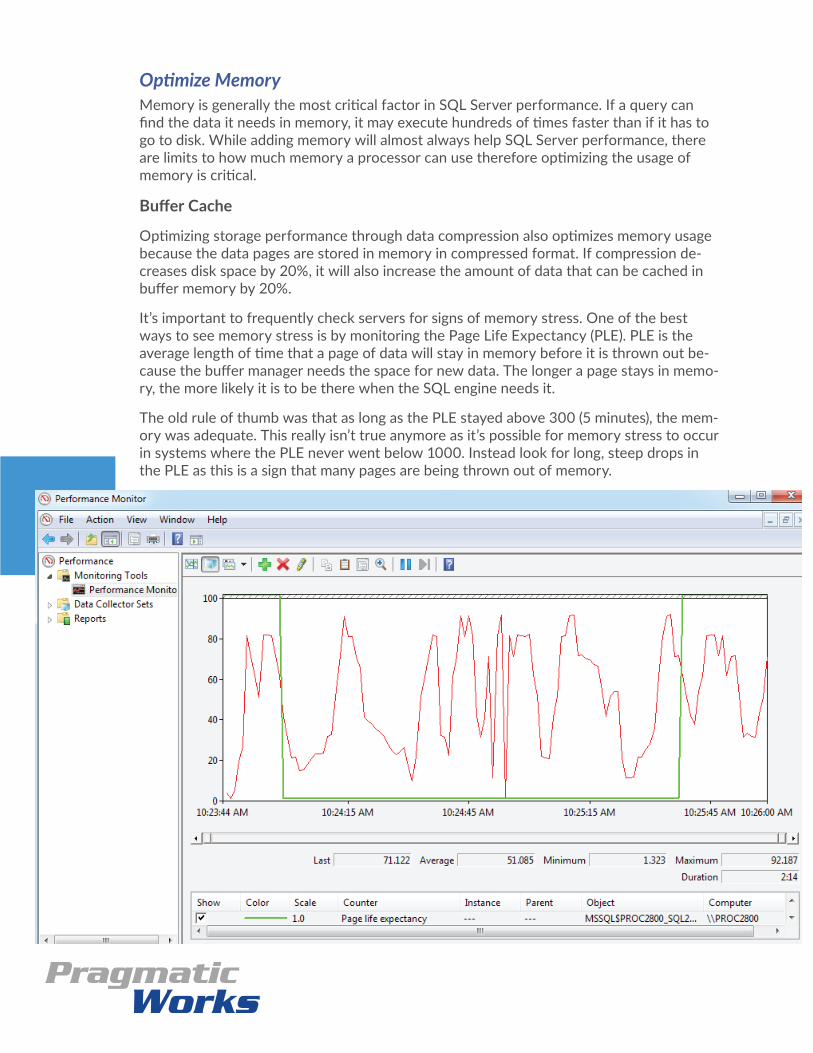
It’s important to frequently check servers for signs of memory stress. One of the best ways to see memory stress is by monitoring the Page Life Expectancy (PLE). PLE is the average length of time that a page of data will stay in memory before it is thrown out be-cause the buffer manager needs the space for new data. The longer a page stays in memo-ry, the more likely it is to be there when the SQL engine needs it.
The old rule of thumb was that as long as the PLE stayed above 300 (5 minutes), the mem-ory was adequate. This really isn’t true anymore as it’s possible for memory stress to occur in systems where the PLE never went below 1000. Instead look for long, steep drops in the PLE as this is a sign that many pages are being thrown out of memory.
According to the PLE graph, it can take many minutes for the PLE to return to normal af-ter one of these drops. The gradual buildup of the PLE to normal levels represents thou-sands of IOs loading data into memory and because the data has to be read from disk, performance suffers.
These sharp drops in PLE are almost always caused by table or index scans which read significant parts of a table into memory. Many scans can be eliminated by proper index-ing and well-written queries. Sharp PLE drops can also be caused by DBCC or index re-builds which read large amounts of data. These drops cannot be avoided so it’s safe to ignore them.
Another sign of memory stress is that dirty pages (pages that contain data which has been changed but not yet persisted to disk) are written to disk so the memory can be freed. Dirty pages are normally written to disk during checkpoint operations that hap-pen about once a minute, but if memory is needed between checkpoints, the lazy writer process writes dirty pages to disk. Monitoring the number of lazy writer pages is another way to detect memory pressure. A few lazy writes is normal, but if the lazy writer is writ-ing many pages over an extended period, the system is suffering from memory pressure.
Plan Cache
Another important use for memory in SQL Server is the plan cache. Query plans are ex-pensive and time consuming to compile, so SQL Server caches the plan it compiles and reuses it the next time it executes the same query. To speed up plan lookup, a hash is computed over the text of the query and compared to the hash for queries stored in the plan cache. This means that if the incoming query is not exactly the same character for character, including case and white space, the same as a query stored in the plan cache, a new plan will be compiled and stored in the plan cache.
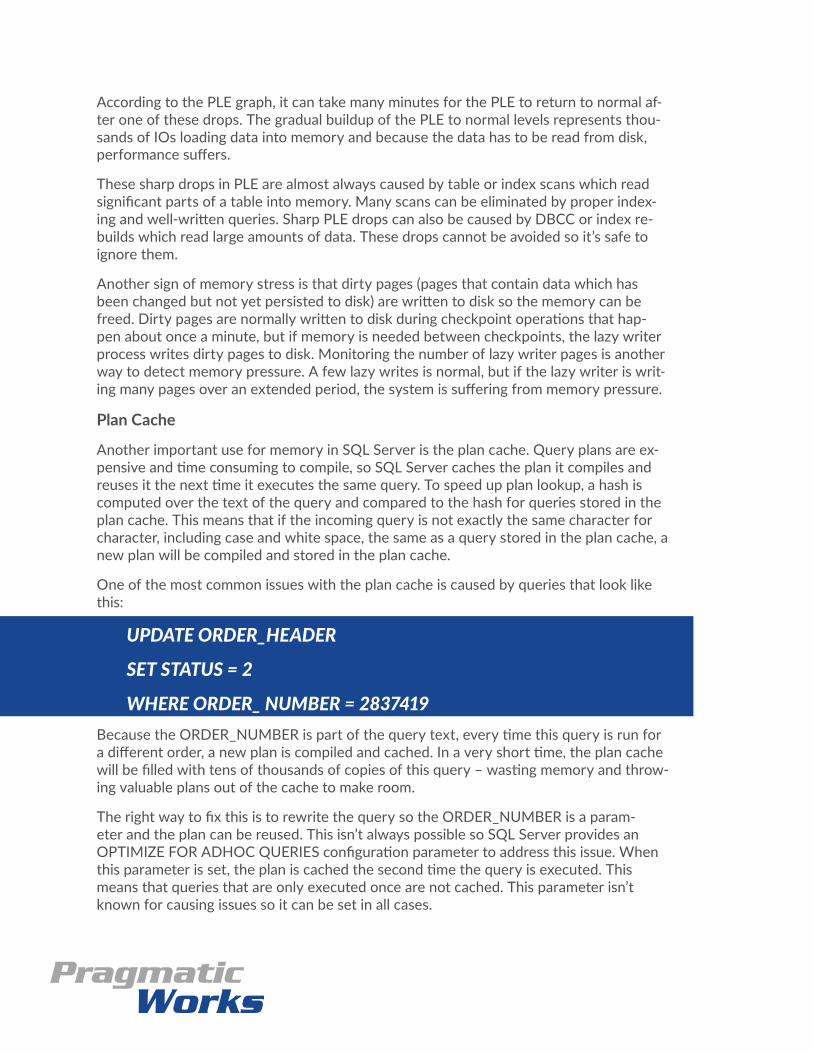
One of the most common issues with the plan cache is caused by queries that look like this:
UPDATE ORDER_HEADER
SET STATUS = 2
WHERE ORDER_ NUMBER = 2837419 Because the ORDER_NUMBER is part of the query text, every time this query is run for a different order, a new plan is compiled and cached. In a very short time, the plan cache will be filled with tens of thousands of copies of this query – wasting memory and throw-ing valuable plans out of the cache to make room.
The right way to fix this is to rewrite the query so the ORDER_NUMBER is a param-eter and the plan can be reused. This isn’t always possible so SQL Server provides an OPTIMIZE FOR ADHOC QUERIES configuration parameter to address this issue. When this parameter is set, the plan is cached the second time the query is executed. This means that queries that are only executed once are not cached. This parameter isn’t known for causing issues so it can be set in all cases.

Fine-Tune Table and Index ScansAs mentioned previously, one of the significant contributors to excessive IO and memory usage is scans of tables and indexes. Scans read all rows in a table or a range of rows in a table. Reading a large number of rows can exhaust the free space in the buffer cache and force the cache to evict pages to make room for the pages required for the scan. This not only requires IOs to read in the rows being scanned, but the rows evicted from the cache to make room for the scanned rows must be read in again the next time they’re needed. Scans are not always bad though. In cases where not a large number of rows are required, a scan in often the best choice for performance. There are also some operations like SUM or COUNT which have to read all the rows to complete.
Table and Index Scans
Using DPA, scans can be found by searching the plans for the most expensive queries tracked by. If the query plan contains scan operations, first determine why the optimiz-er chose to do a scan, then decide if the scan is a problem. There are several reasons why the optimizer will chose to scan an index or table:
1. The query needs to access all the rows. The query may not have a where clause or the where clause selects a large number of rows. These scans can’t be avoided.
2. The query accesses so few rows that a scan is the fastest way to execute the que-ry. Look at the estimated rows returned and if this is a reasonably small number, ignore this scan. If the estimated number of rows is much lower than the actual number of rows scanned, the statistics for the table need updating.
3. There is no index on the columns being scanned. If there isn’t an index, then a scan is the only option. Try putting an index on the column or columns that the scan is looking at.
4. There is an index, but the optimizer can’t use it. There are a couple common issues here:
a. The query involves an implicit data type conversion and the optimizer can’t use the index because it has to convert all the values in the column to do the comparison. For example, if the where clause is WHERE fname = @first_name and fname is varchar and @ first_name is nvarchar then all the fname values must be converted to nvarchar be-cause nvarchar has a higher precedence than varchar. Implicit type conversion always changes the lower precedence type to the higher precedence type. The way to avoid the scan in this case would be to change @first_name to varchar so the index on fname can be used.
b. The query uses a scalar function on the column used in a comparison. Here again, every row has to be read and have the function applied before the comparison can be done. A good example of this is WHERE UPPER(fname) = ‘JOE’
Speed Up Transaction LogsOne of the most critical determinants of database performance is transaction log write speed. Transactions can’t commit until the commit record is written to the transaction log. It’s pretty common to see applications with no “BEGIN TRANSACTION … COMMIT” statements. A common assumption of many is that this means transactions are not

being used. Relational databases always use transactions, so if there are no transac-tion boundaries defined, each statement is its own transaction. This means that each statement has to wait for a transaction log write to complete. This puts a lot of stress on the transaction log which can adversely impact performance. Very long transactions are also a performance issue because locks are held until the transaction completes. Grouping statements into logically related transactions can improve performance by re-ducing the waits on transaction log writes.
Analyze Wait TimesThe next step in improving SQL Server performance is to determine which waits are involved in the queries that are causing issues. DPA includes a Response Time Analysis (RTA) feature that breaks the total response time into the wait states involved in pro-ducing the result. A careful analysis of the wait times can help determine which issues should be addressed to improve query performance. For example, if IO waits are a sig-nificant part of the query processing, consider adding an index to reduce the IO. If the biggest wait is ASYNC_NETWORK_IO, talk to the network team.
If it’s unclear which queries are causing issues, DPA will indicate which queries are tak-ing the most time, which queries run most often and which queries are using the most resources. Of those queries, RTA can find the significant waits and determine how to improve performance.
Wait times can be analyzed at the instance level and correlated with system resource metrics to ensure the right problem is addressed. For example, if CXPACKET waits are high and Page Life Expectancy is low, changing instance-level parameters or buying more memory may be the solution. In one instance, a query
indicated it took 30 seconds to run and was scheduled every 5 seconds. As a result, 6 copies of the same query were running simultaneously. Changing the schedule to run the query every 2 minutes instead of 5 seconds dropped processor usage from 100% to 40% and processing was current for the first time in months.
Also, look for patterns in performance over time. There are normally peaks in resource usage at the same time of day or the same day of the week, for example. DPA stores historical data in a repository to make finding performance trends like these easier. In most cases, when these peaks occur cannot be con-trolled, it makes sense to schedule backups, mainte-nance, scheduled jobs and other controllable factors so that they happen at off-peak times. Significant performance issues can be alleviated by staggering the start times of nightly processing jobs instead of starting them all at the same time.
DPA can also be used to track the performance of a query over time. This might indicate when it started performing poorly – possibly because the query plan changed, a lot of rows were added, or another application was deployed. When something is tuned or changed, DPA can de-termine whether performance improved, regressed or stayed the same.

The key thing to remember is that while there are many ways improve performance, there is little chance of fixing it unless the problem is determined first.
These fundamental performance analysis and resolution techniques apply whether a tool like DPA is used to gather, maintain, and analyze performance data or if the analysis is done with the SQL Server facilities. Find out how you can start using these tools and more with training and consulting services from Pragmatic Works.
www.pragmaticworks.com
904-638-5743