enhancing experiential learning via sustained student
TRANSCRIPT

Page 42 - Developments in Business Simulation and Experiential Learning, Volume 47, 2020
ABSTRACT
Based on learning and engagement theory, this paper provides evidence of sustained (a) observed in-class participation / interaction skills (cognitive), emotional (affective), and performance physical (behavioral) engagement among competing simulation team members. In-class engagement measures monitored include observed levels of increased attendance, in-class focus and energy, relevant questions raised, discussion quality, decision support package usage, end-of-period scaffolding, initial, intermediate, and final debriefing. Out-of-class engagement measures include two-way communication, bi-weekly online decision entry, results retrieval, and graphics package usage, weekly writing assignments, individual report, team presentation, server log statistics of daily, weekly, and semester team activity, website tracking, and online survey responses.
INTRODUCTION
Student engagement is considered an important predictor of student achievement (Handelsman, Briggs, Sullivan, & Towler,
2005). Engaged students are good learners and effective teaching stimulates and sustains student engagement (Pintrich & DeGroot, 1990; Skinner & Belmont, 1993). In addition, Skinner and Belmont (1993) found a reciprocal relationship between student engagement and teacher involvement. Yet, the definitions and measurement of student engagement are limited.
The Association to Advance Collegiate Schools of Business (AACSB International) 2013 Eligibility Procedures and
Accreditation Standards for Business Administration (last revised July 1, 2018) Accreditation Standard 13 on Student Academic and Professional Engagement, states “Curricula facilitate student academic and professional engagement appropriate to the degree program type and learning goals.” (AACSB International, 2013). AACSB International asserts that student academic and professional engagement occurs when students are actively involved in their educational experience, in both academic and professional settings, and when they are able to connect these experiences in meaningful ways.
When reviewing business school accreditation applications, the AACSB International bases for evaluating student
engagement, include (a) students give the appropriate attention and dedication to the learning materials, and (b) maintain their engagement with these materials even when challenged by difficult learning activities. In addition, the curricula include approaches that actively engage and include all students in learning. Pedagogical approaches suitable for challenging students in this way include problem-based learning projects and simulations (AACSB International, 2013). Faced with challenging learning activities, students are willing to invest personal, internal energies regardless of task difficulty. Kahn (1990) asserted that this investment of resources results in physical, cognitive, and emotional dimensions of engagement that produce active, full performance as demonstrated by attendance, performance and student products.
AACSB International recommends that educational institutions applying for accreditation document (a) curricula
approaches that actively engage and include students in academic learning, and (b) outcomes of the learning process in the form of projects, papers, presentation, examination performances, and other demonstrations of learning in order to demonstrate clear evidence of active student engagement in learning (AACSB International 2013).
The primary purpose of this paper is to review the engagement literature, and identify, describe and attempt to synthesize
the current models of academic and curricular engagement. Based on this review, evidence of sustained (a) observed in-class skills (cognitive), emotional (affective), participation/interaction and performance (behavioral) engagement among competing simulation team members is monitored on a continuing basis. Both subjective and objective measures of in-class and out-of-class engagement at the individual- team- and class-levels are currently monitored. In-class engagement measures include recorded levels of (a) attendance, (b) classroom focus and energy, (c) questions raised, (d) discussion quality, (e) decision support package usage, (f) team discussion and responses to thinklets (problems posed in class) using a problem-based learning approach, (g) group discussion with the professor to address sub-par performance concerns during scaffolding sessions at the end of each class period, (h) co-creation of value using the operand resources (marketing decision support packages) and student knowledge, skills and notebook computers (operant resources). Out-of-class engagement measures include (a) timely bi-weekly online decision entry prior to preset decision deadlines and subsequent results retrieval, (b) graphics package usage, (c) timely submission of weekly writing assignments, (d) server log statistics of daily, weekly, and semester team activity, (e) website tracking of visitor activity, visitor paths, page views, time spent, keywords used, marketing dss package downloads, exit pages, visitor location, and number of sessions by page, and (f) responses to an online student engagement survey on the value added to the learning experience by the initial, intermediate and final debriefing phases of the course.
Enhancing Experiential Learning via Sustained Student Engagement
Aspy P. Palia
University of Hawaii at Manoa [email protected]

Page 43 - Developments in Business Simulation and Experiential Learning, Volume 47, 2020
First, a review of the literature on student engagement includes (a) Handelsman, Briggs, Sullivan, and Towler (2005) development of the Student Engagement Questionnaire (SCEQ) and identification of four distinct and reliable dimensions of college student engagement, and (b) Dweck and Leggett (1988), Dweck (1999), and Molden and Dweck (2000) social-cognitive model based on a motivational pattern of mastery.
Next, several attempts to develop student engagement scales and survey instruments are summarized. These surveys elicit
responses on (a) cognitive, affective and behavioral engagement (Hoover & Whitehead, 1975), (b) the amount of time and energy students put into their education and related activities, and (c) how institutions use resources to encourage students to engage in activities that increase the student’s learning experience, in order to assess college quality by National Survey of Student Engagement (NSSE). Other survey instruments elicit responses on (a) the level of performance at the class level (Hu & Wolniak, 2013), (b) student work engagement adapted from the Ultrecht employee work engagement survey (Schaefeli & Bakker, 2004), and (c) work engagement at the employee level to align with Kahn’s (1990) physical, cognitive, and emotional engagement that result in active, full performance (Rich, LePine, & Crawford, 2010). Further, an effort to develop an engagement survey instrument and elicit responses on four components of student engagement: (a) student in-class and out-of-class cognitive engagement, (b) physical (behavioral) engagement, and (c) emotional (affective) engagement, as well as four learning outcome components: (a) deep learning
EXHIBIT 1 Academic Engagement
Learning Environment: affects engagement through decisions on (a) how material is presented, (b) which learning activities are used, (c) what kinds of feedback are provided. Effective engagement: needs to address underlying psychological variables such as the needs for (a) autonomy, (b) relatedness, and (c) competence (National Research Council 2003). Demand Control Support Model (Karasek 1979) postulates that psychological strain results from the joint effects of (a) the demands of the work situation, (b) the range of the decision-making freedom to face those demands, and (c) the amount of support provided. Job demands are psychological stressors such as (a) time pressure, (b) heavy work load, (c) ambiguity, and (d) role conflict. Job control concerns individual’s potential control over work tasks and is composed of (a) decision authority, and (b) skill discretion. Degree of (a) autonomy, (b) flexibility and (c) discretion in choosing the timing and methods for performing the tasks as well as the variety and creativity in skill usage affect the degree of job control. Perceived Competence: by students in their ability to accomplish some behavior. Role Overload: the degree to which individuals are overtaxed as a result of (a) being under time pressure, and (b) having too many commitments and responsibilities (Jones et al. 2007) Source: Adapted from: Young, M.R. (2010). The art and science of fostering engaged learning. Academy of Educational Leadership Jour-nal, 14 (Special Issue), 1-18.

Page 44 - Developments in Business Simulation and Experiential Learning, Volume 47, 2020
integrative/reflective learning, (b) deep learning higher order learning, (c) persistence with difficult tasks, and (d) development as global citizens was used to test the hypothesis that experiential learning activities lead to engagement which in turn leads to student learning outcomes (Burch, Heller, & Freed, 2014).
Finally. based on the Handelsman, Briggs, Sullivan, and Towler (2005) and Burch, Heller, & Freed (2014) student
engagement classifications, this paper provides evidence of sustained (a) observed participation/interaction in-class cognitive engagement, (b) monitored skills out-of-class cognitive engagement, (c) emotional affective engagement, and (d) performance/physical behavioral engagement among competing simulation team members. Open-ended responses to online surveys on the value of each phase of the phased debriefing process employed indicate that participants are engaged.
STUDENT ENGAGEMENT
Young (2010) reviews the definition and measurement of academic engagement and investigates environmental antecedents
that foster or discourage each of the dimensions of engagement (see exhibit 1). Curricular engagement represents engagement towards targets or objects related to teaching and learning pedagogies, while extra-curricular engagement refers to engagement towards targets or objects outside the classroom, such as student clubs, athletics, and musical events. Curricular engagement refers to the intensity and emotional quality of students’ involvement in nurturing and carrying out learning activities (Skinner, 1991). This definition recognizes both the affective (emotional) and behavioral components of engagement.
Affective engagement refers to students’ emotional reactions to the learning task, the content, and/or the learning context
(Skinner & Belmont, 1993), as well as identification with school (Voelkl, 1997) and the liking or disliking of school (Epstein & McPartland, 1976). Behavioral engagement represents the effort, attention and persistence of performing various learning activity behaviors such as class discussion, debate, role-playing, and short written exercises (Young, 2010).
A third component of engagement includes students’ use of cognitive and self-regulatory strategies to monitor and guide
learning (Pintrich & De Groot, 1990). This cognitive engagement accounts for the mental effort and psychological investment directed toward comprehending and mastering the academic task (Wehlage, Rutter, Smith, Lesko, & Fernandez, 1989). Accordingly, engagement is a multidimensional concept with affective, behavioral and cognitive components. Fredricks, Blumefeld, & Paris, (2004) review the engagement literature and suggest that the antecedents and outcomes of engagement need to be specified. Engagement and Experiential Learning
Active student engagement is fostered through experiential learning. Experiential learning involves learning through experience via cognitive and affective involvement of the whole person (Hoover, 1974). It is the result of cognitive, affective and behavioral engagement (Hoover & Whitehead, 1975). In addition, it is “the process whereby knowledge is created through the transformation of experience. Knowledge results from the combination of grasping and transforming experience” (Kolb, 1984). Experiential learning is an active form of learning that requires student engagement and leads to student learning outcomes (Burch, Heller, & Freed, 2014).
Experiential learning theory (Kolb, 1984) proposes that experiential learning has six main characteristics. First, learning is
best conceived as a process, not in terms of outcomes. Second, learning is a continuous process grounded in experience. Third, learning requires the resolution of conflicts between opposed modes of adaptation to the world (learning is by its very nature full of tension). Fourth, learning is a holistic process of adaptation to the world. Fifth, learning involves transactions between the person and the environment. Sixth, learning is the process of creating knowledge that is the result of transaction between social knowledge and personal knowledge (Kolb, 1984). Further, in order to transform experience into knowledge, it is necessary to (a) involve the whole person (intellect, feelings, and senses) in learning, (b) use relevant life and learning experience, and (c) reflect on the learning experience (Kolb, 1984; Magnuson & Good 2017). Experiential learning requires self-initiative, an intention to learn, and an active phase of learning (Moon, 2004). In experiential learning, the individual is encouraged to (a) directly involve themselves in the experience, (b) reflect on their experience using analytical skills, (c) gain a better understanding of the new knowledge, and (d) retain the information for a longer time (Winsett, Foster, Dearing, & Burch, 2016).
Rahn (2009) suggests that student engagement is evident when there is a competitive team spirit, discussion and debate
within the team. He asserts that the importance of student engagement in education is a function of the simulation and educational environment. In order to stimulate student engagement and augment experiential learning, instructors can provide students with goal oriented and engaging tools (Miller, 2013). Further engagement is strengthened when students are presented with focused goals, challenging tasks, an authentic and compelling story, and a degree of novelty. Students in simulation enhanced courses have identified goal setting, information processing, organization and interpersonal skills, sales forecasting, entrepreneurial skills, financial analysis, economic conceptualization, inventory management, mathematical modeling, hiring, training, motivation, enhanced creativity, communication skills, data analysis, strategic planning, and other skills as part of the learning experience (Wellington & Faria, 2006). Engagement Sources
Bowen (2005) suggests four sources of engagement. First, engagement with the learning process involves active learning pedagogies such as class discussion, debate, role-playing, and short written exercises (Bonwell & Eison, 1991). Second, engagement

Page 45 - Developments in Business Simulation and Experiential Learning, Volume 47, 2020
with the subject matter involves activities such as field or laboratory experiences, rigorous case study, and complex simulations, referred to as experiential learning (Kolb, 1984). Third, engagement with the context in which subject of study is situated is accomplished using significant problem solving requiring perspectives from different disciplines typical of integrative business capstone courses. Fourth, engagement with the human condition incorporates social, cultural and civic dimensions common in service learning pedagogy that involves a cycle of action and reflection applied to community problems (Eyler & Giles, 1999; Petakus, 2000; Hagenbuch, 2006).
However, student engagement in the learning process based on these activities does not necessarily lead to learning.
Kirschner, Sweller, and Clark (2006) suggest that students placed in unguided learning situations without some initial instruction and follow-up may leave learners less competent than when they began the activity. Trosset (1998) reports that students feel the purpose of class discussion is to defend their established views and convince others of them rather than to learn. Hence, student engagement in the learning process may be a necessary, but not sufficient condition for learning. Young (2010) conceptualizes curricular engagement as the affective, behavioral, and cognitive involvement towards one or more specified sources of engagement. Some researchers have studied cognitive engagement (Meece, Blumenfeld, & Hoyle, 1988), while others have focused on engagement in schools (Skinner & Belmont, 1993). Engagement Perspectives
The engagement construct has been investigated from a university perspective, a student perspective and the instructor perspective (Winsett, Foster, Dearing, & Burch, 2016). First, from the university perspective, engagement is defined as “the time and energy students devote to educationally sound activities inside and outside of the classroom, and the policies and practices that institutions use to induce students to take part in these activities.” (Kuh, 2003). Kuh asserts that the more time a student spends studying a subject or putting the concept into use, the more the student will know about that subject. His work was instrumental in developing the National Survey of Student Engagement (NSSE) that was designed in 1999 to (a) systematically compare student engagement across colleges and universities, and (b) measure if student behaviors correlated highly with many desirable learning and personal development outcomes of college (Axelson & Flick, 2011). The NSSE instrument includes behaviors such as faculty-student contact, group work, number of hours per week spent on homework, and institutional features such as a supportive campus environment, and reflects the belief that student engagement in college activities determine student learning outcomes (Hu & Wolniak, 2010).
The National Survey of Student Engagement (NSSE) at Indiana University assesses the impact of an institution’s programs
and practices on students’ activities, experiences and outcomes (NSSE 2000, 2002) based on student overall perceptions of active learning and other educational experiences (Handelsman, Briggs, Sullivan, & Towler 2005). The NSSE includes approximately 70 items that assess student engagement based upon the extent to which college students put time and energy toward educationally purposeful activities (Carini, Kuh, & Klein, 2006; Pike, 2013). However, some studies have questioned the validity and reliability of the NSSE survey (Campbell & Cabrera 2011; Gordon, Ludlum, & Hoey, 2008; Porter, 2011). Yet, other scholars have demonstrated the usefulness of NSSE benchmark scales in measuring exposure to experiences that predict student progress on important educational outcomes such as critical thinking (Pascarella, Seifert, & Blaich, 2010), retention, and graduation rates (Pike, 2013).
Second, from the student perspective, engagement primarily means active participation in class, comfort with the instructor,
and open
EXHIBIT 2 Motivational Components and the Objectives Sought by Instruction
ARCS Component Instructional Objectives
Attention Capture learner interest Stimulate curiosity Maintain learner attention
Relevance Address learner needs Provide appropriate choices and responsibilities for learners Tie instruction to learner’s experiences
Confidence Build positive expectation for success Support students’ beliefs in their competence Communicate that success is based on effort and ability
Satisfaction Provide meaningful opportunities for learners to use their newly acquired skills Reinforce learner successes Leave students with positive feeling for their success
Source: Keller, J.M. (1987). Strategies for stimulating the motivation to learn. Performance and Instruction, 26 (8), 1-7. Keller, J.M. (1987). The systematic process of motivational design. Performance and Instruction, 26 (9-10), 1-8.

Page 46 - Developments in Business Simulation and Experiential Learning, Volume 47, 2020
communication. Accordingly, students are concerned with both physical and emotional class components and associate engagement with active participation. Yet student engagement may not be realized if the student is not comfortable with the instructor, or if the instructor fails to communicate their expectations fairly and clearly (Winsett, Foster, Dearing, & Burch, 2016).
Third, from the instructor perspective, student engagement can be enhanced by altering the learning environment. Most
instructors recognize that student motivation leads to student engagement, which in turn leads to academic learning and achievement. The ARCS management theory of learner motivation model developed by John Keller (1983) examines the motivational constructs of attention, relevance, confidence and satisfaction (see exhibit 2). The ARCS model represents the extent to which the course content (a) arouses student interest, (b) is relevant to learner needs, (c) builds students’ confidence in their ability to achieve success, and (d) satisfies the learner. Keller (1987) identifies specific motivational objectives related to these constructs (see exhibit 1).
The ARCS model is based on the expectancy x value theory of motivation which suggests that in order to motivate students
to learn, instructors must (a) help them to appreciate the value of academic activities, and (b) make sure they can achieve success on these activities if they apply reasonable effort (Brophy, 1987). The ARCS model asserts that careful instructional design can influence and improve student perceptions of value and expectancy for success. First, the student’s attention has to be acquired, directed to the appropriate cues, and sustained. In addition, the instructor should stimulate an attitude of inquiry and generate student interest in the specific topic and the subject in general. Attention strategies include (a) use of incongruity and conflict in presenting issues, (b) using engaging instructional materials, (c) incorporating problem solving activities, and (d) providing students the opportunity to select projects or topics that reflect their interests (Fitzpatrick, McConnell, & Sasse, 2006).
Second, relevance to learner needs refers to the students’ perceived importance of the subject matter to be learned. If
students perceive the material or exercises to be relevant to their personal or educational needs, the level of effort expended will increase. Relevance strategies include linking course content or concepts to the students’ (a) existing frame of reference, and (b) future goals, by using job-related examples or posing situations likely to be faced in future (Fitzpatrick, McConnell, & Sasse, 2006).
Third, confidence refers to the students’ perception of their ability to successfully learn or perform the required concept or
task. Challenging experiences that require thought and effort to succeed facilitate learning. On the other hand, vague or unstructured experiences, or those that are challenging to the degree of serious anxiety do not facilitate student motivation and learning. High confidence leads to students maintaining effort associated with performing a task, while low confidence leads to blocks that prevent students from beginning or engaging in learning activities (Smith & Ragan, 1993). Confidence strategies vary with course level and objectives. Advanced courses lend themselves to experiences or exercises with higher levels of uncertainty and challenge.
Finally, satisfaction occurs when students connect the achievement of learning goals with their individual effort. These
connections can be made during or at the end of the course. Satisfaction is achieved when students are stimulated to maintain or increase efforts because of challenge or accomplishment. Satisfaction strategies include providing students the opportunity to compare their performance with stated expectations and see how their efforts have led to achievement of course goals. At the end of the course, satisfaction can be enhanced when students see how they are now able to perform significant or comprehensive activities that they did not have the skills for at the beginning of the course. This enhanced confidence and resulting satisfaction can enhance a continued motivation to learn and/or transfer their new skills to their professional work environment. Personal attention, consistent feedback, and avoidance of negative comparisons can increase feelings of positive challenge or accomplishment (Fitzpatrick, McConnell, & Sasse, 2006). Student Engagement
Accordingly, student engagement is viewed as a multidimensional meta-construct, consisting of three types of engagement – behavioral, emotional, and cognitive (Axelson & Flick, 2011). Yet, the observable part of engagement may not be valid indicator of true student engagement. Students who appear to be curious about or interested in a subject or who display other outward signs of engagement may not acquire knowledge about the subject. Other students who do not display signs of physical engagement may still be learning (Winsett, Foster, Dearing, & Burch, 2016).
Engagement is a multi-dimensional phenomenon that includes behavioral and affective components. It includes “initiation
of action, effort, and persistence in schoolwork, as well as ambient emotional states during learning activities” (Handelsman, Briggs, Sullivan & Towler, 2005; Skinner, Wellborn, & Connell, 1990). In addition, it “is grounded in the cognitive and affective systems of learners and readers” (Mosenthal, 1999; Handelsman, Briggs, Sullivan & Towler, 2005; Hoover & Whitehead, 1975). Some scholars note that engagement has an interpersonal component, given that interactions with teachers and other students can be an important part of the classroom experience (Connell & Wellborn, 1991; Deci, Connell & Ryan, 1985; Guthrie & Anderson, 1999; Handelsman, Briggs, Sullivan & Towler, 2005; Skinner & Belmont, 1993). In addition, social interaction patterns in the classroom can amplify or constrict students’ intrinsic motivations, their use of self-regulated strategies, and their attainment of deep conceptual knowledge (Guthrie & Anderson, 1999; Handelsman, Briggs, Sullivan & Towler, 2005; Winsett, Foster, Dearing, & Burch, 2016).
Social learning, also called “collaborative” of “cooperative” learning is defined as acquiring knowledge as a group
(Bandura, 1977). It involves observing how others in the group act, observing consequences, and acting to modify individual behavior. The role models observed by learners are extremely influential in this process (Bandura, 1977). Students must be active learners first, in order to take advantage of social learning: both active learning and social learning are more student-driven than traditional college lectures (Perkins, 1999).

Page 47 - Developments in Business Simulation and Experiential Learning, Volume 47, 2020
Winsett, Foster, Dearing, and Burch (2016) demonstrated a positive relationship between group experiential learning activities and student engagement. Their research supports the use of Social Learning Theory to facilitate classroom engagement. Individuals in a group setting observe others in the same group, noting specifically how they act and the resultant consequences associated with it, and then modify their own behavior, thus increasing their own level of engagement. Their research results reveal that group discussions drive physical engagement, group projects drive emotional engagement and having a variety of group work drives cognitive out of class engagement in addition to emotional engagement.
Student engagement can facilitate authentic learning and personal development outcome, and enhance the development of
skills, habits and rituals that augment the capacity for continuous learning and personal development. In addition, student engagement factors such as level of academic challenge, active and collaborative learning, student-faculty interactions, and supportive campus climate are significantly correlated with GPAs (Carini, Kuh, and Klein, 2006; Luthans, Luthans, & Palmer, 2016).
Geddes, Cannon, Cannon, and Feinstein (2015) and Geddes, Cannon, and Cannon (2017) draw on service-dominant logic
(Vargo & Lusch, 2004, 2014) to conceptualize co-creative strategies in experiential learning. Co-creation of value in experiential education via the combination of diverse (a) course operant resources such as lectures, and/or in-class or out-of-class exercises, (b) teacher and administrator operant resources such as emotional energy and attitude, and (c) student willingness to apply or withhold their operand resources (such as notebook computers) can lead to a range of potential educational outcomes.
ENGAGEMENT CLASSIFICATIONS AND SCALES
Several attempts have been made to develop student engagement scales (Burch, Heller, & Freed, 2014). Hoover and
Whitehead (1975) believed that experiential learning is the result of cognitive, affective, and behavioral engagement. Student satisfaction survey questions include items “I felt active and involved,” “I felt the course required me to exercise independent judgment in evaluating textbook theories,” and “I felt the course challenged me” (Hoover & Whitehead, 1975).
Handelsman, Briggs, Sullivan, and Towler (2005) developed and explored the validity of a measure of student engagement,
the Student Engagement Questionnaire (SCEQ). First, they validated their measure of student engagement with three other measures in order to provide indications of convergent and discriminant validity. These were (a) student self-reported levels of absolute engagement (in the present course) and relative engagement (relative to engagement in other courses), (b) students who held an incremental theory of learning instead of an entity theory of learning (Dweck, 1999; Dweck & Leggett, 1988), and (c) student motivation with a learning goal orientation instead of a performance goal orientation (Dweck & Leggett, 1988; Dweck, 1999; Molden and Dweck, 2000).
The incremental theory of learning holds that the capacity for learning can be extended, while the students who subscribe to
the entity theory of learning believe that they have a predetermined capacity for learning which needs to be actualized but not extended. Accordingly, Handelsman, Briggs, Sullivan, and Towler (2005) hypothesized that student engagement is related positively to incremental theory because students who are engaged presumably believe that the engagement will increase their learning capacity.
EXHIBIT 3 Handelsman et al. (2005) Student Engagement Classification
Skills Engagement Emotional Engagement Participation/Interaction Performance Engagement
Engagement through prac-ticing skills
Emotional involvement with the material
Participation in class & Inter-actions with prof & other students
Engagement through levels of performance in class
Study on regular basis Make course material rele-vant to life
Raising hand in class Getting a good grade
Putting forth effort Apply course material to life Asking ?s to improve under-standing
Doing well on the tests
Doing homework Make course interesting Having fun in class Being confident of learning and doing well in class
Staying up on readings Think about material outside class
Participating actively In small group discussions
Looking over class notes Really desiring to learn ma-terial
Going to prof’s off hours to review assignments ?s
Desiring to learn material Helping fellow students
General learning strategies Consistent with affective engagement
Consistent with active & collaborative learning
Similar to performance goals (not learning/mastery goals)
Handelsman, M.M., Briggs, W.L., Sullivan, N., & Towler, A. (2005). A measure of college student course engagement. Journal of Educational Research, 98 (3), 184-191.

Page 48 - Developments in Business Simulation and Experiential Learning, Volume 47, 2020
The association between student engagement and motivational goals is on the belief that students approach tasks with differing levels and types of motivation. Dweck and Leggett (1988), Dweck (1999), and Molden and Dweck (2000) proposed a social-cognitive model that based on a motivational pattern of mastery. Students that set learning goals related to increased competence are intrinsically motivated, seek challenging tasks, and maintain effective striving after they experience failure. Other students that adopt performance goals that focus on gaining favorable competence judgments are more concerned with proving their ability and are extrinsically motivated. Accordingly, Handelsman, Briggs, Sullivan, and Towler (2005) hypothesized that students with a learning goal orientation would be more engaged than students with a performance goal orientation.
Later, they used exploratory factor analysis to identify four dimensions of college student engagement that were distinct and
reliable (see exhibit 3). These four dimensions are skills engagement, participation/interaction engagement, emotional engagement and performance engagement (Handelsman, Briggs, Sullivan, & Towler 2005). The first factor labeled skills engagement, which represents student engagement through practicing skills, consists of nine items: making sure to study on a regular basis, putting forth effort, doing all the homework problems, staying up on the readings, looking over class notes between classes to make sure material is understood, being organized, taking notes in class, listening carefully in class, and coming to class every day. These items appear to reflect general learning strategies.
The second factor labeled emotional engagement, which represents student engagement through emotional involvement
with the class material, consists of five items: finding ways to make the course material relevant to my life, applying course material to my life, finding ways to make the course interesting to me, thinking about the course between class meetings, and really desiring to learn the material. The emotional engagement factor is consistent with the findings of an affective component to engagement by other researchers (Mosenthal, 1999; Skinner, Wellborn & Connell, 1990). However, all the items of emotional engagement are invisible and cannot be observed in the classroom. Requiring papers in which students relate course concepts to their lives may improve their visibility.
The third factor labeled participation/interaction engagement, which represents student engagement through participation in
class and interactions with instructors and other students, consists of six items: raising my hand in class, asking questions when I don’t understand the instructor, having fun in class, participating actively in small group discussions, going to the professor’s office hours to review assignments or tests or to ask questions, and helping fellow students. These participation/interaction engagement items converge with the NSSE (2000, 2002) category of faculty interaction. The two items participating in small group discussions and helping fellow students correspond to the NSSE category of active and collaborative learning (see exhibit 4).
EXHIBIT 4 Handelsman et al. (2005) Factor Structure of Student Course Engagement Questionnaire
Skills Engagement Emotional Engagement Participation/Interaction Performance Engagement
Making sure to study on a regular basis .64
Finding ways to make the course material relevant to my life .86
Raising my hand in class .82
Getting a good grade .77
Putting forth ef-fort .59
Applying course material to my life .86
Asking questions when I don’t understand the instruc-tor .64
Doing well on the tests .68
Doing all the homework prob-lems .57
Finding ways to make the course interesting to me .54
Having fun in class .57
Being confident that I can learn and do well in the class .64
Staying up on the readings .55
Thinking about the class be-tween class meetings .46
Participating actively in small group discus-sions .55
Looking over class notes between classes to make sure I understand the mate-rial .53
Really desiring to learn the material .43
Going to the professor’s of-fice hours to review assign-ments or test or to ask ques-tions .50
Being organized .53 Helping fellow students .45
Taking notes in class .53
Listening carefully in class .51
Coming to class everyday .47
Note: Factor loadings less than .40 are not displayed
Handelsman, M.M., Briggs, W.L., Sullivan, N., & Towler, A. (2005). A measure of college student course engagement. Journal of Educational Research, 98 (3), 184-191.
Page 49 - Developments in Business Simulation and Experiential Learning, Volume 47, 2020
The fourth factor labeled performance engagement, which represents student engagement through levels of performance in the class, consists of three items: getting a good grade, doing well on the tests, and being confident that I can learn and do well in the class. These performance engagement items are similar to performance goals rather than learning or mastery goals (Molden & Dweck, 2000).
Student engagement can also be promoted by action-based learning or project-based learning (Blumenfeld, Soloway, Marx,
Krajcik, Guzdial, & Palinesar, 1991). Project-based learning is an experiential learning method with both high potential and high difficulty (Bransford, Brown, & Cocking, 2000). Action learning based on authentic and current business problems, can promote active engagement, teach problem-solving, critical thinking, and teamwork skills (Bos, Naab, & Gordon, 2005).
National Survey of Student Engagement (NSSE) funded by the Pew Charitable Trusts was developed by the National
Center for Higher Education Management Systems (NCHEMS) to determine (a) the amount of time and energy students put into their education and related activities, and (b) how institutions use resources to encourage students to engage in activities that increase the student’s learning experience, in order to assess college quality. Some NSSE questions are linked to student deep learning which includes higher order learning, reflective learning, and integrative learning (Nelson, Laird, Shoup, & Kuh, 2005). Yet, the NSSE survey is not a student engagement survey based on engagement theory (Burch, Heller & Freed, 2014)
Hu and Wolniak (2013) developed an academic engagement survey to determine the level of performance at the class level,
but this survey does not address the dimensions of student engagement that lead to performance. The Ultrecht Work Engagement Survey for Students is an adaptation from the Ultrecht employee engagement survey used in many organizational behavior studies (Schaefeli & Bakker, 2004).
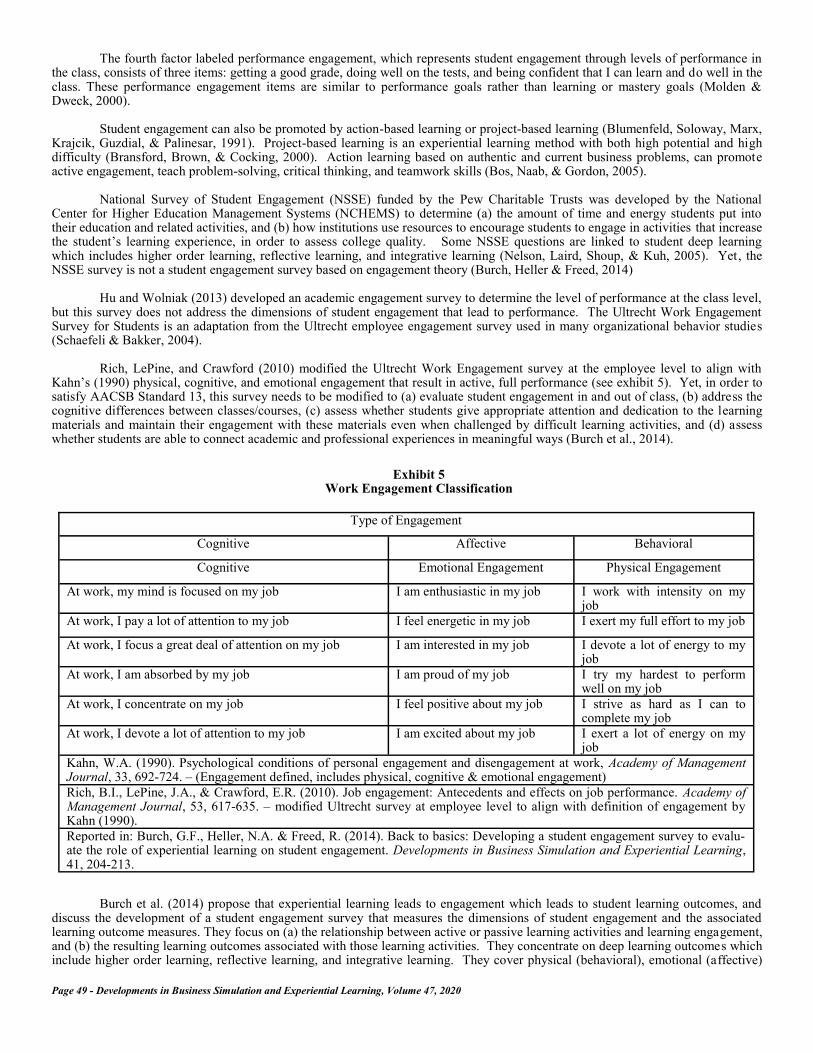
Rich, LePine, and Crawford (2010) modified the Ultrecht Work Engagement survey at the employee level to align with
Kahn’s (1990) physical, cognitive, and emotional engagement that result in active, full performance (see exhibit 5). Yet, in order to satisfy AACSB Standard 13, this survey needs to be modified to (a) evaluate student engagement in and out of class, (b) address the cognitive differences between classes/courses, (c) assess whether students give appropriate attention and dedication to the learning materials and maintain their engagement with these materials even when challenged by difficult learning activities, and (d) assess whether students are able to connect academic and professional experiences in meaningful ways (Burch et al., 2014).
Burch et al. (2014) propose that experiential learning leads to engagement which leads to student learning outcomes, and
discuss the development of a student engagement survey that measures the dimensions of student engagement and the associated learning outcome measures. They focus on (a) the relationship between active or passive learning activities and learning engagement, and (b) the resulting learning outcomes associated with those learning activities. They concentrate on deep learning outcomes which include higher order learning, reflective learning, and integrative learning. They cover physical (behavioral), emotional (affective)
Exhibit 5 Work Engagement Classification
Type of Engagement
Cognitive Affective Behavioral
Cognitive Emotional Engagement Physical Engagement
At work, my mind is focused on my job I am enthusiastic in my job I work with intensity on my job
At work, I pay a lot of attention to my job I feel energetic in my job I exert my full effort to my job
At work, I focus a great deal of attention on my job I am interested in my job I devote a lot of energy to my job
At work, I am absorbed by my job I am proud of my job I try my hardest to perform well on my job
At work, I concentrate on my job I feel positive about my job I strive as hard as I can to complete my job
At work, I devote a lot of attention to my job I am excited about my job I exert a lot of energy on my job
Kahn, W.A. (1990). Psychological conditions of personal engagement and disengagement at work, Academy of Management Journal, 33, 692-724. – (Engagement defined, includes physical, cognitive & emotional engagement)
Rich, B.I., LePine, J.A., & Crawford, E.R. (2010). Job engagement: Antecedents and effects on job performance. Academy of Management Journal, 53, 617-635. – modified Ultrecht survey at employee level to align with definition of engagement by Kahn (1990).
Reported in: Burch, G.F., Heller, N.A. & Freed, R. (2014). Back to basics: Developing a student engagement survey to evalu-ate the role of experiential learning on student engagement. Developments in Business Simulation and Experiential Learning, 41, 204-213.

Page 50 - Developments in Business Simulation and Experiential Learning, Volume 47, 2020
and both in-class and outside-class (cognitive) engagement. They assess convergent and discriminant validity among similar and dissimilar constructs respectively.
Lectures, seminar discussion, and library research are considered low-level experiential learning activities. Problem-solving,
laboratory and experiential exercises, case discussions, study group discussions, and individual case reports are considered moderate-level experiential learning activities. Group case assignments, simulation games, descriptive field activities/projects, consultative field projects are considered high-level experiential learning activities (Burch et al., 2014).
Learning outcomes are conceptualized as either general or concrete. General learning outcomes such as trying harder in
class, coming to class on time, and discussing ideas outside class are triggered by student engagement. General learning outcomes are classified as deep learning outcomes (higher order learning, reflective learning, and integrative learning). Concrete learning outcomes such as communication, leadership, teamwork, decision making, and planning skills are acquired during the learning process (Hoover, Giambatista, Sorenson, & Bommer, 2010). General mental ability is predicted to be related to higher-order learning outcomes but not related to student engagement (Burch et al., 2014).
Burch et al. (2014) used exploratory factor to develop a 25 item scale designed to measure four components of student
engagement - student in-class (cognitive), student out-of-class (cognitive), physical (behavioral) and emotional (affective), and four learning outcome components (deep learning integrative/reflective learning, deep learning higher order learning, persistence with difficult tasks, and development as global citizens (see exhibit 6).
Curricular engagement, a component of academic engagement (see exhibit1), consists of cognitive, affective and behavioral
engagement. Cognitive engagement consists of participation/interaction engagement and skills management based on the Handelsman et al. (2005) engagement classification. Alternatively, cognitive engagement consists of in-class engagement and out-of-class engagement based on the Burch et al. (2014) engagement classification. Affective engagement is referred to as emotional engagement in both the Handelsman et al. (2005) and Burch et al. (2014) engagement classifications. Further Behavioral engagement is referred to as performance engagement based on the Handelsman et al. (2005) engagement classification, and as physical engagement based on the Burch et al (2014) engagement classification (see exhibit 7).
ENGAGEMENT SETTING
Based on the above classifications of student engagement, this study (a) reports on the learning activities, student
engagement and student learning outcomes observed at various stages in a capstone marketing course, and (b) provides evidence of participation/interaction in-class and skills out-of-class cognitive engagement, emotional engagement and performance/physical behavioral engagement. Phased intermediate and final simulation debriefing stimulates participant engagement and enhances learning. Final simulation debriefing, the culmination of the participant learning experience, follows phased intermediate briefing using a problem-based learning approach on marketing concepts, performance determinants, and marketing decision support system (DSS) package usage. Competing participant teams use marketing decision support packages to monitor and analyze team
Exhibit 6 Burch et al. (2014) Factor Structure of Student Course Engagement Questionnaire
Cognitive In-Class Cognitive Out-of-Class Emotional Engagement Physical Engagement
When I am in the class-room for this class/course, I pay a lot of attention to class discussion and activi-ties. .821
I summarized what I learned in class or from course materials in this class/course. .546
This class/course helped me speak clearly and effectively.
.730
I try my hardest to perform well for this class/course.
.817
When I am in the class-room for this class/course, I concentrate on class dis-cussion and activities. .809
I reviewed my notes after class in this class/course. .489
I reached conclusions based on my own analysis of numerical information (numbers, graphs, statistics, etc.) in this class/course. .727
I exert my full effort towards this class/course. .799
When I am in the class-room for this class / course, I focus a great deal of attention on class dis-cussion and activities. .807
I discuss ideas from the readings and class/course discussion with friends and family outside of class.
.474
This class/course helped me write clearly and effectively.
.700
I devote a lot of energy to-wards this class/course.
.796
Burch, G.F., Heller, N.A. & Freed, R. (2014). Back to basics: Developing a student engagement survey to evaluate the role of experiential learning on student engagement. Developments in Business Simulation and Experiential Learning, 41, 204-213.

Page 51 - Developments in Business Simulation and Experiential Learning, Volume 47, 2020
performance, identify and understand reasons for sub-par performance, and make better-informed decisions. Problem Based Learning
Problem based learning (PBL) pedagogy, founded on the premise that answers flow from problems, prompts students to recognize their knowledge limitations and motivates them to learn. The learning process begins by presenting the learner with an engaging problem. As students explore the problem, they discover how course concepts provide the means for resolving the problem (Anderson & Lawton, 2004). PBL provides students with opportunities to (a) examine the experiment with what they already know; (b) discover what they need to learn; (c) develop the people skills they need for improving their performance in a team setting; (d) improve their writing and speaking abilities by learning to state and defend with sound arguments and evidence their own ideas, and (e) become more flexible in their approach to problems. It gives students the opportunity to identify the ideas and skills they need to work through the problems they confront (Spence, 2001). A PBL problem should (a) engage student interest, and (b) require
EXHIBIT 7 Curricular Engagement
Participation/Interaction Engagement: refers to participation in class & interactions with professor and students. It includes (a) raising hand in class, (b) asking questions to improve understanding, (c) having fun in class, (d) participating active-ly in small group discussions, (e) going to prof’s office hours to review assignments / ?s, and (f) helping fellow students, and is consistent with active collaborative learning. Skills Engagement: refers to engagement through practicing skills. It includes (a) studying on a regular basis, (b) putting forth effort, (c) doing homework, (d) staying up on readings, (e) looking over class notes, (f) desiring to learn material, and is consistent with using general learning strategies. Emotional Engagement: refers to emotional involvement with the material. It includes (a) making course material relevant to life, (b) applying course material in life, (c) making course interesting, (d) think-ing about material outside class, (e) desiring to learn material, and is consistent with Affective Engagement. Performance Engagement: refers to engagement through levels of performance in class. It includes (a) getting a good grade, (b) doing well on tests, (c) being confident of learning and doing well in class, and is similar to setting performance goals (not learning / mastery goals). Cognitive In-class Engagement: includes (a) paying attention to, (b) concentrating on, and (c) focusing attention on, class discus-sion & activities. Cognitive Out-of-class Engagement: includes (a) summarizing in-class learning and course materials, (b) reviewing notes after class, and (c) discussing ideas from readings and class discussion with friends & family outside class. Emotional Engagement: includes (a) feeling that course helps with speaking clearly and effectively, (b) reaching conclusions based on analysis of information (numbers, graphs, statistics) provided. Physical Engagement: includes (a) trying hard to perform well in class, (b) exerting full effort toward course/class, and (c) devot-ing a lot of energy toward class/course. Sources: Handelsman, M.M., Briggs, W.L., Sullivan, N., & Towler, A. (2005). A measure of college student course engagement. Journal of Educational Research, 98 (3), 184-191. Burch, G.F., Heller, N.A. & Freed, R. (2014). Back to basics: Developing a student engagement survey to evaluate the role of ex-periential learning on student engagement. Developments in Business Simulation and Experiential Learning, 41, 204-213.
Handelsman et al., 2005. Burch et al., 2014.

Page 52 - Developments in Business Simulation and Experiential Learning, Volume 47, 2020
students to develop and implement the principle concepts of the course in order to successfully solve the problem (Duch, Gron, & Allen, 2001).
Business simulations engage students’ interest and are preferred by students when compared to cases and lectures in order
to learn course concepts (Wolfe, 1985; Washbush & Gosenpud, 1991). In addition, they have been used to apply course concepts (Anderson & Lawton, 1997; Green & Faria 1995; Hemmasi & Graf 1992; Miller, Schumann, Anderson & Scott, 1998; Schellenberger, Hill, & Keusch, 1989; Teach & Govahi, 1998; Wolfe, 1990). Simulations have been used to (a) present concepts, and (b) provide students with an opportunity to experiment with and apply those concepts (Keys & Wolfe 1990). Consequently, simulations provide the opportunity to use PBL to illustrate and apply important concepts in business courses. Yet, instructors need to consider the scope of the simulation, the student level of preparation as they begin the course, and the objective in using the simulation prior to using a PBL approach (Anderson & Lawton, 2004, 2005). Marketing Strategies (Writing Intensive) Capstone Course
The undergraduate functional capstone writing-intensive Marketing Strategies course is a response to a call from the local business community to develop the analytical and communication skills of our graduates. The mission of the course is to learn and apply strategic market planning and marketing management skills to optimize overall company performance while maintaining cash in balance. The writing-intensive course designation stresses learning through writing and requires frequent writing with quality individual feedback. Phased debriefing reduces uncertainty, improves understanding of underlying performance determinants, builds confidence and engagement, and motivates teamwork to identify problems, take corrective action, and exercise marketing control.
At the end of the semester, each participant submits a quality 10-page (narrative) Strategic Market Plan report (30% of
course grade) based on performance in the COMPETE marketing simulation (Faria 2006), marketing DSS package usage, and external research. In addition, each company makes a one-hour long team presentation (10% of course grade) that is divided into two equal parts. The first 30-minute company report covers (a) the presentation agenda, (b) company and brand name justification, and logo explanation, (c) mission statement, (d) organizational structure selected with individual responsibilities, (e) performance analysis, (f) strategic, tactical and forecasting errors made and lessons learned, and (g) sales forecast model using multiple regression analysis with forecast made and forecast error experienced. The second 30-minute company marketing plan covers (a) strategic analysis based on the Aaker framework (Aaker, 2014; Aaker & Moorman, 2018), (b) positioning analysis and strategy using VALS psycho-geo-demographic segmentation data and product positioning maps based on simulation performance data, (c) strategic market plan via SBU portfolio analysis using the BCG growth share and growth gain matrices based on simulation performance data, (d) recommended evaluation and control mechanisms (reports required and marketing control measures), and (e) conclusion with research references. In addition, each team submits a team presentation handout (10% of course grade) with DSS packages and external references used.
First, during each decision period, the competing teams receive cumulative team performance rankings on the above 18
performance measures for their own company. However, they do not receive competitor rankings on cumulative profit, cumulative market share, end-of-period quality, end-of-period unit cost of production, or cumulative efficiency, based on which the cumulative rankings are determined. This confidential information is released to them (a) at the end of the four trial decision periods prior to the start of simulation competition, in order to facilitate preliminary cause-effect analyses and intermediate simulation debriefing, as well as to establish credibility in the ranking system, and (b) at the end of each year (4 quarterly decisions) of simulation competition for intermediate debriefing purposes.
Next, at the end of each year (four quarterly decision periods) of operations, the competing teams can access cumulative
team performance rankings on the same 18 performance criteria for all competing companies. These annual reports are uploaded to the COMPETE Portal (server) and can be viewed and downloaded by all participants. They reveal the rankings of all competing teams on each of the 18 performance criteria as well as the overall and adjusted rankings for each of the competing firms. They do not reveal any confidential information on competitor performance measures based on which the cumulative rankings are determined.
Then, at the end of the trial decision period, and subsequently, at the end of competition, the competing teams can access the cumulative End Game Performance Package which consists of 11 charts and 3 worksheets. Charts include (1) cumulative team performance ranking, (2) cumulative team performance ratios, (3) cumulative team profitability measures, (4) cumulative market share, (5) end-of-game quality, (6) end-of-game cost of production, (7) cumulative efficiency, (8) cumulative efficiency measures, (9) sales revenue by period, (10) advertising expense by period, and (11) salesforce expense by period.
Finally, at the end of competition (3 years of operation consisting of 12 quarterly decision periods), the simulation
participants can access the End Game Performance Package to (a) analyze the simulation competition results, (b) prepare their individual strategic market plan reports, and (c) prepare their team presentation at the end of the semester. COMPETE Marketing Simulation
COMPETE (Faria, 2006) is a marketing simulation designed to provide students with marketing strategy development and decision-making experience. Competing student teams are placed in a complex, dynamic, and uncertain environment. The participants experience the excitement and uncertainty of competitive events and are motivated to be active seekers of knowledge.

Page 53 - Developments in Business Simulation and Experiential Learning, Volume 47, 2020
They learn the need for, and usefulness of, mastering an underlying set of decision-making principles. Competing student teams plan, implement, and control a marketing program for three high-tech products in three regions
Region 1 (R1), Region 2 (R2) and Region 3 (R3) within the United States. These three products are a Total Spectrum Television (TST), a Computerized DVD/Video Editor (CVE) and a Safe Shot Laser (SSL). The features and benefits of each product and the characteristics of consumers in each region are described in the student manual. Based on a marketing opportunity analysis, a mission statement is generated, specific and measurable company goals are set, and marketing strategies are formulated to achieve these goals. Constant monitoring and analysis of their own and competitive performance helps the teams better understand their markets and improve their decisions.
Each decision period (quarter), the competing teams make a total of 74 marketing decisions with regard to marketing their
three brands in the three regional markets. These 74 decisions include nine pricing decisions, nine shipment decisions, three sales force size decisions, nine sales force time allocation decisions, one sales force salary decision, one sales force commission decision, twenty-seven advertising media decisions, nine advertising content decisions, three quality-improvement R&D decisions, and three cost-reduction R&D decisions. Successful planning, implementation, and control of their respective marketing programs require that each company constantly monitor trends in its own and competitive decision variables and resulting performance. The teams use the recently launched and upgraded COMPETE Portal, which has replaced the COMPETE Online Decision Entry System (CODES) (Palia, Mak, & Roussos, 2000) to enter their decisions, retrieve their results, and download and use a wide array of marketing DSS packages.
In order to facilitate marketing control, the COMPETE simulation (Faria, 2006) is used together with web-based strategic
market planning (Palia, 1991, 1995; Palia , De Ryck, & Mak, 2002) and positioning (Palia, De Ryck, & Mak, 2003; Palia & De Ryck, 2013) graphic packages, and a diverse array of Excel target profit pricing (Palia, 2008), competitor analysis (Palia & De Ryck, 2015), forecast error impact (Palia, 2011), marketing mix analysis, multiple regression analysis (Palia, 2004), ratios analysis, strategic business unit (SBU) analysis (Palia, 2009), portfolio normative consistency analysis (Palia, 2012), target portfolio analysis (Palia, 2017), cash flow analysis (Palia, 2010), profitability analysis (Palia & De Ryck, 2014), cumulative team performance (Palia 2005), cost of production analysis (Palia & De Ryck, 2016), and marketing efficiency analysis (Palia, 2018) workbooks that auto-extract and present relevant data from the simulation results and facilitate subsequent analysis and decision-making. These marketing DSS packages enable them to make better informed decisions such as target profit pricing, forecasting, market segmentation and positioning, market mix analysis, competitor analysis, forecast error impact analysis, ratios analysis, cash flow analysis, and strategic market planning, that are introduced to them progressively during the simulation competition.
The comprehensive Online Cumulative Simulation Team Performance Package provides feedback on competing participant
team rankings on their cumulative company profitability, market share by product, quality by product, cost of production by product, and efficiency based on simulation results for each decision period (Palia, 2005). The End Game Performance package presents, in addition, graphic feedback on (a) cumulative profits, (b) profitability ratios (Earnings per Share, Return on Total Assets, Net Profit Margin, Sales-to-Asset Turnover, Return on Equity, Retained Income), (c) market share, (d) sales volume, (e) quality, (f) cost of production, (g) efficiency (Sales-to-Advertising, Sales-to-Salesforce expense, and Sales to Promotional Expense) ratios tied to the simulation results (Palia, 2019). Phased Debriefing Process
Palia (2019) suggests a phased approach to simulation debriefing based on insights derived from a review of the literature on experiential learning, business simulations and experiential exercises/games. This augmented approach to debriefing draws on (a) Kolb’s model of experiential learning (Kolb, 1984), (b) Bloom’s taxonomy of educational objectives (Bloom, 1956), (c) Lederman’s work on debriefing (Lederman, 1992), (d) Peters and Vissers classification model for debriefing simulation games (Peters & Vissers, 2004), (e) Argyris’ Organizational Development Intervention Model (Argyris, 1970), (f) Hoover’s treatise on recent trends in complexity avoidance and narcissism (Hoover, 2011), (g) Hoover, Giambatista and Tribble’s (2016) organizational approach to experiential learning (Hoover et al., 2016), and (h) Hogan and Pressley’s work on scaffolding (Hogan & Pressley, 1997).
The comprehensive phased debriefing approach relies on the usage of dss packages that are directly tied to the course
mission, learning objectives and outcomes, and the computer simulation decisions and results. The semester is divided into 4 phases of differing length. The first 3-week long “Prepare to Compete” phase, is followed by a 7-week long “Compete” phase,” a 5-week long “Individual Report and Team Presentation Preparation” phase, and a one-class period Wrap-Up phase.. During the first three weeks of the semester, the competing participant teams are prepared to compete. They are given a comprehensive in-class introduction to (a) decisions, markets and products in the COMPETE marketing simulation, (b) eighteen cumulative team performance criteria, (c) simulation financial statements (income statement, three regional income contribution statements, balance sheet, and underlying cash flow analysis), (d) other simulation reports including market research reports and trade association bulletin, (e) determinants of profitability, market share, quality, cost of production and efficiency, (f) the importance of accurate forecasting, (f) the elements and dimensions of strategy, and (g) alternative strategic thrusts, and the strategic analysis framework (Aaker, 2014; Aaker & Moorman, 2018). They enter four sets of quarterly trial decisions and access the quarterly simulation results via the online COMPETE Portal during the second and third week of the semester. The cumulative team results for each of the four quarterly trial decision periods include the team ranking on the eighteen performance criteria in the End Game Performance package. At the end of the four trial decision periods, they download their decisions, simulation results and access the End Game Performance package. During this ‘Prepare to Compete’ phase, based on the recommendation of prior participants, each competing team meets

Page 54 - Developments in Business Simulation and Experiential Learning, Volume 47, 2020
with the professor/administrator to go over their results, ask questions, and seek clarification of underlying concepts. In addition, the entire class is exposed to an example of the final team presentation at the end of the semester. The simulation is reset, with the company and product names submitted to the professor/administrator along with their company profit, market share, quality, cost of production, and efficiency goals, in preparation for the simulation competition.
During the next seven weeks of the semester, the competing participant teams enter the second ‘Compete’ phase. They
make twelve sets of quarterly decisions over a three-year operating period, and access the simulation results. Topics covered during this seven-week period include market segmentation, positioning, values and lifestyle analysis, sales forecasting, sales forecast model building, and strategic market planning. Based on the suggestion of prior participants, they are shown relevant sections of prior team presentations on each topic covered. In addition, they are progressively introduced to web-based product positioning map graphics package and Excel-based marketing DSS packages on (a) target profit pricing, (b) forecasting, (c) market segmentation and positioning, (d) market mix analysis, (e) competitor analysis, (f) forecast error impact analysis, (g) ratios analysis, (h) cash flow analysis, and (i) strategic market planning in the computer lab hands-on sessions. These marketing DSS packages (a) auto-extract accurate, timely and relevant data from the simulation results, (b) facilitate analysis, and (c) enable them to make better informed decisions. During the competition, stimulators such as increased production costs, increased sales force transfer expenses, and new competition are periodically introduced to affect the simulation parameters. The simulation message center is used to inform the competing teams about the stimulators before they take effect. Competing participant teams adjust their marketing strategies in response to the resulting changes in the marketing environment and/or simulation parameters. The teams are permitted to (a) work on their decisions, (b) ask questions, and (c) seek clarification during the last fifteen minutes of each class period. This intermediate simulation debriefing employs a problem-based learning scaffolding approach to help participants understand the underlying reasons for bankruptcy, low profitability, weak market share and other sub-par performance. Based on this enhanced understanding, participants take corrective action in order to improve team performance. At the end of competition, they access the End Game Performance package via the COMPETE Portal and correlate their strategies and decisions with the final results.
This progressive intermediate debriefing strategy turbocharges participant engagement, and heightens participant interest,
motivation, confidence and understanding. Indeed, based on participant demand, the Marketing Strategies course is scheduled in the computer lab starting Spring 2019. This enables the participants to use the desktop computers in the computer lab (instead of their Mac notebooks) when working with marketing DSS packages that have macros (.xlsm program files) and Excel Add-Ins (Statpak and VBA Statpak) for use in multiple regression analysis. Participants use (a) the online Product Positioning Map (PPM) graphics package to generate product positioning maps for each of their nine SBUs based on the simulation results for each decision period, and (b) the online Strategic Market Planning - Product Portfolio Analysis (PPA) graphics package to generate the Boston Consulting Group (BCG) Growth Share Matrix (GSM) and Growth Gain Matrix (GGM) for their own company and for each of their competitors based on the simulation results.
During the next five weeks of the semester, the competing participant teams enter the third ‘Report & Present’ phase.
Hands-On sessions in the computer lab enable simulation participants to use all the marketing DSS packages to prepare their individual ‘Strategic Market Plan’ reports, team presentations and team presentation handouts. The professor/administrator demonstrates the relevant graphics and marketing DSS packages, guides the participants, clarifies concepts, and answers questions from individual participants that often benefit the entire class. The individual ‘Strategic Market Plan’ report is a 10-page (narrative) report that covers the six-step BCG strategic market planning process and includes the BCG graphics, relevant Excel-based marketing DSS packages, and external research references. The comprehensive one-hour team presentation includes the company marketing report (thirty minutes) and proposed marketing plan (thirty minutes). The company marketing report includes the company and brand name justification, company mission, company organization, performance analysis, errors made and lessons learned, and a sales forecast model using multiple regression analysis. The proposed marketing plan includes a strategic analysis (customer, competitor, market, and environmental analyses; performance and portfolio analyses; and closing the strategic gap), positioning analysis, strategic market planning (BCG product portfolio analysis), and evaluation and control mechanisms. During the one-hour team presentations, the professor periodically interrupts each presentation briefly to point out significant errors for the benefit of future teams and the entire class. After each team presentation, the team fields questions from their competitors as well as the administrator/professor. Questions frequently posed by the professor /administrator include (a) what the team would do differently if they were to relive or restart the simulation experience, (b) how the team responded to the stimulator on increased production costs, the consequent results, and lessons learned, (c) how the team responded to the stimulator on increased salesforce expenses, the consequent results, and lessons learned, and (d) how the team responded to the stimulator on entry of new competition at lower prices, the consequent results, and lessons learned.
The final debriefing phase occurs during the last class period at the end of the semester. A departmental Marketing
Knowledge Assessment test is followed by performance feedback based on the End Game Performance package, the scored earned by each of the competing participant teams, and a review of alternative responses to the simulation stimulators. The professor/administrator reviews (a) the elements of strategy, (b) the situation analysis, planning, implementation and control phases of the marketing strategy process, and (c) the skills and knowledge of foundation disciplines that facilitate effective marketing.
ENGAGEMENT EVIDENCE
Evidence of sustained (a) observed in-class skills (cognitive), emotional (affective), participation/interaction and
performance (behavioral) engagement among competing simulation team members is monitored on a continuing basis. Both subjective and objective measures of in-class and out-of-class engagement at the individual- team- and class-levels are currently

Page 55 - Developments in Business Simulation and Experiential Learning, Volume 47, 2020
monitored. In-class engagement measures include recorded levels of (a) attendance, (b) classroom focus and energy, (c) questions
raised, (d) discussion quality, (e) decision support package usage, (f) team discussion and responses to thinklets (problems posed in class) using a problem-based learning approach, (g) group discussion with the professor to address sub-par performance concerns during scaffolding sessions at the end of each class period, (h) co-creation of value using the operand resources (marketing decision support packages) and student knowledge, skills and notebook computers (operant resources).
Out-of-class engagement measures include (a) timely bi-weekly online decision entry prior to preset decision deadlines and
subsequent results retrieval, (b) graphics package usage, (c) timely submission of weekly writing assignments, (d) server log statistics of daily, weekly, and semester team activity, (e) website tracking of visitor activity, visitor paths, page views, time spent, keywords used, marketing dss package downloads, exit pages, visitor location, and number of sessions by page, and (f) responses to an online student engagement survey on the value added to the learning experience by the initial, intermediate and final debriefing phases of the course. Phased Simulation Debriefing Survey
In order to provide evidence of student engagement, heightened motivation and enhanced learning via phased simulation
debriefing, an online survey of the phased simulation debriefing process was developed and deployed. This survey explores the perceived benefit of elements used in each of the four simulation debriefing phases: (a) initial briefing during the first ‘Prepare to Compete’ phase, (b) intermediate debriefing during the second ‘Compete’ phase, (c) intermediate debriefing during the third ‘Report & Present’ phase, and (d) final debriefing during the fourth ‘Wrap-Up’ phase to better understand the COMPETE simulation, simulation performance, and strategic market planning, management & control respectively. Open-ended participant comments on the value of each debriefing phase augment and amplify the survey responses.
This phased simulation debriefing survey was posted online during the final weeks of the Fall 2018 semester when students
are busy completing reports, preparing presentations, completing course assignments and preparing for final examinations. The nine responses received from the first section of 19 participants (max. class size is 20 students for this capstone writing-intensive course) provides evidence on the value of phased simulation debriefing. Open-ended Survey Responses
The phased simulation debriefing survey consists of open-ended responses by participants on each of phases. The open-ended comments on the value of the initial simulation briefing ‘Prepare to Compete’ phase clearly indicate substantial perceived value in understanding the COMPETE simulation (see exhibit 8).
Next, the open-ended comments on the value of the second intermediate simulation briefing ‘Compete’ phase clearly
indicate substantial perceived value in understanding COMPETE simulation performance (see exhibit 9). The open-ended comments on the value of the third intermediate simulation briefing ‘Compete’ phase clearly indicate
substantial perceived value in understanding strategic market planning, management & control (see exhibit 10). Lastly, the open-ended comments on the value of the final simulation briefing ‘Wrap-up’ phase clearly indicate substantial
perceived value in understanding strategic market planning, management & control (see exhibit 11). Based on the above open-ended responses, the students perceive (a) the initial simulation briefing ‘Prepare to Compete’
phase, (b) the second intermediate simulation briefing ‘Compete’ phase, (c) the third intermediate simulation briefing ‘Compete’ phase, and (d) the final simulation briefing ‘Wrap-up’ phase to be of “substantial” value. In their words, the initial simulation briefing aided in their understanding of the simulation, helped answer questions and ease uncertainties, and was beneficial in understanding how the simulation operated. The scaffolding sessions at the end of each class during the second intermediate simulation briefing ‘Compete’ phase helped them have their immediate questions answered, get their thoughts together prior to entering their decisions, seek clarification, and directly address their current problems.
The intermediate simulation briefing ‘Report and Present’ phase enabled them to better understand the results of their
decisions, to keep them on track, learn from their competitors presentations, have errors corrected and doubts clarified by the professor, and to learn how to improve their presentation. Lastly, participants believed that the final simulation debriefing ‘Wrap-up’ phase highlighted the important factors of Marketing, provided a gateway to entering real world experiences and moving forward to their career goals, summarized and reviewed key strategic concepts, and allowed them to reflect on what they had learned and apply it to real-life situations such as their marketing internships and potential job situations. COMPETE Portal Web Server Log
Evidence of participant engagement by team, by day, week, and semester is captured in the COMPETE Portal server log (see exhibit 12). During Fall 2019, till Friday October 4th, teams C1 (4 members), C2 (4 members), C3 (4 members) and C4 (5 members) recorded 215, 179, 217, and 240 logins respectively. Team members use a team ID and password to login to their team

Page 56 - Developments in Business Simulation and Experiential Learning, Volume 47, 2020
EXHIBIT 8 Initial Simulation Briefing During ‘Prepare to Compete’ Phase - Comments

Page 57 - Developments in Business Simulation and Experiential Learning, Volume 47, 2020
EXHIBIT 9 Intermediate Simulation Debriefing During ‘Compete’ Phase - Comments

Page 58 - Developments in Business Simulation and Experiential Learning, Volume 47, 2020
EXHIBIT 10 Intermediate Simulation Debriefing During ‘Report & Present’ Phase - Comments

Page 59 - Developments in Business Simulation and Experiential Learning, Volume 47, 2020
EXHIBIT 11 Final Simulation Debriefing During ‘Wrap-Up’ Phase - Comments

Page 60 - Developments in Business Simulation and Experiential Learning, Volume 47, 2020
account in order to: (a) enter decisions, (b) view results, (c) access course website (schedule and handouts repository), (d) submit weekly writing assignments (e) download and use marketing dss packages, and (e) generate server-generated performance-based product positioning maps. The most intensively used performance-based BCG growth share and growth gain matrices (used in both the individual strategic market plan report and team presentation) will only become available after two years of operating results on Friday October 11, 2019. Subsequently, website activity will increase as participants work with the marketing dss packages to prepare their individual Strategic Market Plan reports and their one-hour team presentation.
COMPETE Portal Website Tracking
Further evidence of individual participant engagement is based on tracking of visitors to the COMPETE Portal website. A 4-week summary of daily page views, sessions and visitors from Monday September 9 to Friday October 4, 2019 indicates an average of 77.7 daily page views, 23.2 average daily sessions, and 15.5 average daily visitors (see exhibit 13). Again, website activity is expected to increase substantially after October 11, 2019 as participants generate product positioning maps, BCG growth share and growth gain matrices and work with the marketing dss packages to prepare their individual Strategic Market Plan reports and team presentations.
Moreover, website tracking of the COMPETE Portal server registered a total of 2020 page views, in a total of 604 sessions,
by a total of 404 visitors during a four-week period from September 9 to October 4, 2019 (see exhibit 14). Website activity tracked includes visitor paths, page view activity, keyword activity, came from activity, download activity,
exit link activity, and visitor location and number of sessions by page. Visitor activity tracked includes page views, exit date and time, visit length, resolution, operating system, total visits, location, IP address, referring URL and visit page.
Twenty-two participants in both sections of the Marketing Strategies course during Fall 2019 have executed a total of 424
downloads of marketing dss packages during the period from August 29 to October 1, 2019 (see exhibit 15). This activity has taken place during the first half (six quarterly decision periods) of competition. Online activity is expected to increase during the second half of the competition as we approach the submission deadlines for both the individual Strategic Market Plan (SMP) report and team presentation. Both final deliverables (individual report and team presentation) require the inclusion and explanation of the online strategic market planning and positioning graphics packages as well as the marketing dss packages used.
In addition, the navigation paths of individual visitors to the COMPETE Portal server website are tracked (see exhibit 16).
EXHIBIT 12 COMPETE Portal Server Login Statistics (September4, 2019)

Page 61 - Developments in Business Simulation and Experiential Learning, Volume 47, 2020
EXHIBIT 13 Statcounter Statistics of COMPETE Server Website (4-Week Summary)

Page 62 - Developments in Business Simulation and Experiential Learning, Volume 47, 2020
EXHIBIT 14 Statcounter Statistics of COMPETE Server Website (4-Week Summary)
Day Date PageViews Sessions Visitors NewVisitors
Monday 9/9/2019 130 47 30 12
Tuesday 9/10/2019 115 46 27 7
Wednesday 9/11/2019 100 31 17 1
Thursday 9/12/2019 73 28 20 3
Friday 9/13/2019 47 16 14 7
Saturday 9/14/2019 14 10 6 2
Sunday 9/15/2019 45 16 12 2
Monday 9/16/2019 238 49 30 10
Tuesday 9/17/2019 347 77 47 28
Wednesday 9/18/2019 23 11 10 1
Thursday 9/19/2019 205 52 34 16
Friday 9/20/2019 33 8 8 2
Saturday 9/21/2019 4 2 1 0
Sunday 9/22/2019 62 18 12 3
Monday 9/23/2019 108 45 20 1
Tuesday 9/24/2019 47 22 18 6
Wednesday 9/25/2019 15 7 7 2
Thursday 9/26/2019 162 24 18 3
Friday 9/27/2019 31 10 8 1
Saturday 9/28/2019 20 11 9 5
Sunday 9/29/2019 34 7 7 2
Monday 9/30/2019 49 21 13 0
Tuesday 10/1/2019 42 17 13 3
Wednesday 10/2/2019 9 5 5 0
Thursday 10/3/2019 41 16 11 2
Friday 10/4/2019 26 8 7 3
2020 604 404 122
MKT 391(1 & 2) - Marketing Strategies
Fall 2019
Statcounter Tracking of http://compete.hawaii.edu
(N = 22 participants)
4-Week Total

Page 63 - Developments in Business Simulation and Experiential Learning, Volume 47, 2020
This example shows that the participant tracked visited the course website homepage, the weekly writing assignments webpage, the individual strategic market plan webpage, the COMPETE performance worksheets webpage, the COMPETE analysis worksheets webpage, and visited the breakeven analysis dss package, the Performance Profit analysis dss package, the cost of production dss analysis package, my ABSEL 2014 paper on profitability analysis, and the forecast error impact dss package at the times indicated on September 28 and 29, 2019.
Furthermore, the COMPETE Portal website activity of a single visitor is magnified and tracked (see exhibit 17). This example indicates that the user tracked on the COMPETE Portal website visited the Marketing Strategies course schedule webpage, the course homepage, the BCG product portfolio analysis webpage, the COMPETE performance worksheets webpage, the COMPETE analysis worksheets webpage, the SBU analysis webpage, the profitability analysis webpage, the weekly writing assignments webpage, and the individual SMP report webpage.
In summary, the open-ended responses to the online Phased Debriefing Survey indicate the students are positively disposed
to the learning experience and assign substantial value to each of the four briefing/debriefing phases All the above tracking exhibits indicate considerable student cognitive, affective and behavioral engagement out-of-class.
In addition, timely submission of decisions and weekly writing assignments by the respective deadlines, near-perfect attendance, active participation in thinklets (small group discussion on problems posed by the instructor), continued discussion among groups at the end of each class period, team meetings with the instructor both in-class and out-of-class, in order to monitor, identify and resolve problems in performance, use of notebook computers, and giving and receiving constructive feedback provides clear evidence of value co-creation and active student engagement.
LIMITATIONS AND FUTURE DIRECTION
Small class size precludes use of experimental design to test hypotheses on alternative treatments of the relationship
between curricular engagement, academic engagement, learning and academic achievement. While the COMPETE Portal server log is limited strictly to the competing participant team logins, tracking on the COMPETE Portal website may include external traffic. Yet, external visitors to the COMPETE Portal are relatively few and can be identified by their location, IP numbers, and pages visited.
A hybrid student engagement survey based on (a) the Handelsman et al. (2005) student engagement classification (see
exhibit 3) and factor structures of student course engagement questionnaire (see exhibit 4), as well as (b) the Burch et al. (2014) factor structure of Student Course Engagement Questionnaire (see exhibit 6) will be developed and deployed. Suggestions on the scales and survey instrument by the ABSEL membership are welcomed, as we strive to establish the value of experiential learning pedagogy at educational institutions.
CONCLUSION
Based on a review of the engagement and experiential learning literature, this paper presents evidence of sustained (a)
observed in-class skills (cognitive), emotional (affective), participation/interaction and performance (behavioral) engagement among competing simulation team members. Subjective and objective measures of in-class and out-of-class engagement at the individual- team- and class-levels are provided. In-class engagement measures include recorded levels of (a) attendance, (b) classroom focus and energy, (c) questions raised, (d) discussion quality, (e) decision support package usage, (f) team discussion and responses to thinklets (problems posed in class) using a problem-based learning approach, (g) group discussion with the professor to address sub-par performance concerns during scaffolding sessions at the end of each class period, (h) co-creation of value using the operand resources (marketing decision support packages) and student knowledge, skills and notebook computers (operant resources). Out-of-class engagement measures include (a) bi-weekly online decision entry and results retrieval, (b) graphics package usage, (c) weekly writing assignments, (d) server log statistics of daily, weekly, and semester team activity, (e) website tracking of visitor activity, visitor paths, page views, time spent, keywords used, marketing dss package downloads, exit pages, visitor location, and number of sessions by page, and (f) responses to an online student engagement survey on the value added to the learning experience by the initial, intermediate and final debriefing phases of the course.
Competing participant teams demonstrated heightened in-class engagement and motivation via near-perfect attendance,
palpable classroom energy level, questions, active discussion, and usage of decision support packages. Sustained outside-class team engagement, captured via the simulation server log, correlated with team performance. In addition, sustained outside-class student engagement was captured via website tracking of visitor activity on simulation and course webpages, time spent, paths used, and download activity monitored during the semester. Further, peer-evaluated one-hour team presentations that demonstrate usage of the decision support packages, seven individual weekly writing assignments on sections of the individual Strategic Market Plan, and the one-hour team presentation, foster engagement and learning. Survey responses on the value of the initial-, intermediate---- and final-simulation debriefing confirm that students are actively engaged.
The phased debriefing strategy enhances participant engagement early in the semester, and heightens interest, motivation,
confidence and understanding among simulation participants. Given the significance of engagement, experiential learning and simulation debriefing, and the enhanced engagement and motivation of past and current participants that has resulted from recent use

Page 64 - Developments in Business Simulation and Experiential Learning, Volume 47, 2020
COMPETE Server Website (MKT dss Package Download Activity) Exhibit 15
Date Time MKT dss Package Download
10/1/2019 6:04:47 http://compete.hawaii.edu/aspy/CAP/PROD1A.xls
10/1/2019 6:04:28 http://compete.hawaii.edu/aspy/CAP/PROD1B.xls
10/1/2019 5:59:52 http://compete.hawaii.edu/aspy/CAP/PROD1A.xls
10/1/2019 5:59:38 http://compete.hawaii.edu/aspy/CAP/PROD2A.xls
10/1/2019 5:59:10 http://compete.hawaii.edu/aspy/CAP/PROD3A.xls
9/29/2019 11:26:03 http://compete.hawaii.edu/aspy/INNOVATE/Proforma 12.zip
9/29/2019 11:25:53 http://compete.hawaii.edu/aspy/INNOVATE/Breakeven 12.zip
9/29/2019 11:24:28 http://compete.hawaii.edu/aspy/Perform/Profitability C.zip
9/29/2019 11:20:04 http://compete.hawaii.edu/aspy/INNOVATE/Forecast Error Impact.zip
9/29/2019 11:18:24 http://compete.hawaii.edu/aspy/INNOVATE/Performance Profit.zip
9/29/2019 11:18:18 http://compete.hawaii.edu/aspy/INNOVATE/ABSEL 2014 Profitability Analysis.pdf
9/29/2019 11:16:21 http://compete.hawaii.edu/aspy/INNOVATE/Performance Cost of Production.zip
9/29/2019 11:15:25 http://compete.hawaii.edu/aspy/INNOVATE/Performance Profit.zip
9/29/2019 11:11:34 http://compete.hawaii.edu/aspy/INNOVATE/Breakeven 12.zip
9/27/2019 13:53:07 http://compete.hawaii.edu/aspy/INNOVATE/Sources and Uses of Cash.zip
9/27/2019 13:51:04 http://compete.hawaii.edu/aspy/INNOVATE/Mkt Mix 3.zip
9/27/2019 13:47:56 http://compete.hawaii.edu/aspy/INNOVATE/Performance Market Share.zip
9/27/2019 6:39:19 http://compete.hawaii.edu/aspy/INNOVATE/Performance Profit.zip
9/27/2019 6:38:17 http://compete.hawaii.edu/aspy/INNOVATE/Proforma 2.zip
9/27/2019 6:35:51 http://compete.hawaii.edu/aspy/INNOVATE/SBU Analysis 2.zip
9/27/2019 6:34:37 http://compete.hawaii.edu/aspy/INNOVATE/Forecast Error Impact.zip
9/27/2019 6:34:33 http://compete.hawaii.edu/aspy/INNOVATE/Forecast Error.zip
9/26/2019 13:13:09 http://compete.hawaii.edu/aspy/INNOVATE/Forecast Error.zip
9/26/2019 12:51:20 http://compete.hawaii.edu/aspy/INNOVATE/SBU Analysis 3.zip
9/26/2019 12:48:10 http://compete.hawaii.edu/aspy/INNOVATE/SBU Analysis 3.zip
9/26/2019 11:43:22 http://compete.hawaii.edu/aspy/INNOVATE/Forecast Error Impact.zip
9/26/2019 11:40:24 http://compete.hawaii.edu/aspy/INNOVATE/Forecast Error.zip
9/26/2019 11:31:52 http://compete.hawaii.edu/aspy/INNOVATE/SBU Analysis 3.zip
9/26/2019 11:31:45 http://compete.hawaii.edu/aspy/INNOVATE/ABSEL 2009 SBU Analysis.pdf
9/26/2019 11:31:23 http://compete.hawaii.edu/aspy/INNOVATE/SBU Analysis 3.zip
9/26/2019 11:30:23 http://compete.hawaii.edu/aspy/INNOVATE/SBU Analysis 12.zip
9/26/2019 11:28:50 http://compete.hawaii.edu/aspy/INNOVATE/Performance Market Share.zip
9/26/2019 11:28:49 http://compete.hawaii.edu/aspy/INNOVATE/Performance Market Share.zip
9/26/2019 11:28:43 http://compete.hawaii.edu/aspy/INNOVATE/Performance Profit.zip
9/26/2019 11:28:25 http://compete.hawaii.edu/aspy/INNOVATE/Performance Profit.zip
9/26/2019 11:28:20 http://compete.hawaii.edu/aspy/INNOVATE/Performance Profit.zip
9/26/2019 11:28:09 http://compete.hawaii.edu/aspy/INNOVATE/Performance Profit.zip
9/26/2019 11:28:07 http://compete.hawaii.edu/aspy/INNOVATE/Performance Market Share.zip
9/26/2019 11:27:57 http://compete.hawaii.edu/aspy/INNOVATE/SBU Analysis 3.zip
9/26/2019 11:25:48 http://compete.hawaii.edu/aspy/INNOVATE/Performance Profit.zip
9/26/2019 11:24:55 http://compete.hawaii.edu/aspy/INNOVATE/SBU Analysis 3.zip
9/26/2019 11:24:47 http://compete.hawaii.edu/aspy/INNOVATE/SBU Analysis 3.zip
424 Dowloads from 8-29-19 to 10-1-19
COMPETE Portal Website (http://compete.hawaii.edu) Tracking MKT dss PackageDownload Activity
MKT 391 (1&2) - Marketing Strategies, Fall 2019
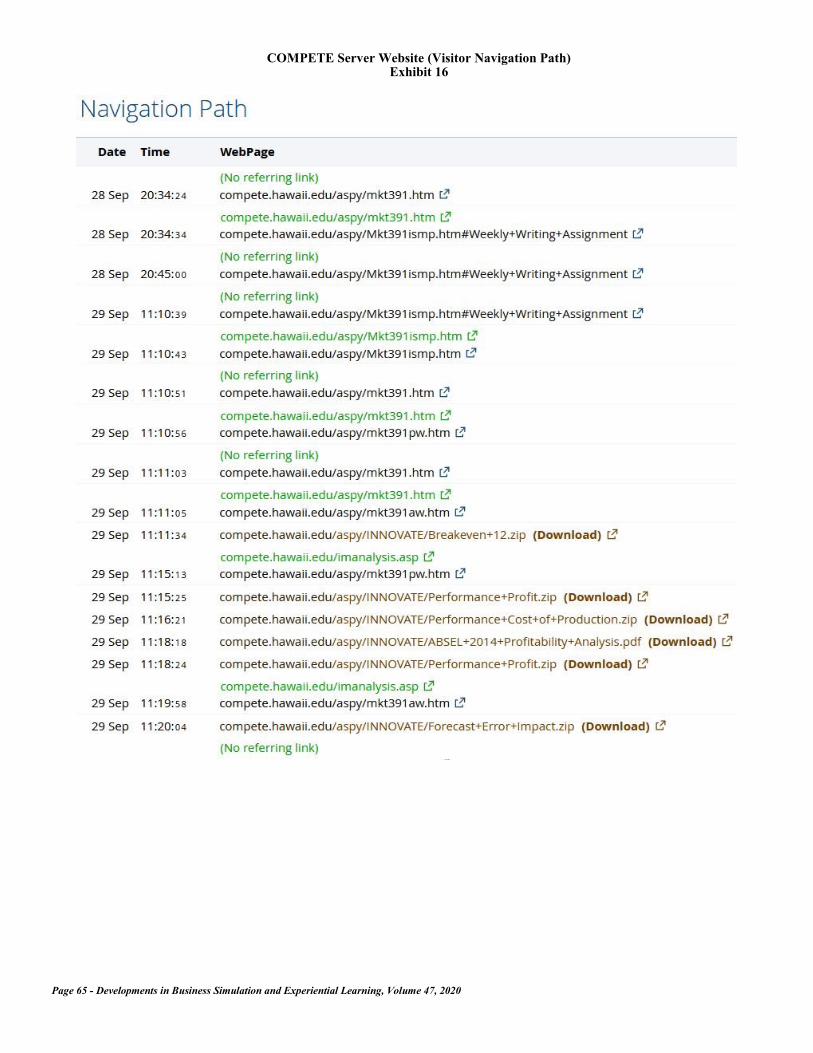
Page 65 - Developments in Business Simulation and Experiential Learning, Volume 47, 2020
COMPETE Server Website (Visitor Navigation Path) Exhibit 16

Page 66 - Developments in Business Simulation and Experiential Learning, Volume 47, 2020
of the phased debriefing process, ABSEL may wish to refocus on improving and streamlining the simulation debriefing process. A best-practices simulation debriefing workshop, and/or an ABSEL Simulation Competition during which ABSEL member participants explore and evaluate alternative debriefing strategies, may help in this regard. Alternative proposed debriefing processes can be tested and evaluated, and suggestions for improvement provided.
Given that the AACSB International bases for evaluating student engagement, when reviewing business school
accreditation applications, include (a) students give the appropriate attention and dedication to the learning materials, and (b) maintain their engagement with these materials even when challenged by difficult learning activities, as well as (c) the curricula include approaches that actively engage and include all students in learning, and their recognition that (d) pedagogical approaches suitable for challenging students in this way include problem-based learning projects and simulations (AACSB International, 2013), ABSEL can play a leading role in developing new approaches to foster and enhance student engagement.
Finally, as AACSB International recommends that educational institutions applying for accreditation document (a) curricula
approaches that actively engage and include students in academic learning, and (b) outcomes of the learning process in the form of projects, papers, presentation, examination performances, and other demonstrations of learning, in order to demonstrate clear evidence of active student engagement in learning (AACSB International 2013), ABSEL can play a leading role in developing new approaches to measure and document academic engagement and learning outcomes.
COMPETE Server Website (Visitor Page Navigation Tracking) Exhibit 17
Date
9/26/2019 11:24 http://compete.hawaii.edu/aspy/mkt391cs.htm
9/26/2019 11:25 http://compete.hawaii.edu/aspy/mkt391.htm
9/26/2019 11:25 http://compete.hawaii.edu/aspy/ppagraph.htm
9/26/2019 11:25 http://compete.hawaii.edu/aspy/mkt391pw.htm
9/26/2019 11:26 http://compete.hawaii.edu/aspy/mkt391aw.htm
9/26/2019 11:27
9/26/2019 11:31
9/27/2019 0:13 http://compete.hawaii.edu/aspy/mkt391aw.htm#SBU Analysis
9/27/2019 13:52 http://compete.hawaii.edu/aspy/mkt391aw.htm#SBU Analysis Guidelines
9/27/2019 13:52 http://compete.hawaii.edu/aspy/mkt391cs.htm
9/27/2019 13:53 http://compete.hawaii.edu/aspy/mkt391ca.htm
9/27/2019 13:53 http://compete.hawaii.edu/aspy/mkt391aw.htm
9/28/2019 12:49 http://compete.hawaii.edu/aspy/mkt391pw.htm#Profitability Analysis
9/28/2019 12:49 http://compete.hawaii.edu/aspy/mkt391ismp.htm#Weekly Writing Assignment
10/2/2019 15:22 http://compete.hawaii.edu/aspy/Mkt391ismp.htm
Url
COMPETE Portal Website (http://compete.hawaii.edu) Visitor Page Magnification Tracking
MKT 391 (1&2) - Marketing Strategies
Fall 2019

Page 67 - Developments in Business Simulation and Experiential Learning, Volume 47, 2020
AACSB International (2013). Eligibility procedures and accreditation standards for business accreditation. Tampa, FL: The Association to Advance Collegiate Schools of Business. (Last revised: July 1, 2018).
Aaker, D.A. (2014). Strategic market management, 10th ed. New York, NY: Wiley.
Aaker, D.A. & Moorman, C. (2018), Strategic market management, 11th ed., New York, NY: Wiley.
Anderson, P.H. & Lawton, L. (2005). The effectiveness of a simulation exercise for integrating problem-based learning in management education. Developments in Business Simulation and Experiential Learning, 32, 10-18.
Anderson, P.H. & Lawton, L. (2004). Simulation exercises and problem based learning: Is there A fit? Developments in Business Simulation and Experiential Learning, 31, 183-189.
Anderson, P.H. & Lawton, L. (1997). Demonstrating the learning effectiveness of simulations Where we are and where we need to go. Developments in Business Simulation and Experiential Exercises, 24, 68-73.
Argyris, C. (1970). Intervention Theory and Method: A Behavioral Science View. Reading, MA: Addison-Wesley.
Axelson, R.D. & Flick, A. (2011). Defining student engagement. Change: The Magazine of Higher Learning, 43 (1), 38-43.
Bandura, A. (1977). Self–efficacy: toward a unifying theory of behavioral change. Psychological Review, 84, 191-215.
Bandura, A. (1977). Social Learning Theory. Englewood Cliffs, NJ: Prentice Hall.
Bloom, B.S. (1956). Taxonomy of Educational Objectives: Handbook/Cognitive Domain. New York, NY: David McKay.
Blumenfeld, P., Soloway, E., Marx, R., Krajcik, J., Guzdial, M., and Palincsar, A. (1991). Motivating project-based learning: sustaining the doing, supporting the learning. Educational Psychologist, 26 (3&4), 369-398.
Bonwell, C. & Eison, J. (1991). Active Learning: Creating Excitement in the Classroom AEHE-ERIC Higher Education Report No. 1. Washington, D.C.: Jossey-Bass.
Bos, N., Naab, S., & Gordon, M. (2005). SimMAP: Turning action-based learning into simulated consulting projects. Developments in Business Simulation and Experiential Learning, 32, 36-41.
Bowen, S. (2005). Engaged learning: Are we all on the same page,” peerReview, 7, 2 (Winter) [available at: https://www.aacu.org/publications-research/periodicals/engaged-learning-are-we-all-same-page].
Bransford, J.D, Brown, A., & Cocking, R. (2000). How People Learn: brain, mind, experience and school. (by the Committee on Developments in the Science of Learning at the National Research Council). Washington, DC: National Academy Press.
Brophy, J. (1987). Synthesis of research on strategies for motivating students to learn. Educational Leadership, 45, 40-48.
Burch, G.F., Batchelor, J.H., Heller, N.A., Shaw, J., Kendall, W., & Turner, B. (2014). Experiential learning – What do we know? A meta-analysis of 40 years of research. Development in Business Simulation and Experiential Learning, 41, 179-183.
Burch, G.F., Heller, N.A., & Freed, R. (2014). Basic to the basics: Developing a student engagement survey to evaluate the role of experiential learning on student engagement. Development in Business Simulation and Experiential Learning, 41, 204-213.
Campbell, C.M. & Cabrera, A.F. (2011). How sound is NSSE? Investigating the psychometric properties of NSSE at a public, research-extensive institution. Review of Higher Education, 35 (1), 77-103.
Carini, R.M., Kuh, G.D. & Klein, S.P. (2006). Student engagement and student learning: testing the linkages. Research in Higher Education, 47 (1), 1-32.
Connell, J.P & Wellborn, J.G. (1991). Competence, autonomy, and relatedness: A motivational analysis of self-system processes. In M.R. Gunnar & L.A. Stroufe (Eds.), Self-Processes in Development: Minnesota Symposium on Child Psychology, (23, 43-77). Hillsdale, NJ: Erlbaum.
Deci, E.L., Connell, J.P., & Ryan, R.M. (1985). A motivational analysis of self-determination and self-regulation in the classroom. In C. Ames, & R.E. Ames (Eds.), Research On Motivation in Education, The Decision Milieu (2, 13-52). San Diego, CA: Academic Press.
Duch, B., Gron, S., & Allen, D., eds. (2001). The Power of Problem-Based Learning, A Practical ‘How To’ For Teaching Undergraduate Courses in Any Discipline. Sterling, VA: Stylus Publishing, LLC,
Dweck, C.S. (1999). Self-Theories: Their Role in Motivation, Personality and Development. Philadelphia, PA: Psychology Press.
Dweck, C.S. & Leggett, E.L. (1988). A social-cognitive approach to motivation and personality. Psychological Review, 95, 256-273.
Epstein, J. L. & McPartland, J.M. (1976). The concepts and measurement of the quality of school life,” American Educational Research Journal, 13, 15-30.
Eyler, J. & Giles, D.E. (1999). Where’s the Learning in Service Learning? San Francisco, CA: Jossey-Bass.
Faria, A.J. (2006). COMPETE: A Dynamic Marketing Simulation, 5th ed. Windsor, CA: University of Windsor.
Fitzpatrick, L.F., McConnell, C.A., & Sasse, C. (2006). Motivating the reluctant, novice learner: Principles of macroeconomics. Journal of Economics and Economic Education Research, 7 (2), 23-45.
Fredricks, J.A., Blumefeld, P.C., & Paris, A.H. (2004). School engagement: Potential of the concept: State of evidence. Review of Educational Research, 74 (1), 59-109.
Geddes, B.C., Cannon, H.M. & Cannon, J.N. (2017). Conceptualizing co-creative strategies in experiential education: Individual versus group approaches. Development in Business Simulation and Experiential Learning, 44, 59-72.
REFERENCES

Page 68 - Developments in Business Simulation and Experiential Learning, Volume 47, 2020
Geddes, B.C., Cannon, H.M., Cannon, J.N., & Feinstein, A. (2015). Developing educational strategies for experiential learning: An application of service dominant logic from marketing. Developments in Business Simulation & Experiential Learning, 42, 226–232.
Gordon, J., Ludlum, J., & Hoey, J.J. (2008). Validating NSSE against student outcomes: Are they related?. Research in Higher Education, 49 (1), 19-39.
Green, D. & Faria, A.J. (1995). Are good strategies consistently good?, Developments in Business Simulations and Experiential Exercises, 22, 31-37.
Guthrie, J.T. & Anderson, E. (1999). Engagement in reading: Processes of motivated, strategic, knowledgeable and social readers. In Guthrie, J.T. and Alvermann, D.E. (Eds.) Engaged Reading: Processes, Practices and Policy Implications (17-45). New York, NY: Teachers College Press.
Hagenbuch, D.J. (2006). Service learning inputs and outcomes in a personal selling course. Journal of Marketing Education, 28 (1), 26-34.
Handelsman, M. M., Briggs, W.L., Sullivan, N., & Towler, A. (2005). A measure of college student course engagement. The Journal of Educational Research, 98 (3), (Jan./Feb.), 184-191.
Hemmasi, M. & Graf, L.A. (1992). Managerial skills acquisition: A case for using business policy simulations,” Simulation & Gaming, 24 (4), 298-410.
Hogan, K. & Pressley, M. (1997). Scaffolding Student Learning: Instructional Approaches and Issues, (Advances in Teaching and Learning Series). Cambridge, MA: Brookline Books.
Hoover, J.D. (1974). Experiential learning: Conceptualization and definition. Developments in Business Simulation & Experiential Learning, 1, 31-35. (Reprinted from Bernie Keys Library (9th ed.)).
Hoover, J.D. (2011). Complexity avoidance, narcissism and experiential learning. Developments in Business Simulation & Experiential Learning, 38, 255-260.
Hoover, J.D., Giambatista, R.C., & Tribble, L. (2016). An organizational development approach to experiential learning with millennials. Developments in Business Simulation & Experiential Learning, 43, 27-31.
Hoover, J.D., Giambatista, R.C., Sorensen, R.L. & Bommer, W.H. (2010). Assessing the effectiveness of whole person learning pedagogy in skill acquisition. Academy of Management Learning & Education, 192-203.
Hoover, J.D. & Whitehead, C.J. (1975). An experimental-cognitive methodology in the first course in management: Some preliminary results. Simulation Games and Experiential Learning in Action, 2, 25-30.
Hu, S. & Wolniak, G. (2010). Initial evidence on the influence of college student engagement on early career earnings. Research in Higher Education, 51 (8), 750-766.
Hu, S. & Wolniak, G.C. (2013). College student engagement and early career earnings: Differences by gender, race/ethnicity, and academic preparation. The Review of Higher Education, 36, 211-233.
Kahn, W.A. (1990). Psychological conditions of personal engagement and disengagement at work. Academy of Management Journal. 33, 692-724.
Keller, J.M. (1983). Motivational design of instruction. In C.M. Reigeluth (Ed.), Instructional-Design Theories and Model: An Overview of Their Current Status. Millsdale, NJ: Lawrence Erlbaum Associates.
Keller, J.M. (1987). Strategies for stimulating the motivation to learn. Performance and Instruction, 26 (8), 1-7.
Keller, J.M. (1987). The systematic process of motivational design. Performance and Instruction, 26 (9-10), 1-8.
Keys, B. & Wolfe, J. (1990). The role of management games and simulations in education and research. Journal of Management, 16 (1), 311.
Kirschner, P.A., Sweller, J. & Clark, R.E. (2006). Why minimal guidance during instruction does not work: An analysis of the failure of constructivist, discovery, problem-based, experiential, and inquiry-based teaching. Educational Psychologist, 41 (2), 75-86.
Kolb, D. (1984). Experiential Learning: Experience As the Source of Learning And Development. Englewood Cliffs, NJ: Prentice Hall.
Kuh, G.D. (2003). What we’re learning about student engagement from NSSE. Change: The Magazine of Higher Learning, 35 (2), 24-31.
Lederman, L.C. (1992). Debriefing: Toward a systematic assessment of theory and practices. Simulation & Gaming, 23, 145-149.
Luthans, K.W., Luthans, B.C. & Palmer, N.F. (2016). A positive approach to management education: The relationship between academic PsyCap and student engagement. Journal of Management Development, 35, (9), 1098-1118.
Magnuson, R.A. & Good, D.C. (2017). It’s more than just a simulation: Deepening and broadening student learning by using a business enterprise simulation as a platform. Development in Business Simulation and Experiential Learning, 44, 95-105.
Meece, J.L., Blumenfeld, P., and Hoyle, R. (1988). Students’ goal orientations and cognitive engagement in classroom activities. Journal of Educational Psychology, 80, 514-523.
Miller, Craig (2013). The gamification of education. Developments in Business Simulation and Experiential Learning, 40, 196-200.
Miller, H.E., Schumann, P.L., Anderson, P.H., & Scott, T.W. (1998). Maximizing learning gains in simulations: Lessons from the training literature. Developments in Business Simulation and Experiential Exercises, 25, 217–223.
Magnuson, R.A. & Good, D.C. (2017). It’s more than just a simulation: Deepening and broadening student learning by using a business enterprise simulation as a platform. Developments in Business Simulation and Experiential Exercises, 44, 95–105.
Molden, D.C. & Dweck, C.S. (2000). Hidden costs (and benefits) of achievement goals. In C. Sansone, & J.M. Harackiewicz (Eds.) Intrinsic and Extrinsic Motivation: The Search For Optimal Motivation and Performance. (pp. 131-159). San Diego, CA: Academic Press.
Moon, J. (2004). A Handbook of Reflective and Experiential Learning: Theory and Practice. London,UK: Routledge Palmer.

Page 69 - Developments in Business Simulation and Experiential Learning, Volume 47, 2020
Mosenthal, P.R. (1999). Understanding engagement: Historical and political contexts. In J.T. Guthrie & D.F. Alvermann (Eds.) Engaged Reading: Processes, Practices and Policy Implications. (pp. 1-16). New York, NY: Teachers College Press.
National Survey of Student Engagement (2000). The NSSE Report: National Benchmarks of Effective Educational Practice. Bloomington, IN: Indiana University Center For Postsecondary Research and Planning.
National Survey of Student Engagement (2002). 2002 Overview. Bloomington, IN: Indiana University Center For Postsecondary Research and Planning.
Nelson Laird, T.F., Shoup, R. & Kuh, G.D. (2005). Measuring deep approaches to learning using the National Survey of Student Engagement.” Paper presented at the Annual Meeting of the Association for Institutional Research: Chicago, IL.
Palia, A.P. (2012). Assessing brand portfolio normative consistency & trends with the Normative Position of Brands & Trends Package. Developments in Business Simulation and Experiential Learning, 39, 47-74.
Palia, A.P. (2010). Checking financial balance of target brand portfolio with the Strategic Market Plan Cash Flow Package. Developments in Business Simulation and Experiential Learning, 37, 157-169.
Palia, A.P. (1995). Comparative static analysis with the COMPETE PPA Package: A strategic market planning tool. Developments in Business Simulation and Experiential Learning, 22, 130-131.
Palia, A.P. (2017). Developing a strategic target SBU portfolio with the Target Portfolio Package. Developments in Business Simulation and Experiential Learning, 44, 167-184.
Palia, A.P. (2019). Enhancing experiential learning via phased simulation debriefing. Developments in Business Simulation and Experiential Learning, 46, 222-257.
Palia, A.P. (2007). Online budgeting and marketing control with the Proforma Analysis package. Developments in Business Simulation and Experiential Learning, 35, 197-204.
Palia, A.P. (2005). Online cumulative simulation team performance package. Developments in Business Simulation and Experiential Learning, 32, 233-239.
Palia, A.P. (2009). Online marketing control with the Strategic Business Unit Analysis package. Developments in Business Simulation and Experiential Learning, 36, 91-101.
Palia, A.P. (2004). Online sales forecasting with the Multiple Regression Analysis Data Matrices package. Developments in Business Simulation and Experiential Learning, 31, 180-182.
Palia, A.P. (1989). Sensitivity analysis with the COMPETE IFPS/Personal Student Analysis Package: A marketing decision support system. Developments in Business Simulation and Experiential Learning, 16, 141-144.
Palia, A.P. (1991). Strategic market planning with the COMPETE Product Portfolio Analysis Package: A marketing decision support system. Developments in Business Simulation and Experiential Learning, 18, 80-83.
Palia, A.P. (2008). Target profit pricing with the web-based Breakeven Analysis Package. Developments in Business Simulation and Experiential Learning, 35, 197-204.
Palia, A.P. (2011). Tracking forecast error type, frequency and magnitude with the Forecast Error Package. Developments in Business Simulation and Experiential Learning, 38, 45-58.
Palia, A.P. (2018). The quest for marketing effectiveness & ROI with the Efficiency Analysis Package. Developments in Business Simulation and Experiential Learning, 45, 105-127.
Palia, A.P. & De Ryck, J. (2015). Assessing competitor strategic business units with the Competitor Analysis Package. Developments in Business Simulation and Experiential Learning, 42, 52-68.
Palia, A.P. & De Ryck, J. (2014). Implementing marketing control with the web-based Profitability Analysis Package. Developments in Business Simulation and Experiential Learning, 41, 64-84.
Palia, A.P. & De Ryck, J. (2016). Improving profitability via cost control with the Cost of Production Performance Package. Developments in Business Simulation and Experiential Learning, 43, 166-101.
Palia, A.P. & De Ryck, J. (2013). Repositioning brands with the web-based Product Positioning Map Graphics Package. Developments in Business Simulation and Experiential Learning, 40, 207-228.
Palia, A.P., De Ryck, J. & Mak, W.K. (2003). Interactive online positioning with the web-based Product Positioning Map Graphics Package. Developments in Business Simulation and Experiential Learning, 30, 202-206.
Palia, A.P., De Ryck, J. & Mak, W.K. (2002), Interactive online strategic market planning with the web-based Boston Consulting Group (BCG) Matrix Graphics Package. Developments in Business Simulation and Experiential Learning, 29, 140-142.
Palia, A.P. & Mak, W.K. (2001). An online evaluation of the COMPETE Online Decision Entry System (CODES). Developments in Business Simulation and Experiential Learning, 28, 188-191.
Palia, A.P., Mak, W.K., & Roussos, D.S. (2000). Facilitating learning in the new millennium with the COMPETE Online Decision Entry System (CODES). Developments in Business Simulation and Experiential Learning, 27, 248-249.
Palia, A.P. & Roussos, D.S. (2006). Online market test laboratory with the MINISIM program. Developments in Business Simulation and Experiential Learning, 33, 238-41.
Pascarella, E.T., Seifert, T.A., & Blaich, C. (2010). How effective are the NSSE benchmarks in predicting important educational outcomes?. Change: The Magazine of Higher Learning, 42 (1), 16-22.
Perkins, D. (1999). The many faces of constructivism. Educational Leadership, 6-11.
Petakus, E. (2000). A theoretical and practical framework For service-learning in marketing: Kolb’s experiential learning cycle. Journal of Marketing Education, 22 (1), 64-70.
Peters, V.A.M. & Vissers, G.A.N. (2004). A simple classification model for debriefing simulation games, Simulation & Gaming, 35 (1), 70-84.
Pike, G.R. (2013). NSSE benchmarks and institutional outcomes: A note on the importance of considering the intended uses of a measure in validity studies. Research in Higher Education, 54 (2), 149-170.

Page 70 - Developments in Business Simulation and Experiential Learning, Volume 47, 2020
Pintrich, P.R. & DeGroot, E.V. (1990). Motivational and self-regulated learning components of classroom academic performance. Journal of Educational Psychology, 82, 33-40.
Porter, S.R. (2011). Do college surveys have any validity?. Review of Higher Education, 35, 45-76.
Rahn, D. (2009). Enhancing web-based simulations with game elements for increased engagement. Developments in Business Simulation and Experiential Learning, 36, 303-311.
Rich, B.L., LePine, J.A., & Crawford E.R. (2010). Job engagement: Antecedents and effects on job performance. Academy of Management Journal, 53, 617-635.
Schaefeli, W. & Bakker, A. (2004). Ultrecht Work Engagement Scale: Preliminary Manual. Ultrecht University.
Schellenberger, R.E., Hill, J.A., & Keusch, R.B. (1989). An exploratory study of the effect of strategic emphasis in management games on attitudes, interest, and learning in the Business Policy course. Developments in Business Simulations and Experiential Exercises, 16, 178.
Skinner, E.A. (1991). Development and perceived control: A dynamic model of action in context. In M.R. Gunnar & L.A. Stroufe (Eds.), Self Processes in Development: Minnesota Symposium on Child Psychology, (Vol. 23, pp. 167-216). Chicago, IL: Chicago University Press.
Skinner, E.A. & Belmont, M.J. (1993). Motivation in the classroom: Reciprocal effects of teacher behavior and student engagement across the school year. Journal of Educational Psychology, 85, 571-581.
Skinner, E.A., Wellborn, J.G., & Connell, J.P. (1990). What it takes to do well in school and whether I’ve got it: A process model of perceived control and children’s engagement and achievement in school. Journal of Educational Psychology, 82, 22-32.
Smith, P.L. & Ragan, T.J. (1993). Instructional Design. New York, NY: Merrill.
Spence, L. (2001). Problem based learning: Lead to learn, learn to lead. Problem Based Learning Handbook. University Park, PA: Penn State University, School for Information Sciences and Technology.
Teach, R., & Govahi, G. (1988). The role of experiential learning and simulation in teaching management skills. Developments in Business Simulation & Experiential Exercises, 15, 65-71.
Trosset, C. (1998). Obstacles to open discussion and critical thinking: The Grinnell College study. Change Magazine (September/October), 44-49.
Vargo, S. L., & Lusch, R. F. (2004). Evolving to a new dominant logic for marketing. Journal of Marketing, 68, (1), 1–17.
Vargo, S. L., & Lusch, R. F. (2014). Inversions of service-dominant logic. Marketing Theory, 14, 239–248.
Voelkl, K.E. (1997). Identification with school. American Journal of Education, 105, 204-319.
Washbush, J.B., & Gosenpud, J.J. (1991). Student attitudes about policy course simulations. Developments in Business Simulations and Experiential Exercises, 18, 105-110.
Wellington, W., & Faria, A.J. (2006). Validating business simulations: Do simulations exhibit natural market structures?. Developments in Business Simulation and Experiential Learning, 33, 118-123.
Wehlage, G.G., Rutter, R.A., Smith, G.A., Lesko, N.L. & Fernandez, R.R. (1989). Reducing The Risk: Schools as Communities of Support. Philadelphia, PA: Farmer Press.
Winsett, C., Foster, C., Dearing, J., & Burch, G. (2016). The impact of group experiential learning on student engagement. Academy of Business Research Journal, 3, 7-17.
Wolfe, J. (1985). The teaching effectiveness of games in collegiate business courses. Simulation and Games, 16, 251-288.
Wolfe, J. (1990). The evaluation of computer-based business games: Methodology, findings, and future needs. In J.W. Gentry (ed.), Guide to Business Gaming and Experiential Learning (pp. 279–300), New York: Nichols/GP Publishing.
Young, Mark R. (2010). The Art And Science of Fostering Engaged Learning. Academy of Educational Leadership Journal, 14 (Special Issue), 1-18.
Zimmerman, T., Schmidt, L., Becker, J., Peterson, J., Nyland, R., & Surdick, R. (2014). Narrowing the gap between students and instructors: A study of expectations. Transformative Dialogues: Teaching & Learning Journal, 7 (1), 1-18.