enhancement of boiling surfaces using nanofluid particle ... · enhancement of boiling surfaces...
TRANSCRIPT

ENHANCEMENT OF BOILING SURFACES USING NANOFLUID PARTICLE
DEPOSITION
by
Steven Bryan White
A dissertation submitted in partial fulfillment
of the requirements for the degree of
Doctor of Philosophy
(Mechanical Engineering)
in The University of Michigan
2010
Doctoral Committee:
Professor Albert Shih, Co-Chair
Assistant Professor Kevin P. Pipe, Co-Chair
Associate Professor Claus Borgnakke
Assistant Professor Anish Tuteja

© Steven Bryan White 2010

ii
DEDICATION
Dedicated to the ones I love.

iii
ACKNOWLEDGEMENTS
I truly appreciate the support that I have received from all directions.
First, I am extremely grateful for the opportunity to have worked with Professor
Albert Shih. Under his tutelage I have grown as a student, teacher, writer, researcher, and
most of all as a person. He has presented me with numerous opportunities in research
and other endeavors. He has been supportive in both my research and my life, and for
that I am sincerely thankful.
I also truly appreciate the guidance I have received from Professor Kevin Pipe.
He has helped me to focus my thoughts and express them clearly. I value the time he has
spent with me and I am grateful to have worked with him these past few years. He has
set an excellent example as a young researcher that I strive to become. Further, I thank
both Professor Shih and Professor Pipe for being co-authors on the papers that make up
Chapters 2-4 in this dissertation.
I would like to thank my other committee members, Professors Claus Borgnakke
and Anish Tuteja, for their assistance along the way. Professor Borgnakke’s teaching
engaged me while being a student here and inspired me to get into research. I appreciate
Professor Tuteja for being gracious enough to allow me to use his lab and join my
committee. I am glad to have met and worked with both of them.
I thank Nidia Gallego for my first research exposure at Oak Ridge National Lab.
I appreciate the time I spent with Simon Tung while I was at GM as well as Angelo
Quintana and Eric Schneider. I am thankful to Nanophase Technologies Corp. for

iv
providing the nanofluids that I used in my research. I also am grateful to the Medical
Innovation Center and Tangent Medical for providing me wonderful opportunities
outside of the lab. I thank Oak Ridge National Lab and General Motors for supporting my
research. I also am glad to have worked with Dr. Geoffrey Gerstner over the last year. I
am also sincerely appreciative for the guidance provided by Toby Donajkowski and Steve
Emanuel in the machine shop. They have helped grow as an engineer and provided me
the tools to aid my research over the years.
I would like to thank all of my colleagues at the Wu Lab for providing a great
environment to learn and do research. I thank Scott Miller for being an amazing friend,
colleague, and mentor. I am thankful to Grant Kruger for his guidance and camaraderie.
I am glad to have worked with Bin Shen, Yani Chen, and Bruce Tai on nanofluids. I
thank my other lab mates, Rob Dodde, Matt Chastagner, and Dan Johnson, for their
insightful discussions. Also, I thank Kwang Hyup An, Ben Hagan, Arun Kota, Haiping
Sun and Chris Welch for their assistance. I am also grateful to my friends outside of the
lab, James, Tim, Adam, Mike and Robbie, who have enriched my life.
I would like to thank my Mom, Dad, and brother, A.J., for their unwavering
support and encouragement. While there have been several difficult moments over the
last few years, they provided the love and strength that have made me who I am today. I
thank both of my Grandmas, my Aunt Judy and Uncle Tom for their love and support.
Finally, I would like to thank my best friend and the love of my life, Elyse
Kemmerer, for everything. She has helped me in numerous ways, from discussing my
research, to editing, to cooking, to relaxing. Not to mention the love and support she has
given me. I will always be indebted to her.

v
TABLE OF CONTENTS
DEDICATION .................................................................................................................... ii
ACKNOWLEDGEMENTS ............................................................................................... iii
LIST OF FIGURES .......................................................................................................... vii
LIST OF TABLES ............................................................................................................. ix
ABSTRACT ........................................................................................................................ x
CHAPTER 1 INTRODUCTION ........................................................................................ 1
1.1 MOTIVATION ......................................................................................................... 1
1.2 BACKGROUND ...................................................................................................... 3
1.3 RESEARCH OBJECTIVES ..................................................................................... 6
1.4 ORGANIZATION OF THE DISSERTATION ....................................................... 7
CHAPTER 2 EFFECTS OF NANOPARTICLE LAYERING ON NANOFLUID AND
BASE FLUID POOL BOILING HEAT TRANSFER FROM A HORIZONTAL
SURFACE UNDER ATMOSPHERIC PRESSURE ........................................................ 15
2.1 INTRODUCTION .................................................................................................. 16
2.2 EXPERIMENTAL SETUP ..................................................................................... 18
2.2.1 Nanofluid Preparation ...................................................................................... 18
2.2.2 Boiling Apparatus ............................................................................................ 19
2.3 EXPERIMENTAL PROCEDURE ......................................................................... 19
2.3.1 ZnO layering study .......................................................................................... 19
2.3.2 Scanning electron microscopy (SEM) and atomic force microscopy (AFM) of
nanoparticle layers .................................................................................................... 20
2.4 BOILING PERFORMANCE CHARACTERIZATION ........................................ 20
2.4.1 Analysis ............................................................................................................ 21
2.4.2 Uncertainty ....................................................................................................... 22
2.5 BOILING PERFORMANCE RESULTS ............................................................... 24
2.6 SEM AND AFM INVESTIGATION OF BOILING SURFACE AND
DISCUSSION ............................................................................................................... 25
2.7 CONCLUSIONS .................................................................................................... 28
CHAPTER 3 BOILING SURFACE ENHANCEMENT BY ELECTROPHORETIC
DEPOSITION OF PARTICLES FROM A NANOFLUID .............................................. 40
3.1 INTRODUCTION .................................................................................................. 40
3.2 EXPERIMENTAL METHOD ................................................................................ 42
3.2.1 Nanofluid preparation and characterization ..................................................... 42
3.2.2 Coating procedure ............................................................................................ 42
3.2.3 Boiling characterization ................................................................................... 43
3.2.4 Calculation of heat flux and measurement uncertainty .................................... 44
3.2.5 Surface characterization ................................................................................... 46
3.3 BOILING MODELS ............................................................................................... 47
3.3.1 Rohsenow correlation ...................................................................................... 47

vi
3.3.2 Nucleation site density ..................................................................................... 47
3.4 RESULTS AND DISCUSSION ............................................................................. 48
3.4.1 Impact of coating time on boiling performance ............................................... 48
3.4.2 Residual ZnO layer .......................................................................................... 49
3.4.3 Surface roughness ............................................................................................ 50
3.4.4 Scanning electron microscopy ......................................................................... 50
3.4.5 Estimation of active nucleation site density based on the Mikic-Rohsenow
correlation ................................................................................................................. 51
3.4.6 Contact angle ................................................................................................... 51
3.4.7 Cavity analysis from SEM image processing .................................................. 52
3.5 CONCLUSIONS .................................................................................................... 52
CHAPTER 4 INVESTIGATION OF THE ELECTRICAL CONDUCTIVITY OF
PROPYLENE GLYCOL BASED ZNO NANOFLUIDS ................................................ 64
4.1 INTRODUCTION .................................................................................................. 64
4.2 NANOFLUID PREPARATION AND CHARACTERIZATION ......................... 67
4.2.1 Nanofluid Preparation ...................................................................................... 67
4.2.2 Zeta Potential Measurement............................................................................. 67
4.2.3 Electrical Conductivity Measurement .............................................................. 68
4.3 NANOFLUID ELECTRICAL CONDUCTIVITY MODELING .......................... 68
4.4 RESULTS AND DISCUSSION ............................................................................. 70
4.4.1 Zeta Potential ................................................................................................... 70
4.4.2 Modeling Parameters ....................................................................................... 71
4.4.3 Comparison of Experimental and Modeling Results ....................................... 71
4.4.4 Particle Size and Concentration Effects ........................................................... 72
4.4.5 Effects of Surface Charge in Modeling............................................................ 73
4.4.6 Electrokinetic Radius ....................................................................................... 74
4.5 CONCLUSIONS .................................................................................................... 75
CHAPTER 5 CONCLUSIONS AND FUTURE WORK ................................................. 85
5.1 CONCLUSIONS .................................................................................................... 85
5.2 FUTURE WORK .................................................................................................... 87

vii
LIST OF FIGURES
Figure 1.1. (a) Boiling curve for water through four different boiling regimes as a
function of superheat and (b) visualization of the different boiling regimes. [5] ............. 10
Figure 1.2. Al2O3/water based nanofluid. ........................................................................ 11
Figure 2.1. Picture of boiling system and schematic of heat source. ................................ 30
Figure 2.2. Calibration data for water compared to the Rohsenow [28] correlation
showing good agreement with a heat transfer efficiency η=0.83. .................................... 31
Figure 2.3. Experimental data showing that ZnO nanofluids have a larger boiling
coefficient at the same heat flux when compared to the boiling of water on the same clean
(unroughened) surface. ..................................................................................................... 32
Figure 2.4. Experimental data showing that for each heat flux into the system (24, 28,
and 32 kW/m2) the boiling coefficient of water increases with successive coatings of ZnO
nanoparticles. .................................................................................................................... 33
Figure 2.5. Experimental data showing that at each heat flux into the system (24, 28, and
32 kW/m2) the boiling coefficient of the ZnO nanofluid initially increases from the value
for water on a clean surface (Test 0) then remains nearly constant after successive
coatings of ZnO nanoparticles. ......................................................................................... 34
Figure 2.6. SEM images of deposited ZnO nanoparticle layer on stainless steel heater
surface after the referenced boiling test. Test 1 yields incomplete surface coverage, while
subsequent nanofluid boiling tests yield full coverage. .................................................... 35
Figure 2.7. AFM images of heater surface samples after the referenced boiling test,
showing increasing surface roughness. ............................................................................. 36
Figure 2.8. Comparison of normalized experimental data for water and ZnO nanofluid to
the normalized Gorenflo [29] model which accounts for surface roughness. Water boiling
tests show significantly increasing performance due to increasing surface roughness,
while nanofluids show moderately decreasing performance that we ascribe to suppression
of bubble transport by suspended nanoparticles. .............................................................. 37
Figure 3.1. Electrophoretic configuration used to coat ZnO nanoparticles on a SS surface.
........................................................................................................................................... 55
Figure 3.2. Schematic of boiling test system. ................................................................... 56
Figure 3.3. Experimental boiling results comparing the baseline surface to the
electrophoretically coated Surfaces #1-#4. ....................................................................... 57

viii
Figure 3.4. Surface #4 shown (a) before coating, (b) after coating/before boiling, and (c)
after boiling (when the bulk layer has flaked off). (d) EDX analysis of the surface after
boiling, showing that ZnO is still present. ........................................................................ 58
Figure 3.5. SEM images of different surfaces investigated at three magnifications. ....... 59
Figure 3.6. Comparison of active nucleation site density calculated from the Mikic
Rohsenow correlation for baseline (uncoated) surface and (coated) Surface #4. ............. 60
Figure 3.7. Representative images produced by thresholding algorithm that are used to
analyze the number of cavities available for nucleation in (a) baseline, (b) Surface #1, and
(c) Surface #4. ................................................................................................................... 61
Figure 4.1. Schematic of Kuwabara’s cell model with particle radius, a, layer thickness,
κ-1, and particle space, b................................................................................................... 77
Figure 4.2. Experimental electrical conductivity of propylene glycol-based ZnO
nanofluids with 20, 40, and 60 nm particles in comparison to a model for the electrical
conductivity of a colloidal suspension in a salt-free medium. .......................................... 78
Figure 4.3. The difference in electrical conductivity between particle sizes of 20 (K20) and
40 nm (K40) and 40 and 60 nm (K60) at the same volume fraction. The difference in
electrical conductivity between the 20 nm and 40 nm is larger than the difference
between 40 nm and 60 nm particles. ................................................................................. 79
Figure 4.4. The rate of change in electrical conductivity between volume fractions for the
different particle sizes. The rate of change decreases at higher volume fractions. .......... 80
Figure 4.5. Two potential cases for the model using Eqs. (4.3) and (4.4) for the low
surface charge (Case 1) and high surface charge (Case 2), respectively, for the 20 nm
ZnO/PG suspension. ......................................................................................................... 81
Figure 4.6. Variation of the electrokinetic radius, κa, with volume fraction. .................. 82

ix
LIST OF TABLES
Table 1.1. Review of nanofluid boiling literature ............................................................... 9
Table 2.1. Cyclic Boiling Experiment Order .................................................................... 29
Table 3.1. Coating time, HTC, surface roughness and contact angle results ................... 54
Table 4.1. Zeta potential measurements ........................................................................... 76
Table 4.2. Values of the right hand side of the inequality in Eq. (4.1) ............................. 76

x
ABSTRACT
To meet increasing power demands across several industries, advanced thermal
management systems based on boiling heat transfer have been proposed. Furthermore,
nanofluids, a relatively new class of coolants created by suspending 1-100 nm sized
particles in a base fluid, have been shown to improve a fluid’s thermal properties. This
research focuses on two methods using nanofluids to deposit nanoparticles for the
creation of enhanced surfaces for boiling heat transfer. Since many of these thermal
management systems require a non-conductive fluid, the electrical conductivity of
nanofluids is also studied.
Pool boiling studies of nanofluids have demonstrated either enhanced or
diminished boiling heat transfer, yet have been unable to distinguish the contributions of
increased surface roughness and suppression of bubble transport by suspended particles.
This uncertainty is resolved by studying the boiling performance of a surface exposed to
a series of boiling tests that alternate between water and a water-based nanofluid. The
boiling performance of the coated surfaces increases significantly with each cycle. The
measured surface roughness of the intervening nanoparticle layers is used with a model to
explain the measured increase in performance. The results demonstrate that the effect of
increased surface roughness due to nanoparticle layering can enhance boiling for the base
fluid.
A novel method to create enhanced boiling surfaces is electrophoretic deposition
of nanoparticles from a nanofluid. A surface was coated using electrophoretic deposition

xi
from a ZnO-propylene glycol based nanofluid. With adequate coating time, such a
surface modification method can increase the boiling heat transfer coefficient by about
200%, which was correlated to an increase in the nucleation site density.
In addition, on chip cooling techniques require low conductivity coolants.
However, the electrical conductivity of nanofluids has not been widely studied. The
particle size and concentration effects on nanofluid electrical conductivity were
experimentally investigated and compared to a model based on colloidal suspensions in a
salt-free medium. The results showed the electrical conductivity increased with
increasing volume fraction and decreasing particle size. At higher volume fractions, the
increase of electrical conductivity begins to level off, which is attributed to ion
condensation effects in the high surface charge regime.

1
CHAPTER 1
INTRODUCTION
1.1 MOTIVATION
The need for advanced thermal management systems based on boiling heat
transfer with next-generation coolants has been driven by the increase in chip power
density and an increase in the amount of electronics onboard a vehicle [1]. Gordon
Moore first predicted in 1965 that the number of transistors per chip would double every
year [2]. This trend held and now has been observed in other aspects of the
semiconductor industry. With this increase in power and decrease in size of transistors,
the temperature limit of the current Si chip material is being approached. Currently the
power density of chips in high end applications exceeds 1000 kW/m2 but must maintain a
junction temperature below 105°C [3]. Insulated Gate Bipolar Transistor (IGBT) motor
controllers can dissipate up to 400 kW/m2 while being held below 125°C in a much
harsher automotive environment. Projections have power densities increasing towards
2500 kW/m2 over the next few years [4].
There are a number of air cooling methods for power electronics, with the most basic
being the natural convection of the chip, which can be further aided by adding a heat
sink. In other systems liquid can be flowed through heat sinks to increase the
performance. Pin-finned heat exchangers can be easily cast, however, these heat sinks
tend to be bulky and significantly increase the weight of the system. To overcome these
limitations thermosyphons have been explored as an advanced thermal management

2
system. A thermosyphon removes heat by conducting it away from the source to boil a
fluid in the evaporator section, from which vapor rises to the condensing section. The
vapor condenses and the condensate returns to the evaporator. This allows heat from a
concentrated source, such as an electronic chip, to be spread out to a larger area using the
latent heat of vaporization of the fluid. Thermosyphons rely on natural convection and
do not require external power, making them inexpensive and quiet.
Advanced cooling techniques are based on boiling heat transfer since it is an efficient
method of removing large heat fluxes through the phase change of the liquid. Pool
boiling is boiling of a heated surface submerged in a pool of liquid. Fig. 1.1(a) shows a
characteristic curve of boiling heat transfer over four distinct regimes, and Fig. 1.1(b)
illustrates the bubble formation in these regimes [5]. The heat flux at the surface (vertical
axis) and the superheat (horizontal axis) are measured during boiling. First, heat is
removed from the surface through natural convection and no bubbles are formed. Next in
the nucleate boiling regime, the liquid at the surface begins to evaporate and bubbles
form at nucleation sites. This regime is characterized by a very high heat transfer rate at
low surface temperatures. Once the critical heat flux (CHF) has been reached, the
population of bubbles obstructs the path of incoming liquid and forms an insulating vapor
layer. This is referred to as the transition boiling regime. At this point there is a rapid
decrease in the heat that can be removed and a rapid increase of the surface temperature.
Finally in the film boiling regime, a stable vapor film is formed and there is no fluid-
surface contact. When boiling heat transfer (BHT) is enhanced, the curve of Fig. 1.1(a)
shifts up or to the left. This means more heat can be removed from the surface at the
same temperature, or at the same heat flux, the surface temperature is lower.

3
Enhancement of pool boiling heat transfer can accomplished through (a) modifying the
surface, (b) sub-cooling the returning liquid, and/or (c) increasing the operating pressure
[6]. Enhancement of boiling performance can refer to increases in boiling heat transfer
coefficient (HTC), increases in CHF, reduction in the boiling incipience temperature, or
decreases in boiling hysteresis. This research focuses on surface modifications to
improve the boiling HTC compared to a plain surface.
1.2 BACKGROUND
The thermal properties of coolants are inherently poor and the idea of adding
solids to fluids to enhance these properties was first described by Maxwell in 1904 [1].
The problem with using solid particles in fluids is stability; suspensions of µm and larger
sized particles are likely to settle. However, it is thought that nanofluids, suspensions of
nanometer sized particles dispersed in a base fluid specifically to enhance the thermal
properties of the fluid [8], are more stable since the smaller particle sizes allow for a
decrease in the sedimentation rate and charges developed on the particle surface provide
electrostatic repulsion. Nanofluids have shown promise as an advanced coolant for a
variety of applications. One application of this research is the improvement of boiling
heat transfer for thermal management of power electronics that control the electric motor
and the fuel cell stack in advanced hybrid vehicles.
Nanofluids can be created with particle materials, such as metals, oxides, and
nitrides, in a range of base fluids, including water, propylene glycol, oils, and monomers.
Nanofluids are often opaque and take on the color of the particle; for example, a white
Al2O3/water-based nanofluid is shown in Fig. 1.2. Two common practices, the one-step
and two-step methods, are used to produce nanofluids. The one-step method produces

4
metallic nanofluids by directly condensing an evaporated metal vapor into a base fluid to
generate dispersed nanoparticles [9,10]. The two-step method first produces
nanoparticles, typically by inert gas condensation, as a nanopowder, which is then
dispersed into a base fluid [11]. Since oxide nanopowders are commercially available,
the two-step method is simpler and less expensive for producing nanofluids. These
methods allow for nanoparticles of a wide range of shapes, sizes, and types to be
dispersed in aqueous and non-aqueous fluids. The amount of nanoparticles in a nanofluid
is typically reported as the volume fraction of nanoparticles in the suspension, calculated
from the density and mass of nanopowder dispersed. The size of the nanoparticle is
usually reported as the size of the primary particle dispersed and can be measured using
light scattering techniques.
Nanofluids were first described in 1995 [8] and since then their thermal properties
have been widely studied. Most researchers have focused on measuring and modeling
the thermal conductivity enhancements. The change in thermal conductivity of
nanofluids compared to the base fluid has been widely studied and reviewed by Ӧzerinҫ
et al. [12]. There is a wide range in the measured increase in the thermal conductivity of
nanofluids compared to the base fluid. For example, Lee et al. [13] reported a 10%
increase of 38.4 nm Al2O3 particles at 4.4% volume fraction in water, while Das et al.
[14] measured a 24% increase for the same particles at 4.0% volume fraction. CuO
nanoparticles have had the largest measured increase in thermal conductivity reported for
metal oxide based nanofluids [15]. Despite the discrepancies, overall there is a
substantial increase in thermal conductivity compared to the base fluid. There have been
a variety of models proposed to explain the increase in thermal conductivity. With a

5
large collaboration over 30 different sites, Buongiorno et al. [16] determined that the
increase in thermal conductivity could be modeled with the effective medium theory.
Recently, some of the focus has shifted towards nanofluids in other applications, such as
forced convection and boiling. In forced convection applications, as review by Godson et
al. [17], there have been measured increases in heat transfer coefficient for nanofluids.
Since nanofluids have shown improved thermal properties, they have been studied
for boiling applications. However, nanofluid boiling is not well understood. There has
been a consensus that nanofluids improve CHF compared to water [18], but there are
conflicting reports on nanofluids’ influence on the boiling HTC. Taylor and Phelan [19]
provide a comprehensive review of nanofluids in pool boiling. A summary of the
nanofluid pool boiling literature is presented in Table 1.1 [19-40]. There have been
several researchers [20-27] which have measured a decrease in HTC, several [19, 28-36]
that have observed an increase and others [37-40] who did not see any changes. Shi et al.
[31] measured a nearly 60% increase in HTC for Al2O3/water-based nanofluids on a
copper block, while Bang and Chang [20] measured a 20% decrease in HTC for similar
Al2O3/water-based nanofluids on a plain surface. It was noted in nearly every study that
there was some kind of deposition of nanoparticles on the surface. Taylor and Phelan
[19], Das et al. [21], and Narayan [30] all concluded that nanoparticles coating the
surface was an important factor, with Das et al. [21] and Narayan et al. [30] defining a
surface parameter as the ratio of particle size to roughness to explain the change in HTC.
Chopkar et al. [28] boiled ZrO2/water nanofluids multiple times on the same surface and
saw an increase in performance for the first two runs and a decrease after the third time.

6
Overall, the coating formed during nanofluid boiling and its impact on boiling HTC is not
well understood.
For automotive power electronics and fuel cell thermal management applications,
the coolant must also be electrically non-conductive. Strong dielectric coolants are
typically in these applications. There has not been substantial research on the electrical
conductivity of nanofluids. Several researchers have measured increases in [41-44], but a
model to predict the increase and particle size effects are not well understood.
1.3 RESEARCH OBJECTIVES
The focus of this research is on two novel methods to create deposits of
nanoparticles from nanofluids on surfaces undergoing nucleate pool boiling and to study
the electrical conductivity properties of nanofluids. There is lack of understanding on
how the layer formed during nanofluid boiling impacts boiling performance. Alternative
methods to coat boiling surfaces with nanofluids have not been studied. Therefore,
electrophoretic deposition of nanoparticles is investigated. Furthermore, there is a need
to explore how the electrical conductivity changes with particle size and concentration
and how to model these effects.
The specific tasks in this research include:
(1) To quantify the impact of nanoparticles that attach to a surface during boiling.
The review of nanofluid boiling literature reveals two competing phenomena:
surface coating of nanoparticles and bubble suppression due to the particles. To
highlight the effects of the surface coating, a novel process is applied to create
multiple coatings on a surface by alternating boiling studies between water and

7
nanofluids. The surface is investigated to determine BHT enhancement compared
to an uncoated surface.
(2) To use electrophoretic deposition to coat surfaces and investigate their impact on
boiling performance. Since BHT can be enhanced by coating surfaces with
particles from boiling nanofluids and the nanoparticles in suspension have a
surface charge, a novel method is used to enhance boiling surfaces with
electrophoretic deposition of particles.
(3) To measure and model the effect of particle size and concentration on the
electrical conductivity. The electrical properties of nanofluids are not well
understood, yet it is an important property of coolants in advanced thermal
management systems. Three different particle sized nanofluids prepared with
similar methods are experimentally investigated over a range of volume fractions.
The electrical conductivity is modeled as a colloidal suspension a salt-free
medium.
Completion of these objectives will provide a better understanding of how
nanofluids can be used to improve the performance of advanced thermal management
systems.
1.4 ORGANIZATION OF THE DISSERTATION
This dissertation is presented in a multiple manuscript format. Chapters 2, 3, and
4 are written as individual research papers including the abstract, main body, and
references.
Chapter 2 studies the impact of nanoparticle layers formed on a surface while
boiling nanofluids. Chapter 3 studies the impact of nanoparticle layers created from

8
electrophoretic deposition of particles from nanofluids. Chapter 4 investigates the
electrical conductivity of non-aqueous nanofluids. Finally, Chapter 5 provides the
conclusions of this research and summarizes original contributions of the dissertation.
Further, several topics are proposed for future research.

9
Table 1.1. Review of nanofluid boiling literature
Author(s) Heating Surface Nanofluid Change in HTC Particle Deposition
Bang and Chang [20] 4 mm x 100 mm Al2O3/water Decrease, up to
20%
Yes
Das et al. [21] Different
roughness cartridge
heaters
Al2O3/water Decrease, 10-40% Yes
Jackson et al. [22] Cu block Au/water Decrease, up to
25%
Yes
Kathiravan et al. [23] Stainless steel (30
x 30 mm)
Cu/water Decrease, up to
75%
Yes
Kim et al. [24] stainless steel wire
(⌀0.38 mm)
Al2O3, ZrO2,
SiO2/water
Decrease Yes
Liu et al. [25] Cu bar (⌀20 mm) SiO2,
CuO/water
Decrease Yes
Milanova and Kumar
[26]
NiCr wire SiO2/water Decrease Yes/no, depends on
particle charge
Sajith et al. [27] NiCr wire (⌀0.19
mm)
Al2O3, Cu
/water
Decrease Yes
Chopkar et al. [28] Cu plate (⌀50.8
mm)
ZrO2/water Increase Yes
Coursey and Kim [29] Cu block Al2O3 Increase, up to
50%
Yes
Narayan et al. [30] Vertical stainless
steel tube
Al2O3 /water Increase, up to
70% Decrease, up
to 20%
Yes
Shi et al. [31] Cu bar (⌀60 mm) Al2O3 /water Increase, up to
60%
Yes
Taylor and Phelan [19] Wire (⌀0.26 mm) Al2O3 Increase, up to
40%
Yes
Truong [32] Stainless steel wire Al2O3 /water Increase, up to
68%
Yes
Tu et al. [33] Ti heater (26 x 40
mm)
Al2O3 /water Increase, up to
64%
Yes
Wen and Ding [34] Stainless steel disc
(⌀150 mm)
Al2O3 /water Increase, 40% Yes
Wen et al. [35] Stainless Steel disc
(⌀150 mm)
TiO2/water Increase, up to
50%
No
Witharana [36] Cu bar (⌀100 mm) Au, SiO2/water Increase Not studied
Kim et al. [37] Cu surface Al2O3 /water Negligible Yes
Kwark et al. [38] Cu block (1 x 1cm) Al2O3 /water Negligible/Slight
Degradation
Yes
Vasallo et al. [39] NiCr wire (⌀0.4
mm)
SiO2/water Negligible Yes
You et al. [40] Cu surface Al2O3 /water Negligible Not studied

10
Figure 1.1. (a) Boiling curve for water through four different boiling regimes as a function of
superheat and (b) visualization of the different boiling regimes. [5]

11
Figure 1.2. Al2O3/water based nanofluid.

12
References
[1] B.A Myers, ―Cooling Issues for Automotive Electronics,‖ Electronics Cooling, Volume 9, No
3 (2003)
[2] G.E. Moore, ―Cramming more components onto integrated circuits‖, Electronics, 38 (8)
(1965)
[3] T. Katoh, G. Xu, M. Vogel, and S. Novotny, ―New attempt of forced-air cooling for high heat
flux applications,‖ Applied Thermal Engineering, vol. 24, (2004) 1143–1156
[4] M.J. Ellsworth, ―Chip Power Density and Module Cooling Technology Projections for the
Current Decade,‖ Inter Society Conference on Thermal Phenomena, (2004) 707-708
[5] F. Kreith, M.S. Bohn, Principles of Heat Transfer, West Publishing Company 1993.
[6] I. Mudawar, T.M. Anderson, Parametric Investigation Into the Effects of Pressure,
Subcooling, Surface Augmentation and Choice of Coolant on Pool Boiling in the Design of
Cooling Systems for High-Power-Density Electronic Chips, Journal of Electronic Packaging,
112(4) (1990) 375-382.
[7] J. C. Maxwell, A Treatise on Electricity and Magnetism, 2nd ed. Oxford University Press:
Cambridge, U.K., 1904.
[8] S.U.S. Choi, J.A. Eastman, Enhancing thermal conductivity of fluids with nanoparticles, in:
ASME International Mechanical Engineering Congress and Exhibition, San Francisco, CA,
1995
[9] S. U. S Choi, and J.A. Eastman, 2001, ―Enhanced heat transfer using nanofluids,‖ US
Patent Number 6,221,275.
[10] S. U. S Choi, S. Li, W. Yu and L.J. Thompson, ―Anomalously increased effective
thermal conductivities of ethylene glycol-based nanofluids containing copper
nanoparticles,‖ Applied Physics Letters, vol. 78, no. 6, (2001) 718-720.
[11] S.U.S Choi, Z.G. Zhang, W. Yu, F.E. Lockwood and E.A. Grulke, ―Anomalous
thermal conductivity enhancement in nanotube suspensions,‖ Applied Physics Letters,
vol. 79 (2001) 2252-2254. [12] S. Ozerinc, S. Kakac, A.G. YazIcIoglu, Enhanced thermal conductivity of nanofluids: A
state-of-the-art review, Microfluidics and Nanofluidics, 8(2) (2009) 145-170.
[13] S. Lee, S.U.S. Choi, S. Li, J.A. Eastman, Measuring thermal conductivity of fluids
containing oxide nanoparticles, Journal of Heat Transfer, 121(2) (1999) 280-289.
[14] S.K. Das, N. Putra, P. Thiesen, W. Roetzel, Temperature dependence of thermal conductivity
enhancement for nanofluids, Journal of Heat Transfer, 125(4) (2003) 567-574.
[15] Eastman, J.A., Choi, S.U.S., Li S., Thompson L.J., and Lee S., 1997, ―Enhanced
thermal conductivity through development of nanofluids,‖ Materials II, ed. S
Komarnenl, JC Parker, HJ Wollenberger, p. 3. Pittsburgh: Materials Research Society. [16] J. Buongiorno; D. C. Venerus; N. Prabhat; T. McKrell; J. Townsend; R. Christianson; Y. V.
Tolmachev; P. Keblinski; L. W. Hu; J. L. Alvarado; I. C. Bang; S. W. Bishnoi; M. Bonetti; F.
Botz; A. Cecere; Y. Chang; G. Chen; H. S. Chen; S. J. Chung; M. K. Chyu; S. K. Das; R. Di
Paola; Y. L. Ding; F. Dubois; G. Dzido; J. Eapen; W. Escher; D. Funfschilling; Q. Galand; J.
W. Gao; P. E. Gharagozloo; K. E. Goodson; J. G. Gutierrez; H. P. Hong; M. Horton; K. S.
Hwang; C. S. Iorio; S. P. Jang; A. B. Jarzebski; Y. R. Jiang; L. W. Jin; S. Kabelac; A.
Kamath; M. A. Kedzierski; L. G. Kieng; C. Kim; J. H. Kim; S. Kim; S. H. Lee; K. C. Leong;
I. Manna; B. Michel; R. Ni; H. E. Patel; J. Philip; D. Poulikakos; C. Reynaud; R. Savino; P.
K. Singh; P. X. Song; T. Sundararajan; E. Timofeeva; T. Tritcak; A. N. Turanov; S. Van
Vaerenbergh; D. S. Wen; S. Witharana; C. Yang; W. H. Yeh; X. Z. Zhao; S. Q. Zhou, Journal
of Applied Physics 2009, 106, (9), 14.

13
[17] L. Godson, B. Raja, D. Mohan Lal, S. Wongwises, Enhancement of heat transfer using
nanofluids-An overview, Renewable and Sustainable Energy Reviews, 14(2) (2010) 629-641.
[18] D. Wen, G. Lin, S. Vafaei, K. Zhang, Review of nanofluids for heat transfer applications,
Particuology, 7(2) (2009) 141-150.
[19] R.A. Taylor, P.E. Phelan, Pool boiling of nanofluids: Comprehensive review of existing data
and limited new data, Int. J. Heat Mass Transfer, 52(23-24) (2009) 5339-5347. [40]
[20] I.C. Bang, S.H. Chang, W.-P. Baek, Direct observation of a liquid film under a vapor
environment in a pool boiling using a nanofluid, Appl. Phys. Lett., 86(13) (2005) 1-3.
[21] S.K. Das, G. Prakash Narayan, A.K. Baby, Survey on nucleate pool boiling of nanofluids:
The effect of particle size relative to roughness, J. Nanopart. Res., 10(7) (2008) 1099-1108.
[22] J.E. Jackson, B.V. Borgmeyer, C.A. Wilson, P. Cheng, J.E. Bryan, Characteristics of
nucleate boiling with gold nanoparticles in water, in, American Society of Mechanical
Engineers, Chicago, IL, United states, 2006.
[23] R. Kathiravan, R. Kumar, A. Gupta, R. Chandra, Preparation and pool boiling characteristics
of copper nanofluids over a flat plate heater, Int. J. Heat Mass Transfer, 53(9-10) (2010)
1673-1681.
[24] S.J. Kim, I.C. Bang, J. Buongiorno, L.W. Hu, Surface wettability change during pool boiling
of nanofluids and its effect on critical heat flux, Int. J. Heat Mass Transfer, 50(19-20) (2007)
4105-4116.
[25] Z.H. Liu, L. Liao, Sorption and agglutination phenomenon of nanofluids on a plain heating
surface during pool boiling, Int. J. Heat Mass Transfer, 51(9-10) (2008) 2593-2602.
[26] D. Milanova, R. Kumar, Role of ions in pool boiling heat transfer of pure and silica
nanofluids, Appl. Phys. Lett., 87(23) (2005) 1-3.
[27] V. Sajith, M.R. Madhusoodanan, C.B. Sobhan, An experimental investigation of the boiling
performance of water-based nanofluids, in, American Society of Mechanical Engineers,
Tainan, Taiwan, 2008, pp. 555-561.
[28] M. Chopkar, A. Das, I. Manna, P. Das, Pool boiling heat transfer characteristics of ZrO2–
water nanofluids from a flat surface in a pool, Heat Mass Transfer., 44(8) (2008) 999-1004.
[29] J.S. Coursey, J. Kim, Nanofluid boiling: The effect of surface wettability, Int. J. Heat Fluid
Flow, 29(6) (2008) 1577-1585.
[30] G.P. Narayan, K.B. Anoop, S.K. Das, Mechanism of enhancement/deterioration of boiling
heat transfer using stable nanoparticle suspensions over vertical tubes, J. Appl. Phys., 102
(2007).
[31] M.H. Shi, M.Q. Shuai, Z.Q. Chen, Q. Li, Y. Xuan, Study on pool boiling heat transfer of
nano-particle suspensions on plate surface, Journal of Enhanced Heat Transfer, 14(3) (2007)
223-231.
[32] B.H. Truong, Determination of pool boiling Critical Heat Flux enhancement in nanofluids,
in, American Society of Mechanical Engineers, Seattle, WA, United states, 2008, pp. 289-
299.
[33] J.P. Tu, N. Dinh, T. Theofanous, An experimental study of nanofluid boiling heat transfer,
in: Proceedings of 6th International Symposium on Heat Transfer, Beijing, China., 2004.
[34] D. Wen, Y. Ding, Experimental investigation into the pool boiling heat transfer of aqueous
based -alumina nanofluids, J. Nanopart. Res., 7(2-3) (2005) 265-274.
[35] D. Wen, Y. Ding, R.A. Williams, Pool boiling heat transfer of aqueous TiO2-based
nanofluids, Journal of Enhanced Heat Transfer, 13(3) (2006) 231-244.
[36] S. Witharna, Boiling of Refrigerants on Enhanced Surfaces and Boiling Nanofluids, Royal
Institute of Technology, Stockholm, Sweden., 2003.
[37] J.H. Kim, K.H. Kim, S.M. You, Pool boiling heat transfer in saturated nanofluids, in,
American Society of Mechanical Engineers, Anaheim, CA, United states, 2004, pp. 621-628.
[38] S.M. Kwark, R. Kumar, G. Moreno, J. Yoo, S.M. You, Pool boiling characteristics of low
concentration nanofluids, Int. J. Heat Mass Transfer, 53(5-6) (2009) 972-981.

14
[39] P. Vassallo, R. Kumar, S. D'Amico, Pool boiling heat transfer experiments in silica-water
nano-fluids, Int. J. Heat Mass Transfer, 47(2) (2004) 407-411.
[40] S.M. You, J.H. Kim, K.H. Kim, Effect of nanoparticles on critical heat flux of water in pool
boiling heat transfer, Appl. Phys. Lett., 83(16) (2003) 3374-3376.
[41] S. Ganguly, S. Sikdar, S. Basu, Experimental investigation of the effective electrical
conductivity of aluminum oxide nanofluids, Powder Technol., 196(3) (2009) 326-330.
[42] K.F.V. Wong, T. Kurma, Transport properties of alumina nanofluids, Nanotechnology,
19(34) (2008) 345702 (345708 pp.).
[43] M.O. Lisunova, N.I. Lebovka, O.V. Melezhyk, Y.P. Boiko, Stability of the aqueous
suspensions of nanotubes in the presence of nonionic surfactant, J. Colloid Interface Sci.,
299(2) (2006) 740-746.
[44] R.C.D. Cruz, J. Reinshagen, R. Oberacker, A.M. Segadaes, M.J. Hoffmann, Electrical
conductivity and stability of concentrated aqueous alumina suspensions, J. Colloid Interface
Sci., 286(2) (2005) 579-588

15
CHAPTER 2
EFFECTS OF NANOPARTICLE LAYERING ON NANOFLUID AND BASE
FLUID POOL BOILING HEAT TRANSFER FROM A HORIZONTAL SURFACE
UNDER ATMOSPHERIC PRESSURE
ABSTRACT
Previous heat transfer studies of nanofluids have shown that suspended
nanoparticles can affect thermal properties within a fluid and furthermore can affect
surface roughness by depositing on a heater surface. Pool boiling studies of nanofluids
have demonstrated either enhanced or diminished heat transfer, yet have been unable to
distinguish the contributions of increased surface roughness and suppression of bubble
transport by suspended particles, because they have used base fluids on a clean boiling
surface as a comparison. We resolve this uncertainty by studying the boiling performance
of a surface exposed to a series of boiling tests that alternate between water and a water-
based nanofluid with suspended 40 nm ZnO nanoparticles. We find that the performance
for the water tests increases significantly, showing a 62% enhancement after four cycles.
This increase correlates well with a surface roughness model for boiling that uses AFM-
measured surface data to quantify the layering of nanoparticles in intervening nanofluid
boiling tests. We find that the performance of the ZnO nanofluid initially shows a 24%
enhancement versus water on a clean (unroughened) surface, but then steadily declines in
later tests as nanoparticle layering occurs, showing a measured trend that is opposite that
of water. We ascribe this decrease to the suppression of bubble formation and motion by
the suspended particles. The results demonstrate that the effect of increased surface

16
roughness due to nanoparticle layering can be twofold, greatly enhancing boiling for the
base fluid and slightly decreasing performance for the nanofluid.
2.1 INTRODUCTION
Boiling heat transfer is important to applications such as power electronics
cooling, enabling high performance thermal management systems such as
thermosyphons, heat pipes, and spray cooling. The boiling performance of a system is
affected by the properties of the fluid, such as the thermal conductivity, surface tension,
and density; the properties of the boiling surface, such as the material, geometry,
orientation, wettability, and surface roughness; the properties of the system, such as
system pressure; the fluid-surface interaction; and the mechanisms of bubble growth,
departure, and movement [1]. Previous research has aimed to enhance boiling by
manipulating the fluid and the surface.
One method that has been proposed to increase fluid heat transfer performance is
using nanoparticle suspensions known as nanofluids, which have demonstrated improved
thermal conductivity [2-8] and forced convection heat transfer coefficient [9,10]
compared to the base fluid. However, in boiling studies, prior results have been
inconclusive regarding whether measured enhancements in boiling coefficient are due to
surface roughening caused by nanoparticle layering or the effect of nanoparticle motion
on bubble nucleation and transport.
It is well known that surface microstructure can heavily influence boiling
properties [1]. Microporous coatings [11,12], modulated surfaces [13], and fabricated
microstructures [14] have all been used to enhance boiling. It has also been shown that
suspended particles may obstruct bubble movement and liquid stirring, leading to a

17
reduction in boiling performance [15]. These two processes in nanofluid boiling may
therefore have opposite effects on the boiling coefficient, as supported by previous
studies in which boiling performance initially increases and then decreases as the volume
fraction of suspended particles increases [15-17].
Several studies have investigated the boiling of nanofluids on a heated wire and
attributed the measured increase in boiling performance to the increase in surface
roughness caused by the attachment of the nanoparticles to the wire [18,19]. Kim et al.
[20] ascribed measured increases in the critical heat flux to an improved surface
wettability caused by the layering of nanoparticles, but also measured a decrease in
nucleate boiling coefficient that they attributed to surface effects. For nanofluid boiling
on cylindrical and flat surfaces, results have been conflicting. Several researchers have
measured an increase in boiling heat transfer using nanofluids [21-23], while others have
seen a deterioration of performance [24,25]. Narayan et al. [26] measured a decrease in
performance for smooth surfaces (Ra=48 nm) and an increase in performance for rough
surfaces (Ra=524 nm). In an attempt to reconcile these conflicting measurements, they
introduced a surface interaction parameter defined as the ratio of the surface roughness to
the particle size, and correlated this parameter with measured boiling performance. Das
et al. [26,27] also applied this surface interaction parameter to their data as well as other
data reported in the literature. They theorized that the number of nucleation sites is
reduced if the roughness of the surface is close to the particle diameter, and increased if
the size ratio is larger.
Previous studies, such as those outlined above, have used base fluids on a clean
surface as a comparison when investigating nanofluid boiling. Because of this, they have

18
been unable to distinguish the potential contributions of nanoparticle layering on the
boiling surface from the potential suppression of bubble nucleation and motion by
suspended particles.
In this study, we use a series of boiling tests that alternate between water and a
water-based nanofluid to resolve existing uncertainties regarding competing physical
mechanisms in nanofluid boiling. By comparing the performance of water and nanofluid
boiling on the same roughened surface, we are able to separate the effect of suspended
particles from the effect of surface roughness. We use surface roughness data measured
by atomic force microscopy (AFM) in conjunction with a surface roughness correlation
model to explain measured improvements in boiling coefficient of water for successive
layering of nanoparticles on the boiling surface.
2.2 EXPERIMENTAL SETUP
This section provides details regarding the nanofluids used in the experiments, the
design of the test apparatus, and the AFM imaging used to analyze the boiling surface.
2.2.1 Nanofluid Preparation
We used deionized (DI) water-based nanofluids with 40nm diameter ZnO
nanoparticles. The volume fraction of the ZnO nanoparticles was 2.3%, and the
nanofluids contained no dispersant; they were prepared by Nanophase Technologies
(Romeoville, IL). The particles have a specific surface area of 33 m2/g and a crystal
phase of zincite (hexagonal) with an elongated morphology.

19
2.2.2 Boiling Apparatus
The system, as shown in Figure 2.1, consists of a heated surface where boiling
occurs, a housing to contain the fluid, and a condensing section. The heat source is a
half-sheath, chrome-steel disc heater with a diameter of 82.6 mm and power of 600 W
(~120 kW/m2). The heater is controlled by a Staco Energy Products Co. (Dayton, OH) 0-
120 V, 10 A, variable AC power supply. The heater is mated to a Grade 316L stainless
steel disc, 82.6 mm in diameter and 12.7 mm thick, using DOW Corning® 340 silicone
heat sink compound to improve heat transfer across the interface. This assembly is
embedded in a thermal insulator housing composed of polytetrafluoroethylene (PTFE)
114.3 mm in diameter and 114.3 mm thick. This PTFE housing is packed with glass
wool insulation. The working fluid is contained in a polycarbonate housing that has a
chamber 88.9 mm in diameter and 114.3 mm tall. During the experiments the vapor
condensed onto the surface of an aluminum chamber at the top. The temperature of the
boiling surface was extrapolated from the measurements of 3 type-T thermocouples
embedded 6.35 mm below the surface and the heat flux into the system. The saturation
temperature was measured in the fluid using a type-T thermocouple suspended from the
condenser. This configuration is similar to that used by Wen and Ding [23]. The
instrumentation was interfaced with a National Instruments CompactDAQ data
acquisition system with LabVIEW 8.20 software.
2.3 EXPERIMENTAL PROCEDURE
2.3.1 ZnO layering study
For the boiling tests, heat fluxes of 24, 28, and 32 kW/m2 were used by setting the
input voltage to 60, 65, and 70 V. The system was allowed to reach steady state, defined

20
as when the surface temperature did not change by more than 0.1°C for 20 minutes. First
water was boiled on a clean surface until it reached steady state (approximately 45
minutes). The water was then removed and the ZnO nanofluid was boiled until it also
reached steady state (approximately 45 minutes). The ZnO nanofluid was drained, and
then without cleaning the surface of deposited nanoparticles, fresh DI water was used as
the boiling fluid. This process was repeated to create four layers of ZnO on the boiling
surface, with measurement of the boiling coefficient taken during each boiling event.
The cycling study is described in Table 2.1.
2.3.2 Scanning electron microscopy (SEM) and atomic force microscopy (AFM) of
nanoparticle layers
To investigate the heated surface after each boiling cycle, 12.7 x 25.4 x 3.2 mm
stainless steel tabs were fitted to the stainless steel boiling surface using 2.8 mm bolts.
After each cycle, one tab was removed and replaced by a new clean tab. The tabs were
removed in a sequential order, numbered accordingly, and then imaged using a Hitachi S-
4800 Field Emission SEM at 3,000x and 100,000x magnification. To measure the
surface roughness of each tab, a Molecular Imaging PicoLE Scanning Probe Microscope
with an AFM head and Molecular Imaging PicoScan software was used. The tapping
mode was used to image the surface topography over a 5 m x 5 m area. The average
surface roughness, Ra was calculated using Gwyddion 2.16 data visualization and
analysis software. AFM malfunction prevented the measurement of surface roughness
for the sample from Test 5.
2.4 BOILING PERFORMANCE CHARACTERIZATION
This section provides details on the analysis and uncertainty used to calibrate the system

21
and compare different tests.
2.4.1 Analysis
The heat flux at the heated surface, q, was calculated from the measured total heat
into the system, Q, and the heated area, A. The power input, Q=V2/R, was calculated
from the applied voltage, V, and resistance, R, of the heater. The heat flux is given by:
RA
Vq
2
(2.1)
where is the fraction of energy that reaches the heated surface after accounting for
losses to the environment. The superheat, sT , is the difference between the measured
saturation temperature, Tsat, and the boiling surface temperature, Tw, which was
extrapolated from the heat flux, q, and the temperature, Tm, measured by the
thermocouple a distance of l = 6.35 mm below the boiling surface:
satws TTT (2.2)
kqlTT mw /
(2.3)
where k = 17 W/mK is the thermal conductivity of stainless steel. The boiling coefficient,
h, was used to characterize the boiling:
q
Th s
(2.4)
For pure water undergoing nucleate pool boiling, Rohsenow [28] developed the
relationship:

22
31
Pr
vfg
sfs
fg
satwp
gh
qC
h
TTc
(2.5)
where cp is the fluid’s specific heat, hfg is the latent heat of vaporization, μ is the fluid
viscosity, Pr is the Prandtl Number defined as kcpPr , k is the fluid thermal
conductivity, σ is the fluid surface tension, ρ is the fluid density, ρv is the vapor density,
and g is the acceleration due to gravity. For a stainless steel surface and water [1], the
fluid surface interaction constants are Csf= 0.013 and s = 1. This relationship was used in
a calibration measurement to determine the value of η for the test apparatus. Figure 2.2
shows the Rohsenow correlation and experimental data for DI water for the test apparatus.
Least-squares analysis was used find the value of η that minimized the error between the
experimental results and the Rohsenow correlation, yielding η = 0.83.
2.4.2 Uncertainty
To quantify the uncertainty associated with the measured heat flux, superheat, and
boiling coefficient, the sum of squares method was used. The uncertainty uq of the heat
flux q as described in Eq. (2.1) can be written as:
222
ARVq u
A
qu
R
qu
V
qu
(2.6)
where uV is the uncertainty of V, uR is the uncertainty of R, and uA is the uncertainty of A.
The error associated with the voltage measurement was ±0.2 V. The resistance of the
heater was measured to be 24 ± 2% over the temperature range of this study. The
diameter of the stainless steel disk was machined to 82.6 ±0.03 mm; therefore the area of

23
the disk is 6207 ±4 mm2. Using Eq. (2.6), the maximum heat flux uncertainty uq/q was
calculated to be less than 3%.
The uncertainty of the superheat, sT , as defined in Eq. (2.2) is us:
22222
satiw T
m
sq
sL
i
sk
sT
m
ss u
T
Tu
q
Tu
L
Tu
k
Tu
T
Tu
(2.7)
where uTw is the uncertainty of Tw, uTsat is the uncertainty of Tsat, uk is the uncertainty of k,
and uLi is the uncertainty of Li. The error due to the thermocouple measurements was
calculated by using the sum of squares method with the design stage uncertainty and the
measurement uncertainty. The design stage uncertainty was 0.1 K and the measurement
uncertainty was calculated as twice the standard deviation of the temperature
measurements (typically ≤ 0.1 K). The thermal conductivity of stainless steel was
assumed constant over the temperature range of the disk. The distance between the
thermocouple and the heater surface had an uncertainty of ±0.03 mm. Using Eq. (2.7),
the maximum superheat uncertainty us/ΔTs was calculated to be less than 3%.
The uncertainty of the boiling coefficient, uh, can be written as:
22
qs
s
h uq
hu
T
hu
(2.8)
The maximum boiling coefficient uncertainty uh/h was calculated to be less than 10%.

24
2.5 BOILING PERFORMANCE RESULTS
First we compare the boiling performance of the ZnO nanofluid (Test 1) and
water on a clean surface (Test 0). Figure 2.3 shows the demonstrated enhancements of the
nanofluid, for which the boiling coefficient is increased over that of water by 24.8%,
16.1%, and 17.7% at input heat fluxes of 24, 28, and 32 kW/m2, respectively. Based on
the analysis below, we ascribe these increases to the enhanced thermal properties of the
nanofluid, such as the thermal conductivity, rather than the surface roughness produced
by nanoparticle layering.
Next we examine the boiling performance of water on a surface that has been
successively modified by intervening cycles of nanofluid boiling. Figure 2.4 shows the
measured increases in boiling coefficient (h) for each input heat flux as ZnO
nanoparticles are successively coated over a number of trials. After the first coating,
there is little increase of h from the baseline (Test 0), but a trend of increasing h becomes
apparent in later cycles as more layers of ZnO particles build up on the surface. A 62%
increase in the boiling coefficient for water from the first to the last cycle is measured. In
the next section we analyze the origins of this increase by examining the effect of
successive ZnO nanoparticle layers on surface roughness.
The boiling performance of ZnO nanofluids is also compared for successive tests.
Figure 2.5 shows an initial measured increase in h for all heat fluxes when compared to
the baseline (Test 0) of water on a clean surface, as mentioned above. The performance
then slightly decreases and remains nearly constant for each additional cycle of nanofluid
boiling. The origin of this behavior is discussed below in the context of the coating of the
surface.

25
2.6 SEM AND AFM INVESTIGATION OF BOILING SURFACE AND
DISCUSSION
Scanning electron microscopy (SEM) images of the sample surface after each of
the four nanofluid boiling tests are shown in Figure 2.6. The first image, taken after Test
1, shows a layer of ZnO nanoparticles that does not completely cover the surface, with
islands of nanoparticle coverage visible in the 3,000x image (circled in red). We ascribe
the relatively small change in boiling coefficient relative to the baseline measured for
Test 2 (see Figure 2.4) to this incomplete coverage. Later nanofluid boiling tests yield a
completely coated surface, with the 100,000x SEM images showing that the
nanoparticles have a similar size distribution on the surface. For these surfaces, we see
significantly increased boiling performance.
To explain this measured increase in water boiling performance, we use AFM to
quantify the surface topography. Figure 2.7 shows AFM images of the sample surface
after several nanofluid boiling tests, from which the surface roughness parameter, Ra, was
determined. The arithmetic average roughness grew after each successive nanofluid
boiling test, increasing from an initial value of 0.06 m for the baseline (Test 0) to 0.44
m after the final test.
Gorenflo developed a correlation [29] of boiling coefficient based on the reduced
pressure of the fluid and roughness of the boiling surface:
133.0
000 // aa
n
PFb RRqqFhh (2.9)
where h0 is the fluid specific heat transfer coefficient, q0 is the fixed reference conditions
for the heat flux, and Ra0 is the reference value for the surface roughness. The pressure

26
correction factor, FPF, and the heat flux exponent, n, are functions of the reduced pressure,
pr. This equation is valid for 0.005 ≤ pr ≤ 0.95.
A normalized boiling coefficient,bh , can be defined for water on each
nanoparticle-roughened surface at each heat flux by dividing by the boiling coefficient of
water on the initial clean (Test 0, i.e. unroughened) surface at the same heat flux. Here we
note an important advantage of our measurement: because we use water in each case, h0
is expected to remain constant and thus cancel out in this normalization. Previous studies,
which compare nanofluid boiling on roughened surfaces to base fluid boiling on clean
surfaces, are unable to distinguish the effects of the suspended nanoparticles on surface
roughness (Ra) and fluid specific heat transfer coefficient (h0).
We therefore adapt the Gorenflo correlation to yield:
133.0/ cleanaa
cleanb
bb RR
h
hh
(2.10)
where hb-clean is the boiling coefficient of water on the clean surface and Ra-clean is the
surface roughness of the initial clean (Test 0) surface. Figure 2.8 compares the measured
data for the normalized boiling coefficient of water (averaged for the three different heat
fluxes) to the prediction of Eq. (2.10).
The model accounting for surface roughness somewhat under-predicts the
measured enhancements in boiling coefficient, but still falls within the experimental error.
We note that the model does not account for effects such as nanoparticle layer porosity,
which is expected to contribute to boiling coefficient enhancement. The model also does
not account for the finite thermal conductance of the ZnO nanoparticle layer, which may
yield an effective surface temperature that is slightly lower than that extrapolated using

27
Eq. (2.3). Finally, the model does not account for the fluidization of surface-layered
nanoparticles, which may occur during water boiling.
For comparison purposes, we also calculate the averaged normalized boiling
coefficient of the ZnO nanofluid. As for the water, we divide the measured boiling
coefficient at each heat flux by the boiling coefficient of water on the initial clean (Test 0)
surface at the same heat flux. As shown in Figure 2.8, we measure an increase in boiling
coefficient of 24% for the incompletely covered surface (Test 1), and then a slight
decrease for later tests with a completely coated surface. This suggests that the initial
increase is independent of surface roughness and due to thermal properties of the
nanofluid, such as increased thermal conductivity, which has been measured for ZnO
nanofluids [6]. A portion of the increase could also be due to the disruption of the
thermal boundary layer by suspended nanoparticles [15].
For later nanofluid boiling tests, the interaction of the nanoparticles with the
coating counteracts not only the enhanced thermal properties of the nanofluid but also the
mechanism of enhanced boiling coefficient seen for the water in Tests 2, 4, 6, and 8 (see
Figure 2.4). Noting the relatively high volume fraction of the nanofluids and the
horizontal flat boiling surface geometry, we attribute this reduced performance for the
fully coated surface to the blocking of bubble transport and liquid stirring by the particles
in suspension, as described by Iida et al. [15] for fluidized beds.
Note that an alternative formulation of the normalized boiling coefficient for the
nanofluid could divide measured data by the Test 1 value (rather than Test 0) in order to
isolate the effect of the surface/nanofluid interaction for different surface roughnesses.
This alternative formulation would simply move the curve down in Figure 2.8 and not

28
change the trend of reduced performance for increasing surface roughness. We choose
the Test 0 normalization in order to present water and nanofluid data on a common basis.
2.7 CONCLUSIONS
The boiling performance of a heated surface exposed to a series of boiling tests
that alternate between water and a water-based nanofluid with suspended ZnO
nanoparticles has been studied. The creation of a nanoparticle layer on the heated surface
is shown to dramatically increase the boiling performance of water and correlate well
with a model that uses AFM-measured surface roughness data. Nanofluid boiling
performance is shown to increase initially (compared to water) before the deposited
nanoparticle layer is completely formed; we attribute this increase to enhanced thermal
properties of the nanofluid. After the nanoparticle layer fully covers the heater surface,
the nanofluid boiling coefficient declines, which we ascribe to a suppression of bubble
nucleation and transport by the suspended nanoparticles.
Acknowledgements
This research was supported by a General Motors Discovery Project and the U.S.
Department of Energy through Oak Ridge National Laboratory (managed by UT-Battelle
LLC). The authors wish to acknowledge the support and leadership of Dr. Simon Tung,
Dr. Nidia Gallego, and Dr. David Stinton. The authors would further like to thank Kwang
Hyup An, Chris Welch, and Ben Hagan for their assistance, and Nanophase Technologies
Corp. for furnishment of nanofluids.

29
Table 2.1. Cyclic Boiling Experiment Order
Test No. Fluid Boiled
0 DI water (baseline)
1 ZnO nanofluid
2 DI water
3 ZnO nanofluid
4 DI water
5 ZnO nanofluid
6 DI water
7 ZnO nanofluid
8 DI water

30
Figure 2.1. Picture of boiling system and schematic of heat source.

31
Figure 2.2. Calibration data for water compared to the Rohsenow [28] correlation showing good
agreement with a heat transfer efficiency η=0.83.

32
Figure 2.3. Experimental data showing that ZnO nanofluids have a larger boiling coefficient at the
same heat flux when compared to the boiling of water on the same clean (unroughened) surface.

33
Figure 2.4. Experimental data showing that for each heat flux into the system (24, 28, and 32 kW/m
2)
the boiling coefficient of water increases with successive coatings of ZnO nanoparticles.

34
Figure 2.5. Experimental data showing that at each heat flux into the system (24, 28, and 32 kW/m
2)
the boiling coefficient of the ZnO nanofluid initially increases from the value for water on a clean
surface (Test 0) then remains nearly constant after successive coatings of ZnO nanoparticles.

35
Figure 2.6. SEM images of deposited ZnO nanoparticle layer on stainless steel heater surface after
the referenced boiling test. Test 1 yields incomplete surface coverage, while subsequent nanofluid
boiling tests yield full coverage.

36
Figure 2.7. AFM images of heater surface samples after the referenced boiling test, showing
increasing surface roughness.

37
Figure 2.8. Comparison of normalized experimental data for water and ZnO nanofluid to the
normalized Gorenflo [29] model which accounts for surface roughness. Water boiling tests show
significantly increasing performance due to increasing surface roughness, while nanofluids show
moderately decreasing performance that we ascribe to suppression of bubble transport by suspended
nanoparticles.

38
References
[1] F.P. Incoprera, D.P. DeWitt, Introduction to Heat Transfer, John Wiley & Sons, 2007.
[2] Y. Xuan, Q. Li, Heat transfer enhancement of nanofluids, Int. J. Heat & Flow, 21(1) (2000)
58-64.
[3] S.U.S. Choi, S. Li, W. Yu, L.J. Thompson, Anomalously increased effective thermal
conductivities of ethylene glycol-based nanofluids containing copper nanoparticles, Appl.
Phys. Lett., 78(6) (2001) 718-720.
[4] D. Wen, Y. Ding, Effective Thermal Conductivity of Aqueous Suspensions of Carbon
Nanotubes (Carbon Nanotube Nanofluids), J. Thermophys Heat Transfer, 18(4) (2004).
[5] T.K. Hong, H.S. Yang, C.J. Choi, Study of the enhanced thermal conductivity of Fe
nanofluids, J. Appl. Phys., 97 (2005) 64311.
[6] S.H. Kim, S.R. Choi, D. Kim, Thermal Conductivity of Metal-Oxide Nanofluids: Particle Size
Dependence and Effect of Laser Irradiation, J. Heat Transfer, 129(3) (2007) 298-307.
[7] J. Garg, B. Poudel, M. Chiesa, J.B. Gordon, J.J. Ma, J.B. Wang, Z.F. Ren, Y.T. Kang, H.
Ohtani, J. Nanda, G.H. McKinley, G. Chen, Enhanced thermal conductivity and viscosity of
copper nanoparticles in ethylene glycol nanofluid, J. Appl. Phys., 103 (2008) 074301.
[8] E.V. Timofeeva, J.L. Routbort, D. Singh, Particle shape effects on thermophysical properties
of alumina nanofluids, J. Appl. Phys., 106 (2009) 014304
[9] Y. Xuan, Q. Li, Investigation on Convective Heat Transfer and Flow Features of Nanofluids,
J. Heat Transfer, 125 (2003) 151-155.
[10] S.Z. Heris, S.G. Etemad, M.N. Esfahany, Experimental investigation of oxide nanofluids
laminar flow convective heat transfer, International Communications in Heat and Mass
Transfer, 33 (2006) 529–535.
[11] J.H. Kim, K.N. Rainey, S.M. You, J.Y. Pak, Mechanism of nucleate boiling heat transfer
enhancement from microporous surfaces in saturated FC-72, J. Heat Transfer, 121 (2002)
500-506.
[12] K.N. Rainey, S.M. You, Effects of heater size and orientation on pool boiling heat transfer
from microporous coated surfaces, International Journal of Mass and Heat Transfer, 44
(2001) 2589-2599.
[13] S.G. Liter, M. Kaviany, Pool-boiling CHF enhancement by modulated porous-layer coating:
theory and experiment, International Journal of Mass and Heat Transfer, 44 (2001) 4287-
4311.
[14] L. Zhang, E.N. Wang, J.M. Koo, L. Jiang, K.E. Goodson, J.G. Santiago, T.W. Kenny,
Enhanced nucleate boiling in microchannels, Proceedings of the IEEE Micro Electro
Mechanical Systems, (2002) 89-92
[15] Y. Iida, T. Tsuyuki, T. Mashima, T. Takashima, K. Okuyama, Augmentation of Boiling Heat
Transfer from Horizontal Cylinder to Liquid by Movable Particles, Heat Transfer—Asian
Research, 31 (2002) 28-41.
[16] M. Shi, Y. Zhao, Z. Liu, Study on boiling heat transfer in liquid saturated particle bed and
fluidized bed, International Journal of Heat and Mass Transfer, 46 (2003) 4695–4702.
[17] R. Kathiravan, R. Kumar, A. Gupta, R. Chandra, Characterization and Pool Boiling Heat
Transfer Studies of Nanofluids, Journal of Heat Transfer, 131 (2009).
[18] D. Milanova, R. Kumar, Heat Transfer Behavior of Silica Nanoparticles in Pool Boiling
Experiment J. Heat Transfer, 130 (2008).
[19] H. Kim, M. Kim, Experimental study of the characteristics and mechanism of pool boiling
CHF enhancement using nanofluids, Heat Mass Transfer, 45 (2009) 991–998.
[20] S.J. Kim, I.C. Bang, J. Buongiorn, L.W.Hu, Study of pool boiling and critical heat flux
enhancement in nanofluids, Bull. Pol. Ac.: Tech., 55(2) (2007) 211-216.
[21] J.P. Tu, N. Dinh, T. Theofanous, An experimental study of nanofluid boiling heat transfer,
in: Proceedings of 6th International Symposium on Heat Transfer, Beijing, China., 2004.

39
[22] S. Witharna, Boiling of Refrigerants on Enhanced Surfaces and Boiling Nanofluids, Royal
Institute of Technology, Stockholm, Sweden., 2003.
[23] D. Wen, Y. Ding, Experimental investigation into the pool boiling heat transfer of aqueous
based gamma-alumina nanofluids, J. Nanopart. Res., 7 (2005) 265-274.
[24] S.K. Das, N. Putra, W. Roetzel, Pool boiling characteristics of nano-fluids, Int. J. Heat Mass
Transf. , 46 (2003) 851–862.
[25] S.K. Das, N. Putra, W. Roetzel, Pool boiling of nano-fluids on horizontal narrow tubes, Int.
J. Multiphase Flow, 29 (2003) 1237–1247.
[26] G.P. Narayan, K.B. Anoop, S.K. Das, Mechanism of enhancement/deterioration of boiling
heat transfer using stable nanoparticle suspensions over vertical tubes, J. Appl. Phys., 102
(2007).
[27] S.K. Das, G.P. Narayan, A.K. Baby, Survey on nucleate pool boiling of nanofluids: the effect
of particle size relative to roughness, J Nanopart Res 10 (2008) 1099–1108.
[28] W.M. Rohsenow, A method of correlating heat transfer data for surface boiling liquids,
Trans. ASME 74 (1952) 969-979.
[29] A. Bejan, A.D. Kraus, Heat transfer handbook, John Wiley, Hoboken, NJ, 2003.

40
CHAPTER 3
BOILING SURFACE ENHANCEMENT BY ELECTROPHORETIC
DEPOSITION OF PARTICLES FROM A NANOFLUID
ABSTRACT
Boiling heat transfer can be enhanced with a variety of surface treatments. One
method that has not been widely studied is electrophoretic deposition of nanoparticles
from a nanofluid. A stainless steel surface was coated using electrophoretic deposition of
40 nm ZnO particles from a ZnO-propylene glycol based nanofluid. With adequate
coating time, such a surface modification method can increase the boiling heat transfer
coefficient by about 200%. A surface with improved performance had an increase of
active nucleation site density by 2.9 times as determined by the Mikic-Rohsenow
Correlation. This was supported using an analysis of the cavities present in a SEM image
of the surfaces which showed a 2.4 times increase in cavities.
3.1 INTRODUCTION
Boiling heat transfer (BHT) is the basis for thermal management in several
industries including refrigeration, power systems and electronics. Among a number of
strategies to enhance boiling heat transfer, surface modification has proven to be an
attractive means to improve the boiling heat transfer coefficient (HTC). Increases of
100% or more in HTC have been demonstrated by simply roughening the surface [1] and
through the use of microscale pin fins [2-4], microporous coatings [3], microchannels [5],
and micro-drilling of nucleation cavities [6]. Nanoscale surface modification through the
41
growth of carbon nanotubes [7] and nanorods [8] have demonstrated HTC improvements
of 450% and 3000% respectively, while combinations of micromachining and carbon
nanotube growth have demonstrated improvements of nearly 900% [9].
Although nanostructuring or microstructuring of a boiling surface has been shown
to lead to large improvements in performance, in practice the methods used to fabricate
such surface structures (e.g. chemical vapor deposition or micromachining) are often
inconvenient or expensive. Surface treatments utilizing nanofluids offer a potentially
convenient means for surface modification; a number of studies have investigated the
boiling of nanofluids as a means to coat a surface with nanoparticles for enhanced HTC
or critical heat flux [10, 11]. However, results of this method have been mixed [12]
presumably due to the fact that the deposition process during boiling is not well
understood and difficult to control.
Electrophoretic deposition (EPD), on the other hand, is used in a variety of
industrial applications, including automotive and appliance coatings, and can be
implemented with a high level of automation [13]. In this process, charged particles are
attracted to a conducting surface due to an applied electric field. EPD coatings adhere
better at high densities than dipped or sprayed coatings, and EPD process parameters
such as voltage and duration are relatively simple to control.
Recognizing that nanoparticles in suspension (nanofluids) have a surface charge,
several previous studies have examined the EPD coating of surfaces with Al2O3 [11],
TiO2 [14], and ZnO [15] nanoparticles. However, heat transfer measurements have shown
only marginal improvements due to poor coverage or low adherence of the coating.

42
Here we explore the use of high particle volume fraction nanofluids in EPD
coating as a means to overcome the coverage and adherence difficulties associated with
prior nanofluid EPD studies and demonstrate a significant improvement in boiling
performance. An electric field is applied to coat stainless steel (SS) surfaces with ZnO
nanoparticles using propylene glycol (PG) based nanofluids to create enhanced boiling
surfaces. The surface roughness and contact angle of the surfaces are compared and the
surfaces investigated using SEM. The improved performance of the EPD-deposited
surface is shown to be related to the increase in the nucleation site density, which is
estimated using both the Mikic-Rohsenow correlation and SEM image analysis of the
surface.
3.2 EXPERIMENTAL METHOD
3.2.1 Nanofluid preparation and characterization
PG-based nanofluids were prepared by Nanophase Technologies (Romeoville, IL)
with 40 nm diameter ZnO nanoparticles at 7% volume fraction with no dispersants. The
particles had a specific surface area of 33 m2/g and a crystal phase of zincite (hexagonal)
with an elongated morphology. The zeta potential was measured to be 48.6 ± 0.1 mV
using a Brookhaven Instruments (Holtsville, NY) ZetaPlus Zeta Potential Analyzer.
3.2.2 Coating procedure
1 inch diameter disks made from 20 gauge 304 SS were used as boiling surfaces.
To create a consistent surface finish after the machining process, the disk surfaces were
roughened with 400 ANSI grit sandpaper. Two SS disks acting as electrodes were
separated by a 6.4 mm Teflon spacer and connected through wires to a 0-30V DC power

43
supply (B&K Precision, Yorba Linda, CA, Model 1660). Since a positive zeta potential
was measured for the particles, the negative voltage terminal was attached to the surface
to be coated. The electrode assembly was submerged in the nanofluid for a given amount
of time while voltage was applied (see Fig. 3.1). Four samples (denoted as Surfaces #1 to
#4) were coated by applying a voltage of 20 V for a range of times, as summarized in
Table 3.1. The applied voltages and times were similar to those given in Santillan et al.
[14] and Miao et al. [15] in which coatings were created, but the boiling performance was
not studied. Coated samples were allowed to dry for a 24 hour period before boiling
tests.
3.2.3 Boiling characterization
Experiments were conducted in an atmospheric pressure boiling test apparatus
(Fig. 3.2) consisting of heating, evaporating, and condensing sections. One-dimensional
heat flow was provided to the boiling surface through a 1 inch diameter, 10 inch long
copper rod with an embedded cartridge heater (Fast Heat Inc., Elmhurst, IL) that was
controlled by a variable AC power supply (Staco Energy Products, Inc., Dayton, OH).
To limit radial heat losses, the copper rod was encased by a 2.5 inch diameter, 10 inch
long polytetrafluoroethylene (PTFE) cylinder. The PTFE insulator had a 4 inch diameter,
1 inch thick shoulder with a groove for an O-ring, which was used to create a seal
between the heating and evaporating sections. The coated samples were mounted to the
end of the copper rod using a fastener.
The evaporating section consisted of a 200 ml transparent polycarbonate housing
that was bolted to the PTFE heating section and sealed with an O-ring. The condensing
section had a water-cooled aluminum finned condenser bolted and sealed at the top of the
44
fluid housing. The condenser had an opening to allow for a thermocouple and to vent the
system to atmospheric pressure.
The temperature of the heat source was calculated using values measured by three
type-E thermocouples (Omega Engineering, Inc., Stanford, CT, Model SA1-E-SRTC)
that were spaced 0.75 inches apart axially, with the top thermocouple located 1.75 inches
below the top (sample) surface. Temperatures were recorded (using an Omega OMB-
DAQ-56 data acquisition system) until the system reached steady state, which was
defined as a change of less than 0.2 K in a 20 minute period. This was typically achieved
in approximately 45 minutes. Once at steady state, temperatures were recorded for an
additional 10 minutes. A type-T thermocouple (Omega Model TQSS-18G-6) was
suspended from the condensing section to monitor the vapor temperature. The heat flux
and surface temperature were calculated from the temperature measurements.
Deionized (DI) water was used as the working fluid. The boiling performances of
Surfaces #1 - #3 were measured at a heat flux of 181 kW/m2. The boiling performance of
the baseline surface and Surface #4 were measured over a range of 160-240 kW/m2. The
experiment was performed twice for each surface: once after the surface was coated (―1st
run‖) and afterwards with fresh DI water (―2nd
run‖). Surfaces were not cleaned between
these tests.
3.2.4 Calculation of heat flux and measurement uncertainty
The heat flux (q) of the system is defined as:
𝑞 = −𝑘𝑑𝑇
𝑑𝑥= 𝑘
𝑇3−𝑇1
𝐿 (3.1)
45
where T3 is the temperature measured at location 3 (furthest from the surface, as
shown in Fig. 3.2), T1 is the temperature at location 1 (closest to the surface), k is the
thermal conductivity of copper, and L is the distance between the first and third
thermocouples. In this study, k =396 W/m∙K and L = 1.5 inches.
Using the root sum of squares method [16], the uncertainty of q (uq) is defined as:
𝑢𝑞 = 𝛿𝑞
𝛿𝑇1𝑢𝑇1
2
+ 𝛿𝑞
𝛿𝑇3𝑢𝑇3
2
+ 𝛿𝑞
𝛿𝑘𝑢𝑘
2+
𝛿𝑞
𝛿𝐿𝑢𝐿
2 (3.2)
where uT1 is the uncertainty of T1, uT3 is the uncertainty of T3, uk is the uncertainty of k due
to temperature dependence, and uL = 0.005 inches is the uncertainty of L associated with
manufacturing tolerances.
The superheat ( ∆𝑇𝑠 ) is the difference between the measured saturation
temperature (Ts) and the boiling surface temperature (Tw) extrapolated from the derived
heat flux:
∆𝑇𝑠 = 𝑇𝑤 − 𝑇𝑠 (3.3)
𝑇𝑤 = 𝑇1 − 𝑞𝐿1 𝑘 (3.4)
The uncertainty of the super heat, uTs, is:
𝑢𝑇𝑠=
𝛿∆𝑇𝑠
𝛿𝑇1𝑢𝑇1
2
+ 𝛿∆𝑇𝑠
𝛿𝑘𝑢𝑘
2+
𝛿∆𝑇𝑠
𝛿𝐿1𝑢𝐿1
2
+ 𝛿∆𝑇𝑠
𝛿𝑞𝑢𝑞
2 (3.5)
where uLi is the uncertainty of Li.
The error for each thermocouple measurement was calculated as twice the
standard deviation of the measurement. Using Eq. (3.2), the maximum heat flux

46
uncertainty proportion uq/q was calculated to be less than 3%, and using Eq. (3.5), the
maximum superheat uncertainty proportion us/ΔTs was calculated to be less than 3%.
The boiling heat transfer coefficient (HTC) was used to characterize the boiling
performance:
HTC =𝑞
∆𝑇𝑠 (3.6)
The uncertainty of HTC (uh) can be written as:
𝑢 = 𝛿HTC
𝛿∆𝑇𝑠𝑢𝑇𝑠
2
+ 𝛿HTC
𝛿𝑞𝑢𝑞
2
(3.7)
The maximum HTC uncertainty proportion uh/HTC was calculated to be less than
10%.
3.2.5 Surface characterization
Boiling surfaces were characterized by fluid contact angle measurements, surface
roughness measurements, scanning electron microscopy (SEM), and elemental analysis.
The static contact angle between the liquid and solid phases was measured using the
sessile droplet method with deionized water and a Ramé-Hart goniometer with Drop
Image Standard software (Netcong, NJ). The contact angle was measured at five
different randomly selected locations on the surface. The surface roughness of the
boiling surface was measured using a Form TalySurf 50 Profilometer 112/2564-1862
(Taylor Hobson, Leicester, UK). The arithmetic average of absolute roughness values,
Ra, was measured three times at three randomly selected locations for each surface. SEM
images and energy dispersive x-ray spectroscopy (EDX) elemental analysis of the
surfaces were captured using a Philips XL30 SEM (FEI Company, Hillsboro, OR).
47
3.3 BOILING MODELS
Some of the most widely used boiling models are the Rohsenow [18] and Mikic-
Rohsenow [19] correlations, which depend strongly on fluid properties and the fluid-
surface interaction.
3.3.1 Rohsenow correlation
For pure water undergoing nucleate pool boiling, Rohsenow [18] developed the
relationship:
𝑐𝑝 𝑇𝑤−𝑇𝑠
𝑓𝑔 Pr𝑠 = 𝐶𝑠𝑓 𝑞
𝜇𝑓𝑔
𝜍
𝑔 𝜌−𝜌𝑣
1 3
(3.8)
where cp is the fluid specific heat, hfg is the fluid latent heat of vaporization, μ is the fluid
viscosity, σ is the fluid surface tension, ρ is the fluid density, ρv is the vapor density, g is
the acceleration due to gravity, Pr is the Prandtl number of the fluid (defined as Pr =
𝜇𝑐𝑝 𝑘𝑙 ), the exponent s is 1 for water [18], and kl is the fluid thermal conductivity. The
coefficient Csf takes into account the fluid-surface interaction. For example, it has
determined empirically to fall in the range of 0.0065 to 0.018 for nanofluids [12].
3.3.2 Nucleation site density
The Mikic-Rohsenow model [19] assumes that the main mechanism of heat
transfer is transient heat conduction, such that:
𝑞 =1
2 𝜋𝑘𝑙𝜌𝑐𝑝
1 2 𝑓1 2 𝐷𝑑
2𝑛𝑎 𝑇𝑤 − 𝑇𝑠 (3.9)

48
where na is the active nucleation site density, and the bubble departure diameter (Dd) and
frequency (f) are defined by:
𝐷𝑑 = 𝐴1 𝜍
𝜌−𝜌𝑣
1 2
𝜌𝐶𝑝𝑇𝑠
𝜌𝑣𝑓𝑔
5 4
(3.10)
𝑓𝐷𝑑 = 𝐴2 𝜍 𝜌 − 𝜌𝑣 𝜌𝑣2 1 4 (3.11)
where A1=1.5 x 10⁻⁴ s/m1/2
and A2=0.6 m1/4
s3/2
for water [20].
Since the bubble departure diameter and frequency are modeled as functions fluid
properties and there are no models to incoprate the surface effects [21], we assume that
they are constant for the different surfaces and ascribe any changes in boiling
performance to a change in active nucleation site density. To estimate the active
nucleation site density for the surfaces in this study, we rearrange the Mikic-Rohsenow
correlation:
𝑛𝑎 =𝑞
1
2 𝜋𝑘𝑙𝜌𝑐𝑝
1 2 𝑓1 2 𝐷𝑑
2 𝑇𝑤−𝑇𝑠 (3.12)
In this study, the following properties of water at 373.15 K were used: kl = 0.67 W/m∙K,
hfg = 2257 kJ/kg, cp = 4219 J/kg∙K, ρ = 958 kg/m3, ρv = 0.597 kg/m
3, μ = 0.281 cP, and σ
= 58.9 mN/m.
3.4 RESULTS AND DISCUSSION
3.4.1 Impact of coating time on boiling performance
Fig. 3.3 shows the boiling performance of the baseline surface and four coated
surfaces. Surface #1 (which had a coating time of 1 minute) and Surface #2 (which had a

49
coating time of 5 minutes) exhibited decreases in HTC of 26% and 24%, respectively,
when compared to the baseline surface. However, Surfaces #3 and #4 (which each had a
coating time of 10 minutes) showed an average increase in HTC of approximately 200%
compared to the baseline surface. Such an improvement in boiling HTC is large, and
demonstrates that adequate coating time is crucial for optimized surface modification. To
compare the EPD coated surface to results from nanofluid boiling which has particle
deposition,
3.4.2 Residual ZnO layer
Fig. 3.4 shows Surface #4 in three stages: before coating, after coating, and after
boiling. Before coating (Fig. 3.4(a)), the surface is clean, with sanding marks visible on
the surface. After coating (Fig. 3.4(b)), the surface is white due to complete coverage by
a thick layer of ZnO nanoparticles. After boiling (Fig. 3.4(c)), the bulk nanoparticle layer
has flaked off and left behind residual surface coating that is evident from the white tint.
We observed that for each surface, the coating flaked off. An EDX analysis of the
surfaces performed after the bulk layer flaked off indicated the presence of both Zn and O
as well as the elements of SS (Fe and Cr) as seen in Fig. 3.4(d). These observations of
the EPD process for ZnO nanoparticle coating are similar to those of prior nanofluid
boiling studies [22] in which a sorption layer that formed during boiling could be cleaned
off with a water jet, leaving behind a thin layer of nanoparticles trapped in the surface
cavities.
The HTC of the 1st run (after coating) and 2
nd run (after 1
st run, using fresh DI
water) at around 181 kW/m2 for the four coated surfaces are reported in Table 1. The
change in HTC from the 1st to the 2
nd run is small for all four coated surfaces and

50
approximately within the error of the measurement (10%). The flaking off of the bulk
layer occurred early on in the boiling experiment, before the system reached steady state.
We therefore conclude that boiling performance is primarily governed by the residual
ZnO layer and independent of the bulk layer, which flakes off.
3.4.3 Surface roughness
The average and standard deviation of the surface roughness (Ra) for the baseline
surface and four ZnO coated surfaces after boiling are shown in Table 1. For all coating
cases, the residual nanoparticle coating slightly lowered the surface roughness after
boiling, compared to the baseline surface. Because the HTC is expected to be
proportional to Ra1.33
[23], we conclude that changes in roughness should lead to an HTC
decrease of less than 7% and thus do not significantly contribute to the measured change
in HTC.
3.4.4 Scanning electron microscopy
Surfaces were investigated using SEM at 50X, 200X, and 800X magnifications,
as shown in Fig. 3.5. For the baseline surface, the lines created by sanding are visible.
Surfaces #1 and #2, which did not exhibit improved boiling performance, have a similar
quantity of attached ZnO particles which appear as white specks at all magnifications.
Surface #4 has a coating before boiling that appears smooth with some cracking.
However, the coating is observed to flake off during the boiling process. After the bulk
layer flakes off, Surface #4, which had a large increase in boiling performance, still
shows the presence of ZnO clusters (circled in red) are spread across the surface.

51
3.4.5 Estimation of active nucleation site density based on the Mikic-Rohsenow
correlation
Figure 3.6 shows the estimated nucleation site density based on experimental data
using Eq. (3.12). For the baseline surface, the nucleation site density was found to be
between 1.26 x 10⁴ and 1.57 x 10
4 sites/m
2 for heat fluxes between 160 and 240 kW/m
2.
For this same range of heat fluxes, Eq. (3.12) predicts between 3.82 x 10⁴ and 4.18 x 10
4
sites/m2 for Surface #4, an increase of 2.9 times.
3.4.6 Contact angle
Changes in the contact angle between a fluid and boiling surface can impact the
number of active nucleation sites. The static contact angles of the different surfaces
measured after boiling are shown in Table 1. Surfaces #1 and #2, which did not have an
increase in boiling performance, had a small change in contact angle compared to the
baseline surface. Surfaces #3 and #4, which had an increase in boiling performance, had
increases of 24.4° and 11.5°, respectively. An increase in contact angle has been shown
to increase boiling heat transfer [24]. When a surface has an increase in contact angle
(decreased wettability), smaller cavities can become active nucleation sites, such that:
𝑛𝑎 ∝ (1 − cos 𝜃 ) (15)
Therefore, the changes in active nucleation site density compared to the baseline
surface predicted for Surfaces #3 and #4 are +71% and +33% respectively, and for
Surfaces #1 and #2 the changes are –7% and +6%, respectively. Part of the increase in
active nucleation site density for Surfaces #3 and #4 can therefore be attributed to the
increase in contact angle for the coated surfaces.

52
3.4.7 Cavity analysis from SEM image processing
Analysis of dark spots in SEM images of surfaces has been shown to provide a
convenient means to estimate the number of cavities available for nucleation [25]. To
corroborate the nucleation site calculations made above, we processed SEM images of
several surfaces in our study, utilizing an algorithm that reassigned pixels above or below
a threshold grayscale intensity to have a white or black value respectively. The algorithm
then outlined black spots (cavities) to yield images such as shown in Fig. 3.7 and counted
the number of cavities with size greater than 30 m2.
This method was applied to three different areas of the baseline surface, Surface
#1, and Surface #4, yielding an average number of cavities of 56, 79, and 137,
respectively. Surface #4 had a 140% increase in the number of cavities compared to the
baseline surface, while Surface #1 had only a slight increase in the number of cavities.
These percent increases did not vary significantly when choosing different grayscale
threshold intensities in the cavity counting algorithm. The increase for Surface #4 is
similar to the 190% increase in active nucleation site density calculated above using the
Mikic-Rohsenow correlation, further suggesting that the increase in HTC due to the EPD
coating is due to an increase in nucleation site density.
3.5 CONCLUSIONS
This study demonstrated that the boiling performance of a surface can be
significantly enhanced by electrophoretically depositing a layer of nanoparticles from a
nanofluid. When coating times were sufficient, a nearly 200% increase in HTC was
measured. The coating slightly lowered the measured surface roughness, but it was not
substantial enough to impact the HTC. The coating increased the contact angle and

53
cavities available for nucleation, resulting in an increase in boiling HTC. The change in
active nucleation site density calculated from the experimental data (2.9 X) matched well
with the image analysis to determine the change in the number of cavities (2.4 X). This
demonstrates that the increase in nucleation site density is likely to be the cause of the
improved boiling performance. For future work, an investigation of the bubble departure
diameter and frequency would help to broaden the understanding of boiling on an EPD
surface, since it was assumed that different surfaces did not impact these values.

Table 3.1. Coating time, HTC, surface roughness and contact angle results
Surface Coating
Time
(min)
HTC (kW/m2K) * Ra (µm) Contact Angle
1st Run 2
nd Run
change from
1st to 2
nd Run
Average Standard
deviation Average
Standard
deviation
Baseline N/A 18.2 - - 0.19 0.01 65.3° 2.2°
#1 1 12.8 13.5 +5% 0.15 0.01 62.7° 4.7°
#2 5 13.9 16.0 +15% 0.12 0.01 67.4° 1.5°
#3 10 53.2 50.4 -5% 0.18 0.05 89.7° 6.4°
#4 10 53.3 52.3 -2% 0.16 0.01 76.8° 2.7°
* for q = 181 kW/m2
54

55
Figure 3.1. Electrophoretic configuration used to coat ZnO nanoparticles on a SS surface.

56
Figure 3.2. Schematic of boiling test system.

57
Figure 3.3. Experimental boiling results comparing the baseline surface to the electrophoretically
coated Surfaces #1-#4.
0
10
20
30
40
50
60
70
100 150 200 250 300
h (kW
/m2K
)
Heat Flux (kW/m2)
Baseline Surface #1 Surface# 2 Surface #3 Surface #4

58
Figure 3.4. Surface #4 shown (a) before coating, (b) after coating/before boiling, and (c) after boiling
(when the bulk layer has flaked off). (d) EDX analysis of the surface after boiling, showing that ZnO
is still present.
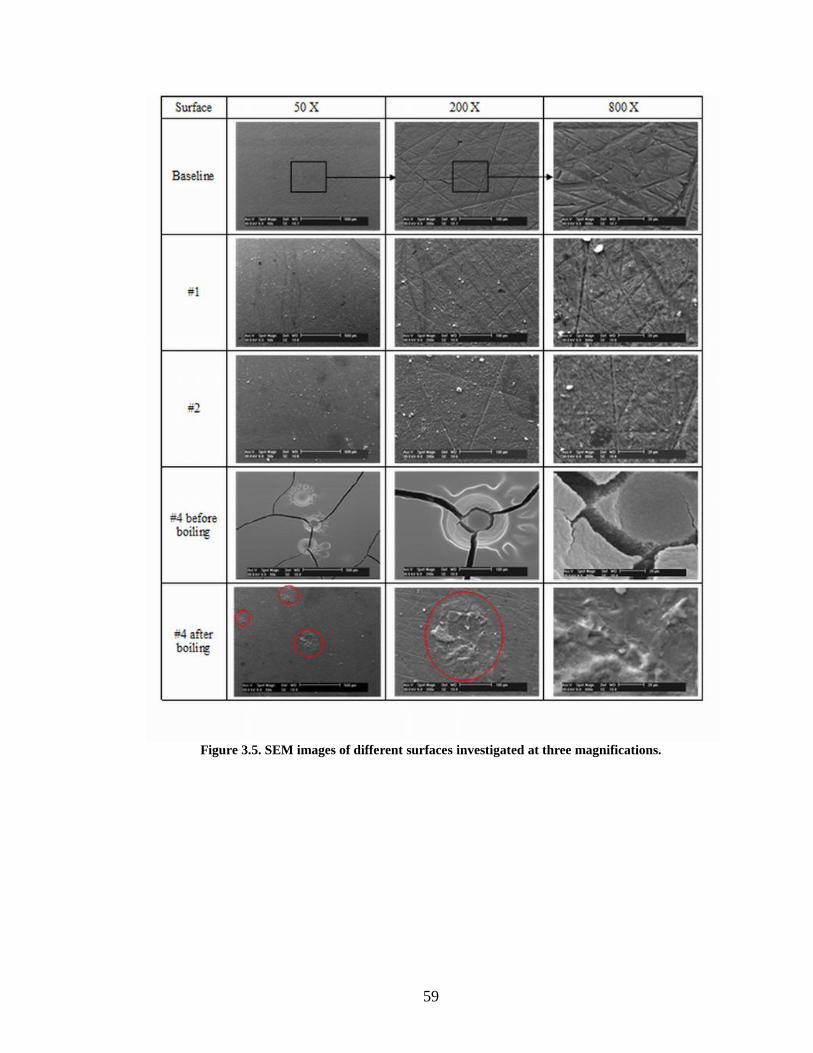
59
Figure 3.5. SEM images of different surfaces investigated at three magnifications.

60
Figure 3.6. Comparison of active nucleation site density calculated from the Mikic Rohsenow
correlation for baseline (uncoated) surface and (coated) Surface #4.
0
5000
10000
15000
20000
25000
30000
35000
40000
45000
50000
100 150 200 250 300
Acti
ve N
uc
leati
on
Sit
e D
en
sit
y (sit
es/m
2)
Heat Flux kW/m2
Baseline Surface #4

61
Figure 3.7. Representative images produced by thresholding algorithm that are used to analyze the
number of cavities available for nucleation in (a) baseline, (b) Surface #1, and (c) Surface #4.

62
References
[1] B.J. Jones, J.P. McHale, S.V. Garimella, The Influence of Surface Roughness on Nucleate
Pool Boiling Heat Transfer, J. Heat Transfer, 131(12) (2009) 121009-121014.
[2] M. Zhang, K. Lian, Using bulk micromachined structures to enhance pool boiling heat
transfer, Microsyst. Technol., 14(9-11) (2008) 1499-1505.
[3] K.N. Rainey, S.M. You, Pool Boiling Heat Transfer From Plain and Microporous, Square Pin-
Finned Surfaces in Saturated FC-72, J. Heat Transfer, 122(3) (2000) 509-516.
[4] J. Mitrovic, F. Hartmann, A new microstructure for pool boiling, Superlattices Microstruct.,
35(3-6) (2004) 617-628.
[5] C.D. Ghiu, Y.K. Joshi, Boiling Performance of Single-Layered Enhanced Structures, J. Heat
Transfer, 127(7) (2005) 675-683.
[6] A.K. Das, P.K. Das, P. Saha, Nucleate boiling of water from plain and structured surfaces,
Exp. Therm Fluid Sci., 31(8) (2007) 967-977.
[7] S. Ujereh, T. Fisher, I. Mudawar, Effects of carbon nanotube arrays on nucleate pool boiling,
Int. J. Heat Mass Transfer, 50(19-20) (2007) 4023-4038.
[8] C. Li, Z. Wang, P.-I. Wang, Y. Peles, N. Koratkar, G.P. Peterson, Nanostructured Copper
Interfaces for Enhanced Boiling, Small, 4(8) (2008) 1084-1088.
[9] S. Launay, A.G. Fedorov, Y. Joshi, A. Cao, P.M. Ajayan, Hybrid micro-nano structured
thermal interfaces for pool boiling heat transfer enhancement, Microelectron. J., 37(11)
(2006) 1158-1164.
[10] S.B. White, A.J. Shih, K.P. Pipe, Effects of nanoparticle layering on nanofluid and base fluid
pool boiling heat transfer from a horizontal surface under atmospheric pressure, J. of Appl.
Phys., in press
[11] S.M. Kwark, R. Kumar, G. Moreno, J. Yoo, S.M. You, Pool boiling characteristics of low
concentration nanofluids, Int. J. Heat Mass Transfer, 53(5-6) (2009) 972-981.
[12] R.A. Taylor, P.E. Phelan, Pool boiling of nanofluids: Comprehensive review of existing data
and limited new data, Int. J. Heat Mass Transfer, 52(23-24) (2009) 5339-5347.
[13] O.O. Van der Biest, L.J. Vandeperre, Electrophoretic deposition of materials, Annu. Rev.
Mater. Sci., 29 (1999) 327-352.
[14 M.J. Santillan, F. Membrives, N. Quaranta, A.R. Boccaccini, Characterization of TiO2
nanoparticle suspensions for electrophoretic deposition, J. Nanopart. Res., 10(5) (2008) 787-
793.
[15] L. Miao, S. Cai, Z. Xiao, Preparation and characterization of nanostructured ZnO thin film
by electrophoretic deposition from ZnO colloidal suspensions, J. Alloys Compd., 490(1-2)
(2009) 422-426.
[16] H. Chang, T. Tsung, Y. Lu, L. Chen, C. Jwo, J. Tsung, The electrochemical properties of
SiC nanoparticle suspension, J. Mater. Eng. Perform., 14 (2005) 158-162.
[17] R.S. Figliola, D.E. Beasley, Theory and Design for Mechanical Measurements, Third
Edition, Meas. Sci. Technol., 12(10) (2001) 1743.
[18] W.M. Rohsenow, A method of correlating heat transfer data for surface boiling liquids,
Trans. ASME 74 (1952) 969-979.
[19] B.B. Mikic, W.M. Rohsenow, A new correlation of pool-boiling data including the effect of
heating surface characteristics, Transactions of the ASME. Series C, Journal of Heat
Transfer, 91(2) (1969) 245-250.
[20] S. Wen, B.X. Wang, Effects of surface wettability on nucleate pool boiling heat transfer for
surfactant solutions, Int. J. Heat Mass Transfer, 45(8) (2002) 1739-1747.
[21] P. Griffith, J.D. Wallis, The Rolfe of Surface Conditions in Nucleate Boiling, in: P. Griffith
and J.D. Wallis, The role of surface conditions in nucleate boiling. Chemical Eng. Progr.
Symp. Ser. 56 30 (1960), pp. 49–63., 1958.

63
[22] Z.-h. Liu, L. Liao, Sorption and agglutination phenomenon of nanofluids on a plain heating
surface during pool boiling, Int. J. Heat Mass Transfer, 51(9-10) (2008) 2593-2602.
[23] A. Bejan, A.D. Kraus, Heat transfer handbook, John Wiley, Hoboken, NJ, 2003.
[24] S.S. Hsieh, C.J. Weng, J.J. Chiou, Nucleate Pool Boiling on Ribbed Surfaces With Micro-
Roughness at Low and Moderate Heat Flux, J. Heat Transfer, 121(2) (1999) 376-385.

64
CHAPTER 4
INVESTIGATION OF THE ELECTRICAL CONDUCTIVITY OF PROPYLENE
GLYCOL BASED ZNO NANOFLUIDS
ABSTRACT
The electrical conductivity is an important property of nanofluids that has not
been widely studied. To study the effects of particle size and concentration, the electrical
conductivity of propylene glycol based ZnO nanofluids with 20, 40, and 60 nm diameter
particles is measured. Since conventional models, such as the Maxwell Model, do not
account for the charge formed on the particle’s surface, the data was compared to a model
based on the electrical conductivity of a colloidal suspension in a salt-free medium with
reasonable agreement. Both the model and experimental results showed the ZnO
nanofluids increased the electrical conductivity with increasing volume fraction and
decreasing particle size compared to that of the base fluid. Furthermore, at higher
volume fractions, the increase of electrical conductivity begins to level off, which is
attributed to ion condensation effects in the high surface charge regime.
4.1 INTRODUCTION
Nanofluids are created by suspending nanometer size particles into a base fluid
[1] and allow for the engineering of the fluid properties by changing the type, size, and
amount of particle. Nanofluids have been proposed for advanced heat transfer
applications, such as fuel cell thermal management and power electronics cooling. For

65
these cooling applications, a low electrical conductivity fluid is required. While the fluid
thermal properties have been thoroughly investigated [2], the interrelated electrical
properties have not.
Nanofluids typically have metal oxide nanoparticles, such as ZnO, TiO2, and
Al2O3. When dispersed into a fluid, a surface charge is formed due to the protonation and
deprotonation of a surface group such as a hydroxyl ligand (-OH) [3]. This causes a layer
of ions called the electric double layer (EDL) to form. This layer may cause polar liquids
to form columns along the surface of the particle, and more site densities and larger
surface charges may lead to stronger structures [3]. The surface charge can be adjusted
by altering the pH of the suspension [4,5], or chemical treating the surface of the particles
[5]. The charge on the surface allows for electrophoresis of the fluids. Chang et al. [6]
applied an electric field to the SiC nanofluids and measured increases in the
hydrodynamic radius of the particles, aggregation, and precipitation of the aggregates.
They also noted that the nanoparticles coated the electrode oppositely charged of the
nanoparticles.
The electrical conductivity of a suspension can either increase or decrease
depending on the background electrolyte, the particle size, and the charge of the particle
[7]. Fang and Zhang [8] studied the concentration effects (<0.2%) on electrical
conductivity of gold nanoparticles in chloroform and toluene suspensions. Cruz et al. [9]
studied high volume fraction (1-35%), 520 nm Al2O3 suspensions in different water-salt
solutions. For pure water the conductivity steadily increases with the addition of
nanoparticles. Wong et al. [10] also measured a linear increase in electrical conductivity
with volume fraction (up to 8.5%) for water-based 36 nm Al2O3 nanofluids. Ganguly et

66
al. [11] reported increases in electrical conductivity of 13 nm Al2O3 nanofluids with both
increasing temperature and volume fraction (up to 3%). Lisunova et al. [12] measured
electrical conductivity increases for carbon nanotube (CNT) based nanofluids and
measured large increases in electrical conductivity with increasing volume fraction (up to
2%). The previous nanofluid electrical conductivity studies showed increases of up to
150X [11], while conventional models, such as the Maxwell Model [13], only predict an
increase of less than 1.5X. The review shows that there is a lack of understanding of the
particle size effect and mathematical modeling on nanofluid electrical conductivity.
Several other models have been proposed for the electrical conductivity colloidal
suspensions. Carrique et al. [14] numerically studied the effects of overlapping EDLs on
the electrical conductivity of concentrated spherical colloidal suspensions. Carrique et al.
[15] investigated the role of boundary conditions on the electrical conductivity of salt free
suspensions using numerical methods. Carrique and Ruiz-Renna [16] explored the
effects of water dissociation and CO2 contamination on the electrical conductivity of salt-
free concentrated suspensions. While these models are valid for a variety of cases,
Ohshima [17] developed a simplified analytical model of the electrical conductivity of
spherical colloidal particles in a salt-free medium. However, these models have not been
used to describe the electrical conductivity metal oxide nanofluids. The analytical model
proposed by Ohsima [17] is used in this study to understand the electrical conductivity of
non-aqueous nanofluids.
The goal of this research is to experimentally measure and analytically model the
particle size and concentration effects on nanofluid electrical conductivity. The electrical
conductivity of ZnO nanofluids are investigated for 20, 40, and 60 nm diameter

67
nanoparticles dispersed in propylene glycol, which allowed for up to a 7% volume
fraction without the addition of dispersants. An analytic model for colloidal particles in a
salt-free medium is used with the properties of the base fluid and nanoparticle to explain
the changes in electrical conductivity.
4.2 NANOFLUID PREPARATION AND CHARACTERIZATION
4.2.1 Nanofluid Preparation
Propylene glycol (PG) based nanofluids with 20, 40, and 60 nm diameter ZnO
nanoparticles were used. The fluids were prepared by Nanophase Technologies
(Romeoville, IL) at 7% volume fraction without any dispersants. The PG-based
suspensions were diluted to 1, 3, and 5% for all particle sizes. The particles have a
crystal phase of zincite (hexagonal) with an elongated morphology. Using PG as a base
fluid allowed for higher volume fractions of nanoparticles to be used without the use of
dispersants compared to water-based nanofluids.
4.2.2 Zeta Potential Measurement
The zeta potential of the nanofluids was measured with a Brookhaven Instruments
Zeta Plus (Holtsville, NY) which uses electrophoretic light scattering (ELS). An electric
field is applied to the fluid that moves the charged particles towards the positive or
negative pole. The direction and speed of the particles are measured to determine the
zeta potential by a laser beam that is scattered proportionally to the velocity of the
particles. The samples were temperature controlled to 25°C and the zeta potential was
measured in 5 separate runs.

68
4.2.3 Electrical Conductivity Measurement
The electrical conductivity of the nanofluids was measured using a Model 72
hand held conductivity meter from Engineered Systems and Designs, Inc (Newark, DE).
The meter operated using two electrodes insulated from each other. With a specific size
and spacing between them, the meter can measure the conductance across a known
volume. The meter has a range of 0.2 to 20,000 μS/cm, a resolution of 0.1%, and an
accuracy of ± 2.5%. The meter was calibrated using salt solutions with known electrical
conductivities of 10, 74, 714, 2,000, 6,668, and 58,640 μS/cm. For the measurements,
approximately 200 ml of the fluid was placed in a beaker which was then submerged in a
temperature bath of 25 °C. The probe was rinsed in tap water and then dipped into three
different beakers of distilled water to prevent any contamination between samples. The
probe was then dipped in the sample beaker and stirred until there was a stable reading.
The rinsing process was repeated before moving to the next sample. The tests were
repeated three times for each sample.
4.3 NANOFLUID ELECTRICAL CONDUCTIVITY MODELING
In a salt-free medium, ions are added from the charging of the particle suspended
in the base fluid, such as a non-aqueous medium [18]. These ions are referred to as
counter-ions. PG, or 1, 2 propanediol, is a polar medium with the formula HO-CH2-
CHOH-CH3, thus allowing the available hydroxyl group to form on the surface when the
ZnO is dispersed in the fluid.
Kuwabara’s cell model [19], as shown in Fig. 4.1, represents the interaction of the
particle in the medium and is used to analyze the electrokinetic properties of colloidal

69
suspensions. Each particle of radius a is surrounded by a virtual shell of radius b such
that the volume fraction, 𝜙 = 𝑎/𝑏 3. The EDL thickness is represented by κ-1
.
Ohshima [17] derived an analytical expression for the electrical conductivity in a
salt-free medium for two cases, one with low surface charge and the other with high
surface charge. The critical value of the surface charge of the nanoparticle, Q, was
related to the volume fraction by:
𝑄
4𝜋휀𝑟휀0𝑎
𝑧𝑒
𝑘𝑇≤ ln 1 𝜙 (4.1)
where εr is the relative permittivity of the medium, ε0 is the permittivity of a vacuum, z is
the valence of the counter-ion, e is the elementary electric charge, k is the Boltzmann
constant, and T is the temperature in K. The universal constants used were: ε0 = 8.85 x
10-12
F/m, e = 1.60 x 10⁻¹⁹
C, and k = 1.38 x 10⁻²³
J/K. In this study, the relative
permittivity of PG was 32 and the temperature was held at 298.15 K. The valence of the
counter-ion was 2 [20]. The zeta potential, ζ, is used to determine Q [17]:
𝑄 = 4𝜋휀𝑟휀0𝑎휁 (4.2)
From this Ohshima [17] approximated the electrical conductivity, K, for the two cases as
follows. For Case 1, Eq. (4.1) is true, the particle has low surface charge and
𝐾 =3𝑧𝑒𝑄
4𝜋𝑏3𝜆=
3𝑧𝑒휀𝑟휀0𝜙휁
4𝜋𝑎2𝜆 (4.3)
For Case 2, Eq. (4.1) is false, the particle has high surface charge and
𝐾 =3휀𝑟휀0𝑎𝑘𝑇
𝑏3𝜆ln 1 𝜙 =
3휀𝑟휀0𝜙𝑘𝑇
𝑎2𝜆ln 1 𝜙 (4.4)

70
where λ is the drag coefficient of the counter-ion is determined from [21]:
𝜆 =𝑁𝐴𝑒2 𝑧
Λc0 (4.5)
where NA is Avogadro’s number (6.022 x 10²³
mol-1
) and Λc0 is the limiting ionic
conductance. For Case 1, K increases linearly with Q which is impacted by the zeta
potential in Eq. (4.2). For Case 2, K is independent of Q due to counter-ion condensation
effects. Increasing the amount of counter-ions adds to the condensation region, leaving
the charge and potential outside that region unchanged. In this case, the electrical
conductivity no longer increases linearly with volume fraction and it begins to plateau at
high volume fraction. These relationships were used to explain the experimental data of
the PG-based nanofluids.
Since the value of Λc0 was an unknown for the ZnO/PG system, the value of λ is
also an unknown. The value of Λc0 is independent of the particle size and concentration
since it depends on the counter-ion at the particle surface. The root-mean-square error
between the experimentally measured and model predicted K, for all particle sizes and
volume fractions was minimized to determine Λc0. The value of Λc
0 is substituted into Eq.
(4.5) to find λ, which is the input to Eq. (4.3) or (4.4) to solve K.
4.4 RESULTS AND DISCUSSION
4.4.1 Zeta Potential
The results of the zeta potential measurements are shown for the PG-based ZnO
nanofluids in Table 4.1. There is little difference between the zeta potential magnitudes
based on particle size for each base fluid. Since the fluids were prepared using the same

71
process, the zeta potential was controlled and should be constant. The average zeta
potential of 48.7 mV was used for modeling.
4.4.2 Modeling Parameters
To determine which case was valid for the particle size and volume fraction, the
values of the inequality in Eq. (4.1) were calculated and compared. Using Eq. (4.2) in Eq.
(4.1), the value of the left hand side of the inequality of Eq. (4.1) was determined to be
3.78 and did not change for different particle sizes or volume fractions. The values of the
right hand side of Eq. (4.1) are dependent on the volume fraction and are shown in Table
4.2. For the PG/ZnO based nanofluids, Case 1 was valid only for the 1% volume fraction
suspensions of all three particle sizes, and Case 2 was valid for the rest of the suspensions
(3, 5, and 7%). From the analysis, the value of Λc0 was determined to be 49.4 S cm
2/mol.
This is in line with common values for Λc0 of ions arising from the colloidal charge
process in aqueous suspensions, which are between about 40-350 S cm2/mol [15]. Based
on the Λc0 value obtained, λ = 6.26 x 10
-12 C
2/(S m
2).
4.4.3 Comparison of Experimental and Modeling Results
The experimental data is shown in Fig. 4.2 with solid symbols. The addition of
nanoparticles to the suspension increased the electrical conductivity when compared to
the PG base fluid (K = 0.1 µS/cm). The electrical conductivity increased with the volume
fraction for each suspension. At the same volume fraction, smaller particles had a higher
electrical conductivity. The electrical conductivity of the 20 nm suspension increased
from 2.72 µS/cm at 1% volume fraction to 9.60 µS/cm at 7%, which is an increase of
nearly 100 times compared to the base fluid. The electrical conductivity of the 40 nm
suspension increased from 1.35 µS/cm to 2.35 µS/cm over the same range of volume

72
fractions. While the 60 nm suspension increased from 0.76 µS/cm to 1.99 µS/cm.
Compared to PG, the 40 nm and 60 nm particle sized suspensions increased by 23.5 and
19.9 times, respectively.
The model data for the PG-based nanofluids is also shown in Fig. 4.2 with solid
lines. The model is similar to the experimental data by showing the electrical
conductivity increases with increasing volume fraction and increases with decreasing
particle size at the same volume fraction. The model for the 20 nm and 40 nm suspension
fit quite well; however, the 60 nm under predicts the experimental data. This may be due
to the measurement error associated with low values of electrical conductivity associated
with the 60 nm nanofluid.
4.4.4 Particle Size and Concentration Effects
The size of the ZnO particle affected the nanofluid electrical conductivity
significantly. The electrical conductivity decreased with increasing particle size at the
same volume fraction. However, the change in electrical conductivity was more
significant from 20 nm to 40 nm than from 40 nm to 60 nm, as shown experimentally and
as modeled in Fig. 4.3. In the model, the electrical conductivity is proportional to a-2
;
therefore, it is expected that the electrical conductivity will increase with decreasing
particle size. It is noted that this difference increases with volume fraction from 20 to 40
nm, and the opposite trend is observed volume fraction increase from 40 to 60 nm for the
experimental data, while the model predicts an increase with volume fraction for both.
The concentration affects the electrical conductivity as well. While the electrical
conductivity increases with volume fraction, the rate of change of the electrical
conductivity per volume fraction change was further investigated. The rate of change

73
was defined as the change in electrical conductivity divided by the change in volume
fraction. There is a large increase in thermal conductivity at low volume fractions;
however, at higher volume fractions, the increase in electrical conductivity with volume
fraction slows, as shown in Fig. 4.4. For the 20 nm suspension, there is a rapid increase
in the electrical conductivity from the base fluid to the 1% volume fraction suspension
and for 1% to 3%; however, the increase from 3% to 5% and 5% to 7% is lower than the
initial increase. There is also similar trend for the 40 nm and 60 nm. For volume
fractions greater than 3%, the model is uses Case 2 and the electrical conductivity is
proportional to 𝜙 ln 1 𝜙 , which predicts a non-linear response to the volume fraction
with a decrease in slope at higher volume fractions.
4.4.5 Effects of Surface Charge in Modeling
The surface charge is important for the accuracy of the modeling since it
determines which case is used. For low surface charge Case 1 is relevant and for high
surface charge Case 2 is relevant. For the PG/ZnO nanofluids, the model switched from
Case 1 to Case 2 between 1% and 3% volume fraction. To see the difference between
these two cases, Fig. 4.5 shows the K value calculated based on Case 1 (Eq. (4.3)) and
Case 2 (Eq. (4.4)) for the 20 nm ZnO suspension. Case 1 over predicts the electrical
conductivity data at higher volume fractions with a linear increase with volume fraction.
Case 2 increases with the volume fraction at a rate of 𝜙ln(1/𝜙), which better fits the
data. This demonstrates the effect of surface charge on the accuracy in modeling of K.
Similar trends were seen for 20 and 40 nm particle sizes. At volume fractions less than
1%, there is not a significant difference in the electrical conductivity predicted by the two
cases.

74
4.4.6 Electrokinetic Radius
For suspensions with a thick EDL, the electrical conductivity is larger than that of
the bulk fluid and the surface conductance increases the effective electrical conductivity
[22]. The electrokinetic radius, κa, is the ratio of the particle diameter to the thickness of
the EDL, κ-1
, and is used to describe the coupled effects of the particle size and ion
concentration. The Debye-Hückle parameter, κ, is defined as:
𝜅 =1
𝑎
3𝑧𝑒휁
𝑘𝑇 1/𝜙−1
1 2
(4.6)
Therefore,
𝜅𝑎 = 3𝑧𝑒휁
𝑘𝑇 1/𝜙−1
1 2 (4.7)
Eq. (4.7) shows that κa is independent of particle size and increases with volume
fraction. For values κa <1, imply a relatively thick double layer. Posner et al. [7] stated
that more work is needed in predicting the conductivity for κa ~ 1.
Fig. 4.6 shows the value of κa is less than 1 for the suspensions studied and it
increases with volume fraction according to Eq. (4.7) for the ZnO/PG-based nanofluids
used in this study. The value of κa ranges from 0.34 at 1% volume fraction to 0.92 for
7% volume fraction. Therefore, the ZnO/PG nanofluids have a thick EDL which affects
the electrical conductivity of the suspensions.

75
4.5 CONCLUSIONS
A model developed for colloidal suspensions in a salt-free medium was used to
model the large increases in the electrical conductivity of ZnO/PG nanofluids. The data
for the 20 nm and 40 nm suspensions fit well, while the model under predicted the 60 nm.
Both the experimental data and the model showed the electrical conductivity increases
with increasing volume fraction and with decreasing particle size at the same volume
fraction. Also, at higher volume fractions, the increase of electrical conductivity begins
to level off, which may be attributed to ion condensation effects in the high surface
charge regime. The electrokinetic radius was found to be less than 1, which implies a
large double layer thickness.

76
Table 4.1. Zeta potential measurements
2a (nm) ζ (mV)
20 49.3 ± 0.1
40 48.6 ± 0.1
60 48.3 ± 0.1
Table 4.2. Values of the right hand side of the inequality in Eq. (4.1)
𝜙 ln(1/𝜙)
1% 4.61
3% 3.51
5% 3.00
7% 2.66

77
Figure 4.1. Schematic of Kuwabara’s cell model with particle radius, a, layer thickness, κ-1, and
particle space, b.

78
Figure 4.2. Experimental electrical conductivity of propylene glycol-based ZnO nanofluids with 20,
40, and 60 nm particles in comparison to a model for the electrical conductivity of a colloidal
suspension in a salt-free medium.

79
Figure 4.3. The difference in electrical conductivity between particle sizes of 20 (K20) and 40 nm (K40)
and 40 and 60 nm (K60) at the same volume fraction. The difference in electrical conductivity
between the 20 nm and 40 nm is larger than the difference between 40 nm and 60 nm particles.

80
Figure 4.4. The rate of change in electrical conductivity between volume fractions for the different
particle sizes. The rate of change decreases at higher volume fractions.

81
Figure 4.5. Two potential cases for the model using Eqs. (4.3) and (4.4) for the low surface charge
(Case 1) and high surface charge (Case 2), respectively, for the 20 nm ZnO/PG suspension.
0
2
4
6
8
10
12
14
16
18
0% 2% 4% 6% 8%
Ele
ctr
ical C
on
du
cti
vit
y (μ
S/c
m)
Volume Fraction
Exp Case 1 Case 2

82
Figure 4.6. Variation of the electrokinetic radius, κa, with volume fraction.

83
References
[1] S.U.S. Choi, Enhancing thermal conductivity of fluids with nanoparticles, in, ASME, San
Francisco, CA, USA, 1995, pp. 99-105.
[2] J. Buongiorno, D.C. Venerus, N. Prabhat, T. McKrell, J. Townsend, R. Christianson, Y.V.
Tolmachev, P. Keblinski, L.W. Hu, J.L. Alvarado, I.C. Bang, S.W. Bishnoi, M. Bonetti, F.
Botz, A. Cecere, Y. Chang, G. Chen, H.S. Chen, S.J. Chung, M.K. Chyu, S.K. Das, R. Di
Paola, Y.L. Ding, F. Dubois, G. Dzido, J. Eapen, W. Escher, D. Funfschilling, Q. Galand,
J.W. Gao, P.E. Gharagozloo, K.E. Goodson, J.G. Gutierrez, H.P. Hong, M. Horton, K.S.
Hwang, C.S. Iorio, S.P. Jang, A.B. Jarzebski, Y.R. Jiang, L.W. Jin, S. Kabelac, A. Kamath,
M.A. Kedzierski, L.G. Kieng, C. Kim, J.H. Kim, S. Kim, S.H. Lee, K.C. Leong, I. Manna, B.
Michel, R. Ni, H.E. Patel, J. Philip, D. Poulikakos, C. Reynaud, R. Savino, P.K. Singh, P.X.
Song, T. Sundararajan, E. Timofeeva, T. Tritcak, A.N. Turanov, S. Van Vaerenbergh, D.S.
Wen, S. Witharana, C. Yang, W.H. Yeh, X.Z. Zhao, S.Q. Zhou, A benchmark study on the
thermal conductivity of nanofluids, J. Appl. Phys., 106(9) (2009) 14.
[3] D. D. Lee, K. Jae-Won, B.G. Kim, A new parameter to control heat transport in nanofluids:
surface charge state of the particle in suspension, J. Phys. Chem. B, 110(9) (2006) 4323-
4328.
[4] X.F. Li, D.S. Zhu, X.J. Wang, N. Wang, J.W. Gao, H. Li, Thermal conductivity enhancement
dependent pH and chemical surfactant for Cu-H2O nanofluids, Thermochim. Acta, 469(1-2)
(2008) 98-103.
[5] D. Lee, Thermophysical Properties of Interfacial Layer in Nanofluids, Langmuir, 23 (2007)
6011-6018.
[6] H. Chang, T. Tsung, Y. Lu, L. Chen, C. Jwo, J. Tsung, The electrochemical properties of SiC
nanoparticle suspension, J. Mater. Eng. Perform., 14 (2005) 158-162.
[7] J.D. Posner, Properties and electrokinetic behavior of non-dilute colloidal suspensions,
Mechanics Research Communications, 36(1) (2009) 22-32.
[8] F. Fang, Y.F. Zhang, DC electrical conductivity of Au nanoparticle/chloroform and toluene
suspensions, Journal of Materials Science, 40(11) (2005) 2979-2980.
[9] R.C.D. Cruz, J. Reinshagen, R. Oberacker, A.M. Segadaes, M.J. Hoffmann, Electrical
conductivity and stability of concentrated aqueous alumina suspensions, J. Colloid Interface
Sci., 286(2) (2005) 579-588.
[10] K.F.V. Wong, T. Kurma, Transport properties of alumina nanofluids, Nanotechnology,
19(34) (2008) 345702 (345708 pp.).
[11] S. Ganguly, S. Sikdar, S. Basu, Experimental investigation of the effective electrical
conductivity of aluminum oxide nanofluids, Powder Technol., 196(3) (2009) 326-330.
[12] M.O. Lisunova, N.I. Lebovka, O.V. Melezhyk, Y.P. Boiko, Stability of the aqueous
suspensions of nanotubes in the presence of nonionic surfactant, J. Colloid Interface Sci.,
299(2) (2006) 740-746.
[13] J.C. Maxwell, A Treatise on Electricity and Magnetism, 2nd ed., Oxford University Press,
Cambridge, U.K., 1904.
[14] F. Carrique, F.J. Arroyo, M.L. Jimenez, A.V. Delgado, Influence of double-layer overlap on
the electrophoretic mobility and DC conductivity of a concentrated suspension of spherical
particles, J. Phys. Chem. B, 107(14) (2003) 3199-3206.
[15] F.l. Carrique, E. Ruiz-Reina, F.J. Arroyo, Ã.V. Delgado, Cell Model of the Direct Current
Electrokinetics in Salt-Free Concentrated Suspensions:The Role of Boundary Conditions,
The Journal of Physical Chemistry B, 110(37) (2006) 18313-18323.
[16] F. Carrique, E. Ruiz-Reina, Electrical conductivity of aqueous salt-free concentrated
suspensions. effects of water dissociation and CO2 contamination, J. Phys. Chem. B, 113(30)
(2009) 10261-10270.

84
[17] H. Ohshima, Electrokinetic phenomena in a dilute suspension of spherical colloidal particles
in a salt-free medium, Colloids and Surfaces A: Physicochemical and Engineering Aspects,
222(1-3) (2003) 207-211.
[18] H. Ohshima, Dynamic electrophoretic mobility of spherical colloidal particles in a salt-free
medium, J. Colloid Interface Sci., 265(2) (2003) 422-427.
[19] S. Kuwabara, The Forces experienced by Randomly Distributed Parallel Circular Cylinders
or Spheres in a Viscous Flow at Small Reynolds Numbers, J. Phys. Soc. Jpn., 14(4) (1959).
[20] A. Degen, M. Kosec, Effect of pH and impurities on the surface charge of zinc oxide in
aqueous solution, J. Eur. Ceram. Soc., 20(6) (2000) 667-673.
[21] R.W. O'Brien, L.R. White, Electrophoretic mobility of a spherical colloidal particle, Journal
of the Chemical Society Faraday Transactions II, 74 (1978) 1607-1626.
[22] E. Ruiz-Reina, F.l. Carrique, Electroviscous Effect of Concentrated Colloidal Suspensions in
Salt-Free Solutions, The Journal of Physical Chemistry C, 111(1) (2006) 141-148.

85
CHAPTER 5
CONCLUSIONS AND FUTURE WORK
5.1 CONCLUSIONS
This dissertation investigated nanofluids for applications involving boiling heat
transfer. The impact of nanoparticle deposition on the boiling performance of a surface
was studied using two different methods: particle deposition during boiling of nanofluids
and electrophoretic deposition of particles from a nanofluid. Also, the particle size and
concentration effects on the electrical conductivity of nanofluids were investigated.
The creation of a nanoparticle layer on the heated surface was shown to increase
the boiling performance of water up to 62% and correlate well with a model that uses
AFM-measured surface roughness data. Nanofluid boiling performance was shown to
increase by about 25% initially (compared to water) before the deposited nanoparticle
layer is completely formed. After the nanoparticle layer fully covers the heater surface,
the nanofluid boiling coefficient declines, which is to a suppression of bubble nucleation
and transport by the suspended nanoparticles.
High particle volume fraction nanofluids were used to create EPD coating and
demonstrated a significant improvement in boiling performance. When coating times
were sufficient, a nearly 200% increase in HTC was measured. The coating increased the
cavities available for nucleation, resulting in an increase in boiling HTC. The 2.9 times
increase in active nucleation site density calculated from the

86
experimental data matched well with the image analysis to determine the change in the
number of cavities (2.4 time increase). This demonstrated that the increase in nucleation
site density is potentially the cause of the improved boiling performance.
The experimentally measured electrical conductivity of nanofluids increased with
increasing volume fraction and decreasing particle size. For a 20 nm ZnO particle in
propylene glycol, the electrical conductivity increased by over 100 times, while the 40
nm and 60 nm particle sized suspensions increased nearly 25 and 20 times, respectively.
This large of an increase was not predicted by conventional models, which only predict a
small increase. A model developed for colloidal suspensions in a salt-free medium was
used to model the electrical conductivity of ZnO/PG nanofluids. The data for the 20 nm
and 40 nm suspensions fit well, while the model under predicted the 60 nm.
Furthermore, at higher volume fractions, the increase of electrical conductivity begins to
level off, which is attributed to ion condensation effects in the high surface charge
regime.
The major contributions of this research can be summarized as follows.
Nanofluid boiling was shown to be influenced by two competing processes. First,
nanofluids enhanced boiling by depositing layer of nanoparticles on the boiling
surface. Second, nanofluids degraded boiling performance due to the particles in
suspension which suppressed bubble growth. The increased boiling performance due
to the nanoparticle layer formed during boiling was attributed to a roughening of the
surface. This was corroborated with a model used to correlate the roughness with the
boiling heat transfer coefficient.

87
A novel method to create enhanced boiling surfaces using EPD of nanoparticles was
introduced. With adequate coating times, the EPD creates a layer which increases the
boiling heat transfer coefficient compared to an uncoated surface. The increase
boiling heat transfer due to the EPD coating was thought to be due to an increase in
nucleation site density. This was verified by comparing the calculated change in
nucleation site density from the experimental data to an estimation of cavities
obtained from SEM image analysis.
The electrical conductivity of nanofluids were measured and validated with a model
showing that the electrical conductivity increases with increasing volume fraction and
decreasing particle size. The model used was able to predict the large increase in
electrical conductivity of the nanofluids that could not be predicted with conventional
models. Also, the leveling off of electrical conductivity at higher volume fractions
was ascribed to ion condensation effects.
5.2 FUTURE WORK
This research has identified the need for future studies in the following areas.
1. Further study is needed for the mechanism of nanoparticle deposition during boiling
of nanofluids. Many researchers have observed this phenomenon and it was used in
this study to create enhanced boiling surfaces, but the process of particle attachment
is not well understood. Knowledge of this process could be used to create surfaces
designed specifically for boiling nanofluids.
2. This research showed that coating time played an important role during the EPD
process. Therefore, optimal coating parameters of the EPD process should be further

88
studied. Also, treatments after coating used in other EPD processes, such as
sintering, may change the quality of the layer. Once optimized, large scale
manufacturing using this coating method could be developed for specific applications
that require enhanced boiling surfaces.
3. EPD can be used to apply coatings to surfaces of different shapes and can be used to
infiltrate foams. So, the EPD of nanoparticles from nanofluids coating process could
be applied to boiling surfaces with enhanced features such as micro-fins and porous
foams to create hybrid surfaces for further enhancement.
4. To create a tunable thermal management system, an electric field could be applied to
the surfaces during boiling of nanofluids. In high performance situations, a field
could be applied to attract particles. In low performance situations, the field could be
turned off or reversed to prevent particle deposition.
5. To extend the model for electrical conductivity of nanofluids, a variety of particles
and base fluids of the nanofluids should be investigated. Since a fluid’s thermal and
electrical properties are often interrelated, information on the electrical conductivity
could lend new insight into the thermal conductivity enhancements of nanofluids.
This information could be used to weigh the tradeoffs between enhanced thermal
performance and increased electrical conductivity.