enhanced photovoltaic performance of inverted hybrid...
TRANSCRIPT

Enhanced photovoltaic performanceof inverted hybrid bulk-heterojunction solar cells using TiO2/reduced graphene oxide films aselectron transport layers
Andreia MoraisJoão Paulo C. AlvesFrancisco Anderson S. LimaMonica Lira-CantuAna Flavia Nogueira
Downloaded From: http://photonicsforenergy.spiedigitallibrary.org/ on 04/22/2015 Terms of Use: http://spiedl.org/terms

Enhanced photovoltaic performance of inverted hybridbulk-heterojunction solar cells using TiO2/reducedgraphene oxide films as electron transport layers
Andreia Morais,a João Paulo C. Alves,a Francisco Anderson S. Lima,b
Monica Lira-Cantu,b and Ana Flavia Nogueiraa,*aUniversity of Campinas (UNICAMP), Chemistry Institute, PO Box 6154,
Campinas-SP 13083-970, BrazilbAutonomous University of Barcelona (UAB), Catalan Institute of Nanocience and
Nanotechnology (ICN2), Building ICN2, Bellaterra, Barcelona E-0193, Spain
Abstract. In this study, we investigated inverted hybrid bulk-heterojunction solar cells with thefollowing configuration: fluorine-doped tin oxide (FTO) jTiO2∕RGOjP3HT∶PC61BMjV2O5 orPEDOT:PSS|Ag. The TiO2∕GO dispersions were prepared by sol-gel method, employing tita-nium isopropoxide and graphene oxide (GO) as starting materials. The GO concentration wasvaried from 0.1 to 4.0 wt%. The corresponding dispersions were spin-coated onto FTO sub-strates and a thermal treatment was performed to remove organic materials and to reduceGO to reduced graphene oxide (RGO). The TiO2∕RGO films were characterized by x-ray dif-fraction, Raman spectroscopy, and microscopy techniques. Atomic force microscopy (AFM)images showed that the addition of RGO significantly changes the morphology of the TiO2
films, with loss of uniformity and increase in surface roughness. Independent of the use ofV2O5 or PEDOT: PSS films as the hole transport layer, the incorporation of 2.0 wt% ofRGO into TiO2 films was the optimal concentration for the best organic photovoltaic perfor-mance. The solar cells based on TiO2∕RGO (2.0 wt%) electrode exhibited a ∼22.3% and∼28.9% short circuit current density (Jsc) and a power conversion efficiency enhancement,respectively, if compared with the devices based on pure TiO2 films. Kelvin probe force micros-copy images suggest that the incorporation of RGO into TiO2 films can promote the appearanceof regions with different charge dissipation capacities. © 2015 Society of Photo-OpticalInstrumentation Engineers (SPIE) [DOI: 10.1117/1.JPE.5.057408]
Keywords: nanocomposites; reduced graphene oxide; titanium oxide; inverted solar cells; vana-dium oxide; electron transport layer.
Paper 14093SSP received Nov. 5, 2014; accepted for publication Feb. 16, 2015; published onlineMar. 12, 2015.
1 Introduction
Inverted hybrid bulk-heterojunction solar cells based on conjugated polymers and fullerenederivatives have attracted much attention because of their numerous advantages. These devicesare considered promising candidates as renewable energy sources because of their low weight,low cost, stability and simple fabrication for large area processing.1 These solar cells occupy aprominent position in the context of photovoltaic devices for solar energy conversion into elec-tricity. This position is due to recent progress which allowed a significant increase in powerconversion efficiency (PCE) of these cells, reaching nearly 10% over the last years.2–4
Additional understanding of the interfaces involved in the inverted hybrid bulk-heterojunctionsolar cells is needed and thus, the development of new materials becomes crucial to furtherimprove the efficiency of these devices.
*Address all correspondence to: Ana Flavia Nogueira, E-mail: [email protected]
1947-7988/2015/$25.00 © 2015 SPIE
Journal of Photonics for Energy 057408-1 Vol. 5, 2015
Downloaded From: http://photonicsforenergy.spiedigitallibrary.org/ on 04/22/2015 Terms of Use: http://spiedl.org/terms

Currently, there is a great interest in developing new materials to act as the electron transportlayer (ETL) between the active layer and the conductive substrate in these devices.1 The mainrequirements for a given film to act as ETL involve high electron mobility and transparency inthe visible region in order to allow transmission of light into the active layer. These requirementslimit the choice to a few materials that have these characteristics, among which are the well-known and widely used titanium oxide (TiO2)
5,6 and zinc oxide (ZnO).7,8 These materials alsoexhibit good compatibility with the lowest unoccupied molecular orbital energy level for themajority of polymers used and act as hole blocking layers preventing a short circuit in the device.
The use of TiO2 films as ETL is advantageous due to their low toxicity, transparency, facilefabrication and well-known physical and chemical stability. In general, thin TiO2 films havebeen introduced as ETL because of their large bandgap (3.7 eV) and well-matched energy levels(valence band of ∼8.1 eV and conduction band of ∼4.4 eV). Thus, these films facilitate theelectron injection and transport; and at the same time, block the hole collection at the cathode.9
However, the slow charge carrier diffusion in a TiO2 film increases the probability for chargerecombination, resulting in decreased energy conversion efficiency of the solar cells. The prom-ising alternative to improve the electronic transport is the incorporation of carbonaceous materi-als, such as carbon nanotubes (CNTs),10 graphene, and their derivatives,11,12 into TiO2 films. In arecent work, Zhang et al.10 proposed the incorporation of CNTs in TiO2 films to act as ETL insolar cells with the following configuration: ITOjTiO2∕CNTsjP3HT∶PC61BMjMoO3jAl. In thiswork, they demonstrated that the conversion efficiency for these devices practically doubles withthe addition of a small amount of CNTs (0.1 wt%). This influence was closely associated withthe amount of CNTs. In addition, the devices assembled with TiO2/multiwalled carbon nanotube(MWCNT) or TiO2/single-walled carbon nanotube films showed similar photovoltaic behavior.In this context, due to the electron-accepting ability presented by these carbonaceous materials,there is also an interest in their use with the aim of improving the electron transport properties insemiconductor films.13
Graphene, a single layer of sp2-bonded carbon atoms tightly packed into a two-dimensionalhoneycomb structure, has attracted a lot of attention since its isolation in 2004, because of itsoutstanding mechanical, thermal, optical, and electrical properties.14 Various methods have beendeveloped for the preparation of graphene, including micromechanical exfoliation,15 epitaxialgrowth,16 electrochemical exfoliation of graphite in ionic liquids,17 and the chemical modifica-tion of graphite.18 The latter method was proven to be an effective, inexpensive method and wasoften applied in large-scale production of this material. In this case, the graphene oxide (GO)product is an electrically insulating material and usually possesses a rich assortment of oxygen-containing groups such as carboxyl, hydroxyl, carbonyl, and epoxy groups.19 However, the GOsheets can be reduced by several methods20–23 in order to increase their electrical conductivity bythe partial restoration of the sp2-hybridized network. In general, the resulting product, alsoknown as reduced graphene oxide (RGO), has properties similar to graphene, although thereduction methods do not fully restore the ideal characteristics of graphene sheets.14 Due toits high surface area, transparency and its electron-accepting properties, RGO is a good materialto enhance the charge carrier transport in semiconductors films, and consequently to improve theperformance of the devices.24
According to other reports, TiO2∕RGO nanocomposites have been widely investigated inphotovoltaic devices,25 photocatalysts,26,27 and lithium-ion batteries.28 Recently, in the field ofdye-sensitized solar cells (DSSC), graphene and its derivatives were employed as counter electro-des29,30 and TiO2∕RGO nanocomposites were used as a photoanode to improve the DSSC per-formance.31–33 Currently, there is an interest in using these nanocomposites as films to act as ETLin organic solar cells. In two recent works, Zhang et al.11,12 proposed the use of thin TiO2∕RGOfilms as ETL in inverted solar cells with the following configurations: ITOjTiO2∕RGOjP3HT∶PC61BMjMoO3jAg or ITO| and TiO2∕RGOjP3HT∶PC61BMjPEDOT∶PSSjAg. They reportedthat solar cells based on these composite films exhibit an improvement in the current density andalso in the energy conversion efficiency. Impedance measurements revealed that the TiO2∕RGOcomposite films as ETL could efficiently reduce the charge recombination and increase the elec-tron lifetime. Although the advantages of RGO sheet incorporation in any TiO2 matrix are widelydisseminated, a detailed explanation of the photovoltaic activity of these nanocomposites, as wellthe role of graphene and its derivatives is still very controversial and scarce in the literature. For this
Morais et al.: Enhanced photovoltaic performance of inverted hybrid bulk-heterojunction solar cells. . .
Journal of Photonics for Energy 057408-2 Vol. 5, 2015
Downloaded From: http://photonicsforenergy.spiedigitallibrary.org/ on 04/22/2015 Terms of Use: http://spiedl.org/terms

reason, there is a need for further studies to improve the general understanding of the photovoltaicbehavior when carbonaceous materials are used.
In this work, RGO was incorporated in TiO2 films to be used as ETL in inverted hybrid bulk-heterojunction solar cells aiming to decrease the charge recombination and to increase the energyconversion efficiency. The solar cells were assembled with the following configuration:FTOjTiO2 or TiO2∕RGOjP3HT∶PC61BMjV2O5jAg. Compared to the solar cell using onlyTiO2 as ELT, we observed that the incorporation of RGO (2.0 wt%) in the TiO2 film showedan increase of 22.3% in Jsc and hence an improvement in the conversion efficiency. In this case,independent of the use ofV2O5 or PEDOT:PSS films as the hole transport layer (HTL), the effectwas positive after adding 2.0 wt% of RGO into the TiO2 film. Kelvin probe force microscopy(KPFM) images suggest that the incorporation of RGO into TiO2 film promotes the appearanceof regions with different charge dissipation capacity. In others words, because of its conductiveproperties, the RGO can act as an electron collector in the TiO2 film, which facilitates a rapidelectron transport resulting in an increase in photocurrent and conversion efficiency.
2 Experimental Methods
2.1 Materials
All reagents were of analytical grade and used without further purification. The natural graphitepowder was purchased from Nacional de Grafite LTDA (code: Micrograf 99507 UJ). Poly(3-hexylthiophene) (P3HT) (regioregular, Merck®, 98%) was used as the electron donor material,and ½6;6�-phenyl-C61-butyric acid methyl ester (PC61BM) (Solenne BV, 99.5%) was used as theelectron acceptor material in the inverted solar cells. All other reagents were purchased fromSigma–Aldrich. The fluorine-doped tin oxide (FTO) conductive substrates were supplied bySOLEMS (sheet resistance: 70 to 100 Ω sq−1). The substrates were cleaned with water-detergentsolution, deionized water and ethanol (99%) successively in ultrasonic baths for 15 min. Allsubstrates were dried with compressed nitrogen and were treated in the UV surface decontami-nation system (Novascan, PSD-UV) connected to the oxygen supply for 20 min.
2.2 Synthesis of GO
GO was synthesized from natural graphite powder using a modified Hummers and Offeman’smethod.34 The graphite powder (10 g) was added to a mixture of concentrated H2SO4 (60 mL),K2S2O8 (5 g) and P2O5 (5 g). The solution was heated to 80°C in an oil bath and was stirred for6 h. The mixture was then carefully diluted with distilled water, filtered, and washed until therinse water pH turned neutral. The product was dried in air at ambient temperature overnight.The preoxidized graphite powder was added to a mixture of concentrated H2SO4 (200 mL) andNaNO3 (5 g) under vigorous stirring, and the solution was cooled to 0°C. Next, 15 g of KMnO4
was added gradually under stirring and the temperature of the mixture was kept below 20°C. Themixture was stirred at 40°C for 4 h, and then diluted with distilled water (2 L) in an ice bath. Thereaction was terminated by the addition of 30% (v/v) H2O2 solution (50 mL) and a brilliantyellow product was formed along with bubbling. The mixture was filtered and washed with3% (v/v) H2SO4 solution in order to remove metal ions. The GO product was suspended indistilled water to give a viscous and brown dispersion, which was subjected to dialysis to com-pletely remove metal ions and acids. The resulting GO dispersion (1.8% w/w) was used in thepreparation of thin TiO2∕RGO films.
2.3 Preparation of Thin TiO2∕RGO Film
Initially, the water present in the GO dispersion was removed to avoid immediate hydrolysis andcondensation of the titanium isopropoxide ½TiðOi PrÞ4�, which is the precursor of TiO2. In thiscase, the solvent exchange was carried out as follows: an aliquot (∼420 mg) of the aqueous GOdispersion (1.8% w/w) was dispersed first in ethanol and then diethyl ether was added, in a ratioof 1:5 (v/v). The GO precipitates due to the addition of a bad solvent (diethyl ether). After
Morais et al.: Enhanced photovoltaic performance of inverted hybrid bulk-heterojunction solar cells. . .
Journal of Photonics for Energy 057408-3 Vol. 5, 2015
Downloaded From: http://photonicsforenergy.spiedigitallibrary.org/ on 04/22/2015 Terms of Use: http://spiedl.org/terms

removing the supernatant by centrifugation, the solvent exchange procedure was repeated toensure complete removal of water. Evaporation of the solvent was carried out in a vacuumoven. The dry GO was redispersed in ethanol (3.0 mL) using an ultrasonic bath and then ace-tylacetone (140 μL) and TiðOi PrÞ4 (200 μL) were added to the dispersion. The browndispersion was designated as TiO2∕GO (4.0 wt%). The dispersion containing only TiO2 wasalso prepared from a mixture of TiðOi PrÞ4 (200 μL), acetylacetone (140 μL) and ethanol(3.0 mL). Other dispersions as TiO2∕GO (2.0 wt%), TiO2∕GO (1.0 wt%), TiO2∕GO(0.5 wt%), and TiO2∕GO (0.1 wt%) were prepared by dilution of the TiO2∕GO (4.0 wt%)using the dispersion containing only TiO2 as the diluent. The TiO2 and TiO2∕GO dispersionswere deposited on the FTO substrates by spin-coating followed by thermal treatment at 350°Cfor 1 h with a heating rate of 10°Cmin−1. This thermal treatment step is very important to removethe organic materials and also to reduce GO to RGO, which is a more conductive material thanGO. The resulting films, with a thickness around 30 to 60 nm as estimated by the scanningelectron microscopy (SEM) images (see Fig. 13 in Appendix), were transparent and uniformwithout any noticeable cracks. All the nanocomposite films were denominated as TiO2∕RGO.
2.4 Characterization
X-ray diffraction measurements were performed directly on the samples of GO, RGO, TiO2 andTiO2∕RGO films using a Shimadzu XRD 7000 diffractometer (40 kV, 30 mA) with Cu(λ ¼ 1.541 78 Å) irradiation in the 2θ range of 5 to 80 deg. The Raman spectra of the sampleswere obtained in a confocal Raman spectrometer (model T64000, Jobin Yvon, USA), equippedwith a charge coupled device detector and an Olympus BTH 2 microscope. The excitation laserwas set at 514 nm with a 20-fold magnification objective lens. The thermal stability of thelyophilized GO sample was analyzed on TA Instruments 2950 thermogravimetric analyzer ata heating rate of 10°Cmin−1, using a synthetic air stream (100 dm3 min−1) in the temperaturerange of 50°C to 1000°C and the average sample weight was within the range of 3 to 5 mg.
AThermo VG Scientific Sigma Probe instrument was used to carry out the x-ray photoelec-tron spectroscopy (XPS) analysis of the GO and RGO (350°C for 1 h) films. The monochromaticAl Kα x-ray source (1486.6 eV) was focused on the sample (400 μm2 size). The high resolutionspectra were collected with a pass energy of 20 eV and an energy step size of 0.1 eV with theflood gun turned on to eliminate any surface charge. TiO2 and TiO2∕RGO films deposited ontoFTO substrates were characterized by atomic force microscopy (AFM) and KPFM analysis.AFM and KPFM measurements were obtained simultaneously using a NX10 Atomic ForceMicroscope from Park Systems in the tapping mode with a three lock-in module. TheKPFM images were obtained in dry atmosphere and an electrical frequency of 17 kHz withan amplitude of 5 V was used. A Pt/Ir-coated tip with a mechanical resonance frequency of75 kHz and a force constant of 2.8 Nm−1 was used.
Optical microscopy images were taken with a Nikon Eclipse 5i (H5505, Nikon, Japan)microscope equipped with Digital Sight Camera System (DS-Fi1 Nikon, Japan) and usingan objective lens with a magnification of 4 × ∕0.10. The optical absorption spectra of theTiO2 and the TiO2∕RGO films were measured by using a Varian spectrophotometer, modelCary 5G UV-VIS, NIR, with a diffuse reflectance accessory. Measurements were carried outwithin the range of 300 to 800 nm, using Teflon as a reference material for all samples.
2.5 Fabrication of Photovoltaic Devices
In this work, we fabricated inverted hybrid bulk-heterojunction solar cells with the followingconfiguration: FTOjTiO2∕RGOjP3HT∶PC61BMjV2O5jAg. First, solutions of P3HT andPC61BM were prepared with 1∶1 ratio and the total concentration of P3HT∶PC61BM was60 mgmL−1 in chlorobenzene. On the FTO substrates coated with thin TiO2 andTiO2∕RGO films, the P3HT∶PC61BM solution was spin-coated at 1000 rpm and the thicknessof the active layer was about 200 nm. The films were annealed at 150°C for 15 min in an N2-filled glove box. The V2O5 hydrate solution was obtained using the procedure described in theliterature.35 In this case, a 1∶1 mixture of V2O5 hydrate (9 mgmL−1) in isopropanol was spin-coated at 3000 rpm on the FTOjTiO2 or TiO2∕RGOjP3HT∶PC61BM and then annealed at 150°C
Morais et al.: Enhanced photovoltaic performance of inverted hybrid bulk-heterojunction solar cells. . .
Journal of Photonics for Energy 057408-4 Vol. 5, 2015
Downloaded From: http://photonicsforenergy.spiedigitallibrary.org/ on 04/22/2015 Terms of Use: http://spiedl.org/terms

for 15 min in an N2-filled glove box. A 100-nm thick Ag back metal electrode was deposited bythermal evaporation in an evaporation system (Auto 306, Boc Edwards) with a base pressure of10−7 torr at the deposition rate of 1.0 Å s−1. The final active area was 0.17 cm−2. The configu-ration of the devices (FTOjTiO2∕RGOjP3HT∶PC61BMjV2O5jAg) and the chemical structuresof P3HT and PC61BM are shown in Fig. 1.
For other the configuration (FTOjTiO2∕RGOjP3HT∶PC61BMjPEDOT∶PSSjAg), thePEDOT:PSS layer was spin-coated at 5000 rpm over the active layer (FTOjTiO2∕RGOjP3HT∶PC61BM). The PEDOT:PSS commercial solution was modified by the addition of the surfactant(Zonyl FS300) with a ratio of Zonyl : PEDOT:PSS equal to 0.5% w/w. The films were annealedat 150°C for 15 min in an N2-filled glove box. A 100-nm thick Ag back metal electrode wasdeposited by thermal evaporation as described previously.
2.6 Photovoltaic Characterization
The solar simulation was performed on a KHS1200 (Steuernagel Solarkonstant) equipped withan AM1.5 filter for all characterizations (100 mWcm−2, AM1.5G). The equipment was cali-brated according to the ASTM G173 standard. J–V curves were measured using a Keithley2601 multimeter. The light intensity was calibrated to 100 mWcm−2 with a Zipp&KonenCM-4 pyranometer, which was used constantly during measurements to set the light intensity,and a calibrated S1227-1010BQ photodiode from Hamamatsu was also used for calibrationbefore each measurement. Incident photon-to-current conversion efficiency (IPCE) analyseswere done with a QE/IPCE measurement System from Oriel (from 300 to 700 nm; at10 nm intervals). The results were not corrected for any intensity losses due to light absorptionor reflection by the glass substrates.
3 Results
3.1 Morphological and Structural Characterization of the GO and RGO Films
The GO and RGO films were characterized through x-ray diffraction and Raman spectroscopy,and the results are shown in Figs. 2(a) and 2(b), respectively.
According to Fig. 2(a), the XRD diffraction pattern of the GO film exhibits a peak at 2θ ¼10.7° corresponding to an interplanar spacing of dð002Þ ¼ 8.3 Å. Other diffraction peaks cor-respond to the crystalline phases of the FTO conductive substrate, and these are marked withasterisks (*). The increased interplanar distance from the characteristic peak of graphite (3.35 Å)is related to the presence of oxygen-containing functional groups and water molecules intro-duced into the carbon lattice during the oxidation.36 When the GO film is heat-treated at350°C for 1 h, the 2θ peak at 10.7° disappears and a broader and weaker peak centered at around2θ ¼ 21.5° with a interplanar spacing of dð002Þ ¼ 4.1 Å is observed. This implies that the oxy-gen-containing functional groups of GO were partially removed through thermal treatment andwithout adding any reducing agent.37 There is also a noticeable decrease in the intensity of thediffraction peak due to the loss of crystallinity of the material, with the formation of more dis-ordered, less packed structures.
Fig. 1 Representation of the inverted solar cell assembled with the following configuration:FTOjTiO2∕RGOjP3HT∶PC61BMjV2O5jAg. Chemical structures of the P3HT and the PC61BM.
Morais et al.: Enhanced photovoltaic performance of inverted hybrid bulk-heterojunction solar cells. . .
Journal of Photonics for Energy 057408-5 Vol. 5, 2015
Downloaded From: http://photonicsforenergy.spiedigitallibrary.org/ on 04/22/2015 Terms of Use: http://spiedl.org/terms

The Raman spectra [Fig. 2(b)] of the GO and RGO films exhibit three vibrational modes at1360, 1600 and 2700 cm−1, corresponding to the D, G and 2-D bands, respectively. The G band isrelated to the E2g vibration mode of the sp2 carbon domains and it can be used to ascertain thedegree of graphitization, whereas the D band is associated with structural defects and partiallydisordered structures of the sp3 domains. The 2-D band is the second order of the D bandand its frequency is generally used to quantify the number of graphene layers and stackingorder in few-layers graphene.38,39 The intensity ratio between the D and G bands (ID∕IG) isoften used as a parameter to correlate the disorder degree in the carbonaceous structures.38 Inthis case, the ID∕IG ratio was 0.93 for the GO film and 0.96 for the RGO film. This small changesuggests that a decrease in the average size of the sp2 domains formed during the thermal treatmentat 350°C for 1 h. It is reasonable to consider that the reduction of GO causes fragmentation alongthe reactive sites and yields new graphitic domains, which led to the RGO sheets being smaller butmore numerous. The small size of the RGO sheets will result in a large number of edges. The edgeswill act as defects. This explains the presence of the D band, with considerable intensity, even afterthe thermal reduction of GO.40,41 Furthermore, the thermal treatment at 350°C for 1 h promoted thepartial removal of the labile oxygen-containing functional groups, as proposed in the thermogra-vimetric analysis (TGA) curve obtained for the lyophilized GO sample (see Fig. 13 in Appendix).42
XPS was used to determine the chemical composition of the GO and RGO (350°C for 1 h)films. XPS survey spectra (up to 1000 eV) were obtained to identify and quantify the elementsand chemical groups present in these samples, as shown in Fig. 14 (see in Appendix). The spec-tra essentially showed the presence of the elements carbon (C1s) and oxygen (O1s) in the regionaround 284 and 532 eV, respectively. Table 3 (see in Appendix) details the atomic percentagesfound in these samples. In the RGO film, the C percentage was 85.2 at% (and 14.8 at% of O),compared to 67.0 at% (and 33.0 at% of O) in the GO film. This is an indication that the oxygen-containing functional groups have been partially removed after the thermal treatment at 350°Cfor 1 h. High resolution XPS C1s spectra obtained for these films are shown in Fig. 3.
The XPS C1s peak of the GO film [Fig. 3(a)] can be decomposed into seven componentswhich correspond to the following functional groups: sp2-hybridized carbon (C═C, 284.2 eV),sp3-hybridized carbon (C─C, 284.9 eV), hydroxyl/phenols (C─OH, 285.5 eV), epoxy/ether(C─O─C, 286.4 eV), carbonyl (C═O, 287.7 eV), carboxyl (O─C═O, 288.7 eV) groups anda shake-up satellite peak (π → π�, 289.8 eV), characteristic of aromatic C structures.43–45
The XPS C1s analysis suggests that the GO film contains a large number of functional groupson its surface such as epoxy, carbonyl, hydroxyl, and carboxyl groups. The XPS spectrum of theRGO film [Fig. 3(b)] shows that the same peaks are related to the oxygen containing functionalgroups, however, they are much less intense. Through this analysis, it was possible to demon-strate the presence of oxygen functional groups on the surface even after a reduction process bythermal treatment at 350°C for 1 h, indicating that the GO film was not fully reduced. However, itwas sufficient to increase the aromatic character of the material, turning RGO into a more con-ductive material than the GO.40,46–48 Another interesting fact can be evidenced in Table 4 (seeAppendix) where the concentration of C═C bonds (∼53%) found in the RGO film is larger than
Fig. 2 (a) X-ray diffraction patterns and (b) Raman spectra for FTO substrate, GO, and RGO (350°C for 1 h) films.
Morais et al.: Enhanced photovoltaic performance of inverted hybrid bulk-heterojunction solar cells. . .
Journal of Photonics for Energy 057408-6 Vol. 5, 2015
Downloaded From: http://photonicsforenergy.spiedigitallibrary.org/ on 04/22/2015 Terms of Use: http://spiedl.org/terms

the GO film (∼32%). This is another evidence of almost complete restoration of the sp2-hybrid-ized network in the RGO film after thermal treatment.
3.2 Morphological and Structural Characterization of the TiO2∕RGO Films
Figure 4 exhibits the XRD diffraction pattern and the Raman spectra of the FTO substrate, TiO2,TiO2∕RGO (2.0 wt%) films and TiO2∕RGO (2.0 wt%) powder when subjected to thermal treat-ment at 350°C for 1 h.
The crystal planes corresponding to the titanium oxide were not observed directly in the XRDdiffraction pattern in Fig. 4(a). This can be due to the overlap from other diffraction peaks thatcorrespond to crystalline phases of the FTO substrate [marked with asterisks (*)]. The x-raydiffraction patterns obtained for the TiO2∕RGO (2.0 wt%) powder exhibit a good crystallinity.The peaks at 2θ values of 25.2, 37.8, 47.9, 53.9, 55.1, 62.6, 68.9, 70.2 and 75.2 deg can beindexed to (101), (004), (200), (105), (211), (204), (220), (116), and (215) planes of anatasetitania, respectively. No diffraction peak was detected for the carbon species in the films,due to both the low concentration and the low relative intensity of the main diffraction peakfor RGO [see Fig. 2(a)]. However, the Raman spectra [Fig. 4(b)] showed wide and less intensebands vibrations in the region between 300 and 800 cm−1 which are associated with the titaniumoxide. In the TiO2∕RGO (2.0 wt%) film, the presence of RGO was confirmed with the appear-ance of three vibrational modes at 1358, 1607 and 2690 cm−1 related to D, G and 2-D bands,respectively. The ID∕IG ratio around 1.0 suggests a relative increase in structural disorder inrelation to the film containing only RGO (ID∕IG ¼ 0.96), possibly because of the interactionbetween the RGO sheets and TiO2 nanoparticles.
Fig. 3 XPS spectrum of the carbon region (C1s) for (a) GO and (b) RGO (350°C for 1 h) films.
Fig. 4 (a) X-ray diffraction patterns for FTO substrate, TiO2, TiO2∕RGO (2.0 wt%) films, andTiO2∕RGO (2.0 wt%) powder. (b) Raman spectra for FTO substrate, TiO2, and TiO2∕RGO(2.0 wt%) films.
Morais et al.: Enhanced photovoltaic performance of inverted hybrid bulk-heterojunction solar cells. . .
Journal of Photonics for Energy 057408-7 Vol. 5, 2015
Downloaded From: http://photonicsforenergy.spiedigitallibrary.org/ on 04/22/2015 Terms of Use: http://spiedl.org/terms

Optical microscopy images (Fig. 5) of the TiO2, TiO2∕RGO (0.1 wt%), TiO2∕RGO (0.5 wt%),TiO2∕RGO (1.0 wt%), TiO2∕RGO (2.0 wt%), and TiO2∕RGO (4.0 wt%) films were obtained inorder to evaluate how the RGO sheets are distributed throughout the TiO2 film.
In this case, the RGO sheets are well distributed throughout the composite films, probably onthe surface, independent of the RGO concentration. In addition, the size and shape of the RGOsheets vary widely for all the TiO2∕RGO films. The increased surface roughness of thecomposite films with increasing RGO concentration was also observed through these images.The TiO2∕RGO (4.0 wt%) film [Fig. 5(f)], for example, shows many regions with agglomer-ations of the RGO sheets providing a rougher appearance compared to the other composite films.Another important factor to be considered is the thickness of the TiO2 and TiO2∕RGO films,estimated in this work through SEM images obtained by the cross-section of all films.
Figure 13 (see in Appendix) illustrates a graph relating thickness variation versus the con-centration of RGO (%) for each film. This graph shows that the thickness increased significantlyfrom 32.2 to 58.5 nm when the concentration of RGO ranged from 0 to 1.0 wt%. At higher RGOconcentrations, the thickness has not changed significantly. The TiO2∕RGO (4.0 wt%) film, forexample, presented a thickness of about 61 nm, which is relatively close to the value measuredfor the TiO2∕RGO (1.0 wt%) film (∼58.3 nm). The increased thickness of the films is directlyrelated to the increased viscosity of the TiO2 dispersions due to the addition of GO. In general,these features, such as roughness and thickness, influence the performance of the photovoltaicdevices.
In order to investigate the morphological effect of the introduction of RGO in TiO2 films,AFM images were obtained and presented in Fig. 6. The AFM image shows that the FTO sub-strate has a surface roughness around 7.6 nm and a homogeneous size distribution and grainshape. The film containing only TiO2 has a low surface roughness (RMS ¼ 3.5� 0.1 nm).The decrease in roughness is related to coating of the FTO substrate by the thin TiO2 film.The addition of RGO significantly changes the morphology of the TiO2 films, with loss of uni-formity and increase in surface roughness. With the addition of RGO (2.0 wt%) and (4.0 wt%),the surface roughness was 16.2� 1.6 and 12.6� 0.8 nm, respectively. Tsai et al.49 observed thesame behavior: the increase in roughness with increasing amount of RGO incorporated into TiO2
films is not linear, due to the heterogeneity of the composite films. The AFM images for theTiO2∕RGO films also show that a part of the RGO sheets are on the surface of the TiO2 film. Wealso found other regions in the AFM images where the RGO sheets are decorated with TiO2
nanoparticles. In conclusion, we obtain a heterogeneous mixture between the two components:RGO and TiO2.
KPFM measurements were obtained in the same area of the AFM images to compare theelectric potential distribution on the surface of the FTO substrate, TiO2 and TiO2∕RGO films.
Fig. 5 Opticalmicroscopy images of the (a) TiO2, (b) TiO2∕RGO (0.1wt%), (c) TiO2∕RGO (0.5wt%),(d) TiO2∕RGO (1.0 wt%), (e) TiO2∕RGO (2.0 wt%) and (f) TiO2∕RGO (4.0 wt%) films.
Morais et al.: Enhanced photovoltaic performance of inverted hybrid bulk-heterojunction solar cells. . .
Journal of Photonics for Energy 057408-8 Vol. 5, 2015
Downloaded From: http://photonicsforenergy.spiedigitallibrary.org/ on 04/22/2015 Terms of Use: http://spiedl.org/terms

The voltage profiles of the substrate and films, obtained in 5 × 5 μm2 sections, are presented inFig. 7. The average surface potential (SP) values for the FTO substrate, TiO2 and TiO2∕RGOfilms were calculated. The FTO substrate presented a homogeneous electric potential distribu-tion with average SP value of −0.86 V. The substrate was used as reference and the relative SPvalues were obtained for TiO2 and TiO2∕RGO films.50 For the TiO2 films, a homogeneous elec-tric potential distribution with little contrast is found, being the relative SP of−0.07 V. The SP ofthe films after incorporation of RGO (2.0 wt%) increased to 0.18 V, and the potential distributionbecomes heterogeneous, allowing a clearer view of regions with different charge densities. Theeffect observed in TiO2∕RGO (4.0 wt%) film is a more positive shift in SP values, however, theelectrical potential is a little more homogeneous. The changes in the electrical potential show thatafter RGO introduction, regions with different charge dissipation capacity were created. In aprevious work, we studied TiO2/MWCNT composite films and the variation of SP of thefilms was attributed to grain boundaries, showing different charge densities between the grainsand the interfaces.51 Even with a substantial difference between the surface roughness of thefilms containing TiO2 and TiO2∕RGO, as demonstrated by AFM images, the change in SPof the TiO2 film after the addition of RGO is significant, indicating that the grains have a relativedifference in charge density between themselves and their interfaces.
Liscio et al.52 demonstrated that introduction of TiO2 nanorods into P3HT film promotes thedecrease in SP, improving the charge dissipation in active layers. Under illumination, negativeshifts in SP were observed for P3HT∕TiO2 bulk heterojunction deposited under ITO/PEDOT:PSS substrates. This fact was attributed to the photogenerated electrons and the hole drift toITO.52 In inverted hybrid bulk-heterojunction solar cells using TiO2/reduced GO films, electronsare referred to the FTO substrate. The introduction of reduced GO into TiO2 films promotes apositive shift in SP values. This shift can suggest that electrons are transported to the FTO sub-strate, while holes remain in the TiO2∕RGO surface. Thus, the electron collection capacity canbe increased with the addition of RGO.
Fig. 6 AFM images of the (a) FTO substrate, (b) TiO2, (c) TiO2∕RGO (2.0 wt%), and(d) TiO2∕RGO (4.0 wt%) films.
Morais et al.: Enhanced photovoltaic performance of inverted hybrid bulk-heterojunction solar cells. . .
Journal of Photonics for Energy 057408-9 Vol. 5, 2015
Downloaded From: http://photonicsforenergy.spiedigitallibrary.org/ on 04/22/2015 Terms of Use: http://spiedl.org/terms

Figure 8 shows the UV-visible absorption spectra of the TiO2 and TiO2∕RGO films. A sig-nificant increase in the absorption at wavelengths shorter than 400 nm is assigned to the intrinsicband gap absorption of the titanium oxide (∼3.2 eV).53 The presence of RGO significantlyaffects the light absorption in all TiO2∕RGO films. Films with higher amounts of RGO resultedin darker films showing an increase in light adsorption within the investigated region. Thisbehavior will have an important implication in the efficiency of photovoltaic devices, as willbe discussed in the next section.
3.3 Photovoltaic Performance of the Devices
The inverted hybrid bulk-heterojunction solar cells (FTOjTiO2 or TiO2∕RGOjP3HT∶PC61BMjV2O5jAg) were characterized using J–V curves obtained under illumination
Fig. 7 KPFM images of the (a) FTO substrate, (b) TiO2 (c) TiO2∕RGO (2.0 wt%), and(d) TiO2∕RGO (4.0 wt%) films.
Fig. 8 UV-vis absorption spectra for the thin TiO2∕RGO films.
Morais et al.: Enhanced photovoltaic performance of inverted hybrid bulk-heterojunction solar cells. . .
Journal of Photonics for Energy 057408-10 Vol. 5, 2015
Downloaded From: http://photonicsforenergy.spiedigitallibrary.org/ on 04/22/2015 Terms of Use: http://spiedl.org/terms

(100 mWcm−2, AM 1.5G) and dark conditions. The effect of incorporation of different amountsof RGO into the TiO2 film was studied and the results are shown in Fig. 9.
The performance of the devices was dependent on the concentration of RGO incorporatedinto TiO2 films. The J–V curves show that at low concentrations of RGO (<2.0 wt%), there wasa marked increase in the short circuit current density (Jsc) and fill factor (FF) values. Noticeably,there was only a small difference between the results with the TiO2∕RGO films containing 0.1,0.5, 1.0, and 2.0 wt% of RGO. However, a dramatic decrease in performance was observed usingTiO2 films containing a higher concentration of RGO (4.0 wt%). In this case, the increasedcharge recombination was one of the main factors of the decline in the efficiency of these devicesand this effect can also be evidenced by observing the J–V curves in the dark (Fig. 9).
For the investigation of the effect of the RGO concentration in the TiO2 film, seven differentdevices (n ¼ 7) for each concentration of RGO were assembled and then the average and stan-dard deviation of the results were obtained. Table 1 shows the photovoltaic parameters shortcircuit current density (Jsc), open circuit potential (Voc), FF, PCE, series resistance (Rs), andshunt resistance (Rsh), calculated from the J–V curves obtained in the inverted solar cellsusing TiO2 films with different concentrations of RGO as ETL. Graphs for all photovoltaicparameters (Jsc, Voc, FF, PCE, Rs, and Rsh) were constructed with their respective averageand standard deviation versus the concentration of RGO in the TiO2 film shown in Fig. 10.
As shown in Table 1, when the concentration of RGO increases from 0 to 2.0 wt% in the TiO2
film, the average Jsc increases from 7.94 to 9.71 mA cm−2, and then decreases to 7.41 mA cm−2
when the amount of RGO is further increased (4.0 wt%). This behavior is apparent in Fig. 10(a),
Fig. 9 J − V curves for the inverted hybrid bulk-heterojunction solar cells (FTOjTiO2 orTiO2∕RGOjP3HT∶PC61BMjV2O5jAg) using TiO2, TiO2∕RGO (0.1 wt%), TiO2∕RGO (0.5 wt%),TiO2∕RGO (1.0 wt%), TiO2∕RGO(2.0 wt%), and TiO2∕RGO (4.0 wt%) films as ETL; under illumi-nation (100 mWcm−2, AM 1.5G) and dark conditions. Active cell area: 0.17 cm−2.
Table 1 Photovoltaic parameters obtained for inverted hybrid bulk-heterojunction solar cells(FTOjTiO2 or TiO2∕RGOjP3HT∶PC61BMjV2O5jAg) using TiO2, TiO2∕RGO (0.1 wt%),TiO2∕RGO (0.5 wt %), TiO2∕RGO (1.0 wt %), TiO2∕RGO (2.0 wt %), and TiO2∕RGO (4.0 wt %)films as ETL. Active cell area: 0.17 cm−2.
Films Jsc (mAcm−2) V oc (V) FF (%) PCE (%) Rs (105 Ω ) Rsh (105 Ω)
TiO2 7.94 � 0.66 0.51� 0.01 44.0� 1.22 1.80� 0.18 1.39� 0.34 1.15� 0.16
TiO2∕RGO (0.1 wt%) 9.43� 0.16 0.51� 0.01 45.5� 1.39 2.20� 0.13 1.16� 0.08 1.27� 0.17
TiO2∕RGO (0.5 wt%) 9.59� 0.58 0.50� 0.01 45.4� 0.56 2.19� 0.11 1.11� 0.05 1.28� 0.09
TiO2∕RGO (1.0 wt%) 9.49� 0.61 0.51� 0.01 46.0� 1.39 2.22� 0.12 1.13� 0.11 1.33� 0.10
TiO2∕RGO (2.0 wt%) 9.71� 0.50 0.51� 0.01 47.4� 2.26 2.32� 0.07 1.02� 0.12 1.38� 0.15
TiO2∕RGO (4.0 wt%) 7.41� 0.58 0.51� 0.01 42.4� 3.25 1.58� 0.14 1.66� 0.28 1.38� 0.15
Morais et al.: Enhanced photovoltaic performance of inverted hybrid bulk-heterojunction solar cells. . .
Journal of Photonics for Energy 057408-11 Vol. 5, 2015
Downloaded From: http://photonicsforenergy.spiedigitallibrary.org/ on 04/22/2015 Terms of Use: http://spiedl.org/terms
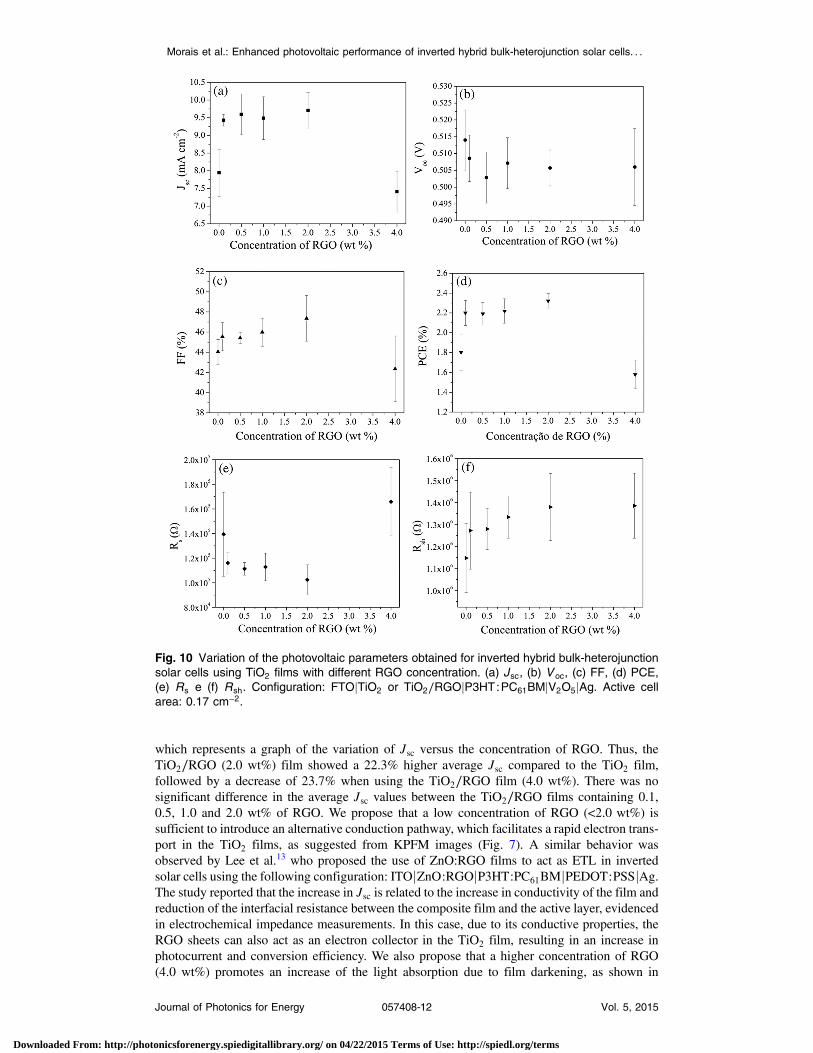
which represents a graph of the variation of Jsc versus the concentration of RGO. Thus, theTiO2∕RGO (2.0 wt%) film showed a 22.3% higher average Jsc compared to the TiO2 film,followed by a decrease of 23.7% when using the TiO2∕RGO film (4.0 wt%). There was nosignificant difference in the average Jsc values between the TiO2∕RGO films containing 0.1,0.5, 1.0 and 2.0 wt% of RGO. We propose that a low concentration of RGO (<2.0 wt%) issufficient to introduce an alternative conduction pathway, which facilitates a rapid electron trans-port in the TiO2 films, as suggested from KPFM images (Fig. 7). A similar behavior wasobserved by Lee et al.13 who proposed the use of ZnO:RGO films to act as ETL in invertedsolar cells using the following configuration: ITOjZnO:RGOjP3HT:PC61BMjPEDOT:PSSjAg.The study reported that the increase in Jsc is related to the increase in conductivity of the film andreduction of the interfacial resistance between the composite film and the active layer, evidencedin electrochemical impedance measurements. In this case, due to its conductive properties, theRGO sheets can also act as an electron collector in the TiO2 film, resulting in an increase inphotocurrent and conversion efficiency. We also propose that a higher concentration of RGO(4.0 wt%) promotes an increase of the light absorption due to film darkening, as shown in
Fig. 10 Variation of the photovoltaic parameters obtained for inverted hybrid bulk-heterojunctionsolar cells using TiO2 films with different RGO concentration. (a) Jsc, (b) V oc, (c) FF, (d) PCE,(e) Rs e (f) Rsh. Configuration: FTOjTiO2 or TiO2∕RGOjP3HT∶PC61BMjV2O5jAg. Active cellarea: 0.17 cm−2.
Morais et al.: Enhanced photovoltaic performance of inverted hybrid bulk-heterojunction solar cells. . .
Journal of Photonics for Energy 057408-12 Vol. 5, 2015
Downloaded From: http://photonicsforenergy.spiedigitallibrary.org/ on 04/22/2015 Terms of Use: http://spiedl.org/terms
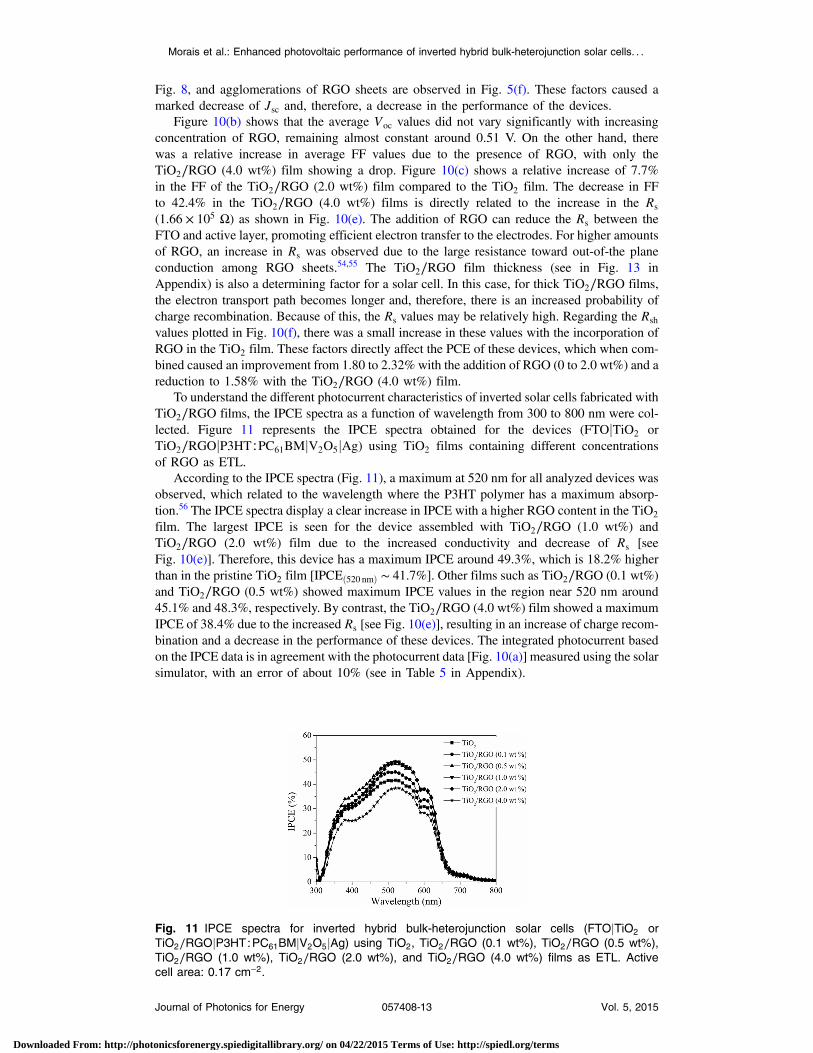
Fig. 8, and agglomerations of RGO sheets are observed in Fig. 5(f). These factors caused amarked decrease of Jsc and, therefore, a decrease in the performance of the devices.
Figure 10(b) shows that the average Voc values did not vary significantly with increasingconcentration of RGO, remaining almost constant around 0.51 V. On the other hand, therewas a relative increase in average FF values due to the presence of RGO, with only theTiO2∕RGO (4.0 wt%) film showing a drop. Figure 10(c) shows a relative increase of 7.7%in the FF of the TiO2∕RGO (2.0 wt%) film compared to the TiO2 film. The decrease in FFto 42.4% in the TiO2∕RGO (4.0 wt%) films is directly related to the increase in the Rs
(1.66 × 10⁵ Ω) as shown in Fig. 10(e). The addition of RGO can reduce the Rs between theFTO and active layer, promoting efficient electron transfer to the electrodes. For higher amountsof RGO, an increase in Rs was observed due to the large resistance toward out-of-the planeconduction among RGO sheets.54,55 The TiO2∕RGO film thickness (see in Fig. 13 inAppendix) is also a determining factor for a solar cell. In this case, for thick TiO2∕RGO films,the electron transport path becomes longer and, therefore, there is an increased probability ofcharge recombination. Because of this, the Rs values may be relatively high. Regarding the Rsh
values plotted in Fig. 10(f), there was a small increase in these values with the incorporation ofRGO in the TiO2 film. These factors directly affect the PCE of these devices, which when com-bined caused an improvement from 1.80 to 2.32% with the addition of RGO (0 to 2.0 wt%) and areduction to 1.58% with the TiO2∕RGO (4.0 wt%) film.
To understand the different photocurrent characteristics of inverted solar cells fabricated withTiO2∕RGO films, the IPCE spectra as a function of wavelength from 300 to 800 nm were col-lected. Figure 11 represents the IPCE spectra obtained for the devices (FTOjTiO2 orTiO2∕RGOjP3HT∶PC61BMjV2O5jAg) using TiO2 films containing different concentrationsof RGO as ETL.
According to the IPCE spectra (Fig. 11), a maximum at 520 nm for all analyzed devices wasobserved, which related to the wavelength where the P3HT polymer has a maximum absorp-tion.56 The IPCE spectra display a clear increase in IPCE with a higher RGO content in the TiO2
film. The largest IPCE is seen for the device assembled with TiO2∕RGO (1.0 wt%) andTiO2∕RGO (2.0 wt%) film due to the increased conductivity and decrease of Rs [seeFig. 10(e)]. Therefore, this device has a maximum IPCE around 49.3%, which is 18.2% higherthan in the pristine TiO2 film [IPCEð520 nmÞ ∼ 41.7%]. Other films such as TiO2∕RGO (0.1 wt%)and TiO2∕RGO (0.5 wt%) showed maximum IPCE values in the region near 520 nm around45.1% and 48.3%, respectively. By contrast, the TiO2∕RGO (4.0 wt%) film showed a maximumIPCE of 38.4% due to the increased Rs [see Fig. 10(e)], resulting in an increase of charge recom-bination and a decrease in the performance of these devices. The integrated photocurrent basedon the IPCE data is in agreement with the photocurrent data [Fig. 10(a)] measured using the solarsimulator, with an error of about 10% (see in Table 5 in Appendix).
Fig. 11 IPCE spectra for inverted hybrid bulk-heterojunction solar cells (FTOjTiO2 orTiO2∕RGOjP3HT∶PC61BMjV2O5jAg) using TiO2, TiO2∕RGO (0.1 wt%), TiO2∕RGO (0.5 wt%),TiO2∕RGO (1.0 wt%), TiO2∕RGO (2.0 wt%), and TiO2∕RGO (4.0 wt%) films as ETL. Activecell area: 0.17 cm−2.
Morais et al.: Enhanced photovoltaic performance of inverted hybrid bulk-heterojunction solar cells. . .
Journal of Photonics for Energy 057408-13 Vol. 5, 2015
Downloaded From: http://photonicsforenergy.spiedigitallibrary.org/ on 04/22/2015 Terms of Use: http://spiedl.org/terms

The proposal of using thin V2O5 films as HTL is because of its higher stability to the ambientatmosphere relative to PEDOT:PSS, which has been shown to be detrimental for organic solarcells due to its high hygroscopic capacity and its acidic pH Ref. 35. The best results obtained byinverted solar cells using TiO2 or TiO2∕RGO (2.0 wt%) as ETL and V2O5 or PEDOT:PSS asHTL are shown in Fig. 12. This study aimed to compare the photovoltaic behavior between thedevices based on V2O5 and PEDOT:PSS as HTL.
In general, the photovoltaic behavior is relatively similar between the devices withconfiguration FTOjTiO2jP3HT∶PC61BMjV2O5 or PEDOT:PSS|Ag and between FTOjTiO2∕RGOð2.0wt%ÞjP3HT∶PC61BMjV2O5 or PEDOT:PSS|Ag. Table 2 shows the photovoltaicparameters such as Jsc, Voc, FF, PCE, Rs e Rsh, calculated from the J–V curves obtainedfor the best inverted solar cells using TiO2 and TiO2∕RGO (2.0 wt%) films as ETL andV2O5 or PEDOT:PSS as HTL.
According to Table 2, the inverted solar cells based on TiO2∕RGO (2.0 wt%) film, for bothconfigurations, using V2O5 or PEDOT:PSS as HTL, showed an increase in Jsc, FF e PCE and adecrease in Rs, compared to the devices based on the pure TiO2 film. The TiO2∕RGO (2.0 wt%)film showed an increase of 18.9% in PCE when using V2O5 as HTL and an increase of 33.1%using PEDOT:PSS as HTL. Therefore, independent of the use of V2O5 or PEDOT: PSS films asHTL, the incorporation 2.0 wt% of RGO into TiO2 films had a positive impact, showing that theRGO sheets can introduce an alternative conduction pathway which facilitates the electrontransport.
4 Conclusions
In this work, we developed TiO2∕RGO films obtained from a sol-gel method, employingTiðOi PrÞ4 and GO as the starting materials. These films were used as ETL in inverted hybrid
Fig. 12 J − V curves for the inverted hybrid bulk-heterojunction solar cells (FTOjTiO2 orTiO2∕RGO (2.0 wt%)jP3HT∶PC61BMjV2O5 or PEDOT:PSS|Ag) using TiO2 or TiO2∕RGO(2.0 wt%) films as ETL, under illumination (100 mWcm−2, AM 1.5G) and dark conditions.Active cell area: 0.17 cm−2.
Table 2 Photovoltaic parameters obtained for inverted hybrid bulk-heterojunction solar cells(FTOjTiO2 or TiO2∕RGOjP3HT∶PC61BMjV2O5 or PEDOT:PSS|Ag) using TiO2 or TiO2∕RGO(2.0 wt%) films as ETL. Active cell area: 0.17 cm−2.
Films HTL Jsc (mAcm−2) V oc (V) FF (%) PCE (%) Rs (105 Ω) Rsh (106 Ω)
TiO2 V2O5 8.89 0.51 45.8 2.06 1.07 1.35
TiO2∕RGO (2.0 wt%) V2O5 9.98 0.51 49.2 2.45 0.82 1.29
TiO2 PEDOT:PSS 8.83 0.51 41.2 1.87 1.46 1.05
TiO2∕RGO (2.0 wt%) PEDOT:PSS 10.65 0.51 46.0 2.49 1.06 1.51
Morais et al.: Enhanced photovoltaic performance of inverted hybrid bulk-heterojunction solar cells. . .
Journal of Photonics for Energy 057408-14 Vol. 5, 2015
Downloaded From: http://photonicsforenergy.spiedigitallibrary.org/ on 04/22/2015 Terms of Use: http://spiedl.org/terms
bulk-heterojunction solar cells. In the photovoltaic studies, the influence of different amounts ofRGO in the TiO2 film was investigated and compared to pristine TiO2 films. The best solar cellsbased on the TiO2∕RGO films were obtained when the amount of RGO was 2.0 wt%. Devicesbased on the TiO2∕RGO (2.0 wt%) films exhibited a Jsc and PCE of 9.71 mA cm−2 and 2.32%,an enhancement of ∼22.3% and ∼28.9%, respectively, when compared with devices based onpristine TiO2 films. Independent of the use of V2O5 or PEDOT:PSS films as HTL, the incor-poration 2.0 wt% of RGO into TiO2 films had a positive impact. The presence of RGO promotesthe formation of regions with higher electron collection capacity and reduced Schottky barrier,providing devices with better performances due to more efficient electron transport to the electro-des, as suggested from KPFM images and Rs values. In general, because of its conductive prop-erties, the RGO sheets can act as an electron collector in the TiO2 film, resulting in an increase inphotocurrent and conversion efficiency. However, a dramatic decrease in performance wasobserved using TiO2∕RGO (4.0 wt%) films due to the increase of Rs, caused by increased re-sistance toward out-of-plane conduction among RGO sheets and the film darkening, reducingthe light absorption of the active layer.
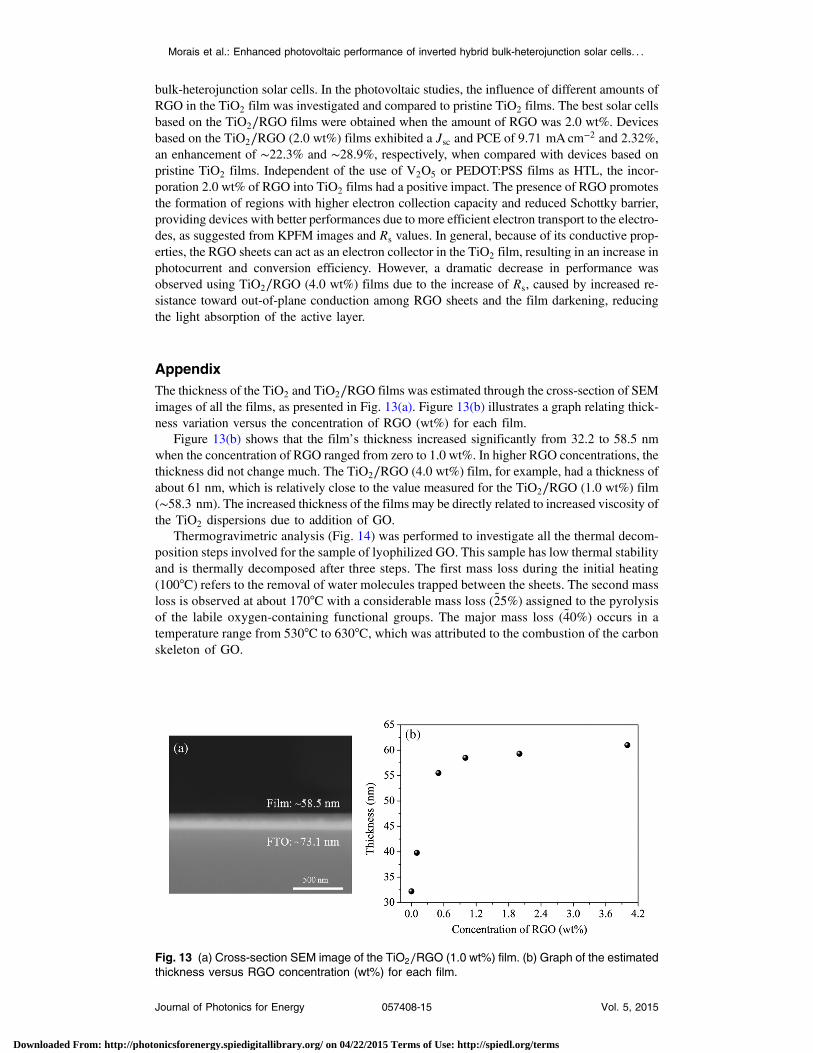
AppendixThe thickness of the TiO2 and TiO2∕RGO films was estimated through the cross-section of SEMimages of all the films, as presented in Fig. 13(a). Figure 13(b) illustrates a graph relating thick-ness variation versus the concentration of RGO (wt%) for each film.
Figure 13(b) shows that the film’s thickness increased significantly from 32.2 to 58.5 nmwhen the concentration of RGO ranged from zero to 1.0 wt%. In higher RGO concentrations, thethickness did not change much. The TiO2∕RGO (4.0 wt%) film, for example, had a thickness ofabout 61 nm, which is relatively close to the value measured for the TiO2∕RGO (1.0 wt%) film(∼58.3 nm). The increased thickness of the films may be directly related to increased viscosity ofthe TiO2 dispersions due to addition of GO.
Thermogravimetric analysis (Fig. 14) was performed to investigate all the thermal decom-position steps involved for the sample of lyophilized GO. This sample has low thermal stabilityand is thermally decomposed after three steps. The first mass loss during the initial heating(100°C) refers to the removal of water molecules trapped between the sheets. The second massloss is observed at about 170°C with a considerable mass loss ( ~25%) assigned to the pyrolysisof the labile oxygen-containing functional groups. The major mass loss ( ~40%) occurs in atemperature range from 530°C to 630°C, which was attributed to the combustion of the carbonskeleton of GO.
Fig. 13 (a) Cross-section SEM image of the TiO2∕RGO (1.0 wt%) film. (b) Graph of the estimatedthickness versus RGO concentration (wt%) for each film.
Morais et al.: Enhanced photovoltaic performance of inverted hybrid bulk-heterojunction solar cells. . .
Journal of Photonics for Energy 057408-15 Vol. 5, 2015
Downloaded From: http://photonicsforenergy.spiedigitallibrary.org/ on 04/22/2015 Terms of Use: http://spiedl.org/terms

XPS survey spectra (up to 1000 eV) were obtained to identify and quantify the elementsand chemical groups present in the GO and RGO films, as shown in Fig. 15. The spectraessentially showed the presence of the elements: carbon (C 1s) and oxygen (O 1s) in the regionaround 284 eV and 532 eV, respectively. Table 3 shows the values of the binding energies,atomic percentage (at %) and the full width at half maximum (FWHM) obtained fromeach XPS survey spectrum corresponding to the predominant chemical elements carbonand oxygen. According to these data, the C/O ratio was 2.0 for the GO film. This is an indi-cation that functional groups containing oxygen were introduced in the pristine graphite afterthe oxidation process. For the sample of RGO film, the C/O ratio was 5.8, showing that therewas a small increase in this ratio due to partial removal of functional groups containing oxygenafter the thermal treatment at 350°C for 1 h.
Fig. 15 XPS survey spectra for samples of (a) GO and (b) RGO films, showing the chemical ele-ments in each sample.
Table 3 Summary of the XPS binding energies, FWHM (in eV) and atomic percentages for thechemical elements found in GO and RGO films with content higher than 1 at %.
Sample Element Binding energy (eV) FWHM at %
GO film C 284.6 2.9 67.0
O 532.6 4.3 33.0
RGO film (350°C for 1 h) C 284.6 3.0 85.2
O 532.6 4.2 14.8
Fig. 14 TGA-DTA curves for the sample of lyophilized graphene oxide in synthetic air.
Morais et al.: Enhanced photovoltaic performance of inverted hybrid bulk-heterojunction solar cells. . .
Journal of Photonics for Energy 057408-16 Vol. 5, 2015
Downloaded From: http://photonicsforenergy.spiedigitallibrary.org/ on 04/22/2015 Terms of Use: http://spiedl.org/terms
Acknowledgments
The authors thank LNNano/LNLS for the AFM and KPFM images, and INEO, CNPq (fellow-ship 246430/2012-5), and FAPESP (fellowship 2010/18656-1) for the financial supports. Theauthors would like to thank Dr. Emre Yassitepe for the XPS measurements at LNNano/LNLS.The authors are also indebted to MSc. Nicolau Saker Neto for manuscript revision. MINECO forthe economic support through the ENE2013-48816-C5-4-R project. The COST ActionStableNextSol project MP1307. The Agència de Gestió d’Ajuts Universitaris i de Recercafor the project 2014 SGR 1212. FASL would like to thank to the Secretary of Education ofthe State of Ceará (SEDUC-CE) for the financial support.
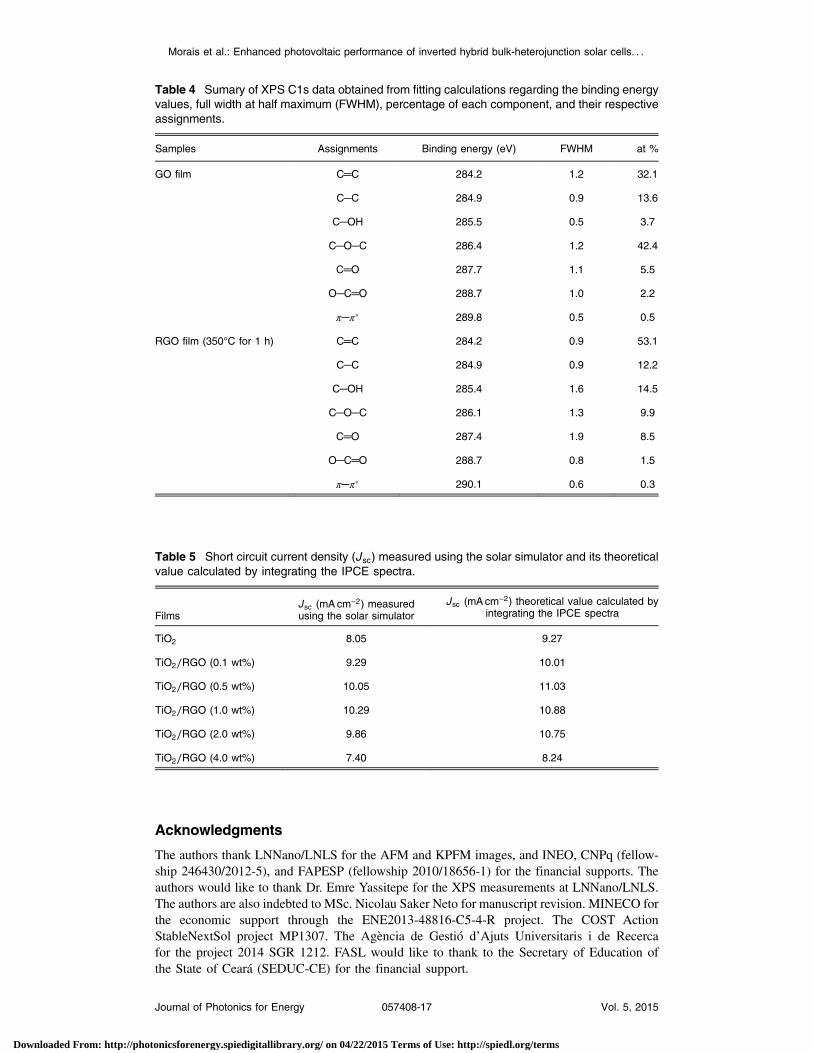
Table 4 Sumary of XPS C1s data obtained from fitting calculations regarding the binding energyvalues, full width at half maximum (FWHM), percentage of each component, and their respectiveassignments.
Samples Assignments Binding energy (eV) FWHM at %
GO film C═C 284.2 1.2 32.1
C─C 284.9 0.9 13.6
C─OH 285.5 0.5 3.7
C─O─C 286.4 1.2 42.4
C═O 287.7 1.1 5.5
O─C═O 288.7 1.0 2.2
π─π� 289.8 0.5 0.5
RGO film (350°C for 1 h) C═C 284.2 0.9 53.1
C─C 284.9 0.9 12.2
C─OH 285.4 1.6 14.5
C─O─C 286.1 1.3 9.9
C═O 287.4 1.9 8.5
O─C═O 288.7 0.8 1.5
π─π� 290.1 0.6 0.3
Table 5 Short circuit current density (Jsc) measured using the solar simulator and its theoreticalvalue calculated by integrating the IPCE spectra.
FilmsJsc (mAcm−2) measuredusing the solar simulator
Jsc (mAcm−2) theoretical value calculated byintegrating the IPCE spectra
TiO2 8.05 9.27
TiO2∕RGO (0.1 wt%) 9.29 10.01
TiO2∕RGO (0.5 wt%) 10.05 11.03
TiO2∕RGO (1.0 wt%) 10.29 10.88
TiO2∕RGO (2.0 wt%) 9.86 10.75
TiO2∕RGO (4.0 wt%) 7.40 8.24
Morais et al.: Enhanced photovoltaic performance of inverted hybrid bulk-heterojunction solar cells. . .
Journal of Photonics for Energy 057408-17 Vol. 5, 2015
Downloaded From: http://photonicsforenergy.spiedigitallibrary.org/ on 04/22/2015 Terms of Use: http://spiedl.org/terms
References
1. S. K. Hau, H. L. Yip, and A. K. Y. Jen, “A review on the development of the invertedpolymer solar cell architecture,” Polym. Rev. 50(4), 474–510 (2010).
2. Y. Y. Liang et al., “For the bright future-bulk heterojunction polymer solar cells with powerconversion efficiency of 7.4%,” Adv. Mater. 22(20), E135–E138 (2010).
3. S. J. Liu et al., “High-efficiency polymer solar cells via the incorporation of an amino-func-tionalized conjugated metallopolymer as a cathode interlayer,” J. Am. Chem. Soc. 135(41),15326–15329 (2013).
4. C. Cabanetos et al., “Linear side chains in benzo[1,2-b:4,5-b′]dithiophene-thieno[3,4-c]pyr-role-4,6-dione polymers direct self-assembly and solar cell performance,” J. Am. Chem.Soc. 135(12), 4656–4659 (2013).
5. K. S. Yeo et al., “Application of sputter-deposited amorphous and anatase TiO2 as electron-collecting layers in inverted organic photovoltaics,” Org. Electron. 14(7), 1715–1719 (2013).
6. I. Sasajima et al., “Flexible inverted polymer solar cells containing an amorphous titaniumoxide electron collection electrode,” Org. Electron. 12(1), 113–118 (2011).
7. D. R. Bekci and S. Erten-Ela, “Effect of nanostructured ZnO cathode layer on the photo-voltaic performance of inverted bulk heterojunction solar cells,” Renewable Energy 43,378–382 (2012).
8. L. K. Jagadamma et al., “Efficient inverted bulk-heterojunction solar cells from low-temper-ature processing of amorphous ZnO buffer layers,” J. Mater. Chem. A 2(33), 13321–13331(2014).
9. H. Y. Sun et al., “UV light protection through TiO2 blocking layers for inverted organicsolar cells,” Sol. Energy Mater. Sol. C 95(12), 3450–3454 (2011).
10. H. Zhang et al., “Enhanced performance of inverted organic photovoltaic cells using CNTs-TiOx nanocomposites as electron injection layer,” Nanotechnology 24(35), 355401 (2013).
11. Y. Zhang et al., “Enhanced electron collection in inverted organic solar cells using titaniumoxide/reduced graphene oxide composite films as electron collecting layers,” Electrochim.Acta 117, 438–442 (2014).
12. Y. Zhang, S. Yuan, and W. Liu, “Inverted organic solar cells employing RGO/TiOx
composite films as electron transport layers,” Electrochim. Acta 143, 18–22 (2014).13. H. W. Lee et al., “Highly efficient inverted polymer solar cells with reduced graphene-
oxide-zinc-oxide nanocomposites buffer layer,” Appl. Phys. Lett. 102(19), 193903 (2013).14. Q. J. Xiang, J. G. Yu, and M. Jaroniec, “Graphene-based semiconductor photocatalysts,”
Chem. Soc. Rev. 41(2), 782–796 (2012).15. X. S. Li et al., “Graphene films with large domain size by a two-step chemical vapor
deposition process,” Nano Lett. 10(11), 4328–4334 (2010).16. J. Hass, W. A. de Heer, and E. H. Conrad, “The growth and morphology of epitaxial
multilayer graphene,” J. Phys. Condens. Matter 20(32), 323202 (2008).17. F. Chen et al., “Electrochemical gate-controlled charge transport in graphene in ionic liquid
and aqueous solution,” J. Am. Chem. Soc. 131(29), 9908–9909 (2009).18. D. Li et al., “Processable aqueous dispersions of graphene nanosheets,” Nat. Nanotechnol.
3(2), 101–105 (2008).19. S. F. Pei and H. M. Cheng, “The reduction of graphene oxide,” Carbon 50(9), 3210–3228
(2012).20. S. Stankovich et al., “Stable aqueous dispersions of graphitic nanoplatelets via the reduction
of exfoliated graphite oxide in the presence of poly(sodium 4-styrenesulfonate),” J. Mater.Chem. 16(2), 155–158 (2006).
21. K. Jasuja et al., “Microwave-reduced uncapped metal nanoparticles on graphene: tuningcatalytic, electrical, and Raman properties,” J. Phys. Chem. Lett. 1(12), 1853–1860(2010).
22. I. A. Aksay et al., “Single sheet functionalized graphene by oxidation and thermal expan-sion of graphite,” Chem. Mater. 19(18), 4396–4404 (2007).
23. J. N. Ding et al., “The influence of temperature, time and concentration on the dispersion ofreduced graphene oxide prepared by hydrothermal reduction,”Diam Relat. Mater. 21 11–15(2012).
Morais et al.: Enhanced photovoltaic performance of inverted hybrid bulk-heterojunction solar cells. . .
Journal of Photonics for Energy 057408-18 Vol. 5, 2015
Downloaded From: http://photonicsforenergy.spiedigitallibrary.org/ on 04/22/2015 Terms of Use: http://spiedl.org/terms
24. L. Chen et al., “Enhanced photovoltaic performance of a dye-sensitized solar cell usinggraphene-TiO2 photoanode prepared by a novel in situ simultaneous reduction-hydrolysistechnique,” Nanoscale 5(8), 3481–3485 (2013).
25. W. Shu et al., “Synthesis and photovoltaic performance of reduced graphene oxide-TiO2
nanoparticles composites by solvothermal method,” J. Alloy Compd. 563 229–233 (2013).26. F. Y. Pei et al., “TiO2 nanocomposite with reduced graphene oxide through facile blending
and its photocatalytic behavior for hydrogen evolution,”Mater. Res. Bull. 48(8), 2824–2831(2013).
27. D. T. Wang et al., “Enhanced photoelectrocatalytic activity of reduced graphene oxide/TiO2
composite films for dye degradation,” Chem. Eng. J. 198 547–554 (2012).28. M. M. Zhen et al., “Well-distributed TiO2 nanocrystals on reduced graphene oxides as high-
performance anode materials for lithium ion batteries,” RSC Adv. 3(33), 13696–13701(2013).
29. M. H. Yeh et al., “Dye-sensitized solar cells with reduced graphene oxide as the counterelectrode prepared by a green photothermal reduction process,” Chem. Phys. Chem. 15(6),1175–1181 (2014).
30. L. Wan et al., “Room-temperature fabrication of graphene films on variable substrates andits use as counter electrodes for dye-sensitized solar cells,” Solid State Sci. 13(2), 468–475(2011).
31. H. Zhang et al., “Effects of TiO2 film thickness on photovoltaic properties of dye-sensitizedsolar cell and its enhanced performance by graphene combination,” Mater. Res. Bull. 49126–131 (2014).
32. G. Cheng et al., “Novel preparation of anatase TiO2 at reduced graphene oxide hybrids forhigh-performance dye-sensitized solar cells,” ACS Appl. Mater. Inter. 5(14), 6635–6642(2013).
33. B. Tang and G. X. Hu, “Two kinds of graphene-based composites for photoanode applyingin dye-sensitized solar cell,” J. Power Sources 220, 95–102 (2012).
34. N. I. Kovtyukhova et al., “Layer-by-layer assembly of ultrathin composite films frommicron-sized graphite oxide sheets and polycations,” Chem. Mater. 11(3), 771–778(1999).
35. G. Teran-Escobar et al., “Low-temperature, solution-processed, layeredV2O5 hydrate as thehole-transport layer for stable organic solar cells,” Energy Environ. Sci. 6(10), 3088–3098(2013).
36. H. Wang and Y. H. Hu, “Effect of oxygen content on structures of graphite oxides,” Ind Eng.Chem. Res. 50(10), 6132–6137 (2011).
37. J. F. Shen et al., “One step hydrothermal synthesis of TiO2-reduced graphene oxide sheets,”J. Mater. Chem. 21(10), 3415–3421 (2011).
38. A. Kaniyoor and S. Ramaprabhu, “A Raman spectroscopic investigation of graphite oxidederived graphene,” AIP Adv. 2(3), 032183 (2012).
39. S. Some et al., “Can commonly used hydrazine produce n-type graphene?,” Chem. Eur. J.18(25), 7665–7670 (2012).
40. S. Stankovich et al., “Synthesis of graphene-based nanosheets via chemical reduction ofexfoliated graphite oxide,” Carbon 45(7), 1558–1565 (2007).
41. J. F. Shen et al., “Ionic liquid-assisted one-step hydrothermal synthesis of TiO2-reducedgraphene oxide composites,” Nano Res. 4(8), 795–806 (2011).
42. H. K. Jeong et al., “Thermal stability of graphite oxide,” Chem. Phys. Lett. 470(4–6),255–258 (2009).
43. J. Filik et al., “XPS and laser Raman analysis of hydrogenated amorphous carbon films,”Diamond Relat. Mater. 12(3–7), 974–978 (2003).
44. Y. H. Zu et al., “Graphite oxide-supported CaO catalysts for transesterification of soybeanoil with methanol,” Bioresour. Technol. 102(19), 8939–8944 (2011).
45. H. S. Han et al., “Synthesis of graphene oxide grafted poly(lactic acid) with palladium nano-particles and its application to serotonin sensing,” Appl. Surf. Sci. 284 438–445 (2013).
46. C. Mattevi et al., “Evolution of electrical, chemical, and structural properties of transparentand conducting chemically derived graphene thin films,” Adv. Funct. Mater. 19(16),2577–2583 (2009).
Morais et al.: Enhanced photovoltaic performance of inverted hybrid bulk-heterojunction solar cells. . .
Journal of Photonics for Energy 057408-19 Vol. 5, 2015
Downloaded From: http://photonicsforenergy.spiedigitallibrary.org/ on 04/22/2015 Terms of Use: http://spiedl.org/terms

47. A. Bagri et al., “Structural evolution during the reduction of chemically derived grapheneoxide,” Nat. Chem. 2(7), 581–587 (2010).
48. D. Yang et al., “Chemical analysis of graphene oxide films after heat and chemical treat-ments by x-ray photoelectron and micro-Raman spectroscopy,” Carbon 47(1), 145–152(2009).
49. T. H. Tsai, S. C. Chiou, and S. M. Chen, “Enhancement of dye-sensitized solar cells byusing graphene-TiO2 composites as photoelectrochemical working electrode,” Int. J.Electrochem. Sci. 6(8), 3333–3343 (2011).
50. M. C. Wu et al., “Correlation between nanoscale surface potential and power conversionefficiency of P3HT∕TiO2 nanorod bulk heterojunction photovoltaic devices,” Nanoscale2(8), 1448–1454 (2010).
51. A. de Morais et al., “Enhancing in the performance of dye-sensitized solar cells by theincorporation of functionalized multi-walled carbon nanotubes into TiO2 films: The roleof MWCNT addition,” J. Photochem. Photobiol. A 251, 78–84 (2013).
52. A. Liscio et al., “Photovoltaic charge generation visualized at the nanoscale: a proof ofprinciple,” J. Am. Chem. Soc. 130(3), 780 (2008).
53. Q. J. Xiang et al., “Microwave-hydrothermal preparation and visible-light photoactivity ofplasmonic photocatalyst Ag-TiO2 nanocomposite hollow spheres,” Chem. Asian J. 5(6),1466–1474 (2010).
54. J. Z. Huang et al., “Incorporation of graphene oxide in quantum dot sensitized photocatalystbased on ZnO nanorods,” J. Nanosci. Nanotechnol. 14(4), 3001–3005 (2014).
55. A. K. K. Kyaw et al., “Top-illuminated dye-sensitized solar cells with a room-temperature-processed ZnO photoanode on metal substrates and a Pt-coated Ga-doped ZnO counterelectrode,” J. Phys. D Appl. Phys. 44(4), 045102 (2011).
56. M. Lira-Cantu et al., “Oxide/polymer interfaces for hybrid and organic solar cells: Anatasevs. Rutile TiO2,” Sol. Energy Mater. Sol. C 95(5), 1362–1374 (2011).
Andreia Morais, studied at the Federal University of Alfenas-MG (Unifal-MG) and receivedher degree in chemistry with technological assignments in 2008. She obtained a master’s degreein physical chemistry at the Federal University of Alfenas-MG (Unifal-MG) in 2010. Currently,she is pursuing PhD studies in physical chemistry at the State University of Campinas(UNICAMP). Her research focuses on the development of nanostructured composites materialsfor hydrogen generation from photoelectrochemical water splitting and applications in photo-voltaic devices and electrochemical sensors.
João Paulo C. Alves, studied at the Federal University of Lavras-MG (UFLA-MG) and receivedhis degree in chemistry in 2009. He obtained a master’s degree in inorganic chemistry from theState University of Campinas (UNICAMP), Campinas, Brazil, in 2011. Currently, he is pursuingPhD studies in inorganic chemistry at UNICAMP. His research is based on the development ofhybrid polymer–inorganic nanoparticle systems, for applications in photovoltaic devices, andphotophysical and morphological studies.
Francisco Anderson S. Lima, studied at the State University of Ceará (UFC) and received hisdegree in physics in 2004. He obtained a master’s degree in applied physical sciences at the sameState University of Ceará (UFC) in 2010. Currently, he is pursuing PhD studies at the CatalanInstitute of Nanoscience and Nanotechnology (ICN2) and at Federal University of Ceará (UFC).His research is devoted to the synthesis, characterization, and application of nanostructuredmaterials for excitonic solar cells.
Monica Lira-Cantu received her PhD degree in materials science by the Materials ScienceInstitute of Barcelonas (ICMAB) and Autonoma University of Barcelona in 1997. From1999 to 2001, she worked as permanent senior staff chemist at ExxonMobil Research andEngineering in New Jersey, USA. Currently, she is a group leader of the nanostructured materialsfor photovoltaic energy group at the Catalan Institute of Nanoscience and Nanotechnology,ICN2 in Barcelona, Spain. She has coauthored more than 70 published papers, 7 patents,and 8 book chapters, h-index of 26.
Morais et al.: Enhanced photovoltaic performance of inverted hybrid bulk-heterojunction solar cells. . .
Journal of Photonics for Energy 057408-20 Vol. 5, 2015
Downloaded From: http://photonicsforenergy.spiedigitallibrary.org/ on 04/22/2015 Terms of Use: http://spiedl.org/terms
Ana Flavia Nogueira received her PhD degree in inorganic chemistry from the UNICAMP in2001. In 2002, she joined the group of professor James R. Durrant at the Imperial College,London, in a postdoctoral position, where she investigated organic and hybrid solar cells.Since 2004, she has been an associate professor at UNICAMP. She is also the coordinatorof the Laboratory of Nanotechnology and Solar Energy, a leading group in the field ofthird-generation solar cells in Brazil.
Morais et al.: Enhanced photovoltaic performance of inverted hybrid bulk-heterojunction solar cells. . .
Journal of Photonics for Energy 057408-21 Vol. 5, 2015
Downloaded From: http://photonicsforenergy.spiedigitallibrary.org/ on 04/22/2015 Terms of Use: http://spiedl.org/terms