enhanced performance of polybenzimidazole-based high
TRANSCRIPT
Su, H. et al. (2013). Enhanced performance of polybenzimidazole-based high temperature
proton exchange membrane fuel cell with gas diffusion electrodes prepared by automatic
catalyst spraying under irradiation technique.
Journal of Power Sources, 242: 510 – 519
http://dx.doi.org/10.1016/j.jpowsour.2013.05.128
University of the Western Cape Research Repository [email protected]
Enhanced performance of polybenzimidazole-based high
temperature proton exchange membrane fuel cell with gas diffusion
electrodes prepared by automatic catalyst spraying under
irradiation technique
Huaneng Su, Sivakumar Pasupathi, Bernard Jan Bladergroen, Vladimir Linkov and Bruno G.
Pollet
Abstract
Gas diffusion electrodes (GDEs) prepared by a novel automatic catalyst spraying
under irradiation (ACSUI) technique are investigated for improving the
performance of phosphoric acid (PA)-doped polybenzimidazole (PBI) high
temperature proton exchange membrane fuel cell (PEMFC). The physical properties
of the GDEs are characterized by pore size distribution and scanning electron
microscopy (SEM). The electrochemical properties of the membrane electrode
assembly (MEA) with the GDEs are evaluated and analyzed by polarization curve,
cyclic voltammetry (CV) and electrochemistry impedance spectroscopy (EIS). Effects
of PTFE binder content, PA impregnation and heat treatment on the GDEs are
investigated to determine the optimum performance of the single cell. At ambient
pressure and 160 o C, the maximum power density can reach 0.61 W cm-2, and the
current density at 0.6 V is up to 0.38 A cm-2, with H /air and a platinum loading of
0.5 mg cm-2 on both electrodes. The MEA with the GDEs shows good stability for
fuel cell operating in a short term durability test.
1. Introduction
In recent years, high temperature proton exchange membrane fuel cells (PEMFCs)
based on phosphoric acid (PA)-doped polybenzimidazole (PBI) electrolyte, which are
capable of operating at temperatures above 120 oC, have attracted wide interest
due to their advantages over low-temperature PEMFCs based on perfluorosulphonic
acid polymer electrolytes (e.g. Nafion). These advantages include faster electrode
reaction kinetics, high tolerance to CO in fuel hydrogen, elimination of cathode flooding
and simpli- fied thermal management [1,2]. In particular, high temperature operation
eliminates the need for a humidification unit, which is quite attractive for vehicles
equipped with PEMFCs. However, the sluggish kinetics of the oxygen reduction reaction
(ORR) [3] and the transport limitations of protons and reactants in cathode, especially
in the presence of PA, limit the cell performance of the high temperature PEMFC.

2
Therefore, enhancing the cell performance of high temperature PEMFC is one of the
most important issues for being more widely considered as an alternative to the low
temperature PEMFC systems.
Membrane electrode assembly (MEA) is the core component of PEMFC and
electrochemical reaction only takes place at ‘triple-phase boundaries’, where reactant,
electrolyte and electrons are brought together. It consists of a proton exchange
membrane sandwiched between two gas diffusion electrodes (GDEs), which possess a
porous structure that allows easy transport of reactant gases and water to and from the
catalytically active zone. Therefore, the fabrication of GDE has significant influence on the
performance of high temperature PEMFC. It is expected that the optimization of GDE,
either on component, structure, or preparation method, will make improvements on the
cell performance. For example, Lobato et al. respectively investigated the influence of the
PBIeH3PO4 in the electrode structure [4], platinum percentage on the carbon support
of commercial catalyst [5], carbon content in the micro- porous layer (MPL) [6] and
catalytic ink preparation method [7] on the performance of high temperature PBI fuel
cells. Seland et al. [8] studied the single cell performance of PBI fuel cell by varying the
platinum content in the Pt/C catalyst and catalyst loading, as well as the loading of the PBI
electrolyte dispersed in the catalyst layer (CL) in order to determine the optimum
structure of their anodes and cathodes. Pan et al. [9] investigated the porosity of GDEs
the fuel cell performance by introducing porogens such as ammonium oxalate, carbonate
and acetate or acid-soluble oxide, e.g. ZnO into the supporting layer and/or CLs. Their
results demonstrated that an increase in the overall electrode porosity from 38% to
59% was achieved without sacrificing the catalytic activity of the electrodes. By
performing fuel cell tests, significant effects of the electrode porosity were observed on
the cathodic limiting current density and air stoichiometry, anodic limiting current and
hydrogen utili- zation, as well as the pressure and temperature impacts.
The binder properties and CL deposition method also play major roles in determining GDE
structure and, thereby, cell performance. Park et al. [10], Mazúr et al. [11] and Mamlouk et al.
[12,13] individ- ually investigated the effects of several different binders, including PBI,
PTFE and polyurethane, on the performance of high temperature PEMFC electrode. Their
results reveal that the electrode with PBI binders did not show any improvement in cell
performances. Alter- native structures based on PTFE and H3PO4 showed advantages over
PBI-based electrodes due to higher oxygen permeability and less danger of the CL flooding
by PA. Furthermore, Mazúr et al. [11] and Millington et al. [14] also investigated different
techniques for GDE fabrication. They found that the spraying technique can provide a
significantly more homogeneous and reproducible deposition of the CL onto the GDL,
compared with other commonly used ones like brushing, doctor blade, and screen printing.
In this work, a novel spraying technique, called automatic catalyst spraying under
irradiation (ACSUI), was developed to prepare the GDEs for high temperature PEMFCs.
Employing PTFE as binder, a much better porous CL structure can be achieved by
simultaneously evaporating the solvent during spraying, followed by sintering at elevated
http://repository.uwc.ac.za

3
temperature. The resultant GDE was physically characterized by pore size distribution and
scanning electron microscopy (SEM). Effects of PTFE binder content, PA impregnation
and heat treatment on the GDEs were investigated to determine the optimum performance
of the single cell. Polarization and durability test showed that the MEA using the GDEs
prepared by this method has high performance and good stability for high temperature
PEMFC operation.
1.1. Literature summary of single cell performance of PA-doped PBI high
temperature PEMFC
Although many researchers reported the cell performances in their studies on PBI-based
PEMFCs, most of these works were focused on developing PBI-based polymer
membranes [15e18], in which neither were the MEAs optimized, nor are the membranes
commercially available. For this reason, the cell performances re- ported in these works are
excepted from our discussion. More representative performance data have been obtained
by the different research groups using significantly different approach of electrode
fabrication and performance optimization. In order to make some comparisons, some of
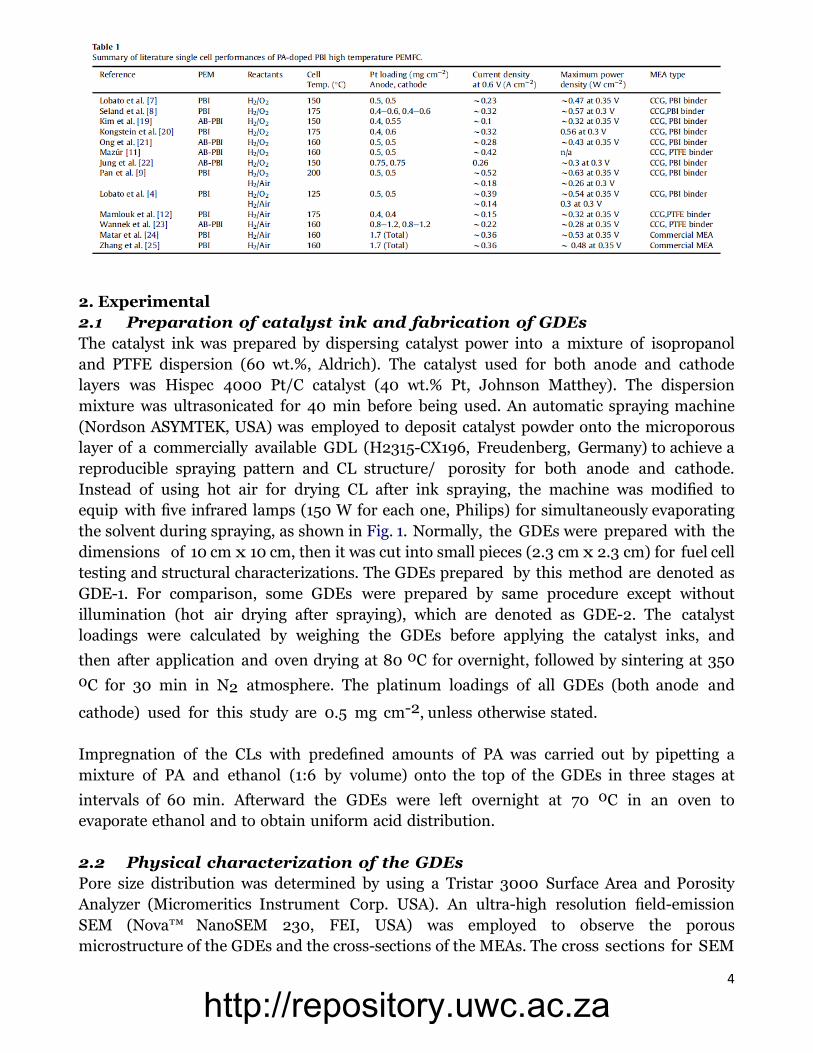
the available results have been tabulated, as shown in Table 1. It can be seen that almost
all the present MEAs for high temperature PEMFC were fabricated by catalyst coated GDL
(CCG), in which either PBI or PTFE was used as the binder. PA-doped PBI and AB-PBI
polymer membranes are the most commonly used PEM in these studies due to their
commercial availabilities. Normally, most of these MEAs were operated at around 160 oC
and ambient pressure, with the Pt loadings of w0.5 mg cm-2 on both anode and
cathode.
The literature cell performances are typically around 0.23e 0.52 A cm-2 at the working
voltage of 0.6 V, and the maximum power densities of 0.3e0.63 W cm-2 can be
reached at 0.3 V or 0.35 V when pure oxygen was used as the oxidant. From the point of
view of commercialization and real applications, usage of air is more practical to
operate PEM fuel cells. When air was used, however these values are typically
below 0.2 A cm-2 and 0.3 W cm-2, respectively. Only a few results published with
the current densities at 0.6 V above 0.2 A cm-2 and the maximum power densities
over 0.3 W cm-2. The excellent results of w0.36 A cm-2 and w0.53 W cm-2 from
Matar et al. [24] and Zhang et al. [25] seem only possible due to the use of commercial
MEAs with relatively high Pt loading of total 1.7 mg cm-2. Reaching stable cell
performance of above 0.2 A cm-2 at 0.6 V and maximum power density of above 0.3 W
cm-2 under the usual operating conditions (w160 oC, Pt loading of w0.5 mg cm-2,
H2/Air, ambient pressure) is therefore considered as a significant achievement.
http://repository.uwc.ac.za
4
2. Experimental
2.1 Preparation of catalyst ink and fabrication of GDEs
The catalyst ink was prepared by dispersing catalyst power into a mixture of isopropanol
and PTFE dispersion (60 wt.%, Aldrich). The catalyst used for both anode and cathode
layers was Hispec 4000 Pt/C catalyst (40 wt.% Pt, Johnson Matthey). The dispersion
mixture was ultrasonicated for 40 min before being used. An automatic spraying machine
(Nordson ASYMTEK, USA) was employed to deposit catalyst powder onto the microporous
layer of a commercially available GDL (H2315-CX196, Freudenberg, Germany) to achieve a
reproducible spraying pattern and CL structure/ porosity for both anode and cathode.
Instead of using hot air for drying CL after ink spraying, the machine was modified to
equip with five infrared lamps (150 W for each one, Philips) for simultaneously evaporating
the solvent during spraying, as shown in Fig. 1. Normally, the GDEs were prepared with the
dimensions of 10 cm x 10 cm, then it was cut into small pieces (2.3 cm x 2.3 cm) for fuel cell
testing and structural characterizations. The GDEs prepared by this method are denoted as
GDE-1. For comparison, some GDEs were prepared by same procedure except without
illumination (hot air drying after spraying), which are denoted as GDE-2. The catalyst
loadings were calculated by weighing the GDEs before applying the catalyst inks, and
then after application and oven drying at 80 oC for overnight, followed by sintering at 350
oC for 30 min in N2 atmosphere. The platinum loadings of all GDEs (both anode and
cathode) used for this study are 0.5 mg cm-2, unless otherwise stated.
Impregnation of the CLs with predefined amounts of PA was carried out by pipetting a
mixture of PA and ethanol (1:6 by volume) onto the top of the GDEs in three stages at
intervals of 60 min. Afterward the GDEs were left overnight at 70 oC in an oven to
evaporate ethanol and to obtain uniform acid distribution.
2.2 Physical characterization of the GDEs
Pore size distribution was determined by using a Tristar 3000 Surface Area and Porosity
Analyzer (Micromeritics Instrument Corp. USA). An ultra-high resolution field-emission
SEM (Nova™ NanoSEM 230, FEI, USA) was employed to observe the porous
microstructure of the GDEs and the cross-sections of the MEAs. The cross sections for SEM
http://repository.uwc.ac.za

5
analysis were prepared by freezing the samples in liquid nitrogen and cutting the
samples with a razor. Samples prepared by this method are reported to yield higher
quality cross-sections than other methods [26].
2.3. MEA and single cell test
The membranes used in this study are AB-PBI (poly(2,5- benzimidazole), which were
supplied by FuMA-Tech (fumapem® AM, w30 mm). For doping with PA, the membranes
were immersed in 85% acid solution for 24 h at 85 oC, which gave the membrane an acid
doping level of about 3.8 molecules of H3PO4 per polymer repeating unit (PRU).
Before being used, the membrane was taken from the PA bath, and the superficial acid
onto the membrane was thoroughly wiped off with lab tissue. The thickness of the acid
doped membrane is about 80 (±5) mm.
Together with gaskets made of fluorinated polymer, the MEA was assembled by
sandwiching the doped membrane between two GDEs impregnated with PA in a single cell
fixture (BalticFuelCells GmbH, Germany) without a preceding hot-pressing step. The cell
fixture consists of two graphite plates with serpentine channels. Electrical heaters and a
thermocouple were embedded into the plates and connected to a Cell Compression Unit
(Pragma In- dustries, France), which controlled the cell temperature at 160 oC and the
piston pressure at 2 N mm-2 in this study.
The cells were operated in a FuelCon Evaluator C test station (FuelCon, Germany). Pure
hydrogen was fed to the anode and air to the cathode respectively, with flow rates of 200 ml
min-1 (hydrogen) and 1000 ml min-1 (air), at ambient pressure. Both hydrogen and air were
used as dry gases, directly from the compressed bottles without external
humidification. Prior to the recording of the polarization curves, the MEAs were activated
by operating the unit cell at a constant voltage (0.55 V) under the cell temperature of 160
oC until a stable performance was obtained. The current voltage polarization curves were
obtained by measuring the current density with the stepwise decrement of voltage from
0.9 to 0.2 V, with an interval of 0.05 V. At each cell voltage, the current was measured
after a hold time of 5 min to allow the cell approaching steady state.
2.4. Electrochemical measurements
Electrochemical impedance spectroscopy (EIS) and cyclic voltammetry (CV) were
performed using an Autolab PGSTAT 30 Potentiostat/Galvanostat (Metrohm) equipped
with a 10 A booster and a frequency response analysis (FRA) module. Because anode
polarization is negligible against to cathode polarization during fuel cell operation, so the
anode can be used as the counter electrode and reference electrode. The measurements
were carried out at a cell voltage of 0.6 V with an amplitude of 5 mV, and in the
frequency range of 100 mHze100 kHz. The impedance data were obtained by calculation
and simulation with Autolab Nova software. Voltammetric measurements, undertaken to
study the electrochemical active surface area (EASA), were conducted using dry N2 at the
http://repository.uwc.ac.za

6
cathode (working electrode) and dry H2 at the anode (counter electrode and reference
electrode) at room temperature (w25 oC). Cyclic voltammogram were recorded from 1.2
V to 0.05 V at a scan rate of 0.05 V s .
3. Results and discussion
3.1. Structural analysis
The distribution of pore sizes is an important parameter to a GDE since the reactant gases
and water (liquid or vapor) transport are regulated by the specific volumes of small and large
pores [27]. The results obtained for the pore size distributions of the GDEs prepared by
different procedure are shown in Fig. 2. Only the range of 0.005e10 mm is measured,
assuming that any larger pore size is due to the carbon support [28]. According to
Watanabe et al. [29], there exist two distinctive pore distributions in the CL with a boundary
of about 0.1 mm. The primary pore is identified with the space in and between the primary
particles in the agglomerates, and the secondary pore, between the agglomerates. From Fig.
2, the main differences are observed in the range of 0.03e0.7 mm, where the specific
volume of the pores is greater in the GDE prepared by ACSUI method (GDE-1) as
evaluated from the area. This means there exist more primary pores and secondary pores
in the CL of GDE-1 than that in GDE-2. In the case of gas transport to the catalyst sites,
the main contribution to gas transport is due to Knudsen diffusion in the primary pores and
a molecular diffusion mechanism in the secondary pores [27]. Therefore, the larger volume
of the pores in GDE-1 would make more catalyst surface available.
Fig. 3 shows the SEM images of the GDEs prepared with and without irradiation.
Obviously, the surface morphology of the GDE prepared with irradiation (Fig. 3(a)) is very
different with that of the one prepared without irradiation (Fig. 3(d)). By spraying catalyst
http://repository.uwc.ac.za
7
ink under infrared lamps, the solvent (isopropanol and water) in the ink can be
simultaneously evaporated, which causes bumps and agglomerates of catalyst particles with
a diameter of about 30e 40 mm on the surface of the CL (see Fig. 3(a)), while cracks (5e
20 mm) and thin crevices exist in the CL fabricated without irradiation (see Fig. 3(d)) due
to the lengthening of the drying time. Although the catalyst bumps and agglomerates make
the CL surface uneven, it does not seems to be a problem for interface contact with PBI
membrane due to the pliability of PA-doped membrane and the considerable assembly
pressure when the MEA was assembled, which can be substantiated by the MEA cross-
section SEM photographs shown later (See Fig. 12, Section 3.6). However, the catalyst
eventually ending up in the cracks will be far from the membrane, leading to a poor
utilization, which illustrates the importance of minimizing the total crack volume in the CL
[11,20,30].
Fig. 3(b) and (e) show the pore structure of the CLs of the GDEs prepared with and without
irradiation, respectively. It can be seen that both the GDEs have porous CL structure, but the
catalyst particles of the electrode prepared under irradiation (GDE-1) seem more uniform
and less big-sized agglomerates when compared to the electrode made without
irradiation, which would justify the larger volume of primary pores and secondary pores
in the CL of GDE-1 (See Fig. 2).
Fig. 3(c) and (f) are back-scattered electrons images of the two electrodes, which were
taken to show the Pt distribution in CLs because heavy compounds like Pt shines up in
SEM back-scattered mode. From them, it can be discerned that the GDE prepared under
irradiation shows a more homogeneous Pt distribution when compared to the electrode
prepared by spraying without irradiation, which may be attributable to the less motility of
the catalyst particles in the CL during spraying because of the instantaneous evaporation
of the solvent in the catalyst slurry under irradiation. Better catalyst utilization would be
expected due to the homogeneous CL structure and Pt distribution of this electrode.
3.2. Single cell performance
Fig. 4 shows the performance comparison of the single cell with the two different GDEs. It
should be noted that both GDEs used for this comparison have been structurally optimized,
which is given separately in Sections 3.3 and 3.4. From Fig. 4, it is clear that the GDE prepared
by catalyst spraying under irradiation method (GDE-1) yields much better performance
than the MEA prepared without irradiation (GDE-2) in all regions of the polarization
curve. At a working voltage of 0.6 V, the current density of the MEA with GDE-1 reaches
0.379 A cm-2, 84.9% higher than that (0.205 A cm-2) of the MEA with GDE-2. The
maximum power density of the MEA with GDE-1 can reach 0.61 W cm-2 at 0.35 V. These
values are among the best results yet reported for similar PA-doped PBI fuel cell and
operated using air, which are totally comparable to the performances of the commercial
MEAs with high Pt loading (See Table 1).
http://repository.uwc.ac.za

8
To understand the excellent performance of the GDE prepared by ACSUI method, an
overall analysis on the polarization curves and electrochemical measurements on both
GDEs are performed. Generally, the polarization curve of a PEMFC could be divided into
three segments (corresponding to different electrochemical processes) according to its
different voltage drop rates. The initial drop of the curve at a very low current density is
due to the sluggish kinetics of oxygen reduction at the cathode, determined by the
nature of the electrodes. It can be seen in Fig. 4 that GDE-1 shows minor voltage drop than
does GDE-2 at this region (0e0.2 A cm-2), which means the structure of GDE-1 is more
effective to enhance the kinetics of ORR than that of GDE-2. This is mainly attributable to the
instantaneous evaporation of the solvent during GDE-1 fabrication, which makes a more
uniform CL structure and Pt distribution (as shown in Fig. 3), then making the
electrochemical reactions in the CL more efficient than that in GDE-2.
The kinetic overpotential in cathode is known to be the largest overpotential in PA-doped
PBI fuel cell. The low oxygen solubility and high ORR Tafel slope of 120 mV decade-1 in
PA [3] along with anion adsorption of H3PO4 on Pt [31] are reported to cause slow ORR
on Pt in cathode. Therefore, the superior porous structure and Pt distribution in GDE-1,
which result in abundant triple-phase boundaries in the CL, are considered as the most
important rea- sons for the excellent performance of GDE-1. To prove this point, CV
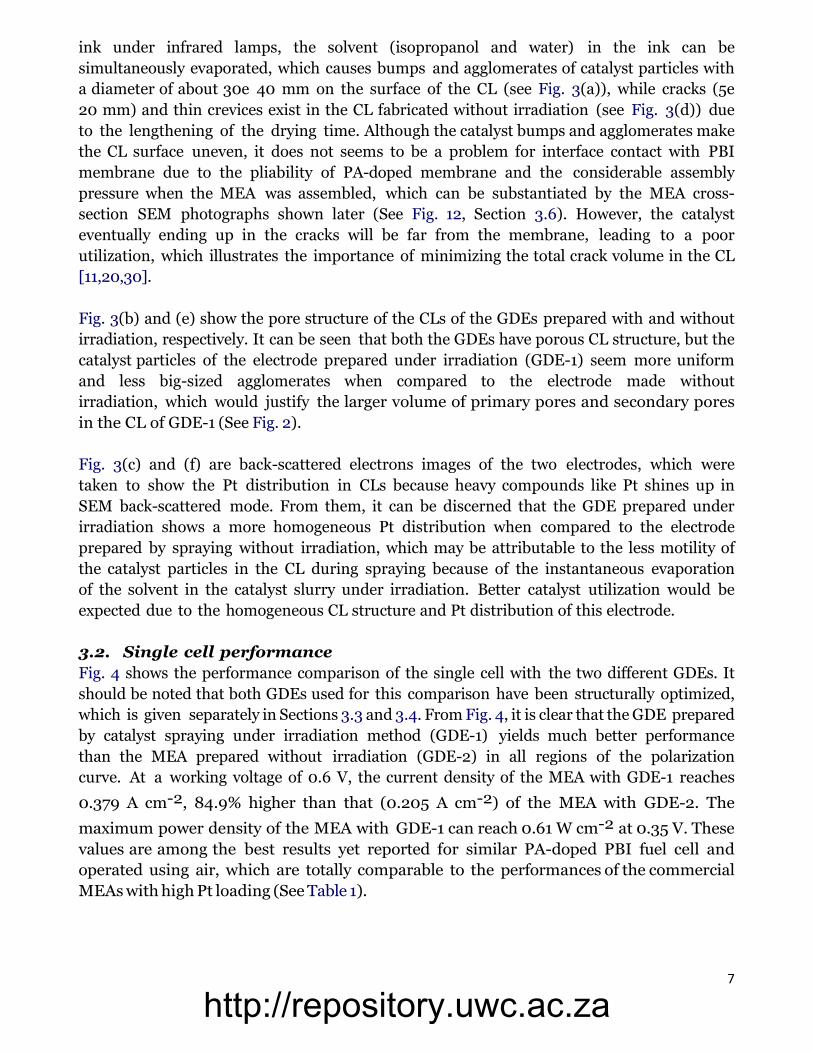
measurements are performed to study the EASAs of the two GDEs, as shown in Fig. 5. The
corresponding EASAs are calculated from the H2 desorption peak of each voltammogram
and the results are also summarized in Fig. 5. The EASA of GDE-1 is about 37.4 m2 g-1, about
58.5% higher than that of GDE-2 (23.6 m2 g-1). This is reasonable because the CL structure
of GDE-1 is more uniform and less agglomerate, which makes more Pt surface available
than GDE-2 did. The EASA results are certainly consistent with their performances
presented in Fig. 4.
The subsequent drop in the polarization curve is ascribed to ohmic loss, which originates
from ionic flow through the electrolyte membrane, and from electron flow through the
electrode layers, current collectors and flow field plates.
http://repository.uwc.ac.za

9
As shown in Fig. 4, the two MEAs present similar decreasing slopes in the linear
region, implying that they had similar ohmic cell resistances. It is reasonable because
http://repository.uwc.ac.za

10
both GDEs were fabricated with the same catalyst loading and PTFE content, and
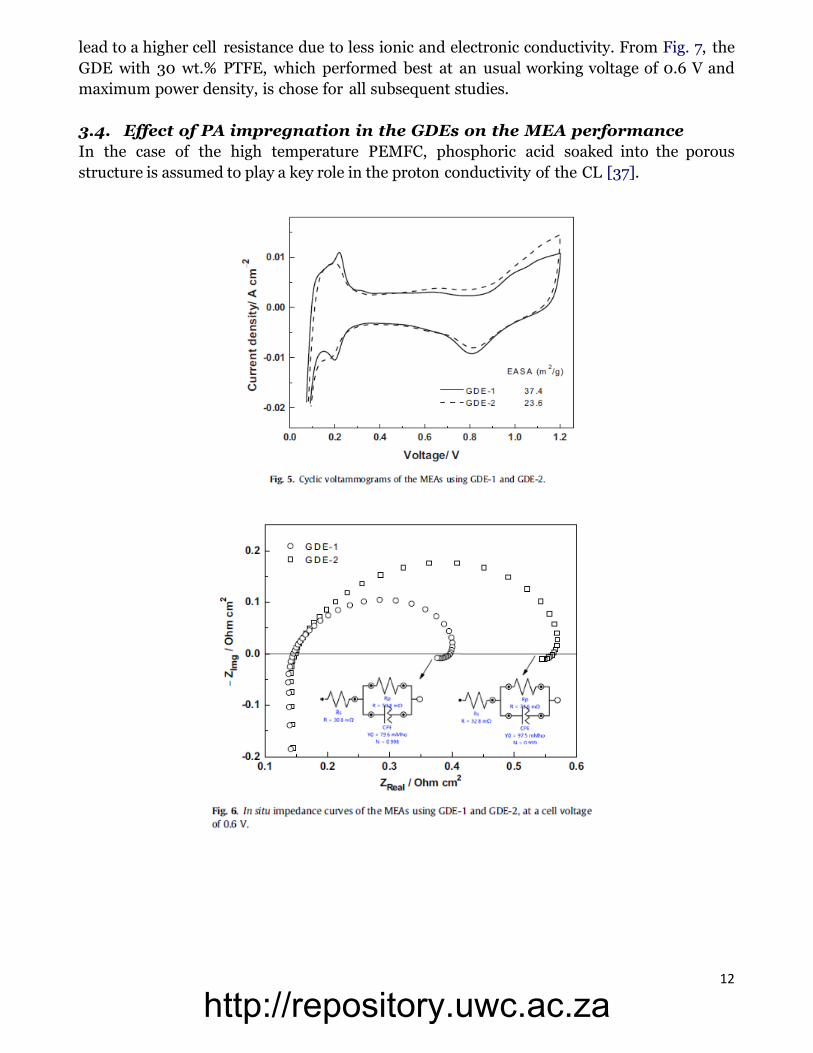
also tested in the same fixture. To verify the resistances of the single cells with the two
GDEs, in situ impedance measurements are performed at the cell voltage of 0.6 V, as
shown in Fig. 6. Only one semicircular loop can be observed in the Nyquist plot as the
electrode process is dominated by ORR [32]. Through simulation with a simple
equivalent circuit, their corresponding cell resistances (Rs) and charge transfer
resistances (Rp) can be calculated, which are also presented in Fig. 6.
It can be seen that there is no significant difference in cell ohmic resistance for the single
cell with the two GDEs, which is consistent with the similar decreasing slopes in the
linear regions of the polarization curves presented in Fig. 4. However, the charge
transfer resistance of GDE-1 is much smaller than that of GDE-2, which suggests that
GDE-1 yielded a more efficient electrochemical active layer. The superior CL porous
structure and better Pt distribution of GDE-1 can keep a high Pt utilization, and improve
the charge transfer in the CL simultaneously, which makes the electrochemical process
in the CL more efficient.
The last voltage drop at high current density is due to mass transport limitations
occurring in the electrodes and the mem- brane. However, from Fig. 4 it can be seen
that, for both GDEs, the voltage drop rates in the high current density region (>1.5 A
cm-2) of their polarization curves are almost same with that in their linear regions,
which means that no obvious mass transfer limitations in both GDEs even at the high
current densities. It is understandable when considering the high operating
temperature (160 oC, only water vapor existed in the GDEs), the porous structures, as
well as the highly hydrophobic CLs and GDLs resulting from the use of PTFE.
http://repository.uwc.ac.za

11
Therefore, the transport of water in the whole GDEs could be balanced easily. Transport of
reactants (H2 and air) in the CLs can be enhanced since no flooding problem in the
electrodes [33]. Furthermore, the elimination of liquid water also can increase the exposed
surface area of the electrocatalysts and improve the ability of the reactants to diffuse into the
reaction layers [34]. These could be the reasons why both GDEs reached their maximum
power densities in this low cell voltage region (0.35 V and 0.3 V, respectively), which also
can be observed in many researchers’ works (see Table 1).
From all these analysis and electrochemical results, it can be concluded that the
excellent performance of GDE-1 is primarily attributable to the superior CL structure
resulting from the ACSUI method, which makes a more efficient electrochemical active
layer, accordingly the minor kinetic overpotential and charge transfer resistance.
3.3. Effect of PTFE content in the CL on the MEA performance
Although PBI is considered a good candidate for membrane materials due to its low gas
permeability, the use of PBI in the CL for proton transport could impose mass transport
limitation on the cell performances, depending on the thickness of the film formed on the
catalyst sites [35]. Alternative CL structure based on PTFE and PA has recently been
suggested by some researchers [10e13] due to the higher oxygen permeability and less
danger of PA flooding in the CL than that in PBI-based electrodes. PTFE is introduced in the
CL to act as binder, which can enhance porosity of the CL and provide an amorphous
phase to hold the PA. Additionally, it facilitates transport of oxygen in the CL due to its
hydrophobic proper- ties. In this study, 15e50 wt.% of PTFE in the CLs were investigated for
the optimization of the single cell performance with the GDEs prepared by automatic
catalyst spraying under irradiation method. Fig. 7(a) shows the performances of the single
cell using the GDEs with different PTFE content in their CLs. It should be mentioned
that all these GDEs are optimized by PA impregnation in the CLs (See Section 3.4) to
reach their optimal performances showed in Fig. 7. For comparison, we plot the current
densities at 0.6 V and the maximum power densities of these MEAs, as shown in Fig. 7(b). It
can be seen that the low PTFE content (15 wt.%) in the CL is not sufficient to achieve the best
fuel cell performance as this MEA only delivers 0.461 W cm-2 as the peak power density
and 0.205 A cm-2 at 0.6 V (Fig. 7(b)). Only with a higher PTFE content, such as 25 wt.% or
30 wt.%, excellent cell performance is achieved with the current density above 0.33 A cm-2
at 0.6 V, and the peak power density is above 0.56 W cm-2. Actually, from our standard
fuel cell characterization (160 oC, H2/air, ambient pressure), no any important differences
can be observed among the polarization curves measured with the GDEs containing 25e40
wt.% PTFE. This means there is a minimum amount of PTFE in the electrodes that gave
satisfactory performance for PBI-base high temperature fuel cell, which also can be
observed in some researchers’ works [12,36]. However, the GDE with 50 wt.% PTFE
performed significantly less satisfactorily (Fig. 7(a)). This could be attributed to a partial
encapsulation of catalyst particles by the high volume fraction of PTFE or by the formation
of non-active parts of the cell area due to large agglomerates of inert PTFE, which further
http://repository.uwc.ac.za
12
lead to a higher cell resistance due to less ionic and electronic conductivity. From Fig. 7, the
GDE with 30 wt.% PTFE, which performed best at an usual working voltage of 0.6 V and
maximum power density, is chose for all subsequent studies.
3.4. Effect of PA impregnation in the GDEs on the MEA performance
In the case of the high temperature PEMFC, phosphoric acid soaked into the porous
structure is assumed to play a key role in the proton conductivity of the CL [37].
http://repository.uwc.ac.za

13
However, liquid PA in the CLs also makes the gas transport difficult and impedes the
electrode reactions by phosphate anion adsorption on the platinum catalyst, especially in
the cathode due to the sluggish ORR [36]. Therefore, PA impregnation in the CL needs to be
optimized using precise control mechanisms to achieve the best balance among these
influencing factors and thereby obtain high cell performance. Although it is found that
the dependence of cell performance on PA content in the anode is not as pronounced as
for the cathode [12,35], but the general tendency that excess- or insufficient PA
content in the electrodes causes the performance degradation does apply to the anode.
Furthermore, there exists a dynamic exchange of PA be- tween the membrane and the
CLs [35,37] when the MEA is operated. For these reasons, we simply impregnated both
GDEs for the cathode and the anode with same amount of PA, to find out the optimal
value for the whole MEA performance, as shown in Fig. 8. Fig. 8(a) presents the
polarization curves of the MEAs using the GDEs (with the optimal PTFE content in CL)
impregnated with different PA loadings. For comparison purposes, we plot the current
densities at 0.6 V and the maximum power densities of these MEAs, as shown in Fig. 8(b). It
is clear that the performances of the MEAs increase with the increase of the PA content
in the GDEs from 0 mg cm-2 up to 3.5 mg cm-2, i.e. the current density increases from
0.203 A cm-2 to 0.379 A cm-2 at 0.6 V, the maximum power density increases from 0.263
http://repository.uwc.ac.za
14
W cm-2 to 0.609 W cm-2. However, further increase in the PA content to 4 mg cm-2
causes deteriorated performance as illustrated by the decreased current densities from
0.379 A cm-2 to 0.24 A cm-2 at the same cell voltage, with the decreased maximum
power density from 0.609 W cm-2 to 0.415 W cm-2, which indicates that higher PA
amount in GDE is disadvantageous as most of the pores of the CL become filled with liquid,
resulting in significant performance degradation at high current densities (Fig. 8(a)) due to
the serious mass transport limitations of the reactants.
It should be pointed out that the optimal PA loading in the GDE slightly varies with the
PTFE content in the CL (3.5 mg cm-2 PA impregnation only for the optimal PTFE content
of 30 wt.%). Based on our experiments, the optimal value is about 3 mg cm-2 for the
GDEs with lower PTFE content (15e25 wt.%), 3.5e4 mg cm-2 for the higher PTFE content
(not detailed here), which is thought to be affected by the change in the thickness and
structure of the CL [23,35]. In contrast, the MEA without PA impregnation in the GDEs
shows the poorest fuel cell performance under the same operating conditions (Fig. 8). This
explicitly indicates that PA impregnation is necessary for the high performance of the MEA
with the “PTFE- based” GDEs.
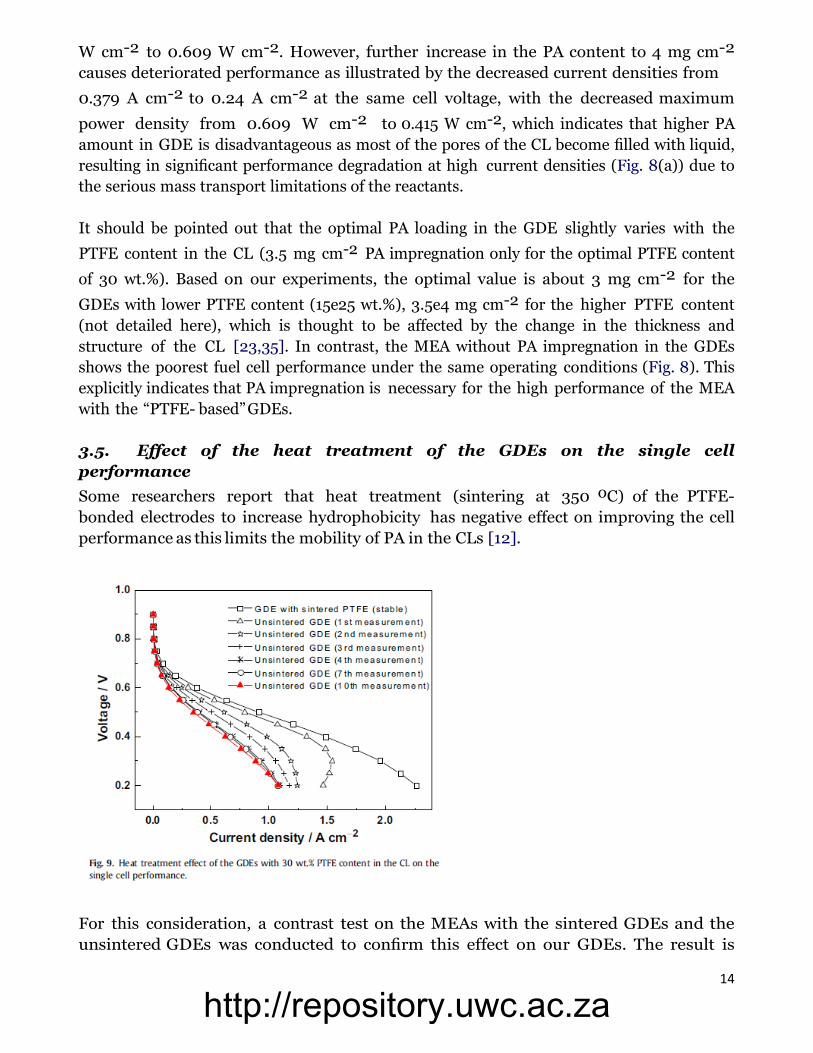
3.5. Effect of the heat treatment of the GDEs on the single cell
performance
Some researchers report that heat treatment (sintering at 350 oC) of the PTFE-
bonded electrodes to increase hydrophobicity has negative effect on improving the cell
performance as this limits the mobility of PA in the CLs [12].
For this consideration, a contrast test on the MEAs with the sintered GDEs and the
unsintered GDEs was conducted to confirm this effect on our GDEs. The result is
http://repository.uwc.ac.za

15
shown in Fig. 9. On the contrary, heat treatment delivers a high and stable cell
performance for the MEA with our GDEs, while the performance of the MEA with
unsintered GDEs is poor and quite unstable in initial hours of test, especially at high
current densities. This could be due to that the unsintered PFTE polymer particles are
agglomerated in the CL (without the formation of network), resulting in reduced CL
porosity and gas permeability, as well as increased possibility of PA flooding. This is
documented by the back-scattered electrons image shown in Fig. 10(b), in which the
PTFE agglomerates can be observed notably. As the same figure shows, in the case of
the sintered GDE (Fig. 10(a)), the structure of the resulting CL is more homogeneous
and porous.
These two opposite results may arise from the different means of introducing PA into
the CLs. In some researchers’ works [12,35], the GDEs were tested without pre-
impregnation of PA, so the proton transfer in the CLs purely relies on the mobile acid
from the PA-doped membrane. In this case, the heat-treated GDEs exhibit a high
degree of hydrophobicity repelling any mobile acid coming from the membrane.
Therefore, the PA amounts in the CLs are low, resulting in limited active three-phase
zone close to the membrane boundary, whereas the remainders of the CLs remain
relatively inactive. This could be even worse for the membrane with low PA doping
level. However, in our case, the GDEs were pre-impregnated with the suitable PA
amount before being tested, so the conductivities of the CLs less rely on the mobile
acid from the membrane, instead the membrane can keep a high acid doping level
due to the high hydrophobic PTFE network repelling the mobile PA from the
membrane. Moreover, the high hydrophobic PTFE network can hold the impregnated
PA in the CLs, thereby reducing the leaching of PA, accordingly the performance
stability of the MEA could be enhanced. For these reasons, heat treatment is thought to
be necessary for the good and stable performance of the MEA with the PA-impregnated
GDEs.
3.6. Stability of the MEA performance
The stability or durability of MEA is a major concern for the real application and
commercialization of fuel cells. The remarkable long term stability of PA-doped PBI
MEA was achieved in some research groups’ works [38e41]. To verify the stability of
the MEA with our GDEs, a short term durability test was performed at 160 oC and 0.2 A
cm-2, as shown in Fig. 11. The test started with a 105 h continuous operation, then
followed a 175 h intermittent operation with three complete shut downs (cooled to room
temperature, no gases flow) to simulate the fuel cell system shutdown and restarting that
is likely to occur in actual system operation. It is note that the cell voltage quickly
reached stable in less than 4 h (small insert in Fig. 11), which is believed to be one of
the advantages of the PTFE-based electrodes over the conventional PBI-based electrodes
[12], as the latter normally require days even weeks of activation in order to achieve the
best operating conditions [8,22,42].
http://repository.uwc.ac.za

16
http://repository.uwc.ac.za

17
It is mainly because the conductivity of PA and the oxygen diffusion in PA are an order of
magnitude higher than that for PA-doped PBI [43], so pre-impregnating the GDEs
with PA reduces the time needed before the MEA reaches its best performance.
After the activation, the cell voltage of the MEA remains at w0.62 V without obvious
drop after the 275 h operation. Usually, the PA loss from the PA-doped PBI
membrane and the GDEs is speculated as a major degradation mechanism of the
PBI-based high temperature PEM fuel cell during short term operation [41]. The
combination of high cell temperature and high load conditions (i.e., high water
generation) leads to a proposed steam distillation mechanism for PA removal from the
MEA [41]. Therefore, the good stability of our MEA performance implies that the GDEs
provide a good structure to keep required PA in the membrane and the CLs, resulting in
a very low PA loss rates under the operating conditions. The degradation rate calculated
by linear fitting of cell voltage data points after the MEA activation is about 17.2 mV h-1,
which is among the values reported in other researchers’ works (normally 4.9e 25
mV h-1) [38,41,44,45].
A post-analysis using SEM on the cross-section of the MEA after the durability test
shows in Fig. 12. In order to get high quality cross-section, the carbon papers were
peeled off when the sample was prepared. It can be seen that the PBI membrane
remains a considerable thickness of about 66.7 mm (the original thickness (PA-
doped) is about 80 mm, cell compression may reduce it greatly), which suggests that
the membrane still keeps a high PA doping level after the durability test [39]. In
addition, it can be seen that although the CL surface is not even, an intimate
contact is still formed between the CLs and the PBI membrane, which can be
observed more clearly in the back-scattered electrons image (Fig. 12(b)). The bumps
and agglomerates of catalyst particles even increased the contact area between the
CLs and the membrane, which could make better catalyst utilization. From all these
results, we believe that the good performance and stability of the MEA benefits
from the intimate contact between the CLs and the PBI membrane, the unique
surface morphology, as well as the superior porous structure of the GDEs prepared by
ACSUI method.
4. Conclusions
High performance MEA with the GDEs prepared by a novel ACSUI method has been
developed for PA-doped PBI high temperature PEMFC. Under an usual operating conditions
(160 oC, H2/Air, ambient pressure), the peak power density of the single cell reached 0.61 W
cm-2, and the current density at 0.6 V was up to 0.38 A cm-2, which are comparable to the
best results yet reported for similar MEAs with Pt loading of w0.5 mg cm-2. It is found
that the PTFE content in the CLs and the PA impregnation in the GDEs are important to
achieve suitable cell performance. A relatively high PFTE content (25e40 wt.%) gave
satisfactory cell performances. Heat treatment of the PTFE-based GDEs is thought to be
necessary for the good and stable performance of the MEA. The MEA showed good stability
http://repository.uwc.ac.za

18
in a short term operation: the cell voltage remained at w0.62 V without obvious drop after
the 275 h operation. It concludes that the good performance and stability of the MEA
benefits from the intimate contact between the CLs and the PBI membrane, the unique
surface morphology, as well as the superior porous structure of the GDEs prepared by ACSUI
method.
Acknowledgments
This work is supported by Hydrogen and Fuel Cell Technologies RDI Programme
(HySA), funded by the Department of Science and Technology in South Africa
(project KP1-S01).
http://repository.uwc.ac.za

19
References
[1] N.L. Garland, J.P. Kopasz, J. Power Sources 172 (2007) 94e99.
[2] S.J. Peighambardoust, S. Rowshanzamir, M. Amjadi, Int. J. Hydrogen Energy
35 (2010) 9349e9384.
[3] K.L. Hsueh, E. Gonzalez, S. Srinivasan, D.T. Chin, J. Electrochem. Soc. 131
(1984) 823e828.
[4] J. Lobato, P. Cañizares, M.A. Rodrigo, J.J. Linares, F.J. Pinar, Int. J.
Hydrogen Energy 35 (2010) 1347e1355.
[5] J. Lobato, P. Cañizares, M.A. Rodrigo, J.J. Linares, D. Úbeda, F.J. Pinar, Fuel
Cells 10 (2010) 312e319.
[6] J. Lobato, P. Canizares, M.A. Rodrigo, D. Ubeda, F.J. Pinar, J.J. Linares, Fuel
Cells 10 (2010) 770e777.
[7] J. Lobato, M.A. Rodrigo, J.J. Linares, K. Scott, J. Power Sources 157 (2006)
284e292. [8] F. Seland, T. Berning, B. Børresen, R. Tunold, J. Power Sources 160
(2006) 27e36. [9] C. Pan, Q. Li, J.O. Jensen, R. He, L.N. Cleemann, M.S. Nilsson,
N.J. Bjerrum,
Q. Zeng, J. Power Sources 172 (2007) 278e286.
[10] J.O. Park, K. Kwon, M.D. Cho, S.G. Hong, T.Y. Kim, D.Y. Yoo, J. Electrochem.
Soc.
158 (2011) B675eB681.
[11] P. Mazúr, J. Soukup, M. Paidar, K. Bouzek, J. Appl. Electrochem. 41 (2011)
1013e1019. [12] M. Mamlouk, K. Scott, Int. J. Energy Res. 35 (2011) 507e519.
[13] M. Mamlouk, K. Scott, Int. J. Hydrogen Energy 35 (2010) 784e793.
[14] B. Millington, V. Whipple, B.G. Pollet, J. Power Sources 196 (2011)
8500e8508.
[15] Q. Li, R. He, J.O. Jensen, N.J. Bjerrum, Fuel Cells 4 (2004) 147e159.
[16] Q. Li, J.O. Jensen, R.F. Savinell, N.J. Bjerrum, Prog. Polym. Sci. 34 (2009)
449e477. [17] J.A. Asensio, P. Gómez-Romero, Fuel Cells 5 (2005) 336e343.
[18] J.A. Asensio, E.M. Sanchez, P. Gomez-Romero, Chem. Soc. Rev. 39
(2010) 3210e3239.
[19] J.-H. Kim, H.-J. Kim, T.-H. Lim, H.-I. Lee, J. Power Sources 170 (2007)
275e280.
[20] O.E. Kongstein, T. Berning, B. Børresen, F. Seland, R. Tunold, Energy 32
(2007) 418e422.
[21] A.-L. Ong, G.-B. Jung, C.-C. Wu, W.-M. Yan, Int. J. Hydrogen Energy 35
(2010) 7866-7873
[22] G.-B. Jung, C.-C. Tseng, C.-C. Yeh, C.-Y. Lin, Int. J. Hydrogen Energy (2012).
[23] C. Wannek, W. Lehnert, J. Mergel, J. Power Sources 192 (2009) 258e266.
[24] S. Matar, A. Higier, H. Liu, J. Power Sources 195 (2010) 181e184.
[25] J. Zhang, Y. Tang, C. Song, J. Zhang, J. Power Sources 172 (2007) 163e171.
[26] H.-N. Su, S.-J. Liao, Y.-N. Wu, J. Power Sources 195 (2010) 3477e3480.
[27] H.-K. Lee, J.-H. Park, D.-Y. Kim, T.-H. Lee, J. Power Sources 131 (2004)
200e206.
http://repository.uwc.ac.za

20
[28] J. Lobato, P. Cañizares, M. Rodrigo, C. Ruiz-López, J. Linares, J. Appl.
Electro- chem. 38 (2008) 793e802.
[29] M. Watanabe, M. Tomikawa, S. Motoo, J. Electroanal. Chem. Interfacial
Elec- trochem. 195 (1985) 81e93.
[30] D.S. Hwang, C.H. Park, S.C. Yi, Y.M. Lee, Int. J. Hydrogen Energy 36 (2011)
9876e9885.
[31] C. Song, Y. Tang, J.L. Zhang, J. Zhang, H. Wang, J. Shen, S. McDermid, J.
Li,
P. Kozak, Electrochim. Acta 52 (2007) 2552e2561.
[32] J.L. Jespersen, E. Schaltz, S.K. Kaer, J. Power Sources 191 (2009)
289e296. [33] Y. Shao, G. Yin, Z. Wang, Y. Gao, J. Power Sources 167 (2007)
235e242.
[34] W.H.J. Hogarth, J.C. Diniz da Costa, G.Q. Lu, J. Power Sources 142 (2005)
223e237.
[35] R. He, Q. Li, A. Bach, J.O. Jensen, N.J. Bjerrum, J. Membr. Sci. 277 (2006)
38e45. [36] C. Wannek, I. Konradi, J. Mergel, W. Lehnert, Int. J. Hydrogen Energy
34 (2009)
9479e9485.
[37] Y. Oono, A. Sounai, M. Hori, J. Power Sources 189 (2009) 943e949. [38]
T.J. Schmidt, J. Baurmeister, J. Power Sources 176 (2008) 428e434. [39] Y.
Oono, A. Sounai, M. Hori, J. Power Sources 210 (2012) 366e373.
[40] Y. Oono, T. Fukuda, A. Sounai, M. Hori, J. Power Sources 195 (2010)
1007e1014. [41] S. Yu, L. Xiao, B.C. Benicewicz, Fuel Cells 8 (2008) 165e174.
[42] M. Boaventura, A. Mendes, Int. J. Hydrogen Energy 35 (2010) 11649e11660.
[43] Z. Liu, J.S. Wainright, M.H. Litt, R.F. Savinell, Electrochim. Acta 51
(2006) 3914-3923.
[44] C. Wannek, B. Kohnen, H.F. Oetjen, H. Lippert, J. Mergel, Fuel Cells 8
(2008) 87-95.
[45] A.D. Modestov, M.R. Tarasevich, V.Y. Filimonov, N.M. Zagudaeva,
Electrochim. Acta 54 (2009) 7121-7127.
http://repository.uwc.ac.za