enhanced fault imaging from seismic and geological model · enhanced fault imaging from seismic and...
TRANSCRIPT

Enhanced Fault Imaging from Seismic and Geological Model Sebastien Lacaze*, Fabien Pauget, Benoit Luquet and Thomas Valding, Eliis
Summary
Imaging faults is a complex process, which requires a
combination of various approaches. Methods based on the
gradient vector field, obtained from the seismic 3D cross
correlation, is sensitive to any local variation. Deriving the
vector field to local dip, curvature or oriented filters such as
variance, is used extensively to enhance structural
discontinuities. By analyzing the maximum of variance, a
new attribute depicts the probability of fault occurrence.
Although it shows a skeleton of the fault network, it remains
difficult to use it for automatic extraction.
Another method consists in using derivatives of a relative
geological time model, obtained during a comprehensive
interpretation process. In such case, the fault image is
directly related to the vertical throw and provides a high
level of detection even where the seismic variance is limited
due to a low signal to noise ratio. To increase the precision
of the detection, surface attributes for each relative age are
computed in the flattened space and then converted to the
seismic domain.
With such technique, the calculation of the extrema values
of the deepest descent gradient shows the fault break points
at a sub seismic accuracy and is related to the vertical throw.
It becomes a complementary attribute to the variance and the
fault probability. Applied to the Exmouth data set, located
on the North West Australian margin, these various types of
attribute were used to interpret complex faulted deposits in
the reservoir level.
Introduction
Seismic attributes have been used extensively to image faults
for the past decade. Even though algorithms, imaging
technologies and hardware are improved year after year,
detecting faults from the seismic remains a complex task. In
this paper, two complementary approaches are presented:
one based on the local vector field directly computed from
the seismic data and the other one related to a relative
geological time (RGT) model, computed during the seismic
interpretation process.
Gradient Vector Field
The gradient vector field reflects the orientations of events
in the seismic volume and represents a very important source
of information to have a preliminary view of the main
geological trends. It is computed using the normalized cross-
correlation to 3D matrix and allows to have automatically a
local vector for each sample in the entire seismic volume
(Fig 1.a). The gradient vector field constitutes a major input
to determine the local dip and azimuth and, to some extent,
can be used to highlight stratigraphy as well as structural
discontinuities.
For each vector, the local dip and azimuth are estimated and
used for various attributes calculation (Fig 1.b). Although
this information is sensitive to faults, it only shows local
variations and cannot be related to the displacement of the
fault plane. Several applications derived from the gradient
vector field have been proposed for fault enhancement, such
as dip-steered coherence (Marfurt et al, 1999), structure-
oriented filter (Luo et al, 2002; Wang, 2008, 2012) and also
curvatures, which are widely used for structural
discontinuities detection (Roberts 2001, Marfurt, 2006).
Figure 1: Calculation of the local vector based seismic 3D cross
correlation. For each seismic sample, a vector provides the local
dip and azimuth, which will be used to compute structural attributes.
In this work, the local vector field has been applied to a
seismic data set coming from the Exmouth Sub-basin, which
is part of the North Carnarvon Basin, along the West
Australian margin and characterized by a complex fault
system in the reservoir level.
A local dip attribute was computed from the Principal
Component Analysis of the principal Eigen vector of the
covariance matrix. Despite this attribute shows main fault
lineaments (Fig 2.b), the image is too heterogeneous to
clearly detect fault planes. Even though this level of
N
E
z
a
q
a)
b)
Page 1971© 2016 SEG SEG International Exposition and 86th Annual Meeting
Dow
nloa
ded
11/0
7/16
to 1
09.2
37.2
42.1
63. R
edis
trib
utio
n su
bjec
t to
SEG
lice
nse
or c
opyr
ight
; see
Ter
ms
of U
se a
t http
://lib
rary
.seg
.org
/
detection can be optimized by using a range of curvature
attributes (Fig 2.c), it remains complex to extract structural
discontinuities. Therefore, dip-steered coherence analysis
(Marfurt et al, 1998), such as variance, provides a
significantly better image of the structural discontinuities but
still depends on the seismic signal heterogeneities in the
vicinity of the fault, inducing approximations in the local dip
calculation (Fig 2.d).
Figure 2: Various attributes based on the local vector field. (a)
Seismic; (b) Local dip from the PCA of the covariance matrix, (c)
Maximum curvature and (d) Variance.
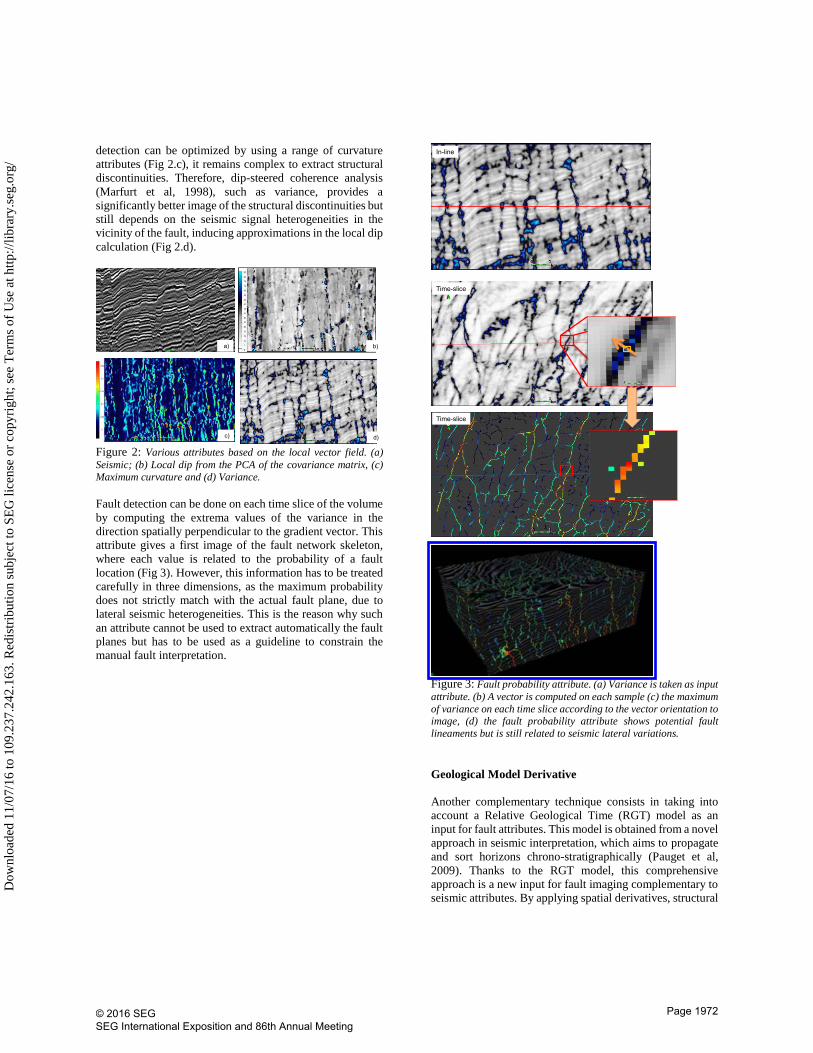
Fault detection can be done on each time slice of the volume
by computing the extrema values of the variance in the
direction spatially perpendicular to the gradient vector. This
attribute gives a first image of the fault network skeleton,
where each value is related to the probability of a fault
location (Fig 3). However, this information has to be treated
carefully in three dimensions, as the maximum probability
does not strictly match with the actual fault plane, due to
lateral seismic heterogeneities. This is the reason why such
an attribute cannot be used to extract automatically the fault
planes but has to be used as a guideline to constrain the
manual fault interpretation.
Figure 3: Fault probability attribute. (a) Variance is taken as input
attribute. (b) A vector is computed on each sample (c) the maximum
of variance on each time slice according to the vector orientation to image, (d) the fault probability attribute shows potential fault
lineaments but is still related to seismic lateral variations.
Geological Model Derivative
Another complementary technique consists in taking into
account a Relative Geological Time (RGT) model as an
input for fault attributes. This model is obtained from a novel
approach in seismic interpretation, which aims to propagate
and sort horizons chrono-stratigraphically (Pauget et al,
2009). Thanks to the RGT model, this comprehensive
approach is a new input for fault imaging complementary to
seismic attributes. By applying spatial derivatives, structural
a)
c)
b)
d)
In-line
Time-slice
Time-slice
Page 1972© 2016 SEG SEG International Exposition and 86th Annual Meeting
Dow
nloa
ded
11/0
7/16
to 1
09.2
37.2
42.1
63. R
edis
trib
utio
n su
bjec
t to
SEG
lice
nse
or c
opyr
ight
; see
Ter
ms
of U
se a
t http
://lib
rary
.seg
.org
/
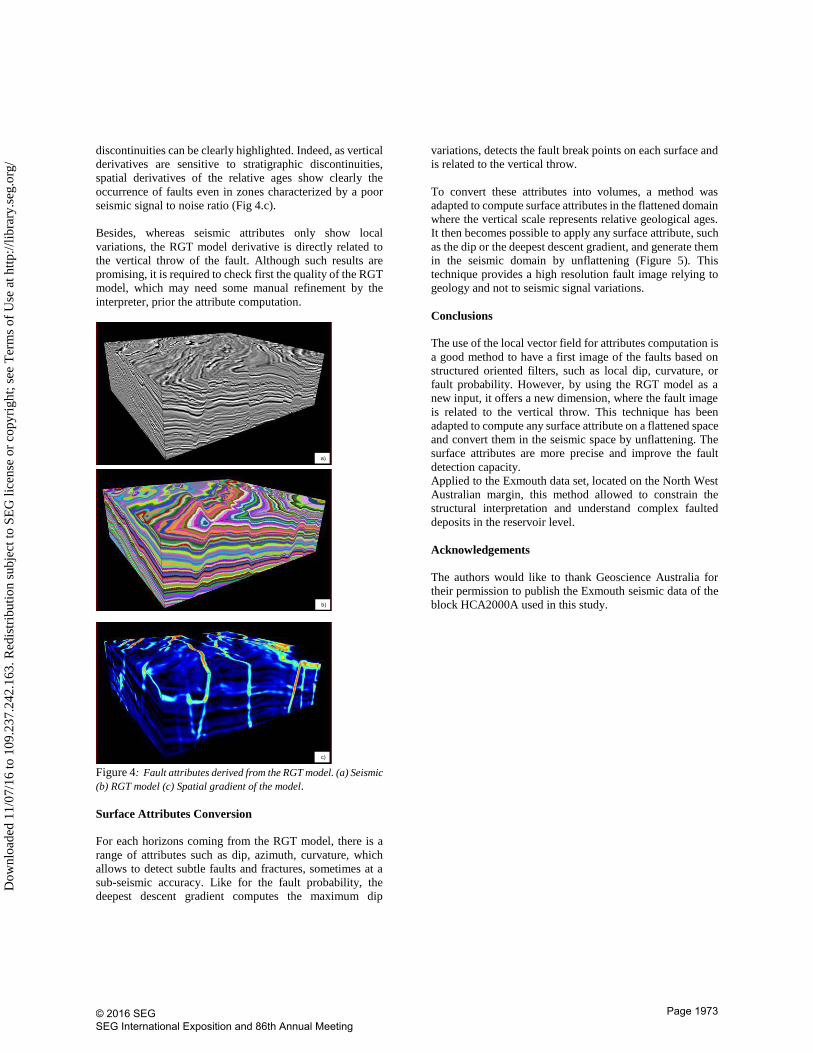
discontinuities can be clearly highlighted. Indeed, as vertical
derivatives are sensitive to stratigraphic discontinuities,
spatial derivatives of the relative ages show clearly the
occurrence of faults even in zones characterized by a poor
seismic signal to noise ratio (Fig 4.c).
Besides, whereas seismic attributes only show local
variations, the RGT model derivative is directly related to
the vertical throw of the fault. Although such results are
promising, it is required to check first the quality of the RGT
model, which may need some manual refinement by the
interpreter, prior the attribute computation.
Figure 4: Fault attributes derived from the RGT model. (a) Seismic
(b) RGT model (c) Spatial gradient of the model.
Surface Attributes Conversion
For each horizons coming from the RGT model, there is a
range of attributes such as dip, azimuth, curvature, which
allows to detect subtle faults and fractures, sometimes at a
sub-seismic accuracy. Like for the fault probability, the
deepest descent gradient computes the maximum dip
variations, detects the fault break points on each surface and
is related to the vertical throw.
To convert these attributes into volumes, a method was
adapted to compute surface attributes in the flattened domain
where the vertical scale represents relative geological ages.
It then becomes possible to apply any surface attribute, such
as the dip or the deepest descent gradient, and generate them
in the seismic domain by unflattening (Figure 5). This
technique provides a high resolution fault image relying to
geology and not to seismic signal variations.
Conclusions
The use of the local vector field for attributes computation is
a good method to have a first image of the faults based on
structured oriented filters, such as local dip, curvature, or
fault probability. However, by using the RGT model as a
new input, it offers a new dimension, where the fault image
is related to the vertical throw. This technique has been
adapted to compute any surface attribute on a flattened space
and convert them in the seismic space by unflattening. The
surface attributes are more precise and improve the fault
detection capacity.
Applied to the Exmouth data set, located on the North West
Australian margin, this method allowed to constrain the
structural interpretation and understand complex faulted
deposits in the reservoir level.
Acknowledgements
The authors would like to thank Geoscience Australia for
their permission to publish the Exmouth seismic data of the
block HCA2000A used in this study.
a)
b)
c)
Page 1973© 2016 SEG SEG International Exposition and 86th Annual Meeting
Dow
nloa
ded
11/0
7/16
to 1
09.2
37.2
42.1
63. R
edis
trib
utio
n su
bjec
t to
SEG
lice
nse
or c
opyr
ight
; see
Ter
ms
of U
se a
t http
://lib
rary
.seg
.org
/
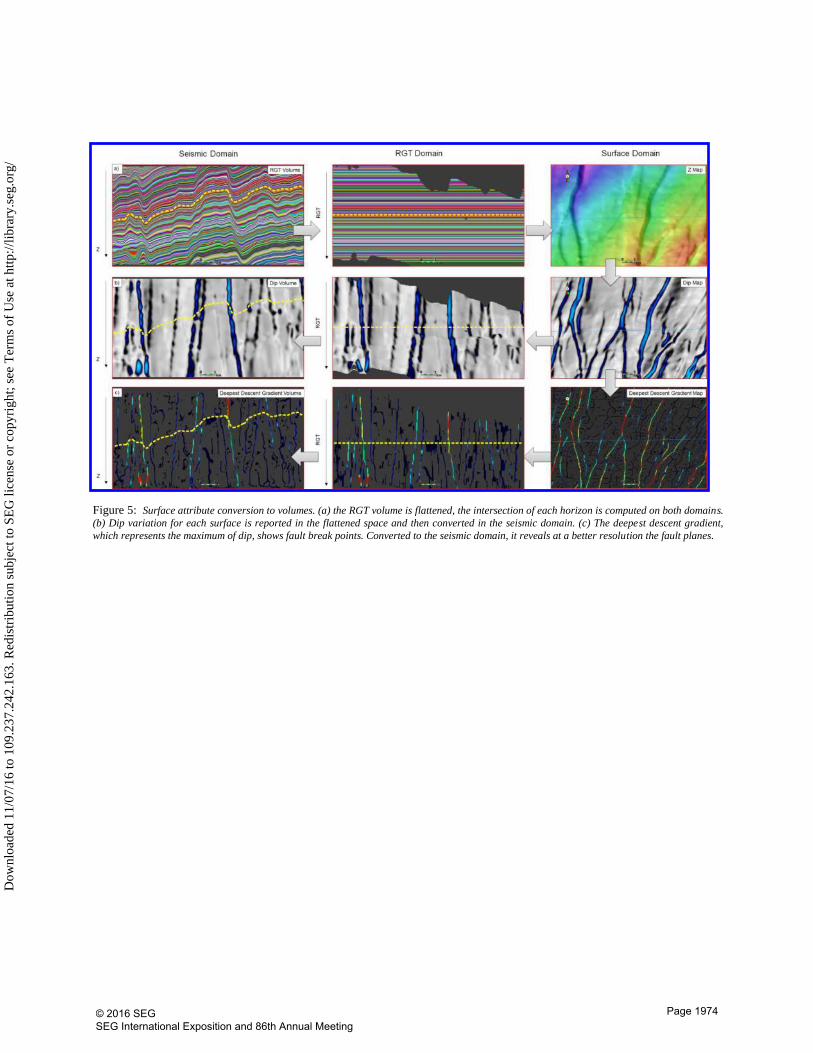
Figure 5: Surface attribute conversion to volumes. (a) the RGT volume is flattened, the intersection of each horizon is computed on both domains.
(b) Dip variation for each surface is reported in the flattened space and then converted in the seismic domain. (c) The deepest descent gradient,
which represents the maximum of dip, shows fault break points. Converted to the seismic domain, it reveals at a better resolution the fault planes.
Page 1974© 2016 SEG SEG International Exposition and 86th Annual Meeting
Dow
nloa
ded
11/0
7/16
to 1
09.2
37.2
42.1
63. R
edis
trib
utio
n su
bjec
t to
SEG
lice
nse
or c
opyr
ight
; see
Ter
ms
of U
se a
t http
://lib
rary
.seg
.org
/
EDITED REFERENCES Note: This reference list is a copyedited version of the reference list submitted by the author. Reference lists for the 2016
SEG Technical Program Expanded Abstracts have been copyedited so that references provided with the online metadata for each paper will achieve a high degree of linking to cited sources that appear on the Web.
REFERENCES Lacaze, S., F. Pauget, M. Mangue, M. Lopez, and A. Gay, 2011, Seismic interpretation from a geological
model — A North Sea case study: 81st Annual International Meeting, SEG, Expanded Abstracts, 1134–1139.
Luo, Y., M. Marhoon, S. Al-Dossary, and M. Alfaraj, 2002, Edge-preserving smoothing and applications: The Leading Edge, 21, 136–158, http://dx.doi.org/10.1190/1.1452603.
Marfurt, K. J., 2006, Robust estimates of 3D reflector dip and azimuth: Geophysics, 71, no. 4, P29–P40, http://dx.doi.org/10.1190/1.2213049.
Marfurt, K. J., R. L. Kirlin, S. L. Farmer, and M. S. Bahorich, 1998, 3D seismic attributes using a semblance-based coherency algorithm: Geophysics, 63, 1150–1165, http://dx.doi.org/10.1190/1.1444415.
Marfurt, K. J., V. Sudhaker, A. Gersztenkorn, K. D. Crawford, and S. E. Nissen, 1999, Coherency calculations in the presence of structural dip: Geophysics, 64, 104–111, http://dx.doi.org/10.1190/1.1444508.
Pauget, F., S. Lacaze, and T. Valding, 2009, A global approach in seismic interpretation based on cost function minimization: 79th Annual International Meeting, SEG, Expanded Abstracts, 5, 2592–2596, http://dx.doi.org/10.1190/1.3255384.
Roberts, A., 2001, Curvature attributes and their application to 3D interpreted horizons: First Break, 19, 85–100, http://dx.doi.org/10.1046/j.0263-5046.2001.00142.x.
Wang, W., J. H. Gao, W. C. Chen, and Z. Y. Zhu, 2012, Random seismic noise suppression via structure adaptive median filter: Chinese Journal of Geophysics, 55, 1732–1741.
Wang, W., J. H. Gao, and K. Li, 2008, Structure-adaptive anisotropic filter with local structure tensors: Proceedings of the 2nd International Symposium on Intelligent Information Technology Application, IEEE, 1005–1010, http://dx.doi.org/10.1109/IITA.2008.144.
Page 1975© 2016 SEG SEG International Exposition and 86th Annual Meeting
Dow
nloa
ded
11/0
7/16
to 1
09.2
37.2
42.1
63. R
edis
trib
utio
n su
bjec
t to
SEG
lice
nse
or c
opyr
ight
; see
Ter
ms
of U
se a
t http
://lib
rary
.seg
.org
/