engro corporation limited · today, engro is a leading player with more than 40 years of experience...
TRANSCRIPT

ENGRO CORPORATION LIMITEDCOMPANY NO. 197302229H
29 INTERNATIONAL BUSINESS PARK#08-05/06 ACER BUILDING TOWER B
SINGAPORE 609923T +65 6561 7978F +65 6561 9770
BUILDING A SUSTAINABLE FUTURE
ANNUAL REPORT 2017
ENG
RO
CO
RPO
RA
TION
LIMITED
AN
NU
AL R
EPOR
T 2017

01 :: CORPORATE PROFILE
02 :: CHAIRMAN’S MESSAGE
04 :: DIRECTORS’ PROFILES
05 :: MANAGEMENT TEAM
06 :: CORPORATE STRUCTURE
07 :: REGIONAL FOOTPRINT
08 :: SINGAPORE & MALAYSIA: INTEGRAL CEMENT & READY-MIX CONCRETE
12 :: CHINA: SPECIALTY CEMENT
18 :: SINGAPORE & CHINA: SPECIALTY POLYMER
20 :: INVESTMENTS
21 :: CORPORATE SOCIAL RESPONSIBILITY
22 :: FINANCIAL HIGHLIGHTS
23 :: CORPORATE GOVERNANCE REPORT
45 :: FINANCIAL CONTENTS
129 :: SUPPLEMENTARY INFORMATION
130 :: STATISTICS OF SHAREHOLDINGS
132 :: NOTICE OF ANNUAL GENERAL MEETING
PROXY FORM
REGISTERED OFFICE29 International Business Park#08-05/06 Acer Building Tower BSingapore 609923Tel: +65-65617978Fax: +65-65619770
SHARE REGISTRARBoardroom Corporate & Advisory Services Pte Ltd50 Raffles Place#32-01 Singapore Land TowerSingapore 048623
AUDITORSKPMG LLPPublic Accountants and Chartered Accountants16 Raffles Quay#22-00 Hong Leong BuildingSingapore 048581
PARTNER-IN-CHARGELow Gin Cheng, Gerald (with effect from FY2016)
COMPANY SECRETARYJoanna Lim Lan Sim
Table of CONTENTS
EnGro was originally incorporated in 1973 as SsangYong Cement (Singapore) Pte Ltd, a tripartite joint venture involving SsangYong Cement Korea, DBS Bank and Afro Asia Shipping.
In 2005, the Company changed its name to EnGro Corporation Limited with a new logo that reflects its vision on North Asia and growth through strategic partnerships. The striking blue and orange symbolises EnGro and its partners. The design simulates the hemisphere of a globe reflecting EnGro’s desire to expand globally.
Today, EnGro is a leading player with more than 40 years of experience providing innovative, eco-friendly, and high performance building materials to key projects in the region.
EnGro’s “Building Sustainability” tagline reflects its campaign to help the industry go green and achieve the triple bottom-line equilibrium of PEOPLE, PLANET, and PROFIT.
ANNUAL REPORT 201701
Corporate PROFILE

DEAR SHAREHOLDERS,
FINANCIAL REVIEWEnGro Corporation Limited (“EnGro” or the “Group”) recorded a revenue of S$141.8 million for the year ended 31 December 2017 (“FY2017”), a 7.5 per cent decline compared to the S$153.3 million in FY2016, due in part to softer demand and intense competition for our Integral Cement and Ready-Mix Concrete (“Integral Cement & RMC”) in Singapore.
Our Specialty Cement business and China property investments performed well but were insufficient to offset the lower returns from the Integral Cement & RMC business and lower returns from our investment portfolio. As a result, the Group’s profit after tax and minority interest (PATMI)fell from S$5.8 million in FY2016 to S$3.6 million in FY2017.
DIVIDENDDespite continuing diff icult operating conditions both in Singapore and China, the Board is cautiously opportunistic going forward and is therefore recommending a first and final dividend of 2.5 cents per share to be declared for FY2017, subject to shareholders’ approval at the Annual General Meeting of the Company to be held on 27 April 2018.
BUSINESS REVIEWNotwithstanding the Singapore economy registering a GDP growth of 3.6 percent in 2017, the construction sector contracted by 8.4 per cent, weighed down by a 29.1 per cent decline in private sector activities which led to
lower volume and selling price for construction materials invariably affecting EnGro’s Integral Cement & RMC business. Fortunately, the property market in Singapore trended up and sentiments have improved after the Government adjusted the Seller’s Stamp Duty and Total Debt Servicing Ratio framework in March 2017.
In China, our GGBS business benefited from China’s 6.9 per cent GDP growth, contributed in part by the construction boom and robust global demand for Chinese exports.
a) Integral Cement and Ready-Mix Concrete Operations
A weak pr ivate sector construction demand coupled with the deferment of several large-scale projects to 2018 led to a slowdown in the Singapore construction sector which affected the performance of our Integral Cement & RMC business. However, construction demand in the public sector was kept steady at $15.5 billion with support from major contracts awarded for a number of industrial and a few infrastructure projects.
Investment in Iskandar Development Region (IDR), by investors from the People’s Republic of China (PRC) slowed down as a result of strict capital controls imposed by the Chinese Government during the year. As the PRC investors embark upon the next wave of their Belt and Road Initiatives (BRI) in Malaysia, our RMC operations have correspondingly expanded northward in anticipation of new opportunities.
b) S p e c i a l t y C e m e n t Operations in China
Our Specialty Cement operations in China, comprising of our Ground Granulated Blastfurnace Slag (GGBS) joint ventures (JVs), turned in a satisfactory performance during the year as a result of capacity rationalisation and improved steel and cement prices. One positive event contributing to increased demand for GGBS is the long-awaited regulatory removal in the use of low quality composite Ordinary Portland Cement of 32.5 grade, which in the past accounted for a significant percentage of the total cement output plus consumption in China.
With the shutdown of Jinan Iron and Steel plant in Jinan, a strategic move by the Shandong Iron and Steel Group to upgrade its core business and competency in China, a new integrated steel complex with 8.1 million tons per annum capacity, known as Shandong Steel Rizhao Company Limited, was established in Rizhao. To support such a move, our Jinan Luxin JV, had one of its two production lines, each with a GGBS capacity of 600,000 tons per annum, relocated correspondingly. The first production line has been in operation since December 2017 and the second is planned to be commissioned in early 2019. As a result of this relocation, Jinan Luxin would be elevated to position itself as a competitive player for GGBS exports riding on China’s BRI.
ENGRO CORPORATION LIMITED02
Chairman’s MESSAGE

c) Specialty PolymerIn 2017, revenue from Specialty Polymer business grew 22 per cent due to increased demand in China and the Asia Pacific region. During the year, another joint venture with a manufacturing facility was set up in Malaysia to serve demand from Asia Pacific, excluding China. With this addition, the Group is moving closer towards its plan for the Specialty Polymer compounding business to supplement the Specialty Cement business.
d) InvestmentsDigital disruption is affecting practically all industries in the world. We have responded to this change by moving our venture capital portfolio towards fund-of-fund investment in order to capture the emergence of data economy.
Our investments in the Tangshan Nanhu Eco City project in Tangshan, Hebei province, have started to show positive results in 2017 as all units built under Phase 1 were practically sold. Phase 2 would commence in 2018. The Central Government has also included Tangshan city in its plan to become a garden city within the Beijing-Tianjin-Hebei corridor and the project is expected to yield positive results in the near future.
PROSPECTSSingapore GDP grew by a better-than-expected rate of 3.6 per cent in 2017 and is expected to grow moderately to between 1.5 and 3.5 per cent range in 2018. Improved property
market sentiments supported by increased collective condominium sale activities and the deferment of large scale public projects to 2018 should prop up the construction sector and this is expected to enable Top-Mix Singapore to perform better in 2018.
In Malaysia, an anticipated recovery of the IDR construction demand in the second half of 2018 would contribute positively to Top-Mix Malaysia. The combined positive Singapore and Malaysia market sentiments should augur well for our Integral Cement & RMC business as a whole.
President Xi Jinping’s three key broad economic thinking which focuses on (1) People Orientation, (2) Quantitative to Qualitative Focus and (3) New Industrial Revolution, would help China rebalance itself as it enters the phase of moderate growth with emphasis to uplift quality of life of Chinese citizens. By embracing new technology and innovation comprising of internet revolution, renewable energy, green development, on top of the its high-speed-rail economy, moderate economic growth in medium term seems sustainable. The foregoing should reinforce EnGro’s stranglehold in China.
We are optimistic that our China business network would be able to seize opportunities derived from the Belt and Road Initiative (BRI). Looking forward, we anticipate that the prices of both cement and GGBS in China will stay firm, which is an encouraging sign that our China GGBS business would contribute as planned.
In view of the global economic recovery gaining traction and a better outlook for the property sector, we remain confident in our ability to meet these challenges head on and to attain our financial and operational goals.
ACKNOWLEDGEMENTOn behalf of the Board, I wish to thank Mr Soh Kim Soon and Mr Ng Tat Pun for their dedication and contribution during their term as Independent Directors of the Company and we wish them all the very best in their future endeavours. At the same time, I would like to extend a warm welcome to both Mr Tan Soo Nan and Mr Steven Ong Kay Eng for joining the board as Non-Executive Independent Directors. I would also offer my heartfelt thanks to everyone in the EnGro family – our customers, stakeholders, my fellow Directors and our Management team and staff for their unwavering support, dedication and belief in EnGro.
Tan Cheng GayChairmanEnGro Corporation Limited
ANNUAL REPORT 201703

TAN CHENG GAYChairman and Chief Executive Officer
Mr Tan is a stalwart of the Company, having been with EnGro Corporation since its inception. He was appointed as Director in 1973 and has since served as the Executive Director to steer the strategic direction and vision of the Group.
Mr Tan holds a Bachelor of Science (Honours) degree in Electrical and Electronic Engineering from University of London King’s College and a Master of Science in Electronic Engineering from University of Manchester Institute of Science and Technology (UK).
TAN YOK KOONExecutive Director
Mr Tan was first appointed as a Non-Independent Director in 1974. In March 2005, he was appointed as the President of China Operations, leading the China team to drive the Specialty Cement (GGBS) thrust. He also serves as a member of the Nominating Committee. He is related to Mr Tan Cheng Gay.
Mr Tan holds a Bachelor of Law degree from University of London’s King’s College, London and a Master in Business Administration from Columbia University, New York.
RONNIE TEO HENG HOCKDirector
Mr Ronnie Teo Heng Hock joined the board in January 2012 as an Independent and Non-Executive Director of the Company. He is the Chairman of the Remuneration Committee and serves as a member of the Audit Committee and the Nominating Committee.
He was previously the Managing Director of DBS Asset Management Ltd and General Manager of DBS Finance Limited. Mr Teo is concurrently a Director of Berger International Private Limited and an Independent Director of Uni Asia Group Limited.
Mr Teo holds a Bachelor of Social Sciences (Honours) degree in Economics from the University of Singapore.
TAN SOO NANDirector
Mr Tan joined the board in May 2017 as an Independent and Non-Executive Director. Mr Tan is also the Lead Independent Director. He is the Chairman of the Audit Committee and serves as a member of the Nominating Committee and the Remuneration Committee.
Mr Tan serves on the boards of public listed and private companies including Raffles Medical Group Ltd, SATS Ltd, Raffles Health Insurance Pte Ltd, ICE Futures Singapore Pte Ltd, ICE Clear Singapore Pte Ltd, and ICE Singapore Holdings Pte Ltd. Mr Tan is also active in social causes and serves as Chairman of Temasek Foundation Management Services CLG Limited and Director in Woh Hup Trust and SPD Singapore, all of which are not-for-profit organisations.
Mr Tan had previously held the positions of Chief Executive Officer at Singapore Pools (Private) Limited, Singapore Totalisator Board, and Temasek Capital (Private) Limited as well as Senior Managing Director of DBS Bank. He was also previously a Director of OSIM International Ltd, Chairman of Temasek Education Foundation CLG Limited and has had over 30 years of experience in the banking and financial services.
Mr Tan holds a Bachelor of Business Administration (Honours) degree from the University of Singapore and is an Associate of The Chartered Institute of Bankers. Mr Tan also attended a Program for Management Development from the Harvard Business School.
STEVEN ONG KAY ENGDirector
Mr Ong joined the board in July 2017 as an Independent and Non-Executive Director. He is the Chairman of the Nominating Committee and serves as a member of the Audit Committee and the Remuneration Committee.
Mr Ong is an Independent Non-Executive Director of Sino Land Company Limited, Tsim Sha Tsui Properties Limited and Sino Hotels (Holdings) Limited since July 2005. He is also a Director of Altrade Investments Pte. Ltd. in Singapore and a substantial shareholder of Hwa Hong Corporation Limited which is listed on the main board of the Singapore Stock Exchange.
Mr Ong has been a veteran banker with extensive experience in banking and finance over 43 years. He was the General Manager and Country Head for American Express Bank in Singapore for nearly 10 years and also the Chief Representative and Country Manager in China for Banca Monte dei Paschi di Siena S.p.A. for 16 years. Mr Ong remained as the bank’s advisor and consultant for 2 years after he left China in 2006 having resided in the country for over 16 years. He was the Chairman of Foreign Bankers’ Association in Beijing, PRC from 1999 to 2000.
ENGRO CORPORATION LIMITED04
Directors’ PROFILES

HQ HEAD OF DEPARTMENTLIM YEE CHUANGroup Financial Controller
Ms Lim oversees financial affairs of the Group. She has over 20 years of experience in similar field in government-linked and public-listed companies in Singapore. Ms Lim is an ACCA graduate and a Chartered Accountant of Singapore.
WONG TOON HONGManager, Strategic Business Unit
Mr Wong oversees the Group’s Venture Capi ta l Hi-Tech investments and Specialty Cement (GGBS) joint venture in Korea. His prior working experience were in sectors like defense, government, publishing, technology and business consulting for multinational companies in Asia Pacific. Mr Wong has a Bachelor of Engineering (Civil) from Nanyang Technological University and an MBA from the University of Surrey, UK.
VINCENT LOH Manager, Knowledge Management & Business Development
Mr Loh currently oversees the Group’s knowledge management, business development, and sustainability initiatives. He has more than 20 years of working experience in various industries. Mr Loh has a Bachelor of Business (Accounting) from Monash University, Australia, and is both a CPA Australia and a Chartered Accountant of Singapore.
INTEGRAL CEMENT & RMC OPERATIONSEUGENE HO Senior General Manager, Building Materials Division (Singapore)
Mr Ho oversees the Group’s Integral Cement and Ready-Mix Concrete (“RMC”) business in Singapore and Malaysia. He has more than 30 years of working experience in building materials industry and has held various senior positions in the major RMC companies. Mr Ho has a Master of Science (Honors) in Marketing from National University of Ireland, a Bachelor of Business (Business Administration) from Royal Melbourne Institute of Technology University, Australia, a Diploma in Civil Engineering from Singapore Polytechnic and a Diploma in Management Studies from Singapore Institute of Management (SIM).
SPECIALTY CEMENT OPERATIONSDR. CHEN EN YIGeneral Manager, Specialty Cement
Dr Chen oversees the Group’s Specialty Cement (GGBS) joint ventures in China. He has been working with the Company for 22 years. Prior to joining the Group, he lectured in Tsinghua University China, specialising in cement and concrete technologies. Dr Chen has a Bachelor of Engineering (Bui ld ing Mater ia ls ) f rom Chongqing University, a Master of Engineering (Civil) and Ph.D in Engineering (Civil) from Tsinghua University, China.
DR. LIM CHAN TENGManager, Business Development (China)
Dr Lim is a key member of EnGro’s China business team. Dr Lim has a Bachelor of Science (Chemical Engineering) from Nanyang University and a Ph.D (Chemical Engineering) from University of Manchester Institute of Science and Technology, UK. He worked for a major oil company for more than 20 years. He has good experience in process technology, facilities planning and development as well as design. Dr Lim joined EnGro in 2004 and has been instrumental in developing and expanding EnGro’s GGBS business in China.
SPECIALTY POLYMER OPERATIONSTAI BOON CHENGeneral Manager, R&P (Pte) Ltd
Mr Tai oversees the business and operations of the Group’s Specialty Polymer unit. He has working experience in operations management, plant restructuring, production management and technology transfer for local and global MNCs.
ANNUAL REPORT 201705
Management TEAM

Companies Incorporated in ChinaCompanies Incorporated in SingaporeCompanies Incorporated in Malaysia
Companies Incorporated in United KingdomCompanies Incorporated in South KoreaCompanies Incorporated in Hong Kong
Building Materials
Specialty Polymer
Food & Beverage
100%
60%
40%
100%
R&P (Pte.) Ltd.
R&P Technologies Pte. Ltd.
Kunshan R&P Co., Ltd
100%
100%
100%
100%
Sancem Investment Pte Ltd
Juniper Capital Ventures (Pte) Ltd
SsangYong LTI Pte Ltd
e-Invest Limited
30%
20%
30%
10%
HBS Investments Pte Ltd
HB Investments (China) Pte. Ltd.
Parliament View Developments Limited
Ho Bee Cove Pte Ltd
Tianjin Ang de Food & Beverages Management Co., Ltd
RMC
100%
100%
40%
40%
40%
Top-Mix Concrete Pte Ltd
Top Mix Concrete (Malaysia) Sdn Bhd
Changshu Chang Long Concrete Co Ltd
Changshu Chang Xin Ready Mix Concrete Co Ltd
Changshu Chang Yin Ready Mix Concrete Co Ltd
GGBS
40%
40%
40%
33%
34.4%
40%
Tangshan Tanglong Materials Co Ltd
Tangshan TangAng Materials Co Ltd
Jinan Luxin Materials Co Ltd
Wuhan Wuxin Materials Co Ltd
Qingdao Evergreen Materials and Technologies Co Ltd
VCEM Materials Co Ltd
40%Jiangsu Huailong Materials Co Ltd
Investments
HI-TECH / VC INVESTMENTS PROPERTY DEVELOPMENT
GREEN CEMENT
40%Xin-Shan Ang-de (Zibo) Materials Co., Ltd
ENGRO CORPORATION LIMITED06
Corporate STRUCTURE

SHANDONG
SINGAPORE
JOHORBAHRU
QUANZHOU
Headquarters
Manufacturing & Distribution
QINGDAO
RIZHAO
China
INCHEON
MALAYSIA
JINGTANG PORT
TANGSHAN
BEIJING
SHANGHAI
KUNSHAN
CHANGSHU
HUAI’AN
JINAN
HUBEI
WUHAN
HEBEISOUTH KOREA
JIANGSU
MALACCA
ANNUAL REPORT 201707
Regional FOOTPRINT

Singapore construction slowed in year 2017, with a decline of S$1.6 billion in total construction demand, from S$26.1 billion in 2016 to preliminary estimate of S$24.5 billion in 2017.
Public sector construction demand held steady at S$15.5 billion. The sustained demand
was supported by major contracts awarded for a number of industrial projects such as HDB’s Defu Industrial City, Bedok Food City and JTC’s Logistics Hub @ Gul, as well as a few major infrastructure projects such as Circle Line 6, North-South Corridor and Deep Tunnel Sewerage System (DTSS) Phase
2. Despite the aforesaid, some of these large-scale projects are rescheduled to 2018 as a longer duration was required for preparation and implementation.
Owing to subdued property market condition and slower economic growth in the previous two years, private sector
Singapore & Malaysia:INTEGRAL CEMENT & READY-MIX CONCRETE
ENGRO CORPORATION LIMITED08

construction demand weakened further to S$9.0 billion in 2017, from S$10.3 billion in 2016.
Per the Building and Construction Author i ty (BCA)’s la test Development Plans Survey conducted in Oct/Nov 2017, and considering the prevailing market developments and economic outlook, BCA forecasts that the
total construction demand in 2018 (excluding reclamation works) will fall within S$26 billion and S$31 billion range, an increment from S$24.5 billion in 2017.
Of which, 60 per cent of the total demand will be attributed by the demand from the public sector construction, which is likely to strengthen to between
2013 2014 2015 2016 2017
Construction Demand, S$ billion 35.8 37.7 27.2 26.1 24.5
• Public Sector, S$ Billion 14.8 19.7 14.0 15.8 15.5
• Private Sector, S$ Billion 21.0 18.0 13.2 10.3 9.0
S$16 billion and S$19 billion, up from the S$15.5 billion in 2017. Likewise, the private sector’s construction demand is expected to increase from S$9 billion in 2017 to between S$10 billion and S$12 billion in 2018 as construction activity benefits from a reinforced economic outlook and an increase in property market sentiment.
ANNUAL REPORT 201709

8PRODUCTS
4PRODUCTS
2PRODUCTS
1PRODUCT
EnGro’s Eco-Friendly Building Materials are awarded with SEC’s Green label Accreditation as well as the SGBC’s Singapore Green Product Label Accreditation
Looking beyond 2018, the overall construction industry is poised for a gradual but steady recovery, supported by a robust pipeline of major public infrastructure projects, optimistic market sentiments that arises from improved economic environment, along with emerging opportunities related with future redevelopment works of collective sale sites. Some of these notable upcoming major contracts in 2018 (including those postponed from 2017) comprises of North-South Corridor, rail systems and Deep Tunnel Sewerage System (DTSS) Phase 2.
As a leading manufacturer of Ground Granulated Blastfurnace Slag (GGBS), EnGro continues to be at the forefront in research and development to cultivate various cementitious products in order to meet demand of the overall construction industry in Singapore. With the constant evolutions of industry standards in the built environment sector, it has become increasing challenging for the members in
the evolving construction sector. Hence, in view of the anticipated increase in demand of blended cement for structural and ground improvement projects in Singapore for the coming years, EnGro will continue to pursue and integrate the latest technology to maintain leadership position in the industry and conduct extensive research to meet with the stringent specifications set by various government agencies. Through these initiatives and transformations, EnGro shall benefit and emerge stronger, achieve long term sustainability and productivity.
2017 was indeed a very challenging year for EnGro’s RMC subsidiary, Top-Mix Concrete Singapore. Weak property market and subdued construction demand resulted in lower sales revenue and margin squeeze for the entity. To counter the adverse situation, Top-Mix Concrete Singapore adopted the differentiation strategy with development of innovative products such as
Singapore & Malaysia:INTEGRAL CEMENT & READY-MIX CONCRETE
ENGRO CORPORATION LIMITED10
P4246S P197AP4246 P197B P197-4S
BLENDED CEMENT
P8000PreFine 60/80
BLENDED CEMENTGREEN CONCRETEGGBS
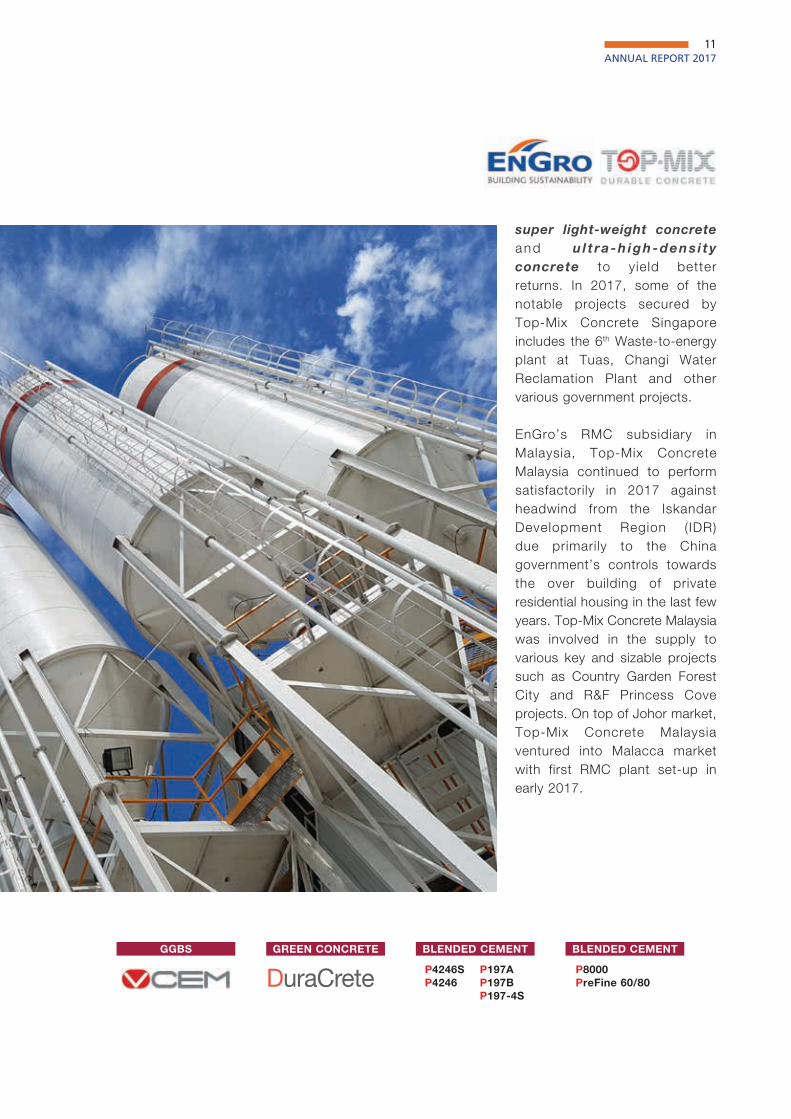
super light-weight concrete and u l t ra-h igh-dens i ty concrete to yield better returns. In 2017, some of the notable projects secured by Top-Mix Concrete Singapore includes the 6th Waste-to-energy plant at Tuas, Changi Water Reclamation Plant and other various government projects.
EnGro’s RMC subsidiary in Malaysia, Top-Mix Concrete Malaysia continued to perform satisfactorily in 2017 against headwind from the Iskandar Development Region (IDR) due primarily to the China government’s controls towards the over building of private residential housing in the last few years. Top-Mix Concrete Malaysia was involved in the supply to various key and sizable projects such as Country Garden Forest City and R&F Princess Cove projects. On top of Johor market, Top-Mix Concrete Malaysia ventured into Malacca market with first RMC plant set-up in early 2017.
ANNUAL REPORT 201711

ENGRO CHINA GROUND GRANULATED BLASTFURNACE SLAG (GGBS) BUSINESS ENDED 2017 ON HIGH NOTEChina’s economy grew faster than expected in the fourth quarter of 2017, as export recovery helped China post its first Gross Domestic Product (GDP) growth in seven years. Chairman Xi Jinping, having established his complete authority at the 19th Party Congress in October, began to address risks associated with China’s debt and property market. Thanks to an improved global demand for its goods, sustained state infrastructure spending, increased momentum from the Belt and Road Initiative (BRI), stronger corporate earnings boosted by soaring factory prices and buoyant consumer spending, the country once again posted an impressive economic performance.
Faced with worsening smog in Beijing, Tianjin, cities in Hebei and West Shandong, China Government implemented strict inspections on likely violators in the latter part of 2017 as well as drastic steps in shutting down cement and other polluting industries for an extended period to curb winter air pollution. The capacity cuts culminated in skyrocketing cement and other building material prices and in the process benefitting GGBS prices across the country with the higher prices being held firm even in the winter season.
Against this backdrop, EnGro China GGBS business enjoyed better overal l performance in 2017. However, one disappointing performer was Tangshan joint venture (JV) plants Tanglong and Tang-Ang; being in Tangshan which is known as one of the worst polluted area in the country, our Tangshan JV plants bore the brunt of extremely severe measures including several months of shutdown due to stop-orders imposed by the Tangshan Municipal Government to tackle air pollution problem during the winter season. All other GGBS JVs performed well above our set targets. Even Jinan Luxin JV, in the midst of relocating one of its four mills due to Jinan Iron & Steel Group (JiGang) steel plant in Jinan decommissioned for good, performed well. In 2017, our GGBS JVs sold a total of 7.8 million metric tons of GGBS and achieved record combined revenues of RMB1.36 billion (42 per cent higher than that of 2016) yielding a profit more than double that of 2016.
China:SPECIALTY CEMENT
ENGRO CORPORATION LIMITED12

MILESTONES ACHIEVED IN 2017
1) RIZHAO LUXINThe fully state-owned Shandong Iron & Steel Group Co. Ltd. (SISG) was formed on 17 March 2008 through the amalgamation of JiGang, Laiwu Iron & Steel Group Co., and Shandong Metallurgical Industry Corp. With the establishment of a new Shandong Iron and Steel production complex
Photo: Slag receiving and storage in an enclosed system
Photo: Slag transport to vertical roller mill by conveyor belt
with annual capacity of 8.1 million tons of steel in Rizhao, a complete shutdown of JiGang plant in Jinan marked an end to a chapter in the history of Jinan, which resulted in Jinan Luxin JV making its first move to relocate one of its four grinding mills to Rizhao in March 2017.
ANNUAL REPORT 201713

Photo: Rizhao Luxin GGBS Plant’s Vertical Roller Mill (“VRM”)
Relocation and installation of Jinan Luxin JV’s first production line was completed in November 2017.
With the successful commissioning of SISG’s first 5200 m3 blast furnace in Rizhao on 18 December 2017, Rizhao Luxin, the branch of Jinan Luxin JV, successfully commissioned production of its relocated production line on 26 December 2017; it is looking into overseas market on top of domestic sales.
Photo: Jiangsu Huailong GGBS Plant in Huai’an, Jiangsu Province
China:SPECIALTY CEMENT
ENGRO CORPORATION LIMITED14

FUJIAN
WUHAN
SHANGHAI
BEIJING
QINGDAO
ZHENGZHOU
XUZHOU
NANJING
FUZHOU
QUANZHOU
XIAMEN
JINGTANG
TIANJIN
VCEM MaterialsKorea
INCHEON
TANGSHAN
HUAI’AN
JINAN
SHIJAZHUANG
Pearl River
GGBS JV PlantAnnual
Production (Metric tons p.a)
Tangshan Tanglong Materials Co., Ltd 1,200,000
Tangshan Tang-Ang Materials Co., Ltd 600,000
Jinan Luxin Materials Co., Ltd 1,800,000
Jinan Luxin Materials Co., Ltd (Rizhao Luxin Branch)
600,000
Quanzhou Luxin Materials Co., Ltd 600,000
Jiangsu Huailong Materials Co., Ltd 1,200,000
Wuhan Wuxin Materials Co., Ltd 3,000,000
Qingdao Evergreen Materials and Technologies Co., Ltd
1,200,000
VCEM Materials Co. Ltd. (Korea) 600,000
Total GGBS Capacity 10,800,000
Map: GGBS Production Plants in North Asia
RIZHAO
Yellow River
Yangtze River
ANNUAL REPORT 201715

2) WUHAN WUXIN PERMEABLE BRICK AND PAVEMENT CONCRETE MAKING PLANT
The plant was commissioned in May 2017, producing permeable bricks and concrete pavement products for use in the sponge city projects in Wuhan. The plant has a production capacity of 1 million square metres of permeable concrete products per annum.
3) ENGRO GGBS+ E-COMMERCE PLATFORM LAUNCHED ON WECHAT
Stage 1 of our e-commerce development ended in December 2017 with a successful launching of the mobile-phone platform over WeChat. Stage 2 involving relocation of the present facilities in Shanghai to Wuhan has commenced and is scheduled to complete by 1Q 2018.
The GGBS+ e-commerce digital platform is designed to expose GGBS and other products to a wider range of users across China. Initially, targeted at professionals and researchers interested in application of Supplementary Cementitious Materials, such as GGBS and fly ash, in blended cements. Through the digital platform, it is envisaged that the concept of green building materials will get a new pair of wings in getting market acceptance at an increased pace.
EnGro GGBS+ e-commerce team promoted EnGro’s Singapore application and experience on GGBS at Tongji University in Shanghai on 18 December 2017. The team also presented EnGro’s VCEM (微神 ) e-commerce platform which aroused interest of the students and researchers from Tongji University’s Civil Engineering Department.
OUTLOOK 2018Economic observers predict China’s economic growth may possibly slow down to 6.4 per cent due to intensified government efforts to curb property market speculation and to deal with rising debt associated risks; economic rebalancing and local ized regulations to rein in pollution, which will impact many factories particularly in the Beijing-Tianjin-Hebei region. However, we expect 2018 demand for raw materials in China to stay healthy while material prices remain firm.
China’s RMB35 trillion high-speed rail (HSR) network construction is still charging ahead with a target of additional 10,000 kilometers by 2020, on top of the 20,000 kilometers currently in service. The almost sure-to-realize dream is to put in place an “8-Vertical, 8-Horizontal” high-speed railway network, crisscrossing the country with eight north-south and eight east-west lines by 2025, covering
80 per cent of China’s major cities. Coupled with spinoffs, it will continue to boost demand for steel, cement and our GGBS which was extensively used in the Beijing-Shanghai HSR project and many other subsequent HSR development.
In 2016, the Chinese government approved the medium and long term Railway Network Program, aiming to build up a HSR network with eight north-south corridors and eight east-west corridors as the backbones for linking regional lines and intercity railways.
According to the Program,
• By 2020, the railway network in China is expected to reach 150,000km, including 30,000km of HSRs. HSR will cover 75% of cities, each with a population of more than 500,000 and 80% of cities, each with a population of more than 1 million.
• By 2025, the railway network is expected to reach 175,000km including 38,000km of HSRs.
In the long term, the railway network is expected to reach 200,000km including 45,000km of HSRs.
Wuxin permeable bricks used in sponge city projects in Wuhan
Key equipment is supplied by Hess Group GmbH
Wuxin Permeable Brick and Pavement Concrete Making Plant
China:SPECIALTY CEMENT
ENGRO CORPORATION LIMITED16

Location Major projects Description
Wuhan 12 urban metro lines Construction of some lines is expected to be completed by 2021.
Qingdao Qingdao-Lianyungang high speed railway
194 kilometers in length, expected to be completed in 2018.
Qingdao New West Railway Station
The new station is part of the China’s Belt and Road initiative. To be completed by late 2018.
Qingdao Jiaodong Airport project
Total investment is RMB41.57 billion. Phase 1 is scheduled to complete by 2025.
Jinan The Jinan-Qingdao High-Speed Railway
Total investment is RMB60 billion. Expected to complete by 2019.
Jinan Metro North-South Line is under construction.
Huai’an Huai’an East Passenger Station (with an area of 200,000 m2)
Costing RMB1.5 billion. Project shall begin in 2018.
Lianyungang-Huai’an-Yangzhou-Zhenjiang High Speed Railway (305-kilometer)
RMB46.4 billion project is currently under construction. Expected to be open to traffic in 2019.
Xuzhou-Suqian-Huai’an-Yancheng rail line (314 kilometers)
RMB37 billion project started in still under construction and scheduled to end by 2019.
Quanzhou Fuzhou-Xiamen High-Speed Railway (via Quanzhou)
RMB50 billion project started construction in 2017 and planned for completion in 2022.
CHINA TO ABOLISH COMPOSITE 32.5 GRADE CEMENT PRODUCTSA l t h o u g h n u m e r o u s announcements had been made to ban the use of low quality composite Ordinary Portland Cement (OPC) of 32.5 grade, which accounts for a significant percentage of China’s total cement output, implementation has been slow. However, once set in full motion, cement producers will be forced to switch to producing OPC of 42.5 grade. The announced policy to abolish OPC of 32.5 grade bodes well for the future of GGBS.
ANOTHER UNCERTAIN, BUT PROMISING YEAR AHEADNotwi thstand ing a l l the positive announcements and developments mentioned above, 2018 will still pose a challenging year for EnGro’s China GGBS business as the situation surrounding China Government’s unrelenting efforts to combat pollution remains very fluid and unpredictable.
While relocation of JiGang’s mill to Rizhao last year will continue to exert negative impact on Jinan Luxin JV’s operation, we see potential silver lining offered by its recently commissioned 1st production line in Rizhao, where Jinan Luxin JV is capable of supplying to both domestic and export markets, riding on the Belt and Road Initiative (BRI).
To capitalise on the increase in raw slag supply from the new steel complex slag, one of Jinan Luxin JV’s remaining three grinding mills will be relocated to Rizhao Port this year to grow the production capacity of Rizhao Luxin to 1.2 million metric tons per annum. During Rizhao Luxin’s transitional phase, Jinan Luxin JV management shall continue to seek ways to optimise cost and production.
Wuhan Wuxin JV management will be placing greater effort to boost GGBS production, supplemented by the sales ramp up of Wuhan Wuxin JV’s new permeable-brick manufacturing plant.
We will speed up our GGBS+ e-commerce project upon completion of relocating our facilities from Shanghai to Wuhan.
Our green blended slag cement JV in Shandong is still under development and is expected to commence operations sometime in 2018.
As we crossed over from 2017 to 2018, we were delighted and encouraged to see that both cement and GGBS prices have remained firm and this augurs well for our prospect in 2018 if slag price increase does not outpace that of the GGBS selling price; therefore, we remain cautiously confident that our China GGBS business will continue to perform well in 2018 and with a bit of luck, we may even out-perform 2017.
Some of on-going and the announced infrastructural projects that shall have positive impacts on EnGro’s GGBS JVs are set out below:
ANNUAL REPORT 201717

R&P’s transformation from a toll compounder for ExxonMobil Chemical to an independent compounder serv ing the automotive sector, enabled it to secure a foothold within and beyond China, supplying to various countries in Asia such as China, Japan, India, Thailand and Indonesia.
R&P’s joint venture (JV) production facility in Kunshan, China commissioned its first production line in January 2017 and second line in September 2017. Sales of more than 7,000 metric tons was achieved in 2017 and sales volume is expected to grow in coming years in tandem with economic growth. Total production capacity of 26,000 metric tons in Kunshan is sufficient to meet market demand for the next two years.
Kunshan R&P JV has secured supply to two major global customers, FORD and Valeo, and successfully qualified two more new customers, Volvo and Zotye, in 2017.
Research and development (R&D) centre of R&P was relocated to Kunshan in October 2017 to better serve its customers’ need and support the development of new models called for by customers. Investment in R&D is key to R&P long term competitive edge as well as to penetrate huge automotive market and tapping into other business segments.
In August 2017, R&P signed a joint venture agreement with Omni-Plus System Pte Ltd (OPS), a Singapore-based company involved in polymer compounding, distribution and
R&P Kunshan Production Plant
supply chain management for key polymer manufacturers. OPS has presence in Thailand, Indonesia, Malaysia, Vietnam, India and China. Itochu Plastic is one of its equity partners since July 2017. The joint venture enabled R&P to relocate its production lines from Jurong Island to OPS’s production facility at Johor Bahru in order to continue supplying existing customers outside of China and the increasing supply to Indonesia market in anticipation of automotive plants that have been lined up.
With the two key JVs set in place upon fine tuning of geographical growth, we are optimistic that the Specialty Polymer compounding business will serve as EnGro’s second growth engine in due course.
Photo: R&P Plant in Kunshan
Singapore & China:SPECIALTY POLYMER
ENGRO CORPORATION LIMITED18

Photo: These are some of the automotive applications for R&P’s products.
ANNUAL REPORT 201719

VENTURE CAPITAL HI-TECH INVESTMENTSIn 2017, over US$84 billion was invested into 7,783 companies, the largest amount since the dot-com era for the US venture capital industry. With US$110 billion raised in 2014 to 2016, and a further US$32.4 billion in 2017, there is ample funding for start-ups going forward. Despite non-traditional funds investing less in the venture scene now, the emergence of Softbank’s massive US$100 billion Vision Fund will have an impact on the eco-system in the years to come.
Going into 2018, venture investors are staying disciplined as more capital is now deployed at higher valuations with deal size doubling across the angel, seed and early stage deals since 2013. Start-ups are also more mature in age and developmental progress as investors insist on tighter KPIs before investing. Unicorns (valuations exceeding US$1 billion) attracted US$19.1 billion in investments which represented 23% of total capital invested in the venture capital sector.
As non-traditional funds had earlier invested large amounts in venture deals, this had pushed out the IPO and extended exit timeline for some venture-backed companies. This also resulted in peak valuations and longer time to liquidity as late stage start-ups embraced using private capital to fund growth instead of going the IPO route. Despite this, there were 58 IPO exits in 2017 which had surpassed the 41 IPOs in 2016. Going into 2018 and riding on this trend, our venture fund managers continue to look for timely exits within their portfolios.
Although investment into software companies declined to US$30 billion, it continues to attract the bulk of venture investments. Emerging software verticals are Fintech, Artificial Intelligence and Machine Learning, Data Analytics, Blockchain technology, Robotics and Drones.
To leverage on these emerging innovations and to achieve consistency in annuity-l ike investment returns with better risk diversifications, our venture capital strategy had evolved investing into high tech early
stage fund-of-funds. Despite our fund-of-funds being primarily USA-based, their geographical investment focus also includes investing into the best-of-breed fund managers in Europe and China. This approach allows us indirect access to top performing venture funds on a global scale as the venture landscape becomes more competitive and access limited for new investors.
PROPERTY INVESTMENTLocal residential property market has shown signs of recovery in recent month. Depending on the market conditions, unsold units of Turquoise in Sentosa might be relaunched at appropriate time. Despite weak rental market, occupancy and rental rate for the project remain satisfactory.
Tangshan Nanhu Eco city project in China has sold more than 95% of its phase 1 units. Selling price continues to rise and Phase 2 is expected to be launched in 2018. With Tangshan being earmarked to become a garden city within the Beijing-Tianjin-Hebei corridor under Central Government policy, management expects the project to yield results in medium term.
ENGRO CORPORATION LIMITED20
INVESTMENTS

ENGRO SCHOLARSHIP FOR STUDENTS OF SINGAPORE INSTITUTE OF TECHNOLOGY (“SIT”)
In October 2017, EnGro S c h o l a r s h i p p r o g r a m continued to support deserving undergraduates of the Singapore Institute of Technology (“SIT”) who are pursuing full-time degree programmes in the areas of sustainable infrastructure engineer ing and systems engineering offered by SIT.
ENGRO DONATION TO SCO
On 27 October 2017, the Singapore Chinese Orchestra (SCO) held its 21st Fundraising Gala Dinner and Concert. In this record-breaking fundraising, ESM Goh Chok Tong thanked donors and partners such as EnGro by presenting them with a bamboo flute (笛子) for its donation in support of SCO to be a world renowned Chinese orchestra with a uniquely Singaporean character.
ANNUAL REPORT 201721
Corporate Social RESPONSIBILITY

THREE-YEAR RESULTS AT A GLANCE
FY2015 FY2016 FY2017
Consolidated Statement of Comprehensive Income ($’000)
Revenue 180,770 153,297 141,826
(Loss)/Profit after tax (5,445) 5,881 3,813
(Loss)/Profit after tax and minority interest (PATMI) (5,283) 5,768 3,636
Statement of Financial Position ($’000)
Total assets 262,793 253,882 244,317
Net assets value 223,451 219,208 215,241
Per Share (Cents)
Basic earnings (4.45) 4.86 3.07
Net asset value 188 185 181
Net dividend 2.50 2.50 2.50
REVENUE (S$’000)
(LOSS)/PROFIT AFTER TAX AND MINORITY INTEREST (PATMI) (S$’000)
TOTAL ASSETS(S$’000)
NET ASSET VALUE(S$’000)
BASIC EARNINGS PER SHARE(cents)
NET ASSET VALUE PER SHARE(cents)
NET DIVIDEND PER SHARE(cents)
REVENUE OF ENGRO AND ASSOCIATES AND JOINT VENTURES# (S$’000)
# Revenue of Associates and Joint Ventures is calculated based on percentage of interest EnGro has in the Associates and Joint Ventures. Numbers are for illustration purpose only.
180,770153,297
141,826
2015 2016 2017
262,793253,882 244,317
2015 2016 2017
223,451 219,208 215,241
2015 2016 2017
188 185 181
2015 2016 2017
2.50 2.50 2.50
2015 2016 2017
295,318266,716
295,716
2015 2016 2017
(4.45)
4.86
3.07
2015 2016 2017
(5,283)
5,7683,636
2015 2016 2017
ENGRO CORPORATION LIMITED22
Financial HIGHLIGHTS

EnGro Corporation Limited (the “Company”) is committed to achieving a high standard of corporate governance within the
Company and its subsidiaries (the “Group”), to promote corporate transparency and to enhance shareholder value. This report
describes the Company’s corporate governance processes and activities with specific reference to the Code of Corporate
Governance 2012 (the “Code”) issued on 2 May 2012.
The Company is generally in compliance with the principles and guidelines as set out in the Code and in areas where the
Company deviated from the Code, appropriate explanation has been provided within this report. The Board considers that
the alternative corporate governance practices are sufficient to meet the underlying objective of the Code.
BOARD MATTERS
The Board’s Conduct of its Affairs
Principle 1: Every company should be headed by an effective Board to lead and control the company. The Board is
collectively responsible for the long-term success of the company. The Board works with Management to achieve
this objective and Management remains accountable to the Board.
Guidelines
of the Code Corporate Governance Practices of the Company
1.1 The Board’s principal functions include, among others, supervising the overall management and performance
of the business and affairs of the Group and approving the Group’s corporate and strategic policies and
direction.
1.2 All Directors exercise due diligence and independent judgement, and are obliged to act in good faith and
in the best interests of the Company.
1.3 To assist the Board in executing its duties, the Board has delegated specific functions to the Audit
Committee (“AC”), the Nominating Committee (“NC”) and the Remuneration Committee (“RC”) (together
“Board Committees” and each a “Board Committee”). Each of these Board Committees has its own written
terms of reference and its actions are reported to and monitored by the Board. Minutes of the Board
Committee meetings are available to all Board members.
1.4 The Board has held meetings for particular and specific matters as and when required. A record of the
Directors’ attendance at meetings of Board and Board Committees for the financial year ended 31 December
2017 (“FY2017”), as well as frequency of such meetings, is set out in Table 1.
1.5 Key matters which are specifically reserved for the Board’s approval include, among others, annual budgets,
declaration of dividends, any material acquisitions and disposals of assets, any significant corporate matters
and major undertakings (other than in the ordinary course of business). The Board dictates the strategic
plans, direction and management of the Group through quarterly review of the financial performance of the
Group and the Company. In addition to establishing the limits of the discretionary powers of the officers
and committees, the Board reviews the adequacy of risk management systems and internal controls.
1.6 New Directors, upon appointment, are briefed on the business and organisation structure of the Company.
There are update sessions to inform the Directors on new legislation and/or regulations that are relevant
to the Group.
Corporate GOVERNANCE REPORT
ANNUAL REPORT 201723

All Directors are provided with regular updates on changes in the relevant laws and regulations to enable
them to make well-informed decisions and to ensure that the Directors are competent in carrying out their
expected roles and responsibilities. The Directors are aware of the requirements in respect of disclosure of
interests in securities, disclosure of conflicts of interest in transactions involving the Company, prohibition
on dealings in the Company’s securities and restrictions on the disclosure of price-sensitive information.
The Company provides for all Directors to attend appropriate courses, seminars and conferences for them
to stay abreast of the relevant business developments.
The Company organises strategy review meetings for the Directors once every two years. Presentations
and briefings are conducted at such offsite meetings by Executive Directors and Senior Management on the
Group’s operations and current projects, followed by discussion sessions on matters relating to operations
and strategies. In conjunction with the strategy review meeting held in FY2017, the Directors visited the
Group’s ready-mix concrete plant in Malacca.
1.7 A formal letter is sent to newly-appointed Directors upon their appointment explaining their duties and
obligations as Director. New Directors, upon appointment, will also be briefed on their duties and obligations
as Directors. The Directors are also informed of regulatory changes initiated by or affecting the Company.
The following Directors were appointed during the year:–
Name of Director Nature of Appointment
Date of First Appointment
to the Board
Tan Soon Nan Non-Executive Independent Director 2 May 2017
Steven Ong Kay Eng Non-Executive Independent Director 1 July 2017
As part of the induction programme for new Directors appointed to the Board, the new Directors were
briefed and issued with a Director pack comprising (i) a letter of appointment which sets out the terms of
his appointment; (ii) a general guide on the duties and liabilities of a Director of a listed company under
the Companies Act and the SGX Listing Manual; and (iii) a set of the Company’s corporate manual which
contains all the Company’s policies, including terms of references, approved by the Board.
Board Composition and Guidance
Principle 2: There should be a strong and independent element on the Board, which is able to exercise objective
judgement on corporate affairs independently, in particular, from Management and 10% shareholders. No individual
or small group of individuals should be allowed to dominate the Board’s decision making.
Guidelines
of the Code Corporate Governance Practices of the Company
2.1 The Board comprises five Directors, two of whom are Executive Directors and three of whom are
Independent Non-Executive Directors. There is an independent element on the Board, with Independent
Directors constituting more than half of the Board. A summary of the current composition of the Board and
its committee is set out in Table 2.
Corporate GOVERNANCE REPORT
ENGRO CORPORATION LIMITED24

2.2 Where the Chairman and Chief Executive Officer (“CEO”) of the Company is the same person, the
Independent Directors should make up at least half of the Board. The Company has complied with the
relevant guideline of the Code as more than half of the Board is made up of Independent Directors. There
is a strong and independent group of Non-Executive Directors on the Board and is well balanced.
2.3 The NC, which reviews the independence of each Director on an annual basis, adopts the Code’s
definition of what constitutes an Independent Director. Each Independent Director is required to complete
a Confirmation of Independence Statement annually based on the guidelines as set out in the Code.
2.4 When reviewing the independence of the three Independent Directors, the NC has considered the guidelines
for independence as set out in the Code. As part of the consideration, the NC also took into account their
other directorships, annual declaration regarding their independence, disclosure of interest in transactions in
which they have a direct/indirect interest, their ability to avoid any apparent conflicts of interests especially
by abstaining from deliberation on such transactions and their ability to maintain objectivity in their conduct
as Directors of the Company. The three Independent Directors are Mr Ronnie Teo Heng Hock, Mr Tan Soo
Nan and Mr Steven Ong Kay Eng. For purposes of determination of independence, the three Independent
Directors have also provided confirmation that they are not related to the Directors and 10% shareholders of
the Company. The NC is satisfied that there is no other relationship which could affect their independence.
It is noted that all the Independent Directors have served on the Board for fewer than nine years.
Each of the Independent Directors had duly recused himself from the discussion and taking a decision in
respect of his own independence.
2.5 The Board considers that the present Board size is appropriate, taking into account the nature and scope
of the Group’s operation. The Board comprises Directors who as a group provide core competencies, such
as business and management experience, industry knowledge, financial and strategic planning experience
and knowledge that are necessary and critical to meet the Group’s objectives.
2.6 The Board recognises the importance of an appropriate balance and diversity of skills, experience, gender,
knowledge and professional qualifications in building an effective Board. To this end, the NC reviews the
Board’s collective skills matrix regularly.
As a Group, the Directors bring with them a broad range of expertise and experience in areas such as
accounting, finance, business and management experience, industry knowledge, strategic planning and
customer-based experience and knowledge. The diversity of the Directors’ experience allows for the useful
exchange of ideas and views.
2.7 The Non-Executive Directors aim to assist in the development of proposals on strategy by constructively
challenging Management. The Non-Executive Directors would also review the performance of Management
in meetings.
2.8 Where warranted, the Non-Executive Directors meet without the presence of the Executive Directors or
Management to review any matters that must be raised privately.
Corporate GOVERNANCE REPORT
ANNUAL REPORT 201725

Chairman and Chief Executive Officer
Principle 3: There should be a clear division of responsibilities between the leadership of the Board and the
executives responsible for managing the company’s business. No one individual should represent a considerable
concentration of power.
Guidelines
of the Code Corporate Governance Practices of the Company
3.1 There is no separation of roles between the Chairman and CEO in the Company due to the fact that
Mr Tan Cheng Gay who is the substantial shareholder of the Company, has been a stalwart of the Company
since its inception.
The Board is of the opinion that there is a sufficiently strong independent element on the Board to enable
independent exercise of objective judgement on corporate affairs of the Group.
3.2 As the Chairman and CEO, he, with the assistance of the Company Secretary and Management, schedules
Board meetings as and when required and prepares the agenda for Board meetings. In addition, he sets
guidelines on and ensures quality, quantity, accurateness and timeliness of information flow between the
Board, Management and shareholders of the Company. He encourages constructive relations between
the Board and Management and between the Executive Directors and the Independent Directors. He also
takes a leading role in ensuring the Company’s drive to achieve and maintain a high standard of corporate
governance practices.
As Chairman, he is responsible for, amongst other things, exercising control over the quality, quantity and
timeliness of the flow of information between the management of the Company (the “Management”) and
the Board, and assisting in ensuring compliance with the Company’s guidelines on corporate governance.
3.3 The Board has appointed Mr Tan Soo Nan, an Independent and Non-Executive Director, as the Lead
Independent Director on 2 January 2018. Mr Tan Soo Nan will be available to address shareholders’
concerns when contact through the normal channels of the Chairman, the CEO or other management
executive has failed to provide a satisfactory resolution or when such contact is inappropriate.
3.4 Where warranted, the Lead Independent Director shall meet with the Independent Directors without the
presence of Management or the Executive Directors to review any matters that must be raised privately
before providing feedback to the Chairman of the Board.
Corporate GOVERNANCE REPORT
ENGRO CORPORATION LIMITED26

Board Membership
Principle 4: There should be a formal and transparent process for the appointment and re-appointment of directors
to the Board.
Guidelines
of the Code Corporate Governance Practices of the Company
4.1 The NC, regulated by a set of written terms of reference, comprises two Independent Non-Executive
Directors as well as an Executive Director. The Board is of the view that the inclusion of an Executive
Director in the NC would facilitate discussions at the NC meetings. The names of the members of the NC
are disclosed in Table 2.
4.2 The principal functions of the NC is to establish a formal and transparent process for:
(a) reviewing nominations of new Director appointments based on selection criteria such as incumbent’s
credentials and his skills and contributions required by the Company;
(b) reviewing and recommending to the Board the re-election of Directors in accordance with the
Company’s Articles of Association;
(c) determining annually whether a Director is “independent”, guided by the independent guidelines
contained in the Code;
(d) deciding whether a Director is able to and has adequately carried out his duties as a Director of the
Company, in particular whether the Directors concerned have multiple board representations or if
they are in conflict with the interest of the Company; and
(e) deciding how the Board’s performance may be evaluated and propose objective performance criteria.
4.3 The NC reviews annually the independent declarations made by the Company’s Independent Non-Executive
Directors based on the criterion of independence under the guidelines provided in the Code. The NC has
ascertained the independence of each Director for FY2017 in accordance with the Code’s definition of
independence and is satisfied that Mr Ronnie Teo Heng Hock, Mr Tan Soo Nan, and Mr Steven Ong Kay
Eng remain as Independent Non-Executive Directors of the Company.
The Board having reviewed the performance, character and background of each Independent Non-Executive
Director, considers Mr Ronnie Teo Heng Hock, Mr Tan Soo Nan, and Mr Steven Ong Kay Eng to be
independent by virtue of the fact that each Director does not have any existing business and/or professional
relationship whatsoever with EnGro group of companies and it’s officers who could possibly influence their
objectivity in discharging their duty as an Independent Director of the Company.
Corporate GOVERNANCE REPORT
ANNUAL REPORT 201727

4.4 Notwithstanding that some of the Directors have multiple board representations, the NC is satisfied that
sufficient time and attention are being given by the Directors to the affairs of the Company and each Director
is able to and has been adequately carrying out his duties as a Director of the Company.
The NC has decided not to fix a limit on the number of board representations of each Director as it considers
that the board representations presently held by its Directors do not impede the performance of their duties
to the Company.
4.5 No alternate Director has been appointed to the Board.
4.6 The NC is responsible for identifying and recommending new board members to the Board, after considering
the necessary and desirable competencies of the candidates which include; (i) academic and professional
qualifications; (ii) industry experience; (iii) number of other directorships; (iv) relevant experience as a Director;
and (v) ability and adequacy in carrying out required tasks.
The NC leads the process for board appointments and make recommendations to the Board. The integrated
process of appointment includes:
i. developing a framework on desired competencies and diversity on board;
ii. assessing current competencies and diversity on board;
iii. developing desired profiles of new Directors;
iv. initiating search for new Directors including external search, if necessary;
v. shortlist and interview potential Director candidates;
vi. recommending appointments and retirements to the board;
vii. election at general meeting.
4.7 Key information of each member of the Board can be found under the Directors’ Profile section of this
Annual Report.
The date of the Directors’ initial appointment and last re-election and their directorships are disclosed in
Table 3.
Corporate GOVERNANCE REPORT
ENGRO CORPORATION LIMITED28

Board Performance
Principle 5: There should be a formal annual assessment of the effectiveness of the Board as a whole and its
board committees and the contribution by each director to the effectiveness of the Board.
Guidelines
of the Code Corporate Governance Practices of the Company
5.1 The NC is responsible for assessing the effectiveness and performance of the Board. The assessment
parameters include the evaluation of the Board composition, size and expertise, timeliness of information
flow and quality of information to the Board, Board pro-activeness, Board accountability and oversight,
functioning of the Board Committees as well as standards of conduct. For FY2017, the NC reviewed the
performance of the Board based on the aforesaid parameters.
5.2 The annual evaluation exercise provides an opportunity to obtain constructive feedback from each Director
on whether the Board’s procedures and processes had allowed him to discharge his duties effectively and
to propose changes which may be made to enhance the Board effectiveness as a whole as well as the
efficiency and effectiveness of the Board Committees in assisting the Board.
5.3 The NC members were in consensus that there is no necessity to go through the formal process of
evaluating their fellow Director’s performance on an individual basis. There were no issue with fellow
members’ regularity of attendance at meetings, their objectivity, competencies, time commitment and their
readiness to contribute at meetings. Any disagreement between fellow Directors would be ironed out at
the Board meeting.
Although the Directors are not evaluated individually on a formal basis, the factors taken into consideration
with regard to the re-nomination of Directors for the current year are based on their attendances,
commitment of time and contributions made at meetings of Board and Board committees as well as general
meetings.
Access to Information
Principle 6: In order to fulfill their responsibilities, directors should be provided with complete, adequate and timely
information prior to board meetings and on an on-going basis so as to enable them to make informed decisions
to discharge their duties and responsibilities.
Guidelines
of the Code Corporate Governance practices of the Group
6.1 & 6.2 The members of the Board were provided with financial information, as well as relevant background
information and documents relating to items of business to be discussed at a Board meeting before the
scheduled meeting.
Apart from keeping the Board informed of all relevant new laws and regulations, the Company also has an
on-going orientation program for non-executive Board members to familiarise and update themselves with
the Group’s operations.
Corporate GOVERNANCE REPORT
ANNUAL REPORT 201729

6.3 Directors have separate and independent access to the Company Secretary at all times. The Company
Secretary attends all Board meetings, provides corporate secretarial support to the Board and ensures
adherence to Board procedures and relevant rules and regulations which are applicable to the Company.
The Company Secretary assists the Chairman by preparing meeting agendas, attending Board and Board
Committee meetings and preparing minutes of board proceedings. Under the direction of the Chairman,
the Company Secretary, with the support of the management staff, ensures good information flows within
the Board and the Board Committees and between Senior Management and Non-Executive Directors.
6.4 The appointment and removal of the Company Secretary is subject to the approval of the Board.
6.5 The Board (whether individually or as a group) has, in the execution of its duties, access to independent
professional advice, if necessary, at the Company’s expense.
REMUNERATION MATTERS
Procedures for Developing Remuneration Policies
Principle 7: There should be a formal and transparent procedure for developing policy on executive remuneration
and for fixing the remuneration packages of individual directors. No director should be involved in deciding his
own remuneration.
Guidelines
of the Code Corporate Governance Practices of the Company
7.1 The RC, regulated by a set of written terms of reference, comprises three Independent Non-Executive
Directors. The names of the members of the RC are disclosed in Table 2.
7.2 According to the terms of reference of the RC, the functions of the RC include, amongst others, the setting
up and implementation of formal and transparent processes by which the remuneration packages of all the
Executive Directors (in the form of service agreements) are formulated and approved. The RC has access
to outside expert advice on all remuneration matters at the Company’s expense.
No Director or member of the RC has been involved in deciding his own remuneration, except for providing
information and documents specifically requested by the RC to assist it in its deliberations.
7.3 The RC has, in the execution of its duties, access to independent professional advice inside and/or outside
the Company on remuneration matters as and when required. The remuneration matters are currently
managed by the Group’s Human Resource and no external remuneration consultant was appointed in
FY2017.
7.4 According to the service agreement of the Executive Directors:
i. the term of service shall continue until terminated by either party in accordance with the terms of
the agreement; and
ii. there are no onerous compensation commitments on the part of the Company in the event of an
early termination of the service of the Executive Directors.
Corporate GOVERNANCE REPORT
ENGRO CORPORATION LIMITED30

Level and Mix of Remuneration
Principle 8: The level and structure of remuneration should be aligned with the long-term interest and risk policies
of the company, and should be appropriate to attract, retain and motivate (a) the directors to provide good
stewardship of the company, and (b) key management personnel to successfully manage the company. However,
companies should avoid paying more than is necessary for this purpose.
Guidelines
of the Code Corporate Governance Practices of the Company
8.1 ANNUAL REMUNERATION REPORT
REMUNERATION POLICY IN RESPECT OF EXECUTIVE DIRECTORS AND OTHER KEY
MANAGEMENT PERSONNEL
The CEO’s remuneration include, among others, a fixed salary and a variable performance bonus, which
is designed to align the CEO’s interests with that of the shareholders. The other Executive Director is paid
a basic salary, overseas allowance and a variable performance bonus which is linked to his performance
and the performance of the China operations. He is also paid a Director fee for being a member of the NC.
8.2 The Company obtained shareholders’ approval in FY 2011 to implement a performance share award scheme
(called the “EnGro Corporation Limited Performance Share Award Scheme”) and an employee’s share
option scheme (called the “EnGro Corporation Limited 2011 Employees’ Share Option Scheme”), where
both schemes are administered by the RC. As at the date of this report, no award or share options have
been granted to either the CEO or the other Executive Director, both of whom are entitled to participate in
these two schemes subject to the rules and limits set out therein.
8.3 POLICY IN RESPECT OF NON – EXECUTIVE DIRECTORS’ REMUNERATION
In reviewing the recommendation for Independent Non-Executive Directors’ remuneration for FY2017, the
RC had continued to adopt a framework of base fees for serving on the Board and Board Committees, as
well as fees for chairing Board Committees and the role as Lead Independent Director. The fees take into
consideration the amount of time and effort that each Board member may be required to devote to their role.
Save for Directors’ fees, which have to be approved by the shareholders at every annual general meeting
(“AGM”), the Independent Non-Executive Directors do not receive any other forms of remuneration from
the Company.
8.4 In setting remuneration packages, the Company takes into consideration the remuneration and employment
conditions within the same industry and in comparable companies, as well as the Group’s relative
performance and the performance of the individuals. The Company has not adopted the use of contractual
provisions to reclaim incentive components of the remuneration of Executive Directors and key management
personnel as it was considered unnecessary in the Company’s current context.
Corporate GOVERNANCE REPORT
ANNUAL REPORT 201731

Disclosure on Remuneration
Principle 9: Every company should provide clear disclosure of its remuneration policies, level and mix of
remuneration, and the procedure for setting remuneration, in the company’s Annual Report. It should provide
disclosure in relation to its remuneration policies to enable investors to understand the link between remuneration
paid to directors and key management personnel, and performance.
Guidelines
of the Code Corporate Governance Practices of the Company
9.1
Also Rules
1207(12) to
1207(15) of
the SGX-ST
Listing Rules
LEVEL AND MIX OF REMUNERATION OF DIRECTORS AND KEY MANAGEMENT PERSONNEL
(WHO ARE NOT ALSO DIRECTORS OR THE CEO) FOR THE YEAR ENDED 31 DECEMBER 2017.
Although the remuneration of each Director and the top five key management personnel are not fully
disclosed, the Company discloses their remuneration in bands of S$250,000 and also discloses in aggregate
the total remuneration paid to the Directors and the top five key management personnel.
The compensation structure for the key management personnel of the Group consists of three key
components – fixed salary, bonus and other benefits.
Table 4 and Table 4A sets out the breakdown of the remuneration of the Directors and the top five key
management personnel for FY2017, respectively.
9.2 & 9.3 Regarding the Code’s recommendation to fully disclose the remuneration of Directors and the top five key
management personnel, given the highly competitive environment it is operating in and the confidentiality
attached to the remuneration matters, the Company believes that disclosing remuneration in bands of
S$250,000 and disclosing in aggregate the total remuneration paid to the Directors and the top five key
management personnel provide sufficient overview of the remuneration of Directors and the top five key
management personnel.
9.4 REMUNERATION OF EMPLOYEES WHO ARE IMMEDIATE FAMILY MEMBERS OF A DIRECTOR OR
THE CHIEF EXECUTIVE OFFICER
Save as disclosed in Table 4, there is no immediate family member (defined in the SGX-ST Listing Manual)
as the spouse, child, adopted child, step-child, brother sister and parent) of a Director or the CEO in the
employment of the Company whose annual remuneration exceeded S$50,000 during FY2017.
9.5 The Circular to Shareholders containing the details of the EnGro Corporation Limited Performance Share
Award Scheme and the EnGro Corporation Limited 2011 Employees’ Share Option Scheme are available
to shareholders upon their request.
9.6 Matters which are required to be disclosed in the annual remuneration report have been sufficiently disclosed
in this report under Principles 7, 8 and 9 and in the financial statements of the Company and the Group.
Corporate GOVERNANCE REPORT
ENGRO CORPORATION LIMITED32

ACCOUNTABILITY AND AUDIT
Accountability
Principle 10: The Board should present a balanced and understandable assessment of the company’s performance,
position and prospects.
Guidelines
of the Code Corporate Governance Practices of the Company
10.1 The Board is responsible for providing a balanced and understandable assessment of the Group’s
performance, position and prospects when presenting quarterly and other price-sensitive public reports
and reports to regulators (if required).
The Group prepares its financial statements in accordance with the Singapore Financial Reporting Standards
(“SFRS”) prescribed by the Accounting Standards Council. The Company releases its quarterly and full-year
financial results through announcements to the SGX-ST.
10.2 In its interim quarterly financial statements announcements, the Board provides a negative assurance
statement confirming to the best of its knowledge that nothing had come to the attention of the Board
which might render the financial statements false or misleading in any material aspect.
The Company has also procured undertakings from all its Directors and executive officers in compliance
with Listing Rule 720(1).
10.3 Management had provided each member of the Board with management accounts on a quarterly and
monthly basis so that they will be better informed on how the Group and Company are performing. The
CEO and the Group Financial Controller (“Group FC”) provide assurance to the Board on the integrity of
these financial statements through a written representation.
RISK MANAGEMENT AND INTERNAL CONTROLS
Principle 11: The Board is responsible for the governance of risk. The Board should ensure that Management
maintains a sound system of risk management and internal controls to safeguard shareholders’ interests and the
company’s assets, and should determine the nature and extent of the significant risks which the Board is willing
to take in achieving its strategic objectives.
Guidelines
of the Code Corporate Governance Practices of the Company
11.1 The Group’s system of internal controls is designed to manage rather than eliminate the risk of failure to
achieve business objectives. It can only provide reasonable and not absolute assurance against material
misstatement or loss. During the year, the AC, on behalf of the Board and through the assistance of internal
and external auditors, had reviewed the effectiveness of the Group’s material internal control systems,
including financial, operational, compliance and information technology controls, as well as risk management
policies and systems. The process used by the AC to monitor and review the effectiveness of the system
of internal controls and risk management includes:–
(a) discussions with management on risks identified by management;
Corporate GOVERNANCE REPORT
ANNUAL REPORT 201733

(b) the audit processes;
(c) the review of internal and external audit plans; and
(d) the review of significant issues arising from internal and external audits.
11.2 The Directors recognise that risk management is integral to the whole business of the Group. In 2013, the
Company developed the risk identification and management framework with the assistance of a reputable
consultant, following which management has been tasked with the responsibility of overseeing and regularly
reviewing the Group’s internal controls, including financial, operational, compliance and information
technology controls, as well as risk management policies and systems.
11.3 Based on the Group’s framework of management controls in place; the internal control policies and
procedures established and maintained by the Group; the work performed by the internal and external
auditors and the documentation on the Group’s key risks referred to above, reviews performed by
Management, the AC and the Board, the Board with the concurrence of AC is of the opinion that the risk
management and internal control systems within the Group, addressing the financial, operational, compliance
and information technology risks, are adequate and effective as at 31 December 2017.
Also Rule
1207(10) of
the SGX-ST
Listing Rules
For the financial year under review, the CEO and the Group FC have provided assurance to the Board that
the financial statements give a true and fair view of the Group’s business operations and finances and the
Group’s risk management and internal control systems in place are adequate and effective in addressing the
material risks in the Group in its current business environment including financial, operational, compliance
and information technology.
11.4 As the Company does not have a Risk Management Committee, the Board, AC and Management assume
the responsibility of the risk management function. Management reviews regularly the Group’s business
and operational activities to identify areas of significant risks as well as appropriate measures to control
and mitigate these risks. Management reviews all significant policies and procedures and highlights all
significant matters to the Board and the AC.
AUDIT COMMITTEE
Principle 12: The Board should establish an Audit Committee (“AC”) with written terms of reference which clearly
set out its authority and duties.
Guidelines
of the Code Corporate Governance Practices of the Company
12.1 The AC, regulated by a set of written terms of reference, comprises three members, all of whom are
Independent Non-Executive Directors. The names of the members of the AC are disclosed in Table 2.
12.2 The AC has three members namely Mr Tan Soo Nan, Mr Ronnie Teo Heng Hock and Mr Steven Ong Kay
Eng, who have accounting or related financial management expertise or experience.
12.3 The AC has full access to and full co-operation of the Management and external auditors. It also has the
full discretion to invite any Director or executive officer to attend its meetings. The AC also has the power
to conduct or authorise investigations into any matters within its terms of reference.
Corporate GOVERNANCE REPORT
ENGRO CORPORATION LIMITED34

12.4 The AC has specific written terms of reference and performed the following functions:
12.4 (i) reviews and evaluates with the external auditors on their audit plan, financial results of the Group
and any material non-compliance and internal control weaknesses reported by the external auditors;
(ii) monitors the scope and results of the external audit, its cost effectiveness, independence, objectivity
and gives its recommendations to the Board and the Company regarding the appointment,
re-appointment or removal of the external auditors;
(iii) reviews the draft quarterly and full year financial statements of the Group and the Company before
submission to the Board, including announcements relating thereto, to Shareholders and the
Singapore Exchange Securities Trading Limited (“SGX-ST”);
(iv) reviews the adequacy of (a) Internal Audit (“IA”) function’s activities to ensure that IA has adequate
resources and appropriate standing within the Company and (b) the internal audit programme and
(c) ensures co-ordination between the internal auditors, external auditors and Management; and
(v) ensures that IA meets the Standards for the Professional Practice of Internal Auditing set by The
Institute of Internal Auditors.
The AC had recommended and the Board had approved to table the re-appointment of KPMG LLP as
auditors of the Company for shareholders’ approval at the forthcoming AGM.
The AC shall continue to monitor the scope and results of the external audit, its cost effectiveness, as well
as the independence and objectivity of the external auditors and give its recommendations to the Board
and the Company regarding the appointment, re-appointment or removal of the external auditors.
KPMG LLP, the Company’s external auditors, carried out, as part of their statutory audit, a review of the
effectiveness of the Company’s internal accounting controls relevant to the audit on an annual basis. Any
material internal accounting control weaknesses noted in the course of the statutory audit were reported
by the external auditors to the AC.
12.5 Annually, the AC meets with the external auditors without the presence of management. Where warranted,
the AC shall meet with the internal auditors without the presence of management to review any matters
that must be raised.
12.6 The amount of audit and non-audit fees paid to the external auditors in FY2017 is disclosed on page 107
of the Annual Report.
The AC has reviewed the non-audit services provided by the external auditors to the Group in FY2017 and
is satisfied that such services would not impair the independence of the external auditors in their conduct
of the statutory audit.
12.7 The Group has a Whistle-Blowing Policy where employees of the Group may, in confidence, raise concerns
about possible improprieties in matters of financial reporting or other matters. The objective for such
arrangement is to ensure independent investigation of such matters and for appropriate follow-up action.
The arrangement provides for investigation to be undertaken by the Internal Auditor as the Whistleblower
Investigation Officer who reports directly to the CEO or the Chairman of the AC if the concern involves the
CEO.
Corporate GOVERNANCE REPORT
ANNUAL REPORT 201735

12.8 Summary of AC’s activities in FY2017
During the year, the AC:
(i) reviewed the financial statements of the Company before the announcement of the Company’s
quarterly and full-year results;
(ii) reviewed the key areas of Management judgement applied for adequate provisioning and disclosure,
critical accounting policies and any significant changes made that would have a material impact on
the financials;
(iii) reviewed and approved both the Group internal auditor’s and external auditor’s plans to ensure that
the plans covered sufficiently in terms of audit scope in reviewing the significant internal controls
comprise financial, operational and compliance controls of the Company;
(iv) reviewed the independence and objectivity of the internal and external auditors through discussions
with the internal and external auditors;
(v) reviewed audit and non-audit fees;
(vi) reviewed the appointment of a different auditor for its subsidiaries;
(vii) reviewed the accounting, auditing and financial reporting matters so as to ensure that an effective
system of control is maintained in the Group;
(viii) reviewed the internal audit functions and discusses accounting implications of major transactions
including significant financial reporting issues; and
(ix) reviewed interested party transactions.
Financial reporting and significant financial judgement
The role of the AC in relation to financial reporting is to monitor the integrity of the quarterly and full year
financial statements and that of any formal announcements relating to the Group’s financial performance.
For the financial year under review, the AC has considered whether accounting standards are consistently
applied across the Group and whether disclosures to the financial statements are clear and sufficient.
Corporate GOVERNANCE REPORT
ENGRO CORPORATION LIMITED36

Following discussions with the management and the external auditors, the AC has determined that the
following areas are the key audit matters of the Group’s financial statements. The table below summarised
how these key audit matters were deliberated and addressed:
Matters Considered Action
Valuation and impairment of
non-financial assets
– $113.5 million (46% of
Group’s total assets)
The AC considered the approach and methodology applied to the
valuation and impairment assessment of the non-financial assets of
the Group and discussed with external auditors on their review of
the reasonableness and relevance of the assumptions used in the
assessment.
As a result of the above processes, the AC was satisfied that the key
assumptions used in the assessments were balanced in comparison
with the Group’s historical performance against market data. The AC
therefore concurred with the management’s assessment that provision
for impairment losses for non-financial assets was not required.
Valuation of available-for-sale
financial assets
– $13.7 million (6% of
Group’s total assets)
In consideration of this matter, the AC reviewed the methodology
applied to the valuation assessment of the available-for-sale financial
assets which, comprise mainly investments in Venture Capital Funds
(VCFs). The AC also obtained understanding on the work performed
by the external auditors.
It was satisfied that the fair values of VCFs recorded are consistent
with the latest available valuation reports issued by professional fund
managers.
Valuation of trade receivables
– $38.0 million (16% of
Group’s total assets)
In assessing the recoverability of the trade receivables, the AC
considered the improvement in the trade receivables’ aging, the
historical default rate and the post year end collections. The AC has
also considered inherent risk of the industry and the findings presented
by the external auditors with reference to review of key controls over
trade receivables.
The above procedures provided the AC with the assurance on the
approach and conclusion drawn by management that the impairment
allowance of the trade receivables was adequate.
12.9 None of the AC members were previous partners or directors of the existing auditing firm within the
previous twelve months and none of the AC members hold any financial interest in the auditing firm.
Corporate GOVERNANCE REPORT
ANNUAL REPORT 201737

Internal Audit
Principle 13: The company should establish an effective internal audit function that is adequately resourced and
independent of the activities it audit.
Guidelines
of the Code Corporate Governance Practices of the Company
13.1 The internal audit function reports directly to the Audit Committee. The AC reviews and approves the annual
audit plan and resources to ensure that the internal auditors have the necessary resources to adequately
perform their duties.
13.2 to 13.5 Our in-house internal audit team reports directly to the Chairman of the AC on internal audit matters. The
AC has reviewed the adequacy of the in-house internal audit function and is satisfied that the team is
adequately resourced and has appropriate standing within the Company.
SHAREHOLDER RIGHTS AND RESPONSIBILITIES
Shareholder Rights
Principle 14: Companies should treat all shareholders fairly and equitably, and should recognize, protect and
facilitate the exercise of shareholders’ rights, and continually review and update such governance arrangements.
Guidelines
of the Code Corporate Governance Practices of the Company
14.1 The Company is committed to regular and timely communication with shareholders as part of the
organisation’s development to build systems and procedures that will enable the Group to compete
internationally. The Company strives to maintain a high standard of transparency and to promote better
investor communications. It aims to provide investors with clear, balanced and useful information, on a
timely basis, about the Group’s performance, financial position and prospects.
14.2 Management supported the Code’s principle to encourage shareholder participation. Shareholders
are encouraged to attend the AGM to ensure a high level of accountability and to stay informed of the
Company’s strategy and goals. Notice of the AGM is despatched to shareholders, together with explanatory
notes or a circular on items of special business (if necessary), at least 14 days or 21 days, as the case
may be, before the meeting. The Board welcomes questions from shareholders who have an opportunity
to raise issues either informally or formally before or at the AGM.
14.3 The Constitution of the Company allows each shareholder to appoint up to two proxies to attend and vote
at AGMs on his/her behalf.
The Company allows relevant intermediaries such as the Central Provident Fund Board or corporations
which provide nominee or custodial services to appoint more than two proxies so that shareholders who
hold shares through such bodies can attend and participate in general meetings as proxies.
Corporate GOVERNANCE REPORT
ENGRO CORPORATION LIMITED38

COMMUNICATION WITH SHAREHOLDERS
Principle 15: Companies should actively engage their shareholders and put in place an investor relations policy
to promote regular, effective and fair communication with shareholders.
Guidelines
of the Code Corporate Governance Practices of the Company
15.1 The Company provides sufficient and regular information to its shareholders on a timely and fair basis
regarding its business developments and financial performance that could have a material impact on
the price or value of its shares. The Board embraces openness and transparency in the conduct of the
Company’s affairs, whilst safeguarding its commercial interests.
15.2 The Company does not practise selective disclosure. In line with continuous obligations of the Company
pursuant to the SGX-ST Listing Manual and the Companies Act (Cap 50) of Singapore, the Board’s policy
is that all shareholders should be equally and timely informed of all major developments that will impact
the Company or the Group. Information is communicated to shareholders on a timely basis through the
Singapore Exchange Network (the “SGXNET”) and the press.
15.3 The Board welcomes the views of shareholders on matters affecting the Company, whether at shareholders’
meetings or on an ad hoc basis. At AGMs, shareholders are given the opportunity to air their views and to
ask the Directors and Management questions regarding the Group.
15.4 The Company has adopted quarterly reporting of its financial results since FY2003. Accordingly, in FY2017,
quarterly financial results of the Company were published via SGXNET.
15.5 The Company’s seeks to balance dividend return to shareholders with the need for long-term sustainable
growth whilst aiming for an efficient capital structure.
The declaration of a first and final tax-exempt (1-tier) dividend of 2.5 cents per ordinary share has been
proposed for FY2017.
Corporate GOVERNANCE REPORT
ANNUAL REPORT 201739

CONDUCT OF SHAREHOLDER MEETINGS
Principle 16: Companies should encourage greater shareholder participation at general meetings of shareholders,
and allow shareholders the opportunity to communicate their views on various matters affecting the company.
Guidelines
of the Code Corporate Governance Practices of the Company
16.1 In general meetings, shareholders are given the opportunity to communicate their views and direct questions
to Directors and Management regarding the Company. The Chairpersons of Board Committees are present
at the AGM and other general meetings of shareholders, to assist the Board in addressing shareholders’
questions. The minutes of AGM are available to shareholders upon their request.
Shareholders have the opportunity to participate effectively and to vote in the AGM either in person or by
proxy.
The Company is not implementing absentia voting methods such as voting via mail, e-mail or fax until
security, integrity and other pertinent issues are satisfactorily resolved.
16.2 Resolutions to be passed at general meetings are always separate and distinct in terms of issue and
are consistent with the Code’s recommendation that companies avoid ‘bundling’ resolutions unless the
resolutions are interdependent and linked so as to form one significant proposal.
16.3 The Chairpersons of the AC, NC and RC are also present and available to address to questions raised. In
addition, the external auditors are present at AGMs to address queries, if any, on the conduct of the audit
and the preparation and content of the Auditors’ Report.
16.4 & 16.5 To have greater transparency in the voting process, with effect from FY2013, the Company conducts the
voting of all its resolutions by poll at its AGM. The detailed voting results of each of the resolutions tabled
are announced on the same day after the meetings. The total numbers of votes cast for or against the
resolutions are also announced after the meetings via SGXNET.
Rule 1207(19)
of the SGX-ST
Listing Rules
DEALING IN SECURITIES
An internal code, which complies with Rule 1207(19) of the Listing Manual of the SGX-ST, with respect to
dealings in securities of the Company, has been issued to Directors and officers. The Company’s Directors
and officers are not allowed to deal in the Company’s shares within two weeks before the announcement
of its results for the first three quarters of the year. The Directors and officers are not allowed to deal in the
Company’s shares one month before the announcement of its full year results.
Directors and officers are not expected to deal in the Company’s securities on considerations of a short-
term nature. Directors and officers are required to observe insider trading provisions under the Securities
and Futures Act at all times even when dealing in the Company’s securities within the permitted periods.
Directors of the Company are required to report all dealings to the Company Secretary.
Corporate GOVERNANCE REPORT
ENGRO CORPORATION LIMITED40

Rule 1207(8)
of the SGX-ST
Listing Rules
MATERIAL CONTRACTS
Save as the service agreement entered with the CEO and the other Executive Director, no other material
contracts involving the interests of the CEO, Directors or controlling shareholders of the Company has been
entered into by the Company and its subsidiaries, which were either subsisting at the end of the financial
year or, if not then subsisting, entered into since the end of the previous financial year.
Rule 1207(17)
of the SGX-ST
Listing Manual
INTERESTED PERSON TRANSACTION (“IPT”)
The Company has established procedures to ensure that all transactions with interested persons are
reported on in a timely manner to the AC and that the transactions are carried out on normal commercial
terms and will not be prejudicial to the interests of the Company and its minority shareholders.
During the year under review, there have been no material interested person transactions requiring disclosure
pursuant to the SGX-ST Listing Manual. No IPT Mandate has been obtained from shareholders.
Rule 711A -
711B of the
SGX-ST Listing
Rules
SUSTAINABILITY REPORTING
As Singapore moves towards becoming a more sustainable city, we continue to play our part in promoting
sustainability. We believe that the effective management of environmental, social and governance (ESG)
risks and opportunities can help us to deliver long-term value to our stakeholders.
EnGro intends to publish our augural Sustainability Report (the “Report”), which is aligned to SGX-ST’s
Listing Rules – Sustainability Reporting Guide, by December 2018. This Report will be publicly accessible
through EnGro’s website as well as on SGXNet.
TABLE 1 – ATTENDANCE AT BOARD AND BOARD COMMITTEE MEETINGS FOR FY2017
Directors
Board of
Directors
Nominating
Committee
Audit
Committee
Remuneration
Committee
Number of Meetings
Held Attended Held Attended Held Attended Held Attended
Tan Cheng Gay 5 5 – – – – – –
Tan Yok Koon 5 4 1 0 – – – –
Ronnie Teo Heng Hock 5 5 1 1 4 4 2 2
Tan Soo Nan(1) 4 3 1 1 3 2 – –
Steven Ong Kay Eng(2) 3 3 1 1 2 2 – –
(1) Appointed on 2 May 2017(2) Appointed on 1 July 2017
Corporate GOVERNANCE REPORT
ANNUAL REPORT 201741

TABLE 2 – BOARD AND BOARD COMMITTEES
Board
Nominating
Committee
Audit
Committee
Remuneration
Committee
Non-Independent Directors
Tan Cheng Gay (executive) Chairman – – –
Tan Yok Koon (executive) Member Member – –
Independent Non-Executive Directors
Ronnie Teo Heng Hock Member Member Member Chairman
Tan Soo Nan (also Lead Independent Director) Member Member Chairman Member
Steven Ong Kay Eng Member Chairman Member Member
TABLE 3 – DATE OF DIRECTOR’S INITIAL APPOINTMENT & LAST RE-ELECTION & THEIR DIRECTORSHIPS
Name of Director Age
Date of initial
appointment
Date of last
re-election
Present directorships in
listed companies
Past (preceding
3 years)
directorships in
listed companies
Tan Cheng Gay 71 27/11/1973 28/04/2017 EnGro Corporation Limited –
Tan Yok Koon 69 17/05/1974 29/04/2016 EnGro Corporation Limited –
Ronnie Teo Heng Hock 69 05/01/2012 28/04/2017 1) EnGro Corporation Limited
2) Uni-Asia Group Limited
–
Tan Soo Nan 69 02/05/2017 N/A 1) EnGro Corporation Limited
2) Raffles Medical Group
3) SATS Limited
OSIM International
Ltd
Steven Ong Kay Eng 71 01/07/2017 N/A 1) EnGro Corporation Limited
2) Sino Land Company Limited
3) Tsim Sha Tsui Properties
Limited
4) Sino Hotels (Holdings)
Limited
–
Corporate GOVERNANCE REPORT
ENGRO CORPORATION LIMITED42

TABLE 4 – REMUNERATION OF DIRECTORS
The breakdown of the total remuneration of the Directors of the Company for the year ended 31 December 2017 is set out
below:
Name of Directors Position
Breakdown of Remuneration in Percentage (%)Actual Total
Remuneration in
Compensation
Bands of S$250,000
Directors’
Fee
%
Salary
%
Bonus
%
Other
Benefits
%
Total
%
Tan Cheng Gay ED – 73 24 3 100% 500,001 – 750,000
Tan Yok Koon ED 1 49 19 31 100% 500,001 – 750,000
Ronnie Teo Heng
HockNEID 100 – – – 100% <250,000
Ng Tat Pun(1) NEID 100 – – – 100% <250,000
Soh Kim Soon(2) NEID 100 – – – 100% <250,000
Tan Soo Nan(3) NEID 100 – – – 100% <250,000
Steven Ong Kay Eng(4) NEID 100 – – – 100% <250,000
The Aggregate Total Remuneration (S$’000) of Directors 1,586
(1) Resigned on 31 December 2017
(2) Resigned on 30 June 2017
(3) Appointed on 2 May 2017
(4) Appointed on 1 July 2017
Notes
ED: Executive Director
NEID: Non-Executive Independent Director
Corporate GOVERNANCE REPORT
ANNUAL REPORT 201743

TABLE 4A – REMUNERATION OF TOP FIVE KEY MANAGEMENT PERSONNEL (WHO ARE NOT ALSO DIRECTORS
OR THE CEO)
The breakdown of total remuneration of the top five key management personnel (who are not also Directors or the CEO) of
the Group for the year ended 31 December 2017 is set out below:
Name of
Top Five
Management
Personnel Position
Breakdown of Remuneration in
Percentage (%)Actual Total
Remuneration in
Compensation
Bands of $250,000
Salary
%
Bonus
%
Other
Benefits
%
Total
%
Ho Pol Lim
Eugene
Senior General Manager
Building Materials
73 22 5 100 250,001 – 500,000
Chen En Yi General Manager
Specialty Cement
70 27 3 100 <250,000
Wong Toon Hong Manager, Strategic
Business Unit
84 13 3 100 <250,000
Vincent Loh Manager, Knowledge
Management & Business
Development
68 26 6 100 <250,000
Len Cheng(1) Chief Financial Officer 94 0 6 100 <250,000
The Aggregate Total Remuneration (S$’000) of Top Five Key Management
Personnel 1,195
(1) Resigned on 5 December 2017
Legend:
Salary: Basic salary and Employer’s Central Provident Fund (“CPF”) contribution
Bonus: Bonus is based on the Company and individual performance and includes Employer’s CPF contribution.
Other Benefits: Transport allowance and other benefits.
Corporate GOVERNANCE REPORT
ENGRO CORPORATION LIMITED44

We are pleased to submit this annual report to the members of the Company together with the audited financial statements
for the financial year ended 31 December 2017.
In our opinion:
(a) the financial statements set out on pages 56 to 128 are drawn up so as to give a true and fair view of the financial
position of the Group and of the Company as at 31 December 2017 and the financial performance, changes in equity
and cash flows of the Group for the year ended on that date in accordance with the provisions of the Singapore
Companies Act, Chapter 50 and Singapore Financial Reporting Standards; and
(b) at the date of this statement, there are reasonable grounds to believe that the Company will be able to pay its debts
as and when they fall due.
The Board of Directors has, on the date of this statement, authorised these financial statements for issue.
Directors
The directors in office at the date of this statement are as follows:
Tan Cheng Gay Executive Chairman
Tan Yok Koon Executive Director
Ronnie Teo Heng Hock Independent and Non-Executive Director
Tan Soo Nan Lead Independent and Non-Executive Director (Appointed on 2 May 2017)
Steven Ong Kay Eng Independent and Non-Executive Director (Appointed on 1 July 2017)
Directors’ interests
According to the register kept by the Company for the purposes of Section 164 of the Companies Act, Chapter 50 (“the Act”),
particulars of interests of directors who held office at the end of the financial year (including those held by their spouses and
infant children) in shares in the Company are as follows:
Name of Director and corporation
in which interests are held
Holdings
at beginning
of the year
Holdings
at end
of the year
The Company
Ordinary shares
– direct interests held
Tan Cheng Gay 636,750 636,750
Tan Yok Koon 366,000 366,000
Soh Kim Soon* 46,500 –
* Resigned on 30 June 2017
YEAR ENDED 31 DECEMBER 2017Directors’ STATEMENT
ANNUAL REPORT 201745

Directors’ interests (Continued)
Name of Director and corporation in
which interests are held
Holdings
at beginning
of the year
Holdings
at end
of the year
The Company
Ordinary shares
– deemed interests held
Tan Cheng Gay 16,500,500 16,500,500
Tan Yok Koon 15,674,500 15,674,500
Except as disclosed in this statement, no Director who held office at the end of the financial year had interests in shares,
debentures, warrants or share options of the Company, or of related corporations, either at the beginning of the financial
year, or date of appointment if later, or at the end of the financial year.
There were no changes in any of the above mentioned interests in the Company between the end of the financial year and
21 January 2018.
Except as disclosed under the “Share options” section of this statement, neither at the end of, nor at any time during the
financial year, was the Company a party to any arrangement whose objects are, or one of whose objects is, to enable the
Directors of the Company to acquire benefits by means of the acquisition of shares in or debentures of the Company or any
other body corporate.
Share options
(I) Ssangyong Cement (Singapore) Limited 2000 Employees’ Share Option Scheme (the “ESOS 2000”)
The Ssangyong Cement (Singapore) Limited 2000 Employees’ Share Option Scheme (the “ESOS 2000”) of the Company
was approved and adopted by its members at an Extraordinary General Meeting held on 15 January 2001. The ESOS
2000 is administered by the Company’s Remuneration Committee, comprising three directors, Ronnie Teo Heng Hock
(Chairman), Tan Soo Nan and Steven Ong Kay Eng.
Other information regarding the ESOS 2000 is set out below:
(a) Options were granted on 1 December 2006 (Option 1), 8 January 2008 (Option 2) and 30 March 2009 (Option 3).
(b) The exercise prices of the options are set at $0.75 per share (Option 1), $1.17 per share (Option 2) and $0.55
per share (Option 3).
(c) The options can be exercised after 1 December 2007 (Option 1), 8 January 2009 (Option 2) and 30 March
2010 (Option 3).
(d) The options granted shall expire on 1 December 2016 (Option 1), 8 January 2018 (Option 2) and 30 March
2019 (Option 3).
Option 1 expired on 1 December 2016 while Option 3 had been fully exercised in prior year.
YEAR ENDED 31 DECEMBER 2017Directors’ STATEMENT
ENGRO CORPORATION LIMITED46

Share options (Continued)
(II) EnGro Corporation Limited 2011 Employees’ Share Option Scheme (the “ESOS 2011”)
The EnGro Corporation Limited 2011 Employees’ Share Option Scheme (the “ESOS 2011”) of the Company was
approved and adopted by its members at an Extraordinary General Meeting held on 27 April 2011. The ESOS 2011
is administered by the Company’s Remuneration Committee, comprising three directors, Ronnie Teo Heng Hock
(Chairman), Tan Soo Nan and Steven Ong Kay Eng.
Other information regarding the ESOS 2011 is set out below:
(a) Option was granted on 18 April 2012.
(b) The exercise price of the option is set at $0.79 per share.
(c) The option can be exercised after 18 April 2013.
(d) The option granted shall expire on 18 April 2022.
At the end of the financial year, details of the options granted under the ESOS 2000 and ESOS 2011 on the unissued
ordinary shares of the Company, are as follows:
Date of
grant of
options
Exercise
price per
share
Options
outstanding at
1 January
2017
Options
exercised
Options
forfeited
Options
outstanding at
31 December
2017
Number
of option
holders at
31 December
2017 Exercise period
ESOS 2000*
08/01/2008 $1.17 740,000 – – 740,000 8 09/01/2009 – 07/01/2018
ESOS 2011
18/04/2012 $0.79 205,000 (55,000) (15,000) 135,000 3 19/04/2013 – 17/04/2022
945,000 (55,000) (15,000) 875,000
* No further options will be granted under ESOS 2000.
Except as disclosed above, there were no unissued shares of the Company or its subsidiaries under options granted
by the Company or its subsidiaries as at the end of the financial year.
Since the commencement of both Schemes, no options have been granted to the controlling shareholders of the
Company or their associates and no participant under both Schemes has been granted 5% or more of the total options
available under both Schemes.
The options granted by the Company do not entitle the holders of the options, by virtue of such holding, to any rights
to participate in any share issue of any other company.
YEAR ENDED 31 DECEMBER 2017Directors’ STATEMENT
ANNUAL REPORT 201747

Audit Committee
The members of the Audit Committee at the date of this statement are:
Tan Soo Nan (Chairman)
Ronnie Teo Heng Hock
Steven Ong Kay Eng
The Audit Committee performs the functions specified in Section 201B of the Singapore Companies Act, the SGX Listing
Manual and the Code of Corporate Governance.
The Audit Committee has held four meetings since the last directors’ statement. In performing its functions, the Audit
Committee met with the Company’s external and internal auditors to discuss the scope of their work, the results of their
examination and evaluation of the Company’s internal accounting control system.
The Audit Committee also reviewed the following:
(i) effectiveness of the management of financial business risks and the reliability of management reporting;
(ii) assistance provided by the Company’s officers to the internal and external auditors;
(iii) quarterly financial information and annual financial statements of the Group and the Company prior to their submission
to the directors of the Company for adoption; and
(iv) interested person transactions (as defined in Chapter 9 of the SGX Listing Manual).
The Audit Committee has full access to management and is given the resources required for it to discharge its functions. It
has full authority and the discretion to invite any director or executive officer to attend its meetings. The Audit Committee also
recommends the appointment of the external auditors and reviews the level of audit and non-audit fees.
The Audit Committee is satisfied with the independence and objectivity of the external auditors and has recommended to
the Board of Directors that the auditors, KPMG LLP, be nominated for re-appointment as auditors at the forthcoming Annual
General Meeting of the Company.
In appointing our auditors for the Company, subsidiaries and significant associated companies, we have complied with Rules
712 and 715 of the SGX Listing Manual.
YEAR ENDED 31 DECEMBER 2017Directors’ STATEMENT
ENGRO CORPORATION LIMITED48

Auditors
The auditors, KPMG LLP, have indicated their willingness to accept re-appointment.
On behalf of the Board of Directors
Tan Cheng Gay
Director
Tan Yok Koon
Director
2 April 2018
YEAR ENDED 31 DECEMBER 2017Directors’ STATEMENT
ANNUAL REPORT 201749

MEMBERS OF THE COMPANY
ENGRO CORPORATION LIMITED
REPORT ON THE AUDIT OF THE FINANCIAL STATEMENTS
Opinion
We have audited the accompanying financial statements of EnGro Corporation Limited (“the Company”) and its subsidiaries
(“the Group”), which comprise the consolidated statement of financial position of the Group and the statement of financial
position of the Company as at 31 December 2017, the consolidated statement of profit or loss and other comprehensive
income, consolidated statement of changes in equity and consolidated statement of cash flows of the Group for the year then
ended, and notes to the financial statements, including a summary of significant accounting policies, as set out on pages
56 to 128.
In our opinion, the accompanying consolidated financial statements of the Group and the statement of financial position of
the Company are properly drawn up in accordance with the provisions of the Companies Act, Chapter 50 (“the Act”) and
Financial Reporting Standards in Singapore (“FRSs”) so as to give a true and fair view of the consolidated financial position of
the Group and the financial position of the Company as at 31 December 2017 and of the consolidated financial performance,
consolidated changes in equity and consolidated cash flows of the Group for the year ended on that date.
Basis for opinion
We conducted our audit in accordance with Singapore Standards on Auditing (“SSAs”). Our responsibilities under those
standards are further described in the “Auditors’ responsibilities for the audit of the financial statements” section of our report.
We are independent of the Group in accordance with the Accounting and Corporate Regulatory Authority Code of Professional
Conduct and Ethics for Public Accountants and Accounting Entities (“ACRA Code”) together with the ethical requirements
that are relevant to our audit of the financial statements in Singapore, and we have fulfilled our other ethical responsibilities in
accordance with these requirements and the ACRA Code. We believe that the audit evidence we have obtained is sufficient
and appropriate to provide a basis for our opinion.
Key audit matters
Key audit matters are those matters that, in our professional judgement, were of most significance in our audit of the financial
statements of the current period. These matters were addressed in the context of our audit of the financial statements as a
whole, and in forming our opinion thereon, and we do not provide a separate opinion on these matters.
Independent AUDITORS’ REPORT
ENGRO CORPORATION LIMITED50

Valuation and impairment of non-financial assets
(Refer to Note 4 to the financial statements)
The key audit matter
As at 31 December 2017, the Group’s net asset value
exceeded its market capitalisation by approximately $103.1
million. This is an indication that the Group’s non-financial
assets may be impaired. The carrying value of the Group’s
non-financial assets, which comprise mainly investments
in associates and joint ventures with a carrying amount of
$100.6 million, and property, plant and equipment (“PPE”)
with a carrying amount of $12.8 million, accounted for
approximately 46% of the Group’s total assets.
In accordance with FRS 36 Impairment of Assets, the Group
performed an assessment of the recoverable amounts of
the Group’s non-financial assets as at the reporting date for
the Group’s significant cash generating units (“CGUs”). The
recoverable amounts of these CGUs have been determined
using their values in use. Various assumptions which involve
estimates and judgements made by the Group are used in the
value in use calculations. These estimates and judgements
include revenue growth, selling price growth and the discount
rates.
How the matter was addressed in our audit
We assessed management’s identification of CGUs based
on our understanding of the Group’s businesses. For those
significant CGUs, we evaluated management’s value in use
calculations prepared based on cash flow forecasts. We
determined the appropriateness of key assumptions used,
including revenue growth, selling price growth and discount
rate, by comparing to historical sales data and market data
drawn from independent data sources.
Our findings
We found that the Group’s CGUs with impairment indicators
have been appropriately identified. The key assumptions used
in the value in use calculations were balanced in comparison
with the Group’s historical performance and against market
data.
Independent AUDITORS’ REPORT
ANNUAL REPORT 201751

Valuation of available-for-sale financial assets
(Refer to Note 25 to the financial statements)
The key audit matter
The Group has significant investments in available-for-
sale financial assets. These investments comprise mainly
investments in venture capital funds (“VCFs”).
For investments in VCFs, their fair values are derived based
on the valuation of the underlying assets prepared by the
VCF fund managers, which consist of quoted and unquoted
debt and equity securities measured at fair value. For certain
unquoted debt and equity securities, there are unobservable
inputs used in the determination of fair value.
The valuation of the unquoted securities requires the use of
expertise and judgement.
How the matter was addressed in our audit
Our audit procedures performed on the valuation of the VCFs
included, among others, checking to the latest available
valuation reports of the VCFs to ascertain the accuracy of
their fair values. The VCF valuations were performed by the
VCF fund managers, utilising valuation models which are
generally accepted by market participants, such as last round
financing price and similar recent transactions in the private
market led by a reputable valuer. In placing reliance on the
VCF valuations, we evaluated the competency and objectivity
of the VCF fund managers by reviewing their professional
credentials and corroborating the valuation inputs used to
observable market data.
Our findings
We found the fair values of VCFs recorded to be consistent
with the latest available valuation reports and after taking
into consideration all capital calls and distributions that have
occurred subsequent to the date of the valuation reports.
We also identified no concerns over the competence and
objectivity of the VCF fund managers in performing the
valuations as a basis for placing reliance.
Independent AUDITORS’ REPORT
ENGRO CORPORATION LIMITED52

Valuation of trade receivables
(Refer to Note 25 to the financial statements)
The key audit matter
The Group is exposed to credit risk relating to construction
companies based in Singapore and Malaysia. Risk exists over
the recovery of trade receivables from these companies. The
estimate of the allowance for impairment of trade receivables
requires the use of judgement on the customers’ ability to
pay.
How the matter was addressed in our audit
We evaluated the Group’s specific and collective impairment
assessment on doubtful trade receivables as at year end.
Our audit procedures performed included performing a
retrospective review to assess the reliability of management’s
estimation by comparing the amount of provisions made in
previous year against the actual subsequent utilisation of these
provisions, discussing with management on the recoverability
of trade receivables that were past due, selecting samples
of trade receivables and checking to collections subsequent
to year end and comparing the ageing profile of the trade
receivables to the payment patterns of the customers.
Our findings
We found the Group’s estimate of the allowance for
impairment of trade receivables as described in note 25 to
be balanced.
Other information
Management is responsible for the other information contained in the annual report. Other information is defined as all
information in the annual report other than the financial statements and our auditors’ report thereon.
We have obtained all other information prior to the date of this auditors’ report.
Our opinion on the financial statements does not cover the other information and we do not express any form of assurance
conclusion thereon.
In connection with our audit of the financial statements, our responsibility is to read the other information and, in doing so,
consider whether the other information is materially inconsistent with the financial statements or our knowledge obtained in the
audit or otherwise appears to be materially misstated. If, based on the work we have performed, we conclude that there is a
material misstatement of this other information, we are required to report that fact. We have nothing to report in this regard.
Responsibilities of management and directors for the financial statements
Management is responsible for the preparation of financial statements that give a true and fair view in accordance with the
provisions of the Act and FRSs, and for devising and maintaining a system of internal accounting controls sufficient to provide
a reasonable assurance that assets are safeguarded against loss from unauthorised use or disposition; and transactions are
properly authorised and that they are recorded as necessary to permit the preparation of true and fair financial statements
and to maintain accountability of assets.
Independent AUDITORS’ REPORT
ANNUAL REPORT 201753

In preparing the financial statements, management is responsible for assessing the Group’s ability to continue as a going
concern, disclosing, as applicable, matters related to going concern and using the going concern basis of accounting unless
management either intends to liquidate the Group or to cease operations, or has no realistic alternative but to do so.
The directors’ responsibilities include overseeing the Group’s financial reporting process.
Auditors’ responsibilities for the audit of the financial statements
Our objectives are to obtain reasonable assurance about whether the financial statements as a whole are free from material
misstatement, whether due to fraud or error, and to issue an auditors’ report that includes our opinion. Reasonable assurance
is a high level of assurance, but is not a guarantee that an audit conducted in accordance with SSAs will always detect a
material misstatement when it exists. Misstatements can arise from fraud or error and are considered material if, individually
or in the aggregate, they could reasonably be expected to influence the economic decisions of users taken on the basis of
these financial statements.
As part of an audit in accordance with SSAs, we exercise professional judgement and maintain professional scepticism
throughout the audit. We also:
• Identify and assess the risks of material misstatement of the financial statements, whether due to fraud or error, design
and perform audit procedures responsive to those risks, and obtain audit evidence that is sufficient and appropriate
to provide a basis for our opinion. The risk of not detecting a material misstatement resulting from fraud is higher than
for one resulting from error, as fraud may involve collusion, forgery, intentional omissions, misrepresentations, or the
override of internal controls.
• Obtain an understanding of internal controls relevant to the audit in order to design audit procedures that are
appropriate in the circumstances, but not for the purpose of expressing an opinion on the effectiveness of the Group’s
internal controls.
• Evaluate the appropriateness of accounting policies used and the reasonableness of accounting estimates and related
disclosures made by management.
• Conclude on the appropriateness of management’s use of the going concern basis of accounting and, based on
the audit evidence obtained, whether a material uncertainty exists management’s going concern assumption related
to events or conditions that may cast significant doubt on the Group’s ability to continue as a going concern. If we
conclude that a material uncertainty exists, we are required to draw attention in our auditors’ report to the related
disclosures in the financial statements or, if such disclosures are inadequate, to modify our opinion. Our conclusions
are based on the audit evidence obtained up to the date of our auditors’ report. However, future events or conditions
may cause the Group to cease to continue as a going concern.
• Evaluate the overall presentation, structure and content of the financial statements, including the disclosures, and
whether the financial statements represent the underlying transactions and events in a manner that achieves fair
presentation.
• Obtain sufficient appropriate audit evidence regarding the financial information of the entities or business activities
within the Group to express an opinion on the consolidated financial statements. We are responsible for the direction,
supervision and performance of the group audit. We remain solely responsible for our audit opinion.
Independent AUDITORS’ REPORT
ENGRO CORPORATION LIMITED54

We communicate with the directors regarding, among other matters, the planned scope and timing of the audit and significant
audit findings, including any significant deficiencies in internal controls that we identify during our audit.
We also provide the directors with a statement that we have complied with relevant ethical requirements regarding
independence, and to communicate with them all relationships and other matters that may reasonably be thought to bear on
our independence, and where applicable, related safeguards.
From the matters communicated with the directors, we determine those matters that were of most significance in the audit
of the financial statements of the current period and are therefore the key audit matters. We describe these matters in
our auditors’ report unless the law or regulations preclude public disclosure about the matter or when, in extremely rare
circumstances, we determine that a matter should not be communicated in our report because the adverse consequences
of doing so would reasonably be expected to outweigh the public interest benefits of such communication.
Report on other legal and regulatory requirements
In our opinion, the accounting and other records required by the Act to be kept by the Company and by those subsidiary
corporations incorporated in Singapore of which we are the auditors have been properly kept in accordance with the provisions
of the Act.
The engagement partner on the audit resulting in this independent auditors’ report is Low Gin Cheng, Gerald.
KPMG LLP
Public Accountants and
Chartered Accountants
Singapore
2 April 2018
Independent AUDITORS’ REPORT
ANNUAL REPORT 201755

Group Company
Note 2017 2016 2017 2016
$’000 $’000 $’000 $’000
Assets
Property, plant and equipment 4 12,824 14,250 2,336 2,760
Subsidiaries 5 – – 55,766 54,475
Intangible assets 6 512 425 154 131
Associates and joint ventures 7 100,630 101,096 60,555 60,555
Other investments 8 16,452 17,742 1,217 1,217
Other assets 9 78 97 78 97
Amounts due from associates and
joint ventures 11 – 1,037 – –
Loan to a subsidiary 12 – – – 5,059
Deferred tax assets 17 – 29 – –
Non-current assets 130,496 134,676 120,106 124,294
Other investments 8 26,110 21,717 – –
Inventories 10 12,318 10,132 3,956 5,114
Trade and other receivables 11 51,524 47,964 49,364 49,012
Loan to a subsidiary 12 – – 5,059 –
Cash and cash equivalents 13 23,869 39,393 8,878 20,363
Current assets 113,821 119,206 67,257 74,489
Total assets 244,317 253,882 187,363 198,783
Equity
Share capital 14 85,270 85,270 85,270 85,270
Reserves 14 129,971 133,938 89,118 90,112
Equity attributable to owners
of the Company 215,241 219,208 174,388 175,382
Non-controlling interests 1,169 123 – –
Total equity 216,410 219,331 174,388 175,382
Liabilities
Loans and borrowings 16 3,558 6,919 – 244
Deferred tax liabilities 17 481 756 – –
Non-current liabilities 4,039 7,675 – 244
Loans and borrowings 16 4,963 3,633 8,339 13,775
Trade and other payables 18 18,699 22,881 4,636 9,382
Current tax liabilities 206 362 – –
Current liabilities 23,868 26,876 12,975 23,157
Total liabilities 27,907 34,551 12,975 23,401
Total equity and liabilities 244,317 253,882 187,363 198,783
The accompanying notes form an integral part of these financial statements.
AS AT 31 DECEMBER 2017Statements of FINANCIAL POSITION
ENGRO CORPORATION LIMITED56

Note 2017 2016
$’000 $’000
Revenue 19 141,826 153,297
Other income 2,221 2,883
Changes in inventories of finished goods and work in progress (611) (2,507)
Raw materials (111,764) (114,659)
Depreciation of property, plant and equipment 4 (4,464) (4,358)
Amortisation of intangible assets 6 (74) (77)
Staff costs (12,909) (14,296)
Other expenses (18,606) (22,318)
Results from operating activities (4,381) (2,035)
Finance income 20 2,803 5,679
Finance costs 20 (2,898) (1,676)
Net finance (costs)/income (95) 4,003
Share of profit of associates and joint ventures, net of tax 8,633 4,884
Profit before tax 4,157 6,852
Tax expense 21 (344) (971)
Profit for the year 22 3,813 5,881
Profit attributable to:
Owners of the Company 3,636 5,768
Non-controlling interests 177 113
Profit for the year 3,813 5,881
Other comprehensive income
Items that are or may be reclassified subsequently to profit or loss:
Foreign currency translation differences (488) (2,937)
Exchange differences on monetary items forming part of net investment
in foreign operations (3,084) 941
Net change in fair value of available-for-sale financial assets reclassified
to profit or loss (15) (3,486)
Net change in fair value of available-for-sale financial assets (1,233) (1,528)
Other comprehensive income for the year, net of tax (4,820) (7,010)
Total comprehensive income for the year (1,007) (1,129)
Total comprehensive income attributable to:
Owners of the Company (1,151) (1,190)
Non-controlling interests 144 61
Total comprehensive income for the year (1,007) (1,129)
Earnings per share
Basic earnings per share (cents) 23 3.07 4.86
Diluted earnings per share (cents) 23 3.07 4.86
The accompanying notes form an integral part of these financial statements.
YEAR ENDED 31 DECEMBER 2017
Consolidated statement of profit or loss AND OTHER COMPREHENSIVE INCOME
ANNUAL REPORT 201757

Attributable to owners of the Company
Share capital
Capital reserve
Reserve for own shares
Share option reserve
Foreign currency
translation reserve
Fair value reserve
Accumulated profits* Total
Non-controlling interests
Total equity
$’000 $’000 $’000 $’000 $’000 $’000 $’000 $’000 $’000 $’000
At 1 January 2016 85,270 (21) (73) 168 3,180 9,927 125,000 223,451 62 223,513
Total comprehensive income for the year
Profit for the year – – – – – – 5,768 5,768 113 5,881Other comprehensive
incomeForeign currency
translation differences – – – – (2,885) – – (2,885) (52) (2,937)Exchange differences
on monetary items forming part of net investment in foreign operations – – – – 941 – – 941 – 941
Net change in fair value of available-for-sale financial assets reclassified to profit or loss – – – – – (3,486) – (3,486) – (3,486)
Net change in fair value of available-for-sale financial assets – – – – – (1,528) – (1,528) – (1,528)
Total other comprehensive income – – – – (1,944) (5,014) – (6,958) (52) (7,010)
Total comprehensive income for the year – – – – (1,944) (5,014) 5,768 (1,190) 61 (1,129)
Transactions with owners, recognised directly in equity
Contributions by and distributions to owners
Final one-tier dividend declared of 2.5 cents per share in respect of year ended 31 December 2015 – – – – – – (2,968) (2,968) – (2,968)
Issue of treasury shares under share option scheme – (24) 144 (14) – – – 106 – 106
Own shares acquired – – (191) – – – – (191) – (191)
Total contributions by and distributions to owners – (24) (47) (14) – – (2,968) (3,053) – (3,053)
At 31 December 2016 85,270 (45) (120) 154 1,236 4,913 127,800 219,208 123 219,331
* Included in accumulated profits is the Group’s share of statutory common reserves of its associates and joint ventures of $15,694,000 that are not distributable as cash dividends.
The accompanying notes form an integral part of these financial statements.
YEAR ENDED 31 DECEMBER 2017
Consolidated statement ofCHANGES IN EQUITY
ENGRO CORPORATION LIMITED58

Attributable to owners of the Company
Share capital
Capital reserve
Reserve for own shares
Share option reserve
Foreign currency
translation reserve
Fair value reserve
Accumulated profits* Total
Non-controlling interests
Total equity
$’000 $’000 $’000 $’000 $’000 $’000 $’000 $’000 $’000 $’000
At 1 January 2017 85,270 (45) (120) 154 1,236 4,913 127,800 219,208 123 219,331
Total comprehensive income for the year
Profit for the year – – – – – – 3,636 3,636 177 3,813Other comprehensive
incomeForeign currency
translation differences – – – – (455) – – (455) (33) (488)Exchange differences
on monetary items forming part of net investment in foreign operations – – – – (3,084) – – (3,084) – (3,084)
Net change in fair value of available-for-sale financial assets reclassified to profit or loss – – – – – (15) – (15) – (15)
Net change in fair value of available-for-sale financial assets – – – – – (1,233) – (1,233) – (1,233)
Total other comprehensive income – – – – (3,539) (1,248) – (4,787) (33) (4,820)
Total comprehensive income for the year – – – – (3,539) (1,248) 3,636 (1,151) 144 (1,007)
Transactions with owners, recognised directly in equity
Contributions by and distributions to owners
Final one-tier dividend declared of 2.5 cents per share in respect of year ended 31 December 2016 – – – – – – (2,964) (2,964) – (2,964)
Issue of treasury shares under share option scheme – 4 48 (8) – – – 44 – 44
Share options forfeited – – – (20) – – 20 – – –
Total contributions by and distributions to owners – 4 48 (28) – – (2,944) (2,920) – (2,920)
Contribution by non-controlling interest of a subsidiary – – – – – – – – 1,022 1,022
Acquisition of a non-controlling interest without a change in control – – – – – – 104 104 (120) (16)
At 31 December 2017 85,270 (41) (72) 126 (2,303) 3,665 128,596 215,241 1,169 216,410
* Included in accumulated profits is the Group’s share of statutory common reserves of its associates and joint ventures of $16,130,000 that are not distributable as cash dividends.
The accompanying notes form an integral part of these financial statements.
YEAR ENDED 31 DECEMBER 2017
Consolidated statement ofCHANGES IN EQUITY
ANNUAL REPORT 201759

Note 2017 2016$’000 $’000
Cash flows from operating activitiesProfit before tax 4,157 6,852Adjustments for:Depreciation of property, plant and equipment 4 4,464 4,358Allowance for inventory obsolescence – 64Amortisation of intangible assets 6 74 77Dividend income (326) (436)Gain on disposal of property, plant and equipment 22 (273) (230)(Reversal of)/allowance for doubtful receivables 22 (270) 688Impairment loss on other assets 9 – 75Impairment loss on available-for-sale financial assets 20 665 1,261Interest income 20 (196) (766)Interest expense 315 415Other investment income 20 (435) (220)Gain on disposal of available-for-sale financial assets 20 (680) (3,466)Net change in fair value of financial assets at fair value
through profit or loss (1,166) (745)Share of profits of associates and joint ventures, net of tax (8,633) (4,884)
(2,304) 3,043Changes in:Inventories (2,200) 3,526Trade and other receivables (4,195) (2,258)Trade and other payables (623) 1,097
Cash (used in)/generated from operations (9,322) 5,408Tax paid (792) (465)
Net cash (used in)/generated from operating activities (10,114) 4,943
Cash flows from investing activitiesAcquisition of property, plant and equipment (2,963) (2,765)Distributions from available-for-sale financial assets 1,270 835Dividends received from:– associates and joint ventures 2,790 1,960– other investments 278 384Interest received 196 183Proceeds from disposal of:– available-for-sale financial assets 680 2,634– financial assets at fair value through profit or loss 671 3,285– property, plant and equipment 523 668– other assets 40 –Purchase of available-for-sale financial assets (2,722) (1,374)Purchase of financial assets at fair value through profit or loss (988) (613)Purchase of intangible asset (18) –Purchase of other assets (20) –Investment in a joint venture – (312)Repayment of non-trade amount from a joint venture – 6,071
Net cash (used in)/from investing activities (263) 10,956
The accompanying notes form an integral part of these financial statements.
YEAR ENDED 31 DECEMBER 2017Consolidated statement of CASH FLOWS
ENGRO CORPORATION LIMITED60

The accompanying notes form an integral part of these financial statements.
Note 2017 2016
$’000 $’000
Cash flows from financing activities
Acquisition of non-controlling interest (16) –
Capital contribution from non-controlling interest
of a subsidiary 1,022 –
Refund of deposits pledged – 500
Dividends paid (2,964) (7,326)
Interest paid (315) (415)
Payment of finance lease liabilities (2,826) (3,106)
Proceeds from exercise of share options 44 106
Proceeds from trust receipts 223 1,273
Repayment of loan from a non-controlling interest
of a subsidiary – (947)
Repurchase of own shares – (191)
Loan from a non-controlling interest of a subsidiary – 569
Net cash used in financing activities (4,832) (9,537)
Net (decrease)/increase in cash and cash equivalents (15,209) 6,362
Cash and cash equivalents at 1 January 39,393 33,121
Effect of exchange rate fluctuations on cash held (315) (90)
Cash and cash equivalents at 31 December 13 23,869 39,393
Significant non-cash transaction
The following significant non-cash transactions are not included in the statement of cash flows:
2017 2016
$’000 $’000
Acquisition of property, plant and equipment under finance leases 535 1,457
YEAR ENDED 31 DECEMBER 2017Consolidated statement of CASH FLOWS
ANNUAL REPORT 201761

These notes form an integral part of the financial statements.
The financial statements were authorised for issue by the Board of Directors on 2 April 2018.
1 DOMICILE AND ACTIVITIES
EnGro Corporation Limited (“the Company”) is incorporated in the Republic of Singapore. The address of the Company’s
registered office is 29 International Business Park, #08-05/06 Acer Building Tower B, Singapore 609923.
The financial statements of the Group as at and for the year ended 31 December 2017 comprise the Company and
its subsidiaries (together referred to as “the Group” and individually as “Group entities”) and the Group’s interests in
equity-accounted investees.
The principal activities of the Group are those relating to the manufacture and sale of cement and building materials
and specialty polymers and that of an investment holding company.
2 BASIS OF PREPARATION
2.1 Statement of compliance
The financial statements have been prepared in accordance with the Singapore Financial Reporting Standards (“FRS”).
2.2 Basis of measurement
The financial statements have been prepared on the historical cost basis except as otherwise described in the notes
below.
2.3 Functional and presentation currency
These financial statements are presented in Singapore dollars, which is the Company’s functional currency. All financial
information presented in Singapore dollars has been rounded to the nearest thousand, unless otherwise stated.
2.4 Use of estimates and judgements
The preparation of the financial statements in conformity with FRSs requires management to make judgements,
estimates and assumptions that affect the application of accounting policies and the reported amounts of assets,
liabilities, income and expenses. Actual results may differ from these estimates.
Estimates and underlying assumptions are reviewed on an ongoing basis. Revisions to accounting estimates are
recognised in the period in which the estimates are revised and in any future periods affected.
Management is of the opinion that there are no critical judgements made in applying the accounting policies.
YEAR ENDED 31 DECEMBER 2017Notes to the FINANCIAL STATEMENTS
ENGRO CORPORATION LIMITED62

2 BASIS OF PREPARATION (CONTINUED)
2.4 Use of estimates and judgements (Continued)
Information about assumptions and estimation uncertainties that have a significant risk of resulting in a material
adjustment within the next financial year are included in the following notes:
• Note 4 – Impairment of property, plant and equipment
• Note 25 – Impairment of trade and other receivables
• Note 25 – Valuation of available-for-sale financial assets
Information about other estimates applied are included in the following notes:
• Note 4 – Useful economic lives of property, plant and equipment
• Note 5 – Impairment of investments in subsidiaries
• Note 10 – Allowance for inventory obsolescence
Measurement of fair values
A number of the Group’s accounting policies and disclosures require the measurement of fair values, for both financial
and non-financial assets and liabilities.
When measuring the fair value of an asset or a liability, the Group uses market observable data as far as possible.
Fair values are categorised into different levels in a fair value hierarchy based on the inputs used in the valuation
techniques as follows:
Level 1: quoted prices (unadjusted) in active markets for identical assets or liabilities.
Level 2: inputs other than quoted prices included in Level 1 that are observable for the asset or liability, either directly
(i.e. as prices) or indirectly (i.e. derived from prices).
Level 3: inputs for the asset or liability that are not based on observable market data (unobservable inputs).
If the inputs used to measure the fair value of an asset or a liability might be categorised in different levels of the fair
value hierarchy, then the fair value measurement is categorised in its entirety in the same level of the fair value hierarchy
as the lowest level input that is significant to the entire measurement (with Level 3 being the lowest).
The Group recognises transfers between levels of the fair value hierarchy as of the end of the reporting period during
which the change has occurred.
Further information about the assumptions made in measuring fair values is included in Note 25 – Financial instruments.
2.5 Changes in accounting policies
Disclosure Initiative (Amendment to FRS 7)
From 1 January 2017, as a result of the amendments to FRS 7, the Group has provided additional disclosure
(see note 16) in relation to the changes in liabilities arising from financing activities for the year ended 31 December
2017. Comparative information has not been presented.
YEAR ENDED 31 DECEMBER 2017Notes to the FINANCIAL STATEMENTS
ANNUAL REPORT 201763

3 SIGNIFICANT ACCOUNTING POLICIES
The accounting policies set out below have been applied consistently to all periods presented in these financial
statements, and have been applied consistently by Group entities.
3.1 Basis of consolidation
Business combinations
Business combinations are accounted for using the acquisition method in accordance with FRS 103 Business
Combination as at the date of acquisition, which is the date on which control is transferred to the Group.
The Group measures goodwill at the acquisition date as:
• the fair value of the consideration transferred; plus
• the recognised amount of any non-controlling interests in the acquiree; plus
• if the business combination is achieved in stages, the fair value of the pre-existing equity interest in the acquiree,
over the net recognised amount (generally fair value) of the identifiable assets acquired and liabilities assumed. Any
goodwill that arises is tested annually for impairment.
When the excess is negative, a bargain purchase gain is recognised immediately in profit or loss.
The consideration transferred does not include amounts related to the settlement of pre-existing relationships. Such
amounts are generally recognised in profit or loss.
Any contingent consideration payable is recognised at fair value at the acquisition date and included in the consideration
transferred. If the contingent consideration is classified as equity, it is not remeasured and settlement is accounted
for within equity. Otherwise, subsequent changes to the fair value of the contingent consideration are recognised in
profit or loss.
Non-controlling interests that are present ownership interests and entitle their holders to a proportionate share of the
acquiree’s net assets in the event of liquidation, are measured either at fair value or at the non-controlling interests’
proportionate share of the recognised amounts of the acquiree’s identifiable net assets, at the date of acquisition.
The measurement basis taken is elected on a transaction-by-transaction basis. All other non-controlling interests are
measured at acquisition-date fair value, unless another measurement basis is required by FRSs.
Costs related to the acquisition, other than those associated with the issue of debt or equity securities, that the Group
incurs in connection with a business combination are expensed as incurred.
Changes in the Group’s interest in a subsidiary that do not result in a loss of control are accounted for as transactions
with owners in their capacity as owners and therefore no adjustments are made to goodwill and no gain or loss is
recognised in profit or loss. Adjustments to non-controlling interests arising from transactions that do not involve the
loss of control are based on a proportionate amount of the net assets of the subsidiary.
YEAR ENDED 31 DECEMBER 2017Notes to the FINANCIAL STATEMENTS
ENGRO CORPORATION LIMITED64

3 SIGNIFICANT ACCOUNTING POLICIES (CONTINUED)
3.1 Basis of consolidation (Continued)
Subsidiaries
Subsidiaries are entities controlled by the Group. The Group controls an entity when it is exposed to, or has rights to,
variable returns from its involvement with the entity and has the ability to affect those returns through its power over
the entity. The financial statements of subsidiaries are included in the consolidated financial statements from the date
that control commences until the date that control ceases.
The accounting policies of subsidiaries have been changed when necessary to align them with the policies adopted
by the Group. Losses applicable to the non-controlling interests in subsidiaries are allocated to the non-controlling
interests even if doing so causes the non-controlling interests to have a deficit balance.
Loss of control
Upon the loss of control, the Group derecognises the assets and liabilities of the subsidiary, any non-controlling
interest(s) and the other components of equity related to the subsidiary. Any surplus or deficit arising on the loss of
control is recognised in profit or loss. If the Group retains any interest in the previous subsidiary, then such interest
is measured at fair value at the date that control is lost. Subsequently, it is accounted for as an equity-accounted
investee or as an available-for-sale financial asset depending on the level of influence retained.
Investments in associates and joint-ventures (“equity-accounted investees”)
Associates are those entities in which the Group has significant influence, but not control or joint control, over the
financial and operating policies of these entities. Significant influence is presumed to exist when the Group holds 20%
or more of the voting power of another entity. A joint venture is an arrangement in which the Group has joint control,
whereby the Group has rights to the net assets of the arrangement, rather than rights to its assets and obligations
for its liabilities.
Investments in associates and joint ventures are accounted for using the equity method. They are recognised initially
at cost, which includes transaction costs. Subsequent to initial recognition, the consolidated financial statements
include the Group’s share of the profit or loss and other comprehensive income of equity-accounted investees, after
adjustments to align the accounting policies with those of the Group, from the date that significant influence or joint
control commences until the date that significant influence or joint control ceases.
When the Group’s share of losses exceeds its interest in an equity-accounted investee, the carrying amount of the
investment, together with any long-term interests that form part thereof, is reduced to zero, and the recognition of
further losses is discontinued except to the extent that the Group has an obligation to fund the investee’s operations
or has made payments on behalf of the investee.
YEAR ENDED 31 DECEMBER 2017Notes to the FINANCIAL STATEMENTS
ANNUAL REPORT 201765

3 SIGNIFICANT ACCOUNTING POLICIES (CONTINUED)
3.1 Basis of consolidation (Continued)
Transactions eliminated on consolidation
Intra-group balances and transactions, and any unrealised income and expenses arising from intra-group transactions,
are eliminated in preparing the consolidated financial statements. Unrealised gains arising from transactions with
equity-accounted investees are eliminated against the investment to the extent of the Group’s interest in the investee.
Unrealised losses are eliminated in the same way as unrealised gains, but only to the extent that there is no evidence
of impairment.
Subsidiaries, associates and joint ventures in the separate financial statements
Investments in subsidiaries, associates and joint ventures are stated in the Company’s statement of financial position
at cost less accumulated impairment losses.
3.2 Foreign currency
Foreign currency transactions
Transactions in foreign currencies are translated to the respective functional currencies of Group entities at exchange
rates at the dates of the transactions. Monetary assets and liabilities denominated in foreign currencies at the reporting
date are translated to the functional currency at the exchange rate at that date. The foreign currency gain or loss
on monetary items is the difference between amortised cost in the functional currency at the beginning of the year,
adjusted for effective interest and payments during the year, and the amortised cost in foreign currency translated at
the exchange rate at the end of the year.
Non-monetary assets and liabilities denominated in foreign currencies that are measured at fair value are retranslated
to the functional currency at the exchange rate at the date that the fair value was determined. Non-monetary items in a
foreign currency that are measured in terms of historical cost are translated using the exchange rate at the date of the
transaction. Foreign currency differences arising on retranslation are recognised in profit or loss, except for differences
arising on the translation of available-for-sale equity instruments which are recognised in other comprehensive income
(except on impairment in which case foreign currency differences that have been recognised in other comprehensive
income are reclassified to profit or loss).
Foreign operations
The assets and liabilities of foreign operations, excluding goodwill and fair value adjustments arising on acquisition,
are translated to Singapore dollars at exchange rates at the reporting date. The income and expenses of foreign
operations are translated to Singapore dollars at exchange rates at the dates of the transactions. Goodwill and fair
value adjustments arising on the acquisition of a foreign operation on or after 1 January 2005 are treated as assets
and liabilities of the foreign operation and are translated at the exchange rates at the reporting date. For acquisitions
prior to 1 January 2005, the exchange rates at the date of acquisition were used.
YEAR ENDED 31 DECEMBER 2017Notes to the FINANCIAL STATEMENTS
ENGRO CORPORATION LIMITED66

3 SIGNIFICANT ACCOUNTING POLICIES (CONTINUED)
3.2 Foreign currency (Continued)
Foreign operations (Continued)
Foreign currency differences are recognised in other comprehensive income, and presented in the foreign currency
translation reserve in equity. However, if the operation is a non-wholly-owned subsidiary, then the relevant proportionate
share of the translation difference is allocated to non-controlling interests. When a foreign operation is disposed of such
that control, significant influence or joint control is lost, the cumulative amount in the translation reserve related to that
foreign operation is reclassified to profit or loss as part of the gain or loss on disposal. When the Group disposes of
only part of its interest in a subsidiary that includes a foreign operation while retaining control, the relevant proportion
of the cumulative amount is reattributed to non-controlling interests. When the Group disposes of only part of its
investment in an associate or joint venture that includes a foreign operation while retaining significant influence or joint
control, the relevant proportion of the cumulative amount is reclassified to profit or loss.
When the settlement of a monetary item receivable from or payable to a foreign operation is neither planned nor likely
to occur in the foreseeable future, foreign exchange gains and losses arising from such a monetary item that are
considered to form part of a net investment in a foreign operation are recognised in other comprehensive income, and
are presented in the foreign currency translation reserve in equity.
3.3 Financial instruments
Non-derivative financial assets
The Group initially recognises loans and receivables on the date that they are originated. All other financial assets
(including assets designated at fair value through profit or loss) are recognised initially on the trade date, which is the
date that the Group becomes a party to the contractual provisions of the instrument.
The Group derecognises a financial asset when the contractual rights to the cash flows from the asset expire, or it
transfers the rights to receive the contractual cash flows on the financial asset in a transaction in which substantially all
the risks and rewards of ownership of the financial asset are transferred, or it neither transfers nor retains substantially
all of the risks and rewards of ownership and does not retain control over the transferred asset. Any interest in
transferred financial assets that is created or retained by the Group is recognised as a separate asset or liability.
Financial assets and liabilities are offset and the net amount presented in the statement of financial position when,
and only when, the Group currently has a legal right to offset the amounts and intends either to settle them on a net
basis or to realise the asset and settle the liability simultaneously.
The Group classifies non-derivative financial assets into the following categories: financial assets at fair value through
profit or loss, loans and receivables and available-for-sale financial assets.
YEAR ENDED 31 DECEMBER 2017Notes to the FINANCIAL STATEMENTS
ANNUAL REPORT 201767

3 SIGNIFICANT ACCOUNTING POLICIES (CONTINUED)
3.3 Financial instruments (Continued)
Non-derivative financial assets (Continued)
Financial assets at fair value through profit or loss
A financial asset is classified at fair value through profit or loss if it is classified as held for trading or is designated as
such upon initial recognition. Financial assets are designated at fair value through profit or loss if the Group manages
such investments and makes purchase and sale decisions based on their fair value in accordance with the Group’s
investment strategy. Directly attributable transaction costs are recognised in profit or loss as incurred. Financial assets
at fair value through profit or loss are measured at fair value, and changes therein, which takes into account any
dividend income, are recognised in profit or loss.
Financial assets classified as held for trading comprise equity and debt securities actively managed by the Group.
Financial assets designated at fair value through profit or loss comprise investment funds that otherwise would have
been classified as available-for-sale.
Loans and receivables
Loans and receivables are financial assets with fixed or determinable payments that are not quoted in an active
market. Such assets are initially measured at fair value plus any directly attributable transaction costs. Subsequent
to initial recognition, loans and receivables are measured at amortised cost using the effective interest method, less
any impairment losses.
Loans and receivables comprise loan to a subsidiary, cash and cash equivalents, and trade and other receivables
(excluding prepayments).
Cash and cash equivalents
Cash and cash equivalents comprise cash balances and short-term deposits with maturities of three months or less
from the acquisition date that are subject to an insignificant risk of changes in their fair value.
Available-for-sale financial assets
Available-for-sale financial assets are non-derivative financial assets that are designated as available for sale or are not
classified in any of the above categories of financial assets. Available-for-sale financial assets are initially measured
at fair value plus any directly attributable transaction costs. Subsequent to initial recognition, they are measured at
fair value and changes therein, other than impairment losses, are recognised in other comprehensive income and
presented in the fair value reserve in equity. When an investment is derecognised, the gain or loss accumulated in
equity is reclassified to profit or loss.
Available-for-sale financial assets comprise investments in equity securities and venture capital funds.
YEAR ENDED 31 DECEMBER 2017Notes to the FINANCIAL STATEMENTS
ENGRO CORPORATION LIMITED68

3 SIGNIFICANT ACCOUNTING POLICIES (CONTINUED)
3.3 Financial instruments (Continued)
Non-derivative financial assets (Continued)
Available-for-sale financial assets (Continued)
When the fair value for unquoted securities cannot be reliably measured because the variability in the range of
reasonable fair value estimates is significant or that investment or probabilities of the various estimates within the
range cannot be reasonably assessed and used in estimating fair value, such securities are stated at cost less any
impairment losses.
Distributions of cash or quoted equity shares made by venture capital funds are recognised in the financial statements
as and when they are received. Such distributions are initially treated as return of investment and are therefore offset
against the cost of the investment. Any cash distributions received in excess of the cost of the investment are taken to
profit or loss. Distributed quoted equity shares are stated at market value and any increases or decreases in carrying
amount are included in other comprehensive income.
Non-derivative financial liabilities
Financial liabilities are recognised initially on the trade date, which is the date that the Group becomes a party to the
contractual provisions of the instrument.
The Group derecognises a financial liability when its contractual obligations are discharged, cancelled or expire.
Financial assets and liabilities are offset and the net amount presented in the statement of financial position when,
and only when, the Group currently has a legally enforceable right to offset the amounts and intends either to settle
on a net basis or to realise the asset and settle the liability simultaneously.
The Group classifies non-derivative financial liabilities into the other financial liabilities category.
Other non-derivative financial liabilities are initially measured at fair value less any directly attributable transaction costs.
Subsequent to initial recognition, these financial liabilities are measured at amortised cost using the effective interest
method. These financial liabilities comprise loans and borrowings, and trade and other payables.
Share capital
Ordinary shares
Ordinary shares are classified as equity. Incremental costs directly attributable to the issue of ordinary shares and
share options are recognised as a deduction from equity, net of any tax effects.
Repurchase, disposal and reissue of share capital (treasury shares)
When share capital recognised as equity is repurchased, the amount of the consideration paid, which includes directly
attributable costs, net of any tax effects, is recognised as a deduction from equity. Repurchased shares are classified
as treasury shares and are presented in the reserve for own share account. When treasury shares are sold or reissued
subsequently, the amount received is recognised as an increase in equity, and the resulting surplus or deficit on the
transaction is presented in non-distributable capital reserve.
YEAR ENDED 31 DECEMBER 2017Notes to the FINANCIAL STATEMENTS
ANNUAL REPORT 201769

3 SIGNIFICANT ACCOUNTING POLICIES (CONTINUED)
3.3 Financial instruments (Continued)
Derivative financial instruments
Non-trading derivatives
When a derivative financial instrument is not designated in a hedge relationship that qualifies for hedge accounting,
all changes in its fair value are recognised immediately in profit or loss.
Intra-group financial guarantees in the separate financial statements
Financial guarantees are financial instruments issued by the Company that require the issuer to make specified
payments to reimburse the holder for the loss it incurs because a specified debtor fails to meet payment when due in
accordance with the original or modified terms of a debt instrument.
Financial guarantee contracts issued by Group entities to external parties are accounted for as insurance contracts. A
provision is recognised based on the Company’s estimate of the ultimate cost of setting all claims incurred but unpaid
at the reporting date. The provision is assessed by reviewing individual claims and tested for adequacy by Company
against the amount that would be required to settle the guarantee contracts.
3.4 Property, plant and equipment
Recognition and measurement
Items of property, plant and equipment are measured at cost less accumulated depreciation and accumulated
impairment losses.
Cost includes expenditure that is directly attributable to the acquisition of the asset. The cost of self-constructed
assets includes:
• the cost of materials and direct labour;
• any other costs directly attributable to bringing the assets to a working condition for their intended use; and
• when the Group has an obligation to remove the asset or restore the site, an estimate of the costs of dismantling
and removing the items and restoring the site on which they are located.
Purchased software that is integral to the functionality of the related equipment is capitalised as part of that equipment.
When parts of an item of property, plant and equipment have different useful lives, they are accounted for as separate
items (major components) of property, plant and equipment.
The gain or loss on disposal of an item of property, plant and equipment (calculated as the difference between the net
proceeds from disposal and the carrying amount of the item) is recognised in profit or loss.
YEAR ENDED 31 DECEMBER 2017Notes to the FINANCIAL STATEMENTS
ENGRO CORPORATION LIMITED70

3 SIGNIFICANT ACCOUNTING POLICIES (CONTINUED)
3.4 Property, plant and equipment (Continued)
Subsequent costs
The cost of replacing a component of an item of property, plant and equipment is recognised in the carrying amount
of the item if it is probable that the future economic benefits embodied within the component will flow to the Group,
and its cost can be measured reliably. The carrying amount of the replaced component is derecognised. The costs of
the day-to-day servicing of property, plant and equipment are recognised in profit or loss as incurred.
Depreciation
Depreciation is based on the cost of an asset less its residual value. Significant components of individual assets are
assessed and if a component has a useful life that is different from the remainder of that asset, that component is
depreciated separately.
Depreciation is recognised as an expense in profit or loss on a straight-line basis over the estimated useful lives of
each component of an item of property, plant and equipment, unless it is included in the carrying amount of another
asset. Leased assets are depreciated over the shorter of the lease term and their useful lives unless it is reasonably
certain that the Group will obtain ownership by the end of the lease term.
Depreciation is recognised from the date that the property, plant and equipment are installed and are ready for use,
or in respect of assets under construction, from the date that the asset is ready for use.
The estimated useful economic lives for the current and comparative years are as follows:
Leasehold property – over remaining lease term of 30 years
Buildings and civil works – 3 to 20 years
Plant, machinery and equipment – 4 to 10 years
Office equipment, furniture and fittings – 5 to 10 years
Computers – 3 to 5 years
Motor vehicles and transport equipment – 5 years
Depreciation methods, useful lives and residual values are reviewed at the end of each reporting period and adjusted
if appropriate.
3.5 Intangible assets
Intangible assets acquired by the Group that have finite useful lives are measured at cost less accumulated amortisation
and accumulated impairment losses.
Subsequent expenditure
Subsequent expenditure is capitalised only when it increases the future economic benefits embodied in the specific
asset to which it relates. All other expenditure is recognised in profit or loss as incurred.
YEAR ENDED 31 DECEMBER 2017Notes to the FINANCIAL STATEMENTS
ANNUAL REPORT 201771

3 SIGNIFICANT ACCOUNTING POLICIES (CONTINUED)
3.5 Intangible assets (Continued)
Amortisation
Amortisation is calculated based on the cost of the asset, less its residual value.
Amortisation is recognised in profit or loss on a straight-line basis over the estimated useful lives of intangible assets
from the date that they are available for use. The estimated useful lives for the current and comparative years are as
follows:
Franchise rights – 10 years
Software – 8 years
Amortisation methods, useful lives and residual values are reviewed at the end of each reporting period and adjusted
if appropriate.
3.6 Leased assets
Leases in term of which the Group assumes substantially all the risks and rewards of ownership are classified as
finance leases. Upon initial recognition, the leased asset is measured at an amount equal to the lower of its fair value
and the present value of the minimum lease payments. Subsequent to initial recognition, the asset is accounted for
in accordance with the accounting policy applicable to that asset.
Other leases are operating leases and are not recognised in the Group’s statement of financial position.
3.7 Inventories
Inventories are measured at the lower of cost and net realisable value. The cost of inventories is based on the first-in
first-out principle, and includes expenditure incurred in acquiring the inventories, production or conversion costs and
other costs incurred in bringing them to their existing location and condition. In the case of manufactured inventories,
cost includes an appropriate share of production overheads based on normal operating capacity.
Net realisable value is the estimated selling price in the ordinary course of business, less the estimated costs of
completion and estimated costs necessary to make the sale.
3.8 Other trading investments
Other trading investments comprise those investments which are tradeable on exchanges. Such assets are measured
at fair value less costs to sell.
YEAR ENDED 31 DECEMBER 2017Notes to the FINANCIAL STATEMENTS
ENGRO CORPORATION LIMITED72

3 SIGNIFICANT ACCOUNTING POLICIES (CONTINUED)
3.9 Impairment
Non-derivative financial assets
A financial asset not carried at fair value through profit or loss, including an interest in equity-accounted investees, is
assessed at the end of each reporting period to determine whether there is objective evidence that it is impaired. A
financial asset is impaired if objective evidence indicates that a loss event(s) has occurred after the initial recognition
of the asset, and that the loss event(s) has an impact on the estimated future cash flows of that asset that can be
estimated reliably.
Objective evidence that financial assets (including equity securities) are impaired can include default or delinquency
by a debtor, restructuring of an amount due to the Group on terms that the Group would not consider otherwise,
indications that a debtor will enter bankruptcy or economic conditions that correlate with defaults. In addition, for an
investment in an equity security, a significant or prolonged decline in its fair value below its cost is objective evidence
of impairment. The Group considers a decline of 30% to be significant and a period of nine months to be prolonged.
Loans and receivables
The Group considers evidence of impairment for loans and receivables at both a specific asset and collective level. All
individually significant loans and receivables are assessed for specific impairment. All individually significant receivables
found not to be specifically impaired are then collectively assessed for any impairment that has been incurred but not
yet identified. Loans and receivables that are not individually significant are collectively assessed for impairment by
grouping together loans and receivables with similar risk characteristics.
In assessing collective impairment, the Group uses historical trends of the probability of default, the timing of recoveries
and the amount of loss incurred, adjusted for management’s judgement as to whether current economic and credit
conditions are such that the actual losses are likely to be greater or less than suggested by historical trends.
An impairment loss in respect of a financial asset measured at amortised cost is calculated as the difference between
its carrying amount and the present value of the estimated future cash flows, discounted at the asset’s original
effective interest rate. Losses are recognised in profit or loss and reflected in an allowance account against loans
and receivables. When the Group considers that there are no realistic prospects of recovery of the asset, the relevant
amounts are written off. If the amount of impairment loss subsequently decreases and the decrease can be related
objectively to an event occurring after the impairment was recognised, then the previously recognised impairment
loss is reversed through profit or loss.
Available-for-sale financial assets
Impairment losses on available-for-sale financial assets are recognised by reclassifying the losses accumulated in the
fair value reserve in equity to profit or loss. The cumulative loss that is reclassified from equity to profit or loss is the
difference between the acquisition cost and the current fair value, less any impairment loss recognised previously in
profit or loss. Any subsequent recovery in the fair value of an impaired available-for-sale equity security is recognised
in other comprehensive income.
YEAR ENDED 31 DECEMBER 2017Notes to the FINANCIAL STATEMENTS
ANNUAL REPORT 201773

3 SIGNIFICANT ACCOUNTING POLICIES (CONTINUED)
3.9 Impairment (Continued)
Associates and joint ventures
An impairment loss in respect of an associate or joint venture is measured by comparing the recoverable amount of the
investment with its carrying amount. An impairment loss is recognised in profit or loss. An impairment loss is reversed
if there has been a favourable change in the estimates used to determine the recoverable amount.
Non-financial assets
The carrying amounts of the Group’s non-financial assets, other than inventories and deferred tax assets, are reviewed
at each reporting date to determine whether there is any indication of impairment. If any such indication exists, then
the asset’s recoverable amount is estimated. An impairment loss is recognised if the carrying amount of an asset or
its related cash-generating unit (“CGU”) exceeds its estimated recoverable amount.
The recoverable amount of an asset or CGU is the greater of its value in use and its fair value less costs to sell. In
assessing value in use, the estimated future cash flows are discounted to their present value using a pre-tax discount
rate that reflects current market assessments of the time value of money and the risks specific to the asset or CGU.
For the purpose of impairment testing, assets that cannot be tested individually are grouped together into the smallest
group of assets that generates cash inflows from continuing use that are largely independent of the cash inflows of
other assets or CGUs.
Impairment losses are recognised in profit or loss. Impairment losses recognised in respect of CGUs are allocated to
reduce the carrying amounts of assets in the CGU (group of CGUs) on a pro rata basis.
Impairment losses recognised in prior periods are assessed at each reporting date for any indications that the loss
has decreased or no longer exists. An impairment loss is reversed if there has been a change in the estimates used to
determine the recoverable amount. An impairment loss is reversed only to the extent that the asset’s carrying amount
does not exceed the carrying amount that would have been determined, net of depreciation or amortisation, if no
impairment loss had been recognised.
3.10 Employee benefits
Defined contribution plans
A defined contribution plan is a post-employment benefit plan under which an entity pays fixed contributions into a
separate entity and will have no legal or constructive obligation to pay further amounts. Obligations for contributions
to defined contribution pension plans are recognised as an employee benefit expense in profit or loss in the periods
during which related services are rendered by employees.
YEAR ENDED 31 DECEMBER 2017Notes to the FINANCIAL STATEMENTS
ENGRO CORPORATION LIMITED74

3 SIGNIFICANT ACCOUNTING POLICIES (CONTINUED)
3.10 Employee benefits (Continued)
Short-term employee benefits
Short-term employee benefit obligations are measured on an undiscounted basis and are expensed as the related
service is provided. A liability is recognised for the amount expected to be paid under short-term cash bonus if the
Group has a present legal or constructive obligation to pay this amount as a result of past service provided by the
employee, and the obligation can be estimated reliably.
Share-based payment transactions
The grant date fair value of share-based payment awards granted to employees is recognised as an employee expense,
with a corresponding increase in equity, over the period that the employees unconditionally become entitled to the
awards. The amount recognised as an expense is adjusted to reflect the number of awards for which the related service
and non-market performance conditions are expected to be met, such that the amount ultimately recognised as an
expense is based on the number of awards that meet the related service and non-market performance conditions
at the vesting date. For share-based payment awards with non-vesting conditions, the grant date fair value of the
share-based payment is measured to reflect such conditions and there is no true-up for differences between expected
and actual outcomes.
3.11 Revenue
Sales of goods
Revenue from the sale of goods in the course of ordinary activities is measured at the fair value of the consideration
received or receivable, net of returns, trade discounts and volume rebates. Revenue is recognised when significant
risks and rewards of ownership have been transferred to the customer, recovery of the consideration is probable,
the associated costs and possible return of goods can be estimated reliably, there is no continuing management
involvement with the goods, and the amount of revenue can be measured reliably. If it is probable that discounts will
be granted and the amount can be measured reliably, then the discount is recognised as a reduction of revenue as
the sales are recognised. The timing of the transfer of risks and rewards vary depending on the individual trade terms
of the sales transactions.
3.12 Lease payments
Payments made under operating leases are recognised in profit or loss on a straight-line basis over the term of the
lease. Lease incentives received are recognised as an integral part of the total lease expense, over the term of the lease.
Minimum lease payments made under finance leases are apportioned between the finance expense and the reduction
of the outstanding liability. The finance expense is allocated to each period during the lease term so as to produce a
constant periodic rate of interest on the remaining balance of the liability.
YEAR ENDED 31 DECEMBER 2017Notes to the FINANCIAL STATEMENTS
ANNUAL REPORT 201775

3 SIGNIFICANT ACCOUNTING POLICIES (CONTINUED)
3.13 Finance income and finance costs
Finance income comprises interest income on funds invested, dividend income, gains on the disposal of available-for-sale
financial assets, fair value gains on financial assets at fair value through profit or loss and reclassifications of net gains
previously recognised in other comprehensive income. Interest income is recognised as it accrues in profit or loss,
using the effective interest method. Dividend income is recognised in profit or loss on the date that the Group’s right
to receive payment is established, which in the case of quoted securities is the ex-dividend date.
Finance costs comprise interest expense on borrowings, losses on disposal of available-for-sale financial assets, fair
value losses on financial assets at fair value through profit or loss, impairment losses recognised on financial assets
(other than trade receivables) and reclassifications of net losses previously recognised in other comprehensive income.
Borrowing costs that are not directly attributable to the acquisition, construction or production of a qualifying asset
are recognised in profit or loss using the effective interest method.
Foreign currency gains and losses on financial assets and financial liabilities are reported on a net basis as either
finance income or finance cost depending on whether foreign currency movements are in a net gain or net loss position.
3.14 Tax
Tax expense comprises current and deferred tax. Current tax and deferred tax is recognised in profit or loss except to
the extent that it relates to a business combination, or items recognised directly in equity or in other comprehensive
income.
Current tax is the expected tax payable or receivable on the taxable income or loss for the year, using tax rates enacted
or substantively enacted at the reporting date, and any adjustment to tax payable in respect of previous years. The
amount of current tax payable or receivable is the best estimate of the tax amount expected to be paid or received
that reflects uncertainty related to income taxes, if any.
Deferred tax is recognised in respect of temporary differences between the carrying amounts of assets and liabilities
for financial reporting purposes and the amounts used for taxation purposes. Deferred tax is not recognised for:
• temporary differences on the initial recognition of assets or liabilities in a transaction that is not a business
combination and that affects neither accounting nor taxable profit or loss; and
• temporary differences related to investments in subsidiaries, associates and joint ventures to the extent that
the Group is able to control the timing of the reversal of the temporary difference and it is probable that they
will not reverse in the foreseeable future.
The measurement of deferred taxes reflects the tax consequences that would follow the manner in which the Group
expects, at the reporting date, to recover or settle the carrying amount of its assets and liabilities. Deferred tax is
measured at the tax rates that are expected to be applied to temporary differences when they reverse, based on the
laws that have been enacted or substantively enacted by the reporting date.
YEAR ENDED 31 DECEMBER 2017Notes to the FINANCIAL STATEMENTS
ENGRO CORPORATION LIMITED76

3 SIGNIFICANT ACCOUNTING POLICIES (CONTINUED)
3.14 Tax (Continued)
Deferred tax assets and liabilities are offset if there is a legally enforceable right to offset current tax liabilities and
assets, and they relate to taxes levied by the same tax authority on the same taxable entity, or on different tax entities,
but they intend to settle current tax liabilities and assets on a net basis or their tax assets and liabilities will be realised
simultaneously.
A deferred tax asset is recognised for unused tax losses, tax credits and deductible temporary differences, to the
extent that it is probable that future taxable profits will be available against which they can be utilised. Deferred tax
assets are reviewed at each reporting date and are reduced to the extent that it is no longer probable that the related
tax benefit will be realised.
In determining the amount of current and deferred tax, the Group takes into account the impact of uncertain tax
positions and whether additional taxes and interest may be due. The Group believes that its accruals for tax liabilities
are adequate for all open tax years based on its assessment of many factors, including interpretations of tax law and
prior experience. This assessment relies on estimates and assumptions and may involve a series of judgements about
future events. New information may become available that causes the Group to change its judgement regarding the
adequacy of existing tax liabilities; such changes to tax liabilities will impact tax expense in the period that such a
determination is made.
3.15 Earnings per share
The Group presents basic and diluted earnings per share data for its ordinary shares. Basic earnings per share is
calculated by dividing the profit or loss attributable to ordinary shareholders of the Company by the weighted average
number of ordinary shares outstanding during the year, adjusted for own shares held. Diluted earnings per share is
determined by adjusting the profit or loss attributable to ordinary shareholders and the weighted average number of
ordinary shares outstanding, adjusted for own shares held, for the effects of all dilutive potential ordinary shares, which
comprise share options granted to employees.
3.16 Segment reporting
An operating segment is a component of the Group that engages in business activities from which it may earn revenues
and incur expenses, including revenues and expenses that relate to transactions with any of the Group’s other
components. All operating segments’ operating results are reviewed regularly by the Group’s CEO (the chief operating
decision maker) to make decisions about resources to be allocated to the segment and assess its performance, and
for which discrete financial information is available.
Segment results that are reported to the Group’s CEO include items directly attributable to a segment as well as those
that can be allocated on a reasonable basis. Unallocated items comprise interest-earning fixed deposits and the related
interest income, interest-bearing loans and the related interest expense, headquarter expense, support expenses of
associates and joint ventures, and tax assets and liabilities.
Segment capital expenditure is the total cost incurred during the year to acquire property, plant and equipment, and
intangible assets.
YEAR ENDED 31 DECEMBER 2017Notes to the FINANCIAL STATEMENTS
ANNUAL REPORT 201777

3 SIGNIFICANT ACCOUNTING POLICIES (CONTINUED)
3.17 Full convergence with International Financial Reporting Standards (“IFRS”) and adoption of new standards
Applicable to 2018 financial statements
In December 2017, the Accounting Standards Council (“ASC”) issued the Singapore Financial Reporting Standards
(International) (“SFRS(I)”). SFRS(I) comprises standards and interpretations that are equivalent to the International
Financial Reporting Standards (“IFRS”) as issued by the International Accounting Standards Board (“IASB”) at
31 December 2017 that are applicable for annual periods beginning on 1 January 2018. Singapore-incorporated
companies that have issued, or are in the process of issuing, equity or debt instruments for trading in a public market
in Singapore, will apply SFRS(I) with effect from annual periods beginning on or after 1 January 2018.
The Group’s financial statements for the financial year ending 31 December 2018 will be prepared in accordance with
SFRS(I). As a result, this will be the last set of financial statements prepared under the current FRS.
In adopting the new framework, the Group will be required to apply the specific transition requirements in SFRS(I) 1
First-time Adoption of Singapore Financial Reporting Standards (International).
In addition to the adoption of the new framework, the Group will also concurrently apply the following SFRS(I)s,
interpretations of SFRS(I)s and requirements of SFRS(I)s which are mandatorily effective from the same date.
• SFRS(I) 15 Revenue from Contracts with Customers which includes the clarifications to IFRS 15 Revenue from
Contracts with Customers issued by the IASB in April 2016;
• SFRS(I) 9 Financial Instruments which includes the amendments to IFRS 4 Insurance Contracts – Applying
IFRS 9 Financial Instruments with IFRS 4 Insurance Contracts issued by the IASB in September 2016;
• requirements in SFRS(I) 2 Share-based Payment arising from the amendments to IFRS 2 – Classification and
Measurement of Share-based Payment Transactions issued by the IASB in June 2016;
• requirements in SFRS(I) 1-40 Investment Property arising from the amendments to IAS 40 – Transfers of
Investment Property issued by the IASB in December 2016;
• requirements in SFRS(I) 1 arising from the amendments to IFRS 1 – Deletion of short-term exemptions for
first-time adopters issued by the IASB in December 2016;
• requirements in SFRS(I) 1-28 Investments in Associates and Joint Ventures arising from the amendments to
IAS 28 – Measuring an associate or joint venture at fair value issued by the IASB in December 2016; and
• SFRS(I) INT 22 Foreign Currency Transactions and Advance Consideration.
The Group does not expect the application of the above standards and interpretations to impact on the financial
statements, except for SFRS(I) 1 and SFRS(I) 9, as described below.
YEAR ENDED 31 DECEMBER 2017Notes to the FINANCIAL STATEMENTS
ENGRO CORPORATION LIMITED78

3 SIGNIFICANT ACCOUNTING POLICIES (CONTINUED)
3.17 Full convergence with International Financial Reporting Standards (“IFRS”) and adoption of new standards
(Continued)
SFRS(I) 1
When the Group adopts SFRS(I) in 2018, the Group will apply SFRS(I) 1 with 1 January 2017 as the date of transition
for the Group and the Company. SFRS(I) 1 generally requires that the Group applies SFRS(I) on a retrospective basis,
as if such accounting policy had always been applied. If there are changes to accounting policies arising from new or
amended standards effective in 2018, restatement of comparatives may be required because SFRS(I) 1 requires both
the opening balance sheet and comparative information to be prepared using the most current accounting policies.
SFRS(I) 1 provides mandatory exceptions and optional exemptions from retrospective application, but these are often
different from those specific transition provisions in individual FRSs applied to the FRS financial statements. Except as
described below, the Group does not expect the application of the mandatory exceptions and the optional exemptions
in SFRS(I) 1 to have any significant impact on the financial statements.
Foreign currency translation reserve (“FCTR”)
The Group considers that restating FCTR to comply with SFRS(I) 1-21 The Effects of Changes in Foreign Exchange
Rates may not be practicable as certain acquisitions and disposals were transacted at dates that preceded the statutory
record keeping periods.
The Group plans to elect the optional exemption in SFRS(I) 1 to reset its cumulative FCTR for all foreign operations
to nil at the date of transition, and reclassify the cumulative FCTR of $1,236,000 as at 1 January 2017 determined in
accordance with FRS at that date to accumulated profits. After the date of transition, any gain or loss on disposal of
any foreign operations will exclude translation differences that arose before the date of transition.
The Group expects the cumulative FCTR to decrease by $1,236,000 and accumulated profits to increase by the same
amount as at 31 December 2017 as a result of the reclassification.
SFRS(I) 15
SFRS(I) 15 establishes a comprehensive framework for determining whether, how much and when revenue is
recognised. It also introduces new cost guidance which requires certain costs of obtaining and fulfilling contracts to
be recognised as separate assets when specified criteria are met.
The Group plans to adopt SFRS(I) 15 in its financial statements for the year ending 31 December 2018. The Group
does not expect any significant adjustments arising from the application of SFRS(I) 15.
YEAR ENDED 31 DECEMBER 2017Notes to the FINANCIAL STATEMENTS
ANNUAL REPORT 201779

3 SIGNIFICANT ACCOUNTING POLICIES (CONTINUED)
3.17 Full convergence with International Financial Reporting Standards (“IFRS”) and adoption of new standards
(Continued)
SFRS(I) 9
SFRS(I) 9 contains new requirements for classification and measurement of financial instruments, a new expected
credit loss model for calculating impairment of financial assets, and new general hedge accounting requirements.
The Group plans to take advantage of the exemption in SFRS(I) 1 allowing it not to restate comparative information in
the 2018 SFRS(I) financial statements. Differences in the carrying amounts of financial assets and financial liabilities
resulting from the adoption of SFRS(I) 9 are recognised in accumulated profits and reserves as at 1 January 2018.
The following assessments have to be made on the basis of facts and circumstances that existed at 1 January 2018.
– The determination of the business model within which a financial asset is held.
– The determination of whether the contractual terms of a financial asset give rise to cash flows that are solely
payments of principal and interest on the principal amount outstanding.
– The designation of an investment in equity instruments that is not held for trading as at fair value through other
comprehensive income (“FVOCI”).
– The designation and revocation of previous designations of certain financial assets and financial liabilities
measured at fair value through profit or loss (“FVTPL”).
If an investment in a debt instrument has low credit risk at 1 January 2018, the Group plans to assume that the credit
risk on the asset has not increased significantly since its initial recognition.
New hedge accounting requirements are applied prospectively. All hedging relationships designated under FRS 39
Financial Instruments: Recognition and Measurement at 31 December 2017 that meet the criteria for hedge accounting
under SFRS(I) 9 at 1 January 2018 will be regarded as continuing hedging relationships.
Classification and measurement: financial assets
For financial assets currently measured at fair value, the Group intends to continue measuring these assets at fair value
under SFRS(I) 9. Available-for-sale (“AFS”) financial assets are expected to be reclassified as financial assets measured
at FVTPL as the default classification. For investments that are currently classified as financial assets designated at
FVTPL, the Group expects to classify these assets as financial assets measured at FVTPL.
On adoption of the standard at 1 January 2018, the Group expects fair value reserve to decrease by $3,665,000 and
accumulated profits to increase by $3,665,000.
YEAR ENDED 31 DECEMBER 2017Notes to the FINANCIAL STATEMENTS
ENGRO CORPORATION LIMITED80

3 SIGNIFICANT ACCOUNTING POLICIES (CONTINUED)
3.17 Full convergence with International Financial Reporting Standards (“IFRS”) and adoption of new standards
(Continued)
SFRS(I) 9 (Continued)
Impairment
SFRS(I) 9 replaces the current “incurred loss” model with a forward-looking expected credit loss (“ECL”) model. The
new impairment model will apply to financial assets measured at amortised cost or FVOCI, except for investments in
equity instruments.
Under SFRS(I) 9, loss allowances of the Group will be measured on either of the following bases:
• 12-month ECLs: These are ECLs that result from possible default events within the 12 months after the reporting
date; or
• lifetime ECLs: These are ECLs that result from all possible default events over the expected life of a financial
instrument.
The Group plans to apply the simplified approach and record lifetime ECL on all trade receivables. The Group expects
an increase in impairment for trade receivables of $436,000 as at 1 January 2018.
The Group is currently finalising the testing of its expected credit loss model and the quantum of the final transition
adjustments may be different upon finalisation.
Applicable to financial statements for the year 2019 and thereafter
The following new SFRS(I), amendments to and interpretations of SFRS(I) are effective for annual periods beginning
after 1 January 2018:
Applicable to 2019 financial statements
• SFRS(I) 16 Leases
• SFRS(I) INT 23 Uncertainty over Income Tax Treatments
• Long-term Interests in Associates and Joint Ventures (Amendments to SFRS(I) 1-28)
• Prepayment Features with Negative Compensation (Amendments to SFRS(I) 9)
Mandatory effective date deferred
• Sale or Contribution of Assets between an Investor and its Associate or Joint Venture (Amendments to
SFRS(I) 10 and SFRS(I) 1-28).
The Group is still in the process of assessing the impact of the new SFRS(I)s, amendments to and interpretations of
SFRS(I)s on the financial statements. The Group’s preliminary assessment of SFRS(I) 16, which is expected to impact
the Group, is described below.
YEAR ENDED 31 DECEMBER 2017Notes to the FINANCIAL STATEMENTS
ANNUAL REPORT 201781

3 SIGNIFICANT ACCOUNTING POLICIES (CONTINUED)
3.17 Full convergence with International Financial Reporting Standards (“IFRS”) and adoption of new standards
(Continued)
SFRS(I) 16
SFRS(I) 16 replaces existing lease accounting guidance. SFRS(I) 16 is effective for annual periods beginning on or
after 1 January 2019, with early adoption permitted if SFRS(I) 15 is also applied. SFRS(I) 16 eliminates the lessee’s
classification of leases as either operating leases or finance leases and introduces a single lessee accounting model.
Applying the new model, a lessee is required to recognise right-of-use (“ROU”) assets and lease liabilities for all leases
with a term of more than 12 months, unless the underlying asset is of low value.
The Group plans to adopt the standard when it becomes effective in 2019 and expects to apply the standard using
the modified retrospective approach. The Group also expects the ROU assets recognised at date of initial application
to be equal to their lease liabilities.
The Group is likely to elect the practical expedient not to reassess whether a contract contains a lease at the date
of initial application, 1 January 2019. Accordingly, existing lease contracts that are still effective on 1 January 2019
continue to be accounted for as lease contracts under SFRS(I) 16. The Group is currently assessing the impact of
adopting SFRS(I) 16 on its financial statements based on its existing operating lease arrangements.
Until 2018, the approximate financial impact of the standard is unknown due to factors that impact calculation of lease
liabilities such as discount rate, expected term of leases including renewal options and exemptions for short-term
leases. The Group will continue to assess its portfolio of leases to calculate the impending impact of transition to the
new standard.
The Group as lessee
The Group expects its existing operating lease arrangements to be recognised as ROU assets with corresponding lease
liabilities under SFRS(I) 16. The operating lease commitments on an undiscounted basis amount to approximately 5%
of the consolidated total assets of $244,317,000 and 46% of consolidated total liabilities of $27,907,000. Under the
new standard, remaining lease payments of the operating leases will be recognised at their present value discounted
using appropriate discount rates. In addition, the nature of expenses related to those leases will now change as SFRS(I)
16 replaces the straight-line operating lease expense with depreciation charge of ROU assets and interest expense
on lease liabilities.
YEAR ENDED 31 DECEMBER 2017Notes to the FINANCIAL STATEMENTS
ENGRO CORPORATION LIMITED82

4 PROPERTY, PLANT AND EQUIPMENT
NoteLeasehold property
Buildings and civil works
Plant, machinery
and equipment
Office equipment,
furniture and fittings Computers
Motor vehicles and
transport equipment
Assets under
construction Total$’000 $’000 $’000 $’000 $’000 $’000 $’000 $’000
Group
Cost
At 1 January 2016 419 23,047 24,089 1,387 634 15,768 243 65,587
Additions – 251 738 19 6 2,340 868 4,222
Reclassification – 202 37 – – – (239) –
Reclassification to intangible assets 6 – – – – – – (174) (174)
Disposals/write-offs – (728) (566) (223) – (2,055) – (3,572)
Effect of movements in exchange rates (18) (57) (102) (32) – (133) (16) (358)
At 31 December 2016 401 22,715 24,196 1,151 640 15,920 682 65,705
Additions – 874 753 118 20 770 963 3,498
Reclassification – 1,047 463 – – – (1,510) –
Reclassification to intangible assets 6 – – – – – – (144) (144)
Disposals/write-offs – (3,458) (6,217) (175) (423) (388) – (10,661)
Effect of movements in exchange rates (5) 19 66 (8) – 92 15 179
At 31 December 2017 396 21,197 19,261 1,086 237 16,394 6 58,577
Accumulated depreciation
At 1 January 2016 196 22,051 20,206 963 578 6,394 – 50,388
Depreciation for the year 18 436 817 189 23 2,875 – 4,358
Disposals/write-offs – (651) (564) (117) – (1,803) – (3,135)
Effect of movements in exchange rates (9) (41) (50) (11) – (45) – (156)
At 31 December 2016 205 21,795 20,409 1,024 601 7,421 – 51,455
Depreciation for the year 18 734 921 137 18 2,636 – 4,464
Disposals/write-offs – (3,334) (6,217) (174) (423) (92) – (10,240)
Effect of movements in exchange rates (2) 9 20 (3) – 50 – 74
At 31 December 2017 221 19,204 15,133 984 196 10,015 – 45,753
Carrying amounts
At 1 January 2016 223 996 3,883 424 56 9,374 243 15,199
At 31 December 2016 196 920 3,787 127 39 8,499 682 14,250
At 31 December 2017 175 1,993 4,128 102 41 6,379 6 12,824
During the year, the Group acquired property, plant and equipment with an aggregate cost of $3,498,000
(2016: $4,222,000), of which $535,000 (2016: $1,457,000) were acquired under finance leases.
YEAR ENDED 31 DECEMBER 2017Notes to the FINANCIAL STATEMENTS
ANNUAL REPORT 201783

4 PROPERTY, PLANT AND EQUIPMENT (CONTINUED)
Note
Buildings and civil works
Plant, machinery
and equipment
Office equipment,
furniture and fittings Computers
Motor vehicles and
transport equipment
Assets under
construction Total$’000 $’000 $’000 $’000 $’000 $’000 $’000
Company
Cost
At 1 January 2016 17,211 14,731 843 170 1,288 219 34,462
Additions – 89 4 6 471 – 570
Reclassifications – 37 – – – (37) –
Reclassification to intangible assets 6 – – – – – (174) (174)
Disposals/write-offs – (204) (14) – (92) – (310)
At 31 December 2016 17,211 14,653 833 176 1,667 8 34,548
Additions – 57 48 8 89 37 239
Reclassification to intangible assets 6 – – – – – (43) (43)
Disposals/write-offs – – – – (44) – (44)
At 31 December 2017 17,211 14,710 881 184 1,712 2 34,700
Accumulated depreciation
At 1 January 2016 17,211 13,112 577 142 472 – 31,514
Depreciation for the year – 266 37 17 264 – 584
Disposals/write-offs – (204) (14) – (92) – (310)
At 31 December 2016 17,211 13,174 600 159 644 – 31,788
Depreciation for the year – 265 37 13 305 – 620
Disposals/write-offs – – – – (44) – (44)
At 31 December 2017 17,211 13,439 637 172 905 – 32,364
Carrying amounts
At 1 January 2016 – 1,619 266 28 816 219 2,948
At 31 December 2016 – 1,479 233 17 1,023 8 2,760
At 31 December 2017 – 1,271 244 12 807 2 2,336
YEAR ENDED 31 DECEMBER 2017Notes to the FINANCIAL STATEMENTS
ENGRO CORPORATION LIMITED84

4 PROPERTY, PLANT AND EQUIPMENT (CONTINUED)
At 31 December, the net carrying amount of property, plant and equipment, and motor vehicles acquired under finance
leases is as follows:
Group Company
2017 2016 2017 2016
$’000 $’000 $’000 $’000
Plant, machinery and equipment 1,749 1,766 – –
Motor vehicles 4,668 7,257 387 570
Impairment assessment
The Group reviews the carrying amounts of property, plant and equipment as at each reporting date to determine
whether there is any indication of impairment. If any such indication exists, the assets’ recoverable amounts are
estimated. The recoverable amounts are determined based on the future cash flows expected to be generated from
the continued use of the assets, which requires the use of estimates and assumptions. Based on management’s
assessment, there were no impairment loss to be recognised at the reporting date.
Source of estimation uncertainty
Property, plant and equipment are depreciated on a straight-line basis over its useful economic lives. Management
estimates the useful economic lives of property, plant and equipment to be between 3 to 30 years. The Group reviews
annually the estimated useful economic lives of property, plant and equipment based on factors that include asset
utilisation, internal technical evaluation, technological changes and anticipated use of the assets. It is possible that
future results of operations could be materially affected by changes in these estimates brought about by changes in
factors mentioned. A reduction in the estimated useful economic lives of property, plant and equipment would increase
depreciation expense and decrease non-current assets.
5 SUBSIDIARIES
Company
2017 2016
$’000 $’000
Equity investments at cost 61,817 56,802
Accumulated impairment losses (45,201) (45,201)
16,616 11,601
Loans to subsidiaries 56,394 60,118
Accumulated impairment losses (17,244) (17,244)
39,150 42,874
55,766 54,475
The loans to subsidiaries are non-trade in nature, unsecured and interest-free. The settlement of the loans are neither
planned nor likely to occur in the foreseeable future. As the loans are, in substance, a part of the Company’s net
investment in subsidiaries, they are classified as non-current and stated at cost less accumulated impairment losses.
YEAR ENDED 31 DECEMBER 2017Notes to the FINANCIAL STATEMENTS
ANNUAL REPORT 201785

5 SUBSIDIARIES (CONTINUED)
Details of the subsidiaries are as follows:
Name of subsidiaries Principal activitiesCountry of
incorporation
Effective equity held
by the Group2017 2016
% %
Held by the Company
CemtecAsia (H.K.) Limited(3) Inactive Hong Kong 100 100
CemtecAsia (M) Sdn Bhd(2) Trading of construction chemicals and building materials
Malaysia 100 100
Pacific Climate Solutions Pte. Ltd. Carbon consultancy services Singapore 100 100
EnGro Global Resources Pte. Ltd. Investment holding Singapore 100 100
S3 Technologies Pte Ltd Investment holding Singapore 100 100
Sancem Investment Pte Ltd Investment trading Singapore 100 100
Shanghai S3 Building Materials Co Ltd(2)
Manufacture and sale of construction and building materials
People’s Republic of
China
100 100
SsangYong Cement (S) Pte. Ltd. Investment holding Singapore 100 100
e-Invest Limited(1) Investment holding Hong Kong 100 100
Juniper Capital Ventures (Pte) Ltd Investment holding Singapore 100 100
SsangYong Cement Investment (S) Pte. Ltd.
Investment holding Singapore 100 100
SsangYong Cement Singapore (China) Pte Ltd
Investment holding Singapore 100 100
SsangYong LTI (Pte) Ltd Investment holding Singapore 100 100
EnGro (Asia) Private Limited Investment holding Singapore 80 80
Shanghai VCEM Commercial Co Ltd(3) Trading, wholesale and distribution of building materials
People’s Republic of
China
100 100
YEAR ENDED 31 DECEMBER 2017Notes to the FINANCIAL STATEMENTS
ENGRO CORPORATION LIMITED86

5 SUBSIDIARIES (CONTINUED)
Name of subsidiaries Principal activitiesCountry of
incorporation
Effective equity held
by the Group2017 2016
% %
Held by subsidiaries
EnGro Chemicals Pte. Ltd.(4) Inactive Singapore 100 100
MPT Pacific Technology Sdn Bhd(4) Inactive Malaysia 100 100
Top-Mix Concrete Pte Ltd Manufacture and sale of concrete and other building materials
Singapore 100 100
Top Mix Concrete (Malaysia) Sdn Bhd(1) Manufacture and sale of concrete and other building materials
Malaysia 100 100
Pelopor Niaga Sdn Bhd(2) Inactive Malaysia 100 100
Tianjin Ang De Food & Beverages Management Co., Ltd(2)
Operation of food and beverage outlets
People’s Republic of
China
100 100
Wuhan VCEM Technology Development Company Limited(3)
Trading, wholesale and distribution of building materials
People’s Republic of
China
100 –
Burkill (Singapore) Pte. Ltd.(4) Inactive Singapore 100 98.57
Resin & Pigment Technologies Sdn Bhd(4)
Inactive Malaysia 100 98.57
Resin & Pigment Technologies (Wuxi) Co Ltd(4)
Inactive People’s Republic of
China
100 98.57
R&P Technologies Pte. Ltd.(2) Manufacture of thermosetting synthetic resin and plastic materials
Singapore 60 –
Jointly held by the Company and a subsidiary
R&P (Pte.) Ltd. Manufacture of thermosetting synthetic resin and plastic materials
Singapore 100 98.57
KPMG LLP is the auditor of all subsidiaries, except for the following:(1) Member firms of KPMG International in the respective country of incorporation.(2) Audited by other certified public accountants in the respective country of incorporation.(3) Inactive company and thus not required to be audited by laws of country of incorporation.(4) In the process of striking off as at 31 December 2017.
Source of estimation uncertainty
The Company maintains impairment losses at a level considered adequate to provide for potential non-recoverability
of the investments in subsidiaries. The level of allowance is evaluated by the Company on the basis of factors that
affect the recoverability of the investments in subsidiaries. These factors include, but are not limited to, the activities
and financial position of the entities and market factors. The Company reviews and identifies balances that are to
be impaired on a continuous basis. The amount and timing of recorded expenses for any period would differ if the
Company made different judgements or utilised different estimates. An increase in the Company’s impairment losses
would increase the Company’s recorded other expenses and decrease the carrying value of interests in subsidiaries.
YEAR ENDED 31 DECEMBER 2017Notes to the FINANCIAL STATEMENTS
ANNUAL REPORT 201787

6 INTANGIBLE ASSETS
Note SoftwareFranchise
rights Total$’000 $’000 $’000
GroupCostAt 1 January 2016 – 333 333Reclassification from property, plant and equipment 4 174 – 174
At 31 December 2016 174 333 507Additions 17 – 17Reclassification from property, plant and equipment 4 144 – 144
At 31 December 2017 335 333 668
Accumulated amortisationAt 1 January 2016 – 5 5Amortisation for the year 43 34 77
At 31 December 2016 43 39 82Amortisation for the year 39 35 74
At 31 December 2017 82 74 156
Carrying amountsAt 1 January 2016 – 328 328
At 31 December 2016 131 294 425
At 31 December 2017 253 259 512
Note Software$’000
CompanyCostAt 1 January 2016 –Reclassification from property, plant and equipment 4 174
At 31 December 2016 174Additions 6Reclassification from property, plant and equipment 4 43
At 31 December 2017 223
Accumulated amortisationAt 1 January 2016 –Amortisation for the year 43
At 31 December 2016 43Amortisation for the year 26
At 31 December 2017 69
Carrying amountsAt 1 January 2016 –
At 31 December 2016 131
At 31 December 2017 154
YEAR ENDED 31 DECEMBER 2017Notes to the FINANCIAL STATEMENTS
ENGRO CORPORATION LIMITED88

7 ASSOCIATES AND JOINT VENTURES
Group Company2017 2016 2017 2016$’000 $’000 $’000 $’000
AssociatesEquity investments at cost 2,436 2,436 320 320Loan to an associate 15,213 15,213 15,213 15,213Share of reserves* 1,288 4,698 – –
18,937 22,347 15,533 15,533
Joint venturesEquity investments at cost 57,629 57,629 45,022 45,022Share of reserves* 24,064 21,120 – –
81,693 78,749 45,022 45,022
100,630 101,096 60,555 60,555
* Included in share of reserves is the Group’s share of statutory common reserves of its associates and joint ventures of $16,130,000 (2016: $15,694,000) that are not distributable as cash dividends.
The loan to an associate is non-trade in nature, unsecured and interest-free. The settlement of the amount is neither
planned nor likely to occur in the foreseeable future. As the loan is in substance, a part of the Group’s net investment
in the associate, it is classified as non-current and stated at cost less accumulated impairment losses.
Details of the associates and joint ventures are as follows:
Name of associates Principal activitiesCountry of
incorporation
Effective equity held by the
Group2017 2016
% %
Held by the Company
HBS Investments Pte Ltd(1) Investment holding Singapore 30 30
HB Investments (China) Pte. Ltd.(1) Investment holding Singapore 20 20
Held by subsidiaries
Changshu Changlong Concrete Co Ltd(4)
Manufacture and sale of building materials
People’s Republic of China
40 40
Changshu Changxin Ready Mix Concrete Co Ltd(4)
Manufacture and sale of building materials
People’s Republic of China
40 40
YEAR ENDED 31 DECEMBER 2017Notes to the FINANCIAL STATEMENTS
ANNUAL REPORT 201789

7 ASSOCIATES AND JOINT VENTURES (CONTINUED)
Name of joint ventures Principal activitiesCountry of
incorporation
Effective equity held by the
Group2017 2016
% %
Held by the Company
Jiangsu Huailong Materials Co Ltd(2), (4)
Manufacture and sale of specialty cement
People’s Republic of China
40 40
Jinan Luxin Materials Co Ltd(2), (4) Manufacture and sale of specialty cement
People’s Republic of China
40 40
Tangshan Tanglong Materials Co Ltd(4)
Manufacture and sale of specialty cement
People’s Republic of China
40 40
Tangshan TangAng Materials Co Ltd(4)
Manufacture and sale of specialty cement
People’s Republic of China
40 40
Wuhan Wuxin Materials Co Ltd(2), (4) Manufacture and sale of specialty cement
People’s Republic of China
33 33
Xin-shan Ang-de (Zibo) Materials Co., Ltd.(5)
Manufacture and sale of specialty cement
People’s Republic of China
40 40
Held by subsidiaries
VCEM Materials Co Ltd(3) Manufacture and sale of specialty cement
South Korea 40 40
Changshu Changyin Ready Mix Concrete Co Ltd(4)
Manufacture and sale of building materials
People’s Republic of China
40 40
Qingdao Evergreen Materials and Technologies Co Ltd(2), (4)
Manufacture and sale of specialty cement
People’s Republic of China
34.40 34.40
Kunshan R&P Co., Ltd.(4) Manufacture of thermosetting synthetic resin and plastic materials
People’s Republic of China
40 –
The auditors of the associates and joint ventures are as follows:(1) KPMG LLP, Singapore.(2) For consolidation purposes, a member firm of KPMG International performed specified audit procedures on certain specified significant
accounts in accordance with International Standards on Auditing.(3) Member firm of KPMG International in the country of incorporation.(4) Audited by other certified public accountants in the respective country of incorporation.(5) Inactive company and thus not required to be audited by laws of country of incorporation.
YEAR ENDED 31 DECEMBER 2017Notes to the FINANCIAL STATEMENTS
ENGRO CORPORATION LIMITED90

7 ASSOCIATES AND JOINT VENTURES (CONTINUED)
Associates
The Group has interest in one (2016: one) associate which is considered to be material and a number of associates
that are individually immaterial to the Group. All associates are equity accounted.
HB Investments (China) Pte. Ltd.
Nature of relationship with the Group Investment in property and real estate
Principal place of business/Country of incorporation Singapore
Ownership interest/Voting rights held 20% (2016: 20%)
The following summarises the financial information of the Group’s material associate based on its financial statements
prepared in accordance with FRS. The table also analyses, in aggregate, the carrying amount and share of results
and other comprehensive income of the remaining individually immaterial associates.
HB Investments
(China)
Pte. Ltd.
Immaterial
associates Total
$’000 $’000 $’000
2017
Revenue –
Profit from continuing operations 6,534
Other comprehensive income (5,835)
Total comprehensive income 699
Non-current assets 68,132
Current assets 223
Non-current liabilities (76,066)
Current liabilities (11)
Net assets (7,722)
Add: Non-current liabilities 76,066*
Adjusted net assets 68,344
Group’s interest in net assets of investee
at beginning of the year 13,528 8,819 22,347
Group’s share of:
– profit from continuing operations 1,307 65 1,372
– other comprehensive income (1,167) (105) (1,272)
– total comprehensive income 140 (40) 100
Less: Dividends recognised during the year – (3,510) (3,510)
Carrying amount of interest in investee
at end of the year 13,668 5,269 18,937
* The non-current liabilities of the associate are, in substance, part of the net investment in the associate. Settlement of the amounts is neither planned nor likely to occur in the foreseeable future.
YEAR ENDED 31 DECEMBER 2017Notes to the FINANCIAL STATEMENTS
ANNUAL REPORT 201791

7 ASSOCIATES AND JOINT VENTURES (CONTINUED)
Associates (Continued)
HB Investments
(China)
Pte. Ltd.
Immaterial
associates Total
$’000 $’000 $’000
2016
Revenue –
Profit from continuing operations 1,255
Other comprehensive income 2,030
Total comprehensive income 3,285
Non-current assets 67,417
Current assets 237
Non-current liabilities (76,066)
Current liabilities (11)
Net assets (8,423)
Add: Non-current liabilities 76,066*
Adjusted net assets 67,643
Group’s interest in net assets of investee
at beginning of the year 12,871 8,477 21,348
Group’s share of:
– profit from continuing operations 251 615 866
– other comprehensive income 406 (273) 133
– total comprehensive income 657 342 999
Carrying amount of interest in investee
at end of the year 13,528 8,819 22,347
* The non-current liabilities of the associate are, in substance, part of the net investment in the associate. Settlement of the amounts is neither planned nor likely to occur in the foreseeable future.
Joint ventures
Jiangsu Huailong Materials Co Ltd, Jinan Luxin Materials Co Ltd, Wuhan Wuxin Materials Co Ltd, Qingdao Evergreen
Materials and Technologies Co Ltd and VCEM Materials Co Ltd are joint arrangements in which the Group has joint
control via investors’ agreement and holds 40%, 40%, 33%, 43% and 40% (2016: 40%, 40%, 33%, 43% and 40%)
ownership interest respectively. These investees are incorporated in the People’s Republic of China and South Korea,
principally engaged in the manufacture and sale of specialty cement.
Jiangsu Huailong Materials Co Ltd, Jinan Luxin Materials Co Ltd, Wuhan Wuxin Materials Co Ltd, Qingdao Evergreen
Materials and Technologies Co Ltd and VCEM Materials Co Ltd are structured as separate vehicles and the Group
has residual interests in their net assets. Accordingly, the Group classified its interests in these investees as joint
ventures, which are equity-accounted.
YEAR ENDED 31 DECEMBER 2017Notes to the FINANCIAL STATEMENTS
ENGRO CORPORATION LIMITED92

7 ASSOCIATES AND JOINT VENTURES (CONTINUED)
Joint ventures (Continued)
The following summarises the financial information of each of the Group’s material joint ventures based on their
respective financial statements prepared in accordance with FRS. The table also analyses, in aggregate, the carrying
amount and share of results and other comprehensive income of the individually immaterial joint ventures.
Jiangsu Huailong Materials
Co Ltd
Jinan Luxin Materials
Co Ltd
Wuhan Wuxin
Materials Co Ltd
QingdaoEvergreen
Materials andTechnologies
Co Ltd
VCEMMaterials
Co Ltd
Immaterial joint
ventures Total$’000 $’000 $’000 $’000 $’000 $’000 $’000
2017Revenue 40,477 79,499 84,286 31,877 47,926
Profit from continuing operationsa 5,166 1,453 3,289 2,054 3,065
Other comprehensive income (535) (1,138) (740) (195) 1,652
Total comprehensive income 4,631 315 2,549 1,859 4,717
a Includes:– depreciation 2,107 6,154 4,180 1,736 1,055– income tax expense 1,760 181 871 684 992
Non-current assets 11,931 43,382 75,965 38,414 12,867Current assetsb 27,138 24,453 24,274 10,146 17,486Non-current liabilities – – (819) (16,955) (3)Current liabilities (6,577) (10,237) (54,867) (16,218) (9,241)
Net assets 32,492 57,598 44,553 15,387 21,109
Includesb Cash and cash equivalents 9,573 4,957 14,377 3,811 3,798
Group’s interest in net assets of investee at beginning of the year 11,900 22,913 13,861 5,817 7,078 17,180 78,749
Group’s share of:– profit from continuing
operations 2,066 581 1,085 883 1,226 1,420 7,261– other comprehensive
income (214) (455) (244) (84) 661 (161) (497)– total comprehensive
income 1,852 126 841 799 1,887 1,259 6,764
Dividends recognised during the year (755) – – – (521) (2,544) (3,820)
Carrying amount of interest in investee at end of the year 12,997 23,039 14,702 6,616 8,444 15,895 81,693
YEAR ENDED 31 DECEMBER 2017Notes to the FINANCIAL STATEMENTS
ANNUAL REPORT 201793

7 ASSOCIATES AND JOINT VENTURES (CONTINUED)
Joint ventures (Continued)
Jiangsu
Huailong
Materials
Co Ltd
Jinan Luxin
Materials
Co Ltd
Wuhan
Wuxin
Materials
Co Ltd
QingdaoEvergreen
Materials andTechnologies
Co Ltd
VCEMMaterials
Co Ltd
Immaterial
joint
ventures Total
$’000 $’000 $’000 $’000 $’000 $’000 $’000
2016
Revenue 26,400 67,319 59,001 14,605 42,805
Profit from continuing
operationsa 2,178 2,950 712 286 2,916
Other comprehensive
income (918) (1,918) (1,112) (776) (490)
Total comprehensive
income 1,260 1,032 (400) (490) 2,426
a Includes:
– depreciation 2,709 5,087 3,974 1,486 801
– income tax expense 846 631 138 – 883
Non-current assets 13,188 39,710 74,275 37,124 12,704
Current assetsb 21,063 28,570 48,559 8,705 15,648
Non-current liabilities – – (998) (22,079) –
Current liabilities (4,501) (10,998) (79,834) (10,222) (10,658)
Net assets 29,750 57,282 42,002 13,528 17,694
Includesb Cash and cash
equivalents 8,603 9,518 15,488 1,594 4,394
Group’s interest in net
assets of investee at
beginning of the year 11,396 23,676 15,099 6,028 6,240 17,220 79,659
Group’s share of:
– profit from continuing
operations 871 1,180 235 123 1,166 443 4,018
– other comprehensive
income (367) (767) (367) (334) (196) (263) (2,294)
– total comprehensive
income 504 413 (132) (211) 970 180 1,724
Dividends recognised
during the year – (1,176) (1,106) – (132) (220) (2,634)
Carrying amount of
interest in investee at
end of the year 11,900 22,913 13,861 5,817 7,078 17,180 78,749
YEAR ENDED 31 DECEMBER 2017Notes to the FINANCIAL STATEMENTS
ENGRO CORPORATION LIMITED94

8 OTHER INVESTMENTS
Group Company
2017 2016 2017 2016
$’000 $’000 $’000 $’000
Non-current investments
Available-for-sale financial assets:
– Equity securities 2,796 3,429 1,217 1,217
– Venture capital funds 13,656 14,313 – –
16,452 17,742 1,217 1,217
Current investments
Convertible loan 1,336 1,447 – –
Financial assets classified as held for
trading:
– Equity securities 7,216 6,472 – –
– Debt securities 1,708 1,228 – –
Financial assets designated as at fair value
through profit or loss:
– Investment funds 12,894 12,570 – –
Other trading investments 2,956 – – –
26,110 21,717 – –
42,562 39,459 1,217 1,217
An impairment loss of $665,000 (2016: $1,261,000) in respect of available-for-sale financial assets of the Group was
recognised in profit or loss during the year.
Information about the Group’s and the Company’s exposures to credit and market risks, and fair value measurement,
is included in note 25.
9 OTHER ASSETS
Group Company
2017 2016 2017 2016
$’000 $’000 $’000 $’000
Club memberships, at cost 219 238 219 238
Accumulated impairment losses (141) (141) (141) (141)
78 97 78 97
In the prior year, the club memberships were impaired by $75,000 due to a decline in their market values.
YEAR ENDED 31 DECEMBER 2017Notes to the FINANCIAL STATEMENTS
ANNUAL REPORT 201795

10 INVENTORIES
Group Company2017 2016 2017 2016$’000 $’000 $’000 $’000
Raw materials 4,919 2,126 – –Goods-in-transit 1,102 2,935 1,103 2,175Finished goods 6,297 5,071 2,853 2,939
12,318 10,132 3,956 5,114
Source of estimation uncertainty
The Group recognises allowance on inventory obsolescence when inventory items are identified as obsolete and the
allowance is charged to profit or loss. Obsolescence is based on the physical and internal condition of inventory items.
Obsolescence is also established when inventory items are no longer marketable. In addition to an allowance for
specifically identified obsolete inventory, estimation is made on a group basis based on the age of the inventory items.
The Group believes such estimates represent a fair charge of the level of inventory obsolescence in a given year. The
Group reviews on a monthly basis the condition of its inventory. An increase in the Group’s allowance for obsolescence
would increase the Group’s recorded changes in finished goods and decrease its inventories (current assets).
11 TRADE AND OTHER RECEIVABLES
Group Company2017 2016 2017 2016$’000 $’000 $’000 $’000
Trade receivables due from– Third parties 35,223 36,846 14,528 15,792– Subsidiaries – – 10,732 7,524– Joint venture 3,931 – – –
39,154 36,846 25,260 23,316Allowance for doubtful receivables (1,137) (1,526) (246) (246)
Net trade receivables 38,017 35,320 25,014 23,070
Non-trade receivables due from– Subsidiaries – – 25,851 26,716– Joint ventures 605 620 169 139
605 620 26,020 26,855Allowance for doubtful receivables – – (4,009) (4,466)
605 620 22,011 22,389
Deposits 471 564 31 28Other receivables 3,124 2,146 535 472Dividend receivable from associates and
joint ventures 6,281 2,143 – 1,106
Loans and receivables 48,498 40,793 47,591 47,065Prepayments 3,026 8,208 1,773 1,947
51,524 49,001 49,364 49,012
Non-current – 1,037 – –Current 51,524 47,964 49,364 49,012
YEAR ENDED 31 DECEMBER 2017Notes to the FINANCIAL STATEMENTS
ENGRO CORPORATION LIMITED96

11 TRADE AND OTHER RECEIVABLES (CONTINUED)
All outstanding balances with subsidiaries, associates and joint ventures are unsecured, interest-free and repayable
on demand.
The Group’s and the Company’s exposures to credit and currency risks, and impairment losses related to trade and
other receivables, are disclosed in note 25.
12 LOAN TO A SUBSIDIARY
The loan to a subsidiary of $5,059,000 (2016: $5,059,000) is unsecured, bear interest at 3% (2016: 3%) per annum
and is repayable in 2018. No impairment loss has been recognised in respect of the loan to a subsidiary.
13 CASH AND CASH EQUIVALENTS
Group Company
2017 2016 2017 2016
$’000 $’000 $’000 $’000
Fixed deposits 5,807 13,751 3,007 10,033
Bank balances 18,062 25,642 5,871 10,330
23,869 39,393 8,878 20,363
The weighted average effective interest rates per annum relating to cash and cash equivalents at 31 December 2017
for the Group and the Company are 0.46% (2016: 0.38%) and 0.43% (2016: 0.42%) per annum respectively.
14 CAPITAL AND RESERVES
Share capital
Ordinary shares
2017 2017 2016 2016
No. of shares No. of shares
’000 $’000 ’000 $’000
Company
In issue at 1 January and 31 December 118,703 85,270 118,703 85,270
All issued shares are fully paid, with no par value.
All shares rank equally with regard to the Company’s residual assets.
Ordinary shares
The holders of ordinary shares are entitled to receive dividends as declared from time to time, and are entitled to one
vote per share at meetings of the Company.
YEAR ENDED 31 DECEMBER 2017Notes to the FINANCIAL STATEMENTS
ANNUAL REPORT 201797

14 CAPITAL AND RESERVES (CONTINUED)
Reserves
Group Company
2017 2016 2017 2016
$’000 $’000 $’000 $’000
Foreign currency translation reserve (2,303) 1,236 – –
Fair value reserve 3,665 4,913 – –
Share option reserve 126 154 126 154
Reserve for own shares (72) (120) (72) (120)
Capital reserve (41) (45) (41) (45)
Accumulated profits 128,596 127,800 89,105 90,123
129,971 133,938 89,118 90,112
Foreign currency translation reserve
The foreign currency translation reserve comprises foreign currency differences arising from the translation of the
financial statements of foreign operations whose functional currencies are different from the functional currency of the
Company, as well as foreign exchange differences on monetary items which form part of the Group’s net investment
in foreign operations as described in note 3.2.
Fair value reserve
The fair value reserve comprises the cumulative net change in the fair value of available-for-sale financial assets until
the investments are derecognised or impaired.
Share option reserve
The share option reserve comprises the cumulative value of employee services received for the issue of share options.
Reserve for own shares
The reserve for the Company’s own shares comprises the cost of the Company’s shares held by the Group. As at
31 December 2017, the Group held 79,200 (2016: 134,200) of the Company’s shares.
Capital reserve
Capital reserve arises from the difference between proceeds from the disposal of treasury shares and the cost of the
treasury shares disposed.
YEAR ENDED 31 DECEMBER 2017Notes to the FINANCIAL STATEMENTS
ENGRO CORPORATION LIMITED98

15 EMPLOYEE SHARE OPTIONS
Ssangyong Cement (Singapore) Limited 2000 Employees’ Share Option Scheme (the “ESOS 2000”)
The Ssangyong Cement (Singapore) Limited 2000 Employees’ Share Option Scheme (the “ESOS 2000”) of the Company
was approved and adopted by its members at an Extraordinary General Meeting held on 15 January 2001. The ESOS
2000 is administered by the Company’s Remuneration Committee comprising three directors, Ronnie Teo Heng Hock
(Chairman), Tan Soo Nan and Steven Ong Kay Eng.
Other information regarding the ESOS 2000 is set out below:
(a) Options were granted on 1 December 2006 (Option 1), 8 January 2008 (Option 2) and 30 March 2009 (Option 3).
(b) The exercise prices of the options are set at $0.75 per share (Option 1), $1.17 per share (Option 2) and $0.55
per share (Option 3).
(c) The options can be exercised after 1 December 2007 (Option 1), 8 January 2009 (Option 2) and 30 March
2010 (Option 3).
(d) The options granted shall expire on 1 December 2016 (Option 1), 8 January 2018 (Option 2) and 30 March
2019 (Option 3).
EnGro Corporation Limited 2011 Employees’ Share Option Scheme (the “ESOS 2011”)
The EnGro Corporation Limited 2011 Employees’ Share Option Scheme (the “ESOS 2011”) of the Company was
approved and adopted by its members at an Extraordinary General Meeting held on 27 April 2011. The ESOS 2011
is administered by the Company’s Remuneration Committee, comprising three directors, Ronnie Teo Heng Hock
(Chairman), Tan Soo Nan and Steven Ong Kay Eng.
Other information regarding the ESOS 2011 is set out below:
(a) Option was granted on 18 April 2012.
(b) The exercise price of the option is set at $0.79 per share.
(c) The option can be exercised after 18 April 2013.
(d) The option granted shall expire on 18 April 2022.
YEAR ENDED 31 DECEMBER 2017Notes to the FINANCIAL STATEMENTS
ANNUAL REPORT 201799

15 EMPLOYEE SHARE OPTIONS (CONTINUED)
Movements in the number of share options and their related weighted average exercise prices are as follows:
2017 2016
Weighted
average
exercise
price
No. of
options
Weighted
average
exercise
price
No. of
options
$ ’000 $ ’000
Outstanding at 1 January 1.09 945 1.05 1,232
Forfeited 0.79 (15) 0.75 (142)
Exercised 0.79 (55) 0.75 (145)
Outstanding at 31 December 1.11 875 1.09 945
Exercisable at 31 December 1.11 875 1.09 945
The details of shares issued from the exercising of share options are as follows:
2017 2016
Options exercised and
exercise price
No. of
ordinary
shares
issued
No. of
treasury
shares
issued
No. of
ordinary
shares
issued
No. of
treasury
shares
issued
’000 ’000 ’000 ’000
ESOS 2000
Option 1 – $0.75 each – – – 145
ESOS 2011
Option 1 – $0.79 each – 55 – –
At 31 December 2017, outstanding share options granted under the Ssangyong Cement (Singapore) Ltd 2000
Employees’ Share Option Scheme amounted 740,000 shares (2016: 740,000 shares) and under the EnGro Corporation
Limited 2011 Employees’ Share Option Scheme amounted to 135,000 shares (2016: 205,000 shares).
YEAR ENDED 31 DECEMBER 2017Notes to the FINANCIAL STATEMENTS
ENGRO CORPORATION LIMITED100
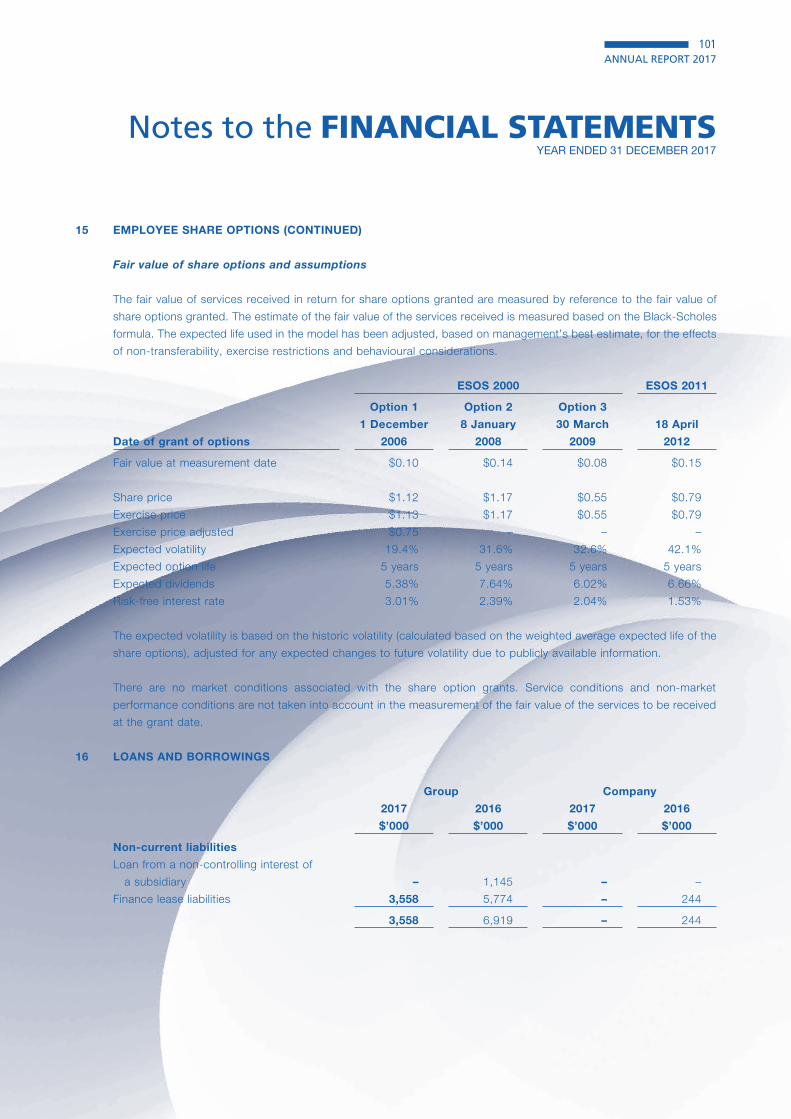
15 EMPLOYEE SHARE OPTIONS (CONTINUED)
Fair value of share options and assumptions
The fair value of services received in return for share options granted are measured by reference to the fair value of
share options granted. The estimate of the fair value of the services received is measured based on the Black-Scholes
formula. The expected life used in the model has been adjusted, based on management’s best estimate, for the effects
of non-transferability, exercise restrictions and behavioural considerations.
ESOS 2000 ESOS 2011
Option 1 Option 2 Option 3
Date of grant of options
1 December
2006
8 January
2008
30 March
2009
18 April
2012
Fair value at measurement date $0.10 $0.14 $0.08 $0.15
Share price $1.12 $1.17 $0.55 $0.79
Exercise price $1.13 $1.17 $0.55 $0.79
Exercise price adjusted $0.75 – – –
Expected volatility 19.4% 31.6% 32.6% 42.1%
Expected option life 5 years 5 years 5 years 5 years
Expected dividends 5.38% 7.64% 6.02% 6.66%
Risk-free interest rate 3.01% 2.39% 2.04% 1.53%
The expected volatility is based on the historic volatility (calculated based on the weighted average expected life of the
share options), adjusted for any expected changes to future volatility due to publicly available information.
There are no market conditions associated with the share option grants. Service conditions and non-market
performance conditions are not taken into account in the measurement of the fair value of the services to be received
at the grant date.
16 LOANS AND BORROWINGS
Group Company
2017 2016 2017 2016
$’000 $’000 $’000 $’000
Non-current liabilities
Loan from a non-controlling interest of
a subsidiary – 1,145 – –
Finance lease liabilities 3,558 5,774 – 244
3,558 6,919 – 244
YEAR ENDED 31 DECEMBER 2017Notes to the FINANCIAL STATEMENTS
ANNUAL REPORT 2017101

16 LOANS AND BORROWINGS (CONTINUED)
Group Company
2017 2016 2017 2016
$’000 $’000 $’000 $’000
Current liabilities
Loans from subsidiaries – – 6,626 12,312
Loan from a non-controlling interest of
a subsidiary 1,131 – – –
Trust receipts 1,496 1,273 1,496 1,273
Finance lease liabilities 2,336 2,360 217 190
4,963 3,633 8,339 13,775
8,521 10,552 8,339 14,019
The loans from subsidiaries and a non-controlling interest of a subsidiary are unsecured, interest-free and repayable
on demand.
Information about the Group’s and the Company’s exposures to interest rate, foreign currency and liquidity risks are
disclosed in note 25.
Terms and debt repayment schedule
Terms and conditions of outstanding loans and borrowings, excluding loans from subsidiaries, are as follows:
2017 2016
Nominal
interest rate
Year of
maturity
Face
value
Carrying
amount
Face
value
Carrying
amount
% $’000 $’000 $’000 $’000
Group
Loan from a
non-controlling interest
of a subsidiary – 2018 1,131 1,131 1,145 1,145
Trust receipts 3.23% 2018 1,500 1,496 1,279 1,273
Finance lease liabilities 1.30% – 3.52% 2018 – 2021 6,244 5,894 8,689 8,134
8,875 8,521 11,113 10,552
Company
Trust receipts 3.23% 2018 1,500 1,496 1,279 1,273
Finance lease liabilities 1.50% 2018 224 217 452 434
1,724 1,713 1,731 1,707
YEAR ENDED 31 DECEMBER 2017Notes to the FINANCIAL STATEMENTS
ENGRO CORPORATION LIMITED102

16 LOANS AND BORROWINGS (CONTINUED)
Finance lease liabilities
Finance lease liabilities are payable as follows:
2017 2016
Future minimum
lease payments
Present value of
minimum lease
payments
Future minimum
lease payments
Present value of
minimum lease
payments$’000 $’000 $’000 $’000
GroupWithin one year 2,527 2,336 2,619 2,360Between two to five years 3,717 3,558 6,070 5,774
6,244 5,894 8,689 8,134
Less: Future finance charges (350) (555)
Present value of obligation 5,894 8,134
CompanyWithin one year 224 217 200 190Between two to five years – – 252 244
224 217 452 434
Less: Future finance charges (7) (18)
Present value of obligation 217 434
Reconciliation of movements of liabilities to cash flows arising from financing activities
Other loans and
borrowings
Finance lease
liabilities Total$’000 $’000 $’000
As at 1 January 2017 2,418 8,134 10,552
Changes from financing cash flowsInterest paid (38) (277) (315)Payment of finance lease liabilities – (2,826) (2,826)Proceeds from trust receipts 223 – 223
Total changes from financing cash flows 185 (3,103) (2,918)
The effect of changes in foreign exchange rates (14) 51 37
Other changesLiability-relatedNew finance leases – 535 535Interest expense 38 277 315
Total liability-related other changes 38 812 850
As at 31 December 2017 2,627 5,894 8,521
YEAR ENDED 31 DECEMBER 2017Notes to the FINANCIAL STATEMENTS
ANNUAL REPORT 2017103

17 DEFERRED TAX (ASSETS)/LIABILITIES
Movements in deferred tax (assets)/liabilities of the Group during the year are as follows:
At
1 January
Recognised
in profit
or loss
(note 21)
Withholding
tax paid
At
31 December
$’000 $’000 $’000 $’000
Group
2017
Property, plant and equipment (29) 29 – –
Withholding tax on share of profits of
associates and joint ventures 756 169 (444) 481
2016
Property, plant and equipment (29) – – (29)
Withholding tax on share of profits of
associates and joint ventures 655 172 (71) 756
Deferred tax assets have not been recognised in respect of the following items:
Group
2017 2016
$’000 $’000
Unabsorbed tax losses 38,345 33,524
Unabsorbed wear and tear allowances 286 286
Deductible temporary differences 14,756 12,170
53,387 45,980
Unutilised donations 1,095 2,263
The tax losses and unabsorbed wear and tear allowances of Singapore incorporated subsidiaries at 31 December 2017
are available for carry forward and set off against future taxable income subject to agreement with the Comptroller of
Income Tax and compliance with Section 37 of the Income Tax Act Chapter 134. Foreign subsidiaries’ unabsorbed
tax losses are subject to agreement by the local tax authorities and compliance with tax regulations in the respective
countries in which the subsidiaries operate in. The deductible temporary differences do not expire under current tax
legislation. Deferred tax assets have not been recognised in respect of these items in accordance with the Group’s
accounting policy as set out in note 3.14.
YEAR ENDED 31 DECEMBER 2017Notes to the FINANCIAL STATEMENTS
ENGRO CORPORATION LIMITED104

18 TRADE AND OTHER PAYABLES
Group Company
2017 2016 2017 2016
$’000 $’000 $’000 $’000
Trade payables:
– Third parties 12,454 11,771 1,619 2,599
Advances received from:
– Third parties 68 39 – –
– Joint ventures 1 4 – –
Accrued expenses 3,837 8,524 2,453 4,727
Non-trade payables due to:
– Subsidiaries – – – 332
Other payables 2,076 2,543 301 1,724
Forward exchange contracts 263 – 263 –
18,699 22,881 4,636 9,382
The amounts due to subsidiaries are unsecured, interest-free and repayable on demand.
The Group’s and the Company’s exposures to currency and to liquidity risks related to trade and other payables are
disclosed in note 25.
19 REVENUE
Revenue of the Group represents net sales of goods billed to external customers. Transactions within the Group are
eliminated.
20 FINANCE INCOME AND FINANCE COSTS
Group
2017 2016
$’000 $’000
Finance income
Dividend income from:
– Financial assets classified as held for trading 226 286
– Available-for-sale financial assets 100 150
Interest income 196 766
Other investment income 435 220
Net change in fair value of financial assets:
– Held for trading 548 227
– Designated as at fair value through profit or loss 618 518
Net change in fair value of available-for-sale financial assets reclassified to
profit or loss:
– Gain on disposal of available-for-sale financial assets 680 3,466
Net foreign exchange gain – 46
2,803 5,679
YEAR ENDED 31 DECEMBER 2017Notes to the FINANCIAL STATEMENTS
ANNUAL REPORT 2017105

20 FINANCE INCOME AND FINANCE COSTS (CONTINUED)
Group
2017 2016
$’000 $’000
Finance costs
Interest expense on trust receipts (38) (90)
Interest expense on finance lease liabilities (277) (325)
Impairment loss on available-for-sale financial assets (665) (1,261)
Net foreign exchange loss (1,918) –
(2,898) (1,676)
Net finance (costs)/income (95) 4,003
21 TAX EXPENSE
Group
2017 2016
$’000 $’000
Current tax expense
Current year 353 667
(Over)/Under provided in prior years (207) 132
146 799
Deferred tax expense
Origination and reversal of temporary differences 198 172
198 172
344 971
Reconciliation of effective tax rate
Profit before tax 4,157 6,852
Less: Share of profits of associates and joint ventures (net of tax) (8,633) (4,884)
(4,476) 1,968
Tax using the Singapore tax rate of 17% (2016: 17%) (761) 335
Effect of tax rates in foreign jurisdictions 61 210
Non-deductible expenses 257 444
Tax exempt income (434) (785)
Utilisation of deferred tax benefits previously not recognised (61) (226)
Tax on unremitted profits 169 172
Unrecognised deferred tax assets 1,320 689
(Over)/Under provided in prior years (207) 132
344 971
YEAR ENDED 31 DECEMBER 2017Notes to the FINANCIAL STATEMENTS
ENGRO CORPORATION LIMITED106

22 PROFIT FOR THE YEAR
The following items have been included in arriving at profit for the year:
Group
2017 2016
$’000 $’000
(Reversal of)/allowance for doubtful receivables (270) 688
Bad debts recovered – (18)
Gain on disposal of property, plant and equipment (273) (230)
Contributions to defined contribution plans, included in staff costs 1,035 1,019
Audit fees paid to:
– auditors of the Company 348 341
– other auditors 31 37
Non-audit fees paid to:
– other auditors 3 3
Operating lease expense 2,581 2,854
23 EARNINGS PER SHARE
Basic earnings per share
The calculation of basic earnings per share at 31 December 2017 was based on the profit attributable to ordinary
shareholders of $3,636,000 (2016: $5,768,000), and a weighted average number of ordinary shares outstanding of
118,598,000 (2016: 118,631,000), calculated as follows:
Weighted average number of ordinary shares
Group
2017 2016
No. of
shares
No. of
shares
’000 ’000
Issued ordinary shares at 1 January (excluding treasury shares) 118,568 118,628
Effect of share options exercised 30 114
Effect of own shares held – (111)
Weighted average number of ordinary shares during the year 118,598 118,631
YEAR ENDED 31 DECEMBER 2017Notes to the FINANCIAL STATEMENTS
ANNUAL REPORT 2017107

23 EARNINGS PER SHARE (CONTINUED)
Diluted earnings per share
The calculation of diluted earnings per share at 31 December 2017 was based on profit attributable to ordinary
shareholders of $3,636,000 (2016: $5,768,000), and a weighted average number of ordinary shares outstanding after
adjustment for the effects of all dilutive potential ordinary shares of 118,621,000 (2016: 118,678,000), calculated as
follows:
Weighted average number of ordinary shares (diluted)
Group
2017 2016
Profit attributable to owners of Company ($’000) 3,636 5,768
Weighted average number of ordinary shares (basic) (’000) 118,598 118,631
Potential ordinary shares issuable under share options (’000) 23 47
Weighted average number of ordinary shares (diluted) during the year (’000) 118,621 118,678
Basic earnings per share (cents) 3.07 4.86
24 OPERATING SEGMENTS
The Group has four reportable segments, as described below, which are the Group’s strategic business units. The
strategic business units offer different products or services, and are managed separately. For each of the strategic
business units, the Group’s CEO reviews internal management reports on at least a monthly basis. The following
summary describes the operations in each of the Group’s reportable segments:
– Cement and building materials: Manufacture and sale of cement, ready-mix concrete and building materials.
– Specialty polymer: Manufacture and sale of thermosetting synthetic resin and plastic materials.
– Investments: Trading of equity securities, debt securities and holding of investments in venture capital funds.
– Food and beverage: Operation of food and beverage outlets under franchise.
Other operations include the provision of carbon consultancy services. None of these segments meets any of the
quantitative thresholds for determining reportable segments in 2017 or 2016.
Information regarding the results of each reportable segment is included below. Performance is measured based on
segment profit before tax, as included in the internal management reports that are reviewed by the Group’s CEO.
Segment profit is used to measure performance as management believes that such information is the most relevant
in evaluating the results of certain segments relative to other entities that operate within these industries. Segment
results, assets and liabilities include items directly attributable to a segment as well as those that can be allocated on
a reasonable basis. Unallocated items mainly comprise headquarter expenses and support expenses of associates
and joint ventures.
YEAR ENDED 31 DECEMBER 2017Notes to the FINANCIAL STATEMENTS
ENGRO CORPORATION LIMITED108

24 OPERATING SEGMENTS (CONTINUED)
Information about reportable segments
Cement
and
building
materials
Specialty
polymer Investments
Food &
Beverage Total
$’000 $’000 $’000 $’000 $’000
Revenue and expenses
2017
External revenues, representing
consolidated revenue 107,977 31,520 – 2,329 141,826
Dividend income – – 326 – 326
Reportable segment profit/(loss) before tax 1,870 656 (869) (602) 1,055
Share of profits of associates and
joint ventures 7,364 – 1,269 – 8,633
9,234 656 400 (602) 9,688
Headquarter expenses (3,674)
Support expenses of associates and
joint ventures (1,738)
Interest expense (315)
Interest income 196
Tax expense (344)
Profit for the year 3,813
2016
External revenues, representing
consolidated revenue 125,569 25,933 – 1,795 153,297
Dividend income – – 436 – 436
Reportable segment profit/(loss) before tax 5,286 303 3,224 (1,178) 7,635
Share of profits of associates and
joint ventures 4,825 – 59 – 4,884
10,111 303 3,283 (1,178) 12,519
Headquarter expenses (4,125)
Support expenses of associates and
joint ventures (1,893)
Interest expense (415)
Interest income 766
Tax expense (971)
Profit for the year 5,881
YEAR ENDED 31 DECEMBER 2017Notes to the FINANCIAL STATEMENTS
ANNUAL REPORT 2017109

24 OPERATING SEGMENTS (CONTINUED)
Information about reportable segments (Continued)
Cement
and
building
materials
Specialty
polymer Investments
Food &
Beverage Others Total
$’000 $’000 $’000 $’000 $’000 $’000
Assets and liabilities
2017
Total assets for reportable
segments 61,640 20,859 52,772 2,402 18 137,691
Investments in associates and
joint ventures 100,630
Other unallocated amounts 5,996
Consolidated total assets 244,317
Total liabilities for reportable
segments 20,090 4,069 59 372 4 24,594
Other unallocated amounts 3,313
Consolidated total liabilities 27,907
2016
Total assets for reportable
segments 57,462 14,860 62,978 3,556 45 138,901
Investments in associates and
joint ventures 101,096
Other unallocated amounts 13,885
Consolidated total assets 253,882
Total liabilities for reportable
segments 25,997 4,706 66 242 5 31,016
Other unallocated amounts 3,535
Consolidated total liabilities 34,551
Other segment information
2017
Capital expenditure 3,343 48 – 124 – 3,515
Depreciation and amortisation 4,399 9 – 130 – 4,538
Impairment loss on available-for-sale
financial assets – – 665 – – 665
2016
Capital expenditure 4,187 26 – 9 – 4,222
Depreciation and amortisation 4,290 2 – 143 – 4,435
Impairment loss on available-for-sale
financial assets – – 1,261 – – 1,261
YEAR ENDED 31 DECEMBER 2017Notes to the FINANCIAL STATEMENTS
ENGRO CORPORATION LIMITED110

24 OPERATING SEGMENTS (CONTINUED)
Reconciliation of reportable segment profit or loss
2017 2016
$’000 $’000
Profit or loss
Total profit for reportable segments 1,055 7,635
Unallocated amounts (5,531) (5,667)
Share of profit of associates and joint ventures 8,633 4,884
Consolidated profit before tax 4,157 6,852
Geographical segments
The Group’s operations are mainly in Singapore, Malaysia and People’s Republic of China. In presenting information on
the basis of geographical segments, segment revenue is based on the geographical location of customers. Segment
assets are based on the geographical location of the assets.
Singapore Malaysia
People’s
Republic of
China Others Elimination Total
$’000 $’000 $’000 $’000 $’000 $’000
2017
External customers 86,112 24,533 26,108 5,073 – 141,826
Inter-segment revenue 4,815 3,865 – – (8,680) –
Total revenue 90,927 28,398 26,108 5,073 (8,680) 141,826
Total assets for reportable
segments 104,555 19,253 13,883 – – 137,691
Investments in associates and
joint ventures 100,630
Other unallocated amounts 5,996
Consolidated total assets 244,317
2016
External customers 92,416 33,686 25,431 1,764 – 153,297
Inter-segment revenue 7,145 9,225 – – (16,370) –
Total revenue 99,561 42,911 25,431 1,764 (16,370) 153,297
Total assets for reportable
segments 107,343 20,743 10,815 – – 138,901
Investments in associates and
joint ventures 101,096
Other unallocated amounts 13,885
Consolidated total assets 253,882
YEAR ENDED 31 DECEMBER 2017Notes to the FINANCIAL STATEMENTS
ANNUAL REPORT 2017111

24 OPERATING SEGMENTS (CONTINUED)
Major customer
For the year ended 31 December 2017, there is no customer that individually contribute more than 10 percent of the
Group’s total revenues. In the prior year, revenues from one customer of the Specialty Polymer segment represent
approximately $20,909,000 of the Group’s total revenues.
25 FINANCIAL INSTRUMENTS
Financial risk management
Overview
The Group has exposure to the following risks from its use of financial instruments:
• credit risk
• liquidity risk
• market risk
This note presents information about the Group’s exposure to each of the above risks, the Group’s objectives, policies
and processes for measuring and managing risk, and the Group’s management of capital.
Risk management framework
The Board of Directors has overall responsibility for the establishment and oversight of the Group’s risk management
framework.
The Group’s risk management policies are established to identify and analyse the risks faced by the Group, to set
appropriate risk limits and controls, and to monitor risks and adherence to limits. Risk management policies and
systems are reviewed regularly to reflect changes in market conditions and the Group’s activities.
The Group Audit Committee oversees how management monitors compliance with the Group’s risk management
policies and procedures, and reviews the adequacy of the risk management framework in relation to the risks faced
by the Group. The Group Audit Committee is assisted in its oversight role by Internal Audit. Internal Audit undertakes
both regular and ad hoc reviews of risk management controls and procedures, the results of which are reported to
the Group Audit Committee.
Credit risk
Credit risk is the risk of financial loss to the Group if a customer or counterparty to a financial instrument fails to meet
its contractual obligations, and arises principally from the Group’s receivables from customers and investments in
debt securities.
YEAR ENDED 31 DECEMBER 2017Notes to the FINANCIAL STATEMENTS
ENGRO CORPORATION LIMITED112

25 FINANCIAL INSTRUMENTS (CONTINUED)
Credit risk (Continued)
Exposure to credit risk
The maximum exposure to credit risk at the reporting date was as follows:
Group Company
Note 2017 2016 2017 2016
$’000 $’000 $’000 $’000
Convertible loan 8 1,336 1,447 – –
Financial assets classified as
held for trading:
– Debt securities 8 1,708 1,228 – –
Loans and receivables 11 48,498 40,793 47,591 47,065
Loans to a subsidiary 12 – – 5,059 5,059
Cash and cash equivalents 13 23,869 39,393 8,878 20,363
75,411 82,861 61,528 72,487
The carrying amounts of financial assets in the statements of financial position represents the Group and the Company’s
respective maximum exposures to credit risk, before taking into account any collateral held. The Group and the
Company do not hold any collateral in respect of its financial assets.
Guarantees
The Group’s policy is to provide financial guarantees only for subsidiaries’ liabilities.
The maximum exposure to the Company in respect of intra-group financial guarantees at the reporting date if the
facilities are drawn down amount to $6,413,000 (2016: $10,489,000). At the reporting date, the Company does not
consider it probable that a claim will be made against the Company under the intra-group financial guarantee.
Trade and other receivables
The Group has a credit policy in place which establishes credit limits for customers and monitors their balances on an
ongoing basis. Credit evaluations are performed on all customers requiring credit, taking into account their financial
position and past payment experience with the Group.
At 31 December 2017, the Group’s exposure to credit risk primarily comprises $19,004,000 (2016: $20,824,000),
$9,467,000 (2016: $9,760,000) and $9,129,000 (2016: $9,878,000) due from companies in Singapore, People’s
Republic of China and Malaysia respectively.
At 31 December 2017, the Group’s exposure to credit risk primarily comprises $27,731,000 (2016: $29,176,000) due
from construction companies.
YEAR ENDED 31 DECEMBER 2017Notes to the FINANCIAL STATEMENTS
ANNUAL REPORT 2017113

25 FINANCIAL INSTRUMENTS (CONTINUED)
Credit risk (Continued)
Trade and other receivables (Continued)
The Group’s historical experience in the collection of trade receivables falls within the recorded allowances. Due to
these factors, management believes that no additional credit risk beyond amounts provided for collection losses is
inherent in the Group’s trade receivables.
The ageing of loans and receivables (excluding cash and cash equivalents) at the reporting date was:
2017 2016
Gross
Impairment
losses Gross
Impairment
losses
$’000 $’000 $’000 $’000
Group
Not past due 32,815 – 30,843 –
Past due 1 – 30 days 7,320 – 6,911 –
Past due 31 – 90 days 6,423 (59) 2,283 (208)
Past due 91 days 3,077 (1,078) 2,282 (1,318)
49,635 (1,137) 42,319 (1,526)
Company
Not past due 49,396 (4,009) 42,890 (4,466)
Past due 1 – 30 days 3,953 – 5,312 –
Past due 31 – 90 days 3,125 – 2,310 –
Past due 91 days 431 (246) 6,324 (246)
56,905 (4,255) 56,836 (4,712)
The Group believes that the unimpaired amounts that are past due by more than 30 days are still collectible in full,
based on historical payment behaviour and extensive analyses of customer credit risk.
An analysis of the credit quality of loans and receivables that are neither past due nor impaired indicates that the
balances are of acceptable risk.
Impairment losses
The Group establishes an allowance for impairment that represents its estimate of incurred losses in respect of trade
and other receivables. The component of this allowance is a specific loss component that relates to individually
significant exposures.
YEAR ENDED 31 DECEMBER 2017Notes to the FINANCIAL STATEMENTS
ENGRO CORPORATION LIMITED114

25 FINANCIAL INSTRUMENTS (CONTINUED)
Credit risk (Continued)
Impairment losses (Continued)
The movements in the allowance for impairment in respect of loans and receivables (excluding cash and cash
equivalents) during the year was as follows:
Group Company
2017 2016 2017 2016
$’000 $’000 $’000 $’000
At 1 January 1,526 842 4,712 4,765
Impairment loss recognised in profit or loss 67 920 – –
Amounts written back (337) (232) (457) (53)
Amounts utilised (120) (8) – –
Translation difference 1 4 – –
At 31 December 1,137 1,526 4,255 4,712
Based on the Group’s monitoring of customer credit risk and historical default rates, the Group believes that, apart
from the above, no impairment allowance is necessary in respect of trade receivables not past due or past due by up
to 30 days. These receivables are mainly with customers that have good payment records with the Group.
Source of estimation uncertainty
The Group maintains allowance for doubtful accounts at a level considered adequate to provide for potential
uncollectible receivables. The level of this allowance is evaluated by the Group on the basis of factors that affect the
collectability of the accounts. These factors include, but are not limited to, the length of the Group’s relationship with
debtors, their payment behaviour and known market factors. The Group reviews the age and status of receivables
and identifies accounts that are to be provided with allowance on a continuous basis. The amount and timing of
recorded expenses for any period would differ if the Group made different judgements or utilised different estimates.
An increase in the Group’s allowance for doubtful accounts would increase the Group’s recorded operating expenses
and decrease its receivables (current assets).
Derivatives
Forward contracts are entered into with banks which are regulated.
Cash and cash equivalents
The Group and Company held cash and cash equivalents of $23,869,000 and $8,878,000 respectively at 31 December
2017 (2016: $39,393,000 and $20,363,000 respectively), which represents its maximum credit exposure on these
assets. The cash and cash equivalents are held with banks and financial institutions which are regulated.
YEAR ENDED 31 DECEMBER 2017Notes to the FINANCIAL STATEMENTS
ANNUAL REPORT 2017115

25 FINANCIAL INSTRUMENTS (CONTINUED)
Liquidity risk
Liquidity risk is the risk that the Group will encounter difficulty in meeting the obligations associated with its financial
liabilities that are settled by delivery cash or another financial asset. The Group’s approach to managing liquidity is
to ensure, as far as possible, that it will always have sufficient liquidity to meet its liabilities when due, under both
normal and stressed conditions, without incurring unacceptable losses or risking damage to the Group’s reputation.
The Group monitors its liquidity risk and maintains a level of cash and cash equivalents deemed adequate by
management to finance the Group’s operations and to mitigate the effects of fluctuations in cash flows. Generally, the
Group ensures that it has sufficient cash on demand to meet expected operational expenses, including the servicing of
financial obligations; this excludes the potential impact of extreme circumstances that cannot reasonably be predicted,
such as natural disasters.
Exposure to liquidity risk
The following are the contractual maturities of financial liabilities, including estimated interest payments and excluding
the impact of netting agreements:
Cash flows
Carrying
amount
Contractual
cash flows
Within
1 year
Between
2 to 5 years
$’000 $’000 $’000 $’000
Group
2017
Non-derivative financial liabilities
Loan from a non-controlling interest of
a subsidiary 1,131 (1,131) (1,131) –
Finance lease liabilities 5,894 (6,244) (2,527) (3,717)
Trust receipts 1,496 (1,500) (1,500) –
Trade and other payables* 18,367 (18,367) (18,367) –
26,888 (27,242) (23,525) (3,717)
Derivative financial instruments
Forward exchange contracts (gross-settled) 263
– Inflow 9,352 9,352 –
– Outflow (9,615) (9,615) –
263 (263) (263) –
27,151 (27,505) (23,788) (3,717)
2016
Non-derivative financial liabilities
Loan from a non-controlling interest of
a subsidiary 1,145 (1,145) – (1,145)
Finance lease liabilities 8,134 (8,689) (2,619) (6,070)
Trust receipts 1,273 (1,279) (1,279) –
Trade and other payables* 22,838 (22,838) (22,838) –
33,390 (33,951) (26,736) (7,215)
YEAR ENDED 31 DECEMBER 2017Notes to the FINANCIAL STATEMENTS
ENGRO CORPORATION LIMITED116

25 FINANCIAL INSTRUMENTS (CONTINUED)
Liquidity risk (Continued)
Cash flows
Carrying
amount
Contractual
cash flows
Within
1 year
Between
2 to 5 years
$’000 $’000 $’000 $’000
Company
2017
Non-derivative financial liabilities
Finance lease liabilities 217 (224) (224) –
Trust receipts 1,496 (1,500) (1,500) –
Trade and other payables* 4,373 (4,373) (4,373) –
Loans from subsidiaries 6,626 (6,626) (6,626) –
12,712 (12,723) (12,723) –
Derivative financial instruments
Forward exchange contracts (gross-settled) 263
– Inflow 9,352 9,352 –
– Outflow (9,615) (9,615) –
263 (263) (263) –
12,975 12,986 12,986 –
2016
Non-derivative financial liabilities
Finance lease liabilities 434 (452) (200) (252)
Trust receipts 1,273 (1,279) (1,279) –
Trade and other payables* 9,382 (9,382) (9,382) –
Loans from subsidiaries 12,312 (12,312) (12,312) –
23,401 (23,425) (23,173) (252)
* excludes advances received and forward exchange contracts
The maturity analyses show the contractual undiscounted cash flows of the Group and the Company’s financial
liabilities on the basis of their earliest possible contractual maturity. The cash inflows/(outflows) disclosed for derivative
financial instruments relate to those instruments held for risk management purposes and which are usually not closed
out prior to contractual maturity. The disclosure shows gross cash inflow and outflow amounts for derivatives that
have simultaneous gross cash settlement e.g. forward exchange contracts.
It is not expected that the cash flows included in the maturity analysis could occur significantly earlier, or at significantly
different amounts.
Market risk
Market risk is the risk that changes in market prices, such as foreign exchange rates, interest rates and equity prices will
affect the Group’s income or the value of its holdings of financial instruments. The objective of market risk management
is to manage and control market risk exposures within acceptable parameters, while optimising the return.
YEAR ENDED 31 DECEMBER 2017Notes to the FINANCIAL STATEMENTS
ANNUAL REPORT 2017117

25 FINANCIAL INSTRUMENTS (CONTINUED)
Market risk (Continued)
Currency risk
The Group is exposed to currency risk on sales, purchases, investments and borrowings, including inter-company
sales, purchases and inter-company balances that are denominated in a currency other than the respective functional
currencies of Group entities. The currencies in which these transactions are denominated are mainly the Singapore
dollar, US dollar and China renminbi.
At 31 December, the Group’s and the Company’s exposure to currency risk are as follows:
Singapore
dollar
US
dollar
China
renminbi
$’000 $’000 $’000
Group
2017
Trade and other receivables 623 39 7,856
Cash and cash equivalents 168 3,523 2,082
Other investments 88 19,503 2,956
Loan from a non-controlling interest of a subsidiary – – (1,131)
Trust receipts – (1,496) –
Trade and other payables (487) (677) (91)
392 20,892 11,672
2016
Trade and other receivables 1,538 227 2,709
Cash and cash equivalents 419 2,721 1,372
Other investments 584 17,964 –
Loan from a non-controlling interest of a subsidiary – – (1,145)
Trust receipts – (1,273) –
Trade and other payables (1,527) (7) (137)
1,014 19,632 2,799
US
dollar
China
renminbi
$’000 $’000
Company
2017
Trade and other receivables 6,679 7,103
Cash and cash equivalents 1,998 2,047
Loans to subsidiaries 21,672 –
Trade and other payables (677) (12)
Loans from subsidiaries (3,428) –
Trust receipts (1,496) –
24,748 9,138
YEAR ENDED 31 DECEMBER 2017Notes to the FINANCIAL STATEMENTS
ENGRO CORPORATION LIMITED118

25 FINANCIAL INSTRUMENTS (CONTINUED)
Market risk (Continued)
Currency risk (Continued)
US
dollar
China
renminbi
$’000 $’000
Company
2016
Trade and other receivables 6,941 4,170
Cash and cash equivalents 458 1,311
Loans to subsidiaries 39,986 –
Trade and other payables (134) –
Loans from subsidiaries (9,752) (1,960)
Trust receipts (1,273) –
36,226 3,521
Sensitivity analysis
A 10% strengthening of the group entities’ functional currencies, as indicated below, against the following currencies
at 31 December would have decreased equity and profit or loss before tax by the amounts shown below. The analysis
assumes that all other variables, in particular interest rates, remain constant. The analysis is performed on the same
basis for 2016, as indicated below:
Group Company
Profit or loss Equity Profit or loss Equity
$’000 $’000 $’000 $’000
31 December 2017
Singapore dollar (39) – – –
US dollar (2,086) (3) (2,475) –
China renminbi (1,167) – (914) –
31 December 2016
Singapore dollar (101) – – –
US dollar (1,959) (4) (3,623) –
China renminbi (280) – (352) –
A 10% weakening of the group entities’ functional currencies against the above currencies at 31 December would
have had the equal but opposite effect on the above currencies to the amounts shown above, on the basis that all
other variables remain constant.
YEAR ENDED 31 DECEMBER 2017Notes to the FINANCIAL STATEMENTS
ANNUAL REPORT 2017119

25 FINANCIAL INSTRUMENTS (CONTINUED)
Market risk (Continued)
Interest rate risk
Exposure to interest rate risk
At the reporting date, the Group’s interest-bearing financial instruments are as follows:
Group Company
Note 2017 2016 2017 2016
$’000 $’000 $’000 $’000
Financial assets classified as held for trading
– Debt securities 8 1,708 1,228 – –
Fair value sensitivity analysis for fixed rate instruments
A change of 100 basis points in interest rates would have increased or decreased profit or loss by approximately
$57,000 (2016: $37,000) for the Group. The analysis assumes that all other variables, in particular foreign exchange
rates, remain constant. The analysis is performed on the same basis for 2016.
Cash flow sensitivity analysis for variable rate instruments
There is no significant interest rate risk relating to variable rate instruments.
Equity price risk
Sensitivity analysis
For investments classified as available-for-sale financial assets, a 10% increase in the equity prices of quoted equity
securities at the reporting date would have increased equity by $9,000 (2016: $58,000). For investments classified as
held for trading, the impact on profit or loss would have been an increase of $722,000 (2016: $647,000). The analysis
is performed on the same basis for 2016. A 10% decrease in equity prices would have had the equal but opposite
effect on the amounts shown above, on the basis that all other variables remain constant.
Capital management
The Board’s policy is to maintain a sound capital base so as to maintain investor, creditor and market confidence and
to sustain future development of the business. Capital consists of share capital, reserves and accumulated profits of
the Group. The Board of Directors monitors return on capital, as well as the level of dividends to ordinary shareholders.
There were no changes in the Group’s approach to capital management during the year.
Neither the Company nor any of its subsidiaries are subject to externally imposed capital requirements.
YEAR ENDED 31 DECEMBER 2017Notes to the FINANCIAL STATEMENTS
ENGRO CORPORATION LIMITED120

25
FIN
AN
CIA
L I
NS
TR
UM
EN
TS
(C
ON
TIN
UE
D)
Ac
co
un
tin
g c
lass
ific
ati
on
s a
nd
fa
ir v
alu
es
Fa
ir v
alu
es
vers
us
carr
yin
g a
mo
un
ts
The
carr
ying
am
ount
s an
d f
air
valu
es o
f fin
anci
al a
sset
s an
d li
abili
ties,
incl
udin
g th
eir
leve
ls in
the
fai
r va
lue
hier
arch
y, a
re a
s fo
llow
s. It
doe
s no
t in
clud
e
fair
valu
e in
form
atio
n fo
r fin
anci
al a
sset
s an
d fi
nanc
ial l
iab
ilitie
s no
t m
easu
red
at
fair
valu
e if
the
carr
ying
am
ount
is a
rea
sona
ble
ap
pro
xim
ate
of fa
ir va
lue.
Car
ryin
g am
ount
Fair
valu
e
Not
eH
eld
for
trad
ing
Des
igna
ted
at fa
ir va
lue
Loan
s an
d re
ceiv
able
sAv
aila
ble-
fo
r-sa
le
Oth
er
finan
cial
lia
bilit
ies
Tota
lLe
vel 1
Leve
l 2Le
vel 3
Tota
l$’
000
$’00
0$’
000
$’00
0$’
000
$’00
0$’
000
$’00
0$’
000
$’00
0
Gro
up31
Dec
embe
r 20
17Fi
nanc
ial a
sset
s m
easu
red
at fa
ir va
lue
Avai
labl
e-fo
r-sa
le fi
nanc
ial a
sset
s–
Equi
ty s
ecur
ities
––
–11
5–
115
8827
–11
5–
Vent
ure
capi
tal f
unds
8–
––
13,6
56–
13,6
56–
–13
,656
13,6
56Fi
nanc
ial a
sset
s cl
assif
ied
as h
eld
for t
radi
ng–
Debt
sec
uritie
s8
1,70
8–
––
–1,
708
–1,
708
–1,
708
– Eq
uity
sec
uritie
s8
7,21
6–
––
–7,
216
7,21
6–
–7,
216
Fina
ncia
l ass
ets
desig
nate
d as
at f
air v
alue
th
roug
h pr
ofit
or lo
ss–
Inve
stm
ent f
unds
8–
12,8
94–
––
12,8
9489
012
,004
–12
,894
8,92
412
,894
–13
,771
–35
,589
Fina
ncia
l ass
ets
not m
easu
red
at fa
ir va
lue
Con
verti
ble
loan
8–
–1,
336
––
1,33
6Av
aila
ble-
for-
sale
fina
ncia
l ass
ets
– Eq
uity
sec
uritie
s–
––
2,68
1–
2,68
1Tr
ade
and
othe
r rec
eiva
bles
11–
–48
,498
––
48,4
98C
ash
and
cash
equ
ivale
nts
13–
–23
,869
––
23,8
69
––
73,7
032,
681
–76
,384
Fina
ncia
l lia
bilit
ies
mea
sure
d at
fair
valu
eFo
rwar
d ex
chan
ge c
ontra
cts
18–
(263
)–
––
(263
)–
(263
)–
(263
)
–(2
63)
––
–(2
63)
Fina
ncia
l lia
bilit
ies
not m
easu
red
at
fair
valu
eFi
nanc
e le
ase
liabi
lities
16–
––
–(5
,894
)(5
,894
)Lo
an fr
om a
non
-con
trollin
g in
tere
st o
f a
subs
idia
ry16
––
––
(1,1
31)
(1,1
31)
Trus
t rec
eipt
s16
––
––
(1,4
96)
(1,4
96)
Trad
e an
d ot
her p
ayab
les
18–
––
–(1
8,63
0)(1
8,63
0)
––
––
(27,
151)
(27,
151)
YEAR ENDED 31 DECEMBER 2017Notes to the FINANCIAL STATEMENTS
ANNUAL REPORT 2017121

25
FIN
AN
CIA
L I
NS
TR
UM
EN
TS
(C
ON
TIN
UE
D)
Ac
co
un
tin
g c
lass
ific
ati
on
s a
nd
fa
ir v
alu
es
(Co
nti
nu
ed
)
Fa
ir v
alu
es
vers
us
carr
yin
g a
mo
un
ts (
Co
nti
nu
ed
)
Car
ryin
g am
ount
Fair
valu
e
Not
eH
eld
for
trad
ing
Des
igna
ted
at fa
ir va
lue
Loan
s an
d re
ceiv
able
sA
vaila
ble-
fo
r-sa
le
Oth
er
finan
cial
lia
bilit
ies
Tota
lLe
vel 1
Leve
l 2Le
vel 3
Tota
l$’
000
$’00
0$’
000
$’00
0$’
000
$’00
0$’
000
$’00
0$’
000
$’00
0
Gro
up31
Dec
embe
r 20
16Fi
nanc
ial a
sset
s m
easu
red
at fa
ir va
lue
Avai
labl
e-fo
r-sa
le fi
nanc
ial a
sset
s–
Equi
ty s
ecur
ities
––
–62
7–
627
584
43–
627
– Ve
ntur
e ca
pita
l fun
ds8
––
–14
,313
–14
,313
––
14,3
1314
,313
Fina
ncia
l ass
ets
clas
sifie
d as
hel
d fo
r tra
ding
– D
ebt s
ecur
ities
81,
228
––
––
1,22
8–
1,22
8–
1,22
8–
Equi
ty s
ecur
ities
86,
472
––
––
6,47
26,
472
––
6,47
2Fi
nanc
ial a
sset
s de
sign
ated
as
at fa
ir va
lue
thro
ugh
prof
it or
loss
– In
vest
men
t fun
ds8
–12
,570
––
–12
,570
3,17
89,
392
–12
,570
7,70
012
,570
–14
,940
–35
,210
Fina
ncia
l ass
ets
not m
easu
red
at fa
ir va
lue
Con
verti
ble
loan
8–
–1,
447
––
1,44
7Av
aila
ble-
for-
sale
fina
ncia
l ass
ets
– Eq
uity
sec
uriti
es–
––
2,80
2–
2,80
2Tr
ade
and
othe
r rec
eiva
bles
11–
–40
,793
––
40,7
93C
ash
and
cash
equ
ivale
nts
13–
–39
,393
––
39,3
93
––
81,6
332,
802
–84
,435
Fina
ncia
l lia
bilit
ies
not m
easu
red
at
fair
valu
eFi
nanc
e le
ase
liabi
litie
s16
––
––
(8,1
34)
(8,1
34)
Loan
from
a n
on-c
ontro
lling
inte
rest
of
a su
bsid
iary
16–
––
–(1
,145
)(1
,145
)Tr
ust r
ecei
pts
16–
––
–(1
,273
)(1
,273
)Tr
ade
and
othe
r pay
able
s18
––
––
(22,
838)
(22,
838)
––
––
(33,
390)
(33,
390)
YEAR ENDED 31 DECEMBER 2017Notes to the FINANCIAL STATEMENTS
ENGRO CORPORATION LIMITED122

25
FIN
AN
CIA
L I
NS
TR
UM
EN
TS
(C
ON
TIN
UE
D)
Ac
co
un
tin
g c
lass
ific
ati
on
s a
nd
fa
ir v
alu
es
(Co
nti
nu
ed
)
Fa
ir v
alu
es
vers
us
carr
yin
g a
mo
un
ts (
Co
nti
nu
ed
)
Car
ryin
g am
ount
Fair
valu
e
Not
eH
eld
for
trad
ing
Des
igna
ted
at fa
ir va
lue
Loan
s an
d re
ceiv
able
sAv
aila
ble-
fo
r-sa
le
Oth
er
finan
cial
lia
bilit
ies
Tota
lLe
vel 1
Leve
l 2Le
vel 3
Tota
l$’
000
$’00
0$’
000
$’00
0$’
000
$’00
0$’
000
$’00
0$’
000
$’00
0
Com
pany
31 D
ecem
ber
2017
Fina
ncia
l ass
ets
not m
easu
red
at fa
ir va
lue
Avai
labl
e-fo
r-sa
le fi
nanc
ial a
sset
s–
Equi
ty s
ecur
ities
8–
––
1,21
7–
1,21
7Tr
ade
and
othe
r rec
eiva
bles
11–
–47
,591
––
47,5
91Lo
an to
a s
ubsid
iary
12–
–5,
059
––
5,05
9C
ash
and
cash
equ
ivale
nts
13–
–8,
878
––
8,87
8
––
61,5
281,
217
–62
,745
Fina
ncia
l lia
bilit
ies
mea
sure
d at
fair
valu
eFo
rwar
d ex
chan
ge c
ontra
cts
18–
(263
)–
––
(263
)–
(263
)–
(263
)
–(2
63)
––
–(2
63)
Fina
ncia
l lia
bilit
ies
not m
easu
red
at fa
ir va
lue
Fina
nce
leas
e lia
biliti
es16
––
––
(217
)(2
17)
Trus
t rec
eipt
s16
––
––
(1,4
96)
(1,4
96)
Loan
from
sub
sidia
ries
16–
––
–(6
,626
)(6
,626
)Tr
ade
and
othe
r pay
able
s18
––
––
(4,6
36)
(4,6
36)
––
––
(12,
975)
(12,
975)
31 D
ecem
ber
2016
Fina
ncia
l ass
ets
not m
easu
red
at fa
ir va
lue
Avai
labl
e-fo
r-sa
le fi
nanc
ial a
sset
s–
Equi
ty s
ecur
ities
8–
––
1,21
7–
1,21
7Tr
ade
and
othe
r rec
eiva
bles
11–
–47
,065
––
47,0
65Lo
an to
a s
ubsid
iary
12–
–5,
059
––
5,05
9C
ash
and
cash
equ
ivale
nts
13–
–20
,363
––
20,3
63
––
72,4
871,
217
–73
,704
Fina
ncia
l lia
bilit
ies
not m
easu
red
at fa
ir va
lue
Fina
nce
leas
e lia
biliti
es16
––
––
(434
)(4
34)
Trus
t rec
eipt
s16
––
––
(1,2
73)
(1,2
73)
Loan
from
sub
sidia
ries
16–
––
–(1
2,31
2)(1
2,31
2)Tr
ade
and
othe
r pay
able
s18
––
––
(9,3
82)
(9,3
82)
––
––
(23,
401)
(23,
401)
YEAR ENDED 31 DECEMBER 2017Notes to the FINANCIAL STATEMENTS
ANNUAL REPORT 2017123

25 FINANCIAL INSTRUMENTS (CONTINUED)
Accounting classifications and fair values (Continued)
Fair values versus carrying amounts (Continued)
In the prior year, available-for-sale financial assets with a carrying amount $11,000 were transferred out of Level 3
into Level 1 because the quoted securities held by a venture capital fund was distributed as equity shares directly to
the Group. There were no transfers of financial assets from Level 2 to Level 1 during the years ended 31 December
2017 and 31 December 2016.
The Group’s policy is to recognise transfers between levels of fair value hierarchy as at the end of the reporting period
in which they occur.
Level 3 fair values
The following table shows a reconciliation from the beginning balances to the ending balances for fair value
measurements in Level 3 of the fair value hierarchy.
Available-for-sale
financial assets
2017 2016
$’000 $’000
Group
At 1 January 14,313 15,598
Total losses recognised in profit or loss
– Impairment loss on available-for-sale financial assets, included in finance costs (241) (305)
Total losses recognised in other comprehensive income
– Net change in fair value of available-for-sale financial assets (561) (1,299)
Purchases 2,722 1,070
Settlements (1,558) (1,169)
Transfer out of Level 3 – (11)
Exchange movement (1,019) 429
At 31 December 13,656 14,313
At 31 December 2017 and 31 December 2016, the Group did not have any liabilities classified in Level 3 of the fair
value hierarchy.
Available-for-sale equity securities in Level 3 of the fair value hierarchy consist of investments in venture capital funds
(“VCFs”). Fair values of VCFs are derived based on the latest available net asset values (“NAV”) obtained from the Fund
Managers of the VCFs, adjusted for any capital contributions and distributions where relevant up to 31 December
2017, to determine the fair values of these venture capital funds as at 31 December 2017.
YEAR ENDED 31 DECEMBER 2017Notes to the FINANCIAL STATEMENTS
ENGRO CORPORATION LIMITED124

25 FINANCIAL INSTRUMENTS (CONTINUED)
Level 3 fair values (Continued)
The underlying assets of the VCFs consist of quoted and unquoted debt and equity securities which are measured
at fair value. On a quarterly basis, the VCF fund managers perform a valuation of the portfolio of their respective
investments. The fair values of investments in quoted equity and debt securities are determined by reference to their
quoted closing bid price in an active market at the measurement date. Fair value of investments in unquoted debt and
equity securities are determined by obtaining broker quotes, last round financing price or similar recent transactions
in the private market led by a reputable valuer.
Valuation technique Significant unobservable inputs
Inter-relationship between significant
unobservable inputs and fair value
measurement
NAV Value of the underlying assets (mainly
investments) of the VCFs
The estimated fair value would increase/
decrease if NAV was higher/lower
For the fair value of Level 3 available-for-sale financial assets, increasing the significant unobservable input by 10% at
the reporting date would have increased equity by $1,366,000 (2016: $1,431,000). A 10% decrease in the significant
unobservable input would have had the equal but opposite effect on the amounts shown above, on the basis that all
other variables remain constant.
Sources of estimation uncertainty
Fair values of investments in VCFs are derived based on latest available valuations obtained from the General Partners
of the funds, which are determined with reference to the net asset values of the funds. Changes in the unobservable
inputs used to value the funds would increase/decrease the carrying value of the investments and fair value reserve.
Carrying amounts of unquoted equity securities are stated at cost less impairment losses when the fair values cannot be
reliably measured because of variability in the range of reasonable fair value estimates is significant or that investment
or probabilities of various estimates within the range cannot be reasonably assessed and used in estimating fair value.
26 MEASUREMENT OF FAIR VALUES
A number of the Group’s accounting policies and disclosures require the determination of fair value, for both financial
and non-financial assets and liabilities. Fair values have been determined for measurement and/or disclosure purposes
based on the following methods. When applicable, further information about the assumptions made in determining fair
values is disclosed in the notes specific to that asset or liability.
Equity and debt securities, other trading investments and investment funds
The fair values of investments in equity and debt securities, other trading investments and investment funds are
determined by reference to their quoted closing bid price in an active market at the measurement date, or where such
information is unavailable, based on broker quotes (Level 2 fair values).
Forward exchange contracts
The fair values of forward exchange contracts are based on broker quote. Similar contracts are traded in an active
market and the quotes reflect the actual transactions in similar instruments.
YEAR ENDED 31 DECEMBER 2017Notes to the FINANCIAL STATEMENTS
ANNUAL REPORT 2017125

26 MEASUREMENT OF FAIR VALUES (CONTINUED)
Non-derivative financial liabilities
Non-derivative financial liabilities are measured at fair value at initial recognition and for disclosure purposes, at each annual reporting date. For finance leases, the market rate of interest is determined by reference to similar lease agreements.
Other financial assets and liabilities
The carrying amounts of financial assets and liabilities with a maturity of less than one year (including trade and other receivables, cash and cash equivalents, and trade and other payables) approximate their fair values due to the short period to maturity.
27 ACQUISITION OF NON-CONTROLLING INTEREST
On 28 December 2017, the Group acquired an additional 1.43% interest in R&P (Pte.) Ltd. for $16,000 in cash, increasing its ownership from 98.57% to 100%. The Group recognised a decrease in non-controlling interests of $120,000, an increase in retained earnings of $104,000, resulting in a net increase in equity attributable to owners of the Group of $104,000.
The following summarises the effect of changes in the Group’s ownership interest in R&P (Pte.) Ltd.:
$’000
Carrying amount of NCI acquired 120Consideration paid to NCI (16)
Increase in equity attributable to owners of the Company 104
28 OPERATING LEASES
Leases as lessee
At reporting date, the Group and the Company had operating lease commitments for future minimum lease payments under non-cancellable operating leases of warehouse, factory and office space as follows:
Group Company2017 2016 2017 2016$’000 $’000 $’000 $’000
Within one year 1,729 2,161 815 805Between two to five years 4,560 3,124 2,548 1,838More than five years 6,620 6,633 5,551 5,551
12,909 11,918 8,914 8,194
29 CAPITAL COMMITMENTS
As at year end, the Group has commitments amounting to $9,570,000 (2016: $8,970,000) in respect of additional investments in venture capital funds.
As at 31 December 2017, the Group has entered into contracts to purchase property, plant and equipment for $29,000 (2016: $2,816,000).
YEAR ENDED 31 DECEMBER 2017Notes to the FINANCIAL STATEMENTS
ENGRO CORPORATION LIMITED126

30 RELATED PARTIES
For the purpose of these financial statements, parties are considered to be related to the Group if the Group has the ability, directly or indirectly, to control the party or exercise significant influence over the party in making financial and operating decisions, or vice versa, or where the Group and the party are subject to common control or common significant influence. Related parties may be individuals or other entities.
Key management personnel compensation
Key management personnel of the Group are those persons having the authority and responsibility for planning, directing and controlling the activities of the entity. The directors and department heads are considered as key management personnel of the Group.
Key management personnel compensation comprised:
Group2017 2016$’000 $’000
Directors’ fees 307 263Short-term employee benefits:– directors 1,264 1,101– other management personnel 1,117 1,168Post-employment benefits:– directors 15 15– other management personnel 78 82
2,781 2,629
During the year, the Group received dividends amounting to $100,000 from Ho Bee Cove Pte Ltd (2016: $150,000), a company in which a substantial shareholder of the Company has interest in.
Other related party transactions
Other than those disclosed elsewhere in the financial statements, the significant transactions with related parties are as follows:
Group2017 2016$’000 $’000
Joint venturesPurchases of goods (7,688) (9,912)Sales of goods 10,752 –Sales of machinery and equipment 284 –
31 CONTINGENCIES
The Company has given formal undertakings, which are unsecured, to provide financial support to its subsidiaries. As at 31 December 2017, the net current liabilities and net liabilities of these subsidiaries amounted to approximately $12,025,000 and $20,380,000 (2016: $13,843,000 and $21,252,000) respectively.
YEAR ENDED 31 DECEMBER 2017Notes to the FINANCIAL STATEMENTS
ANNUAL REPORT 2017127

32 NON-CONTROLLING INTERESTS
On 19 September 2017, the Group incorporated a new subsidiary, R&P Technologies Pte. Ltd., holding 60% ownership interest. Accordingly, the following information is only for the period from 19 September 2017 to 31 December 2017 and no comparative information is presented.
R&P Technologies Pte. Ltd. has a non-controlling interest that is material to the Group as at 31 December 2017:
Name
Principal place of business/Country of
incorporation Operating segment
Ownership interests held by non-controlling
interest2017 2016
% %
R&P Technologies Pte. Ltd. Singapore Specialty polymer 40 –
The following summarised financial information for the above subsidiary are prepared in accordance with FRS:
R&P Technologies
Pte. Ltd.
Other individually immaterial
subsidiariesIntra- group elimination Total
$’000 $’000 $’000 $’000
2017Revenue –
Loss from continuing operations (28)Other comprehensive income (50)Total comprehensive income (78)
Attributable to non-controlling interest:– (Loss)/Profit (11) 188 – 177– Other comprehensive income (20) (13) – (33)– Total comprehensive income (31) 175 – 144
Non-current assets 1,504Current assets 1,110Current liabilities (137)
Net assets 2,477
Net assets attributable to non-controlling interest 991 178 – 1,169
Cash flows used in investing activities (1,650)Cash flows from financing activities 2,556
Net increase in cash and cash equivalents 906
33. SUBSEQUENT EVENT
On 23 March 2018, the Company entered into a sales and purchase agreement to dispose of its shareholdings in a subsidiary, Shanghai S3 Building Materials Co., Ltd., for cash consideration of approximately $2,303,000.
YEAR ENDED 31 DECEMBER 2017Notes to the FINANCIAL STATEMENTS
ENGRO CORPORATION LIMITED128

1 DIRECTORS’ REMUNERATION – GROUP AND COMPANY
The number of directors in each of the remuneration bands are as follows:
Number of directors
2017 2016
$500,001 to $750,000 2 2
Below $250,000 5 3
Total 7 5
2 INTERESTED PERSON TRANSACTIONS
There were no transactions entered into by the Group with interested persons and their affiliates, as defined in the
SGX Listing Manual.
The supplementary information above does not form part of the financial statements.
(SGX-ST LISTING MANUAL DISCLOSURE REQUIREMENTS)Supplementary INFORMATION
ANNUAL REPORT 2017129

SHARE CAPITAL
Issued and fully paid-up Share Capital : S$85,270,272
Class of Shares : Ordinary Shares
Voting Rights : one vote for every ordinary share (excluding treasury share)
Number of issued shares excluding treasury shares : 118,623,300
Number of treasury shares (percentage) : 79,200 (0.07%)
The Company has no *subsidiary holdings.
* subsidiary holdings – as defined in the SGX-ST Listing Manual to mean shares referred to in Sections 21(4), 21(4B), 21(6A) and 21(6C) of the Companies Act, Cap 50.
DISTRIBUTION OF SHAREHOLDERS
Size of ShareholdingsNo. of
Shareholders % No. of Shares %
1 – 99 41 2.30 831 0.00100 – 1,000 292 16.35 197,099 0.171,001 – 10,000 1,035 57.95 4,355,007 3.6710,001 – 1,000,000 406 22.73 24,371,078 20.541,000,001 and above 12 0.67 89,699,285 75.62
TOTAL 1,786 100.00 118,623,300 100.00
20 LARGEST SHAREHOLDERS AS AT 13 MARCH 2018
NO. NAME NO. OF SHARES %
1 AFRO-ASIA INTERNATIONAL ENTERPRISES PTE LIMITED 44,463,000 37.482 AFRO ASIA SHIPPING CO PTE LTD 14,270,500 12.033 UOB KAY HIAN PRIVATE LIMITED 13,154,010 11.094 CHUA WEE KENG 5,902,300 4.985 DBS NOMINEES (PRIVATE) LIMITED 2,132,725 1.806 MORPH INVESTMENTS LTD 1,596,500 1.357 NG SOO GIAP OR CHEW SOOI GUAT 1,495,500 1.268 TAN CHOO SUAN 1,419,000 1.209 PERFORMANCE INVESTMENT PTE LTD 1,404,000 1.1810 CHUA HOONG TAT FRANZ 1,336,000 1.1311 ZEN PROPERTY MANAGEMENT PTE LTD 1,282,500 1.0812 UNITED OVERSEAS BANK NOMINEES (PRIVATE) LIMITED 1,243,250 1.0513 NEW TOWN DEVELOPMENT PTE LTD 826,000 0.7014 LIM CHER KHIANG 793,182 0.6715 SON FONG MENG 756,000 0.6416 OCBC NOMINEES SINGAPORE PRIVATE LIMITED 722,000 0.6117 KWOK HAE MENG 714,250 0.6018 LIM & TAN SECURITIES PTE LTD 644,100 0.5419 TAN CHOO HOON @TAN CHENG GAY 636,750 0.5420 CHEN ENYI 620,000 0.52
TOTAL 95,411,567 80.45
AS AT 13 MARCH 2018Statistics of SHAREHOLDINGS
ENGRO CORPORATION LIMITED130

SHAREHOLDING HELD IN THE HANDS OF PUBLIC
Based on the information provided to the Company as at 13 March 2018, approximately 44.04% of the total number of
issued shares of the Company is held by the public. Accordingly, the Company has complied with Rule 723 of the SGX-ST
Listing Manual.
SUBSTANTIAL SHAREHOLDERS as at 13 March 2018 as shown in the Company’s Register of Substantial Shareholders
Direct
Interest
Deemed
Interest Total Number % of Issued
Name of Substantial Shareholder No. of Shares No. of Shares of Shares Share Capital
Tan Cheng Gay 636,750 16,500,500(1) 17,137,250 14.45
Tan Yok Koon 366,000 15,674,500(2) 16,040,500 13.52
Tan Chin Hoon – 16,500,500(3) 16,500,500 13.91
Chua Thian Poh 165,000 45,745,500(4) 45,910,500 38.70
Ho Bee Holdings (Pte) Ltd – 45,745,500(5) 45,745,500 38.56
Afro-Asia International Enterprises
Pte. Limited 44,463,000 – 44,463,000 37.48
Afro Asia Shipping Co Pte Ltd 14,270,500 1,404,000(6) 15,674,500 13.21
Notes:
(1) This represents Tan Cheng Gay’s deemed interest of 16,500,500 shares held in the name of the following:–
(a) 14,270,500 shares held by Afro Asia Shipping Co Pte Ltd;
(b) 1,404,000 shares held by Performance Investment Pte Ltd; and
(c) 826,000 shares held by New Town Development Pte Ltd
(2) This represents Tan Yok Koon’s deemed interest of 15,674,500 shares held in the name of the following:–
(a) 14,270,500 shares held by Afro Asia Shipping Co Pte Ltd; and
(b) 1,404,000 shares held by Performance Investment Pte Ltd
(3) This represents Tan Chin Hoon’s deemed interest of 16,500,500 shares held in the name of the following:–
(a) 14,270,500 shares held by Afro Asia Shipping Co Pte Ltd;
(b) 1,404,000 shares held by Performance Investment Pte Ltd; and
(c) 826,000 shares held by New Town Development Pte Ltd
(4) This represents Mr Chua Thian Poh’s deemed interest of 45,745,500 shares held indirectly by Ho Bee Holdings (Pte) Ltd.
(5) This represents Ho Bee Holdings (Pte) Ltd’s deemed interest of 45,745,500 shares held in the name of the following:–
(a) 44,463,000 shares held by Afro-Asia International Enterprises Pte. Limited; and
(b) 1,282,500 shares held by Zen Property Management Pte Ltd.
(6) This represents Afro Asia Shipping Co Pte Ltd’s deemed interest of 1,404,000 shares held by its wholly-owned
subsidiary Performance Investment Pte Ltd.
AS AT 13 MARCH 2018Statistics of SHAREHOLDINGS
ANNUAL REPORT 2017131

NOTICE IS HEREBY GIVEN that the Annual General Meeting (“AGM”) of EnGro Corporation Limited (the “Company”) will be
held at 25 International Business Park, German Centre, Stuttgart Room, 5th floor, East Wing, Singapore 609916 on Friday,
27 April 2018 at 10.00 a.m. for the following purposes:
AS ORDINARY BUSINESS
1. To receive and adopt the Audited Financial Statements for the financial year ended 31 December 2017, the Directors’
Statement and Report of the Auditors thereon. (Resolution 1)
2. To declare a first and final tax-exempt (1-tier) dividend of 2.5 cents per ordinary share for the financial year ended
31 December 2017. (Resolution 2)
3(a) To re-elect Mr Tan Yok Koon who retires pursuant to Article 87 of the Company’s Constitution.
(Resolution 3)
3(b) To re-elect Mr Tan Soo Nan who retires pursuant to Article 94 of the Company’s Constitution.
(Resolution 4)
Mr Tan Soo Nan will, upon re-election as a Director of the Company, remain as the Chairman of the Audit Committee
and will be considered independent for the purposes of Rule 704(8) of the Listing Manual of the Singapore Exchange
Securities Trading Limited.
3(c) To re-elect Mr Steven Ong Kay Eng who retires pursuant to Article 94 of the Company’s Constitution.
(Resolution 5)
Mr Steven Ong Kay Eng will, upon re-election as a Director of the Company, remain as a member of the Audit
Committee and will be considered independent for the purposes of Rule 704(8) of the Listing Manual of the Singapore
Exchange Securities Trading Limited.
[See Explanatory Note]
4. To re-appoint Messrs KPMG LLP as Auditors of the Company and to authorise the Directors to fix their
remuneration. (Resolution 6)
AS SPECIAL BUSINESS
5. To approve the payment of Directors’ fees of S$307,250 for the financial year ended 31 December 2017
(2016: S$262,500). (Resolution 7)
6. To consider and if thought fit, to pass the following resolutions as Ordinary Resolutions, with or without any
modifications:
Notice of ANNUAL GENERAL MEETING
ENGRO CORPORATION LIMITED132

6.1 Authority to allot and issue shares pursuant to the Share Issue Mandate
“That pursuant to Section 161 of the Companies Act, Chapter 50 and the Listing Rules of the Singapore Exchange
Securities Trading Limited (“SGX-ST”), authority be and is hereby given to the Directors to:–
(A) (i) issue shares in the capital of the Company (“shares”) whether by way of rights, bonus or otherwise,
and/or
(ii) make or grant offers, agreements or options (collectively “Instruments”) that might or would require
shares to be issued, including but not limited to the creation and issue of (as well as adjustments to)
warrants, debentures or other instruments convertible into shares,
at any time and upon such terms and conditions and for such purposes and to such persons as the Directors
may in their absolute discretion deem fit; and
(B) (notwithstanding the authority conferred by this Resolution may have ceased to be in force) issue shares in
pursuance of any Instrument made or granted by the Directors while this Resolution was in force,
provided that:
(a) the aggregate number of shares to be issued pursuant to this Resolution (including shares to be issued in
pursuance of Instruments made or granted pursuant to this Resolution) does not exceed fifty per centum (50%)
of the total number of issued shares (excluding treasury shares and subsidiary holdings) of the Company (as
calculated in accordance with sub-paragraph (b) below), of which the aggregate number of shares to be issued
other than on a pro rata basis to shareholders of the Company (including shares to be issued in pursuance of
Instruments made or granted pursuant to this Resolution) does not exceed twenty per centum (20%) of the total
number of issued shares (excluding treasury shares and subsidiary holdings) of the Company (as calculated in
accordance with sub-paragraph (b) below);
(b) (subject to such manner of calculation as may be prescribed by the SGX-ST) for the purpose of determining
the aggregate number of shares that may be issued under sub-paragraph (a) above, the total number of issued
shares (excluding treasury shares and subsidiary holdings) shall be based on the total number of issued shares
(excluding treasury shares and subsidiary holdings) of the Company at the time this Resolution is passed, after
adjusting for:–
(i) new shares arising from the conversion or exercise of any convertible securities;
(ii) new shares arising from exercising share options or vesting of share awards outstanding or subsisting
at the time this Resolution is passed, provided the options or awards were granted in compliance with
the provisions of the Listing Manual of the SGX-ST; and
(iii) any subsequent bonus issue, consolidation or subdivision of shares;
(c) in exercising the authority conferred by this Resolution, the Company shall comply with the provisions of the
Listing Manual of the SGX-ST for the time being in force (unless such compliance has been waived by the
SGX-ST) and the Constitution for the time being of the Company; and
Notice of ANNUAL GENERAL MEETING
ANNUAL REPORT 2017133

(d) (unless revoked or varied by the Company in general meeting) the authority conferred by this Resolution shall
continue in force (i) until the conclusion of the next Annual General Meeting of the Company or the date by
which the next Annual General Meeting of the Company is required by law to be held, whichever is the earlier;
or (ii) in the case of shares to be issued in pursuance of the Instruments, made or granted pursuant to this
Resolution, until the issuance of such shares in accordance with the terms of the Instruments.”
(Resolution 8)
6.2 Authority to grant options and to allot and issue shares under with the EnGro Corporation Limited 2011 Employees’
Share Option Scheme (the “ESOS 2011”)
“That authority be and is hereby given to the Directors of the Company to offer and grant options in accordance with
the provisions of the ESOS 2011 and to allot and issue from time to time such number of ordinary shares in the capital
of the Company as may be required to be issued pursuant to the exercise of options under the ESOS 2011, whether
granted during subsistence of this authority or otherwise, provided always that the aggregate number of new shares
to be allotted and issued pursuant to the ESOS 2011 and other share based schemes of the Company (which shall
include the EnGro Performance Share Award Scheme) shall not exceed fifteen per centum (15%) of the total number
of issued shares (excluding treasury shares and subsidiary holdings) in the capital of the Company from time to time.”
(Resolution 9)
6.3 Authority to issue shares under the EnGro Performance Share Award Scheme (the “EnGro PSA Scheme”)
“That authority be and is hereby given to the Directors of the Company to allot and issue from time to time such
number of fully paid-up shares as may be required to be allotted and issued pursuant to the vesting of awards under
the EnGro PSA Scheme, whether granted during subsistence of this authority or otherwise, provided always that the
aggregate number of shares to be allotted and issued pursuant to the EnGro PSA Scheme and other share based
schemes (including the ESOS 2011) of the Company shall not exceed fifteen per centum (15%) of the total number of
issued shares (excluding treasury shares and subsidiary holdings) in the capital of the Company from time to time.”
(Resolution 10)
6.4 Proposed Renewal of the Share Purchase Mandate
“That:
(a) for the purposes of Sections 76C and 76E of the Companies Act, Chapter 50 of Singapore (the “Act”), the
exercise by the directors of all the powers of the Company to purchase or otherwise acquire from time to time
issued ordinary shares in the capital of the Company (the “Shares”), not exceeding in aggregate the Prescribed
Limit (as hereinafter defined), at such price or prices as may be determined by the directors from time to time
up to the Maximum Price (as hereinafter defined), whether by way of:–
(i) on-market purchases (each a “Market Purchase”) on the Singapore Securities Trading Limited (the
“SGX-ST”); and/or
Notice of ANNUAL GENERAL MEETING
ENGRO CORPORATION LIMITED134

(ii) off-market purchases (each an “Off-Market Purchase”) effected in accordance with any equal access
scheme(s) as may be determined or formulated by the Directors as they may consider fit, which
scheme(s) shall satisfy all the conditions prescribed by the Act,
and otherwise in accordance with all other laws and regulations and rules of the SGX-ST as may for the time being be
applicable, be and is hereby authorised and approved generally and unconditionally (the “Share Purchase Mandate”);
(b) unless varied or revoked by the Company in general meeting, the authority conferred on the Directors pursuant
to the Share Purchase Mandate may be exercised by the Directors at any time and from time to time during
the period commencing from the date of the passing of this Ordinary Resolution, and expiring on the earlier
of:–
(i) the date on which the next annual general meeting of the Company is held; or
(ii) the date by which the next annual general meeting of the Company is required by law to be held; or
(iii) the date on which the purchases of Shares by the Company pursuant to the Share Purchase Mandate
are carried out to the full extent mandated;
(c) in this Resolution:–
“Prescribed Limit” means 10% of the total number of issued Shares (excluding treasury shares and subsidiary
holdings) as at the date of the passing of this Resolution, unless the Company has effected a reduction of the
share capital of the Company in accordance with the applicable provisions of the Companies Act, at any time
during the Relevant Period, in which event the total number of issued Shares shall be taken to be the total
number of issued Shares as altered (excluding treasury shares and subsidiary holdings). Any Shares which are
held as treasury shares and subsidiary holdings will be disregarded for the purpose of computing the 10% limit;
“Relevant Period” means the period commencing from the date on which the last annual general meeting was
held and expiring on the date the next annual general meeting is held or required by law to be held, whichever
is the earlier, after the date of this Resolution; and
“Maximum Price” in relation to a Share to be purchased or acquired, means an amount (excluding related
brokerage, clearance fees, stamp duties, commission, applicable goods and services tax and other related
expenses) not exceeding:–
(i) in the case of a Market Purchase, 105% of the Average Closing Price; and
(ii) in the case of an Off-Market Purchase, 120% of the Average Closing Price,
where:–
“Average Closing Price” means the average of the closing market prices of a Share over the last 5 Market
Days (“Market Day” being a day on which the SGX-ST is open for securities trading), on which transactions
in the Shares were recorded, before the day on which the Market Purchase was made or, as the case may
be, before the date of making an announcement by the Company of an offer for an Off-Market Purchase, and
deemed to be adjusted for any corporate action that occurs after the relevant 5 Market Days; and
Notice of ANNUAL GENERAL MEETING
ANNUAL REPORT 2017135

(d) the Directors of the Company and/or any of them be and are hereby authorised to complete and do all such
acts and things as they and/or he may consider necessary, desirable, expedient, incidental or in the interests
of the Company to give effect to the transactions contemplated and/or authorised by this Resolution.”
(Resolution 11)
7. To transact any other business that may properly be transacted at an Annual General Meeting.
NOTICE OF BOOK CLOSURE DATE FOR DIVIDEND
NOTICE IS ALSO HEREBY GIVEN that, subject to the approval of shareholders being obtained at the Annual General
meeting of the Company for the payment of the first and final tax-exempt (1-tier) dividend, the Share Transfer Books and the
Register of Members of the Company will be closed on 25 May 2018 for the preparation of dividend warrants. Duly completed
transfers received by the Company’s Registrar, Boardroom Corporate & Advisory Services Pte. Ltd. at 50 Raffles Place,
#32-01 Singapore Land Tower, Singapore 048623 up to 5.00 p.m. on 24 May 2018 will be registered to determine
shareholders’ entitlement to the proposed dividends. The first and final tax-exempt (1-tier) dividend of 2.5 cents per ordinary
share for the financial year ended 31 December 2017, if approved at the Annual General Meeting, will be paid on 8 June 2018.
By Order of the Board
Joanna Lim
Company Secretary
12 April 2018
EXPLANATORY NOTE
In relation to Ordinary Resolutions 3, 4 and 5 proposed in items 3(a), 3(b) and 3(c) above, the detailed information on Mr Tan Yok Koon, Mr Tan Soo Nan and Mr Steven Ong Kay Eng are set out in the section entitled “Directors Profile” and Table 3 in the Corporate Governance Report of the Company’s 2017 Annual Report.
Mr Tan Yok Koon is the brother of Mr Tan Cheng Gay (Chairman/CEO and substantial shareholder of the Company) and Mr Tan Chin Hoon (a substantial shareholder of the Company).
There are no relationships (including immediate family relationships) between Mr Tan Soo Nan and or Mr Steven Ong Kay Eng and the other directors, the Company or its 10% shareholders.
STATEMENT PURSUANT TO ARTICLE 57(3) OF THE COMPANY’S CONSTITUTION
The effect of the resolutions under the heading “Special Business” in this Notice of Annual General Meeting are:–
Ordinary Resolution 7
Resolution 7 is to approve the payment of Directors’ fees for the financial year ended 31 December 2017.
Ordinary Resolution 8
Resolution 8 proposed in item 6.1 above, if passed, will empower the Directors from the date of this Meeting until the date of the next Annual General Meeting, or the date by which the next Annual General Meeting is required by law to be held or when varied or revoked by the Company in general meeting, whichever is the earlier, to issue shares and convertible securities in the Company. The number of shares and convertible securities that the Directors may issue under this Resolution would not exceed 50% of the total number of issued shares (excluding treasury shares and subsidiary holdings) of the Company at the time of the passing of this Resolution. For issue of shares and convertible securities other than on a pro rata basis to all shareholders, the aggregate number of shares and convertible securities to be issued shall not exceed 20% of the total number of issued shares (excluding treasury shares and subsidiary holdings) of the Company. The aggregate number of shares which may be issued shall be based on the total number of issued shares (excluding treasury shares and subsidiary holdings) of the Company at the time that Ordinary Resolution 8 is passed, after adjusting for (a) new shares arising from the conversion or exercise of any convertible securities or share options or vesting of share awards which are outstanding or subsisting at the time that Ordinary Resolution 8 is passed, and (b) any subsequent bonus issue or consolidation or subdivision of shares.
Notice of ANNUAL GENERAL MEETING
ENGRO CORPORATION LIMITED136

Ordinary Resolution 9
Resolution 9 proposed in item 6.2 above, if passed, will authorise the Directors of the Company from the date of the above Meeting until the next Annual General Meeting to grant options under the ESOS 2011 which was approved at the Extraordinary General Meeting of the Company on 27 April 2011 and to allot and issue shares upon the exercise of such options granted under the ESOS 2011 in accordance with the rules of the ESOS 2011, provided always that the aggregate number of Shares (comprising new Shares and/or treasury Shares) to be delivered pursuant to the ESOS 2011, when added to the number of new Shares issued and issuable and the number of treasury Shares delivered in respect of all other share schemes or share plans of the Company (if any), shall not exceed fifteen per cent. (15%) of the total issued share capital of the Company (excluding treasury Shares and subsidiary holdings) from time to time. This authority will, unless revoked or varied at a general meeting, expire at the next Annual General Meeting of the Company.
Ordinary Resolution 10
Resolution 10 proposed in item 6.3 above, if passed, will authorise the Directors of the Company from the date of the above Meeting until the next Annual General Meeting to issue shares in the Company pursuant to the vesting of awards under the EnGro PSA Scheme which was approved at the Extraordinary General Meeting of the Company on 27 April 2011 in accordance with the rules of the EnGro PSA Scheme, provided always that the aggregate number of Shares (comprising new Shares and/or treasury Shares) to be delivered pursuant to the EnGro PSA Scheme, when added to the number of new Shares issued and issuable and the number of treasury Shares delivered in respect of all other share schemes or share plans of the Company (if any), shall not exceed fifteen per cent. (15%) of the total issued share capital of the Company (excluding treasury Shares and subsidiary holdings) from time to time. This authority will, unless revoked or varied at a general meeting, expire at the next Annual General Meeting of the Company.
Ordinary Resolution 11
Resolution 11 proposed in item 6.4 above, if passed, will empower the Directors of the Company to repurchase ordinary shares of the Company by way of market purchases or off-market purchases of up to 10% of the total number of issued shares (excluding treasury shares and subsidiary holdings) in capital of the Company at the Maximum Price. The rationale for, the authority and limitation on, the sources of funds to be used for the purchase or acquisition including the amount of financing and the financial effects of the purchase or acquisition of ordinary shares by the Company pursuant to the Share Purchase Mandate on the audited consolidated financial statements of the Company and its subsidiaries for the financial year ended 31 December 2017 are set out in greater detail in the Addendum in relation to the proposed renewal of the Share Purchase Mandate.
Notes:
(1) A member of the Company (other than a depository agent) entitled to attend and vote at the AGM may appoint not more than two proxies to attend and vote in his/her stead.
(2) A proxy need not be a member of the Company.
(3) Pursuant to Section 181 of the Companies Act, Chapter 50 of Singapore, any member who is a relevant intermediary is entitled to appoint one or more proxies to attend, speak and vote at the Annual General Meeting. Where such member’s form of proxy appoints more than one proxy, the proportion of his shareholding concerned to be represented by each proxy shall be specified in the form of proxy. Relevant intermediary is either:
(a) a banking corporation licensed under the Banking Act (Cap. 19) or its wholly-owned subsidiary which provides nominee services and holds shares in that capacity;
(b) a capital markets services licence holder which provides custodial services for securities under the Securities and Futures Act (Cap. 289) and holds shares in that capacity; or
(c) the Central Provident Fund (“CPF”) Board established by the Central Provident Fund Act (Cap. 36), in respect of shares purchased on behalf of CPF investors.
(4) If the appointer is a corporation, the proxy must be executed under seal or the hand of its duly authorised officer or attorney.
(5) An investor who buys shares using CPF monies (“CPF Investor”) and/or SRS monies (“SRS Investor”) (as may be applicable) may attend and cast his vote(s) at the Meeting in person. CPF and SRS Investors who are unable to attend the AGM but would like to vote, may inform their CPF Approved Nominees and/or SRS Operators to appoint the Chairman of the Meeting to act as their proxy, in which case, the CPF and SRS Investors shall be precluded from attending the AGM.
(6) The instrument appointing a proxy must be deposited at the registered office of the Company at 29 International Business Park, #08-05/06 Acer Building Tower B, Singapore 609923 not later than 48 hours before the time appointed for holding the AGM.
Personal data privacy:
By submitting a proxy form appointing a proxy(ies) and/or representative(s) to attend, speak and vote at the AGM and/or any adjournment thereof, a shareholder of the Company (i) consents to the collection, use and disclosure of the shareholder’s personal data by the Company (or its agents or service providers) for the purpose of the processing, administration and analysis by the Company (or its agents or service providers) of proxies and representatives appointed for the AGM (including any adjournment thereof) and the preparation and compilation of the attendance lists, minutes and other documents relating to the AGM (including any adjournment thereof), and in order for the Company (or its agents or service providers) to comply with any applicable laws, listing rules, take-over rules, regulations and/or guidelines (collectively, the “Purposes”), (ii) warrants that where the shareholder discloses the personal data of the shareholder’s proxy(ies) and/or representative(s) to the Company (or its agents or service providers), the shareholder has obtained the prior consent of such proxy(ies) and/or representative(s) for the collection, use and disclosure by the Company (or its agents or service providers) of the personal data of such proxy(ies) and/or representative(s) for the Purposes, and (iii) agrees that the shareholder will indemnify the Company in respect of any penalties, liabilities, claims, demands, losses and damages as a result of the shareholder’s breach of warranty.
Notice of ANNUAL GENERAL MEETING
ANNUAL REPORT 2017137

This page has been intentionally left blank

ENGRO CORPORATION LIMITED (Company Registration No. 197302229H) (Incorporated in the Republic of Singapore)
PROXY FORM
IMPORTANT 1. A relevant intermediary may appoint more than two (2) proxies to
attend, speak and vote at the Annual General Meeting (please see note 3 for the definition of “relevant intermediary”).
2. For investors who have used their CPF/SRS monies to buy shares in the Company, this form of proxy is not valid for use and shall be ineffective for all intents and purposes if used or purported to be used by them. CPF/SRS investors should contact their respective Agent Banks/SRS Operators if they have any queries regarding their appointment as proxies.
*I/We, (name) (NRIC/Passport Number)
of (address)being *a member/members of EnGro Corporation Limited (the “Company”), hereby appoint:
Name Address NRIC/ Passport No.
Proportion of Shareholdings
No. of Shares %
*and/or (delete as appropriate)
or failing whom, the Chairman of the Meeting, as *my/our *proxy/proxies to vote for *me/us on *my/our behalf at the Annual General Meeting (“AGM”) of the Company to be held at 25 International Business Park, German Centre, Stuttgart Room, 5th floor, East Wing, Singapore 609916 on Friday, 27 April 2018 at 10.00 a.m. and at any adjournment thereof. The *proxy is/proxies are to vote for or against the Resolutions to be proposed at the AGM as indicated hereunder. If no specific direction as to voting is given, the *proxy/proxies will vote or abstain from voting at *his/their discretion, as *he/they will on any other matter arising at the Meeting:–
Ordinary Resolutions For Against
Resolution 1 To receive and adopt the Audited Financial Statements of the Company for the financial year ended 31 December 2017, the Directors’ Statement and the Report of the Auditors thereon.
Resolution 2 To declare a first and final tax-exempt (1-tier) dividend of 2.5 cents per ordinary share for the financial year ended 31 December 2017.
Resolution 3 To re-elect Mr Tan Yok Koon (Retiring under Article 87).
Resolution 4 To re-elect Mr Tan Soo Nan (Retiring under Article 94).
Resolution 5 To re-elect Mr Steven Ong Kay Eng (Retiring under Article 94).
Resolution 6 To re-appoint Messrs KPMG LLP as Auditors of the Company and to authorise the Directors to fix their remuneration.
Resolution 7 To approve the payment of Directors’ fees of S$307,250 for the financial year ended 31 December 2017 (2016: S$262,500).
Resolution 8 To authorise the Directors to allot and issue shares pursuant to the Share Issue Mandate.
Resolution 9 To authorise Directors to grant options and to allot and issue shares under EnGro ESOS 2011.
Resolution 10 To authorise Directors to issue shares under the EnGro PSA Scheme.
Resolution 11 To approve the Proposed Renewal of the Share Purchase Mandate.
Please indicate with a tick [√] in the space provided whether you wish your vote to be cast for or against the Resolutions as set out in the Notice of the Meeting. Alternatively, please indicate the number of votes as appropriate.
Dated this day of 2018Total Number of Shares Held
Signature(s) of Member(s) / Common Seal* Delete where applicable
IMPORTANT: PLEASE READ NOTES OVERLEAF BEFORE COMPLETING THIS PROXY FORM

Notes:–
1. A member of the Company (other than a depository agent) entitled to attend and vote at the AGM is entitled to appoint not more than two proxies to attend and vote in his stead. Such proxy need not be a member of the Company.
2. Where a member of the Company appoints two proxies, he shall specify the proportion of his shareholding (expressed as a percentage of the whole) to be represented by each such proxy.
3. Pursuant to Section 181 of the Companies Act, Chapter 50 of Singapore, any member who is a relevant intermediary is entitled to appoint one or more proxies to attend, speak and vote at the AGM. Where such member’s form of proxy appoints more than one proxy, the proportion of his shareholding concerned to be represented by each proxy shall be specified in the form of proxy. Relevant intermediary is either:
(a) a banking corporation licensed under the Banking Act (Cap. 19) or its wholly-owned subsidiary which provides nominee services and holds shares in that capacity;
(b) a capital markets services licence holder which provides custodial services for securities under the Securities and Futures Act (Cap. 289) and holds shares in that capacity; or
(c) the Central Provident Fund (“CPF”) Board established by the Central Provident Fund Act (Cap. 36), in respect of shares purchased on behalf of CPF investors.
4. The instrument appointing a proxy or proxies must be under the hand of the appointor or his attorney duly authorised in writing. Where the instrument appointing a proxy or proxies is executed by a corporation, it must be executed under its common seal or under the hand of its attorney or duly authorised officer.
5. A corporation which is a member of the Company may authorise by resolution of its directors or other governing body such person as it thinks fit to act as its representative at the AGM, in accordance with its Constitution and Section 179 of the Companies Act, Chapter 50 of Singapore.
6. The instrument appointing proxy or proxies, together with the power of attorney or other authority (if any) under which it is signed, or notarially certified copy thereof, must be deposited at the registered office of the Company at 29 International Business Park, #08-05/06 Acer Building Tower B, Singapore 609923 not later than 48 hours before the time set for the AGM.
7. A member should insert the total number of shares held. If the member has shares entered against his name in the Depository Register (as defined in Section 81SF of the Securities Futures Act, Chapter 289 of Singapore), he should insert that number of shares. If the member has shares registered in his name in the Register of Members of the Company, he should insert that number of shares. If the member has shares entered against his name in the Depository Register and shares registered in his name in the Register of Members of the Company, he should insert the aggregate number of shares. If no number is inserted, this form of proxy will be deemed to relate to all the shares held by the member of the Company.
8. The Company shall be entitled to reject the instrument appointing a proxy or proxies if it is incomplete, improperly completed or illegible or where the true intentions of the appointor are not ascertainable from the instructions of the appointor specified in the instrument appointing a proxy or proxies. In addition, in the case of members of the Company whose shares are entered against their names in the Depository Register, the Company may reject any instrument appointing a proxy or proxies lodged if such members are not shown to have shares entered against their names in the Depository Register 72 hours before the time appointed for holding the AGM as certified by The Central Depository (Pte) Limited to the Company.
9. A Depositor shall not be regarded as a member of the Company entitled to attend the AGM and to speak and vote thereat unless his name appears on the Depository Register 72 hours before the time set for the AGM.
10. An investor who buys shares using CPF monies (“CPF Investor”) and/or SRS monies (“SRS Investor”) (as may be applicable) may attend and cast his vote(s) at the AGM in person. CPF and SRS Investors who are unable to attend the AGM but would like to vote, may inform their CPF Approved Nominees and/or SRS Operators to appoint the Chairman of the Meeting to act as their proxy, in which case, the CPF and SRS Investors shall be precluded from attending the AGM.
Personal data privacy:
By submitting an instrument appointing a proxy(ies) and/or representative(s), the member accepts and agrees to the personal data privacy terms set out in the Notice of Annual General Meeting dated 12 April 2018.
Please
Affix
Postage
Fold along this line
Fold along this line
The Company Secretary
ENGRO CORPORATION LIMITED29 International Business Park
#08-05/06 Acer Building Tower B
Singapore 609923

This page has been intentionally left blank

This page has been intentionally left blank


ENGRO CORPORATION LIMITEDCOMPANY NO. 197302229H
29 INTERNATIONAL BUSINESS PARK#08-05/06 ACER BUILDING TOWER B
SINGAPORE 609923T +65 6561 7978F +65 6561 9770
BUILDING A SUSTAINABLE FUTURE
ANNUAL REPORT 2017
ENG
RO
CO
RPO
RA
TION
LIMITED
AN
NU
AL R
EPOR
T 2017