english language arts - montclair public schools · · 2014-11-21student learning objectives...
TRANSCRIPT

Montclair Public Schools
2013-2014
Mathematics Curriculum Guide
Math Grade 8
Approved by the Montclair Board of Education September 2013

1: 2013- 2014
Montclair Public Schools CCSS Math 8th Grade Unit: Marshall A.b
Subject Mathematics Grade 8 Unit # 1 Pacing 10 weeks Unit Name The Number System Overview Unit 1 expands the number system to include irrational numbers. Students will learn how to define the properties of exponents and apply them to the concept of scientific notation. This unit provides foundational skills necessary for the standards presented in the remainder of the 8th grade curriculum, as well as in the high school mathematics courses.
Standard # Standard MC, SC, or
AC
SLO #
Student Learning Objectives Depth of Knowledge
8.NS.A.1
Know that numbers that are not rational are called irrational. Understand informally that every number has a decimal expansion; for rational numbers show that the decimal expansion repeats eventually, and convert a decimal expansion which repeats eventually into a rational number SC
1 Define and compare rational and irrational numbers. 1
2 Demonstrate and identify irrational numbers as decimals that do not repeat. 1
3 Show that any rational number has a decimal expansion that eventually repeats. 2
4 Demonstrate rational numbers as a ratio of two integers. 2
5 Classify numbers as rational or irrational. 2
8.NS.A.2
Use rational approximations of irrational numbers to compare the size of irrational numbers, locate them approximately on a number line diagram, and estimate the value of expressions (e.g., 2). For example, by truncating the decimal expansion of 2, show that 2 is between 1 and 2, then between 1.4 and 1.5, and explain how to continue on to get better approximations SC
6 Use rational numbers to approximate and locate irrational numbers on a number line. 2
7 Estimate the value of expressions involving irrational numbers. 2
8.EE.A.1
Know and apply the properties of integer exponents to generate equivalent numerical expressions. For example, 32 × 3–5 = 3–3 = MC 8
Use the law for exponents to generate equivalent expressions. 2

2: 2013- 2014
1/33 = 1/27
8.EE.A.2
Use square root and cube root symbols to represent solutions to equations of the form x2 = p and x3 = p, where p is a positive rational number. Evaluate square roots of small perfect squares and cube roots of small perfect cubes. Know that √2 is irrational MC
9
Differentiate between squaring a number and finding the square root, and between cubing a number and finding the cube root. 2
10 Identify perfect square numbers and perfect cube numbers. 1
11 Evaluate the square roots and the cube roots of numbers. 2
8.EE.C.7 Solve linear equations in one variable. SC 12 Solve linear equations in one variable. 2
8.EE.A.3
Use numbers expressed in the form of a single digit times an integer power of 10 to estimate very large or very small quantities, and to express how many times as much one is than the other. For example, estimate the population of the United States as 3 × 10⁸ and the population of the world as 7 × 10⁹, and determine that the world population is more than 20 times larger MC
13 Use scientific notation to estimate and express values of very large or very small numbers. 1
14
Compare the values of numbers expressed in scientific notation (how many times larger/smaller one is than the other). 3
15 Convert between scientific and standard notation. 1
8.EE.A.4
Perform operations with numbers expressed in scientific notation, including problems where both decimal and scientific notation are used. Use scientific notation and choose units of appropriate size for measurements of very large or very small quantities (e.g., use millimeters per year for seafloor spreading). Interpret scientific notation that has been generated by technology MC
16
Perform operations using numbers expressed in scientific notation, and in which both decimals and scientific notation are used. 1
17
Choose units of appropriate size for measurements of very large or very small quantities (e.g., use millimeters per year for seafloor spreading) 3
Mathematical Practice #
Selected Opportunities for Connections to Mathematical Practices
CCCS MP1 Transform algebraic and numerical expressions into different forms. CCCS MP3 Use stated assumptions and definitions to construct arguments and solve problems. Justify conclusions by making plausible

3: 2013- 2014
arguments. Big Ideas
• The value of any real number can be represented in multiple forms, such as in scientific notation, written with exponents, or as decimals converted to fractions.
Essential Questions • Why do we use scientific notation to express values? What does it mean for a number to be irrational? Why are quantities represented in
multiple ways? Assessments
Common Benchmark as per district schedule Key Vocabulary
scientific notation, irrational number, rational number, square root, cube root, exponent, radical, terminating decimal, repeating decimal, perfect square number, perfect cube number
Suggested Resources (list specific chapters and or page numbers from existing text that correspond to the SLOs and Standards) Text/Title Concepts Investigations Pg. #s Additional Info/Questions
Thinking with Mathematical Models
solving basic linear equations, examining number patterns, (SLO # 12) 1.1, 1.3, 2.1, 2.2, 2.3, 2.4 Pg. 2-23, 24-32
INV 1 ACE: #16-26, INV 2 ACE:20-28
Growing, Growing, Growing
Scientific Notation, Patterns with exponents (SLO # 8, 13-18) 1.1, 1.2, 5.1, 5.2 Pg. 5-7, 59-62
INV 1: ACE #39-40,INV 5: ACE #56-60
Looking for Pythagoras
Square Roots, Irrational Numbers, exponents, radical form (SLO #1-7) 2.1, 2.2, 2.3, 4.1 Pg. 19-30, 46-48 INV 2: 7-34, 41, 45, 51-53
CMP Common Core Book
Operations with Exponents, cubic roots, square roots, negative exponents (SLO # 9 -11) 1.1, 1.2 Pg. 1-2 Pg. 3-4, Exercises 1 - 52
Online Resource: www.phschool.com

4: 2013- 2014
DIFFERENTIATION
Special Education ELL RtI SAIL • Provide modifications &
accommodations as listed in the student’s IEP
• Position student near helping peer or have quick access to teacher
• Modify or reduce assignments/tests
• Reduce length of assignment for different mode of delivery
• Increase one-to-one time • Utilize working contract between
you and student at risk • Prioritize tasks • Provide manipulatives • Use graphic organizers • Use interactive math journals • Use online resources for skill
building • Provide teacher notes • Use collaborative grouping
strategies such small groups • Use CMP2 online resources • NJDOE resources
• Use CMP2 Spanish Resources (Grade 7-8)
• Provide text to speech for math problems
• Use of translation dictionary or software
• Implement strategy groups • Confer frequently • Provide graphic organizers • Modification plan • NJDOE resources • Adapt a Strategy-Adjusting
strategies for ESL students: http://www.teachersfirst.com/content/esl/adaptstrat.cfm
• Tiered Interventions following RtI framework
• RtI Intervention Bank • Use CMP2 Additional Practice • NJDOE resources • Math Lab • Utilize online resources such
as www.tenmarks.com www.khanacademy.org
• Process should be modified: higher order thinking skills, open-ended thinking, discovery
• Utilize project-based learning for greater depth of knowledge
• Utilize exploratory connections to higher grade concepts
• Contents should be modified: abstraction, complexity, variety, organization
• Products should be modified: real world problems, audiences, deadlines, evaluation, transformations
• Learning environment should be modified: student-centered learning, independence, openness, complexity, groups varied
• Use of web based resources such as www.tenmarks.com www.khanacademy.org
• NJDOE resources
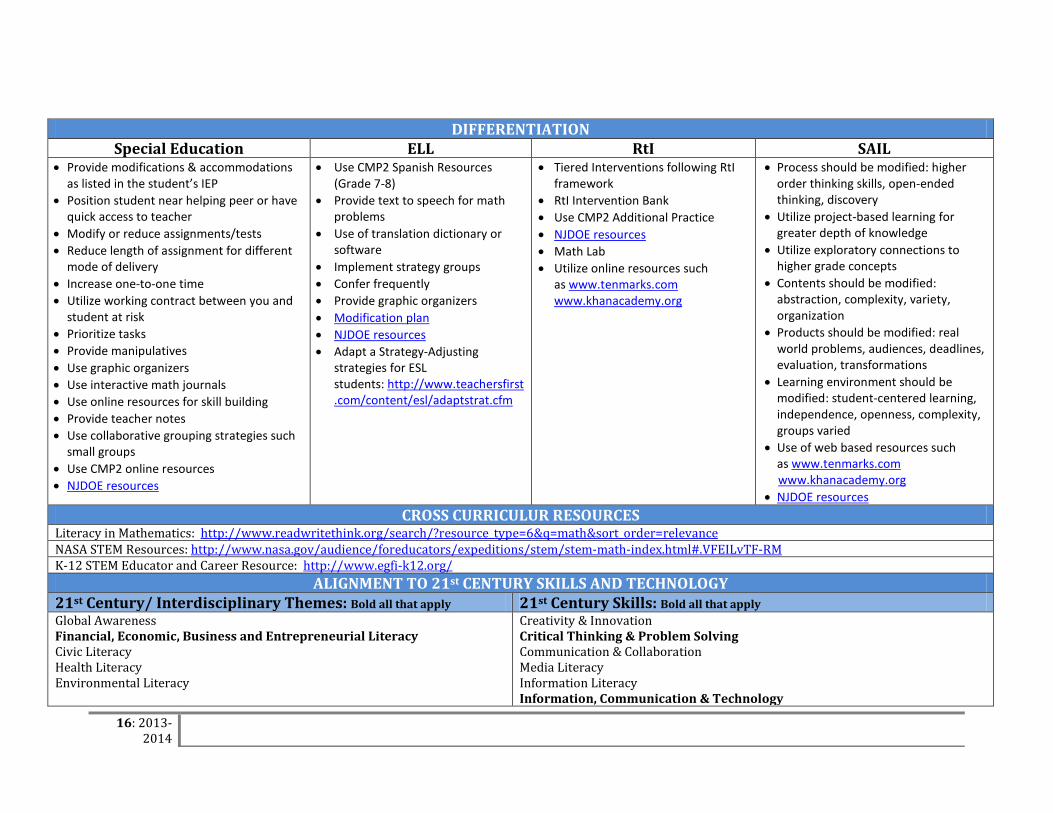
CROSS CURRICULUR RESOURCES Literacy in Mathematics: http://www.readwritethink.org/search/?resource_type=6&q=math&sort_order=relevance NASA STEM Resources: http://www.nasa.gov/audience/foreducators/expeditions/stem/stem-math-index.html#.VFEILvTF-RM K-12 STEM Educator and Career Resource: http://www.egfi-k12.org/
ALIGNMENT TO 21st CENTURY SKILLS AND TECHNOLOGY 21st Century/ Interdisciplinary Themes: Bold all that apply 21st Century Skills: Bold all that apply Global Awareness Financial, Economic, Business and Entrepreneurial Literacy Civic Literacy
Creativity & Innovation Critical Thinking & Problem Solving Communication & Collaboration

5: 2013- 2014
Health Literacy Environmental Literacy
Media Literacy Information Literacy Information, Communication & Technology Life & Career Skills
Technology Infusion National Library of Virtual Manipulatives http://nlvm.usu.edu/en/nav/vlibrary.html Math Resources for Technology https://drive.google.com/file/d/0B4Zh_BcwMUEMOFRfSXZpdW9Yams/view?usp=sharing Smart Board Applications CMP2 Student online resource Evidence of Student Learning • Common benchmark • Observation • Evaluation rubrics • Self-reflections • Teacher-student conferences • Running records • Performance Tasks • Unit tests • Quizzes
6: 2013- 2014
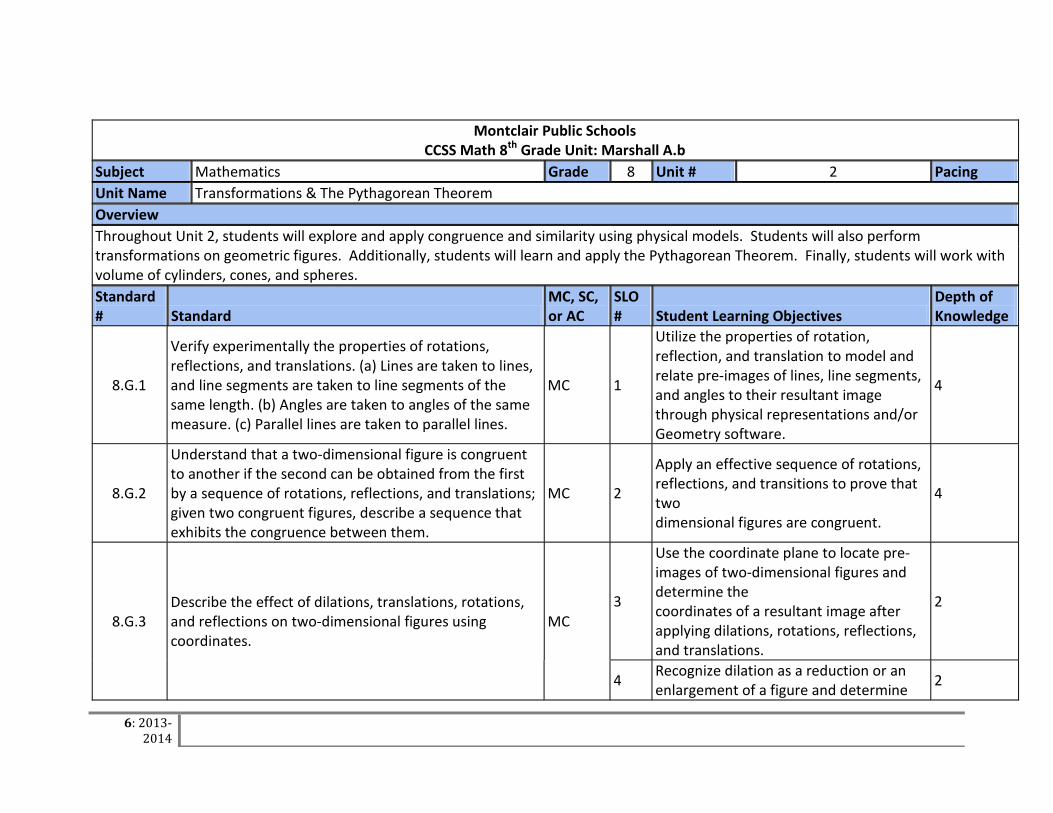
Montclair Public Schools
CCSS Math 8th Grade Unit: Marshall A.b Subject Mathematics Grade 8 Unit # 2 Pacing Unit Name Transformations & The Pythagorean Theorem Overview Throughout Unit 2, students will explore and apply congruence and similarity using physical models. Students will also perform transformations on geometric figures. Additionally, students will learn and apply the Pythagorean Theorem. Finally, students will work with volume of cylinders, cones, and spheres. Standard # Standard
MC, SC, or AC
SLO # Student Learning Objectives
Depth of Knowledge
8.G.1
Verify experimentally the properties of rotations, reflections, and translations. (a) Lines are taken to lines, and line segments are taken to line segments of the same length. (b) Angles are taken to angles of the same measure. (c) Parallel lines are taken to parallel lines.
MC 1
Utilize the properties of rotation, reflection, and translation to model and relate pre-images of lines, line segments, and angles to their resultant image through physical representations and/or Geometry software.
4
8.G.2
Understand that a two-dimensional figure is congruent to another if the second can be obtained from the first by a sequence of rotations, reflections, and translations; given two congruent figures, describe a sequence that exhibits the congruence between them.
MC 2
Apply an effective sequence of rotations, reflections, and transitions to prove that two dimensional figures are congruent.
4
8.G.3 Describe the effect of dilations, translations, rotations, and reflections on two-dimensional figures using coordinates.
MC 3
Use the coordinate plane to locate pre-images of two-dimensional figures and determine the coordinates of a resultant image after applying dilations, rotations, reflections, and translations.
2
4 Recognize dilation as a reduction or an enlargement of a figure and determine 2

7: 2013- 2014
the scale factor.
8.G.4
Understand that a two-dimensional figure is similar to another if the second can be obtained from the first by a sequence of rotations, reflections, translations, and dilations; given two similar two-dimensional figures, describe a sequence that exhibits the similarity between them
MC 5
Apply an effective sequence of transformations to determine similar figures in which corresponding angles are congruent and corresponding sides are proportional. Write similarity statements based on such transformations
4
8.G.5
Use informal arguments to establish facts about the angle sum and exterior angle of triangles, about the angles created when parallel lines are cut by a transversal, and the angle-angle criterion for similarity of triangles. For example, arrange three copies of the same triangle so that the sum of the three angles appears to form a line, and give an argument in terms of transversals why this is so
MC
6 Justify facts about angles created when parallel lines are cut by a transversal. 4
7
Justify facts about the exterior angles of a triangle, the sum of the measures of the interior angles of a triangle and the angle-angle relationship used to identify similar triangles.
4
8.G.9 Know the formulas for the volumes of cones, cylinders, and spheres and use them to solve real-world and mathematical problems.
MC 8
Know and apply the appropriate formula for the volume of a cone, a cylinder, or a sphere to solve real-world and mathematical problems.
4
8.G.6 Explain a proof of the Pythagorean Theorem and its converse. SC 9 Explain a proof of the Pythagorean
Theorem and its converse. 4
8.G.7
Apply the Pythagorean Theorem to determine unknown side lengths in right triangles in real-world and mathematical problems in two and three dimensions.
MC 10
Utilize the Pythagorean Theorem to determine unknown side lengths of right triangles in two and three dimensions to solve real-world and mathematical problems
2
8.G.8 Apply the Pythagorean Theorem to find the distance between two points in a coordinate system. MC 11 Use the Pythagorean Theorem to
determine the distance between two 2

8: 2013- 2014
points in the coordinate plane
Math Practice # Selected Opportunities for Connections to Mathematical Practices CCCS MP1 Check their problem(s) to see if solution(s) make sense. CCCS MP4 Use geometry to solve a problem. CCCS MP6 Attend to precision of final answers. Big Ideas
• Reflections, translations, and rotations are actions that produce congruent geometric objects. • A dilation is a transformation that changes the size of a figure but not the shape. • If the scale factor of a dilation is greater than 1, the image resulting from the dilation is an enlargement, and if the scale factor is less than 1, the
image is a reduction. • Two shapes are similar if the length of all the corresponding sides are proportional and all the corresponding angles are congruent. • Two similar figures are related by a scale factor, which is the ratio of the lengths of corresponding sides. • Congruent figures have the same size and shape. If the scale factor of a dilation is equal to 1, the image resulting from the dilation is congruent to
the original figure. • When parallel lines are cut by a transversal, corresponding angles, alternate interior angles, alternate exterior angles, and vertical angles are
congruent. • Right triangles have a special relationship among the side lengths which can be represented by a model and a formula. • The Pythagorean Theorem can be used to find the missing side lengths in a coordinate plane and real-world situations.
Essential Questions Congruence:
• What are transformations and what effect do they have on an object? • What does the scale factor of a dilation convey? • How can transformations be used to determine congruency or similarity? • What angle relationships are formed by a transversal?
Pythagorean: • Why does the Pythagorean Theorem apply only to right triangles? • How does the knowledge of how to use right triangles and the Pythagorean Theorem enable the design and construction of such structures as a
properly • pitched roof, handicap ramps to meet code, structurally stable bridges, and roads?

9: 2013- 2014
• How can the Pythagorean Theorem be used for indirect measurement? • How do indirect measurement strategies allow for the measurement of items in the real world such as playground structures, flagpoles, and
buildings? Assessments Common Benchmark as per district schedule Key Vocabulary Congruence: Transformation, translation, rotation, reflection, line of reflection, dilation, transversal, exterior angle, interior angle, angle of rotation, line segments, parallel lines, congruent, symmetry, similarity, corresponding, scale factor
Pythagorean: legs of a triangle, hypotenuse, right triangle, Pythagorean Theorem, Pythagorean triple, Converse of Pythagorean Theorem, Square root, distance formula, irrational, perfect squares, radical
Suggested Resources (list specific chapters and or page numbers from existing text that correspond to the SLOs and Standards)
SLO # Textbook Suggested Investigations Topics Page #s/Investigations
1-5, 8
Kaleidoscopes, Hubcaps, & Mirrors, Common Core: Investigation 3
Investigations 1-5, Common Core: Invest 3
Investigation 1: Three Types of Symmetry Investigation 2: Transformations Investigation 3: Congruence Investigation 4: Congruence and Symmetry Investigation 5: Transformations & Coordinates
INV 1.1-1.4 Pg. 2 -14 INV 2.1 -2.4 Pg. 21 -35 INV 3.1- 3.4 Pg. 48-55 INV 4.1 - 4.2 Pg. 65 -69 INV 5.1- 5.4 Pg. 78 - 89 Common Core Pg 13-22
6 – 7 Common Core: Investigation 4
Common Core: Invest 4 Geometry Topics Pg. 23-35
9-11 Looking For Pythagoras Investigations 2-4
Investigation 2: Distance & Pythagorean Theorem Investigation 3: Pythagorean Theorem Investigation 4: Applying Pythagorean Theorem
INV 2.1-2.3 Pg 19-22 INV 3.1-3.1 Pg 31-37 INV 4.1- 4.5 Pg 46 -52
11 Kaleidoscopes, Pythagoras, Say It with Symbols Varied Problems
Kaleidoscopes: Inv. 1: ACE 47-49, Inv. 2: ACE 28, Inv. 3 ACE 24 Pythagoras: Inv. 3: ACE 18-22, 25-26 Symbols: Inv. 1: ACE 55, Inv. 3: AC 41, Inv. 4 ACE 39

10: 2013- 2014
DIFFERENTIATION
Special Education ELL RtI SAIL • Provide modifications &
accommodations as listed in the student’s IEP
• Position student near helping peer or have quick access to teacher
• Modify or reduce assignments/tests • Reduce length of assignment for
different mode of delivery • Increase one-to-one time • Utilize working contract between
you and student at risk • Prioritize tasks • Provide manipulatives • Use graphic organizers • Use interactive math journals • Use online resources for skill
building • Provide teacher notes • Use collaborative grouping
strategies such small groups • Use CMP2 online resources • NJDOE resources
• Use CMP2 Spanish Resources (Grade 7-8)
• Provide text to speech for math problems
• Use of translation dictionary or software
• Implement strategy groups • Confer frequently • Provide graphic organizers • Modification plan • NJDOE resources • Adapt a Strategy-Adjusting
strategies for ESL students: http://www.teachersfirst.com/content/esl/adaptstrat.cfm
• Tiered Interventions following RtI framework
• RtI Intervention Bank • Use CMP2 Additional Practice • NJDOE resources • Math Lab • Utilize online resources such
as www.tenmarks.com www.khanacademy.org
• Process should be modified: higher order thinking skills, open-ended thinking, discovery
• Utilize project-based learning for greater depth of knowledge
• Utilize exploratory connections to higher grade concepts
• Contents should be modified: abstraction, complexity, variety, organization
• Products should be modified: real world problems, audiences, deadlines, evaluation, transformations
• Learning environment should be modified: student-centered learning, independence, openness, complexity, groups varied
• Use of web based resources such as www.tenmarks.com www.khanacademy.org
• NJDOE resources
CROSS CURRICULUR RESOURCES Literacy in Mathematics: http://www.readwritethink.org/search/?resource_type=6&q=math&sort_order=relevance NASA STEM Resources: http://www.nasa.gov/audience/foreducators/expeditions/stem/stem-math-index.html#.VFEILvTF-RM K-12 STEM Educator and Career Resource: http://www.egfi-k12.org/
ALIGNMENT TO 21st CENTURY SKILLS AND TECHNOLOGY 21st Century/ Interdisciplinary Themes: Bold all that apply 21st Century Skills: Bold all that apply Global Awareness Financial, Economic, Business and Entrepreneurial Literacy Civic Literacy Health Literacy
Creativity & Innovation Critical Thinking & Problem Solving Communication & Collaboration Media Literacy

11: 2013- 2014
Environmental Literacy Information Literacy Information, Communication & Technology Life & Career Skills
Technology Infusion National Library of Virtual Manipulatives http://nlvm.usu.edu/en/nav/vlibrary.html Math Resources for Technology https://drive.google.com/file/d/0B4Zh_BcwMUEMOFRfSXZpdW9Yams/view?usp=sharing Smart Board Applications CMP2 Student online resource Evidence of Student Learning • Common benchmark • Observation • Evaluation rubrics • Self-reflections • Teacher-student conferences • Running records • Performance Tasks • Unit tests • Quizzes

12: 2013- 2014
Montclair Public Schools
CCSS 8th Grade Math Unit: Marshall A.b Subject Mathematics Grade 8 Unit # 3 Pacing 3rd Marking Period Unit Name Functions and Data Analysis Overview
Standard # Standard
MC, SC, or AC SLO # Student Learning Objectives DOK
8.F.1
Understand that a function is a rule that assigns to each input exactly one output. The graph of a function is the set of ordered pairs consisting of an input and the corresponding output.
MC 1 Define linear functions as a rule that assigns one output to each input. 1
2 Determine if data represented as a graph or in a table is a function. 2
8.F.2
Compare properties of two functions each represented in a different way (algebraically, graphically, numerically in tables, or by verbal descriptions). For example, given a linear function represented by a table of values and a linear function represented by an algebraic expression, determine which function has the greater rate of change.
MC
3 Compare two functions each represented in a different way (numerically, verbally, graphically, and algebraically) and draw conclusions about their properties (rate of change and intercepts).
3
4 Identify the rate of change and the intercepts of functions represented in different ways. 1
8.F.3
Interpret the equation y = mx + b as defining a linear function, whose graph is a straight line; give examples of functions that are not linear. For example, the function A = s2 giving the area of a square as a function of its side length is not linear because its graph contains the points (1,1), (2,4) and (3,9), which are not on a straight line
MC
5 Classify functions as linear or non-linear by analyzing tables, graphs & equations. 4
6 Recognize that y = mx + b is a linear function with a constant rate of change. 1
8.F.4
Construct a function to model a linear relationship between two quantities. Determine the rate of change and initial value of the function from a description of a relationship or from two (x, y) values, including reading these from a table or from a graph. Interpret the rate of change and initial value of a linear function in terms of the situation it models, and in terms of its graph or a table of values
SC
7 Construct a function equation to model the linear relationship between two variables. 3
8 Determine the rate of change and initial value of the real world data that a function represents from either graphs or tabulated values.
2
8.F.5 Determine the rate of change and initial value of the real world data that a function represents from either graphs or tabulated values.
MC 9 Sketch a graph of a function from a qualitative description and give a
qualitative description of a graph of a function. 4
10 Create a graph from a description of a real-world condition and give a real-world context for a graphic display. 4
13: 2013- 2014
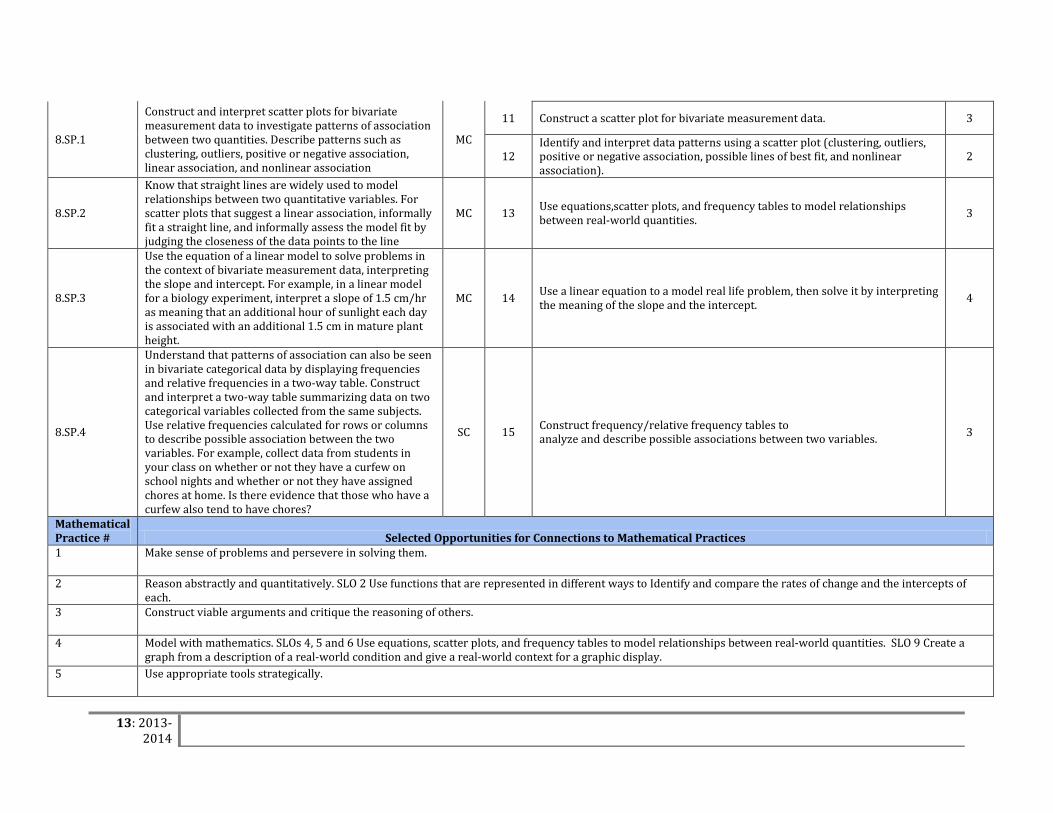
8.SP.1
Construct and interpret scatter plots for bivariate measurement data to investigate patterns of association between two quantities. Describe patterns such as clustering, outliers, positive or negative association, linear association, and nonlinear association
MC
11 Construct a scatter plot for bivariate measurement data. 3
12 Identify and interpret data patterns using a scatter plot (clustering, outliers, positive or negative association, possible lines of best fit, and nonlinear association).
2
8.SP.2
Know that straight lines are widely used to model relationships between two quantitative variables. For scatter plots that suggest a linear association, informally fit a straight line, and informally assess the model fit by judging the closeness of the data points to the line
MC 13 Use equations,scatter plots, and frequency tables to model relationships between real-world quantities. 3
8.SP.3
Use the equation of a linear model to solve problems in the context of bivariate measurement data, interpreting the slope and intercept. For example, in a linear model for a biology experiment, interpret a slope of 1.5 cm/hr as meaning that an additional hour of sunlight each day is associated with an additional 1.5 cm in mature plant height.
MC 14 Use a linear equation to a model real life problem, then solve it by interpreting the meaning of the slope and the intercept. 4
8.SP.4
Understand that patterns of association can also be seen in bivariate categorical data by displaying frequencies and relative frequencies in a two-way table. Construct and interpret a two-way table summarizing data on two categorical variables collected from the same subjects. Use relative frequencies calculated for rows or columns to describe possible association between the two variables. For example, collect data from students in your class on whether or not they have a curfew on school nights and whether or not they have assigned chores at home. Is there evidence that those who have a curfew also tend to have chores?
SC 15 Construct frequency/relative frequency tables to analyze and describe possible associations between two variables. 3
Mathematical Practice # Selected Opportunities for Connections to Mathematical Practices 1 Make sense of problems and persevere in solving them.
2 Reason abstractly and quantitatively. SLO 2 Use functions that are represented in different ways to Identify and compare the rates of change and the intercepts of each.
3 Construct viable arguments and critique the reasoning of others.
4 Model with mathematics. SLOs 4, 5 and 6 Use equations, scatter plots, and frequency tables to model relationships between real-world quantities. SLO 9 Create a graph from a description of a real-world condition and give a real-world context for a graphic display.
5 Use appropriate tools strategically.

14: 2013- 2014
6 Attend to precision.
7 Look for and make use of structure. SLO 2 Identify the rate of change and the intercepts of functions represented in different ways.
8 Look for and express regularity in repeated reasoning.
Big Ideas Understand classification of data by graphing, tables and equations. Be able to identify, create equations for, graph and analyze real word examples of linear or non-linear functions. Be ample to use those methods to analyze and compare data. Essential Questions
How can we interpret data? What are the ways we visualize data and what do those visuals tell us. How can we use equations, tables and graphs to compare and analyze data.
Assessments Tests, Quizzes, Homework, and other assessments aligned to the curriculum Common Benchmark as per district schedule Key Vocabulary Function, expression, rate, bivariate, slope, intercept, frequency, model, linear, scatter plot, line of fit, clustering, outliers, positive or negative association, linear association, and nonlinear association Suggested Resources (list specific chapters and or page numbers from existing text that correspond to the SLOs and Standards) SLO Resource 1 & 2 CC Transition Kit: CC Inv. 2: Functions
3 & 4
Thinking With Mathematical Models: Inv. 1: Exploring Data Patterns Growing, Growing, Growing: Inv. 1: ACE 25–26, 38, 47 Frogs, Fleas and Painted Cubes: Inv. 2: Quadratic Expressions, Inv. 3: Quadratic Patterns of Change, Inv. 4: What Is a Quadratic, Function? Say It With Symbols: Inv. 2: Combining Expressions

15: 2013- 2014
5 & 6
Thinking With Mathematical Models: Inv. 2: Linear Models and Equations, Inv. 3: Inverse Variation Growing, Growing, Growing: Inv. 5: Patterns With Exponents The Shapes of Algebra: Inv. 3: Equations With Two or More Variables, Inv. 4: Solving Systems of Linear Equations Symbolically Say It With Symbols: Inv. 4: Looking Back at Functions
7 & 8
Thinking With Mathematical Models: Inv. 1: Exploring Data Patterns, Inv. 2: Linear Models and Equations The Shapes of Algebra: Inv. 3: Equations With Two or More Variables, Inv. 4: Solving Systems of Linear Equations Symbolically Say It With Symbols: Inv. 4: Looking Back at Functions
9 & 10
Thinking With Mathematical Models: Inv. 2: Linear Models and Equations Growing, Growing, Growing: Inv. 1 Exponential Growth, Inv. 2 Examining Growth Patterns, Inv. 3 Growth Factors and Growth Rates, Inv. 4 Exponential Decay Frogs, Fleas, and Painted Cubes: Inv. 1 Introduction to Quadratic Relationships, Inv. 2 Quadratic Expressions, Inv. 3 Quadratic Patterns of Change, Inv. 4 What Is a Quadratic Function? Say It With Symbols: Inv. 4 Looking Back at Functions
11 & 12 Samples and Populations : Inv. 4: Relating Two Variables
13 Samples and Populations: Inv. 4: Relating Two Variables Thinking With Mathematical Models: Inv. 2: Linear Models and Equations
14 The Shapes of Algebra: Inv. 2: Linear Equations and Inequalities, Inv. 3: Equations With Two or More Variables Thinking With Mathematical Models: Inv. 2: Linear Models and Equations, Inv. 3: Inverse Variation
15 CC Transition Kit: CC Inv. 5: Categorical Data
16: 2013- 2014
DIFFERENTIATION
Special Education ELL RtI SAIL • Provide modifications & accommodations
as listed in the student’s IEP • Position student near helping peer or have
quick access to teacher • Modify or reduce assignments/tests • Reduce length of assignment for different
mode of delivery • Increase one-to-one time • Utilize working contract between you and
student at risk • Prioritize tasks • Provide manipulatives • Use graphic organizers • Use interactive math journals • Use online resources for skill building • Provide teacher notes • Use collaborative grouping strategies such
small groups • Use CMP2 online resources • NJDOE resources
• Use CMP2 Spanish Resources (Grade 7-8)
• Provide text to speech for math problems
• Use of translation dictionary or software
• Implement strategy groups • Confer frequently • Provide graphic organizers • Modification plan • NJDOE resources • Adapt a Strategy-Adjusting
strategies for ESL students: http://www.teachersfirst.com/content/esl/adaptstrat.cfm
• Tiered Interventions following RtI framework
• RtI Intervention Bank • Use CMP2 Additional Practice • NJDOE resources • Math Lab • Utilize online resources such
as www.tenmarks.com www.khanacademy.org
• Process should be modified: higher order thinking skills, open-ended thinking, discovery
• Utilize project-based learning for greater depth of knowledge
• Utilize exploratory connections to higher grade concepts
• Contents should be modified: abstraction, complexity, variety, organization
• Products should be modified: real world problems, audiences, deadlines, evaluation, transformations
• Learning environment should be modified: student-centered learning, independence, openness, complexity, groups varied
• Use of web based resources such as www.tenmarks.com www.khanacademy.org
• NJDOE resources CROSS CURRICULUR RESOURCES
Literacy in Mathematics: http://www.readwritethink.org/search/?resource_type=6&q=math&sort_order=relevance NASA STEM Resources: http://www.nasa.gov/audience/foreducators/expeditions/stem/stem-math-index.html#.VFEILvTF-RM K-12 STEM Educator and Career Resource: http://www.egfi-k12.org/
ALIGNMENT TO 21st CENTURY SKILLS AND TECHNOLOGY 21st Century/ Interdisciplinary Themes: Bold all that apply 21st Century Skills: Bold all that apply Global Awareness Financial, Economic, Business and Entrepreneurial Literacy Civic Literacy Health Literacy Environmental Literacy
Creativity & Innovation Critical Thinking & Problem Solving Communication & Collaboration Media Literacy Information Literacy Information, Communication & Technology
17: 2013- 2014
Life & Career Skills
Technology Infusion National Library of Virtual Manipulatives http://nlvm.usu.edu/en/nav/vlibrary.html Math Resources for Technology https://drive.google.com/file/d/0B4Zh_BcwMUEMOFRfSXZpdW9Yams/view?usp=sharing Smart Board Applications CMP2 Student online resource Evidence of Student Learning • Common benchmark • Observation • Evaluation rubrics • Self-reflections • Teacher-student conferences • Running records • Performance Tasks • Unit tests • Quizzes
18: 2013- 2014
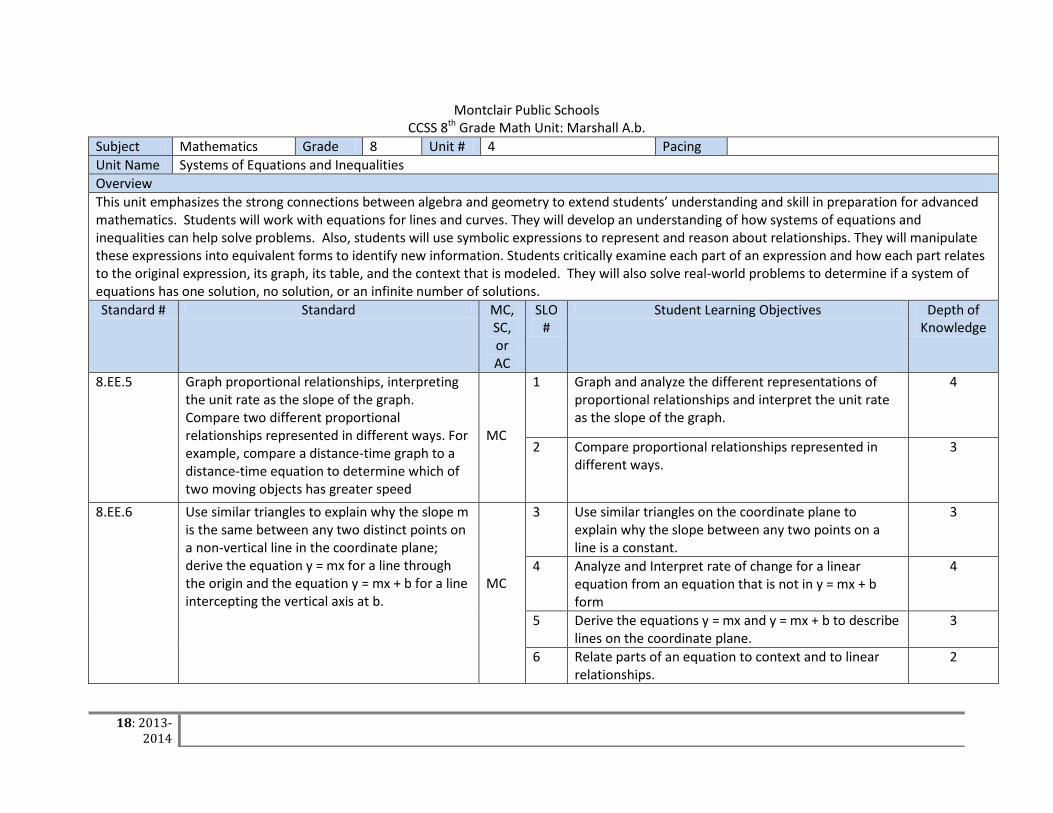
Montclair Public Schools CCSS 8th Grade Math Unit: Marshall A.b.
Subject Mathematics Grade 8 Unit # 4 Pacing Unit Name Systems of Equations and Inequalities Overview This unit emphasizes the strong connections between algebra and geometry to extend students’ understanding and skill in preparation for advanced mathematics. Students will work with equations for lines and curves. They will develop an understanding of how systems of equations and inequalities can help solve problems. Also, students will use symbolic expressions to represent and reason about relationships. They will manipulate these expressions into equivalent forms to identify new information. Students critically examine each part of an expression and how each part relates to the original expression, its graph, its table, and the context that is modeled. They will also solve real-world problems to determine if a system of equations has one solution, no solution, or an infinite number of solutions. Standard # Standard MC,
SC, or AC
SLO #
Student Learning Objectives Depth of Knowledge
8.EE.5 Graph proportional relationships, interpreting the unit rate as the slope of the graph. Compare two different proportional relationships represented in different ways. For example, compare a distance-time graph to a distance-time equation to determine which of two moving objects has greater speed
MC
1
Graph and analyze the different representations of proportional relationships and interpret the unit rate as the slope of the graph.
4
2 Compare proportional relationships represented in different ways.
3
8.EE.6 Use similar triangles to explain why the slope m is the same between any two distinct points on a non-vertical line in the coordinate plane; derive the equation y = mx for a line through the origin and the equation y = mx + b for a line intercepting the vertical axis at b.
MC
3 Use similar triangles on the coordinate plane to explain why the slope between any two points on a line is a constant.
3
4 Analyze and Interpret rate of change for a linear equation from an equation that is not in y = mx + b form
4
5 Derive the equations y = mx and y = mx + b to describe lines on the coordinate plane.
3
6 Relate parts of an equation to context and to linear relationships.
2
19: 2013- 2014
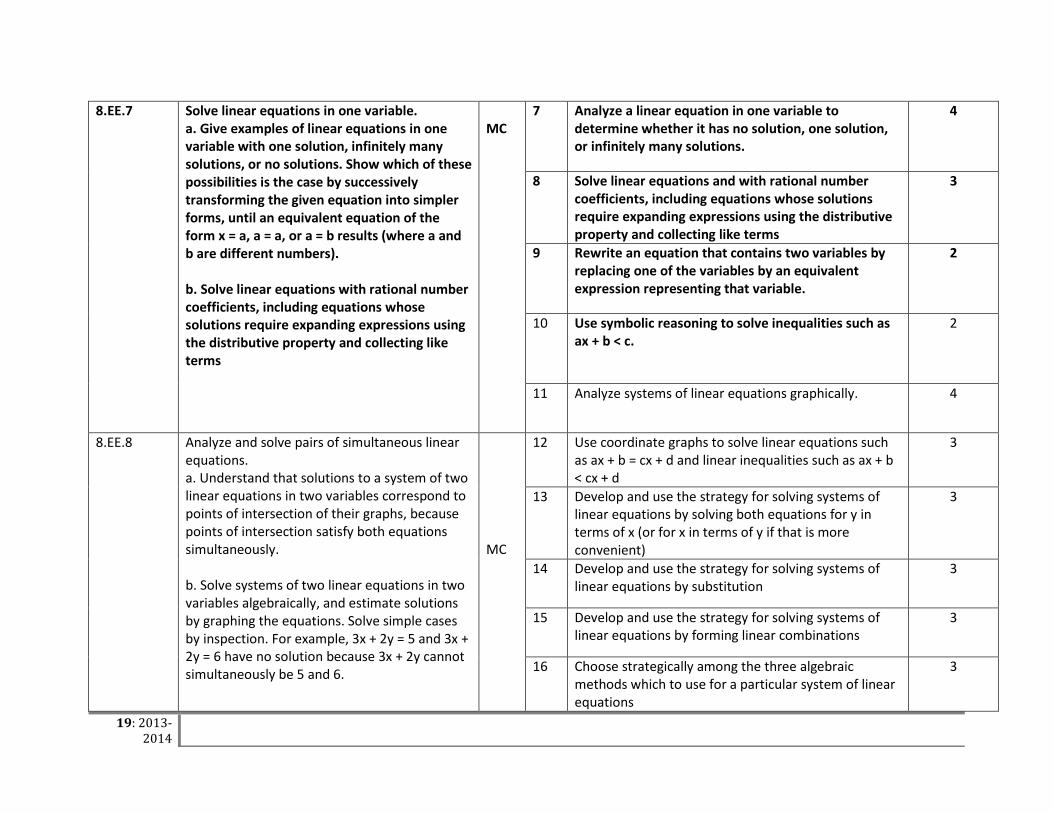
8.EE.7 Solve linear equations in one variable. a. Give examples of linear equations in one variable with one solution, infinitely many solutions, or no solutions. Show which of these possibilities is the case by successively transforming the given equation into simpler forms, until an equivalent equation of the form x = a, a = a, or a = b results (where a and b are different numbers). b. Solve linear equations with rational number coefficients, including equations whose solutions require expanding expressions using the distributive property and collecting like terms
MC
7 Analyze a linear equation in one variable to determine whether it has no solution, one solution, or infinitely many solutions.
4
8 Solve linear equations and with rational number coefficients, including equations whose solutions require expanding expressions using the distributive property and collecting like terms
3
9 Rewrite an equation that contains two variables by replacing one of the variables by an equivalent expression representing that variable.
2
10 Use symbolic reasoning to solve inequalities such as ax + b < c.
2
11 Analyze systems of linear equations graphically. 4
8.EE.8 Analyze and solve pairs of simultaneous linear equations. a. Understand that solutions to a system of two linear equations in two variables correspond to points of intersection of their graphs, because points of intersection satisfy both equations simultaneously. b. Solve systems of two linear equations in two variables algebraically, and estimate solutions by graphing the equations. Solve simple cases by inspection. For example, 3x + 2y = 5 and 3x + 2y = 6 have no solution because 3x + 2y cannot simultaneously be 5 and 6.
MC
12 Use coordinate graphs to solve linear equations such as ax + b = cx + d and linear inequalities such as ax + b < cx + d
3
13 Develop and use the strategy for solving systems of linear equations by solving both equations for y in terms of x (or for x in terms of y if that is more convenient)
3
14 Develop and use the strategy for solving systems of linear equations by substitution
3
15 Develop and use the strategy for solving systems of linear equations by forming linear combinations
3
16 Choose strategically among the three algebraic methods which to use for a particular system of linear equations
3
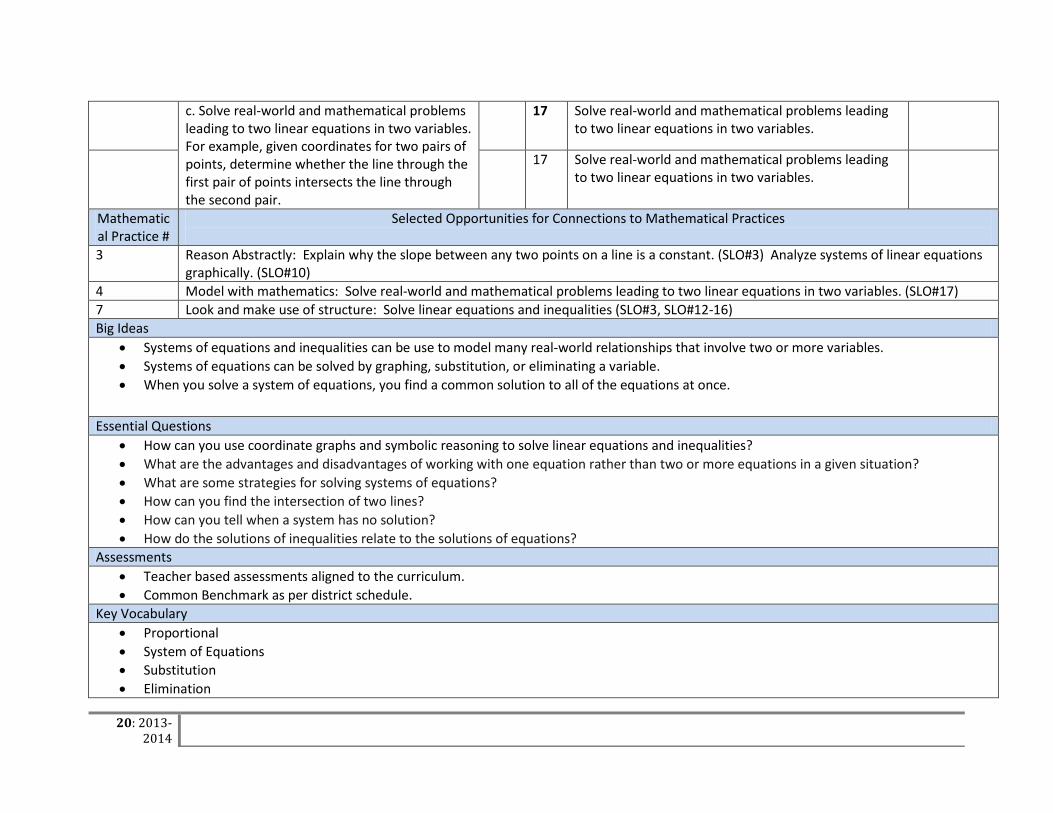
20: 2013- 2014
c. Solve real-world and mathematical problems leading to two linear equations in two variables. For example, given coordinates for two pairs of points, determine whether the line through the first pair of points intersects the line through the second pair.
17 Solve real-world and mathematical problems leading to two linear equations in two variables.
17 Solve real-world and mathematical problems leading to two linear equations in two variables.
Mathematical Practice #
Selected Opportunities for Connections to Mathematical Practices
3 Reason Abstractly: Explain why the slope between any two points on a line is a constant. (SLO#3) Analyze systems of linear equations graphically. (SLO#10)
4 Model with mathematics: Solve real-world and mathematical problems leading to two linear equations in two variables. (SLO#17) 7 Look and make use of structure: Solve linear equations and inequalities (SLO#3, SLO#12-16) Big Ideas
• Systems of equations and inequalities can be use to model many real-world relationships that involve two or more variables. • Systems of equations can be solved by graphing, substitution, or eliminating a variable. • When you solve a system of equations, you find a common solution to all of the equations at once.
Essential Questions • How can you use coordinate graphs and symbolic reasoning to solve linear equations and inequalities? • What are the advantages and disadvantages of working with one equation rather than two or more equations in a given situation? • What are some strategies for solving systems of equations? • How can you find the intersection of two lines? • How can you tell when a system has no solution? • How do the solutions of inequalities relate to the solutions of equations?
Assessments • Teacher based assessments aligned to the curriculum. • Common Benchmark as per district schedule.
Key Vocabulary • Proportional • System of Equations • Substitution • Elimination

21: 2013- 2014
DIFFERENTIATION Special Education ELL RtI SAIL
• Provide modifications & accommodations as listed in the student’s IEP
• Position student near helping peer or have quick access to teacher
• Modify or reduce assignments/tests • Reduce length of assignment for
different mode of delivery • Increase one-to-one time • Utilize working contract between
you and student at risk • Prioritize tasks • Provide manipulatives • Use graphic organizers • Use interactive math journals • Use online resources for skill
building • Provide teacher notes • Use collaborative grouping
strategies such small groups • Use CMP2 online resources • NJDOE resources
• Use CMP2 Spanish Resources (Grade 7-8)
• Provide text to speech for math problems
• Use of translation dictionary or software
• Implement strategy groups • Confer frequently • Provide graphic organizers • Modification plan • NJDOE resources • Adapt a Strategy-Adjusting
strategies for ESL students: http://www.teachersfirst.com/content/esl/adaptstrat.cfm
• Tiered Interventions following RtI framework
• RtI Intervention Bank • Use CMP2 Additional Practice • NJDOE resources • Math Lab • Utilize online resources such
as www.tenmarks.com www.khanacademy.org
• Process should be modified: higher order thinking skills, open-ended thinking, discovery
• Utilize project-based learning for greater depth of knowledge
• Utilize exploratory connections to higher grade concepts
• Contents should be modified: abstraction, complexity, variety, organization
• Products should be modified: real world problems, audiences, deadlines, evaluation, transformations
• Learning environment should be modified: student-centered learning, independence, openness, complexity, groups varied
• Use of web based resources such as www.tenmarks.com www.khanacademy.org
• NJDOE resources
CROSS CURRICULUR RESOURCES Literacy in Mathematics: http://www.readwritethink.org/search/?resource_type=6&q=math&sort_order=relevance NASA STEM Resources: http://www.nasa.gov/audience/foreducators/expeditions/stem/stem-math-index.html#.VFEILvTF-RM K-12 STEM Educator and Career Resource: http://www.egfi-k12.org/
ALIGNMENT TO 21st CENTURY SKILLS AND TECHNOLOGY 21st Century/ Interdisciplinary Themes: Bold all that apply 21st Century Skills: Bold all that apply Global Awareness Financial, Economic, Business and Entrepreneurial Literacy Civic Literacy Health Literacy Environmental Literacy
Creativity & Innovation Critical Thinking & Problem Solving Communication & Collaboration Media Literacy Information Literacy Information, Communication & Technology

22: 2013- 2014
Life & Career Skills
Technology Infusion National Library of Virtual Manipulatives http://nlvm.usu.edu/en/nav/vlibrary.html Math Resources for Technology https://drive.google.com/file/d/0B4Zh_BcwMUEMOFRfSXZpdW9Yams/view?usp=sharing Smart Board Applications CMP2 Student online resource Evidence of Student Learning • Common benchmark • Observation • Evaluation rubrics • Self-reflections • Teacher-student conferences • Running records • Performance Tasks • Unit tests • Quizzes